
#stocks
stocks
4.7M views
11,827 Discussing
Hot
Latest

·
--
Bullish
Verified
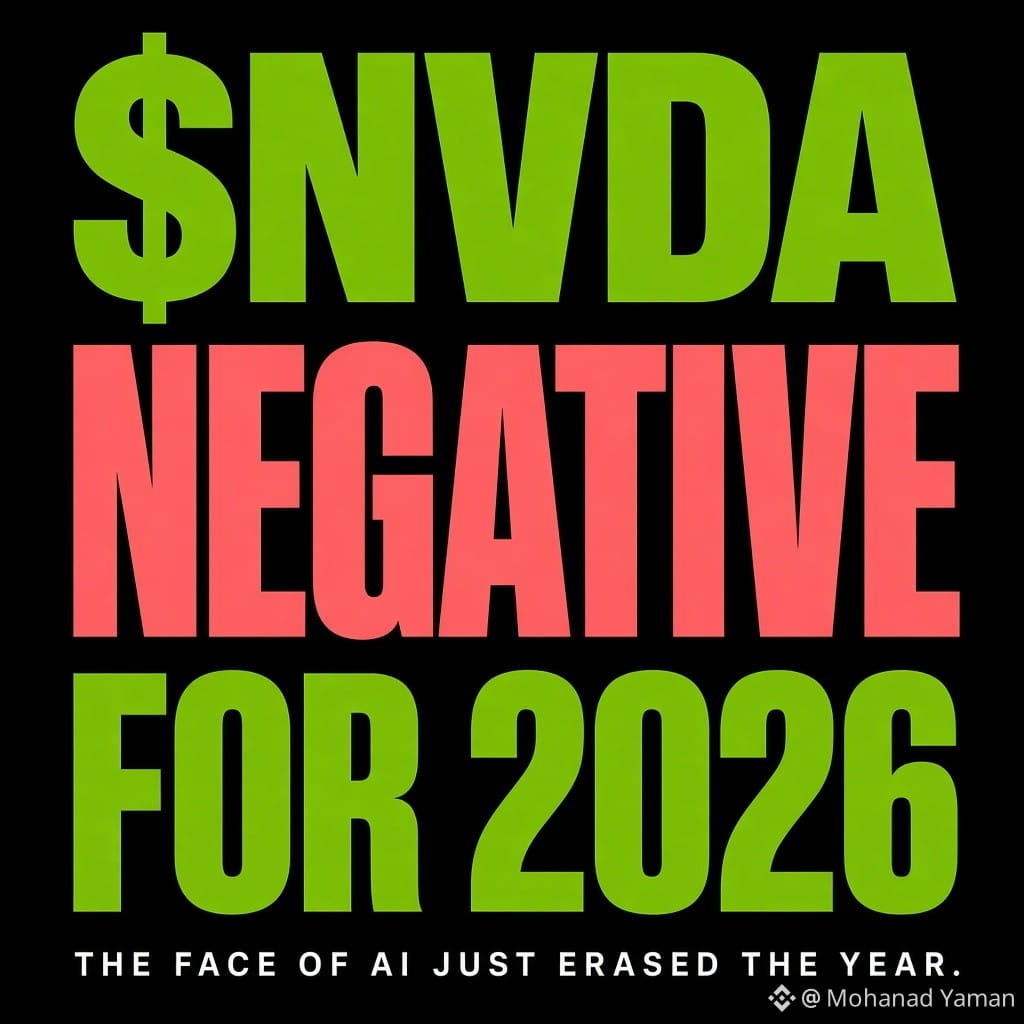
🚨 The face of AI just went red for the year
$NVDA closed at 181 last night. Down 9% on the day 📉
That one session knocked about $450B off its market value 🤯 Worst day since the DeepSeek scare in Jan 2025
Zoom out and it gets uglier
About 24% below the Oct 6 record
Nearly $1.4T in market value gone since that high
Fifth straight losing week
Trading under the 200 day moving average
And now negative for 2026
The Mag 7 lost over $1T yesterday. $NVDA alone took nearly half of that 💥
Earnings are Nov 17. That is the next real test, will it keep dumping or we rally from there? 👀
#stocks
{spot}(NVDABUSDT)
🚨 The face of AI just went red for the year
$NVDA closed at 181 last night. Down 9% on the day 📉
That one session knocked about $450B off its market value 🤯 Worst day since the DeepSeek scare in Jan 2025
Zoom out and it gets uglier
About 24% below the Oct 6 record
Nearly $1.4T in market value gone since that high
Fifth straight losing week
Trading under the 200 day moving average
And now negative for 2026
The Mag 7 lost over $1T yesterday. $NVDA alone took nearly half of that 💥
Earnings are Nov 17. That is the next real test, will it keep dumping or we rally from there? 👀
#stocks
$NVDA closed at 181 last night. Down 9% on the day 📉
That one session knocked about $450B off its market value 🤯 Worst day since the DeepSeek scare in Jan 2025
Zoom out and it gets uglier
About 24% below the Oct 6 record
Nearly $1.4T in market value gone since that high
Fifth straight losing week
Trading under the 200 day moving average
And now negative for 2026
The Mag 7 lost over $1T yesterday. $NVDA alone took nearly half of that 💥
Earnings are Nov 17. That is the next real test, will it keep dumping or we rally from there? 👀
#stocks
632


·
--
Bearish
Partly True
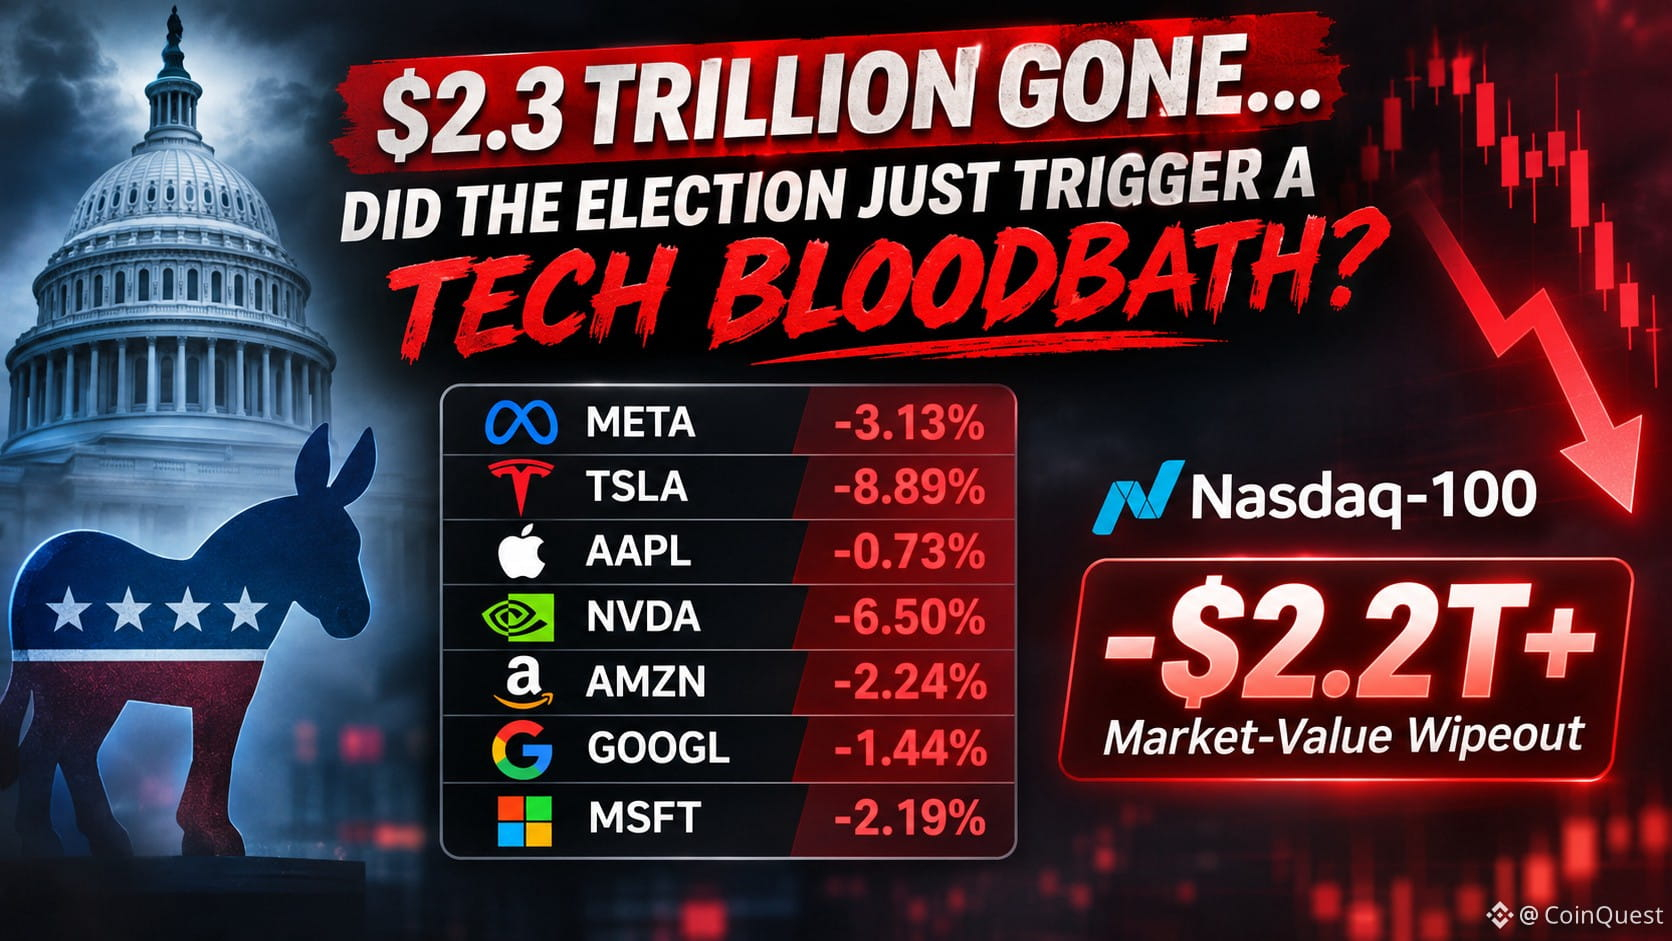
🚨 $2.3 TRILLION GONE… DID THE ELECTION JUST TRIGGER A TECH BLOODBATH?
The Democrats victory was followed by a massive reversal in US stocks… and the Magnificent 7 are taking serious damage.
$META: -3.13%
$TSLA: -8.89%
$AAPL : -0.73%
$NVDA : -6.50%
$AMZN: -2.24%
$GOOGL : -1.44%
$MSFT: -2.19%
The Nasdaq-100 is facing a potential $2.2T+ market-value wipeout as fears around AI regulation and data-center expansion hit the market.
One election… and suddenly the AI trade is facing a completely different Yesterday pump was a BULL TRAP ⁉️😱
#Stocks #USMarkets
🚨 $2.3 TRILLION GONE… DID THE ELECTION JUST TRIGGER A TECH BLOODBATH?
The Democrats victory was followed by a massive reversal in US stocks… and the Magnificent 7 are taking serious damage.
$META: -3.13%
$TSLA: -8.89%
$AAPL : -0.73%
$NVDA : -6.50%
$AMZN: -2.24%
$GOOGL : -1.44%
$MSFT: -2.19%
The Nasdaq-100 is facing a potential $2.2T+ market-value wipeout as fears around AI regulation and data-center expansion hit the market.
One election… and suddenly the AI trade is facing a completely different Yesterday pump was a BULL TRAP ⁉️😱
#Stocks #USMarkets
The Democrats victory was followed by a massive reversal in US stocks… and the Magnificent 7 are taking serious damage.
$META: -3.13%
$TSLA: -8.89%
$AAPL : -0.73%
$NVDA : -6.50%
$AMZN: -2.24%
$GOOGL : -1.44%
$MSFT: -2.19%
The Nasdaq-100 is facing a potential $2.2T+ market-value wipeout as fears around AI regulation and data-center expansion hit the market.
One election… and suddenly the AI trade is facing a completely different Yesterday pump was a BULL TRAP ⁉️😱
#Stocks #USMarkets
2
2.3k

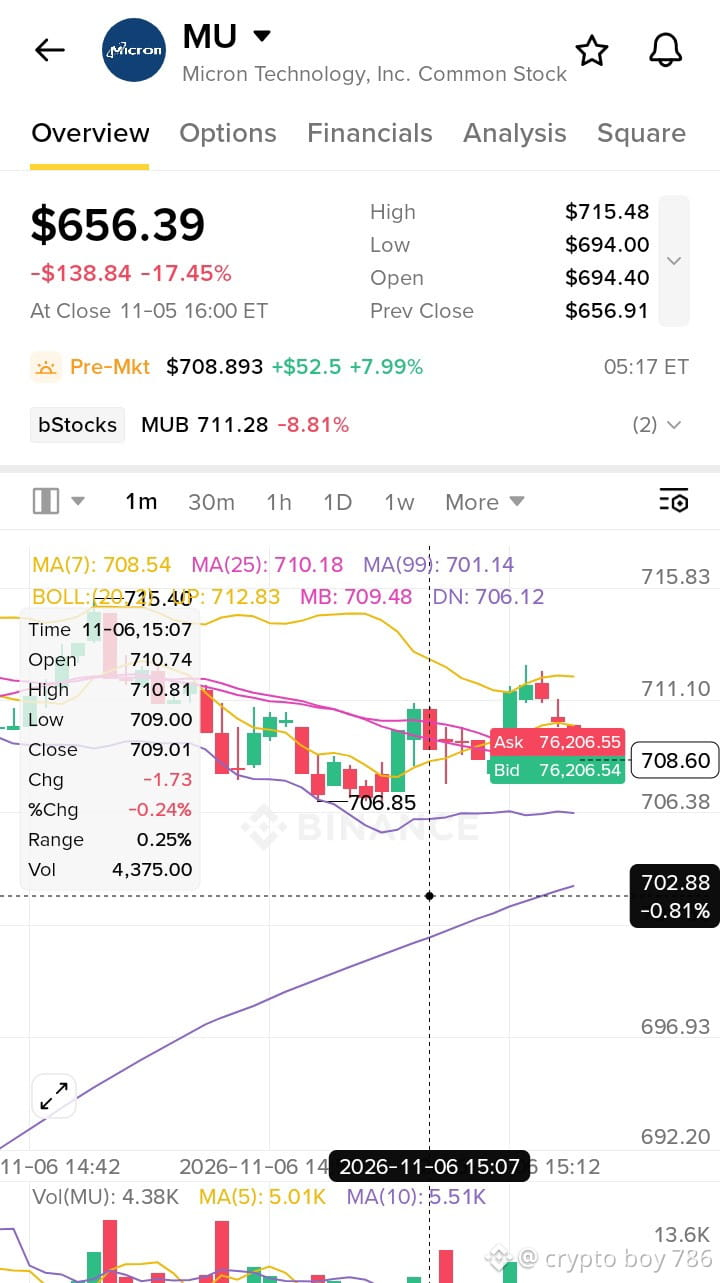
$MU – $712.57 (+8.56%)Micron Technology is leading today's stock performance with an impressive 8.56% gain, bringing its price to $712.57. Strong interest in memory chips and AI infrastructure may be supporting market enthusiasm. This is a notable move, but investors should remain careful about volatility and sudden price changes.
$MU
{future}(MUUSDT)
#BinanceReopensWithdrawalsForMoreAssets #Write2Earn #MU #Micron #Stocks
$MU – $712.57 (+8.56%)Micron Technology is leading today's stock performance with an impressive 8.56% gain, bringing its price to $712.57. Strong interest in memory chips and AI infrastructure may be supporting market enthusiasm. This is a notable move, but investors should remain careful about volatility and sudden price changes.
$MU
#BinanceReopensWithdrawalsForMoreAssets #Write2Earn #MU #Micron #Stocks
$MU
#BinanceReopensWithdrawalsForMoreAssets #Write2Earn #MU #Micron #Stocks
169

·
--
Cyber Defense Rally: $CRWDB Gains Steam on Binance Spot 🚀
CrowdStrike Holdings tokenized as CRWDB/USDT is trading at $225.96, up 3.95% over the past 24 h on Binance Spot. $CRWDB is benefitting from the broader cyber‑security sector’s earnings beat trend, reinforcing demand for threat‑intelligence platforms.
Price action: The stock opened near $220, surged past $225, and now holds above the $224.50 intraday pivot, indicating strong buying pressure.
Key levels – Immediate support sits at $221.00, a zone that held during the last pull‑back. Resistance clusters around $230.00, the next ceiling that has capped prior rallies. The mid‑range equilibrium is near $225.00, acting as a balance point for short‑term traders.
Short outlook: With momentum building and no adverse news, dips to the $221‑$223 band appear attractive for entry. Expect the bullish continuation to persist as institutional inflows chase sector outperformance, targeting a break above $230.00.
#CRWDB #Stocks #BinanceSquare
Cyber Defense Rally: $CRWDB Gains Steam on Binance Spot 🚀
CrowdStrike Holdings tokenized as CRWDB/USDT is trading at $225.96, up 3.95% over the past 24 h on Binance Spot. $CRWDB is benefitting from the broader cyber‑security sector’s earnings beat trend, reinforcing demand for threat‑intelligence platforms.
Price action: The stock opened near $220, surged past $225, and now holds above the $224.50 intraday pivot, indicating strong buying pressure.
Key levels – Immediate support sits at $221.00, a zone that held during the last pull‑back. Resistance clusters around $230.00, the next ceiling that has capped prior rallies. The mid‑range equilibrium is near $225.00, acting as a balance point for short‑term traders.
Short outlook: With momentum building and no adverse news, dips to the $221‑$223 band appear attractive for entry. Expect the bullish continuation to persist as institutional inflows chase sector outperformance, targeting a break above $230.00.
#CRWDB #Stocks #BinanceSquare
CrowdStrike Holdings tokenized as CRWDB/USDT is trading at $225.96, up 3.95% over the past 24 h on Binance Spot. $CRWDB is benefitting from the broader cyber‑security sector’s earnings beat trend, reinforcing demand for threat‑intelligence platforms.
Price action: The stock opened near $220, surged past $225, and now holds above the $224.50 intraday pivot, indicating strong buying pressure.
Key levels – Immediate support sits at $221.00, a zone that held during the last pull‑back. Resistance clusters around $230.00, the next ceiling that has capped prior rallies. The mid‑range equilibrium is near $225.00, acting as a balance point for short‑term traders.
Short outlook: With momentum building and no adverse news, dips to the $221‑$223 band appear attractive for entry. Expect the bullish continuation to persist as institutional inflows chase sector outperformance, targeting a break above $230.00.
#CRWDB #Stocks #BinanceSquare

·
--
White House economic advisor Kevin Hassett stated that Intel's results are a positive sign for the chip industry.
The comment comes as $INTC has declined 54% over the past 30 days, losing over $310,000,000,000 in value.
#Markets #Stocks
White House economic advisor Kevin Hassett stated that Intel's results are a positive sign for the chip industry.
The comment comes as $INTC has declined 54% over the past 30 days, losing over $310,000,000,000 in value.
#Markets #Stocks
The comment comes as $INTC has declined 54% over the past 30 days, losing over $310,000,000,000 in value.
#Markets #Stocks
229
·
--
Bullish
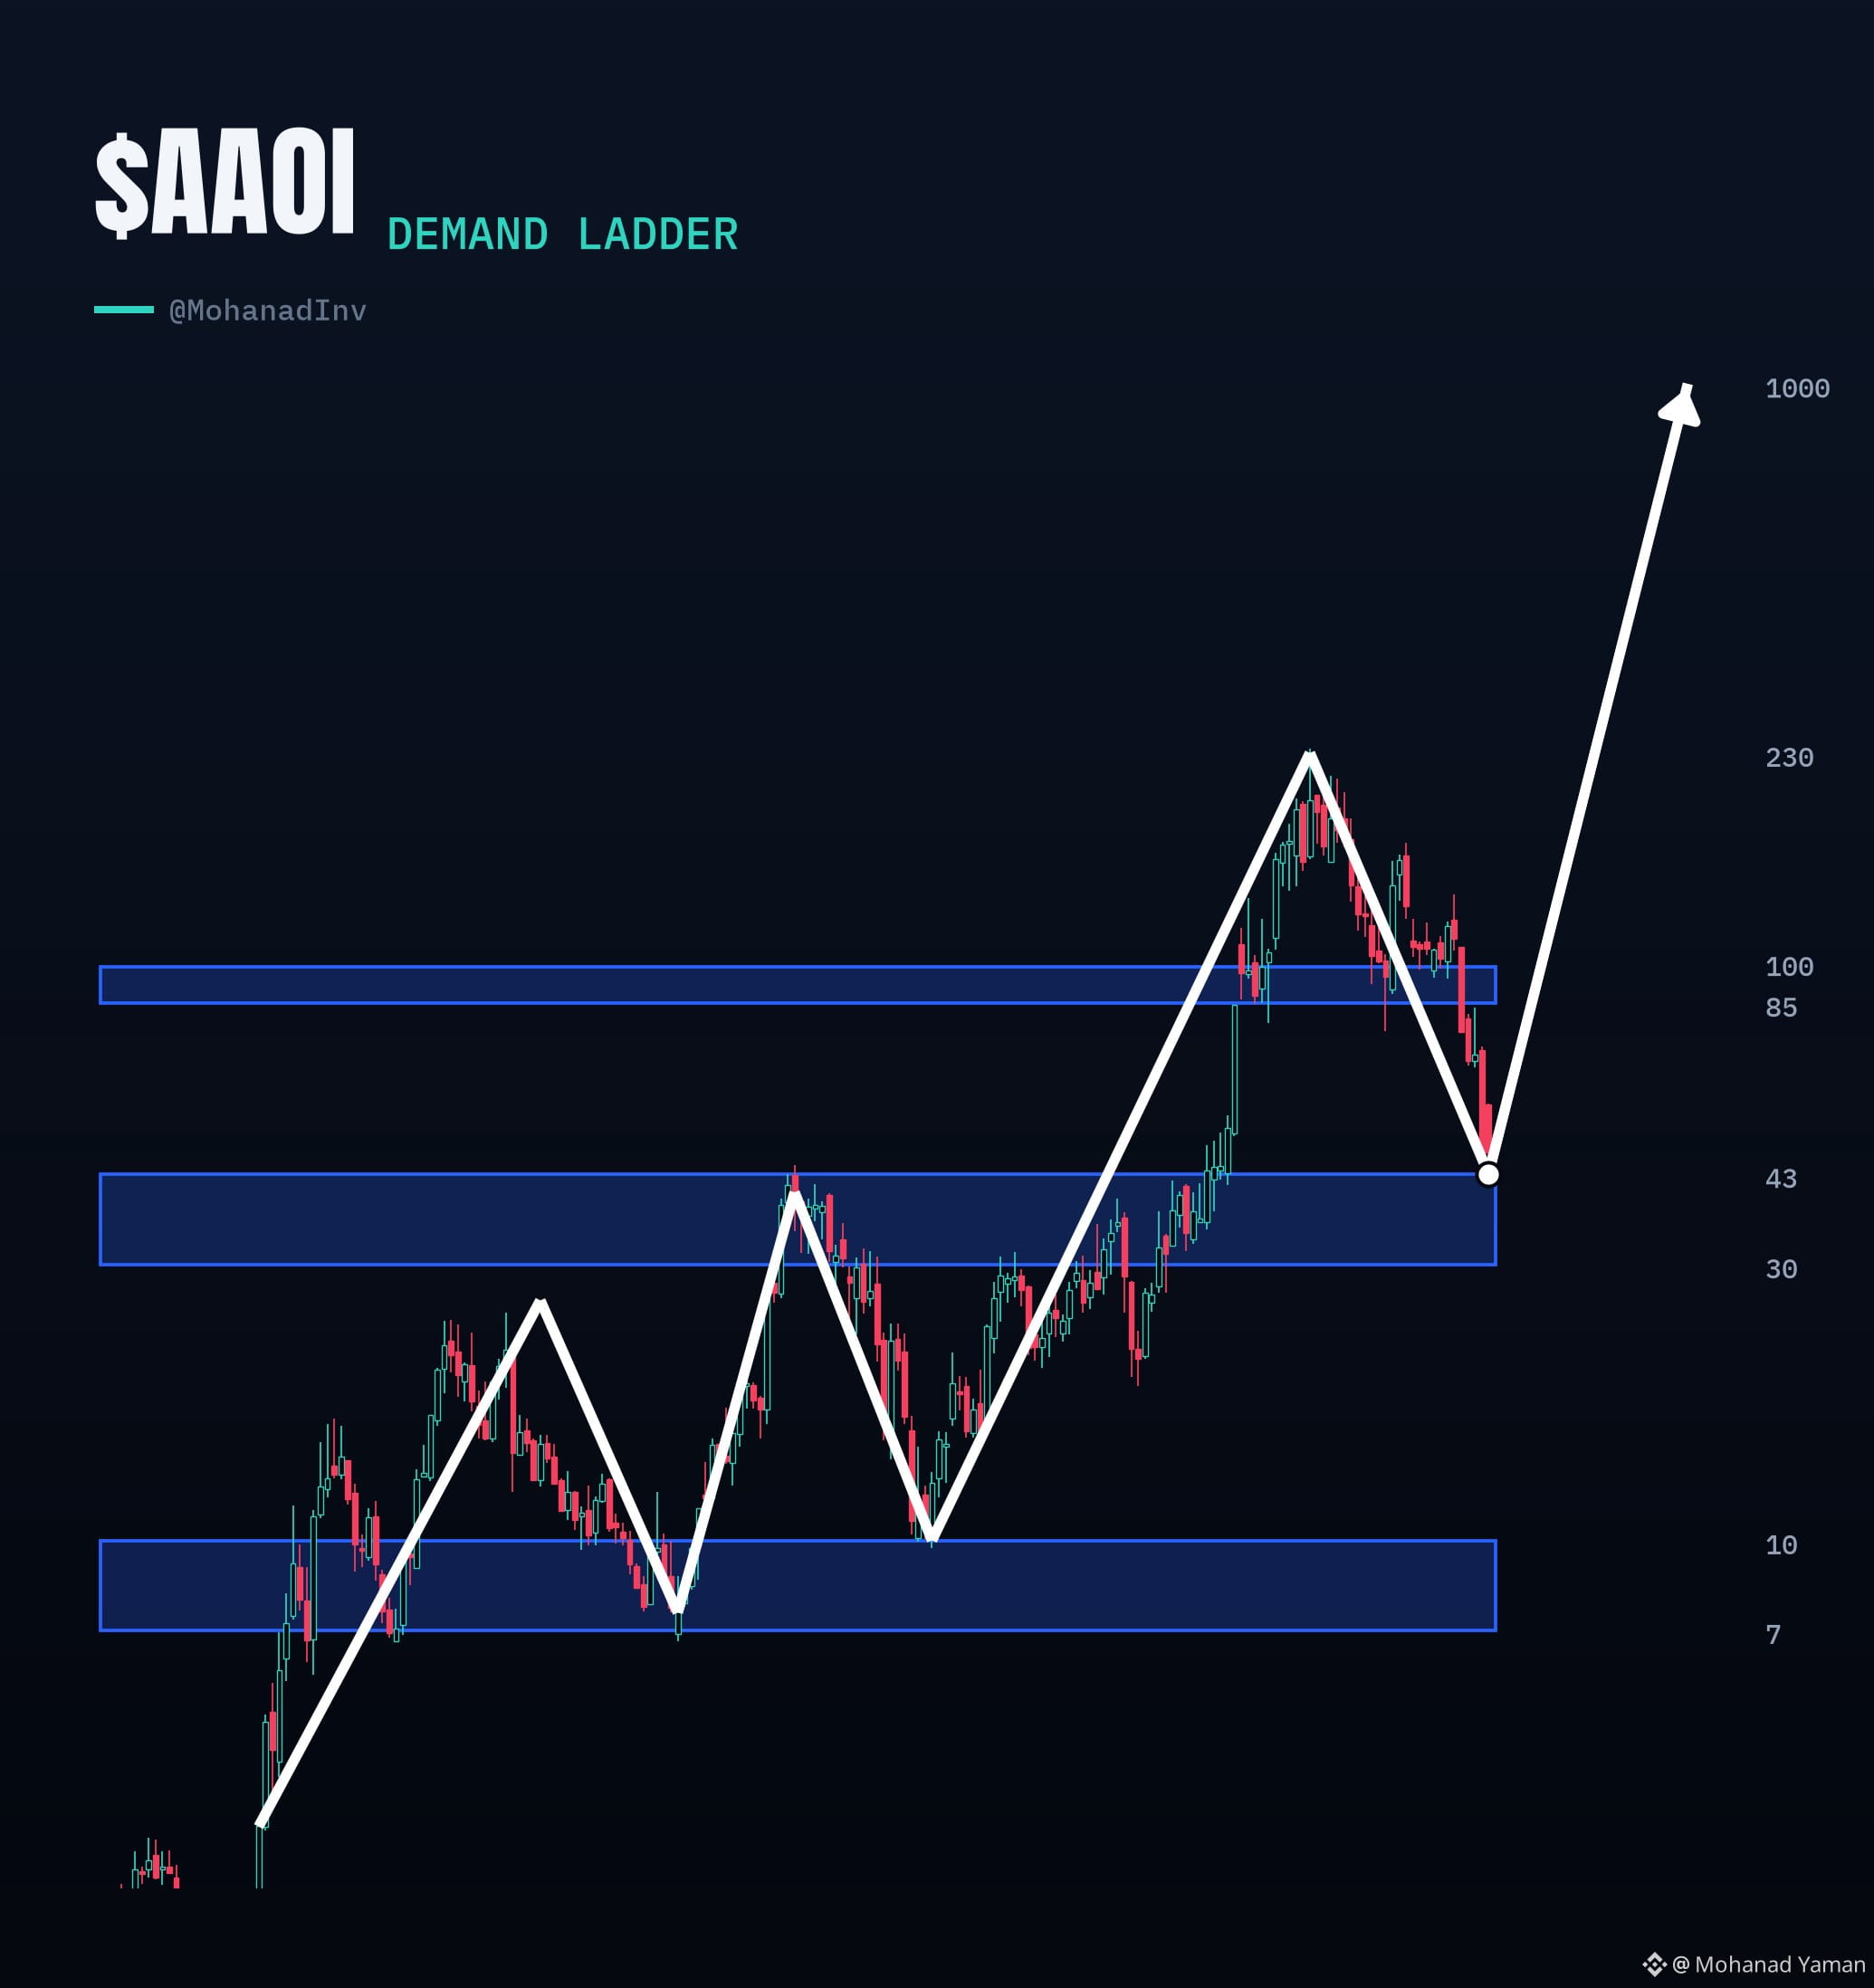
📈 $AAOI I just got handed the next rung on the ladder 👀
Last two times it claimed a demand zone, it ripped to new highs
$7 → $43 (+514%) 🚀
$10 → $230 (+2,200%) 🚀
$43 → $1,000 next 🤔🤔
✅ Q3 reported $270M (+128% YoY) and flipped to profit. The dump was the soft Q4 guide and a slower capacity buildout not demand dying
Same setup. Bigger target. To Uranus next? 🚀🪐
I personally don't know 😅
#stocks
{spot}(AAOIBUSDT)
📈 $AAOI I just got handed the next rung on the ladder 👀
Last two times it claimed a demand zone, it ripped to new highs
$7 → $43 (+514%) 🚀
$10 → $230 (+2,200%) 🚀
$43 → $1,000 next 🤔🤔
✅ Q3 reported $270M (+128% YoY) and flipped to profit. The dump was the soft Q4 guide and a slower capacity buildout not demand dying
Same setup. Bigger target. To Uranus next? 🚀🪐
I personally don't know 😅
#stocks
Last two times it claimed a demand zone, it ripped to new highs
$7 → $43 (+514%) 🚀
$10 → $230 (+2,200%) 🚀
$43 → $1,000 next 🤔🤔
✅ Q3 reported $270M (+128% YoY) and flipped to profit. The dump was the soft Q4 guide and a slower capacity buildout not demand dying
Same setup. Bigger target. To Uranus next? 🚀🪐
I personally don't know 😅
#stocks
Mohammad naeem 519:
$AAOI definitely has an interesting growth story. 📈
The revenue growth and return to profitability are encouraging signs, but reaching $1,000 is a huge target and will require strong execution.
I'm watching future earnings, demand trends, and the company's ability to expand capacity.
Potential is there, but fundamentals and confirmation matter more than hype. Let's see what happens next! 🚀
#AAOI #Stocks #Investing #MarketAnalysis
1
1.3k

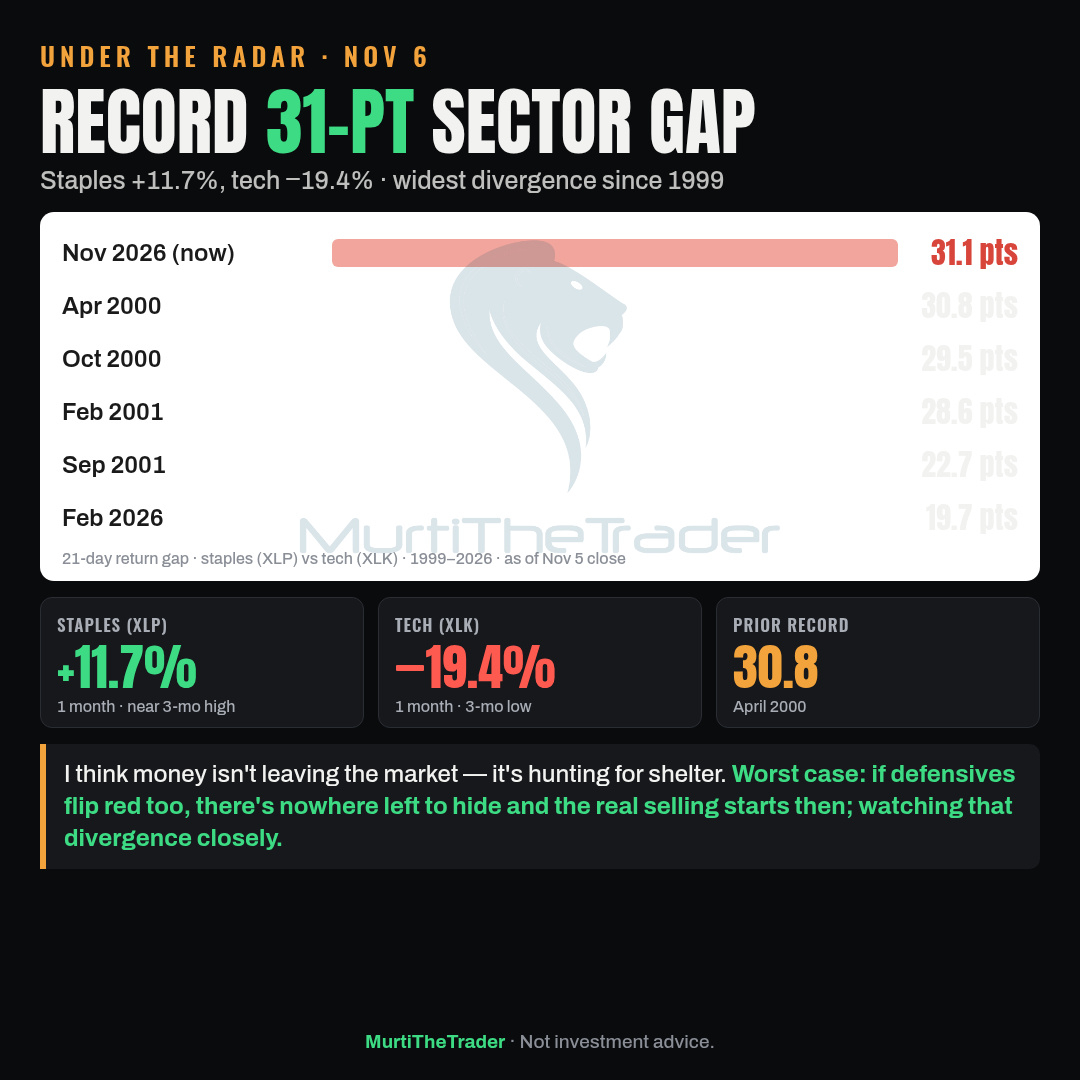
Under the radar: Over the past month consumer staples ($XLP ) are +11.7% while tech ($XLK ) is −19.4% — a 31-point gap, the widest since 1999.
→ Prior record: April 2000 at 30.8 points
→ 4 of the top 5 gaps came from 2000–2001, the years the bubble deflated
→ Staples are near a 3-month high; tech is at a 3-month low
I think money isn't leaving the market — it's hunting for shelter. Worst case: if defensives flip red too, there's nowhere left to hide and the real selling starts then; watching that divergence closely.
Watching: $XLP $XLK $SPY
#Stocks #Economy #Selloff
Under the radar: Over the past month consumer staples ($XLP ) are +11.7% while tech ($XLK ) is −19.4% — a 31-point gap, the widest since 1999.
→ Prior record: April 2000 at 30.8 points
→ 4 of the top 5 gaps came from 2000–2001, the years the bubble deflated
→ Staples are near a 3-month high; tech is at a 3-month low
I think money isn't leaving the market — it's hunting for shelter. Worst case: if defensives flip red too, there's nowhere left to hide and the real selling starts then; watching that divergence closely.
Watching: $XLP $XLK $SPY
#Stocks #Economy #Selloff
→ Prior record: April 2000 at 30.8 points
→ 4 of the top 5 gaps came from 2000–2001, the years the bubble deflated
→ Staples are near a 3-month high; tech is at a 3-month low
I think money isn't leaving the market — it's hunting for shelter. Worst case: if defensives flip red too, there's nowhere left to hide and the real selling starts then; watching that divergence closely.
Watching: $XLP $XLK $SPY
#Stocks #Economy #Selloff
117
Partly True
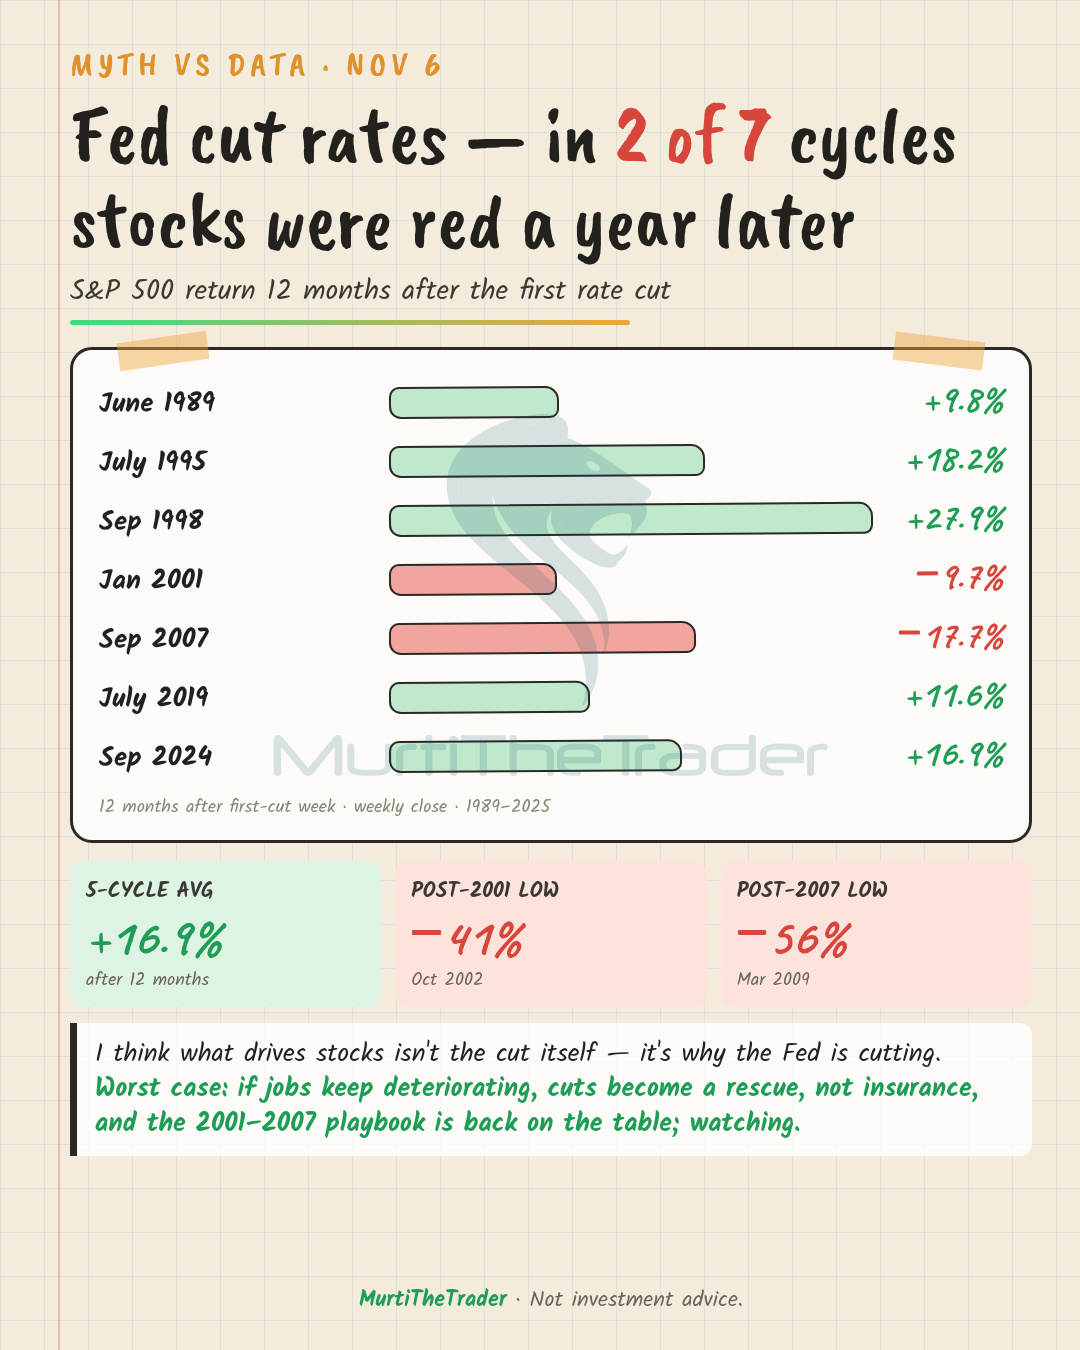
Myth vs data: "When the Fed cuts rates, stocks go up." Since 1989, in 2 of 7 cut cycles the S&P 500 ($SPY ) was still red a year later.
→ 1989, 1995, 1998, 2019, 2024: +9.8% to +27.9% twelve months later
→ 2001: −9.7% at 12 months, −41% into the trough
→ 2007: −17.7% at 12 months, −56% into the trough
I think what drives stocks isn't the cut — it's why the Fed is cutting. Worst case: if employment keeps breaking down, cuts become a rescue, not insurance, and the 2001–2007 pattern is back on the table; watching.
Watching: $SPY $QQQ $IWM
#FOMC #Economy #Stocks
Myth vs data: "When the Fed cuts rates, stocks go up." Since 1989, in 2 of 7 cut cycles the S&P 500 ($SPY ) was still red a year later.
→ 1989, 1995, 1998, 2019, 2024: +9.8% to +27.9% twelve months later
→ 2001: −9.7% at 12 months, −41% into the trough
→ 2007: −17.7% at 12 months, −56% into the trough
I think what drives stocks isn't the cut — it's why the Fed is cutting. Worst case: if employment keeps breaking down, cuts become a rescue, not insurance, and the 2001–2007 pattern is back on the table; watching.
Watching: $SPY $QQQ $IWM
#FOMC #Economy #Stocks
→ 1989, 1995, 1998, 2019, 2024: +9.8% to +27.9% twelve months later
→ 2001: −9.7% at 12 months, −41% into the trough
→ 2007: −17.7% at 12 months, −56% into the trough
I think what drives stocks isn't the cut — it's why the Fed is cutting. Worst case: if employment keeps breaking down, cuts become a rescue, not insurance, and the 2001–2007 pattern is back on the table; watching.
Watching: $SPY $QQQ $IWM
#FOMC #Economy #Stocks
863

·
--
Bullish
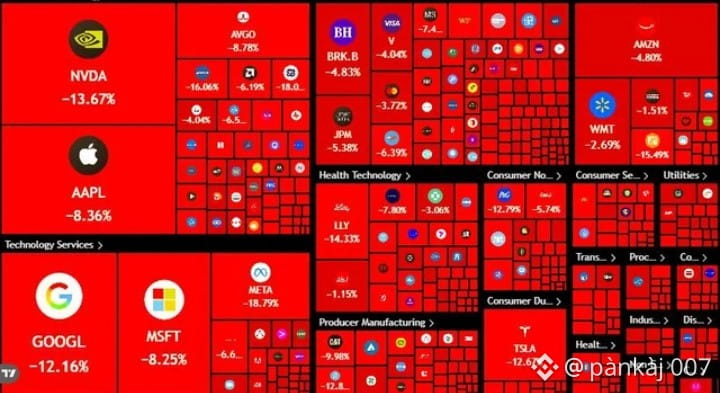
🚨 MARKET CRASH: $2.5 Trillion Wiped Out in Historic Tech Bloodbath! 📉
The market just witnessed one of its most brutal corrections as a massive tech sell-off sent shockwaves across global finance. Hyper-extended valuations in the artificial intelligence sector and new regulatory fears triggered a wave of institutional panic selling.
Here is how the major benchmarks collapsed:
• Nasdaq Composite 📉 Plunged 5.5% straight into official correction territory.
• S&P 500 📉 Tumbled 4.4%, marking its deepest single-day decline in over a year.
• Dow Jones 📉 Plummeted 1,833 points (3.4%), completely erasing its recent record gains.
The Tech Giants Hit Hardest:
• Nvidia ($NVDAB ): 🔴 Dropped 9.3%, wiping out billions in equity value.
• AMD ($AMDB ): 🔴 Plummeted 17% as semiconductor infrastructure faced brutal liquidation.
• SanDisk: 🔴 Crashed 22%, leading the S&P 500 decliners.
With all 11 S&P 500 sectors in the red, Wall Street’s "Fear Index" (VIX) surged 61%. Capital is aggressively fleeing into safe havens, driving the 10-year Treasury yield down to 4.84%.
Traders, how are you positioning your portfolios right now? Are you buying the dip, or shifting entirely into stablecoins and crypto? Let's discuss below! 👇
follow and like for more market news
#MarketUpdate #Nvidia #Stocks #Finance #Trading
$TRX
🚨 MARKET CRASH: $2.5 Trillion Wiped Out in Historic Tech Bloodbath! 📉
The market just witnessed one of its most brutal corrections as a massive tech sell-off sent shockwaves across global finance. Hyper-extended valuations in the artificial intelligence sector and new regulatory fears triggered a wave of institutional panic selling.
Here is how the major benchmarks collapsed:
• Nasdaq Composite 📉 Plunged 5.5% straight into official correction territory.
• S&P 500 📉 Tumbled 4.4%, marking its deepest single-day decline in over a year.
• Dow Jones 📉 Plummeted 1,833 points (3.4%), completely erasing its recent record gains.
The Tech Giants Hit Hardest:
• Nvidia ($NVDAB ): 🔴 Dropped 9.3%, wiping out billions in equity value.
• AMD ($AMDB ): 🔴 Plummeted 17% as semiconductor infrastructure faced brutal liquidation.
• SanDisk: 🔴 Crashed 22%, leading the S&P 500 decliners.
With all 11 S&P 500 sectors in the red, Wall Street’s "Fear Index" (VIX) surged 61%. Capital is aggressively fleeing into safe havens, driving the 10-year Treasury yield down to 4.84%.
Traders, how are you positioning your portfolios right now? Are you buying the dip, or shifting entirely into stablecoins and crypto? Let's discuss below! 👇
follow and like for more market news
#MarketUpdate #Nvidia #Stocks #Finance #Trading
$TRX
The market just witnessed one of its most brutal corrections as a massive tech sell-off sent shockwaves across global finance. Hyper-extended valuations in the artificial intelligence sector and new regulatory fears triggered a wave of institutional panic selling.
Here is how the major benchmarks collapsed:
• Nasdaq Composite 📉 Plunged 5.5% straight into official correction territory.
• S&P 500 📉 Tumbled 4.4%, marking its deepest single-day decline in over a year.
• Dow Jones 📉 Plummeted 1,833 points (3.4%), completely erasing its recent record gains.
The Tech Giants Hit Hardest:
• Nvidia ($NVDAB ): 🔴 Dropped 9.3%, wiping out billions in equity value.
• AMD ($AMDB ): 🔴 Plummeted 17% as semiconductor infrastructure faced brutal liquidation.
• SanDisk: 🔴 Crashed 22%, leading the S&P 500 decliners.
With all 11 S&P 500 sectors in the red, Wall Street’s "Fear Index" (VIX) surged 61%. Capital is aggressively fleeing into safe havens, driving the 10-year Treasury yield down to 4.84%.
Traders, how are you positioning your portfolios right now? Are you buying the dip, or shifting entirely into stablecoins and crypto? Let's discuss below! 👇
follow and like for more market news
#MarketUpdate #Nvidia #Stocks #Finance #Trading
$TRX
1
115

·
--
Micron closed at $656.39 Thursday, down 17.5% in one session and 47.7% from its 52-week high of $1,255.
The important question isn't whether HBM demand disappeared overnight. There's no evidence it did.
It's whether investors are starting to price the next memory cycle before the current one has peaked.
HBM allocations can remain tight while expectations for future pricing, capacity growth and margins deteriorate.
That distinction matters. A memory producer can report strong earnings and still see its valuation contract if the market no longer believes those earnings are sustainable.
I'd watch HBM contract pricing, customer delivery commitments and conventional DRAM supply before calling this either a bargain or the start of a new downcycle.
The stock has already repriced. The industry fundamentals still need to be tested.
#stocks #StocksDown
$MU.US
{stock_us}(MU.US)
Micron closed at $656.39 Thursday, down 17.5% in one session and 47.7% from its 52-week high of $1,255.
The important question isn't whether HBM demand disappeared overnight. There's no evidence it did.
It's whether investors are starting to price the next memory cycle before the current one has peaked.
HBM allocations can remain tight while expectations for future pricing, capacity growth and margins deteriorate.
That distinction matters. A memory producer can report strong earnings and still see its valuation contract if the market no longer believes those earnings are sustainable.
I'd watch HBM contract pricing, customer delivery commitments and conventional DRAM supply before calling this either a bargain or the start of a new downcycle.
The stock has already repriced. The industry fundamentals still need to be tested.
#stocks #StocksDown
$MU.US
The important question isn't whether HBM demand disappeared overnight. There's no evidence it did.
It's whether investors are starting to price the next memory cycle before the current one has peaked.
HBM allocations can remain tight while expectations for future pricing, capacity growth and margins deteriorate.
That distinction matters. A memory producer can report strong earnings and still see its valuation contract if the market no longer believes those earnings are sustainable.
I'd watch HBM contract pricing, customer delivery commitments and conventional DRAM supply before calling this either a bargain or the start of a new downcycle.
The stock has already repriced. The industry fundamentals still need to be tested.
#stocks #StocksDown
$MU.US
MUUS+4.20%
386
·
--
South Korea's KOSPI index has triggered a circuit breaker following a sharp market plunge, falling below the 5,000 level.
#Markets #Stocks
South Korea's KOSPI index has triggered a circuit breaker following a sharp market plunge, falling below the 5,000 level.
#Markets #Stocks
#Markets #Stocks
47
·
--
South Korea's KOSPI stock market dropped 9%, triggering a circuit breaker and halting trading on the exchange.
#Stocks #Markets
South Korea's KOSPI stock market dropped 9%, triggering a circuit breaker and halting trading on the exchange.
#Stocks #Markets
#Stocks #Markets
55
Partly True
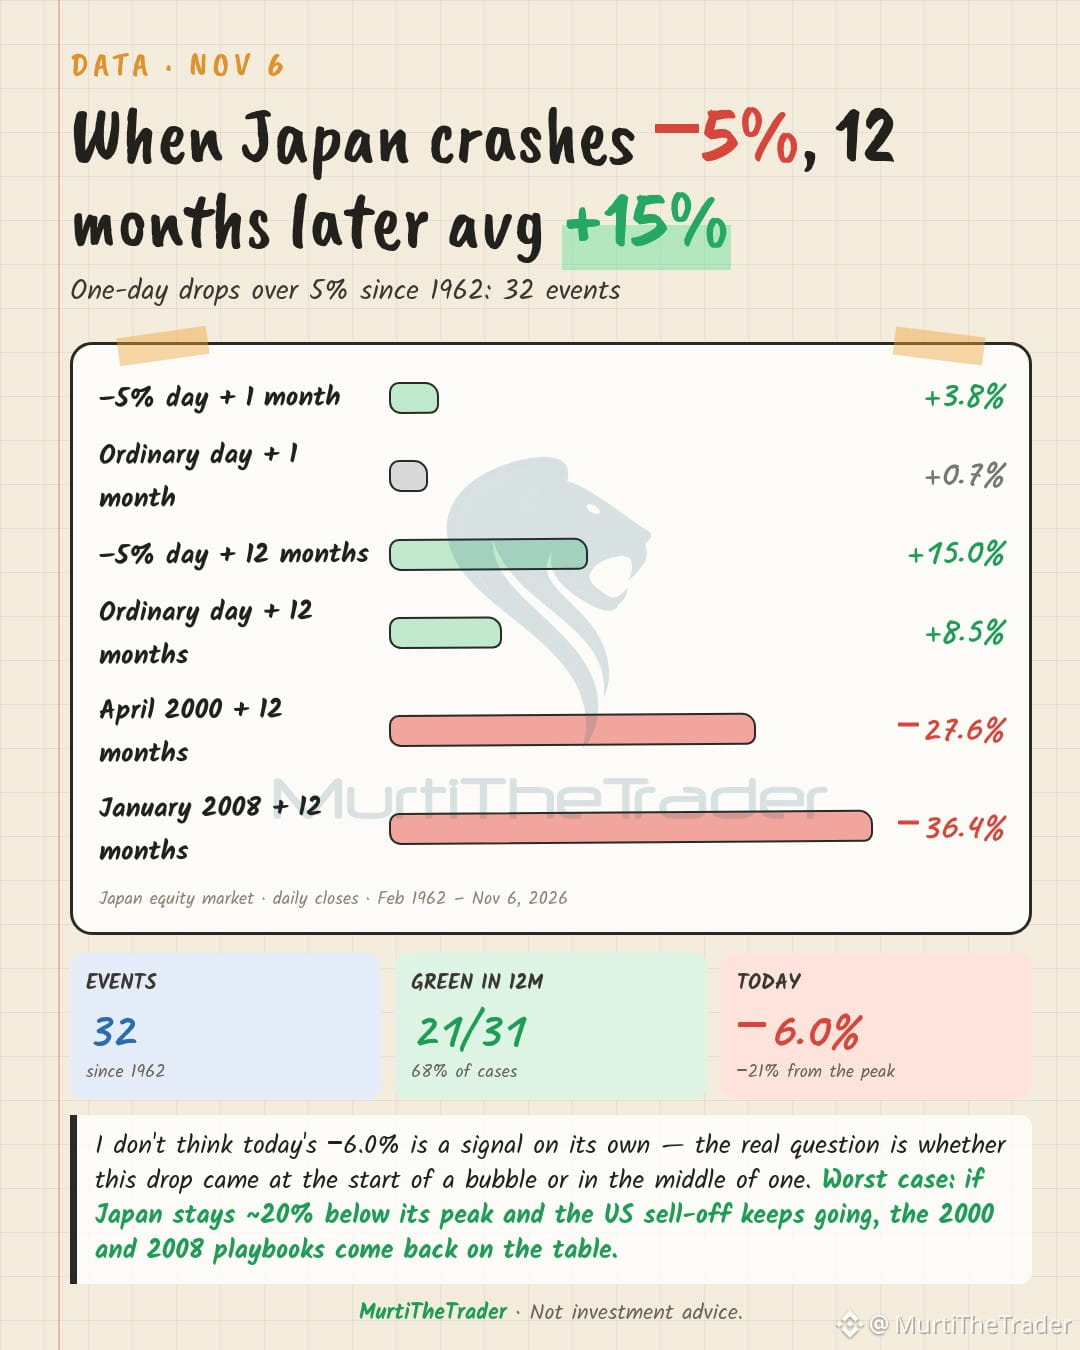
Data: Since 1962, Japan's stock market has dropped more than 5% in a single day 32 times — and 12 months later, 21 of 31 of those were green.
→ 1 month later: avg +3.8% vs +0.7% on a normal day
→ 12 months later: avg +15.0% vs +8.5% on a normal day
→ But April 2000: −27.6%, January 2008: −36.4%
I don't think today's −6.0% is a signal on its own — the real question is whether this drop came at the start of a bubble or in the middle of one.
Watching: $EWJ $SPY $QQQ
#USStocksSlipandCryptoMarketUnderBroadPressure #Stocks #Economy
Data: Since 1962, Japan's stock market has dropped more than 5% in a single day 32 times — and 12 months later, 21 of 31 of those were green.
→ 1 month later: avg +3.8% vs +0.7% on a normal day
→ 12 months later: avg +15.0% vs +8.5% on a normal day
→ But April 2000: −27.6%, January 2008: −36.4%
I don't think today's −6.0% is a signal on its own — the real question is whether this drop came at the start of a bubble or in the middle of one.
Watching: $EWJ $SPY $QQQ
#USStocksSlipandCryptoMarketUnderBroadPressure #Stocks #Economy
→ 1 month later: avg +3.8% vs +0.7% on a normal day
→ 12 months later: avg +15.0% vs +8.5% on a normal day
→ But April 2000: −27.6%, January 2008: −36.4%
I don't think today's −6.0% is a signal on its own — the real question is whether this drop came at the start of a bubble or in the middle of one.
Watching: $EWJ $SPY $QQQ
#USStocksSlipandCryptoMarketUnderBroadPressure #Stocks #Economy
1
797

·
--
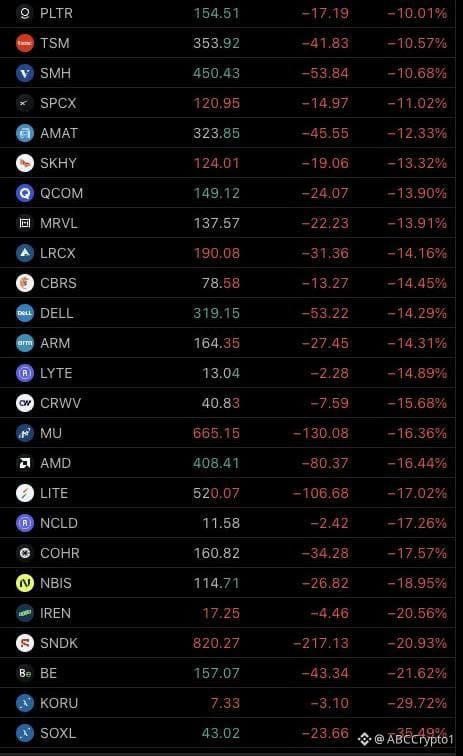
🤔 The US market right now.
Double-digit drops and liquidation cascades in AI tickers.
The market could potentially face trading halts — about 3% left until the first circuit breaker. 👀
#stocks #markets #BTC #crypto #BinanceSquare
🤔 The US market right now.
Double-digit drops and liquidation cascades in AI tickers.
The market could potentially face trading halts — about 3% left until the first circuit breaker. 👀
#stocks #markets #BTC #crypto #BinanceSquare
Double-digit drops and liquidation cascades in AI tickers.
The market could potentially face trading halts — about 3% left until the first circuit breaker. 👀
#stocks #markets #BTC #crypto #BinanceSquare
183
Partly True
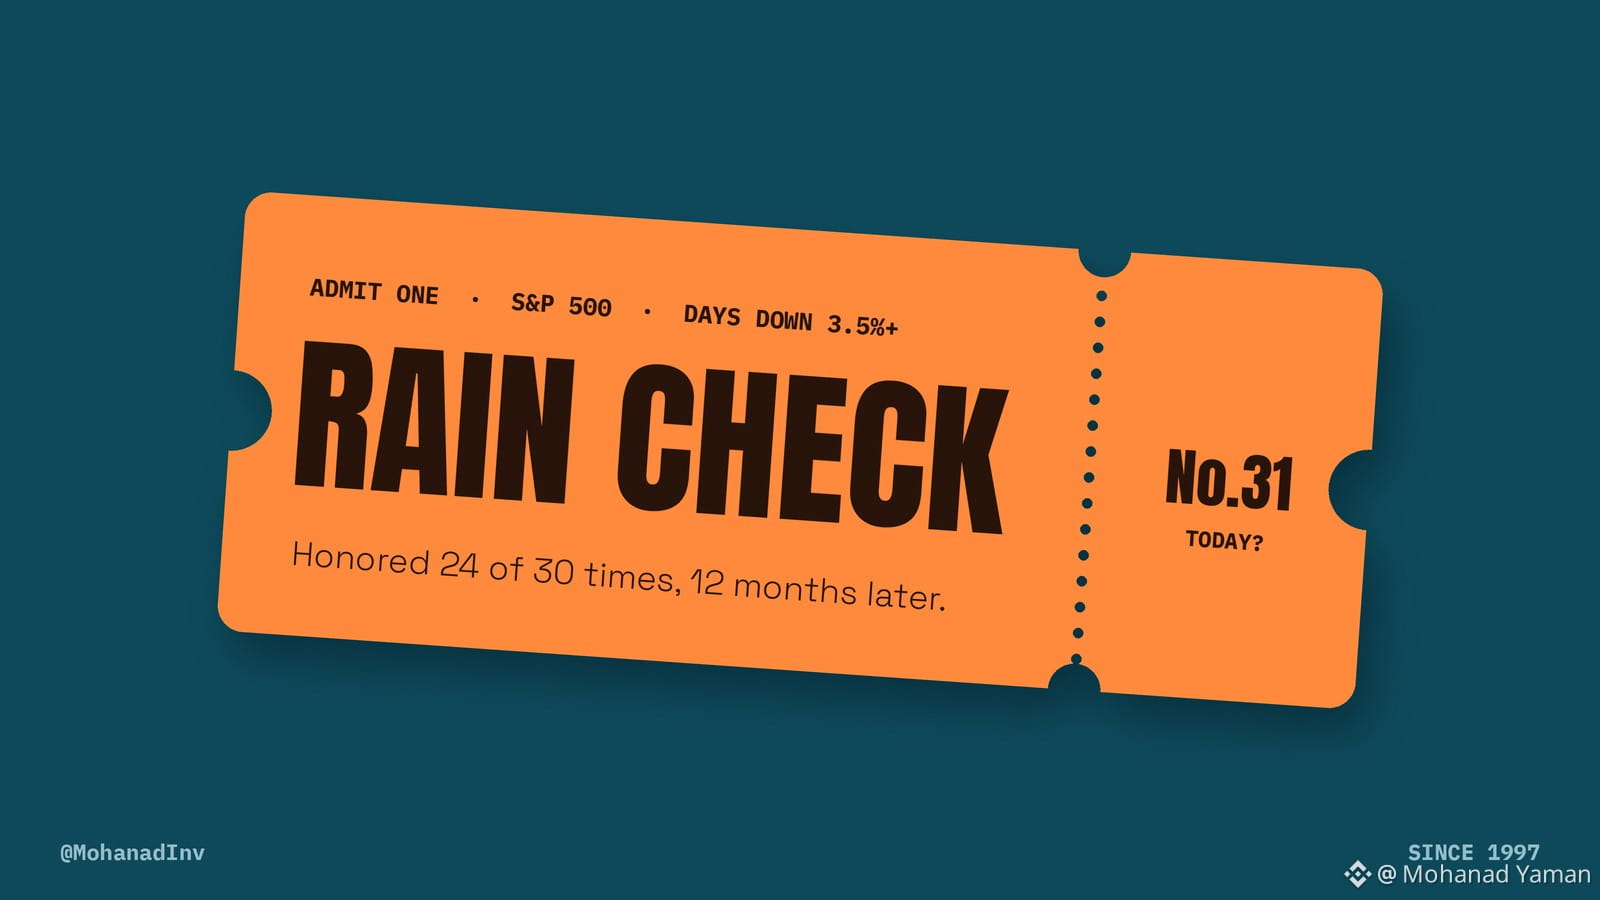
$SPX down about 3.7% today 📉
Since 1997 there have been 30 separate selloffs with a day down 3.5% or more.
12 months later, $SPX was higher in 24 of them. Median gain about 20% 📈
The 6 that weren't: 2000 (twice), 2001 (twice), Sep 2008 and Apr 2022. Not every big red day is the bottom.
Big red days have usually been a rain check, not a farewell. Adding or sitting tight? 🤔
#stocks
$SPX down about 3.7% today 📉
Since 1997 there have been 30 separate selloffs with a day down 3.5% or more.
12 months later, $SPX was higher in 24 of them. Median gain about 20% 📈
The 6 that weren't: 2000 (twice), 2001 (twice), Sep 2008 and Apr 2022. Not every big red day is the bottom.
Big red days have usually been a rain check, not a farewell. Adding or sitting tight? 🤔
#stocks
Since 1997 there have been 30 separate selloffs with a day down 3.5% or more.
12 months later, $SPX was higher in 24 of them. Median gain about 20% 📈
The 6 that weren't: 2000 (twice), 2001 (twice), Sep 2008 and Apr 2022. Not every big red day is the bottom.
Big red days have usually been a rain check, not a farewell. Adding or sitting tight? 🤔
#stocks
1.2k
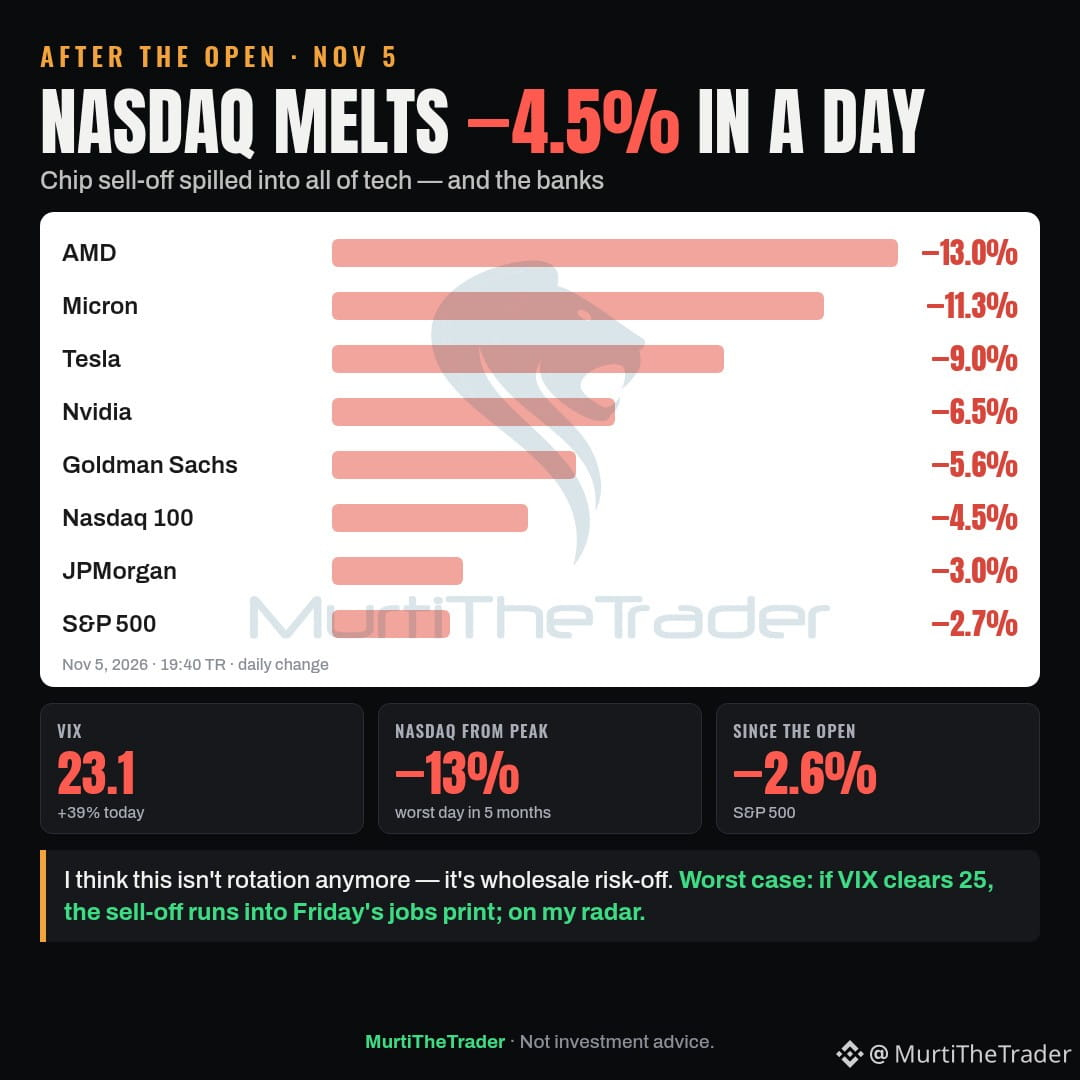
After the open: Nasdaq 100 ($QQQ ) is headed for its worst day in 5 months at −4.5%, and sits 13% below its peak.
→ Since the open: S&P 500 −2.6%, Nasdaq 100 −3.2%; VIX +39% to 23.1
→ AMD ($AMD ) −13%, Micron −11.3%, Tesla −9%, Nvidia ($NVDA ) −6.5%
→ I said this morning money was rotating out of tech — but with JPMorgan −3% and Goldman Sachs −5.6%, the banks are selling too
I think this isn't rotation anymore — it's wholesale risk-off. Worst case: if VIX clears 25, the sell-off runs into Friday's jobs print; on my radar.
Watching: $QQQ $NVDA $AMD
#USStocksSlipandCryptoMarketUnderBroadPressure #Banks #Stocks
After the open: Nasdaq 100 ($QQQ ) is headed for its worst day in 5 months at −4.5%, and sits 13% below its peak.
→ Since the open: S&P 500 −2.6%, Nasdaq 100 −3.2%; VIX +39% to 23.1
→ AMD ($AMD ) −13%, Micron −11.3%, Tesla −9%, Nvidia ($NVDA ) −6.5%
→ I said this morning money was rotating out of tech — but with JPMorgan −3% and Goldman Sachs −5.6%, the banks are selling too
I think this isn't rotation anymore — it's wholesale risk-off. Worst case: if VIX clears 25, the sell-off runs into Friday's jobs print; on my radar.
Watching: $QQQ $NVDA $AMD
#USStocksSlipandCryptoMarketUnderBroadPressure #Banks #Stocks
→ Since the open: S&P 500 −2.6%, Nasdaq 100 −3.2%; VIX +39% to 23.1
→ AMD ($AMD ) −13%, Micron −11.3%, Tesla −9%, Nvidia ($NVDA ) −6.5%
→ I said this morning money was rotating out of tech — but with JPMorgan −3% and Goldman Sachs −5.6%, the banks are selling too
I think this isn't rotation anymore — it's wholesale risk-off. Worst case: if VIX clears 25, the sell-off runs into Friday's jobs print; on my radar.
Watching: $QQQ $NVDA $AMD
#USStocksSlipandCryptoMarketUnderBroadPressure #Banks #Stocks
233
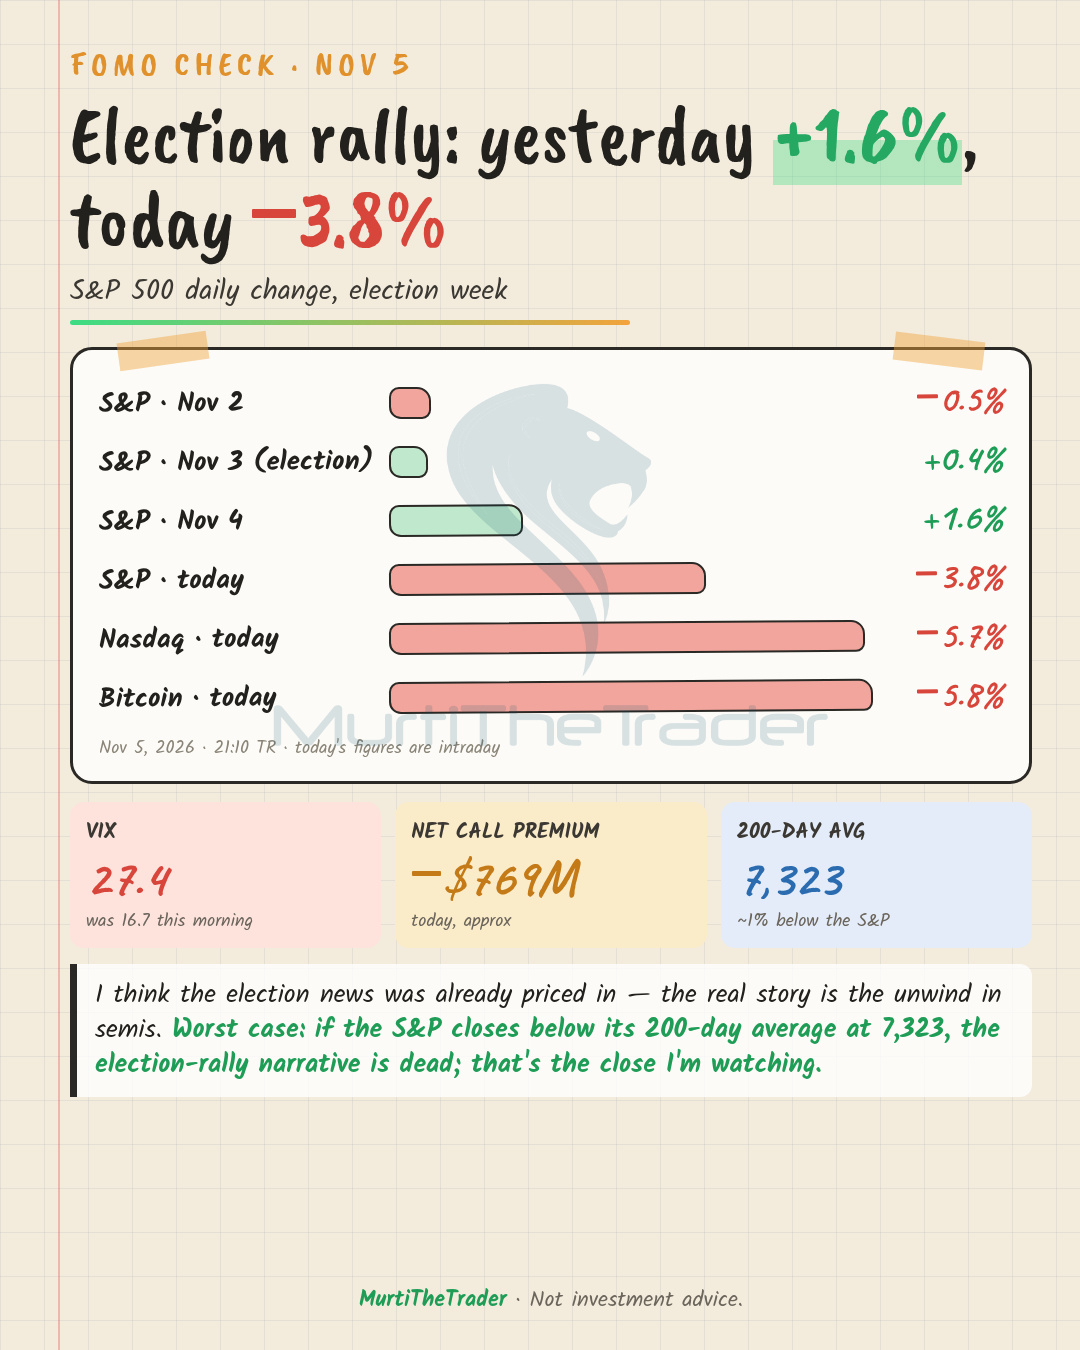
FOMO check: Everyone's saying "Democrats won, stocks will fly." The S&P 500 ($SPY ) just wiped out twice its post-election gain in one session.
→ Yesterday +1.6%, today −3.8%; now −2.3% below the election-day close
→ Nasdaq 100 ($QQQ ) −5.7%, VIX from 16.7 to 27.4
→ Options: net call premium ~−$769M, net put ~+$392M
I think the election news was already priced in — the real story is the unwind in semis. Worst case: if the S&P closes below its 200-day average at 7,323, the election-rally narrative is dead; that's the close I'm watching.
Watching: $SPY $QQQ $IWM
#USStocksSlipandCryptoMarketUnderBroadPressure #Economy #Stocks
FOMO check: Everyone's saying "Democrats won, stocks will fly." The S&P 500 ($SPY ) just wiped out twice its post-election gain in one session.
→ Yesterday +1.6%, today −3.8%; now −2.3% below the election-day close
→ Nasdaq 100 ($QQQ ) −5.7%, VIX from 16.7 to 27.4
→ Options: net call premium ~−$769M, net put ~+$392M
I think the election news was already priced in — the real story is the unwind in semis. Worst case: if the S&P closes below its 200-day average at 7,323, the election-rally narrative is dead; that's the close I'm watching.
Watching: $SPY $QQQ $IWM
#USStocksSlipandCryptoMarketUnderBroadPressure #Economy #Stocks
→ Yesterday +1.6%, today −3.8%; now −2.3% below the election-day close
→ Nasdaq 100 ($QQQ ) −5.7%, VIX from 16.7 to 27.4
→ Options: net call premium ~−$769M, net put ~+$392M
I think the election news was already priced in — the real story is the unwind in semis. Worst case: if the S&P closes below its 200-day average at 7,323, the election-rally narrative is dead; that's the close I'm watching.
Watching: $SPY $QQQ $IWM
#USStocksSlipandCryptoMarketUnderBroadPressure #Economy #Stocks
120
·
--
The Magnificent 7 technology stocks declined following news that Democrats won control of both the U.S. House of Representatives and the Senate. Over $2.3 trillion in market value was wiped out from the U.S. stock market today.
The individual stock losses were recorded as follows:
Tesla ($TSLA): -8.89%
Nvidia ($NVDA): -6.50%
Meta: -3.13%
Amazon: -2.24%
Microsoft ($MSFT): -2.19%
Google: -1.44%
Apple: -0.73%
#Stocks #Politics
The Magnificent 7 technology stocks declined following news that Democrats won control of both the U.S. House of Representatives and the Senate. Over $2.3 trillion in market value was wiped out from the U.S. stock market today.
The individual stock losses were recorded as follows:
Tesla ($TSLA ): -8.89%
Nvidia ($NVDA ): -6.50%
Meta: -3.13%
Amazon: -2.24%
Microsoft ($MSFT ): -2.19%
Google: -1.44%
Apple: -0.73%
#Stocks #Politics
The individual stock losses were recorded as follows:
Tesla ($TSLA ): -8.89%
Nvidia ($NVDA ): -6.50%
Meta: -3.13%
Amazon: -2.24%
Microsoft ($MSFT ): -2.19%
Google: -1.44%
Apple: -0.73%
#Stocks #Politics
113
·
--
Bullish
Verified
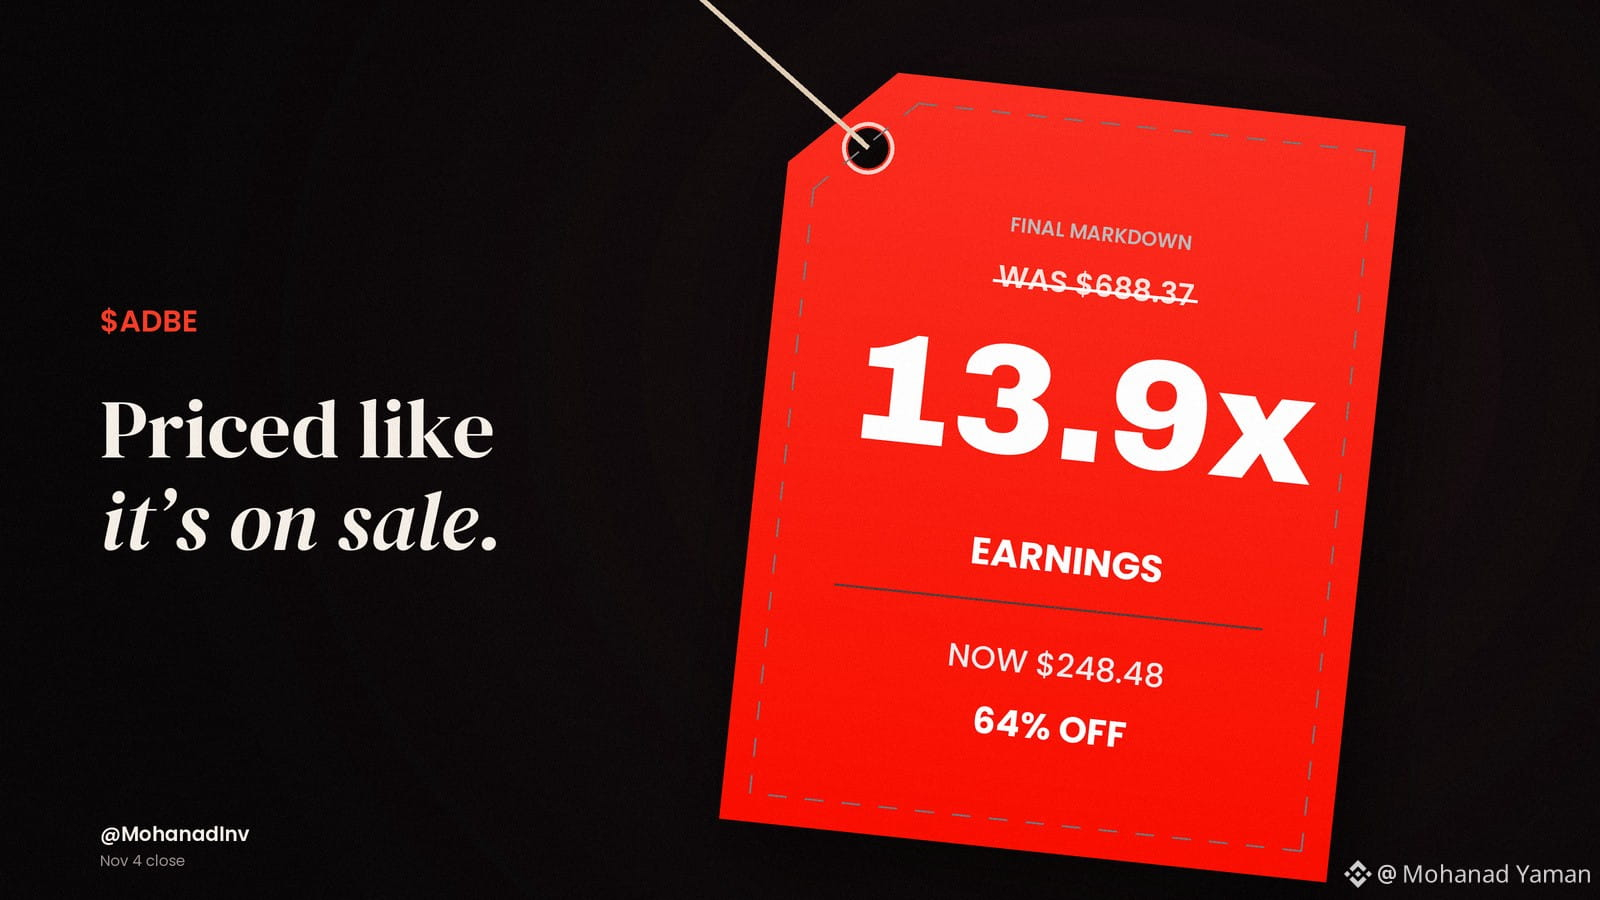
💡 $ADBE now trades at 13.9x earnings.
📉 64% below its 2021 peak and down 29% this year, while revenue is still growing double digits.
The market is pricing Adobe like a company in decline. The numbers don't say that yet. 👀
$ADBE at 13.9x earnings.
Would you buy it here?
#stocks
{spot}(ADBEBUSDT)
💡 $ADBE now trades at 13.9x earnings.
📉 64% below its 2021 peak and down 29% this year, while revenue is still growing double digits.
The market is pricing Adobe like a company in decline. The numbers don't say that yet. 👀
$ADBE at 13.9x earnings.
Would you buy it here?
#stocks
📉 64% below its 2021 peak and down 29% this year, while revenue is still growing double digits.
The market is pricing Adobe like a company in decline. The numbers don't say that yet. 👀
$ADBE at 13.9x earnings.
Would you buy it here?
#stocks
1.1k
Log in to explore more content
Join global crypto users on Binance Square
⚡️ Get latest and useful information about crypto.
💬 Trusted by the world’s largest crypto exchange.
👍 Discover real insights from verified creators.
Email / Phone number
Trending Topics
1
#JobsReportRaisesHikeOdds
13,144 views
313 Discussing
2
#US Data Center Rules May Constrain AI Expansion
2,228 views
44 Discussing
3
#CanUSStocksReboundAfterNonfarmPayrolls?
20,051 views
527 Discussing
4
#BinanceReopensWithdrawalsForMoreAssets
1.2M views
6,620 Discussing
5
#$2TWipedOutHedgeFundsFaceLiquidation
7,190 views
63 Discussing
6
#USNovemberMichiganExpectationsIndexPrelimAt50.9
382 views
44 Discussing
7
#AnthropicIPOValuationDoubts
48,562 views
840 Discussing
8
#OilPlungesBelow$100
2,994 views
25 Discussing
9
#USMidtermsCouldShakeUpUS-IranTies
14,398 views
274 Discussing
10
#RussianCentralBankNamesBTCETHUSDTForNonQualifiedInvestors
180 views
3 Discussing