
景腾不着急
55 Posts

景腾不着急
Report
Block User

Top 30D Traders by Volume

BNB Holder
High-Frequency Trader
1.3 Years
3 Following
19 Followers
18 Liked
1 Badges
Posts
·
--
There are a lot of major events this week, and every day there are speeches by Fed policy committee members. Even though there isn’t any important data, it’ll still be full of tantalizing volatility—so it’s worth looking forward to.
Key events are as follows:
The 81st United Nations General Assembly general debate will kick off on the 22nd. Iranian President Pezeshkian is expected to deliver remarks at the UN General Assembly on the 23rd.
Given the heightened tensions in recent Middle East fighting (with even Trump openly mentioning a major decision he faces regarding a potential war with Iran), oil prices, gold, and overseas “tightening/armor-bulletproof” assets are likely to see wild swings next week due to statements made during the UNGA.
According to NHK, Japan’s Prime Minister Hayashi (or “Hajiji”?) is arranging a meeting with U.S. President Trump during next week’s UN General Assembly; Kyodo News reports that the meeting is being scheduled for September 22.
Ukrainian President Zelensky said he is open to a ceasefire in the energy sector and plans to discuss it during meetings with U.S. President Trump in New York from September 21 to 23. On the 13th, Trump urged Zelensky to stop attacks on Russia’s diesel fuel facilities, saying the related strikes are causing a shortage of Russian diesel fuel.
The Nasdaq 100 index quarterly rebalancing will take effect before the U.S. stock market opens on September 21. At that time, SpaceX’s weight in the index will rise to 2.82%, up sharply from its current weight of about 1.28%. The increase matters because passive funds tracking the benchmark must adjust their holdings accordingly. This includes Invesco QQQ Trust Series 1—known as QQQ—which, with assets of $482 billion, is one of the world’s largest ETFs.
Multiple Fed policymakers will deliver speeches this week. Since Fed Chair Waller himself has said he wants to avoid providing forward-looking guidance on the path of interest rates, any hints about the plans for the Fed’s current interest-rate-hiking cycle will become even more important. Fed Vice Chair Jefferson will speak at the 2026 U.S. Treasury market conference. FOMC voting member, Cleveland Fed President Hmark, an FOMC permanent voting member, and New York Fed President Williams will also give remarks.
#btc #macro #trading #fed #crypto
There are a lot of major events this week, and every day there are speeches by Fed policy committee members. Even though there isn’t any important data, it’ll still be full of tantalizing volatility—so it’s worth looking forward to.
Key events are as follows:
The 81st United Nations General Assembly general debate will kick off on the 22nd. Iranian President Pezeshkian is expected to deliver remarks at the UN General Assembly on the 23rd.
Given the heightened tensions in recent Middle East fighting (with even Trump openly mentioning a major decision he faces regarding a potential war with Iran), oil prices, gold, and overseas “tightening/armor-bulletproof” assets are likely to see wild swings next week due to statements made during the UNGA.
According to NHK, Japan’s Prime Minister Hayashi (or “Hajiji”?) is arranging a meeting with U.S. President Trump during next week’s UN General Assembly; Kyodo News reports that the meeting is being scheduled for September 22.
Ukrainian President Zelensky said he is open to a ceasefire in the energy sector and plans to discuss it during meetings with U.S. President Trump in New York from September 21 to 23. On the 13th, Trump urged Zelensky to stop attacks on Russia’s diesel fuel facilities, saying the related strikes are causing a shortage of Russian diesel fuel.
The Nasdaq 100 index quarterly rebalancing will take effect before the U.S. stock market opens on September 21. At that time, SpaceX’s weight in the index will rise to 2.82%, up sharply from its current weight of about 1.28%. The increase matters because passive funds tracking the benchmark must adjust their holdings accordingly. This includes Invesco QQQ Trust Series 1—known as QQQ—which, with assets of $482 billion, is one of the world’s largest ETFs.
Multiple Fed policymakers will deliver speeches this week. Since Fed Chair Waller himself has said he wants to avoid providing forward-looking guidance on the path of interest rates, any hints about the plans for the Fed’s current interest-rate-hiking cycle will become even more important. Fed Vice Chair Jefferson will speak at the 2026 U.S. Treasury market conference. FOMC voting member, Cleveland Fed President Hmark, an FOMC permanent voting member, and New York Fed President Williams will also give remarks.
#btc #macro #trading #fed #crypto
Key events are as follows:
The 81st United Nations General Assembly general debate will kick off on the 22nd. Iranian President Pezeshkian is expected to deliver remarks at the UN General Assembly on the 23rd.
Given the heightened tensions in recent Middle East fighting (with even Trump openly mentioning a major decision he faces regarding a potential war with Iran), oil prices, gold, and overseas “tightening/armor-bulletproof” assets are likely to see wild swings next week due to statements made during the UNGA.
According to NHK, Japan’s Prime Minister Hayashi (or “Hajiji”?) is arranging a meeting with U.S. President Trump during next week’s UN General Assembly; Kyodo News reports that the meeting is being scheduled for September 22.
Ukrainian President Zelensky said he is open to a ceasefire in the energy sector and plans to discuss it during meetings with U.S. President Trump in New York from September 21 to 23. On the 13th, Trump urged Zelensky to stop attacks on Russia’s diesel fuel facilities, saying the related strikes are causing a shortage of Russian diesel fuel.
The Nasdaq 100 index quarterly rebalancing will take effect before the U.S. stock market opens on September 21. At that time, SpaceX’s weight in the index will rise to 2.82%, up sharply from its current weight of about 1.28%. The increase matters because passive funds tracking the benchmark must adjust their holdings accordingly. This includes Invesco QQQ Trust Series 1—known as QQQ—which, with assets of $482 billion, is one of the world’s largest ETFs.
Multiple Fed policymakers will deliver speeches this week. Since Fed Chair Waller himself has said he wants to avoid providing forward-looking guidance on the path of interest rates, any hints about the plans for the Fed’s current interest-rate-hiking cycle will become even more important. Fed Vice Chair Jefferson will speak at the 2026 U.S. Treasury market conference. FOMC voting member, Cleveland Fed President Hmark, an FOMC permanent voting member, and New York Fed President Williams will also give remarks.
#btc #macro #trading #fed #crypto
78
·
--
$BTC The major resistance this year—namely the upper edge of the consolidation range after last month’s bull market started—at 82k. This month it has already been tested four times. And yesterday, the pullback that met resistance was only just a little; it won’t be long before it breaks above.
#btc #crypto #trading #macro #altcoins
$BTC The major resistance this year—namely the upper edge of the consolidation range after last month’s bull market started—at 82k. This month it has already been tested four times. And yesterday, the pullback that met resistance was only just a little; it won’t be long before it breaks above.
#btc #crypto #trading #macro #altcoins
#btc #crypto #trading #macro #altcoins
55
·
--
As long as tensions in the Middle East ease, inflation doesn’t rebound, and another earnings season rolls around near year-end, having the S&P 500 extend fresh highs to 8,000 this year should be pretty effortless. Now, the market’s main storyline isn’t about how many GPUs are sold anymore—it’s about期待(expectation)that the AI dividend will spread into a broader range of industries, not just the “Seven Fairies.” The earnings of the other 400-plus constituent stocks should be repaired in tandem, with EPS continuing to be revised upward.
#btc #macro #trading #crypto #stocks
As long as tensions in the Middle East ease, inflation doesn’t rebound, and another earnings season rolls around near year-end, having the S&P 500 extend fresh highs to 8,000 this year should be pretty effortless. Now, the market’s main storyline isn’t about how many GPUs are sold anymore—it’s about期待(expectation)that the AI dividend will spread into a broader range of industries, not just the “Seven Fairies.” The earnings of the other 400-plus constituent stocks should be repaired in tandem, with EPS continuing to be revised upward.
#btc #macro #trading #crypto #stocks
#btc #macro #trading #crypto #stocks
24
·
--
⚡️Next week’s macro outlook: Trump’s Middle East “big decision” is approaching; the yen intervention window is nearing; the market is digesting the lingering effects of the Fed’s rate hikes this week
Next week, global markets will digest the aftershocks of the Fed’s first rate hike since 2023 this week, and reprice a “higher for longer” interest-rate path. Geopolitically, Trump plans to meet Gulf countries during the UN General Assembly and is set to make a “major decision” on whether to escalate its approach to attacks on Iran. In Saudi Arabia, the capital sounded air-raid alerts again after months, with oil-market risk premium and actual supply repairs tugging against each other. Japan, meanwhile, enters “Silver Week” with a long holiday, where liquidity is thin and the yen remains under pressure, causing expectations for policy intervention to heat up. Key events are as follows:
Tuesday: Trump meets Persian Gulf nations during the UN General Assembly in New York and makes a “major decision” on its approach to Iran; the U.S. Treasury auctions $69 billion in two-year Treasury notes; New York Fed President Williams and Fed Vice Chair Jefferson deliver remarks.
Wednesday: The U.S. Treasury auctions $70 billion in five-year Treasury notes; Richmond Fed President Barkin delivers remarks.
Thursday: The U.S. Treasury auctions $44 billion in seven-year Treasury notes; the European Central Bank releases an economic bulletin; New York Fed President Williams, Richmond Fed President Barkin, Cleveland Fed President Mester, and Philadelphia Fed President Plosser give frequent remarks.
Friday: Final reading of the University of Michigan consumer sentiment index for September, and the final value of one-year inflation expectations; New York Fed President Williams delivers remarks again.
#btc #macro #trading #fed #fomc
⚡️Next week’s macro outlook: Trump’s Middle East “big decision” is approaching; the yen intervention window is nearing; the market is digesting the lingering effects of the Fed’s rate hikes this week
Next week, global markets will digest the aftershocks of the Fed’s first rate hike since 2023 this week, and reprice a “higher for longer” interest-rate path. Geopolitically, Trump plans to meet Gulf countries during the UN General Assembly and is set to make a “major decision” on whether to escalate its approach to attacks on Iran. In Saudi Arabia, the capital sounded air-raid alerts again after months, with oil-market risk premium and actual supply repairs tugging against each other. Japan, meanwhile, enters “Silver Week” with a long holiday, where liquidity is thin and the yen remains under pressure, causing expectations for policy intervention to heat up. Key events are as follows:
Tuesday: Trump meets Persian Gulf nations during the UN General Assembly in New York and makes a “major decision” on its approach to Iran; the U.S. Treasury auctions $69 billion in two-year Treasury notes; New York Fed President Williams and Fed Vice Chair Jefferson deliver remarks.
Wednesday: The U.S. Treasury auctions $70 billion in five-year Treasury notes; Richmond Fed President Barkin delivers remarks.
Thursday: The U.S. Treasury auctions $44 billion in seven-year Treasury notes; the European Central Bank releases an economic bulletin; New York Fed President Williams, Richmond Fed President Barkin, Cleveland Fed President Mester, and Philadelphia Fed President Plosser give frequent remarks.
Friday: Final reading of the University of Michigan consumer sentiment index for September, and the final value of one-year inflation expectations; New York Fed President Williams delivers remarks again.
#btc #macro #trading #fed #fomc
Next week, global markets will digest the aftershocks of the Fed’s first rate hike since 2023 this week, and reprice a “higher for longer” interest-rate path. Geopolitically, Trump plans to meet Gulf countries during the UN General Assembly and is set to make a “major decision” on whether to escalate its approach to attacks on Iran. In Saudi Arabia, the capital sounded air-raid alerts again after months, with oil-market risk premium and actual supply repairs tugging against each other. Japan, meanwhile, enters “Silver Week” with a long holiday, where liquidity is thin and the yen remains under pressure, causing expectations for policy intervention to heat up. Key events are as follows:
Tuesday: Trump meets Persian Gulf nations during the UN General Assembly in New York and makes a “major decision” on its approach to Iran; the U.S. Treasury auctions $69 billion in two-year Treasury notes; New York Fed President Williams and Fed Vice Chair Jefferson deliver remarks.
Wednesday: The U.S. Treasury auctions $70 billion in five-year Treasury notes; Richmond Fed President Barkin delivers remarks.
Thursday: The U.S. Treasury auctions $44 billion in seven-year Treasury notes; the European Central Bank releases an economic bulletin; New York Fed President Williams, Richmond Fed President Barkin, Cleveland Fed President Mester, and Philadelphia Fed President Plosser give frequent remarks.
Friday: Final reading of the University of Michigan consumer sentiment index for September, and the final value of one-year inflation expectations; New York Fed President Williams delivers remarks again.
#btc #macro #trading #fed #fomc
58
·
--
Trying to break even, losing even harder—the 4 psychological traps most damaging to you in the crypto market
In the crypto market, I’ve seen too many people treat “breaking even” as their only goal. The deeper they get, the more they sink—turning partial losses into a full-position trap. These 4 traps are quietly draining your account.
1. Loss anchor: you’re being held hostage by your cost basis
Once the coin you bought starts falling, many people stop looking at fundamentals or new market signals. All they can see is the “entry price.”
The market is ruthless. It doesn’t know where you bought, and it certainly won’t raise prices just because you’re losing and need to get back to your cost basis.
What you should ask is: given current market conditions, is this trade still worth holding?
Your cost basis is a past chain—don’t use it to decide what to do now.
2. Break-even asymmetry: what you call “adding to recover” is a mathematical illusion
A 20% loss doesn’t mean you can recover with a 20% gain—it requires a 25% gain. A 50% loss needs a 100% gain just to return to the starting point.
The deeper the drop, the steeper the climb ahead. Many people think they can just “hold on” and it’ll pass—until the decline gets out of control. Then they realize that filling this hole takes several times more effort.
3. Averaging-down illusion: you’re not lowering your cost—you’re concentrating risk
When it drops, you average down. It looks like your cost gets lower, and a small rebound might help you break even. But what you don’t see is this: your position is getting heavier, and your risk exposure is expanding rapidly.
The prerequisite for averaging down is confidence in your assessment of this asset. If you’re only doing it because you can’t stand the loss or you want to lower your cost basis, that’s not self-rescue—it’s turning a partial loss into a full-position life-or-death situation.
4. Exit reappraisal: unrealized losses aren’t real losses; exiting isn’t surrender
Many people think “selling means surrender.” But exiting isn’t surrender—it’s reclaiming choice.
With that money, you can look for truly valuable opportunities in the market. If you keep stubbornly holding, you’re only passively praying for the market to come back.
The real way out is never “waiting until you break even.” It’s reappraising: placing this capital here—does it actually still make sense?
What determines your account’s fate is never the cost basis line you keep staring at. It’s whether you’re willing to face the real risks—and whether you dare to make a new choice.
#btc #crypto #trading #altcoins #macro
Trying to break even, losing even harder—the 4 psychological traps most damaging to you in the crypto market
In the crypto market, I’ve seen too many people treat “breaking even” as their only goal. The deeper they get, the more they sink—turning partial losses into a full-position trap. These 4 traps are quietly draining your account.
1. Loss anchor: you’re being held hostage by your cost basis
Once the coin you bought starts falling, many people stop looking at fundamentals or new market signals. All they can see is the “entry price.”
The market is ruthless. It doesn’t know where you bought, and it certainly won’t raise prices just because you’re losing and need to get back to your cost basis.
What you should ask is: given current market conditions, is this trade still worth holding?
Your cost basis is a past chain—don’t use it to decide what to do now.
2. Break-even asymmetry: what you call “adding to recover” is a mathematical illusion
A 20% loss doesn’t mean you can recover with a 20% gain—it requires a 25% gain. A 50% loss needs a 100% gain just to return to the starting point.
The deeper the drop, the steeper the climb ahead. Many people think they can just “hold on” and it’ll pass—until the decline gets out of control. Then they realize that filling this hole takes several times more effort.
3. Averaging-down illusion: you’re not lowering your cost—you’re concentrating risk
When it drops, you average down. It looks like your cost gets lower, and a small rebound might help you break even. But what you don’t see is this: your position is getting heavier, and your risk exposure is expanding rapidly.
The prerequisite for averaging down is confidence in your assessment of this asset. If you’re only doing it because you can’t stand the loss or you want to lower your cost basis, that’s not self-rescue—it’s turning a partial loss into a full-position life-or-death situation.
4. Exit reappraisal: unrealized losses aren’t real losses; exiting isn’t surrender
Many people think “selling means surrender.” But exiting isn’t surrender—it’s reclaiming choice.
With that money, you can look for truly valuable opportunities in the market. If you keep stubbornly holding, you’re only passively praying for the market to come back.
The real way out is never “waiting until you break even.” It’s reappraising: placing this capital here—does it actually still make sense?
What determines your account’s fate is never the cost basis line you keep staring at. It’s whether you’re willing to face the real risks—and whether you dare to make a new choice.
#btc #crypto #trading #altcoins #macro
In the crypto market, I’ve seen too many people treat “breaking even” as their only goal. The deeper they get, the more they sink—turning partial losses into a full-position trap. These 4 traps are quietly draining your account.
1. Loss anchor: you’re being held hostage by your cost basis
Once the coin you bought starts falling, many people stop looking at fundamentals or new market signals. All they can see is the “entry price.”
The market is ruthless. It doesn’t know where you bought, and it certainly won’t raise prices just because you’re losing and need to get back to your cost basis.
What you should ask is: given current market conditions, is this trade still worth holding?
Your cost basis is a past chain—don’t use it to decide what to do now.
2. Break-even asymmetry: what you call “adding to recover” is a mathematical illusion
A 20% loss doesn’t mean you can recover with a 20% gain—it requires a 25% gain. A 50% loss needs a 100% gain just to return to the starting point.
The deeper the drop, the steeper the climb ahead. Many people think they can just “hold on” and it’ll pass—until the decline gets out of control. Then they realize that filling this hole takes several times more effort.
3. Averaging-down illusion: you’re not lowering your cost—you’re concentrating risk
When it drops, you average down. It looks like your cost gets lower, and a small rebound might help you break even. But what you don’t see is this: your position is getting heavier, and your risk exposure is expanding rapidly.
The prerequisite for averaging down is confidence in your assessment of this asset. If you’re only doing it because you can’t stand the loss or you want to lower your cost basis, that’s not self-rescue—it’s turning a partial loss into a full-position life-or-death situation.
4. Exit reappraisal: unrealized losses aren’t real losses; exiting isn’t surrender
Many people think “selling means surrender.” But exiting isn’t surrender—it’s reclaiming choice.
With that money, you can look for truly valuable opportunities in the market. If you keep stubbornly holding, you’re only passively praying for the market to come back.
The real way out is never “waiting until you break even.” It’s reappraising: placing this capital here—does it actually still make sense?
What determines your account’s fate is never the cost basis line you keep staring at. It’s whether you’re willing to face the real risks—and whether you dare to make a new choice.
#btc #crypto #trading #altcoins #macro
190
·
--
A short essay explains clearly why a simple rate hike, which is bearish news, can lead to such a huge rebound?
This rate hike is absolutely not sustainable. With $40 trillion in U.S. Treasuries, the annual fiscal spending is 1/5, and the 10-year Treasury yield breaks above 5%. If rates keep going up on a compounding basis, the fiscal burden becomes unbearable—at that point, they might as well shut the government down directly without even negotiating with Congress. In the end, everything must return to the path of rate cuts.
The core reason this time’s voting members all voted for the rate hike is to deal with inflation—not because of the hot job market. And the direct driver of inflation is the oil price and decoupling. Behind the oil price is the U.S.-Iran conflict. The oil price cannot stay at elevated levels forever; it’s a one-off shock and is controllable. Trump keeps calling for rate cuts every day, but in fact the key to the oil price is in Trump’s own hands. And the oil price has already been falling from the high levels earlier. Once the oil price falls, inflation will ease. Therefore, both the high oil price and inflation are not sustainable, and the necessity of raising rates disappears.
Market expectations for further rate hikes by the Fed are so high—but precisely in this situation, “when things reach the extreme, they reverse.” That’s why we see a massive rally in crypto and global stock markets.
#btc #fed #macro #trading #fomc
A short essay explains clearly why a simple rate hike, which is bearish news, can lead to such a huge rebound?
This rate hike is absolutely not sustainable. With $40 trillion in U.S. Treasuries, the annual fiscal spending is 1/5, and the 10-year Treasury yield breaks above 5%. If rates keep going up on a compounding basis, the fiscal burden becomes unbearable—at that point, they might as well shut the government down directly without even negotiating with Congress. In the end, everything must return to the path of rate cuts.
The core reason this time’s voting members all voted for the rate hike is to deal with inflation—not because of the hot job market. And the direct driver of inflation is the oil price and decoupling. Behind the oil price is the U.S.-Iran conflict. The oil price cannot stay at elevated levels forever; it’s a one-off shock and is controllable. Trump keeps calling for rate cuts every day, but in fact the key to the oil price is in Trump’s own hands. And the oil price has already been falling from the high levels earlier. Once the oil price falls, inflation will ease. Therefore, both the high oil price and inflation are not sustainable, and the necessity of raising rates disappears.
Market expectations for further rate hikes by the Fed are so high—but precisely in this situation, “when things reach the extreme, they reverse.” That’s why we see a massive rally in crypto and global stock markets.
#btc #fed #macro #trading #fomc
This rate hike is absolutely not sustainable. With $40 trillion in U.S. Treasuries, the annual fiscal spending is 1/5, and the 10-year Treasury yield breaks above 5%. If rates keep going up on a compounding basis, the fiscal burden becomes unbearable—at that point, they might as well shut the government down directly without even negotiating with Congress. In the end, everything must return to the path of rate cuts.
The core reason this time’s voting members all voted for the rate hike is to deal with inflation—not because of the hot job market. And the direct driver of inflation is the oil price and decoupling. Behind the oil price is the U.S.-Iran conflict. The oil price cannot stay at elevated levels forever; it’s a one-off shock and is controllable. Trump keeps calling for rate cuts every day, but in fact the key to the oil price is in Trump’s own hands. And the oil price has already been falling from the high levels earlier. Once the oil price falls, inflation will ease. Therefore, both the high oil price and inflation are not sustainable, and the necessity of raising rates disappears.
Market expectations for further rate hikes by the Fed are so high—but precisely in this situation, “when things reach the extreme, they reverse.” That’s why we see a massive rally in crypto and global stock markets.
#btc #fed #macro #trading #fomc
149
·
--
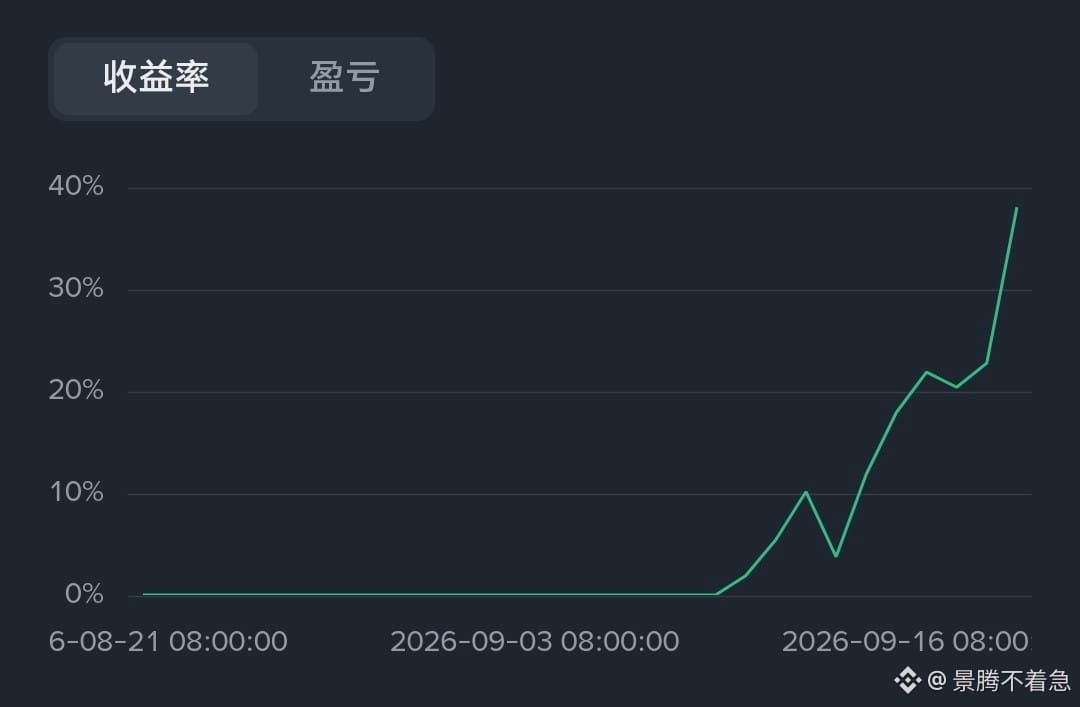
Long-awaited bull market—the 10-day return raked in nearly 40%. Bull’s back, fast return!! $BTC
Long-awaited bull market—the 10-day return raked in nearly 40%. Bull’s back, fast return!! $BTC
91
·
--
Latest News!!
Bessent meets with He Lifeng to discuss artificial intelligence, trade, and rare earth issues in preparation for the China-U.S. summit.
Already laying the groundwork—first wipe the table, bring the issues to the table, exchange bottom lines, and clarify which topics have room for negotiation.
#btc #crypto #trading #macro #altcoins
Latest News!!
Bessent meets with He Lifeng to discuss artificial intelligence, trade, and rare earth issues in preparation for the China-U.S. summit.
Already laying the groundwork—first wipe the table, bring the issues to the table, exchange bottom lines, and clarify which topics have room for negotiation.
#btc #crypto #trading #macro #altcoins
Bessent meets with He Lifeng to discuss artificial intelligence, trade, and rare earth issues in preparation for the China-U.S. summit.
Already laying the groundwork—first wipe the table, bring the issues to the table, exchange bottom lines, and clarify which topics have room for negotiation.
#btc #crypto #trading #macro #altcoins
254
·
--
$ORDI Just chewed through that 4.5 resistance level, and this time it’s real.
First, look at how hard this level has been: over the past 40 hours, price has probed around 4.5 seven times—seven tries, roughly one per hour. But there have been only two closes above it: the one at 22:00 last night, which held at 4.511; and the next candle immediately dropped back to 4.45—a classic fakeout.
Just now was different: it opened at 4.48 and closed at 4.60. The real body expanded by 2.7%, and the upper wick was almost zero. The close was 2.2% above 4.5—by the “closing effective breakout” standard, this counts as holding, not a brief poke-through and leaving.
Up 11% in 24 hours.
But structurally, there are two things to pay attention to.
First, overhead is the 20-day high at 4.606, and the current price is basically right on it. Above that, the next major resistance is 5.15, about 12% away. So breaking 4.5 doesn’t mean a smooth ride—your first hurdle is right in front of you.
Second, the floor is empty. The nearest support band from the recent structure is 4.22 to 4.24, more than 8% below the current price. If it pulls back after standing above 4.5, that 8% gap has no reference/support level to catch you in between.
Also, the pond isn’t big: 16 million USD in trading value over 24 hours. Long accounts are slightly more than shorts (1.52)—it’s being bought up, not pushed up via a short squeeze. That’s more solid than a forced squeeze, but you should be prepared for the volatility of a small liquidity pool.
My view: the breakout is valid, but the price is sitting right in the crack between “sticking to the 20-day high” and “an 8% hollow floor.” If you truly want to get involved, it’s better to wait until it closes above 4.606 as well, or if it retests 4.5 without breaking it, rather than chasing while it’s pinned to the high.
#btc #ordi #crypto #altcoins #trading
$ORDI Just chewed through that 4.5 resistance level, and this time it’s real.
First, look at how hard this level has been: over the past 40 hours, price has probed around 4.5 seven times—seven tries, roughly one per hour. But there have been only two closes above it: the one at 22:00 last night, which held at 4.511; and the next candle immediately dropped back to 4.45—a classic fakeout.
Just now was different: it opened at 4.48 and closed at 4.60. The real body expanded by 2.7%, and the upper wick was almost zero. The close was 2.2% above 4.5—by the “closing effective breakout” standard, this counts as holding, not a brief poke-through and leaving.
Up 11% in 24 hours.
But structurally, there are two things to pay attention to.
First, overhead is the 20-day high at 4.606, and the current price is basically right on it. Above that, the next major resistance is 5.15, about 12% away. So breaking 4.5 doesn’t mean a smooth ride—your first hurdle is right in front of you.
Second, the floor is empty. The nearest support band from the recent structure is 4.22 to 4.24, more than 8% below the current price. If it pulls back after standing above 4.5, that 8% gap has no reference/support level to catch you in between.
Also, the pond isn’t big: 16 million USD in trading value over 24 hours. Long accounts are slightly more than shorts (1.52)—it’s being bought up, not pushed up via a short squeeze. That’s more solid than a forced squeeze, but you should be prepared for the volatility of a small liquidity pool.
My view: the breakout is valid, but the price is sitting right in the crack between “sticking to the 20-day high” and “an 8% hollow floor.” If you truly want to get involved, it’s better to wait until it closes above 4.606 as well, or if it retests 4.5 without breaking it, rather than chasing while it’s pinned to the high.
#btc #ordi #crypto #altcoins #trading
First, look at how hard this level has been: over the past 40 hours, price has probed around 4.5 seven times—seven tries, roughly one per hour. But there have been only two closes above it: the one at 22:00 last night, which held at 4.511; and the next candle immediately dropped back to 4.45—a classic fakeout.
Just now was different: it opened at 4.48 and closed at 4.60. The real body expanded by 2.7%, and the upper wick was almost zero. The close was 2.2% above 4.5—by the “closing effective breakout” standard, this counts as holding, not a brief poke-through and leaving.
Up 11% in 24 hours.
But structurally, there are two things to pay attention to.
First, overhead is the 20-day high at 4.606, and the current price is basically right on it. Above that, the next major resistance is 5.15, about 12% away. So breaking 4.5 doesn’t mean a smooth ride—your first hurdle is right in front of you.
Second, the floor is empty. The nearest support band from the recent structure is 4.22 to 4.24, more than 8% below the current price. If it pulls back after standing above 4.5, that 8% gap has no reference/support level to catch you in between.
Also, the pond isn’t big: 16 million USD in trading value over 24 hours. Long accounts are slightly more than shorts (1.52)—it’s being bought up, not pushed up via a short squeeze. That’s more solid than a forced squeeze, but you should be prepared for the volatility of a small liquidity pool.
My view: the breakout is valid, but the price is sitting right in the crack between “sticking to the 20-day high” and “an 8% hollow floor.” If you truly want to get involved, it’s better to wait until it closes above 4.606 as well, or if it retests 4.5 without breaking it, rather than chasing while it’s pinned to the high.
#btc #ordi #crypto #altcoins #trading
713
·
--
$PENGU Today, this one is worth saying a few words about.
First, let’s talk about the move up: in the past 24 hours it’s up 10%, and during the session it even tapped a high of 0.008089. What’s interesting is that it isn’t stubbornly holding near the top right now—it has pulled back to 0.007986, exactly landing on a 4-hour support band (0.007959 to 0.008004).
The key support area hasn’t broken—that in itself is a good sign.
Next, look at the account positioning—this is the key: the long-vs-short ratio is 0.89.
What does that mean? There are more short accounts than long accounts. As the price is rising, the people shorting are still lining up to enter. Every day they “hold on,” it’s essentially lifting the sedan for the longs higher.
Also, the funding rate is only +0.0050%, slightly positive. That suggests shorts haven’t reached the point where they need to pay longs in the reverse direction—there’s still room for further squeeze to the upside.
The latest active buy/sell is 1.248, with buy orders in control—there really are buyers absorbing it.
But two points are worth pouring cold water on.
First, the liquidity is small: the 24-hour trading volume is only 77 million U. In a small pool, moves are light going up and light going down as well. If you really need to stop out, slippage will be very real.
Second, at this level it isn’t short of sell orders. On the order book, this band has repeatedly been poked with wicks and has gone through multiple fake breakouts—pull up on reduced volume, and then it falls back at the close. That indicates it’s not that there aren’t sellers; it’s that someone is willing to take all the inventory in one go.
In terms of direction, I’m bullish—and position-wise it has indeed held the support band. If it moves, just watch two numbers:
To the upside, first it needs to hold the intraday high at 0.008089;
To the downside, if the lower edge of the 0.007959 band breaks, then it’s a different story.
#btc #pengu #crypto #altcoins #trading
$PENGU Today, this one is worth saying a few words about.
First, let’s talk about the move up: in the past 24 hours it’s up 10%, and during the session it even tapped a high of 0.008089. What’s interesting is that it isn’t stubbornly holding near the top right now—it has pulled back to 0.007986, exactly landing on a 4-hour support band (0.007959 to 0.008004).
The key support area hasn’t broken—that in itself is a good sign.
Next, look at the account positioning—this is the key: the long-vs-short ratio is 0.89.
What does that mean? There are more short accounts than long accounts. As the price is rising, the people shorting are still lining up to enter. Every day they “hold on,” it’s essentially lifting the sedan for the longs higher.
Also, the funding rate is only +0.0050%, slightly positive. That suggests shorts haven’t reached the point where they need to pay longs in the reverse direction—there’s still room for further squeeze to the upside.
The latest active buy/sell is 1.248, with buy orders in control—there really are buyers absorbing it.
But two points are worth pouring cold water on.
First, the liquidity is small: the 24-hour trading volume is only 77 million U. In a small pool, moves are light going up and light going down as well. If you really need to stop out, slippage will be very real.
Second, at this level it isn’t short of sell orders. On the order book, this band has repeatedly been poked with wicks and has gone through multiple fake breakouts—pull up on reduced volume, and then it falls back at the close. That indicates it’s not that there aren’t sellers; it’s that someone is willing to take all the inventory in one go.
In terms of direction, I’m bullish—and position-wise it has indeed held the support band. If it moves, just watch two numbers:
To the upside, first it needs to hold the intraday high at 0.008089;
To the downside, if the lower edge of the 0.007959 band breaks, then it’s a different story.
#btc #pengu #crypto #altcoins #trading
First, let’s talk about the move up: in the past 24 hours it’s up 10%, and during the session it even tapped a high of 0.008089. What’s interesting is that it isn’t stubbornly holding near the top right now—it has pulled back to 0.007986, exactly landing on a 4-hour support band (0.007959 to 0.008004).
The key support area hasn’t broken—that in itself is a good sign.
Next, look at the account positioning—this is the key: the long-vs-short ratio is 0.89.
What does that mean? There are more short accounts than long accounts. As the price is rising, the people shorting are still lining up to enter. Every day they “hold on,” it’s essentially lifting the sedan for the longs higher.
Also, the funding rate is only +0.0050%, slightly positive. That suggests shorts haven’t reached the point where they need to pay longs in the reverse direction—there’s still room for further squeeze to the upside.
The latest active buy/sell is 1.248, with buy orders in control—there really are buyers absorbing it.
But two points are worth pouring cold water on.
First, the liquidity is small: the 24-hour trading volume is only 77 million U. In a small pool, moves are light going up and light going down as well. If you really need to stop out, slippage will be very real.
Second, at this level it isn’t short of sell orders. On the order book, this band has repeatedly been poked with wicks and has gone through multiple fake breakouts—pull up on reduced volume, and then it falls back at the close. That indicates it’s not that there aren’t sellers; it’s that someone is willing to take all the inventory in one go.
In terms of direction, I’m bullish—and position-wise it has indeed held the support band. If it moves, just watch two numbers:
To the upside, first it needs to hold the intraday high at 0.008089;
To the downside, if the lower edge of the 0.007959 band breaks, then it’s a different story.
#btc #pengu #crypto #altcoins #trading
428
·
--
The market is likely to stay strong until mid-Autumn Festival, with summit diplomacy around then. Domestically, it hasn’t been reported yet, but in the U.S., people are already fired up. Hold on tight and stay steady!
After taking a stroll around the community, there are way too many short-selling “fresh rice” investors. These are the fuel for our rise!$BTC $ETH $SOL
#btc #eth #sol #crypto #altcoins
The market is likely to stay strong until mid-Autumn Festival, with summit diplomacy around then. Domestically, it hasn’t been reported yet, but in the U.S., people are already fired up. Hold on tight and stay steady!
After taking a stroll around the community, there are way too many short-selling “fresh rice” investors. These are the fuel for our rise!$BTC $ETH $SOL
#btc #eth #sol #crypto #altcoins
After taking a stroll around the community, there are way too many short-selling “fresh rice” investors. These are the fuel for our rise!$BTC $ETH $SOL
#btc #eth #sol #crypto #altcoins
552
·
--
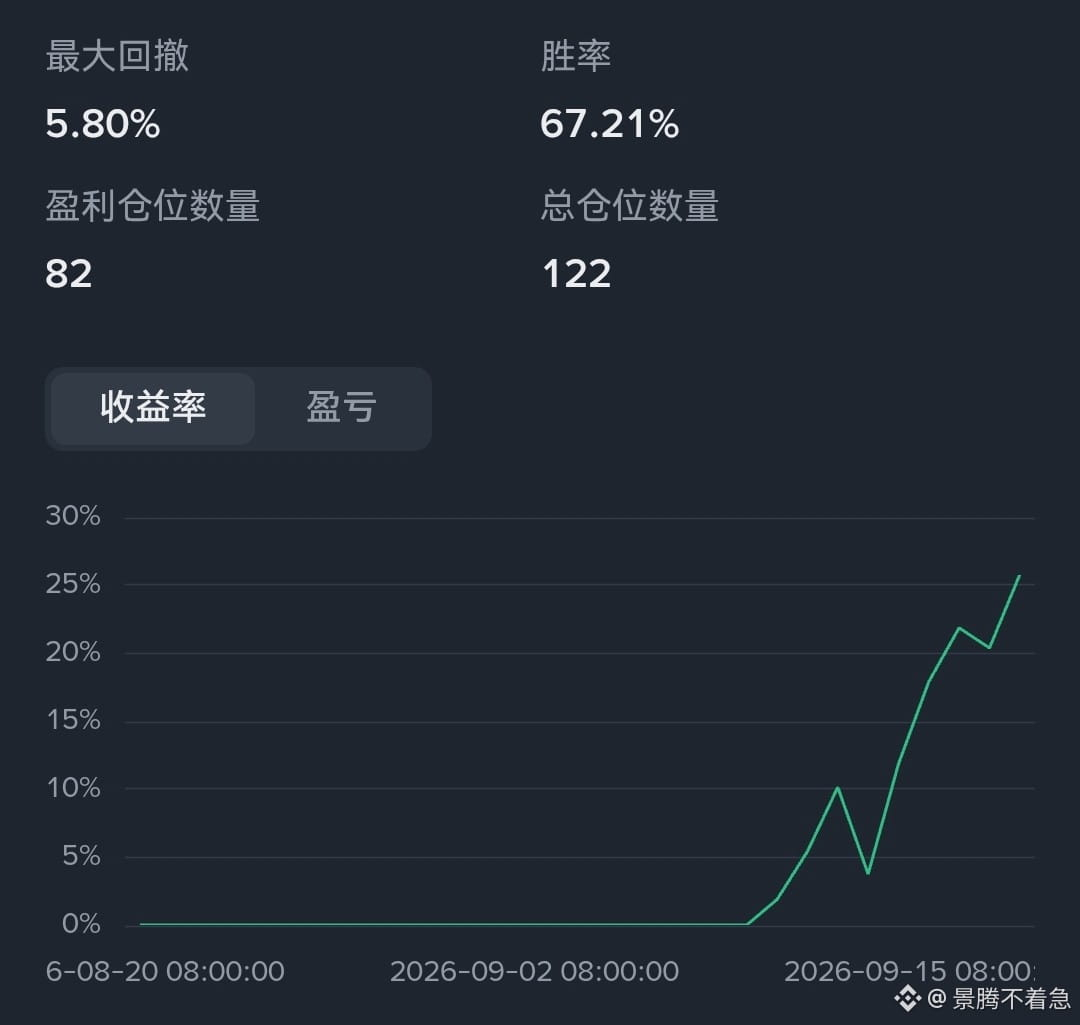
How was it, brothers, scraping up that dip the other day?
How was it, brothers, scraping up that dip the other day?
1
711
·
--
Continuing from the last one: that $ZEC said—$HYPE is also very strong today. Current price is 86.9, up 11% in the last 24 hours.
But the way these two coins pump is completely different.
For ZEC, it’s shorts being forced into a corner to get liquidated and closed out—70% of retail accounts are shorting it, and the funding rate is negative, meaning shorts have to pay longs. Its “fuel” is other people’s stop-losses.
HYPE, on the other hand: the long/short account ratio is 1.455, longs are in control, the funding rate is slightly positive, and active buying/selling is basically close to 1:1. This is bought up with real money—it's not squeezed into the rally.
On the same day, both can climb more than ten percentage points, but one relies on other traders getting liquidated, while the other relies on its own buy pressure—the quality is worlds apart.
There’s also an interesting detail: HYPE’s long/short ratio has been trending down these past few days (1.503 → 1.472 → 1.455). While the price is rising, the share of accounts going long is actually falling—suggesting some shorts are starting to enter at higher levels. Next comes the question: will we keep squeezing them, or will they be right? It depends on who breaks first.
Also don’t forget: this HYPE move has a prior cause. On the 4-hour timeframe, it showed two consecutive bullish divergences at the bottom (9/14 and 9/16). Price kept making lower lows, but MACD momentum didn’t make new lows along with it. By the time the signal appeared at 76.95, now it’s 86.9—13% of the move has already played out.
Finally, a bucket of cold water: today, what’s truly crazy isn’t HYPE. AVA is up 61%, ONE is up 61%, COTI is up 35%, NEAR is up 20%, UNI is up 16%—the whole altcoin market is moving. HYPE’s 11% is only considered a top performer among the lagging rallies.
#btc #hype #crypto #altcoins #trading
Continuing from the last one: that $ZEC said—$HYPE is also very strong today. Current price is 86.9, up 11% in the last 24 hours.
But the way these two coins pump is completely different.
For ZEC, it’s shorts being forced into a corner to get liquidated and closed out—70% of retail accounts are shorting it, and the funding rate is negative, meaning shorts have to pay longs. Its “fuel” is other people’s stop-losses.
HYPE, on the other hand: the long/short account ratio is 1.455, longs are in control, the funding rate is slightly positive, and active buying/selling is basically close to 1:1. This is bought up with real money—it's not squeezed into the rally.
On the same day, both can climb more than ten percentage points, but one relies on other traders getting liquidated, while the other relies on its own buy pressure—the quality is worlds apart.
There’s also an interesting detail: HYPE’s long/short ratio has been trending down these past few days (1.503 → 1.472 → 1.455). While the price is rising, the share of accounts going long is actually falling—suggesting some shorts are starting to enter at higher levels. Next comes the question: will we keep squeezing them, or will they be right? It depends on who breaks first.
Also don’t forget: this HYPE move has a prior cause. On the 4-hour timeframe, it showed two consecutive bullish divergences at the bottom (9/14 and 9/16). Price kept making lower lows, but MACD momentum didn’t make new lows along with it. By the time the signal appeared at 76.95, now it’s 86.9—13% of the move has already played out.
Finally, a bucket of cold water: today, what’s truly crazy isn’t HYPE. AVA is up 61%, ONE is up 61%, COTI is up 35%, NEAR is up 20%, UNI is up 16%—the whole altcoin market is moving. HYPE’s 11% is only considered a top performer among the lagging rallies.
#btc #hype #crypto #altcoins #trading
But the way these two coins pump is completely different.
For ZEC, it’s shorts being forced into a corner to get liquidated and closed out—70% of retail accounts are shorting it, and the funding rate is negative, meaning shorts have to pay longs. Its “fuel” is other people’s stop-losses.
HYPE, on the other hand: the long/short account ratio is 1.455, longs are in control, the funding rate is slightly positive, and active buying/selling is basically close to 1:1. This is bought up with real money—it's not squeezed into the rally.
On the same day, both can climb more than ten percentage points, but one relies on other traders getting liquidated, while the other relies on its own buy pressure—the quality is worlds apart.
There’s also an interesting detail: HYPE’s long/short ratio has been trending down these past few days (1.503 → 1.472 → 1.455). While the price is rising, the share of accounts going long is actually falling—suggesting some shorts are starting to enter at higher levels. Next comes the question: will we keep squeezing them, or will they be right? It depends on who breaks first.
Also don’t forget: this HYPE move has a prior cause. On the 4-hour timeframe, it showed two consecutive bullish divergences at the bottom (9/14 and 9/16). Price kept making lower lows, but MACD momentum didn’t make new lows along with it. By the time the signal appeared at 76.95, now it’s 86.9—13% of the move has already played out.
Finally, a bucket of cold water: today, what’s truly crazy isn’t HYPE. AVA is up 61%, ONE is up 61%, COTI is up 35%, NEAR is up 20%, UNI is up 16%—the whole altcoin market is moving. HYPE’s 11% is only considered a top performer among the lagging rallies.
#btc #hype #crypto #altcoins #trading
630
·
--
The head of state’s diplomacy: U.S. side is leaking information. Next week, on 9/24—which is 9/25 Mid-Autumn Festival in the East Eighth Zone—once again it’s time to hype expectations. Don’t be overly bearish; focus on buying on dips. If there’s a pullback, that’s the buying opportunity.
#btc #crypto #trading #macro #altcoins
The head of state’s diplomacy: U.S. side is leaking information. Next week, on 9/24—which is 9/25 Mid-Autumn Festival in the East Eighth Zone—once again it’s time to hype expectations. Don’t be overly bearish; focus on buying on dips. If there’s a pullback, that’s the buying opportunity.
#btc #crypto #trading #macro #altcoins
#btc #crypto #trading #macro #altcoins
77
·
--
Someone just asked me: $ZEC , what’s going on today? Looking gorgeous on its own?
First, the conclusion—it’s not “on its own.” Today, there are plenty of fake coins up more than 15%: BR is up 185%, SYN 86%, ONE 69%, ZEC 22%, DASH 19%, IOST 18%… while BTC is only up 0.87% and ETH 1.44%, basically barely moving.
This is a classic altcoin rotation day: money flows out of the “big pie” and goes hunting for lower-priced things.
But what’s different about ZEC compared with that bunch of “day-trippers” is the trading volume: its 24-hour volume is 4.33 billion U, which is 6 times that of the #2 BR and 31 times that of DASH, which is also an old coin and up 19% as well. Other coins are just getting a couple of pumps from a small pool, while ZEC is built from real money, stacked in size.
So why is ZEC up? My take is: it’s not that buy pressure is猛; instead, the shorts have been forced into a corner.
Two numbers tell you everything.
One is the long/short account ratio: 0.394. In other words, accounts going long vs. going short are 1 to 2.5—simply put, about 70% of retail traders are shorting this coin.
Two is the funding rate: -0.0365%, which is negative. A negative funding rate means shorts have to pay longs. The longer shorts hold, the more they lose; in the end, they can only close positions by buying back—and the more they buy back, the higher the price climbs.
The control group is more interesting: DASH is also up 19%, its long/short ratio is 1.315, meaning longs are dominant. So DASH is being bought up, while ZEC is basically climbed by shorts liquidating and covering themselves. They’re both old coins, but the driving forces are completely different.
One last reminder about positioning: ZEC is at 1377 now, having surged from 1128 to 1396 in 24 hours. It’s too fast—there isn’t even a support line within 5%. The nearest overhead resistance is around 1388. If you rush in at a spot like this, there’s no structure below to catch you.
Once you understand the reason for the rise, you won’t become the one left holding the bag when a coin jumps more than 20% in a single day.
#btc #zec #altcoins #crypto #trading
Someone just asked me: $ZEC , what’s going on today? Looking gorgeous on its own?
First, the conclusion—it’s not “on its own.” Today, there are plenty of fake coins up more than 15%: BR is up 185%, SYN 86%, ONE 69%, ZEC 22%, DASH 19%, IOST 18%… while BTC is only up 0.87% and ETH 1.44%, basically barely moving.
This is a classic altcoin rotation day: money flows out of the “big pie” and goes hunting for lower-priced things.
But what’s different about ZEC compared with that bunch of “day-trippers” is the trading volume: its 24-hour volume is 4.33 billion U, which is 6 times that of the #2 BR and 31 times that of DASH, which is also an old coin and up 19% as well. Other coins are just getting a couple of pumps from a small pool, while ZEC is built from real money, stacked in size.
So why is ZEC up? My take is: it’s not that buy pressure is猛; instead, the shorts have been forced into a corner.
Two numbers tell you everything.
One is the long/short account ratio: 0.394. In other words, accounts going long vs. going short are 1 to 2.5—simply put, about 70% of retail traders are shorting this coin.
Two is the funding rate: -0.0365%, which is negative. A negative funding rate means shorts have to pay longs. The longer shorts hold, the more they lose; in the end, they can only close positions by buying back—and the more they buy back, the higher the price climbs.
The control group is more interesting: DASH is also up 19%, its long/short ratio is 1.315, meaning longs are dominant. So DASH is being bought up, while ZEC is basically climbed by shorts liquidating and covering themselves. They’re both old coins, but the driving forces are completely different.
One last reminder about positioning: ZEC is at 1377 now, having surged from 1128 to 1396 in 24 hours. It’s too fast—there isn’t even a support line within 5%. The nearest overhead resistance is around 1388. If you rush in at a spot like this, there’s no structure below to catch you.
Once you understand the reason for the rise, you won’t become the one left holding the bag when a coin jumps more than 20% in a single day.
#btc #zec #altcoins #crypto #trading
First, the conclusion—it’s not “on its own.” Today, there are plenty of fake coins up more than 15%: BR is up 185%, SYN 86%, ONE 69%, ZEC 22%, DASH 19%, IOST 18%… while BTC is only up 0.87% and ETH 1.44%, basically barely moving.
This is a classic altcoin rotation day: money flows out of the “big pie” and goes hunting for lower-priced things.
But what’s different about ZEC compared with that bunch of “day-trippers” is the trading volume: its 24-hour volume is 4.33 billion U, which is 6 times that of the #2 BR and 31 times that of DASH, which is also an old coin and up 19% as well. Other coins are just getting a couple of pumps from a small pool, while ZEC is built from real money, stacked in size.
So why is ZEC up? My take is: it’s not that buy pressure is猛; instead, the shorts have been forced into a corner.
Two numbers tell you everything.
One is the long/short account ratio: 0.394. In other words, accounts going long vs. going short are 1 to 2.5—simply put, about 70% of retail traders are shorting this coin.
Two is the funding rate: -0.0365%, which is negative. A negative funding rate means shorts have to pay longs. The longer shorts hold, the more they lose; in the end, they can only close positions by buying back—and the more they buy back, the higher the price climbs.
The control group is more interesting: DASH is also up 19%, its long/short ratio is 1.315, meaning longs are dominant. So DASH is being bought up, while ZEC is basically climbed by shorts liquidating and covering themselves. They’re both old coins, but the driving forces are completely different.
One last reminder about positioning: ZEC is at 1377 now, having surged from 1128 to 1396 in 24 hours. It’s too fast—there isn’t even a support line within 5%. The nearest overhead resistance is around 1388. If you rush in at a spot like this, there’s no structure below to catch you.
Once you understand the reason for the rise, you won’t become the one left holding the bag when a coin jumps more than 20% in a single day.
#btc #zec #altcoins #crypto #trading
1
633
Log in to explore more content
Join global crypto users on Binance Square
⚡️ Get latest and useful information about crypto.
💬 Trusted by the world’s largest crypto exchange.
👍 Discover real insights from verified creators.
Email / Phone number
Trending Topics
EthereumSurpasses$2700
0 views
20 Discussing
watching $ETH on the 15min chart rn
looking ready to rip straight to $2700
position sized, stops set, let's see if this thing actually delivers or just teases us again
feel like we've been edging this breakout for days
MarketVet
·1 Likes
·1.5k views
HackerMintsTokensAfterSingularityNETExploit
0 views
2 Discussing
CanaryFilesSecondAmendmentForStakedSEIETF
0 views
0 Discussing