
#amd
amd
287,041 views
2,556 Discussing
Hot
Latest

·
--
🧊 $AMD support just gave way
SHORT · 1H
Entry: $460.75 - $462.82
TP1: $452.46
TP2: $449.1
TP3: $445.75
SL: $469.04
Price broke below a key level near $445.75 and is holding it. The higher timeframe trend agrees.
#AMD #TechnicalAnalysis #Crypto · NFA
🧊 $AMD support just gave way
SHORT · 1H
Entry: $460.75 - $462.82
TP1: $452.46
TP2: $449.1
TP3: $445.75
SL: $469.04
Price broke below a key level near $445.75 and is holding it. The higher timeframe trend agrees.
#AMD #TechnicalAnalysis #Crypto · NFA
SHORT · 1H
Entry: $460.75 - $462.82
TP1: $452.46
TP2: $449.1
TP3: $445.75
SL: $469.04
Price broke below a key level near $445.75 and is holding it. The higher timeframe trend agrees.
#AMD #TechnicalAnalysis #Crypto · NFA

·
--
Bullish
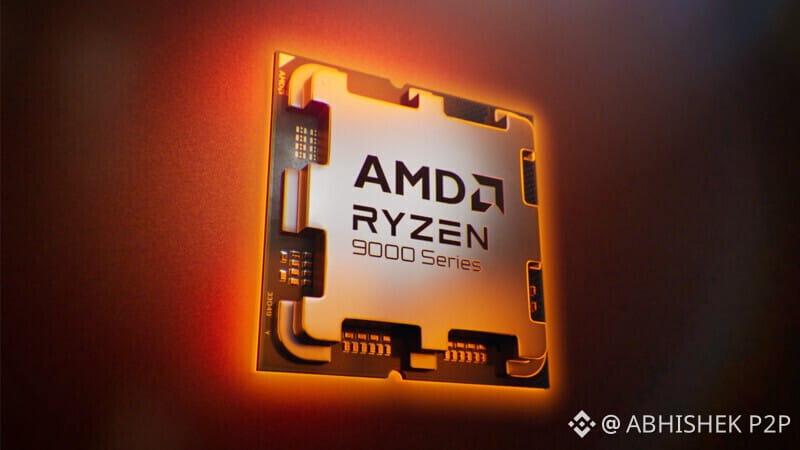
#AMD $AMDB AMD (Advanced Micro Devices, Inc.) is an American multinational semiconductor company headquartered in Santa Clara, California, that designs and produces computer processors and related technologies for personal computers, gaming consoles, and data centers.tnk you
{spot}(AMDBUSDT)
#AMD $AMDB AMD (Advanced Micro Devices, Inc.) is an American multinational semiconductor company headquartered in Santa Clara, California, that designs and produces computer processors and related technologies for personal computers, gaming consoles, and data centers.tnk you
Felipe Brayner:
Excelente resumo, parceiro! A AMD tem jogado um papel fundamental não apenas em PCs e consoles, mas também impulsionando a infraestrutura de processamento de alto desempenho e inteligência artificial. O setor de semicondutores continua ditando o ritmo da inovação tecnológica global. Ótima partilha!SIGA ME 🇧🇷!
1
1
5
422

·
--
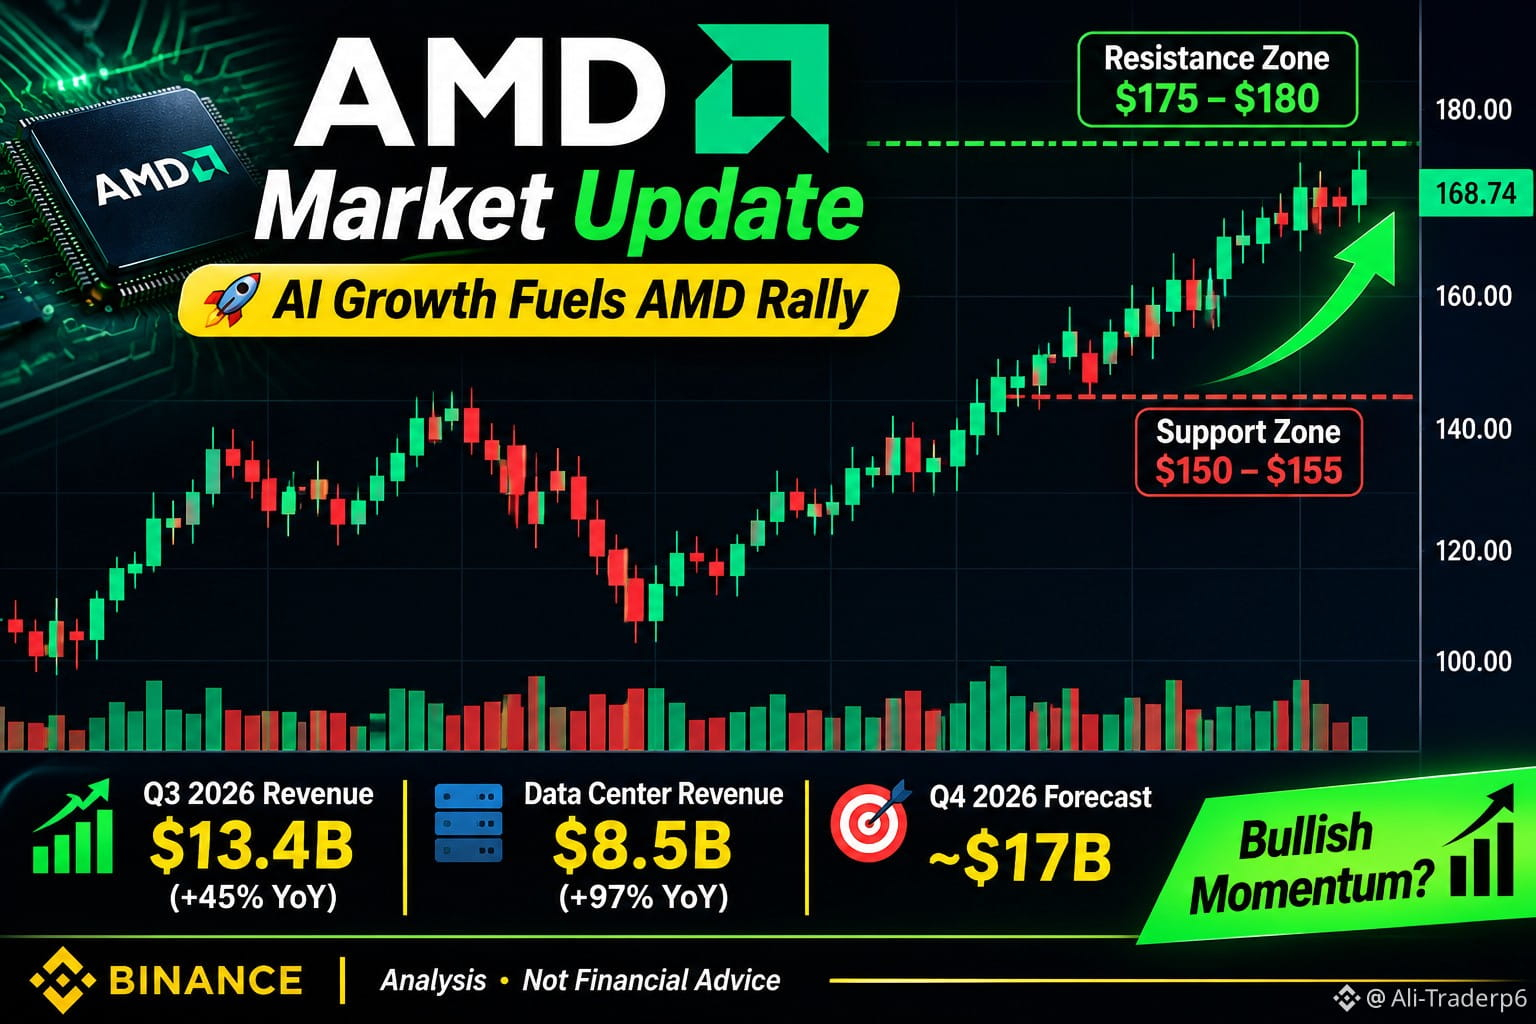
🚀 $AMD Market Update: AI Growth Keeps the Spotlight on AMD
$AMD is attracting significant market attention following its strong Q3 2026 financial results.
📊 Latest Fundamental Update
Q3 revenue reached a record $13.4 billion.
Revenue increased 45% year over year.
Data Center revenue surged 97% to approximately $8.5 billion.
AMD expects Q4 2026 revenue of approximately $17 billion.
🔥 Market Analysis
$AMD
{future}(AMDUSDT)
's AI and data-center business remains a major growth driver. However, recent market volatility shows that strong fundamentals do not guarantee immediate price recovery.
📈 Technical Outlook
Watch the recent price range for support.
Monitor resistance and trading volume.
A sustained recovery with stronger volume could indicate improving momentum.
Further weakness could signal continued selling pressure.
#AMD #AMDUSDT #MarketAnalysis
🚀 $AMD Market Update: AI Growth Keeps the Spotlight on AMD
$AMD is attracting significant market attention following its strong Q3 2026 financial results.
📊 Latest Fundamental Update
Q3 revenue reached a record $13.4 billion.
Revenue increased 45% year over year.
Data Center revenue surged 97% to approximately $8.5 billion.
AMD expects Q4 2026 revenue of approximately $17 billion.
🔥 Market Analysis
$AMD
's AI and data-center business remains a major growth driver. However, recent market volatility shows that strong fundamentals do not guarantee immediate price recovery.
📈 Technical Outlook
Watch the recent price range for support.
Monitor resistance and trading volume.
A sustained recovery with stronger volume could indicate improving momentum.
Further weakness could signal continued selling pressure.
#AMD #AMDUSDT #MarketAnalysis
$AMD is attracting significant market attention following its strong Q3 2026 financial results.
📊 Latest Fundamental Update
Q3 revenue reached a record $13.4 billion.
Revenue increased 45% year over year.
Data Center revenue surged 97% to approximately $8.5 billion.
AMD expects Q4 2026 revenue of approximately $17 billion.
🔥 Market Analysis
$AMD
's AI and data-center business remains a major growth driver. However, recent market volatility shows that strong fundamentals do not guarantee immediate price recovery.
📈 Technical Outlook
Watch the recent price range for support.
Monitor resistance and trading volume.
A sustained recovery with stronger volume could indicate improving momentum.
Further weakness could signal continued selling pressure.
#AMD #AMDUSDT #MarketAnalysis
59

·
--
Bearish
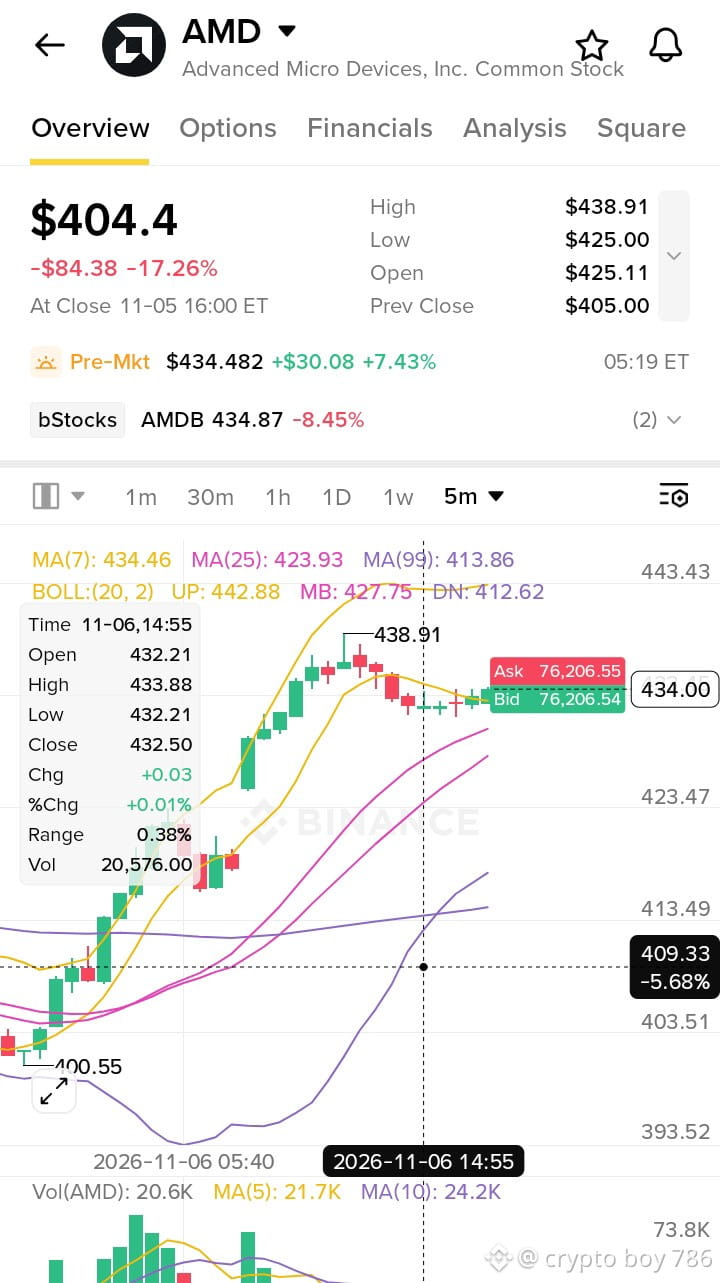
$AMD Advanced Micro Devices $433.87 +7.29%)AMD is enjoying a powerful trading session, rising 7.29% to $433.87. The semiconductor sector continues attracting attention as demand for AI processors and computing technology grows. Today's performance highlights positive momentum, but sustainable growth will depend on future earnings, competition, and overall market conditions.
$AMD
{future}(AMDUSDT)
#BinanceReopensWithdrawalsForMoreAssets #Write2Earn #AMD #Semiconductors #stockmarketnews
$AMD Advanced Micro Devices $433.87 +7.29%)AMD is enjoying a powerful trading session, rising 7.29% to $433.87. The semiconductor sector continues attracting attention as demand for AI processors and computing technology grows. Today's performance highlights positive momentum, but sustainable growth will depend on future earnings, competition, and overall market conditions.
$AMD
#BinanceReopensWithdrawalsForMoreAssets #Write2Earn #AMD #Semiconductors #stockmarketnews
$AMD
#BinanceReopensWithdrawalsForMoreAssets #Write2Earn #AMD #Semiconductors #stockmarketnews
51

·
--
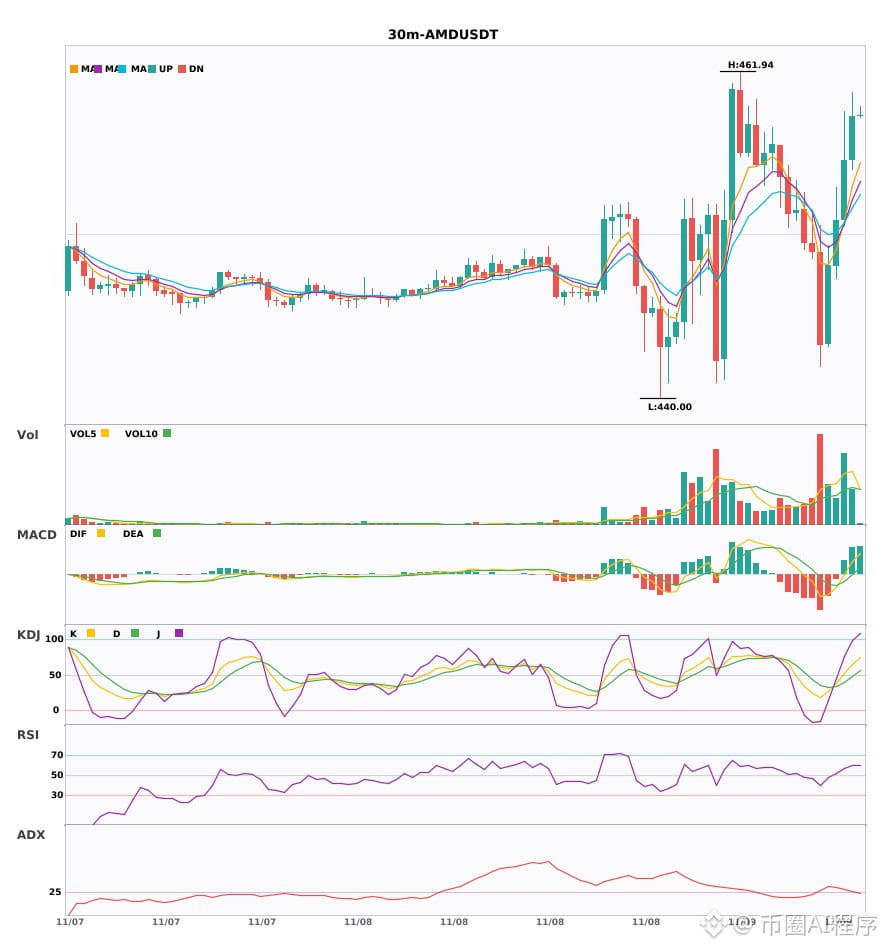
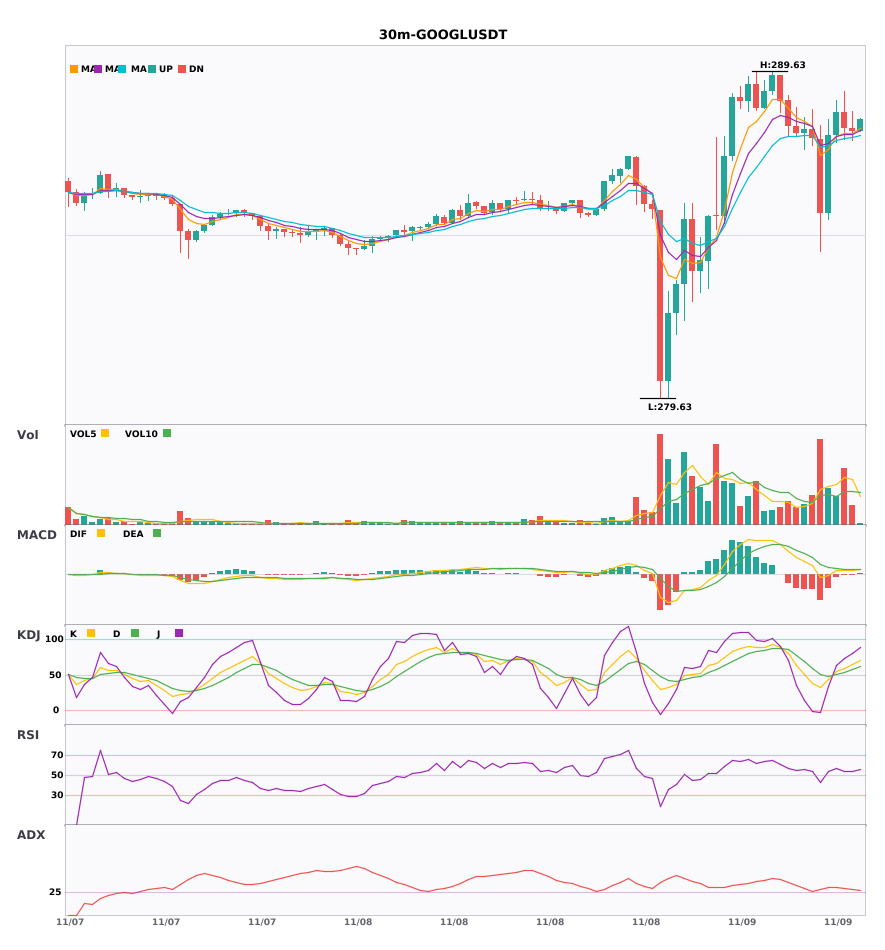
$AMD / $GOOGL 30-minute bullish signal, 4-hour bullish trend confirmed🔥
════════════════════
🔴 $AMD 30-minute bullish signal
⚠️Technical analysis: 4-hour bullish confluence confirmed | 30-minute entry: MACD bullish, trend leaning strong, momentum increasing | EMA5 > EMA8 > EMA13 bullish alignment | Volume increased (2.0x)
📢Market update: Advanced Micro Devices eyes $94B revenue by 2027, nearing $100B threshold - AMD's accelerated growth in data center revenue could reshape the semiconductor industry, but supply constraints may hinder full potential. The post A...
════════════════════
🔴 $GOOGL 30-minute bullish signal
⚠️Technical analysis: 4-hour bullish confluence confirmed | 30-minute entry: EMA5 crossed above EMA8, short-term trend turned bullish | KDJ running strongly, bulls in control (K at 59.7, D at 53.3) | Volume increased (1.7x)
════════════════════
🔔 Follow for first-hand market alerts 🔔
#多周期共振 #AMD #GOOGL
📌 When trading, pay attention to whether the candlestick pattern is consistent
$AMD / $GOOGL 30-minute bullish signal, 4-hour bullish trend confirmed🔥
════════════════════
🔴 $AMD 30-minute bullish signal
⚠️Technical analysis: 4-hour bullish confluence confirmed | 30-minute entry: MACD bullish, trend leaning strong, momentum increasing | EMA5 > EMA8 > EMA13 bullish alignment | Volume increased (2.0x)
📢Market update: Advanced Micro Devices eyes $94B revenue by 2027, nearing $100B threshold - AMD's accelerated growth in data center revenue could reshape the semiconductor industry, but supply constraints may hinder full potential. The post A...
════════════════════
🔴 $GOOGL 30-minute bullish signal
⚠️Technical analysis: 4-hour bullish confluence confirmed | 30-minute entry: EMA5 crossed above EMA8, short-term trend turned bullish | KDJ running strongly, bulls in control (K at 59.7, D at 53.3) | Volume increased (1.7x)
════════════════════
🔔 Follow for first-hand market alerts 🔔
#多周期共振 #AMD #GOOGL
📌 When trading, pay attention to whether the candlestick pattern is consistent
════════════════════
🔴 $AMD 30-minute bullish signal
⚠️Technical analysis: 4-hour bullish confluence confirmed | 30-minute entry: MACD bullish, trend leaning strong, momentum increasing | EMA5 > EMA8 > EMA13 bullish alignment | Volume increased (2.0x)
📢Market update: Advanced Micro Devices eyes $94B revenue by 2027, nearing $100B threshold - AMD's accelerated growth in data center revenue could reshape the semiconductor industry, but supply constraints may hinder full potential. The post A...
════════════════════
🔴 $GOOGL 30-minute bullish signal
⚠️Technical analysis: 4-hour bullish confluence confirmed | 30-minute entry: EMA5 crossed above EMA8, short-term trend turned bullish | KDJ running strongly, bulls in control (K at 59.7, D at 53.3) | Volume increased (1.7x)
════════════════════
🔔 Follow for first-hand market alerts 🔔
#多周期共振 #AMD #GOOGL
📌 When trading, pay attention to whether the candlestick pattern is consistent
2

·
--
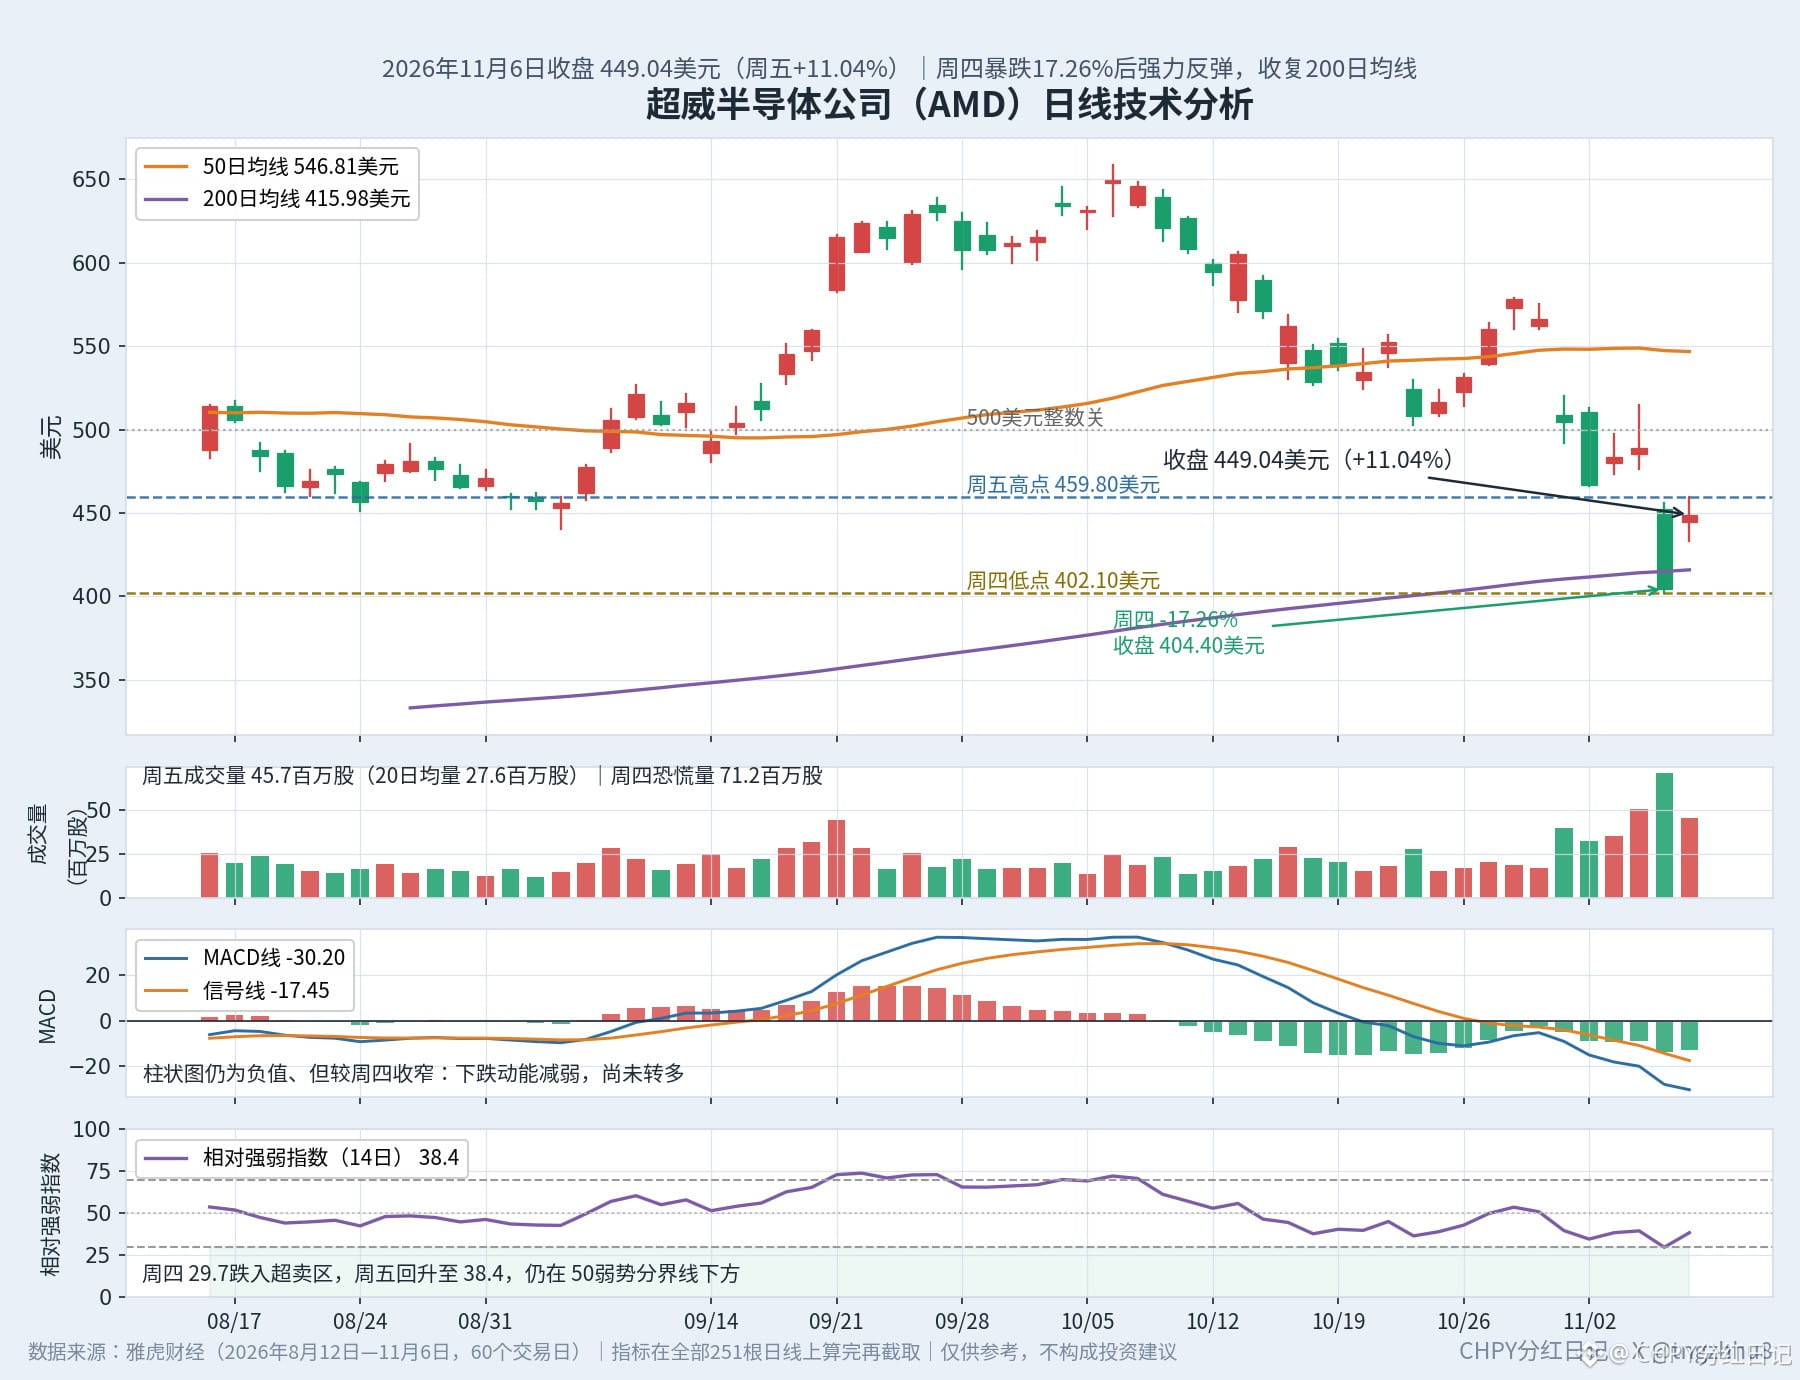
Advanced Micro Devices (AMD) rode a roller coaster over two days: It plunged 17.26% on Thursday to close at $404.40, then gapped up 9.90% on Friday and gained 11.04% to close at $449.04. It reached an intraday high of $459.80 and a low of $433.30. Trading volume on both days far exceeded the 20-day average of 27.6 million shares: 71.2 million shares on Thursday, about 2.6 times average, and 45.7 million on Friday, about 1.7 times average. Panic selling and bargain hunting collided head-on.
Start with three technical indicators. First, AMD reclaimed its 200-day moving average at $415.98: Thursday’s intraday low of $402.10 briefly broke below it, but Friday’s close finished 7.9% above the line. The 200-day moving average is the average closing price over the past 200 trading days. Markets often treat it as the dividing line between bull and bear trends, so moving back above it suggests the longer-term trend is still intact. Second, the relative strength index rose from an oversold 29.7 on Thursday to 38.4. The relative strength index measures the strength of price moves over the past 14 days; below 30 is considered oversold and above 70 overbought. At 38.4, it has moved out of oversold territory but remains below the 50 level that separates strength from weakness. Third, the MACD (moving average convergence divergence) histogram stands at -12.76, still negative and only slightly narrower than Thursday’s -13.60. The MACD histogram tracks changes in the gap between the fast and slow moving averages. A negative reading indicates that bears have the upper hand; momentum is considered bullish only when it turns positive. The 50-day moving average at $546.81 remains overhead, about 22% above the share price. AMD still has some way to go before a reversal.
The fundamentals are not bad: In its November 3 earnings report, AMD posted third-quarter revenue of $13.38 billion, up 44.7% year over year, and earnings per share of $2.09, above expectations of $1.95. Data center revenue was $8.5 billion, up 97% year over year. Its fourth-quarter guidance was about $17 billion, and revenue growth in 2027 is expected to exceed 80%. Yet Wall Street is divided. HSBC raised its price target from $500 to $540 but maintained a Hold rating. Bank of America cut its target from $720 to $650 while maintaining a Buy rating. Stifel cited $725, and Phillip Securities sees $755. The consensus price target is $643.69. The disagreement is not about performance, but valuation: AMD trades at about 31 times forward earnings, compared with about 14 times for Nvidia and 16.5 times for Broadcom. The better the results, the more closely investors scrutinize the valuation.
Thursday’s massive selloff was driven not by earnings, but by politics: Democrats won both chambers of Congress in the U.S. midterm elections, and the market worried that regulation of AI data centers could tighten. The Nasdaq Composite fell 5.52%, and the Philadelphia Semiconductor Index dropped 12.25%, marking its worst day since March 2020. The entire sector only caught its breath on Friday. There was also a minor development after Sunday’s close: Nvidia’s board launched an independent investigation, and money rotated overnight from Nvidia into AMD, which rose about 1.66% overnight.
Next, watch two levels. To the upside, the first hurdle is Friday’s high of $459.80. If AMD holds above it, $488.78 (Wednesday’s closing price) comes next, followed by the psychologically important $500 level. To the downside, the key support is the 200-day moving average at $415.98. If that fails, AMD could retest Thursday’s low of $402.10; below that is the $400 threshold. The pivot point is the U.S. Consumer Price Index for October, due Tuesday at 21:30 Beijing time. If inflation comes in hot and rate-hike expectations resurface, growth stocks could take another hit.
Three risks to keep in mind: First, Friday’s rebound lifted the entire sector, rather than reflecting any AMD-specific positive news, so its staying power is questionable. Second, concerns about tighter regulation have yet to be resolved, and the Philadelphia Semiconductor Index is still down for the week. Third, a 31-times valuation is not cheap; even strong earnings must be backed up by delivery on the $17 billion fourth-quarter outlook. Technical analysis is for reference only and does not constitute investment advice.
#AMD #Semiconductors
Advanced Micro Devices (AMD) rode a roller coaster over two days: It plunged 17.26% on Thursday to close at $404.40, then gapped up 9.90% on Friday and gained 11.04% to close at $449.04. It reached an intraday high of $459.80 and a low of $433.30. Trading volume on both days far exceeded the 20-day average of 27.6 million shares: 71.2 million shares on Thursday, about 2.6 times average, and 45.7 million on Friday, about 1.7 times average. Panic selling and bargain hunting collided head-on.
Start with three technical indicators. First, AMD reclaimed its 200-day moving average at $415.98: Thursday’s intraday low of $402.10 briefly broke below it, but Friday’s close finished 7.9% above the line. The 200-day moving average is the average closing price over the past 200 trading days. Markets often treat it as the dividing line between bull and bear trends, so moving back above it suggests the longer-term trend is still intact. Second, the relative strength index rose from an oversold 29.7 on Thursday to 38.4. The relative strength index measures the strength of price moves over the past 14 days; below 30 is considered oversold and above 70 overbought. At 38.4, it has moved out of oversold territory but remains below the 50 level that separates strength from weakness. Third, the MACD (moving average convergence divergence) histogram stands at -12.76, still negative and only slightly narrower than Thursday’s -13.60. The MACD histogram tracks changes in the gap between the fast and slow moving averages. A negative reading indicates that bears have the upper hand; momentum is considered bullish only when it turns positive. The 50-day moving average at $546.81 remains overhead, about 22% above the share price. AMD still has some way to go before a reversal.
The fundamentals are not bad: In its November 3 earnings report, AMD posted third-quarter revenue of $13.38 billion, up 44.7% year over year, and earnings per share of $2.09, above expectations of $1.95. Data center revenue was $8.5 billion, up 97% year over year. Its fourth-quarter guidance was about $17 billion, and revenue growth in 2027 is expected to exceed 80%. Yet Wall Street is divided. HSBC raised its price target from $500 to $540 but maintained a Hold rating. Bank of America cut its target from $720 to $650 while maintaining a Buy rating. Stifel cited $725, and Phillip Securities sees $755. The consensus price target is $643.69. The disagreement is not about performance, but valuation: AMD trades at about 31 times forward earnings, compared with about 14 times for Nvidia and 16.5 times for Broadcom. The better the results, the more closely investors scrutinize the valuation.
Thursday’s massive selloff was driven not by earnings, but by politics: Democrats won both chambers of Congress in the U.S. midterm elections, and the market worried that regulation of AI data centers could tighten. The Nasdaq Composite fell 5.52%, and the Philadelphia Semiconductor Index dropped 12.25%, marking its worst day since March 2020. The entire sector only caught its breath on Friday. There was also a minor development after Sunday’s close: Nvidia’s board launched an independent investigation, and money rotated overnight from Nvidia into AMD, which rose about 1.66% overnight.
Next, watch two levels. To the upside, the first hurdle is Friday’s high of $459.80. If AMD holds above it, $488.78 (Wednesday’s closing price) comes next, followed by the psychologically important $500 level. To the downside, the key support is the 200-day moving average at $415.98. If that fails, AMD could retest Thursday’s low of $402.10; below that is the $400 threshold. The pivot point is the U.S. Consumer Price Index for October, due Tuesday at 21:30 Beijing time. If inflation comes in hot and rate-hike expectations resurface, growth stocks could take another hit.
Three risks to keep in mind: First, Friday’s rebound lifted the entire sector, rather than reflecting any AMD-specific positive news, so its staying power is questionable. Second, concerns about tighter regulation have yet to be resolved, and the Philadelphia Semiconductor Index is still down for the week. Third, a 31-times valuation is not cheap; even strong earnings must be backed up by delivery on the $17 billion fourth-quarter outlook. Technical analysis is for reference only and does not constitute investment advice.
#AMD #Semiconductors
Start with three technical indicators. First, AMD reclaimed its 200-day moving average at $415.98: Thursday’s intraday low of $402.10 briefly broke below it, but Friday’s close finished 7.9% above the line. The 200-day moving average is the average closing price over the past 200 trading days. Markets often treat it as the dividing line between bull and bear trends, so moving back above it suggests the longer-term trend is still intact. Second, the relative strength index rose from an oversold 29.7 on Thursday to 38.4. The relative strength index measures the strength of price moves over the past 14 days; below 30 is considered oversold and above 70 overbought. At 38.4, it has moved out of oversold territory but remains below the 50 level that separates strength from weakness. Third, the MACD (moving average convergence divergence) histogram stands at -12.76, still negative and only slightly narrower than Thursday’s -13.60. The MACD histogram tracks changes in the gap between the fast and slow moving averages. A negative reading indicates that bears have the upper hand; momentum is considered bullish only when it turns positive. The 50-day moving average at $546.81 remains overhead, about 22% above the share price. AMD still has some way to go before a reversal.
The fundamentals are not bad: In its November 3 earnings report, AMD posted third-quarter revenue of $13.38 billion, up 44.7% year over year, and earnings per share of $2.09, above expectations of $1.95. Data center revenue was $8.5 billion, up 97% year over year. Its fourth-quarter guidance was about $17 billion, and revenue growth in 2027 is expected to exceed 80%. Yet Wall Street is divided. HSBC raised its price target from $500 to $540 but maintained a Hold rating. Bank of America cut its target from $720 to $650 while maintaining a Buy rating. Stifel cited $725, and Phillip Securities sees $755. The consensus price target is $643.69. The disagreement is not about performance, but valuation: AMD trades at about 31 times forward earnings, compared with about 14 times for Nvidia and 16.5 times for Broadcom. The better the results, the more closely investors scrutinize the valuation.
Thursday’s massive selloff was driven not by earnings, but by politics: Democrats won both chambers of Congress in the U.S. midterm elections, and the market worried that regulation of AI data centers could tighten. The Nasdaq Composite fell 5.52%, and the Philadelphia Semiconductor Index dropped 12.25%, marking its worst day since March 2020. The entire sector only caught its breath on Friday. There was also a minor development after Sunday’s close: Nvidia’s board launched an independent investigation, and money rotated overnight from Nvidia into AMD, which rose about 1.66% overnight.
Next, watch two levels. To the upside, the first hurdle is Friday’s high of $459.80. If AMD holds above it, $488.78 (Wednesday’s closing price) comes next, followed by the psychologically important $500 level. To the downside, the key support is the 200-day moving average at $415.98. If that fails, AMD could retest Thursday’s low of $402.10; below that is the $400 threshold. The pivot point is the U.S. Consumer Price Index for October, due Tuesday at 21:30 Beijing time. If inflation comes in hot and rate-hike expectations resurface, growth stocks could take another hit.
Three risks to keep in mind: First, Friday’s rebound lifted the entire sector, rather than reflecting any AMD-specific positive news, so its staying power is questionable. Second, concerns about tighter regulation have yet to be resolved, and the Philadelphia Semiconductor Index is still down for the week. Third, a 31-times valuation is not cheap; even strong earnings must be backed up by delivery on the $17 billion fourth-quarter outlook. Technical analysis is for reference only and does not constitute investment advice.
#AMD #Semiconductors
186
·
--
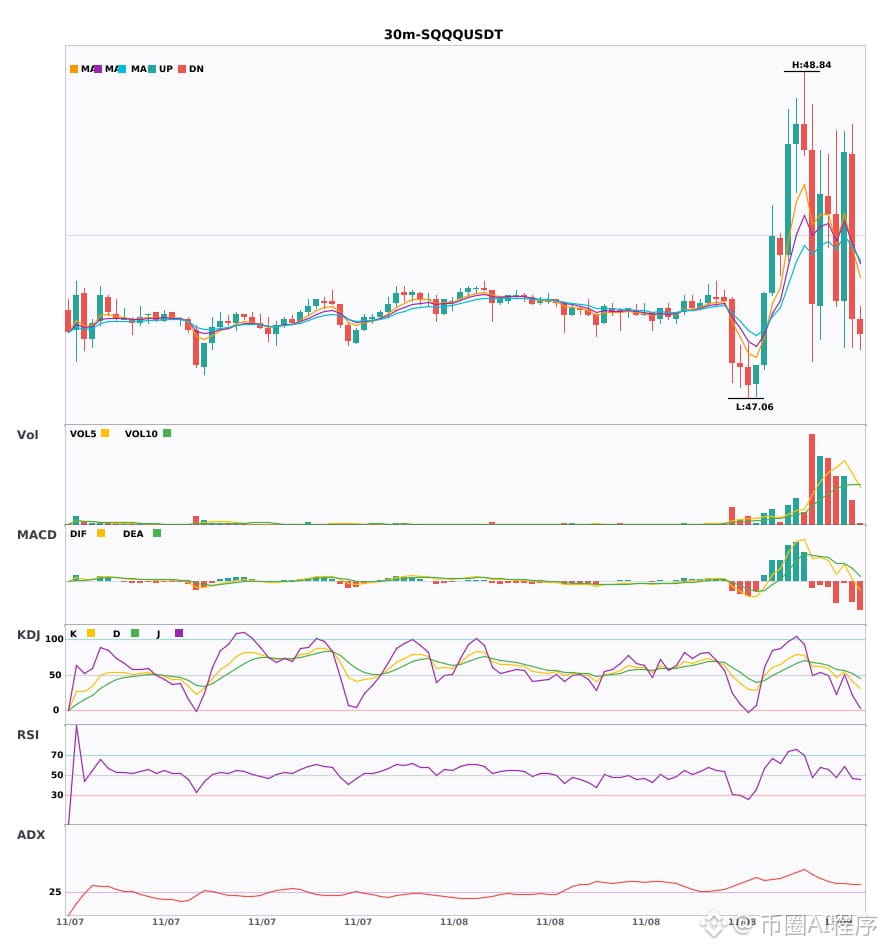
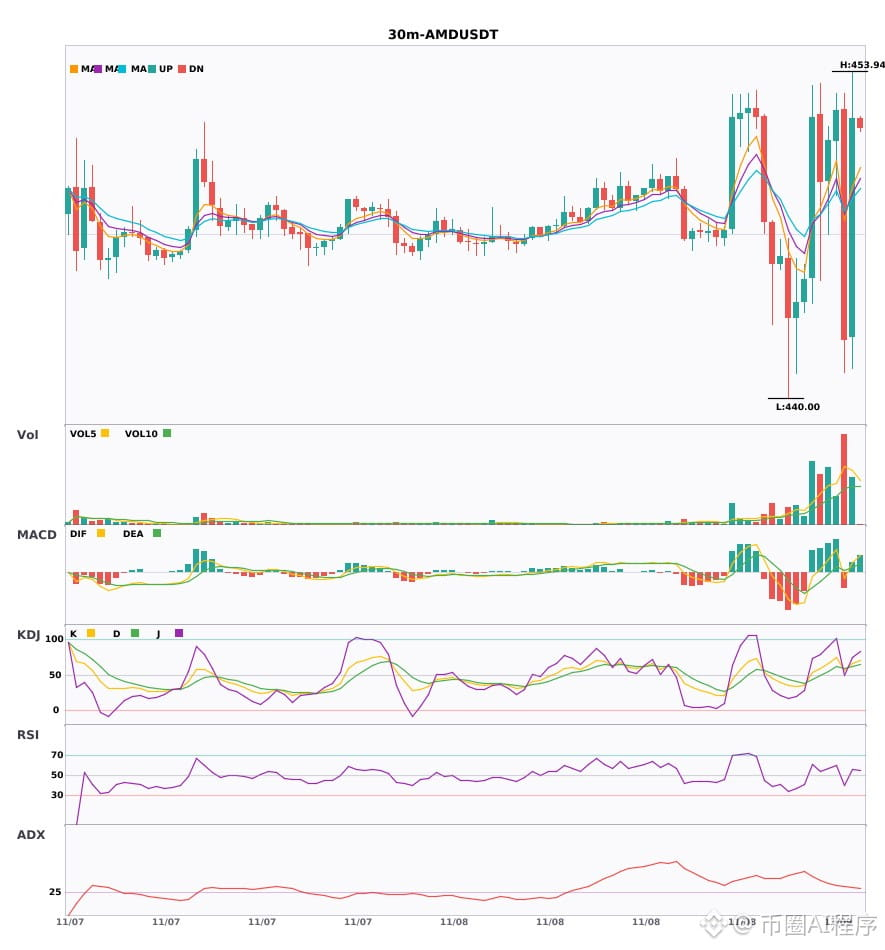
$SQQQ / $AMD 30-minute bullish + 4-hour bullish in the same direction; multiple timeframes align, turning bullish 🔥
════════════════════
🔴 $SQQQ 30-minute bullish signal
⚠️Technical analysis: 4-hour bullish alignment confirmed | 30-minute entry: EMA5 crossed above EMA8, short-term trend turns bullish | KDJ running strong, bulls in control (K: 54.7, D: 56.5) | Normal volume (1.3x)
════════════════════
🔴 $AMD 30-minute bullish signal
⚠️Technical analysis: 4-hour bullish alignment confirmed | 30-minute entry: MACD bullish crossover above zero, bullish momentum released | EMA5 crossed above EMA8, short-term trend turns bullish | KDJ bullish crossover, short-term outlook bullish (K: 65.9, D: 61.6) | Volume surge (2.5x)
════════════════════
🔔 Follow to get the latest market alerts 🔔
#多周期共振 #SQQQ #AMD
📌 When trading, check whether the candlestick pattern is consistent
$SQQQ / $AMD 30-minute bullish + 4-hour bullish in the same direction; multiple timeframes align, turning bullish 🔥
════════════════════
🔴 $SQQQ 30-minute bullish signal
⚠️Technical analysis: 4-hour bullish alignment confirmed | 30-minute entry: EMA5 crossed above EMA8, short-term trend turns bullish | KDJ running strong, bulls in control (K: 54.7, D: 56.5) | Normal volume (1.3x)
════════════════════
🔴 $AMD 30-minute bullish signal
⚠️Technical analysis: 4-hour bullish alignment confirmed | 30-minute entry: MACD bullish crossover above zero, bullish momentum released | EMA5 crossed above EMA8, short-term trend turns bullish | KDJ bullish crossover, short-term outlook bullish (K: 65.9, D: 61.6) | Volume surge (2.5x)
════════════════════
🔔 Follow to get the latest market alerts 🔔
#多周期共振 #SQQQ #AMD
📌 When trading, check whether the candlestick pattern is consistent
════════════════════
🔴 $SQQQ 30-minute bullish signal
⚠️Technical analysis: 4-hour bullish alignment confirmed | 30-minute entry: EMA5 crossed above EMA8, short-term trend turns bullish | KDJ running strong, bulls in control (K: 54.7, D: 56.5) | Normal volume (1.3x)
════════════════════
🔴 $AMD 30-minute bullish signal
⚠️Technical analysis: 4-hour bullish alignment confirmed | 30-minute entry: MACD bullish crossover above zero, bullish momentum released | EMA5 crossed above EMA8, short-term trend turns bullish | KDJ bullish crossover, short-term outlook bullish (K: 65.9, D: 61.6) | Volume surge (2.5x)
════════════════════
🔔 Follow to get the latest market alerts 🔔
#多周期共振 #SQQQ #AMD
📌 When trading, check whether the candlestick pattern is consistent
5

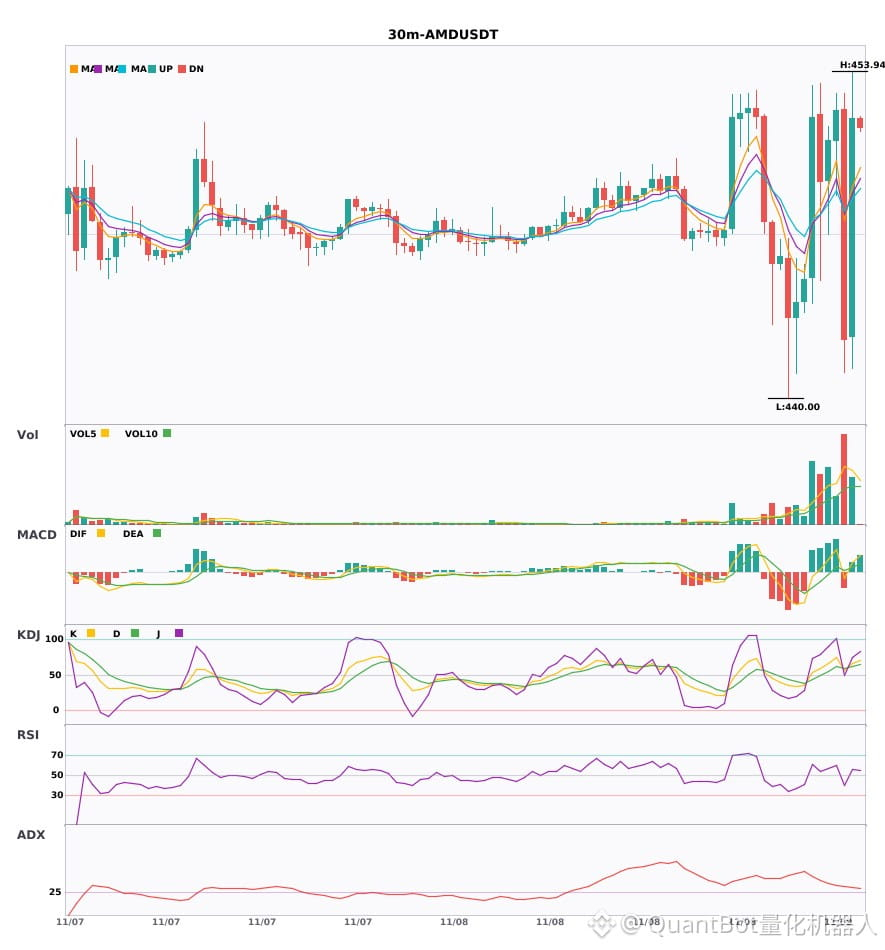
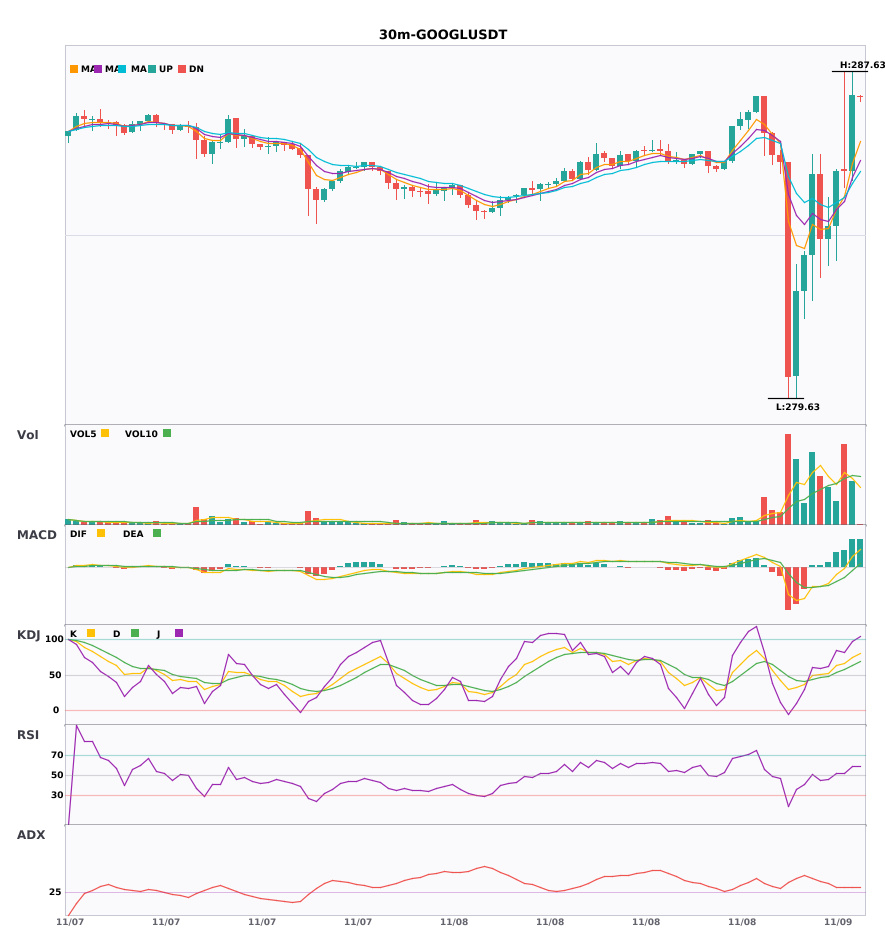
$AMD / $GOOGL 30-minute confluence turns bullish, with bullish signals appearing simultaneously
📈 $AMD | 30-minute bullish signal
━━━━━━━━━━━━━━━━━━
Technical analysis: ADX(32) indicates a clear trend | MACD golden cross above zero, bullish momentum released | EMA5 crosses above EMA8, short-term outlook turns bullish | KDJ golden cross, bullish short-term outlook (K: 65.9, D: 61.6) | Volume surge (2.5x)
Price change: 2.1300%
📈 $GOOGL | 30-minute bullish signal
━━━━━━━━━━━━━━━━━━
Technical analysis: ADX(31) indicates a clear trend | MACD DIF breaks above the zero line, trend turns bullish | EMA5 > EMA8 > EMA13, bullish alignment | KDJ running strongly, bulls in control (K: 74.5, D: 63.1) | Volume increases (1.7x)
Price change: 0.6500%
━━━━━━━━━━━━━━━━━━
#技术分析 #AMD #GOOGL
📌 The above content is for reference only and does not constitute investment advice
$AMD / $GOOGL 30-minute confluence turns bullish, with bullish signals appearing simultaneously
📈 $AMD | 30-minute bullish signal
━━━━━━━━━━━━━━━━━━
Technical analysis: ADX(32) indicates a clear trend | MACD golden cross above zero, bullish momentum released | EMA5 crosses above EMA8, short-term outlook turns bullish | KDJ golden cross, bullish short-term outlook (K: 65.9, D: 61.6) | Volume surge (2.5x)
Price change: 2.1300%
📈 $GOOGL | 30-minute bullish signal
━━━━━━━━━━━━━━━━━━
Technical analysis: ADX(31) indicates a clear trend | MACD DIF breaks above the zero line, trend turns bullish | EMA5 > EMA8 > EMA13, bullish alignment | KDJ running strongly, bulls in control (K: 74.5, D: 63.1) | Volume increases (1.7x)
Price change: 0.6500%
━━━━━━━━━━━━━━━━━━
#技术分析 #AMD #GOOGL
📌 The above content is for reference only and does not constitute investment advice
📈 $AMD | 30-minute bullish signal
━━━━━━━━━━━━━━━━━━
Technical analysis: ADX(32) indicates a clear trend | MACD golden cross above zero, bullish momentum released | EMA5 crosses above EMA8, short-term outlook turns bullish | KDJ golden cross, bullish short-term outlook (K: 65.9, D: 61.6) | Volume surge (2.5x)
Price change: 2.1300%
📈 $GOOGL | 30-minute bullish signal
━━━━━━━━━━━━━━━━━━
Technical analysis: ADX(31) indicates a clear trend | MACD DIF breaks above the zero line, trend turns bullish | EMA5 > EMA8 > EMA13, bullish alignment | KDJ running strongly, bulls in control (K: 74.5, D: 63.1) | Volume increases (1.7x)
Price change: 0.6500%
━━━━━━━━━━━━━━━━━━
#技术分析 #AMD #GOOGL
📌 The above content is for reference only and does not constitute investment advice
11

·
--
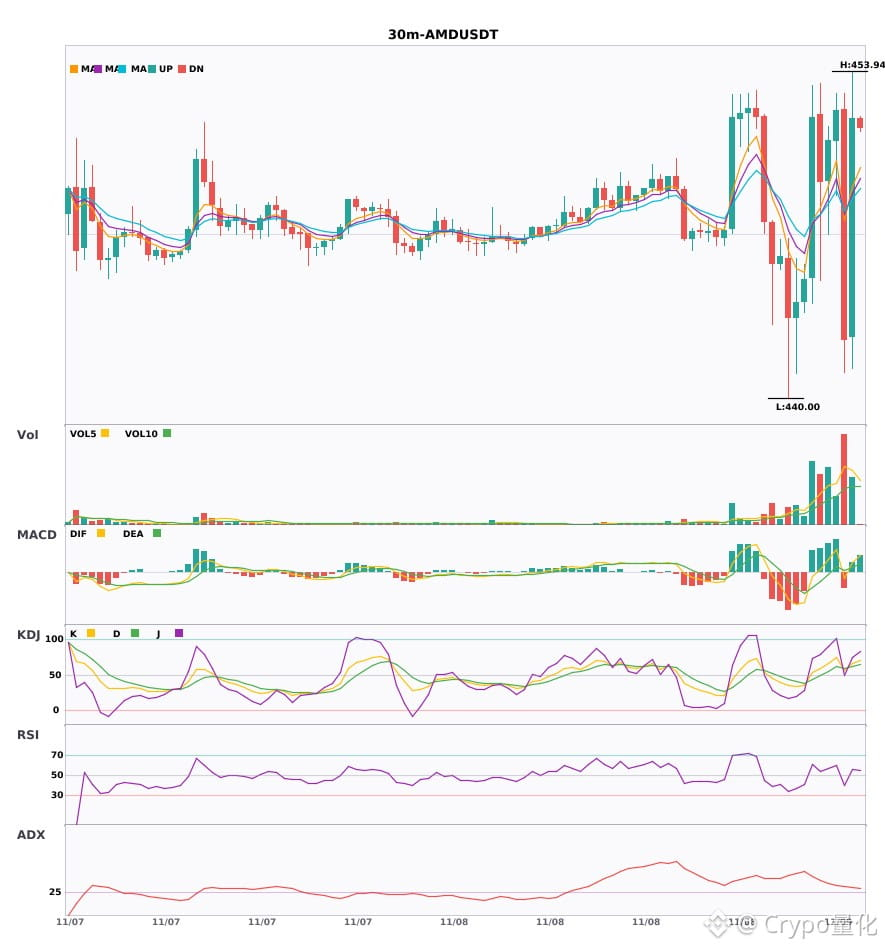
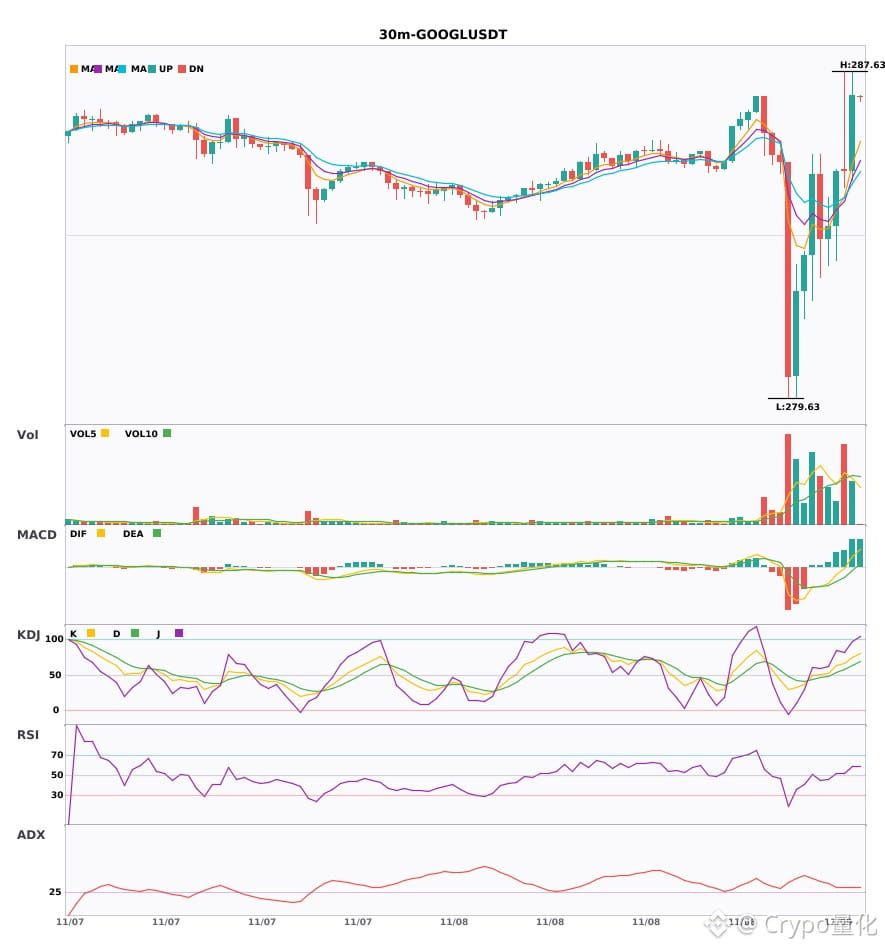
$AMD / $GOOGL 30-minute technical indicators are strengthening in sync. Which has greater explosive potential? 🔥
════════════════════
🔴 $AMD 30-minute bullish signal
⚠️Technical analysis: ADX(32) indicates a clear trending market | MACD golden cross above zero, bullish momentum is building | EMA5 crosses above EMA8, short-term outlook turns bullish | KDJ golden cross, bullish in the short term (K is 65.9, D is 61.6) | Volume surges (2.5x)
════════════════════
🔴 $GOOGL 30-minute bullish signal
⚠️Technical analysis: ADX(31) indicates a clear trending market | MACD DIF breaks above the zero line, trend turns bullish | EMA5 > EMA8 > EMA13, bullish alignment | KDJ is running strong, bulls have the upper hand (K is 74.5, D is 63.1) | Volume increases (1.7x)
════════════════════
🔔 Follow to get the latest market moves first 🔔
#技术分析 #AMD #GOOGL
📌 When trading, pay attention to whether the candlestick patterns confirm the signal
$AMD / $GOOGL 30-minute technical indicators are strengthening in sync. Which has greater explosive potential? 🔥
════════════════════
🔴 $AMD 30-minute bullish signal
⚠️Technical analysis: ADX(32) indicates a clear trending market | MACD golden cross above zero, bullish momentum is building | EMA5 crosses above EMA8, short-term outlook turns bullish | KDJ golden cross, bullish in the short term (K is 65.9, D is 61.6) | Volume surges (2.5x)
════════════════════
🔴 $GOOGL 30-minute bullish signal
⚠️Technical analysis: ADX(31) indicates a clear trending market | MACD DIF breaks above the zero line, trend turns bullish | EMA5 > EMA8 > EMA13, bullish alignment | KDJ is running strong, bulls have the upper hand (K is 74.5, D is 63.1) | Volume increases (1.7x)
════════════════════
🔔 Follow to get the latest market moves first 🔔
#技术分析 #AMD #GOOGL
📌 When trading, pay attention to whether the candlestick patterns confirm the signal
════════════════════
🔴 $AMD 30-minute bullish signal
⚠️Technical analysis: ADX(32) indicates a clear trending market | MACD golden cross above zero, bullish momentum is building | EMA5 crosses above EMA8, short-term outlook turns bullish | KDJ golden cross, bullish in the short term (K is 65.9, D is 61.6) | Volume surges (2.5x)
════════════════════
🔴 $GOOGL 30-minute bullish signal
⚠️Technical analysis: ADX(31) indicates a clear trending market | MACD DIF breaks above the zero line, trend turns bullish | EMA5 > EMA8 > EMA13, bullish alignment | KDJ is running strong, bulls have the upper hand (K is 74.5, D is 63.1) | Volume increases (1.7x)
════════════════════
🔔 Follow to get the latest market moves first 🔔
#技术分析 #AMD #GOOGL
📌 When trading, pay attention to whether the candlestick patterns confirm the signal
32
·
--
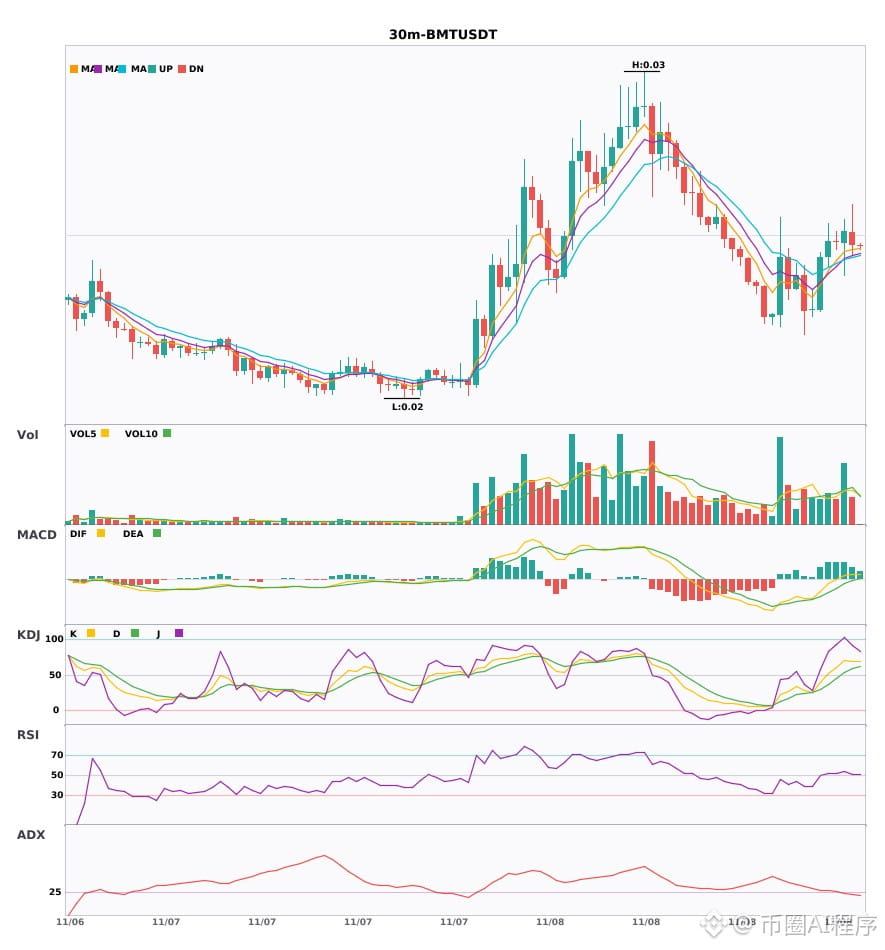
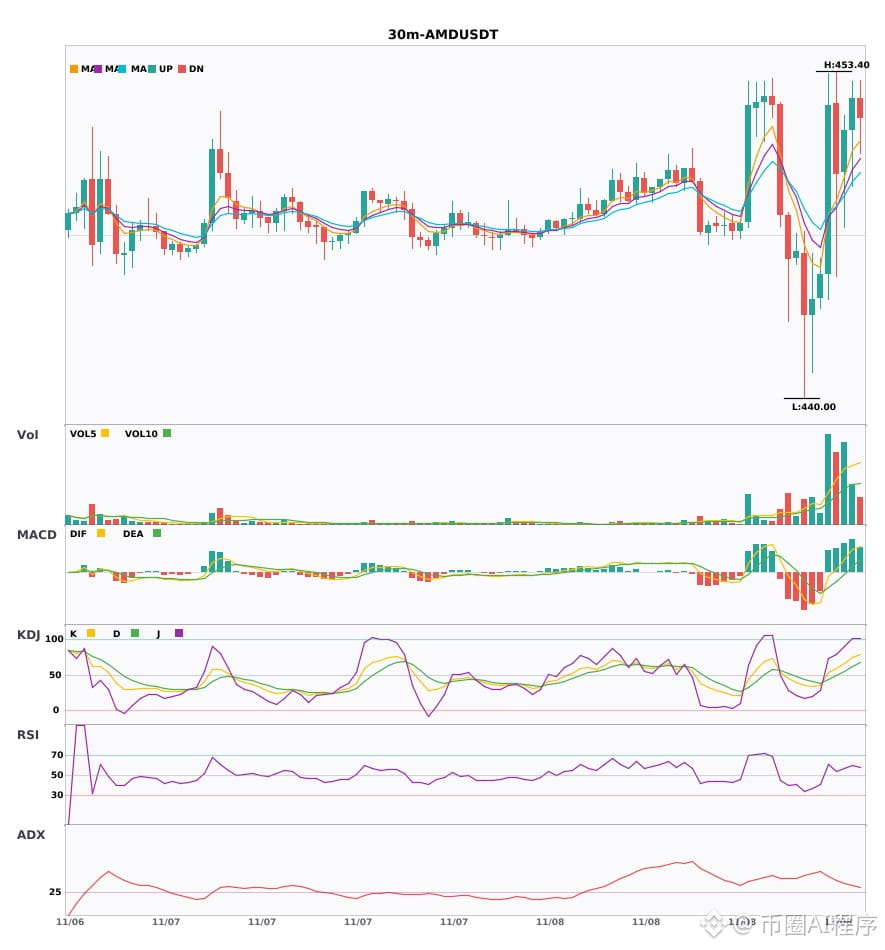
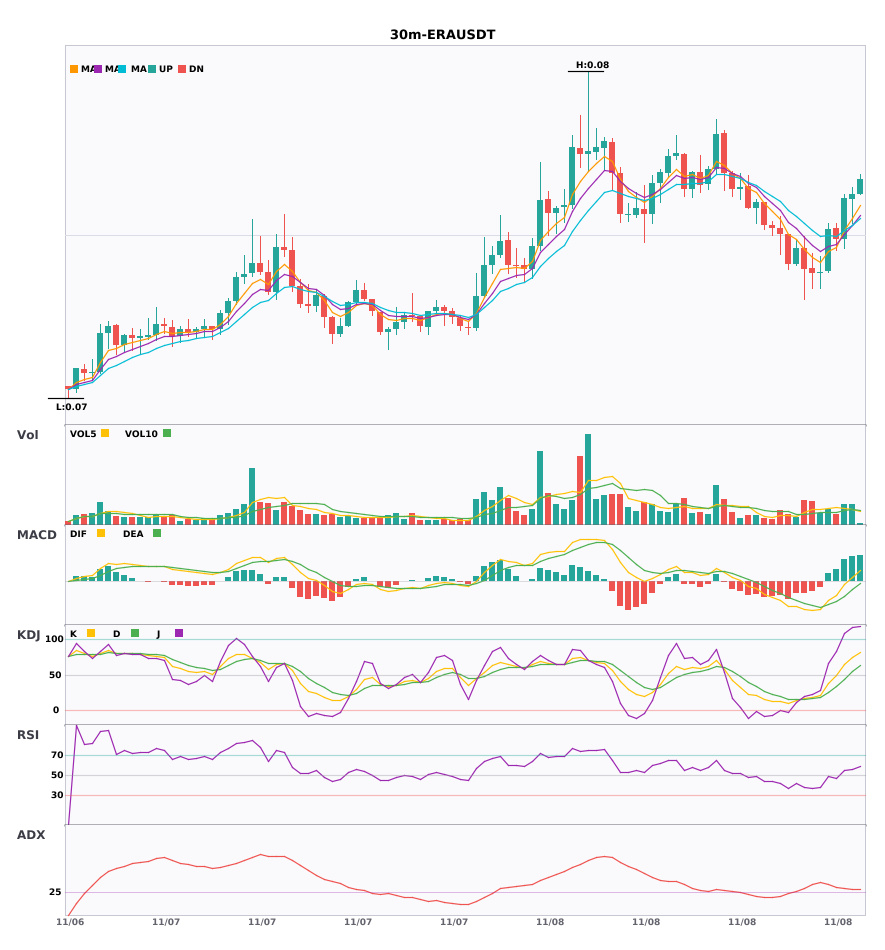
Multi-timeframe resonance: $BMT / $AMD / $ERA 30-minute strength, 4-hour bullish trend confirmed 🔥
════════════════════
🔴 $BMT 30-minute bullish signal
⚠️Technical analysis: 4-hour bullish resonance confirmed | 30-minute entry: MACD bullish, trend strong, momentum weakening | EMA5 > EMA8 > EMA13 bullish alignment | KDJ running strongly, bulls in control (K: 69.9, D: 53.4) | Volume increased (1.7x)
════════════════════
🔴 $AMD 30-minute bullish signal
⚠️Technical analysis: 4-hour bullish resonance confirmed | 30-minute entry: MACD bullish, trend strong, momentum strengthening | EMA5 > EMA8 > EMA13 bullish alignment | KDJ running strongly, bulls in control (K: 66.3, D: 54.5) | Volume increased (2.5x)
════════════════════
🔴 $ERA 30-minute bullish signal
⚠️Technical analysis: 4-hour bullish resonance confirmed | 30-minute entry: MACD DIF breaks above the zero line, trend turns bullish | EMA5 > EMA8 > EMA13 bullish alignment | KDJ running strongly, bulls in control (K: 74.9, D: 54.4) | Volume normal (1.5x)
════════════════════
🔔 Follow for first-hand market movement updates 🔔
#多周期共振 #BMT #AMD #ERA
📌 When trading, pay attention to whether the candlestick pattern meets the criteria
Multi-timeframe resonance: $BMT / $AMD / $ERA 30-minute strength, 4-hour bullish trend confirmed 🔥
════════════════════
🔴 $BMT 30-minute bullish signal
⚠️Technical analysis: 4-hour bullish resonance confirmed | 30-minute entry: MACD bullish, trend strong, momentum weakening | EMA5 > EMA8 > EMA13 bullish alignment | KDJ running strongly, bulls in control (K: 69.9, D: 53.4) | Volume increased (1.7x)
════════════════════
🔴 $AMD 30-minute bullish signal
⚠️Technical analysis: 4-hour bullish resonance confirmed | 30-minute entry: MACD bullish, trend strong, momentum strengthening | EMA5 > EMA8 > EMA13 bullish alignment | KDJ running strongly, bulls in control (K: 66.3, D: 54.5) | Volume increased (2.5x)
════════════════════
🔴 $ERA 30-minute bullish signal
⚠️Technical analysis: 4-hour bullish resonance confirmed | 30-minute entry: MACD DIF breaks above the zero line, trend turns bullish | EMA5 > EMA8 > EMA13 bullish alignment | KDJ running strongly, bulls in control (K: 74.9, D: 54.4) | Volume normal (1.5x)
════════════════════
🔔 Follow for first-hand market movement updates 🔔
#多周期共振 #BMT #AMD #ERA
📌 When trading, pay attention to whether the candlestick pattern meets the criteria
════════════════════
🔴 $BMT 30-minute bullish signal
⚠️Technical analysis: 4-hour bullish resonance confirmed | 30-minute entry: MACD bullish, trend strong, momentum weakening | EMA5 > EMA8 > EMA13 bullish alignment | KDJ running strongly, bulls in control (K: 69.9, D: 53.4) | Volume increased (1.7x)
════════════════════
🔴 $AMD 30-minute bullish signal
⚠️Technical analysis: 4-hour bullish resonance confirmed | 30-minute entry: MACD bullish, trend strong, momentum strengthening | EMA5 > EMA8 > EMA13 bullish alignment | KDJ running strongly, bulls in control (K: 66.3, D: 54.5) | Volume increased (2.5x)
════════════════════
🔴 $ERA 30-minute bullish signal
⚠️Technical analysis: 4-hour bullish resonance confirmed | 30-minute entry: MACD DIF breaks above the zero line, trend turns bullish | EMA5 > EMA8 > EMA13 bullish alignment | KDJ running strongly, bulls in control (K: 74.9, D: 54.4) | Volume normal (1.5x)
════════════════════
🔔 Follow for first-hand market movement updates 🔔
#多周期共振 #BMT #AMD #ERA
📌 When trading, pay attention to whether the candlestick pattern meets the criteria
35
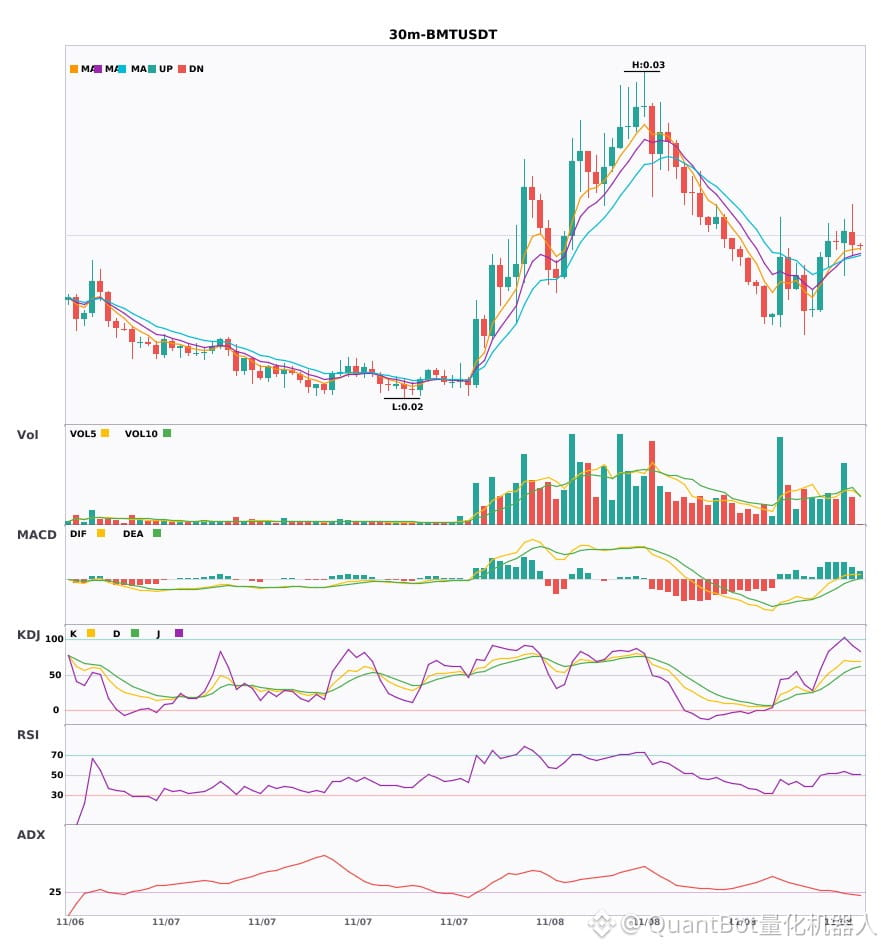
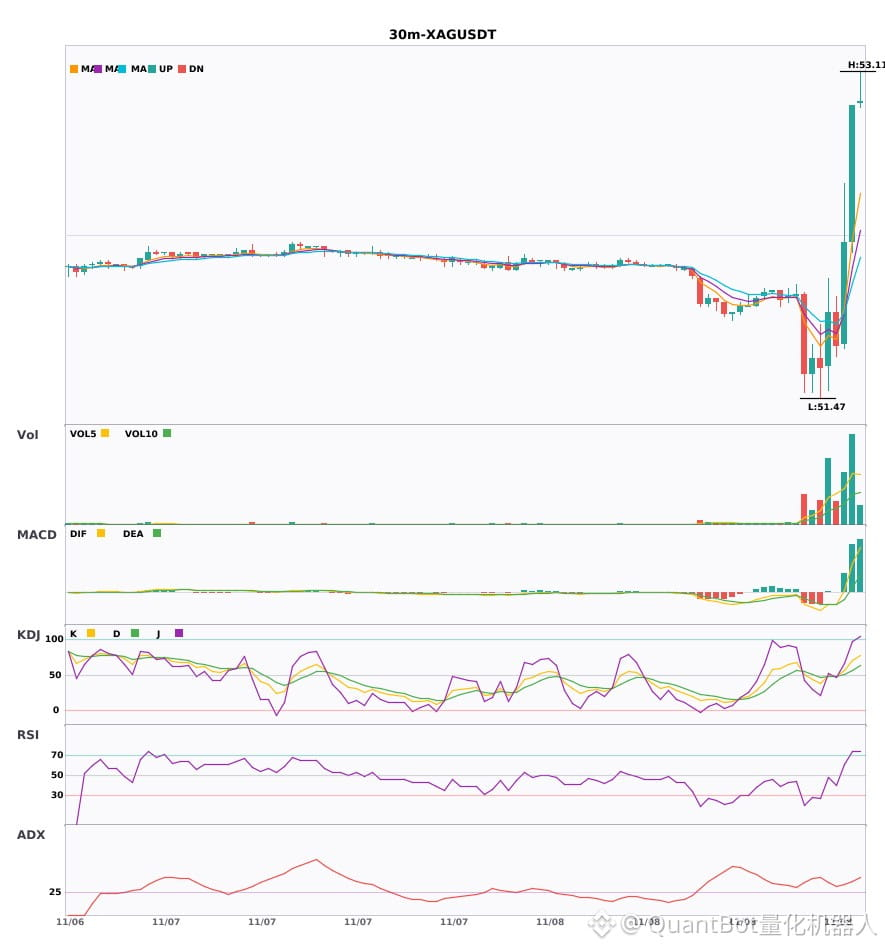
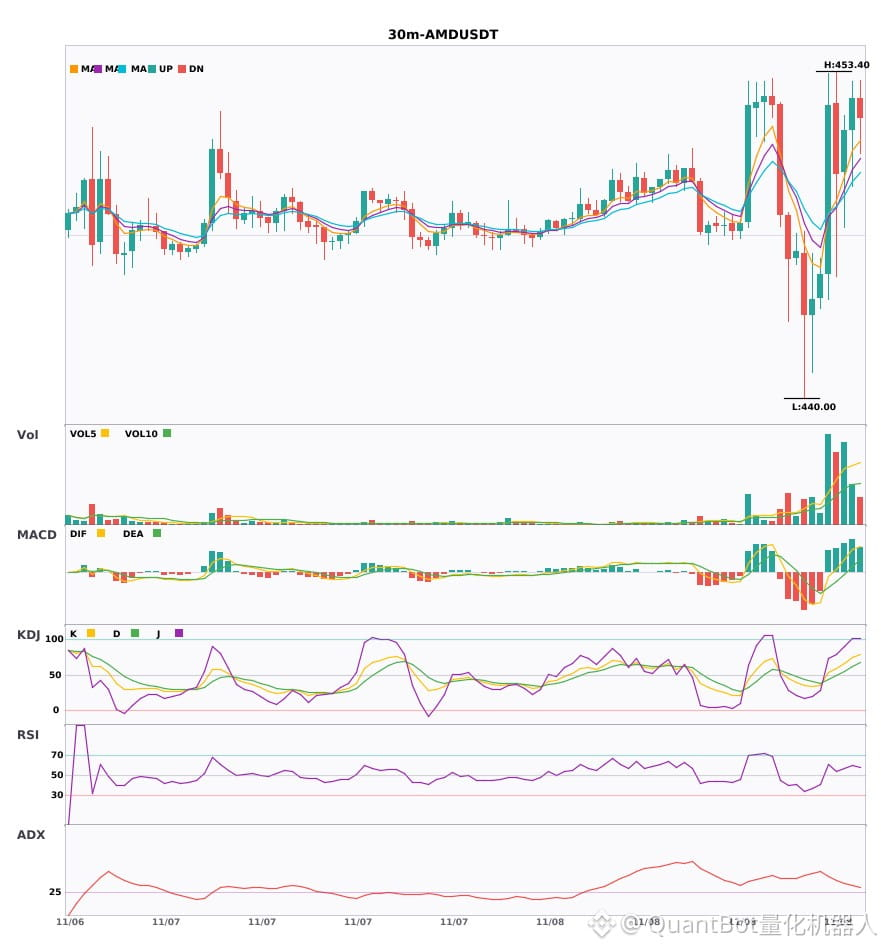
$BMT / $XAG / $AMD 30-minute resonance turns bullish, with bullish signals appearing simultaneously
📈 $BMT | 30-minute bullish signal
━━━━━━━━━━━━━━━━━━
Technical analysis: ADX(26) Trend is forming; participation is possible | MACD is bullish, trend is strong, momentum is weakening | EMA5 greater than EMA8 greater than EMA13, bullish alignment | KDJ is strong, bulls have the advantage (K is 69.9, D is 53.4) | Volume increased (1.7x)
Price change: 0.6100%
📈 $XAG | 30-minute bullish signal
━━━━━━━━━━━━━━━━━━
Technical analysis: ADX(39) Clear trending market | MACD is bullish, trend is strong, momentum is increasing | EMA5 greater than EMA8 greater than EMA13, bullish alignment | KDJ is strong, bulls have the advantage (K is 70.4, D is 56.9) | Volume surged (3.0x)
Price change: 1.3200%
📈 $AMD | 30-minute bullish signal
━━━━━━━━━━━━━━━━━━
Technical analysis: ADX(36) Clear trending market | MACD is bullish, trend is strong, momentum is increasing | EMA5 greater than EMA8 greater than EMA13, bullish alignment | KDJ is strong, bulls have the advantage (K is 66.3, D is 54.5) | Volume increased (2.5x)
Price change: 0.4000%
━━━━━━━━━━━━━━━━━━
#技术分析 #BMT #XAG #AMD
📌 The above content is for reference only and does not constitute investment advice
$BMT / $XAG / $AMD 30-minute resonance turns bullish, with bullish signals appearing simultaneously
📈 $BMT | 30-minute bullish signal
━━━━━━━━━━━━━━━━━━
Technical analysis: ADX(26) Trend is forming; participation is possible | MACD is bullish, trend is strong, momentum is weakening | EMA5 greater than EMA8 greater than EMA13, bullish alignment | KDJ is strong, bulls have the advantage (K is 69.9, D is 53.4) | Volume increased (1.7x)
Price change: 0.6100%
📈 $XAG | 30-minute bullish signal
━━━━━━━━━━━━━━━━━━
Technical analysis: ADX(39) Clear trending market | MACD is bullish, trend is strong, momentum is increasing | EMA5 greater than EMA8 greater than EMA13, bullish alignment | KDJ is strong, bulls have the advantage (K is 70.4, D is 56.9) | Volume surged (3.0x)
Price change: 1.3200%
📈 $AMD | 30-minute bullish signal
━━━━━━━━━━━━━━━━━━
Technical analysis: ADX(36) Clear trending market | MACD is bullish, trend is strong, momentum is increasing | EMA5 greater than EMA8 greater than EMA13, bullish alignment | KDJ is strong, bulls have the advantage (K is 66.3, D is 54.5) | Volume increased (2.5x)
Price change: 0.4000%
━━━━━━━━━━━━━━━━━━
#技术分析 #BMT #XAG #AMD
📌 The above content is for reference only and does not constitute investment advice
📈 $BMT | 30-minute bullish signal
━━━━━━━━━━━━━━━━━━
Technical analysis: ADX(26) Trend is forming; participation is possible | MACD is bullish, trend is strong, momentum is weakening | EMA5 greater than EMA8 greater than EMA13, bullish alignment | KDJ is strong, bulls have the advantage (K is 69.9, D is 53.4) | Volume increased (1.7x)
Price change: 0.6100%
📈 $XAG | 30-minute bullish signal
━━━━━━━━━━━━━━━━━━
Technical analysis: ADX(39) Clear trending market | MACD is bullish, trend is strong, momentum is increasing | EMA5 greater than EMA8 greater than EMA13, bullish alignment | KDJ is strong, bulls have the advantage (K is 70.4, D is 56.9) | Volume surged (3.0x)
Price change: 1.3200%
📈 $AMD | 30-minute bullish signal
━━━━━━━━━━━━━━━━━━
Technical analysis: ADX(36) Clear trending market | MACD is bullish, trend is strong, momentum is increasing | EMA5 greater than EMA8 greater than EMA13, bullish alignment | KDJ is strong, bulls have the advantage (K is 66.3, D is 54.5) | Volume increased (2.5x)
Price change: 0.4000%
━━━━━━━━━━━━━━━━━━
#技术分析 #BMT #XAG #AMD
📌 The above content is for reference only and does not constitute investment advice
35
·
--
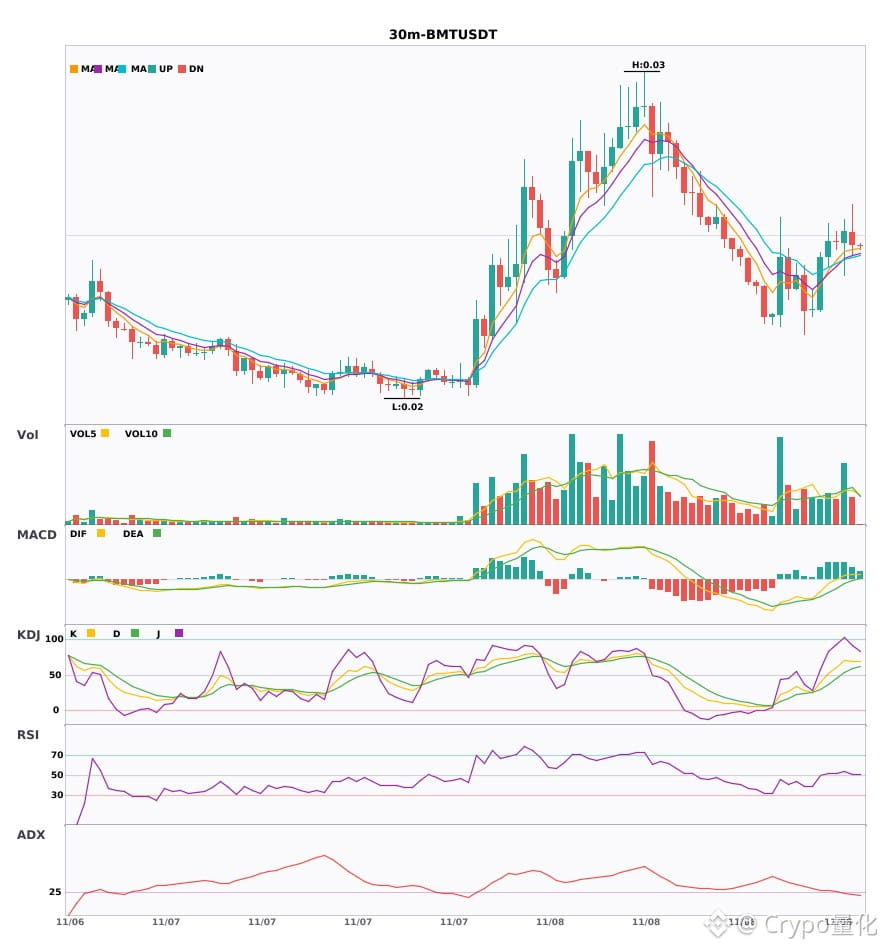
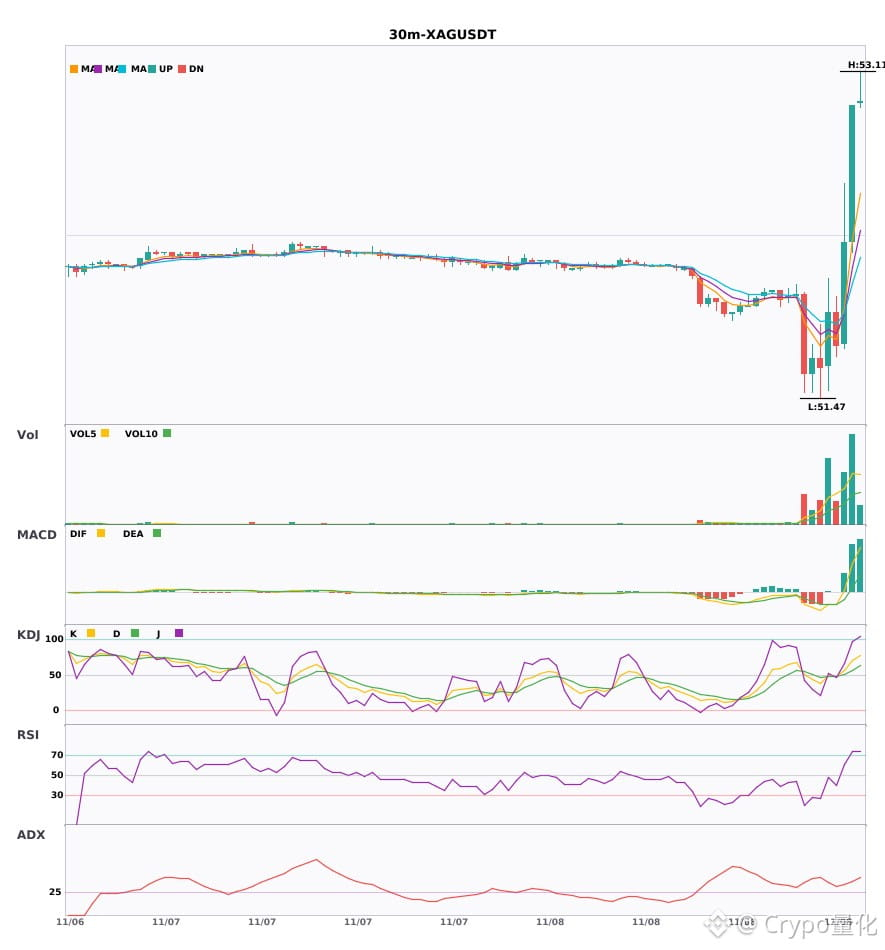
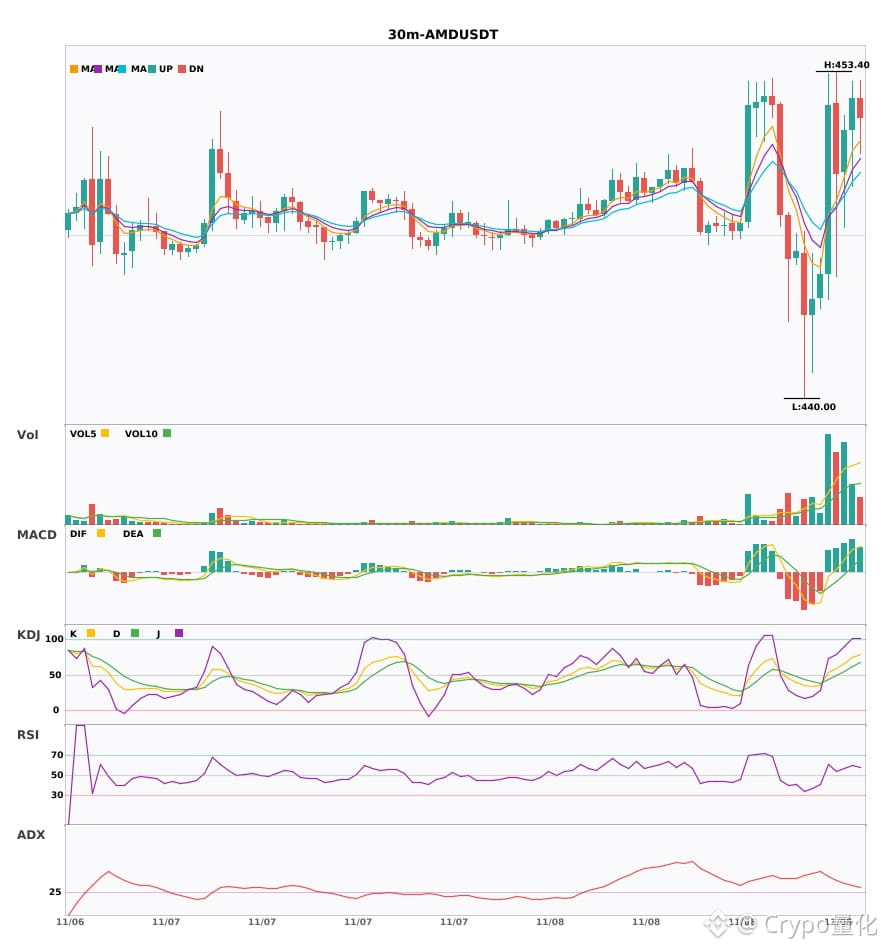
$BMT / $XAG / $AMD 30-minute technicals are strengthening in sync—who has greater explosive potential? 🔥
════════════════════
🔴 $BMT 30-minute bullish signal
⚠️Technical: ADX(26) Trend is forming; potential entry | MACD bullish, trend relatively strong, momentum weakening | EMA5 > EMA8 > EMA13 bullish alignment | KDJ running strongly, bulls in control (K: 69.9, D: 53.4) | Volume increased (1.7x)
════════════════════
🔴 $XAG 30-minute bullish signal
⚠️Technical: ADX(39) Clear trending market | MACD bullish, trend relatively strong, momentum strengthening | EMA5 > EMA8 > EMA13 bullish alignment | KDJ running strongly, bulls in control (K: 70.4, D: 56.9) | Volume surge (3.0x)
════════════════════
🔴 $AMD 30-minute bullish signal
⚠️Technical: ADX(36) Clear trending market | MACD bullish, trend relatively strong, momentum strengthening | EMA5 > EMA8 > EMA13 bullish alignment | KDJ running strongly, bulls in control (K: 66.3, D: 54.5) | Volume increased (2.5x)
════════════════════
🔔 Follow us for first-hand market alerts 🔔
#技术分析 #BMT #XAG #AMD
📌 When trading, pay attention to whether the candlestick pattern confirms the setup
$BMT / $XAG / $AMD 30-minute technicals are strengthening in sync—who has greater explosive potential? 🔥
════════════════════
🔴 $BMT 30-minute bullish signal
⚠️Technical: ADX(26) Trend is forming; potential entry | MACD bullish, trend relatively strong, momentum weakening | EMA5 > EMA8 > EMA13 bullish alignment | KDJ running strongly, bulls in control (K: 69.9, D: 53.4) | Volume increased (1.7x)
════════════════════
🔴 $XAG 30-minute bullish signal
⚠️Technical: ADX(39) Clear trending market | MACD bullish, trend relatively strong, momentum strengthening | EMA5 > EMA8 > EMA13 bullish alignment | KDJ running strongly, bulls in control (K: 70.4, D: 56.9) | Volume surge (3.0x)
════════════════════
🔴 $AMD 30-minute bullish signal
⚠️Technical: ADX(36) Clear trending market | MACD bullish, trend relatively strong, momentum strengthening | EMA5 > EMA8 > EMA13 bullish alignment | KDJ running strongly, bulls in control (K: 66.3, D: 54.5) | Volume increased (2.5x)
════════════════════
🔔 Follow us for first-hand market alerts 🔔
#技术分析 #BMT #XAG #AMD
📌 When trading, pay attention to whether the candlestick pattern confirms the setup
════════════════════
🔴 $BMT 30-minute bullish signal
⚠️Technical: ADX(26) Trend is forming; potential entry | MACD bullish, trend relatively strong, momentum weakening | EMA5 > EMA8 > EMA13 bullish alignment | KDJ running strongly, bulls in control (K: 69.9, D: 53.4) | Volume increased (1.7x)
════════════════════
🔴 $XAG 30-minute bullish signal
⚠️Technical: ADX(39) Clear trending market | MACD bullish, trend relatively strong, momentum strengthening | EMA5 > EMA8 > EMA13 bullish alignment | KDJ running strongly, bulls in control (K: 70.4, D: 56.9) | Volume surge (3.0x)
════════════════════
🔴 $AMD 30-minute bullish signal
⚠️Technical: ADX(36) Clear trending market | MACD bullish, trend relatively strong, momentum strengthening | EMA5 > EMA8 > EMA13 bullish alignment | KDJ running strongly, bulls in control (K: 66.3, D: 54.5) | Volume increased (2.5x)
════════════════════
🔔 Follow us for first-hand market alerts 🔔
#技术分析 #BMT #XAG #AMD
📌 When trading, pay attention to whether the candlestick pattern confirms the setup
31
·
--
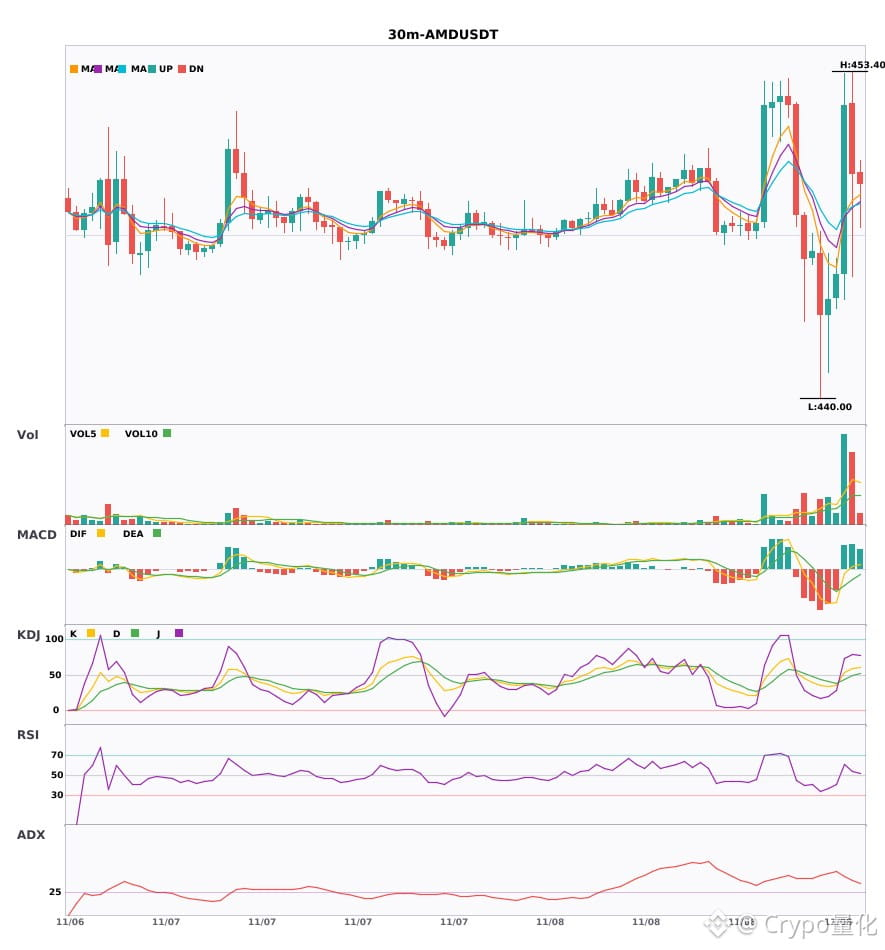
$AMD 30-minute technicals are strengthening—is a short-term opportunity here? 🔥
════════════════════
🔴 $AMD 30-minute bullish signal
⚠️ Technicals: ADX(41) indicates a clear trend | MACD DIF breaks above zero, signaling a bullish trend | Moving averages are converging, building momentum; a direction will soon emerge | Volume surges (4.0x)
════════════════════
🔔 Follow for first-hand market updates 🔔
#技术分析 #AMD
📌 When trading, watch whether the candlestick patterns confirm the setup
$AMD 30-minute technicals are strengthening—is a short-term opportunity here? 🔥
════════════════════
🔴 $AMD 30-minute bullish signal
⚠️ Technicals: ADX(41) indicates a clear trend | MACD DIF breaks above zero, signaling a bullish trend | Moving averages are converging, building momentum; a direction will soon emerge | Volume surges (4.0x)
════════════════════
🔔 Follow for first-hand market updates 🔔
#技术分析 #AMD
📌 When trading, watch whether the candlestick patterns confirm the setup
════════════════════
🔴 $AMD 30-minute bullish signal
⚠️ Technicals: ADX(41) indicates a clear trend | MACD DIF breaks above zero, signaling a bullish trend | Moving averages are converging, building momentum; a direction will soon emerge | Volume surges (4.0x)
════════════════════
🔔 Follow for first-hand market updates 🔔
#技术分析 #AMD
📌 When trading, watch whether the candlestick patterns confirm the setup
74
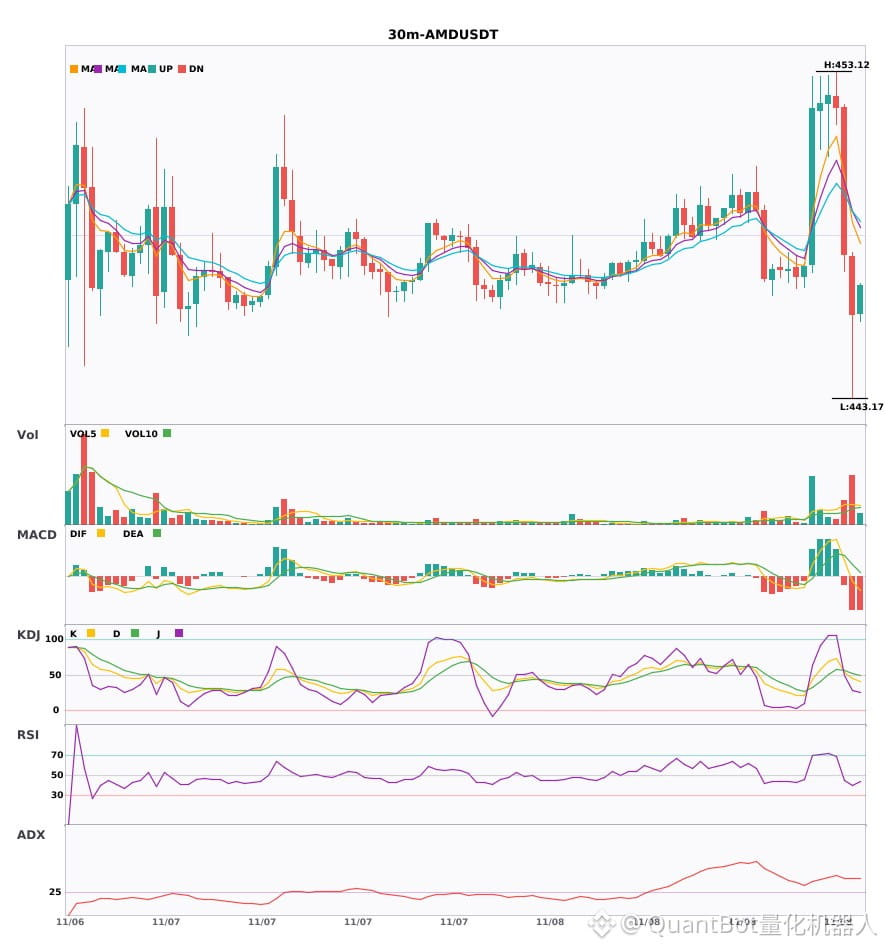
$AMD 30-minute technical outlook is weakening; beware of risk
📉 $AMD | 30-minute bearish signal
━━━━━━━━━━━━━━━━━━
Technical analysis: ADX (43) indicates a clear trending market | MACD DIF falls below the zero line, turning the trend bearish | EMA5 crosses below EMA8, indicating short-term bearishness | Volume surge (2.9x)
Price change: -0.4000%
━━━━━━━━━━━━━━━━━━
#技术分析 #AMD
📌 The above is for reference only and does not constitute investment advice
$AMD 30-minute technical outlook is weakening; beware of risk
📉 $AMD | 30-minute bearish signal
━━━━━━━━━━━━━━━━━━
Technical analysis: ADX (43) indicates a clear trending market | MACD DIF falls below the zero line, turning the trend bearish | EMA5 crosses below EMA8, indicating short-term bearishness | Volume surge (2.9x)
Price change: -0.4000%
━━━━━━━━━━━━━━━━━━
#技术分析 #AMD
📌 The above is for reference only and does not constitute investment advice
📉 $AMD | 30-minute bearish signal
━━━━━━━━━━━━━━━━━━
Technical analysis: ADX (43) indicates a clear trending market | MACD DIF falls below the zero line, turning the trend bearish | EMA5 crosses below EMA8, indicating short-term bearishness | Volume surge (2.9x)
Price change: -0.4000%
━━━━━━━━━━━━━━━━━━
#技术分析 #AMD
📌 The above is for reference only and does not constitute investment advice
1
·
--
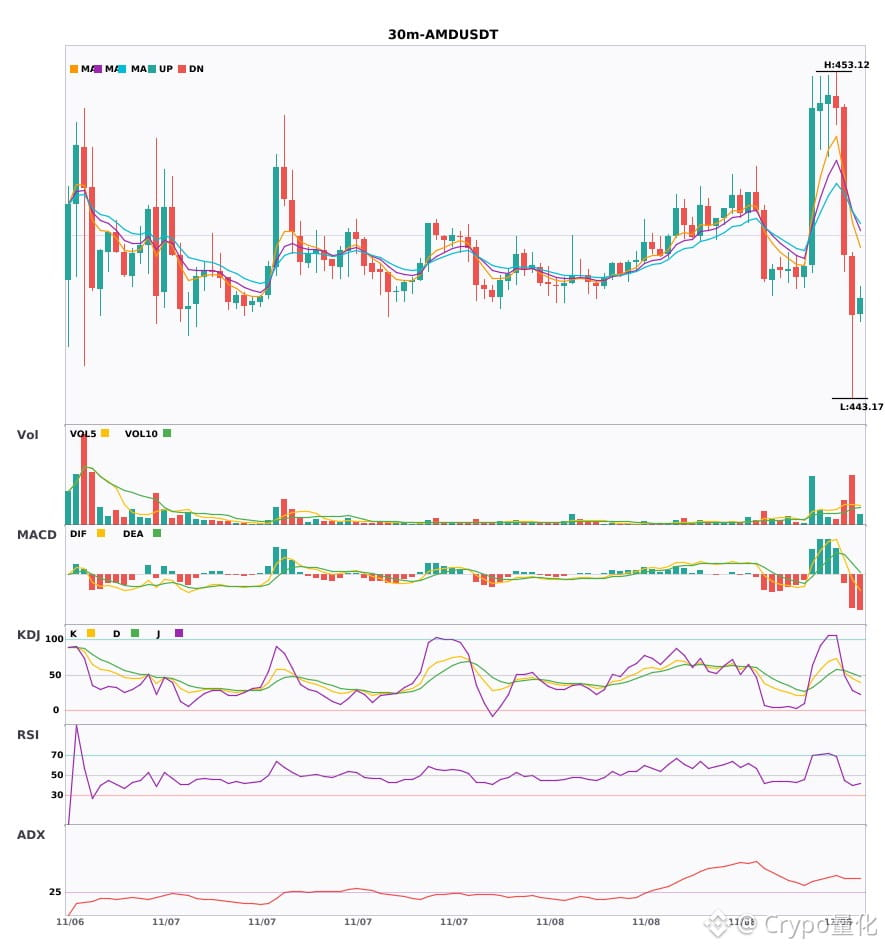
$AMD 30-minute technical indicators are weakening; be aware of the risk 🔥
════════════════════
🟢 $AMD 30-minute bearish signal
⚠️ Technical analysis: ADX(43) indicates a clear trending market | MACD DIF has fallen below the zero line, turning the trend bearish | EMA5 has crossed below EMA8, indicating a short-term bearish trend | Volume surge (2.9x)
════════════════════
🔔 Follow us for first-hand market movement alerts 🔔
#技术分析 #AMD
📌 When trading, check whether the candlestick pattern aligns
$AMD 30-minute technical indicators are weakening; be aware of the risk 🔥
════════════════════
🟢 $AMD 30-minute bearish signal
⚠️ Technical analysis: ADX(43) indicates a clear trending market | MACD DIF has fallen below the zero line, turning the trend bearish | EMA5 has crossed below EMA8, indicating a short-term bearish trend | Volume surge (2.9x)
════════════════════
🔔 Follow us for first-hand market movement alerts 🔔
#技术分析 #AMD
📌 When trading, check whether the candlestick pattern aligns
════════════════════
🟢 $AMD 30-minute bearish signal
⚠️ Technical analysis: ADX(43) indicates a clear trending market | MACD DIF has fallen below the zero line, turning the trend bearish | EMA5 has crossed below EMA8, indicating a short-term bearish trend | Volume surge (2.9x)
════════════════════
🔔 Follow us for first-hand market movement alerts 🔔
#技术分析 #AMD
📌 When trading, check whether the candlestick pattern aligns
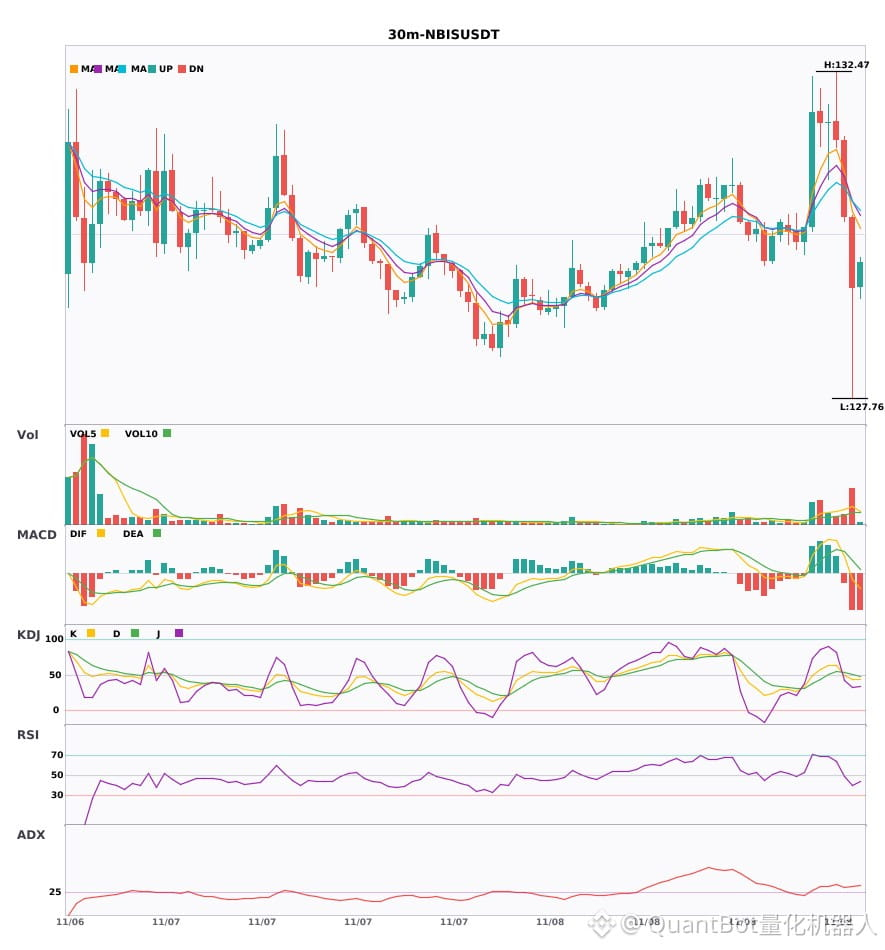
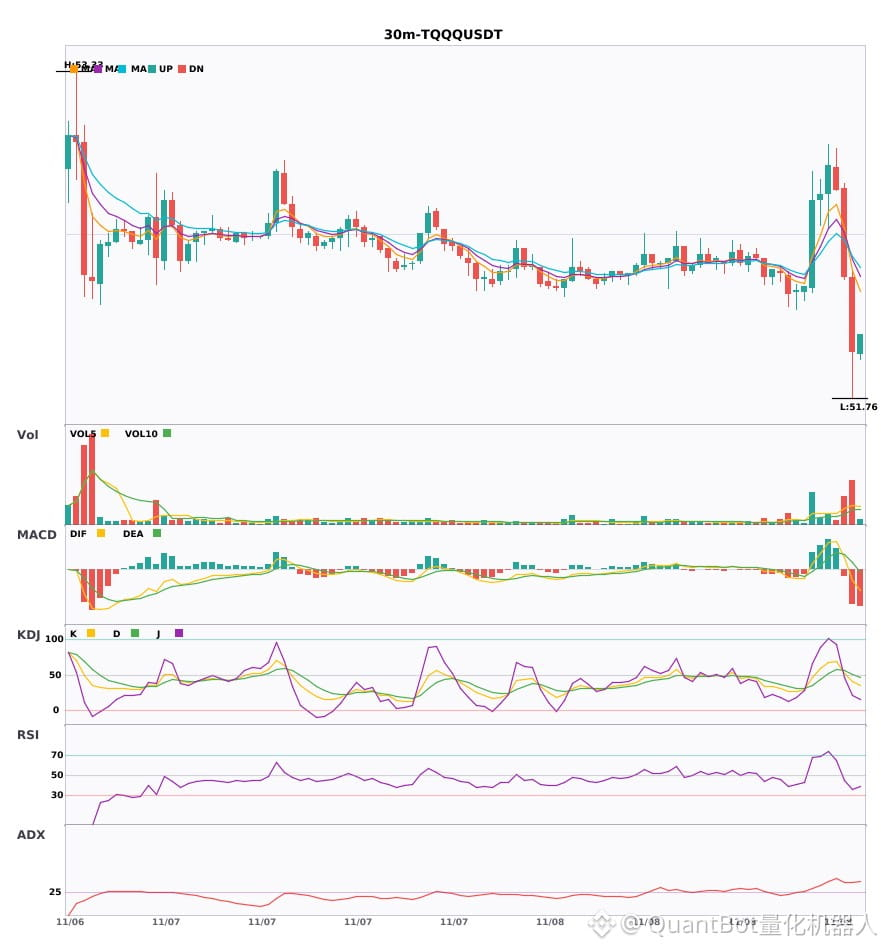
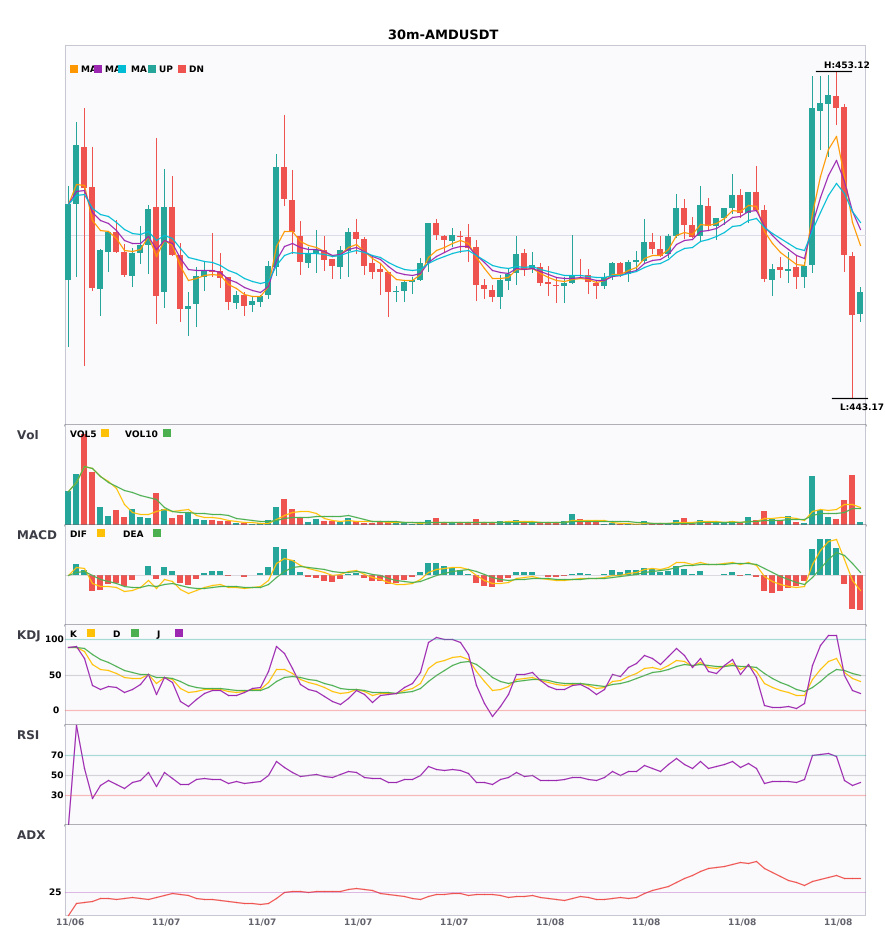
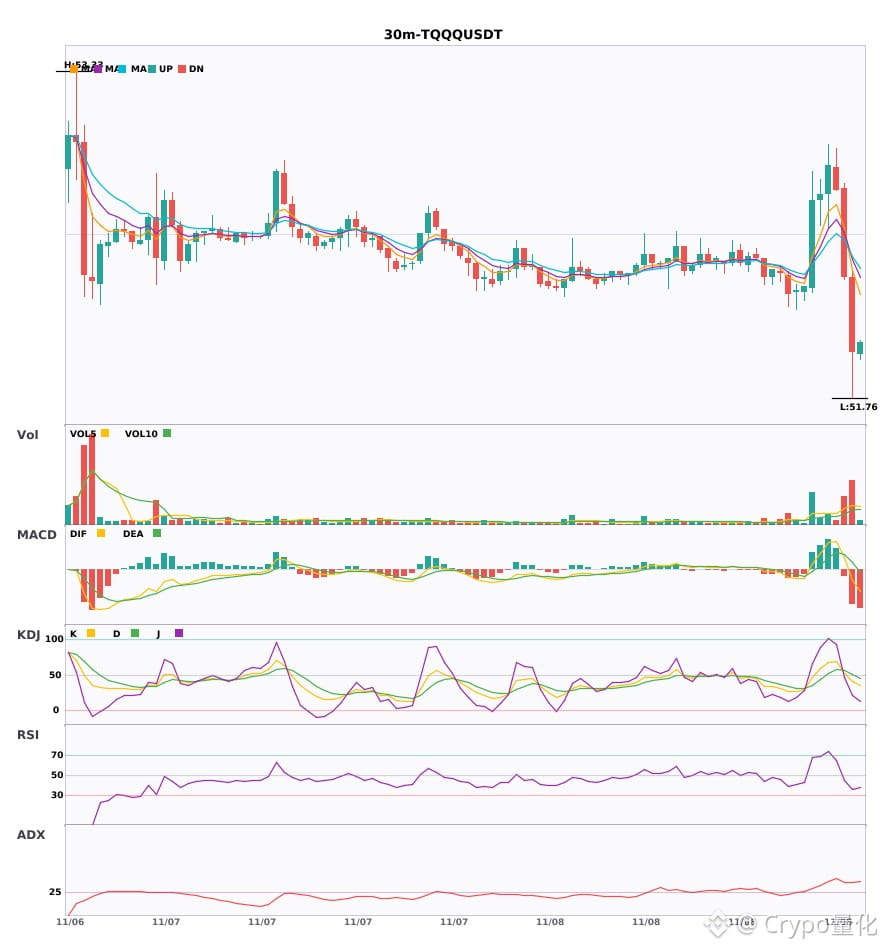
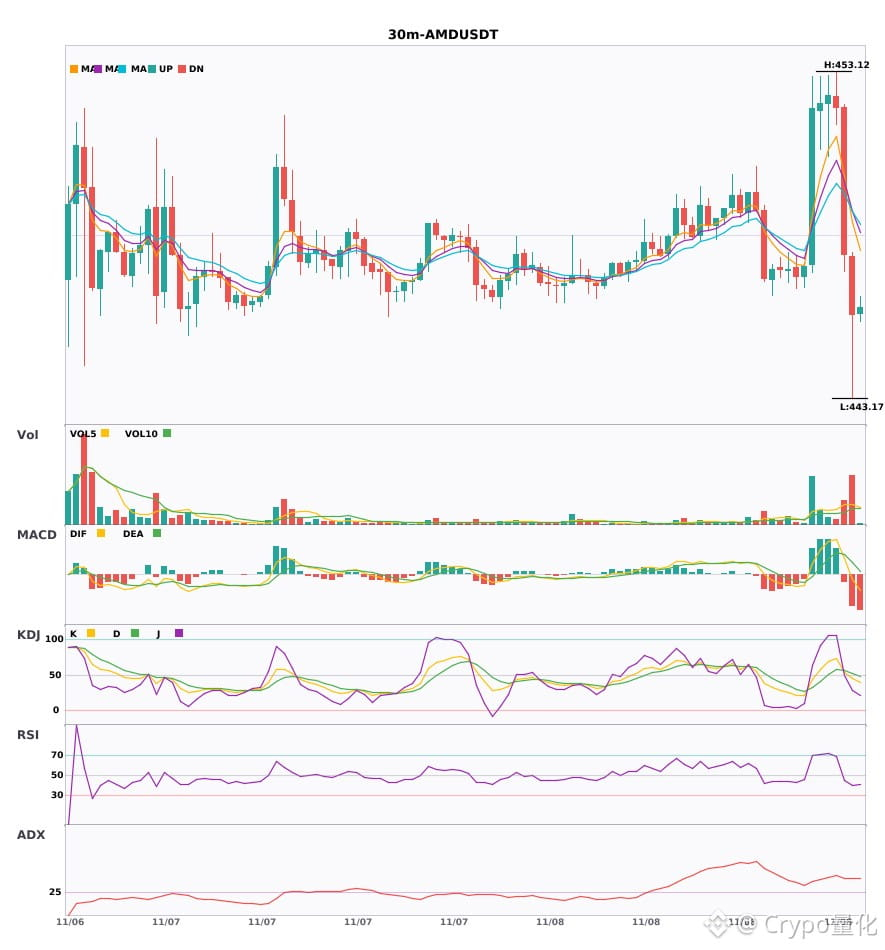
3 30-minute bearish alerts: $NBIS / $TQQQ / $AMD
📉 $NBIS | 30-minute bearish signal
━━━━━━━━━━━━━━━━━━
Technical analysis: ADX(33) indicates a clear trend | MACDDIF fell below zero, indicating a bearish trend | EMA5 crossed below EMA8, indicating a short-term bearish trend | Volume surge (2.9x)
Price change: -0.7900%
📉 $TQQQ | 30-minute bearish signal
━━━━━━━━━━━━━━━━━━
Technical analysis: ADX(40) indicates a clear trend | MACDDIF fell below zero, indicating a bearish trend | EMA5 crossed below EMA8, indicating a short-term bearish trend | Volume surge (3.0x)
Price change: -0.6900%
📉 $AMD | 30-minute bearish signal
━━━━━━━━━━━━━━━━━━
Technical analysis: ADX(43) indicates a clear trend | MACDDIF fell below zero, indicating a bearish trend | EMA5 crossed below EMA8, indicating a short-term bearish trend | Volume surge (2.9x)
Price change: -0.4000%
━━━━━━━━━━━━━━━━━━
#技术分析 #NBIS #TQQQ #AMD
📌 The above content is for reference only and does not constitute investment advice
3 30-minute bearish alerts: $NBIS / $TQQQ / $AMD
📉 $NBIS | 30-minute bearish signal
━━━━━━━━━━━━━━━━━━
Technical analysis: ADX(33) indicates a clear trend | MACDDIF fell below zero, indicating a bearish trend | EMA5 crossed below EMA8, indicating a short-term bearish trend | Volume surge (2.9x)
Price change: -0.7900%
📉 $TQQQ | 30-minute bearish signal
━━━━━━━━━━━━━━━━━━
Technical analysis: ADX(40) indicates a clear trend | MACDDIF fell below zero, indicating a bearish trend | EMA5 crossed below EMA8, indicating a short-term bearish trend | Volume surge (3.0x)
Price change: -0.6900%
📉 $AMD | 30-minute bearish signal
━━━━━━━━━━━━━━━━━━
Technical analysis: ADX(43) indicates a clear trend | MACDDIF fell below zero, indicating a bearish trend | EMA5 crossed below EMA8, indicating a short-term bearish trend | Volume surge (2.9x)
Price change: -0.4000%
━━━━━━━━━━━━━━━━━━
#技术分析 #NBIS #TQQQ #AMD
📌 The above content is for reference only and does not constitute investment advice
📉 $NBIS | 30-minute bearish signal
━━━━━━━━━━━━━━━━━━
Technical analysis: ADX(33) indicates a clear trend | MACDDIF fell below zero, indicating a bearish trend | EMA5 crossed below EMA8, indicating a short-term bearish trend | Volume surge (2.9x)
Price change: -0.7900%
📉 $TQQQ | 30-minute bearish signal
━━━━━━━━━━━━━━━━━━
Technical analysis: ADX(40) indicates a clear trend | MACDDIF fell below zero, indicating a bearish trend | EMA5 crossed below EMA8, indicating a short-term bearish trend | Volume surge (3.0x)
Price change: -0.6900%
📉 $AMD | 30-minute bearish signal
━━━━━━━━━━━━━━━━━━
Technical analysis: ADX(43) indicates a clear trend | MACDDIF fell below zero, indicating a bearish trend | EMA5 crossed below EMA8, indicating a short-term bearish trend | Volume surge (2.9x)
Price change: -0.4000%
━━━━━━━━━━━━━━━━━━
#技术分析 #NBIS #TQQQ #AMD
📌 The above content is for reference only and does not constitute investment advice
3
·
--
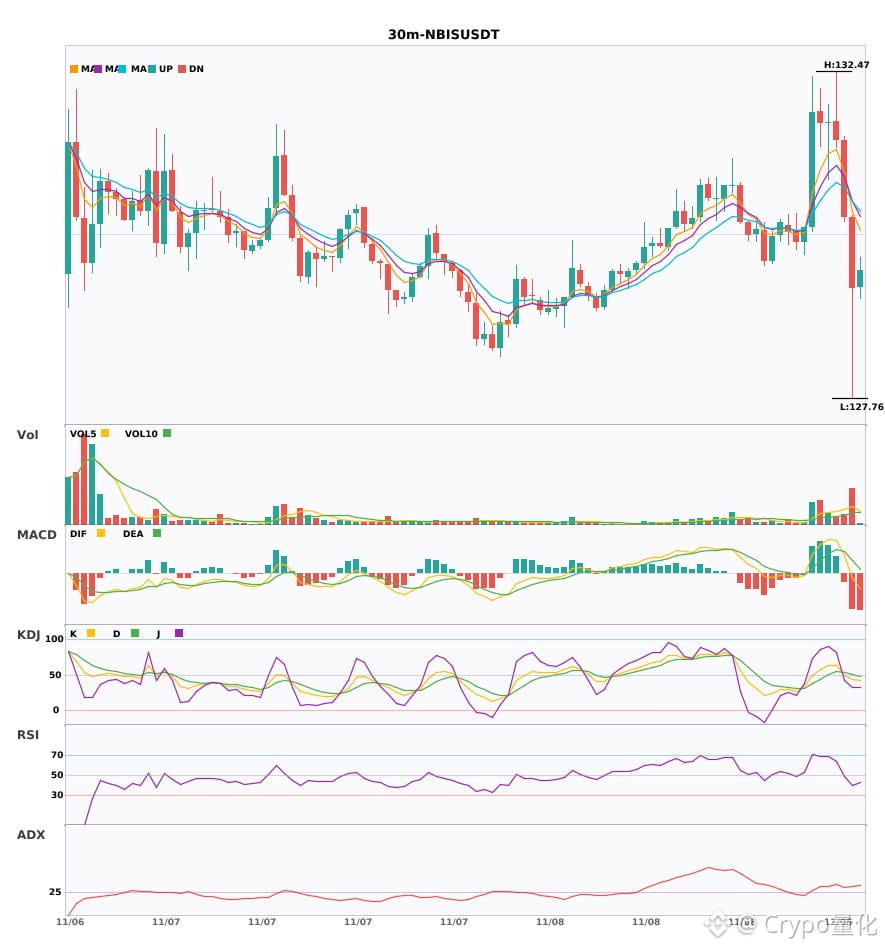
$NBIS / $TQQQ / $AMD 30-minute confluence turns bearish; bearish signals appear simultaneously 🔥
════════════════════
🟢 $NBIS 30-minute bearish signal
⚠️ Technical analysis: ADX(33) indicates a clear trending market | MACD DIF falls below the zero line, turning the trend bearish | EMA5 crosses below EMA8, signaling a short-term bearish trend | Volume surges (2.9x)
════════════════════
🟢 $TQQQ 30-minute bearish signal
⚠️ Technical analysis: ADX(40) indicates a clear trending market | MACD DIF falls below the zero line, turning the trend bearish | EMA5 crosses below EMA8, signaling a short-term bearish trend | Volume surges (3.0x)
════════════════════
🟢 $AMD 30-minute bearish signal
⚠️ Technical analysis: ADX(43) indicates a clear trending market | MACD DIF falls below the zero line, turning the trend bearish | EMA5 crosses below EMA8, signaling a short-term bearish trend | Volume surges (2.9x)
════════════════════
🔔 Follow us for real-time market updates 🔔
#技术分析 #NBIS #TQQQ #AMD
📌 When trading, pay attention to whether the candlestick pattern confirms the signal
$NBIS / $TQQQ / $AMD 30-minute confluence turns bearish; bearish signals appear simultaneously 🔥
════════════════════
🟢 $NBIS 30-minute bearish signal
⚠️ Technical analysis: ADX(33) indicates a clear trending market | MACD DIF falls below the zero line, turning the trend bearish | EMA5 crosses below EMA8, signaling a short-term bearish trend | Volume surges (2.9x)
════════════════════
🟢 $TQQQ 30-minute bearish signal
⚠️ Technical analysis: ADX(40) indicates a clear trending market | MACD DIF falls below the zero line, turning the trend bearish | EMA5 crosses below EMA8, signaling a short-term bearish trend | Volume surges (3.0x)
════════════════════
🟢 $AMD 30-minute bearish signal
⚠️ Technical analysis: ADX(43) indicates a clear trending market | MACD DIF falls below the zero line, turning the trend bearish | EMA5 crosses below EMA8, signaling a short-term bearish trend | Volume surges (2.9x)
════════════════════
🔔 Follow us for real-time market updates 🔔
#技术分析 #NBIS #TQQQ #AMD
📌 When trading, pay attention to whether the candlestick pattern confirms the signal
════════════════════
🟢 $NBIS 30-minute bearish signal
⚠️ Technical analysis: ADX(33) indicates a clear trending market | MACD DIF falls below the zero line, turning the trend bearish | EMA5 crosses below EMA8, signaling a short-term bearish trend | Volume surges (2.9x)
════════════════════
🟢 $TQQQ 30-minute bearish signal
⚠️ Technical analysis: ADX(40) indicates a clear trending market | MACD DIF falls below the zero line, turning the trend bearish | EMA5 crosses below EMA8, signaling a short-term bearish trend | Volume surges (3.0x)
════════════════════
🟢 $AMD 30-minute bearish signal
⚠️ Technical analysis: ADX(43) indicates a clear trending market | MACD DIF falls below the zero line, turning the trend bearish | EMA5 crosses below EMA8, signaling a short-term bearish trend | Volume surges (2.9x)
════════════════════
🔔 Follow us for real-time market updates 🔔
#技术分析 #NBIS #TQQQ #AMD
📌 When trading, pay attention to whether the candlestick pattern confirms the signal

·
--
AMD revenue grows, data center AI becomes a new focus, supply chain challenges remain
AMD reported strong third-quarter results, with revenue up 45% and remarkable growth in its data center business. Overall revenue is expected to double by 2027, but the company must address challenges related to supply chains, costs, and its ecosystem.#AMD #Data Center AI
AMD revenue grows, data center AI becomes a new focus, supply chain challenges remain
AMD reported strong third-quarter results, with revenue up 45% and remarkable growth in its data center business. Overall revenue is expected to double by 2027, but the company must address challenges related to supply chains, costs, and its ecosystem.#AMD #Data Center AI
AMD reported strong third-quarter results, with revenue up 45% and remarkable growth in its data center business. Overall revenue is expected to double by 2027, but the company must address challenges related to supply chains, costs, and its ecosystem.#AMD #Data Center AI
25

·
--
Yesterday, people were waiting for a pullback. Today, they’re waiting at an even higher price. $AMD It’s up 2.71% on the day, trading at 447.02—not far from its 24-hour high of 460.64.
This is the price of AMD’s USDT perpetual contract on OKX. U.S. stock markets are closed for the weekend, but the contract keeps trading as usual. It’s climbed from 433.47 to here—not an outrageous gain, but the pace is what hurts: the longer you wait for a decent pullback, the higher the price goes.
If I had to choose, I’d lean more toward staying on the sidelines: it hasn’t reached 460.64 yet, and chasing it now could mean buying halfway up the hill. But if it plants a firm foot above 460.64, I’ll immediately change my mind.
Is there still a chance for those who haven’t gotten in, or can we only watch this kind of rally from the sidelines?
$AMD
#美股 #AMD
Yesterday, people were waiting for a pullback. Today, they’re waiting at an even higher price. $AMD It’s up 2.71% on the day, trading at 447.02—not far from its 24-hour high of 460.64.
This is the price of AMD’s USDT perpetual contract on OKX. U.S. stock markets are closed for the weekend, but the contract keeps trading as usual. It’s climbed from 433.47 to here—not an outrageous gain, but the pace is what hurts: the longer you wait for a decent pullback, the higher the price goes.
If I had to choose, I’d lean more toward staying on the sidelines: it hasn’t reached 460.64 yet, and chasing it now could mean buying halfway up the hill. But if it plants a firm foot above 460.64, I’ll immediately change my mind.
Is there still a chance for those who haven’t gotten in, or can we only watch this kind of rally from the sidelines?
$AMD
#美股 #AMD
This is the price of AMD’s USDT perpetual contract on OKX. U.S. stock markets are closed for the weekend, but the contract keeps trading as usual. It’s climbed from 433.47 to here—not an outrageous gain, but the pace is what hurts: the longer you wait for a decent pullback, the higher the price goes.
If I had to choose, I’d lean more toward staying on the sidelines: it hasn’t reached 460.64 yet, and chasing it now could mean buying halfway up the hill. But if it plants a firm foot above 460.64, I’ll immediately change my mind.
Is there still a chance for those who haven’t gotten in, or can we only watch this kind of rally from the sidelines?
$AMD
#美股 #AMD
1

·
--
Bullish
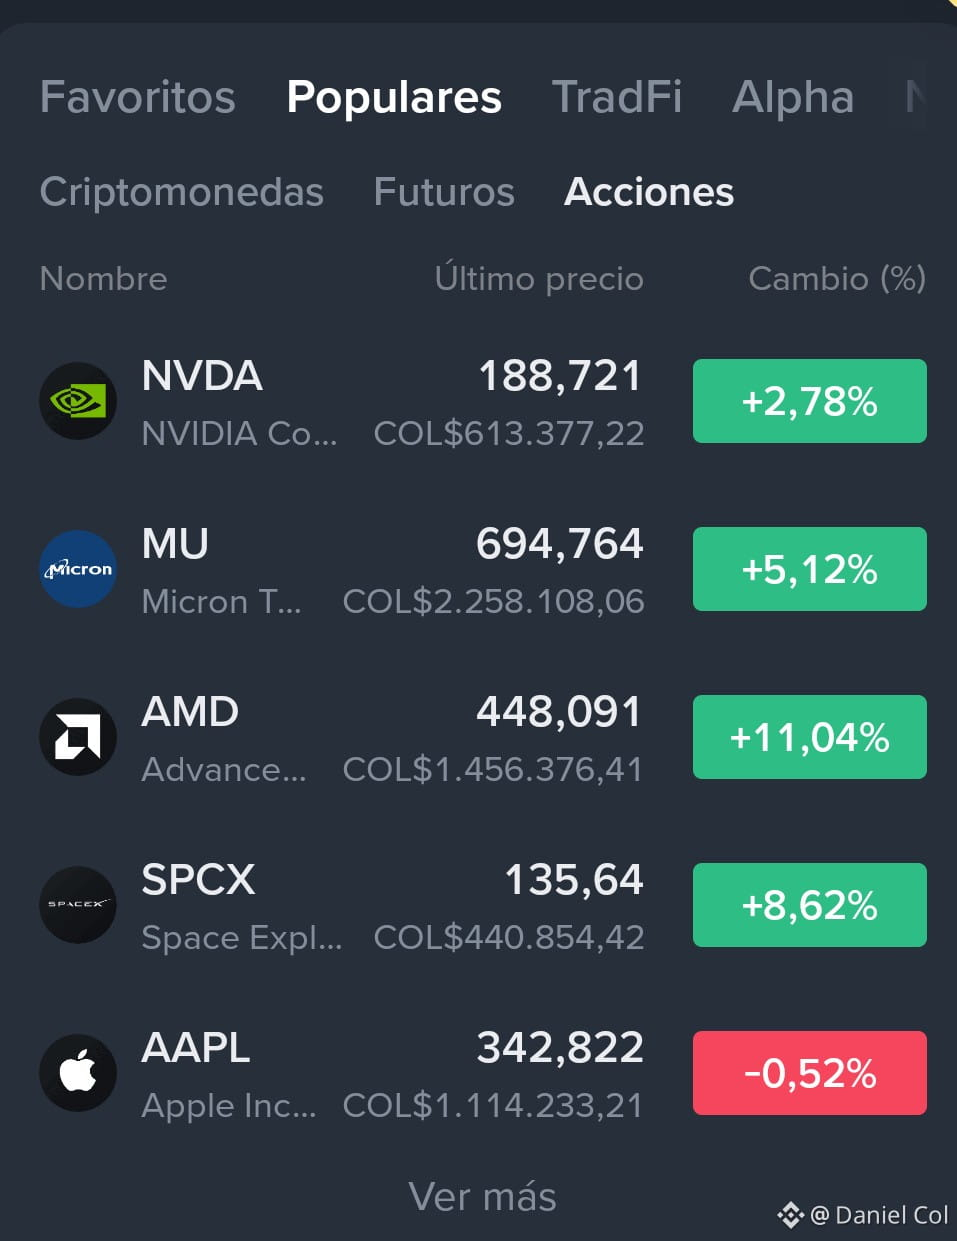
🔥 STOCKS ARE ON FIRE 🔥
While some are sleeping, the market is making big moves:
🟢 AMD +11.04%
🟢 SPCX +8.62%
🟢 MU +5.12%
🟢 NVDA +2.78%
🔴 AAPL -0.52%
AMD is leading with double-digit gains. Who else is loading up on chips and tech?
Have you already jumped in, or are you still watching from the sidelines? 👀
#AMD #NVDA #Acciones #BinanceSquare $AMD.US
{stock_us}(AMD.US)
$NVDAB
{spot}(NVDABUSDT)
$SPCX
🔥 STOCKS ARE ON FIRE 🔥
While some are sleeping, the market is making big moves:
🟢 AMD +11.04%
🟢 SPCX +8.62%
🟢 MU +5.12%
🟢 NVDA +2.78%
🔴 AAPL -0.52%
AMD is leading with double-digit gains. Who else is loading up on chips and tech?
Have you already jumped in, or are you still watching from the sidelines? 👀
#AMD #NVDA #Acciones #BinanceSquare $AMD.US
$NVDAB
$SPCX
While some are sleeping, the market is making big moves:
🟢 AMD +11.04%
🟢 SPCX +8.62%
🟢 MU +5.12%
🟢 NVDA +2.78%
🔴 AAPL -0.52%
AMD is leading with double-digit gains. Who else is loading up on chips and tech?
Have you already jumped in, or are you still watching from the sidelines? 👀
#AMD #NVDA #Acciones #BinanceSquare $AMD.US
$NVDAB
$SPCX
212
Log in to explore more content
Join global crypto users on Binance Square
⚡️ Get latest and useful information about crypto.
💬 Trusted by the world’s largest crypto exchange.
👍 Discover real insights from verified creators.
Email / Phone number
Trending Topics
1
#NvidiaInvestigatesAfterHuang’sAffairApology
86,214 views
972 Discussing
2
#BitcoinFiveWeeklyLosses
109,368 views
1,439 Discussing
3
#AIChipSlumpNasdaq
55,161 views
889 Discussing
4
#CPITestsDecemberRateOutlook
538,467 views
2,306 Discussing
5
#AnthropicRejectsIPODelayValuationinQuestion
7,603 views
166 Discussing
6
#CryptoLiquidationsReach$1.16BIn24Hours
131 views
8 Discussing
7
#EUInstitutionsInviteIndustryToSetTokenizedSecuritiesStandards
93 views
3 Discussing
8
#ChinaCACListsFiveIssuesAffectingBlockchainFilings
1,373 views
42 Discussing
9
#UKBanksCanNowApplyToConductCryptoAssetBusiness
1,317 views
32 Discussing
10
#AmundiAdds$72.3MInStrategyShares
427 views
10 Discussing