
Mohanad Yaman
181 Posts

Mohanad Yaman
Report
Block User
Growth investor. Concentrated portfolio in AI infrastructure, semiconductors, healthcare innovation and energy.

BTC Holder
Occasional Trader
4.9 Years
1 Following
345 Followers
168 Liked
Posts
All
Quotes
·
--
Bullish
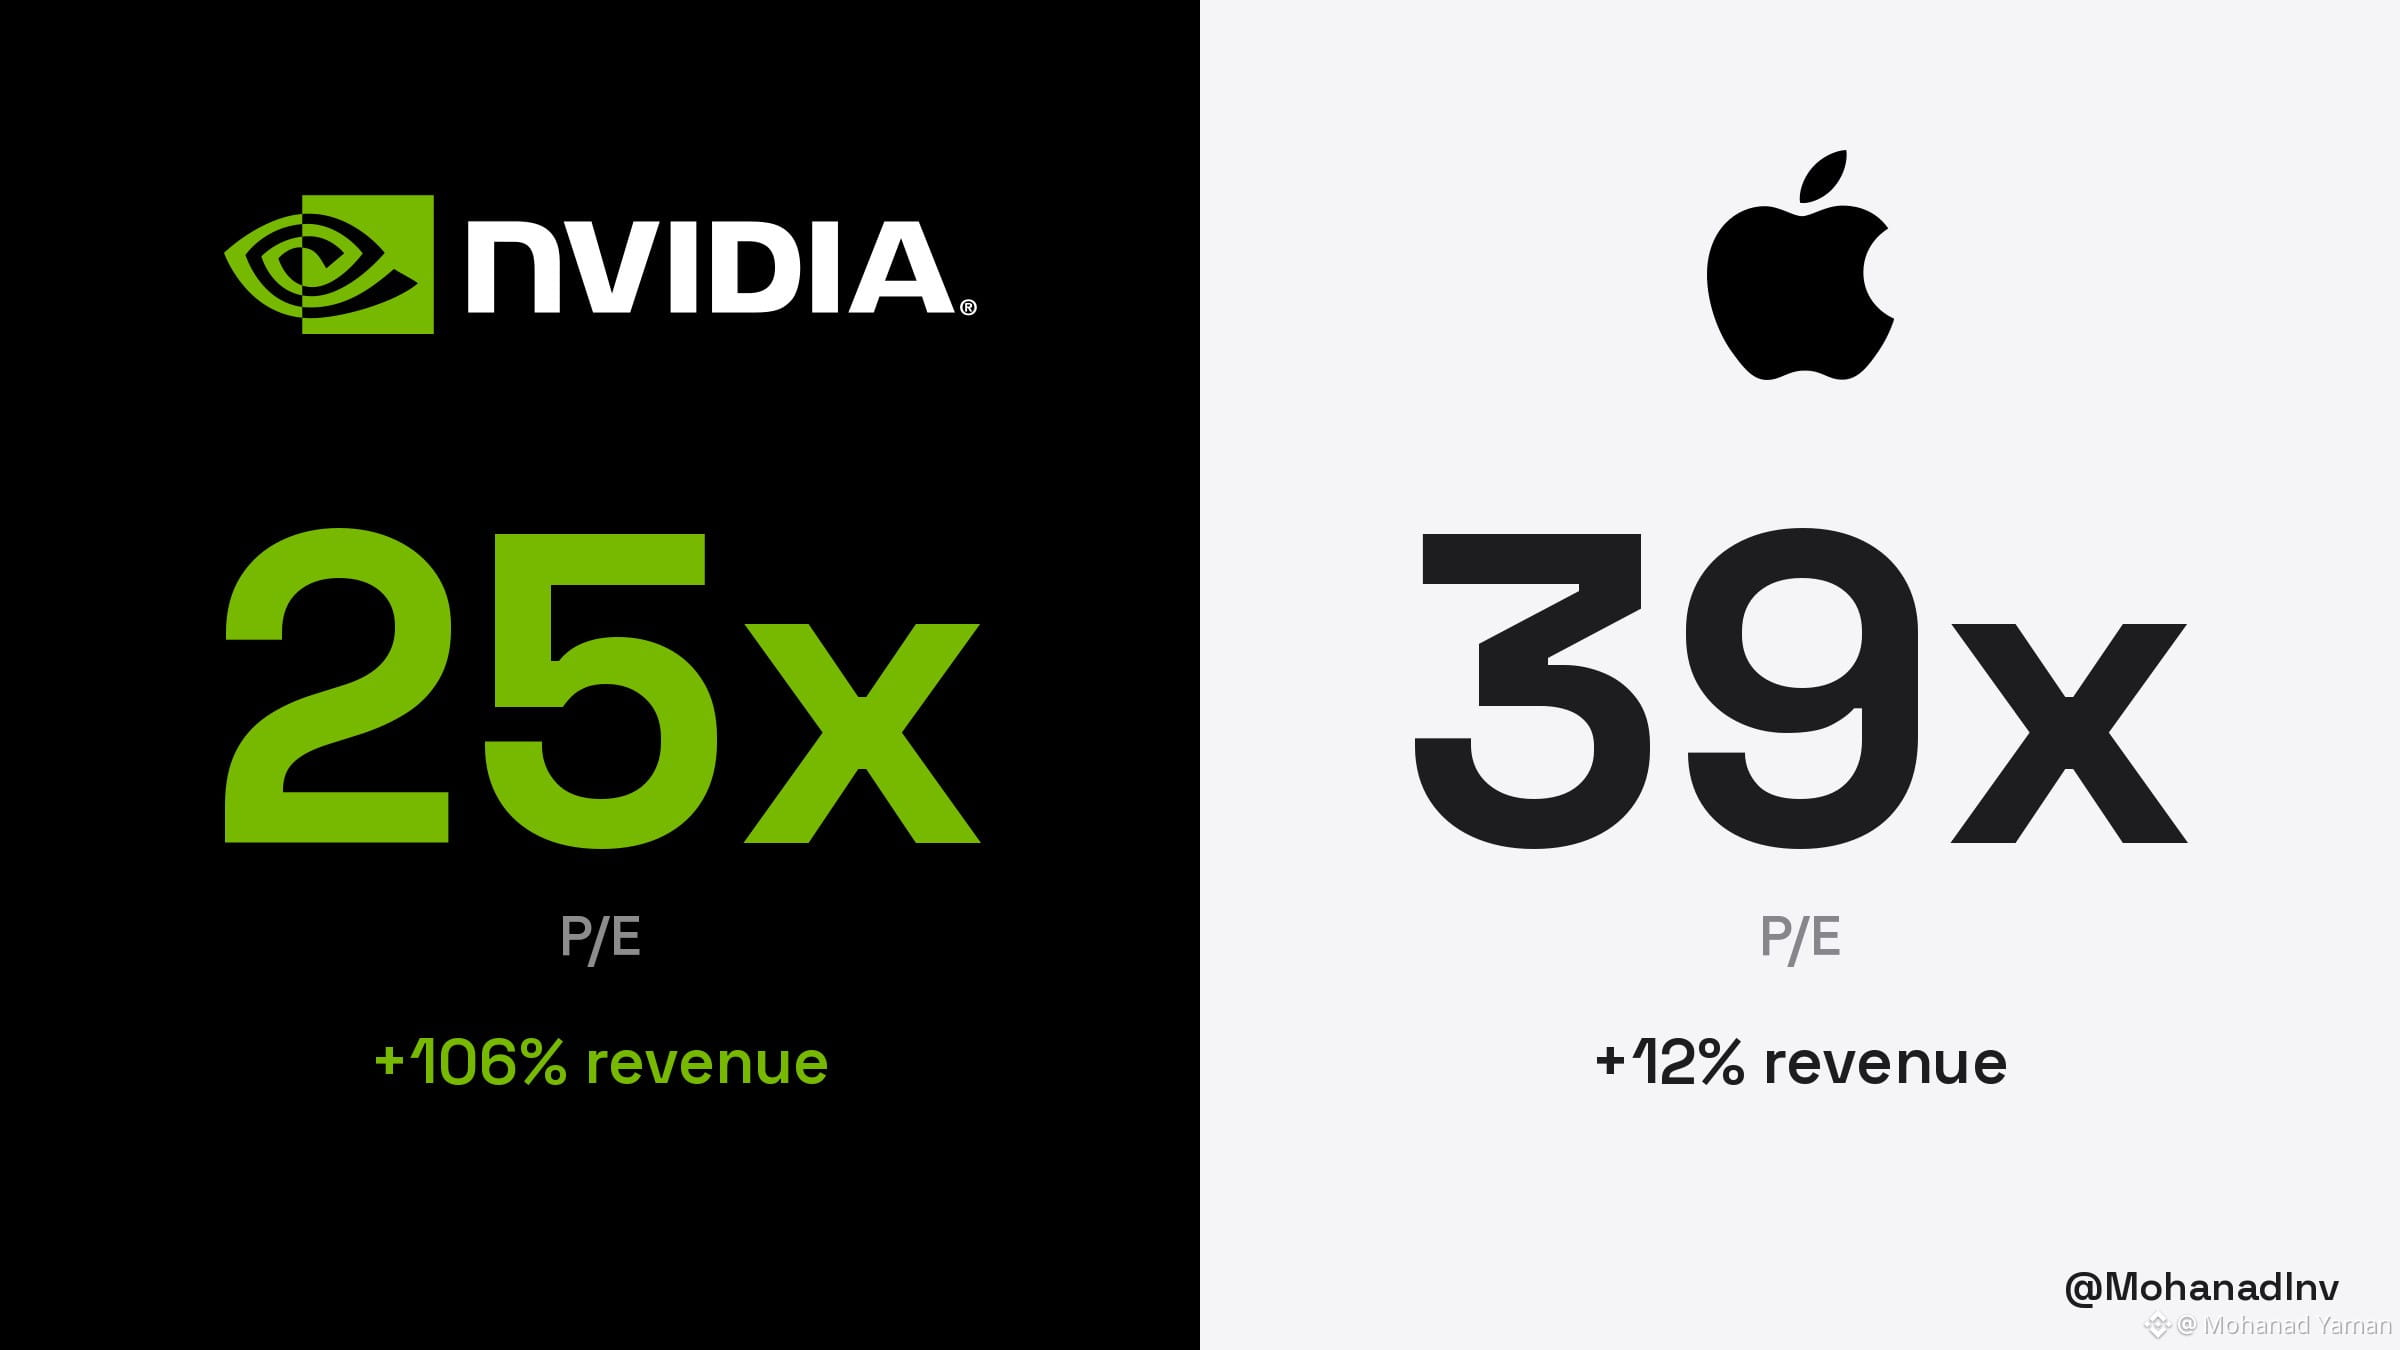
🍏 $AAPL trades at 38.9x trailing GAAP earnings. $NVDA
trades at 25.3x.
📈 Last quarter Apple grew revenue 11.7%. Nvidia grew it 105.9% 🔥
🤔 You're paying more per dollar of profit for the slower grower. Quality premium or overpaying?
#stocks
{spot}(NVDABUSDT)
🍏 $AAPL trades at 38.9x trailing GAAP earnings. $NVDA
trades at 25.3x.
📈 Last quarter Apple grew revenue 11.7%. Nvidia grew it 105.9% 🔥
🤔 You're paying more per dollar of profit for the slower grower. Quality premium or overpaying?
#stocks
trades at 25.3x.
📈 Last quarter Apple grew revenue 11.7%. Nvidia grew it 105.9% 🔥
🤔 You're paying more per dollar of profit for the slower grower. Quality premium or overpaying?
#stocks
111
·
--
Bullish
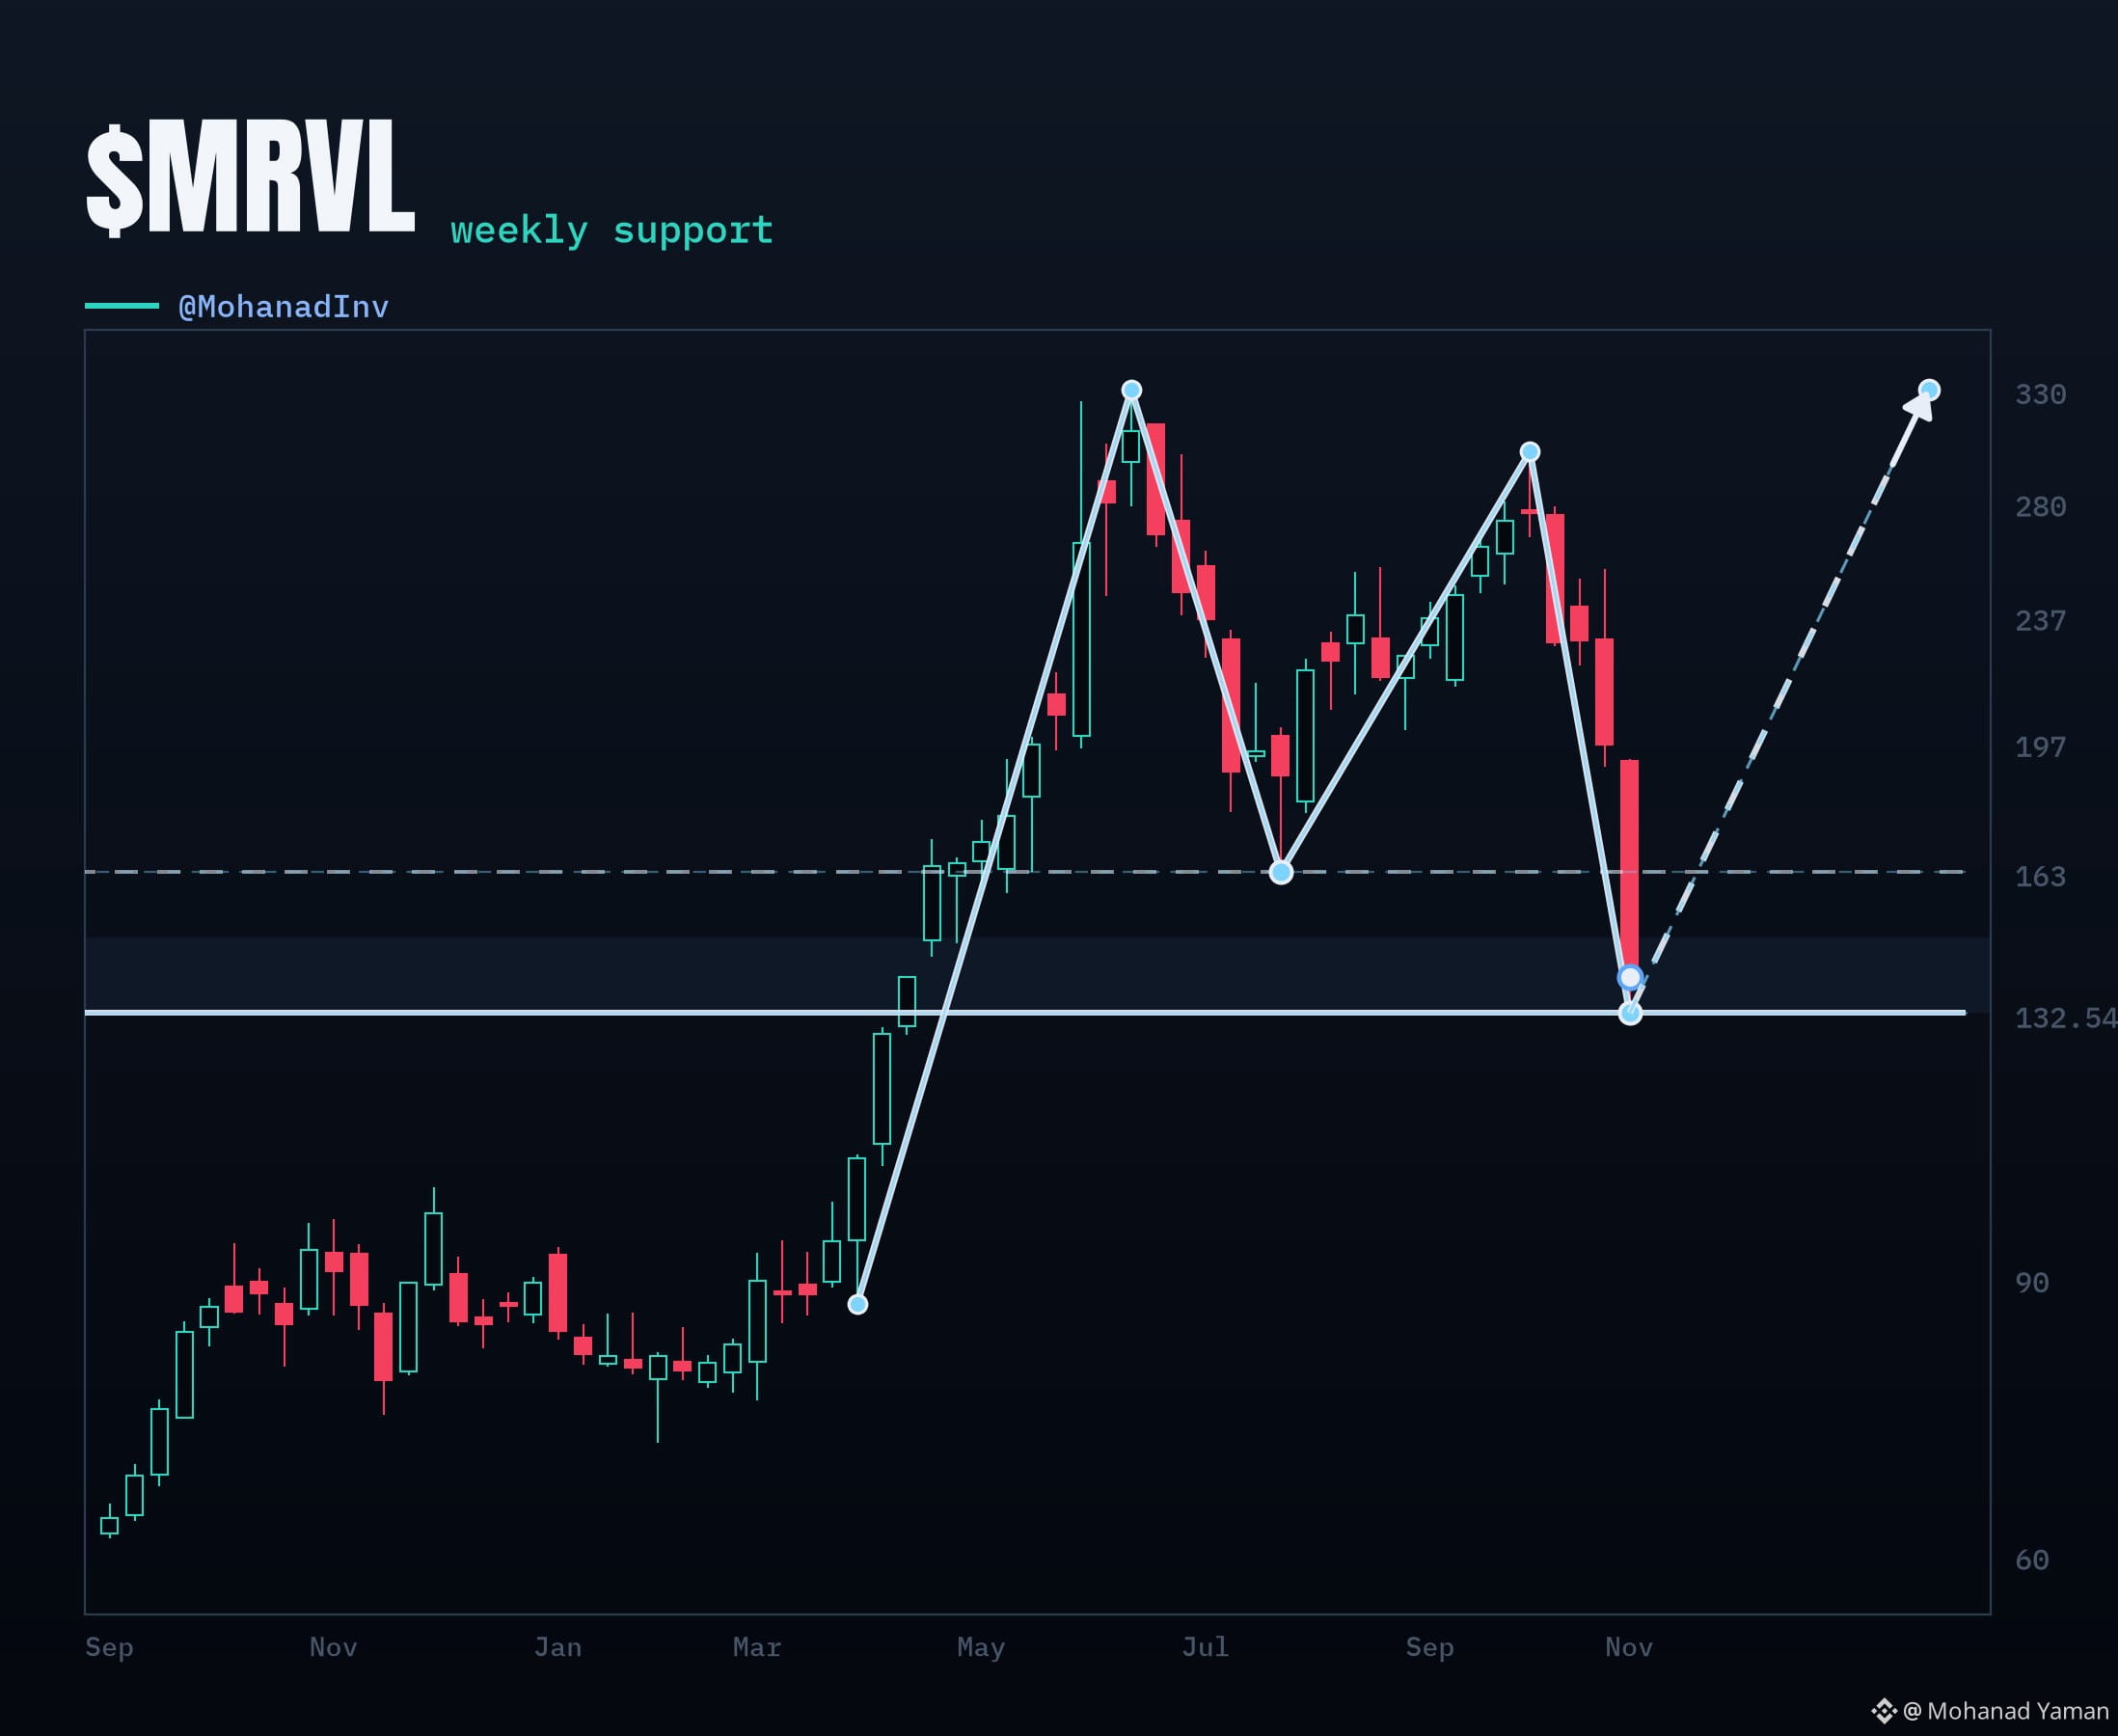
📈 $MRVL testing its weekly support levels 👀
📉 Down 60% from the $329.88 ATH
Hold from here or keep sliding? 🤔
✅️ Tagged $132.54 this week · Live $139.66
⛔️ Invalid under $132.54
Weekly reclaim $196.99 to $236.82 first then ask me questions 😅
Educational only · NFA
#stocks
{spot}(MRVLBUSDT)
📈 $MRVL testing its weekly support levels 👀
📉 Down 60% from the $329.88 ATH
Hold from here or keep sliding? 🤔
✅️ Tagged $132.54 this week · Live $139.66
⛔️ Invalid under $132.54
Weekly reclaim $196.99 to $236.82 first then ask me questions 😅
Educational only · NFA
#stocks
📉 Down 60% from the $329.88 ATH
Hold from here or keep sliding? 🤔
✅️ Tagged $132.54 this week · Live $139.66
⛔️ Invalid under $132.54
Weekly reclaim $196.99 to $236.82 first then ask me questions 😅
Educational only · NFA
#stocks
54
·
--
Bullish
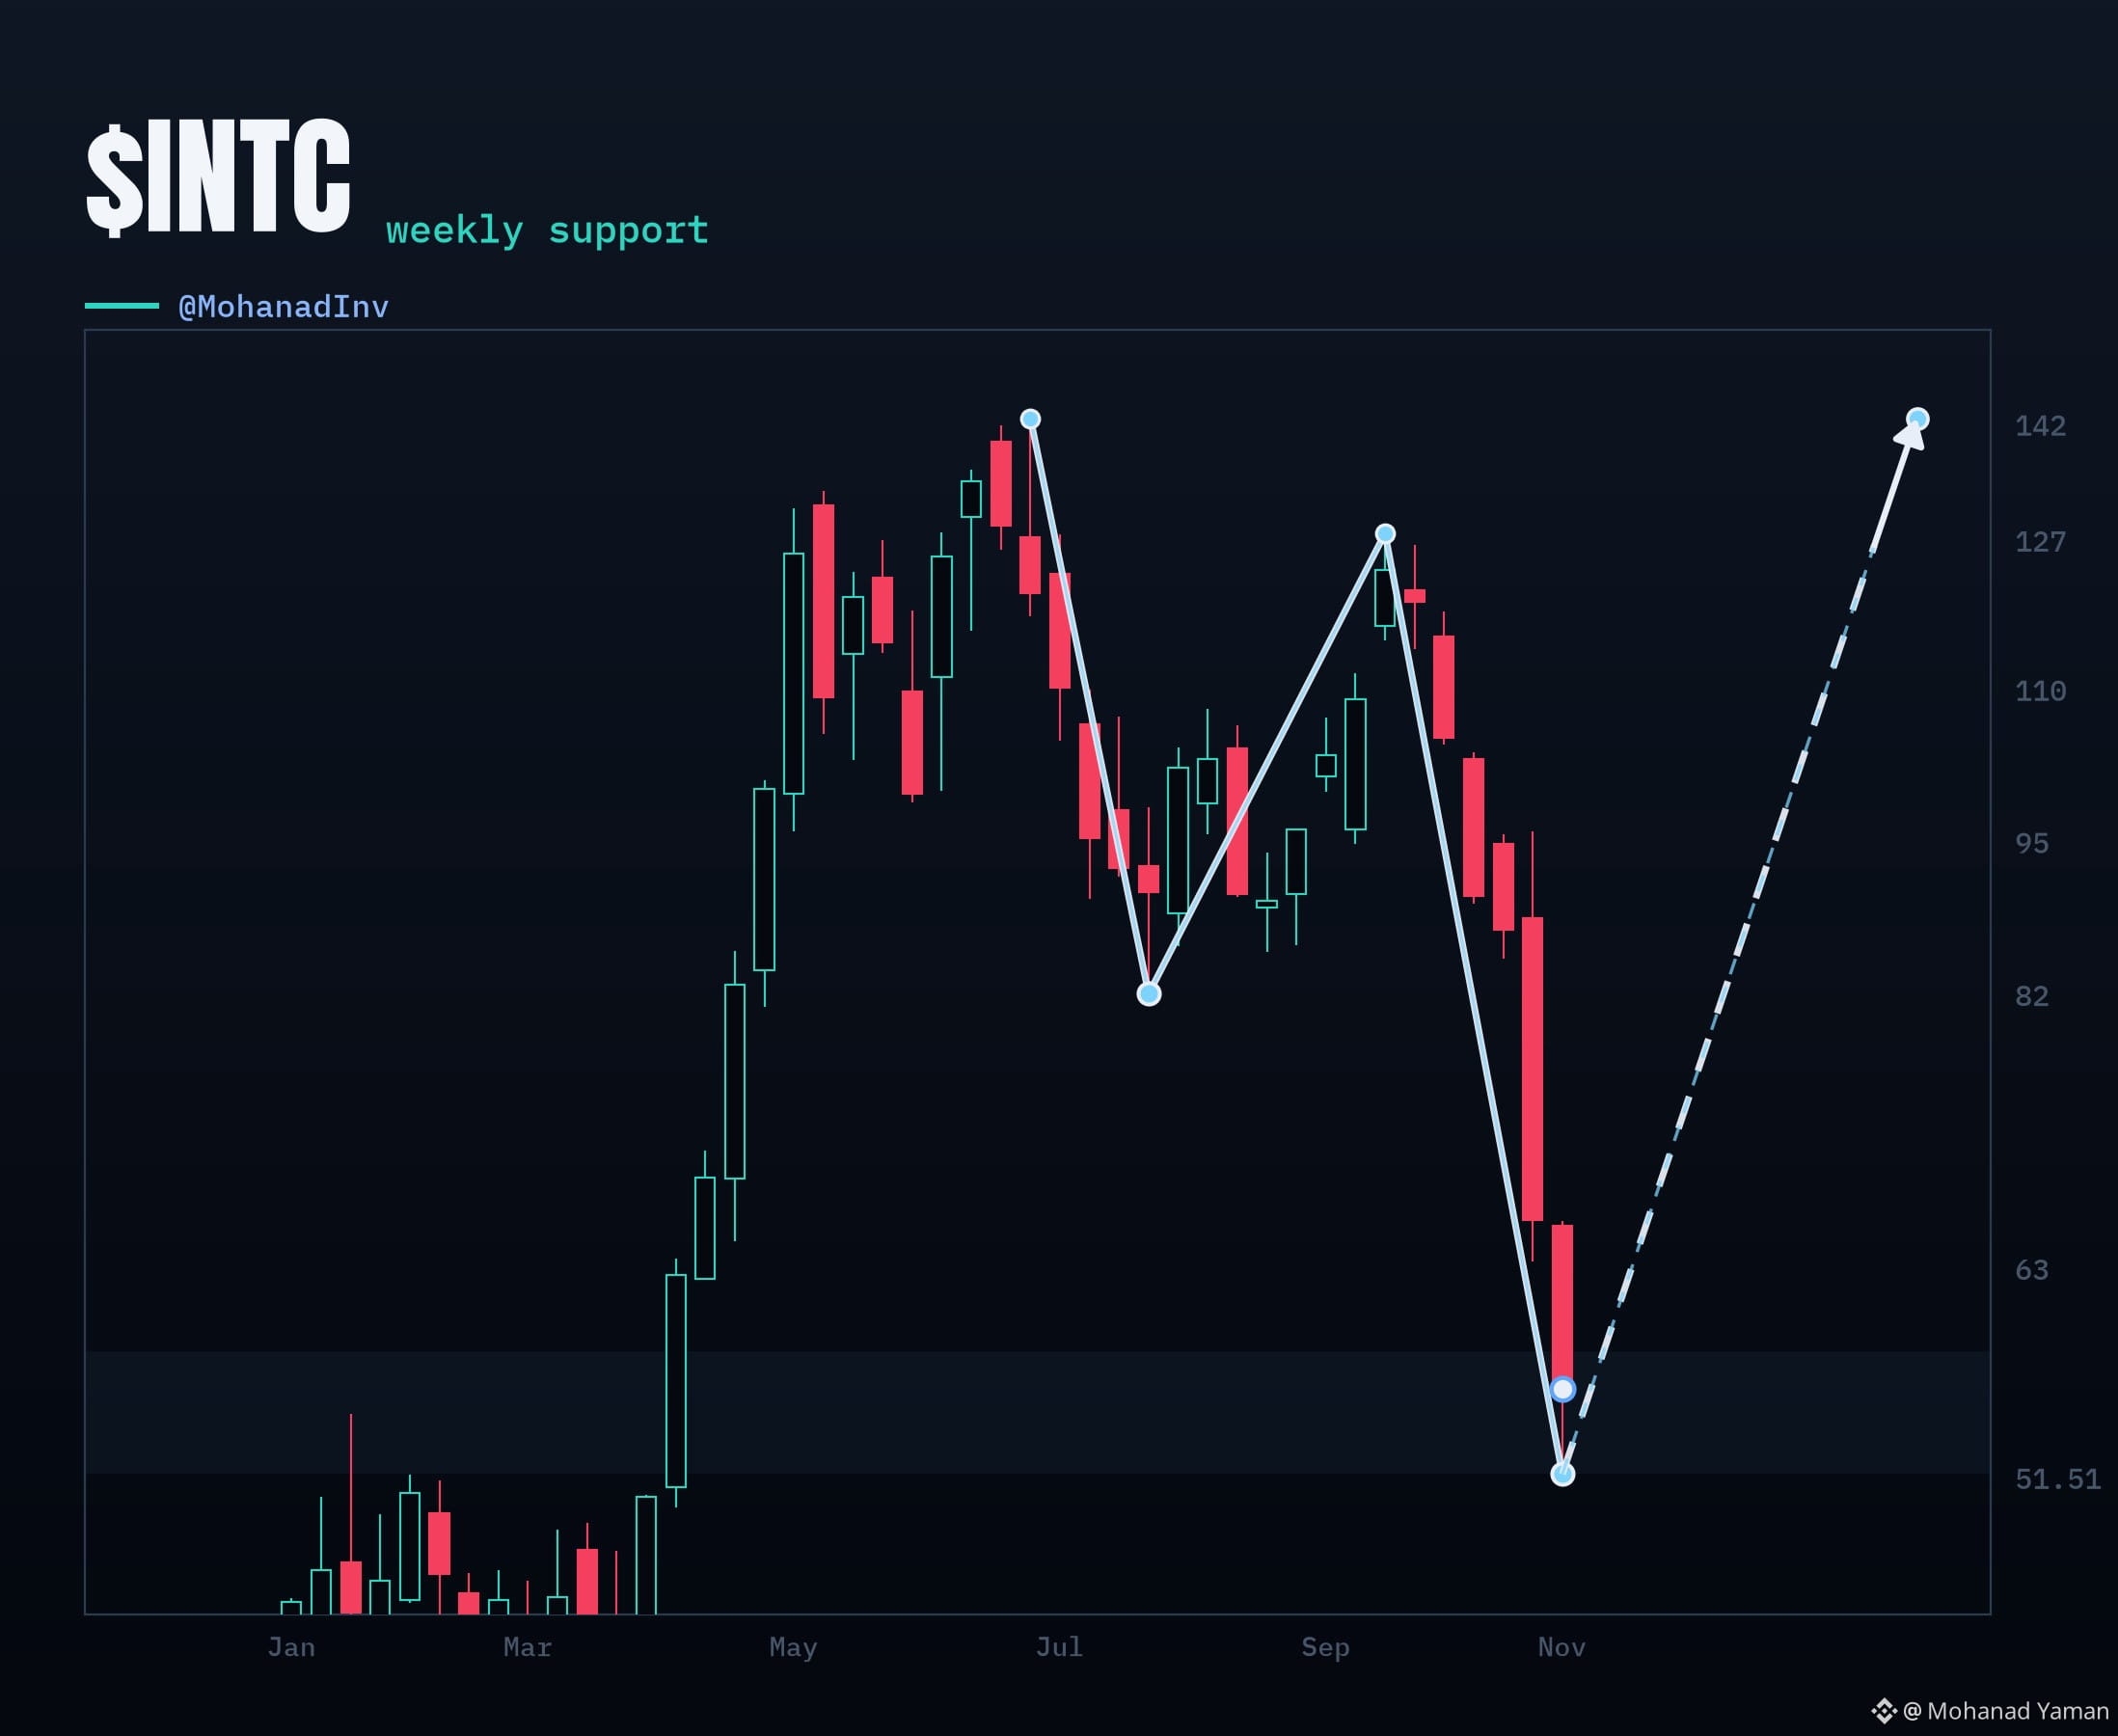
📈 $INTC back to where it all started 👀
🔥 Big selloff after the ATH blowoff
Full circle · now what? 🤔
✅️ Tagged $51.51 this week · Live $55.95
⛔️ Invalid under $51.51
Weekly reclaim $65.72 to $95.68 first then we talk!
Educational only · NFA
#stocks
{spot}(INTCBUSDT)
📈 $INTC back to where it all started 👀
🔥 Big selloff after the ATH blowoff
Full circle · now what? 🤔
✅️ Tagged $51.51 this week · Live $55.95
⛔️ Invalid under $51.51
Weekly reclaim $65.72 to $95.68 first then we talk!
Educational only · NFA
#stocks
🔥 Big selloff after the ATH blowoff
Full circle · now what? 🤔
✅️ Tagged $51.51 this week · Live $55.95
⛔️ Invalid under $51.51
Weekly reclaim $65.72 to $95.68 first then we talk!
Educational only · NFA
#stocks
257
·
--
Bullish
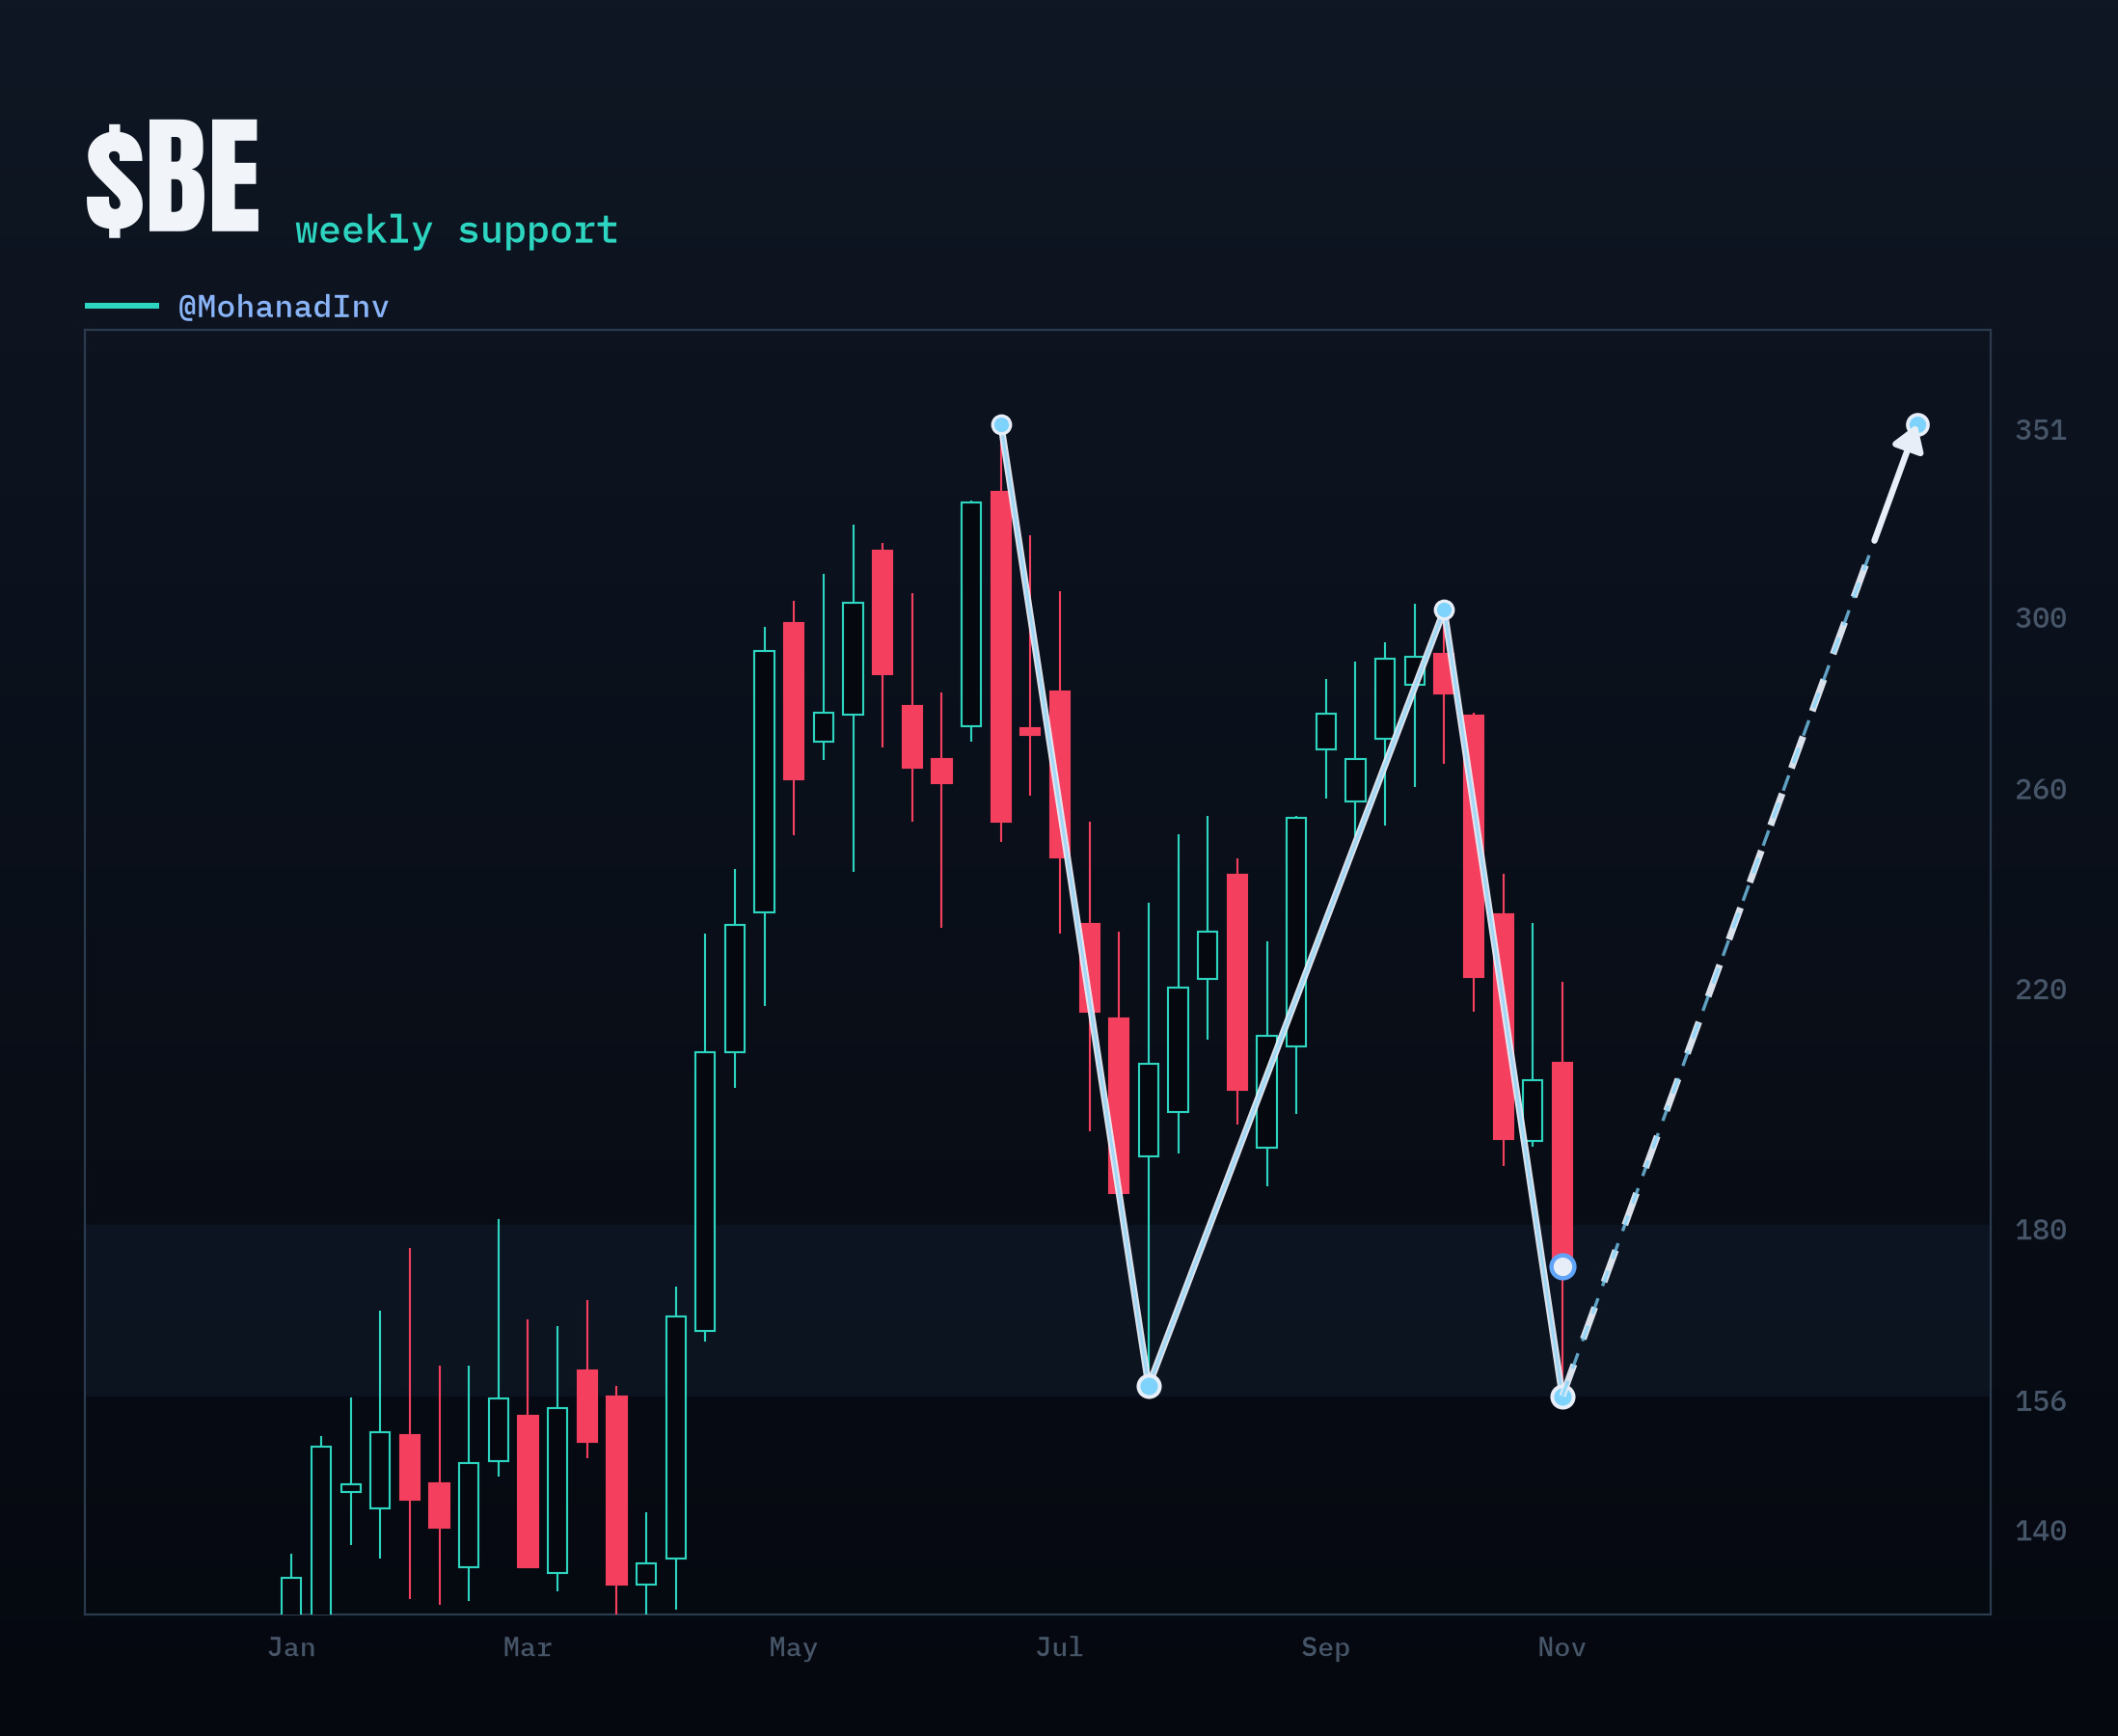
📈 $BE weekly double bottom on the Jul shelf 👀
🔥 Big selloff after the ATH blowoff
Will we ever see a bounce from here? 🤔
✅️ From $157.33 Jul shelf · ATH was $351.28. Tagged $156.00 this week · Live $173.89
⛔️ Invalid under $156
Weekly reclaim $220.50 to $300.80 first · then talk setups
Educational only · NFA
#stocks
{future}(BEUSDT)
📈 $BE weekly double bottom on the Jul shelf 👀
🔥 Big selloff after the ATH blowoff
Will we ever see a bounce from here? 🤔
✅️ From $157.33 Jul shelf · ATH was $351.28. Tagged $156.00 this week · Live $173.89
⛔️ Invalid under $156
Weekly reclaim $220.50 to $300.80 first · then talk setups
Educational only · NFA
#stocks
🔥 Big selloff after the ATH blowoff
Will we ever see a bounce from here? 🤔
✅️ From $157.33 Jul shelf · ATH was $351.28. Tagged $156.00 this week · Live $173.89
⛔️ Invalid under $156
Weekly reclaim $220.50 to $300.80 first · then talk setups
Educational only · NFA
#stocks
1
30
·
--
Bullish
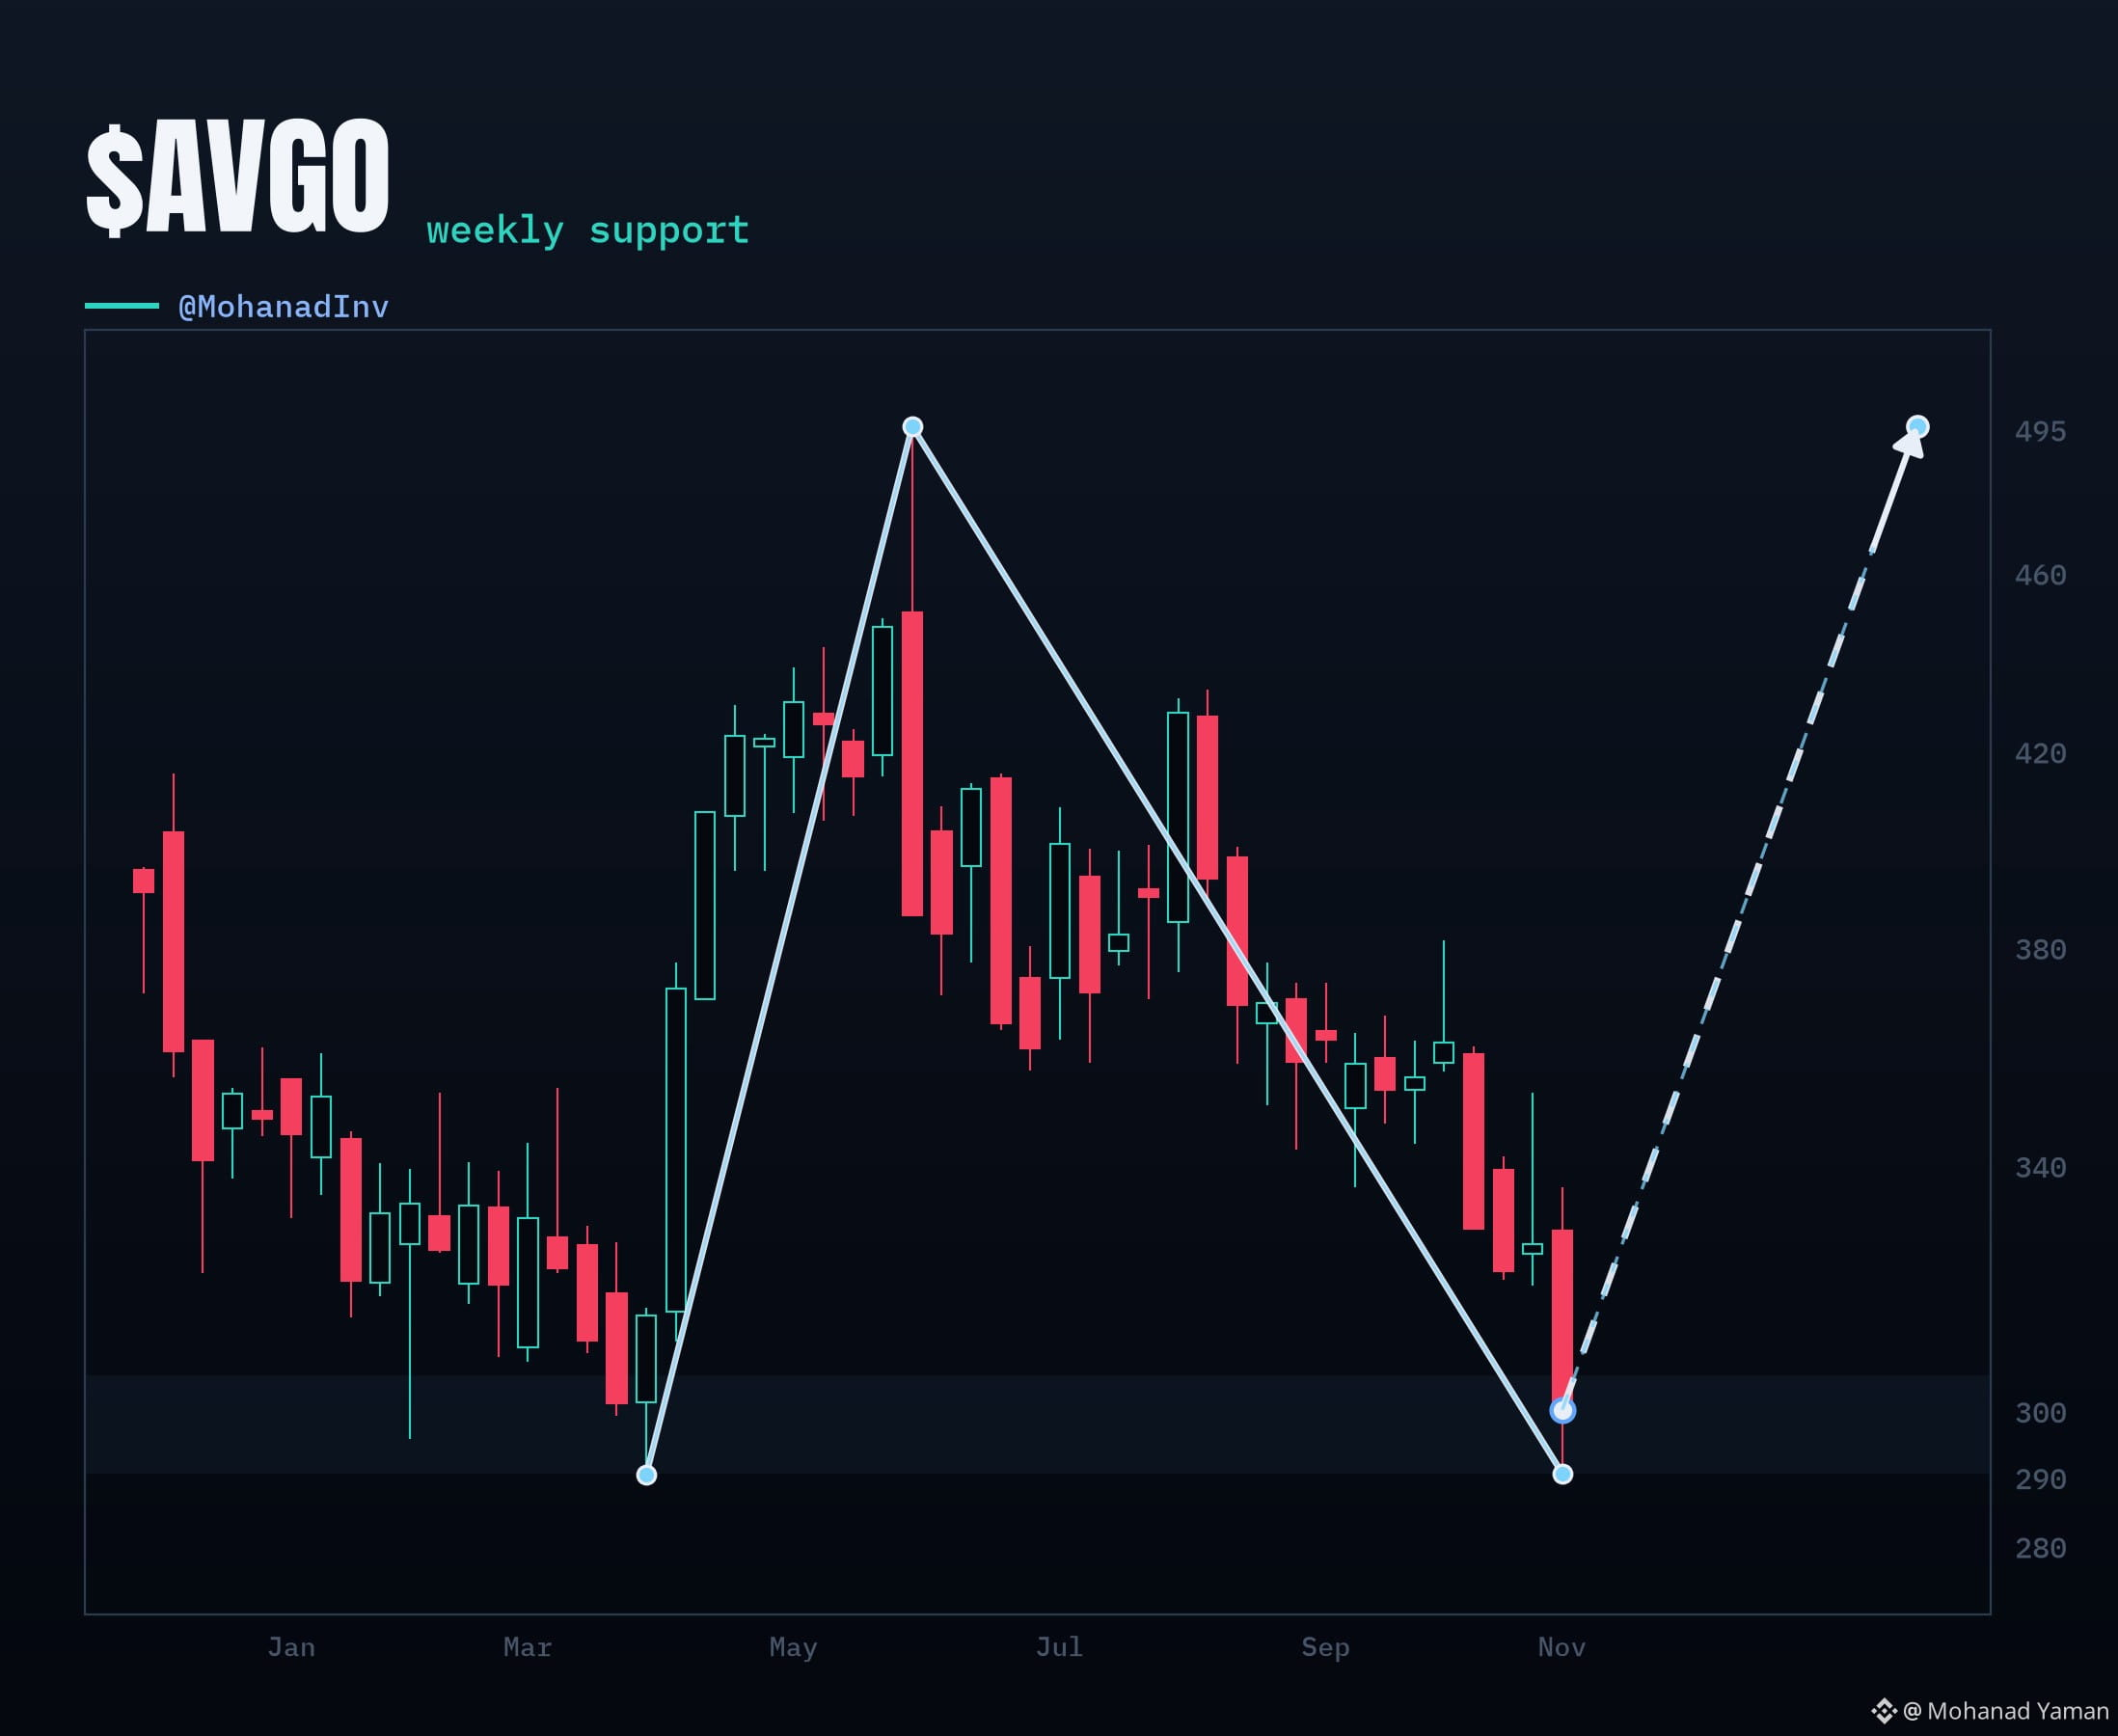
📈 $AVGO sitting on the Mar shelf 👀
✅️ Big selloff. Held over $290.12 this week
📍 From $289.96 up to $495.00 ATH
⬇️ Back to $290.12 this week
📌 Live $299.74 · Invalid under $290.12 📉
Weekly reclaim $368.38 to $416.74 first · then talk setups
Educational only · NFA
#stocks
{spot}(AVGOBUSDT)
📈 $AVGO sitting on the Mar shelf 👀
✅️ Big selloff. Held over $290.12 this week
📍 From $289.96 up to $495.00 ATH
⬇️ Back to $290.12 this week
📌 Live $299.74 · Invalid under $290.12 📉
Weekly reclaim $368.38 to $416.74 first · then talk setups
Educational only · NFA
#stocks
✅️ Big selloff. Held over $290.12 this week
📍 From $289.96 up to $495.00 ATH
⬇️ Back to $290.12 this week
📌 Live $299.74 · Invalid under $290.12 📉
Weekly reclaim $368.38 to $416.74 first · then talk setups
Educational only · NFA
#stocks
77
·
--
Bullish
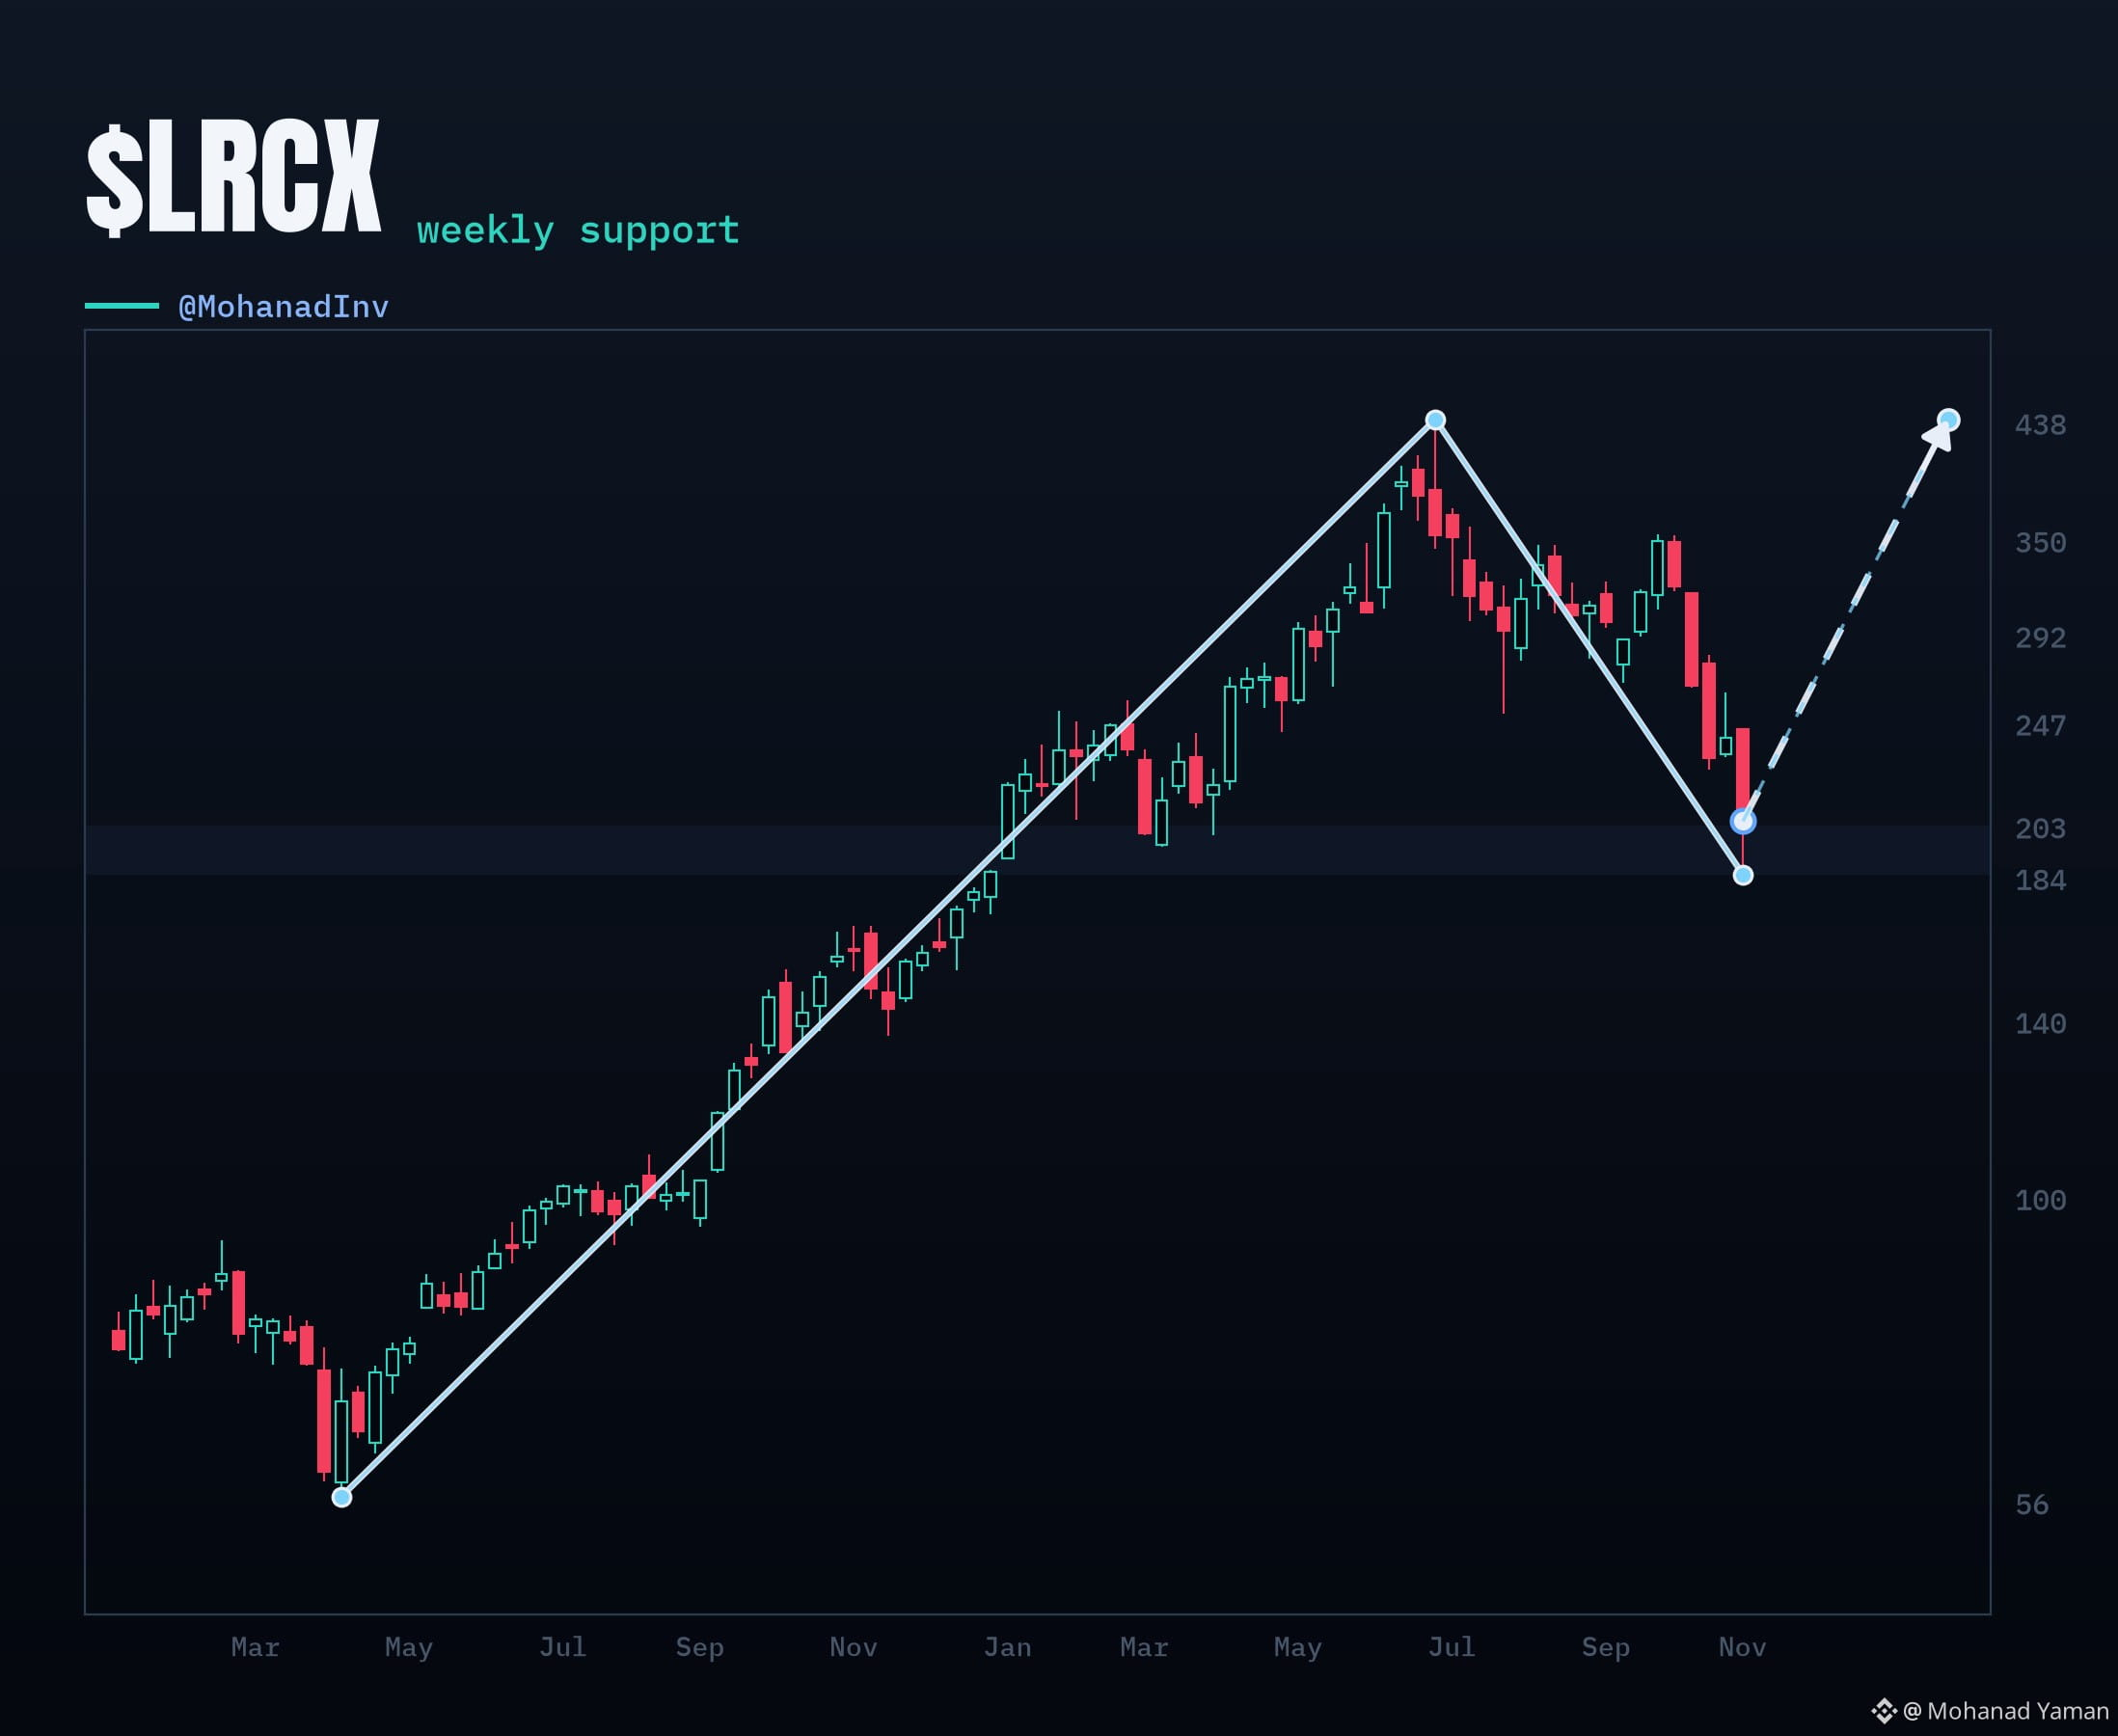
📈 $LRCX weekly chart testing the floor 👀
Deep selloff into support. Hold or break from here? 🤔
Apr low $56.32 → Jun ATH $438.50
This week tagged $184.24 = 66.5% retrace
Under $184.24 we 📉
No clean setup until a weekly reclaim of $247.41 to $292.51
Educational only · NFA
#stocks
{future}(LRCXUSDT)
📈 $LRCX weekly chart testing the floor 👀
Deep selloff into support. Hold or break from here? 🤔
Apr low $56.32 → Jun ATH $438.50
This week tagged $184.24 = 66.5% retrace
Under $184.24 we 📉
No clean setup until a weekly reclaim of $247.41 to $292.51
Educational only · NFA
#stocks
Deep selloff into support. Hold or break from here? 🤔
Apr low $56.32 → Jun ATH $438.50
This week tagged $184.24 = 66.5% retrace
Under $184.24 we 📉
No clean setup until a weekly reclaim of $247.41 to $292.51
Educational only · NFA
#stocks
60
·
--
Bullish
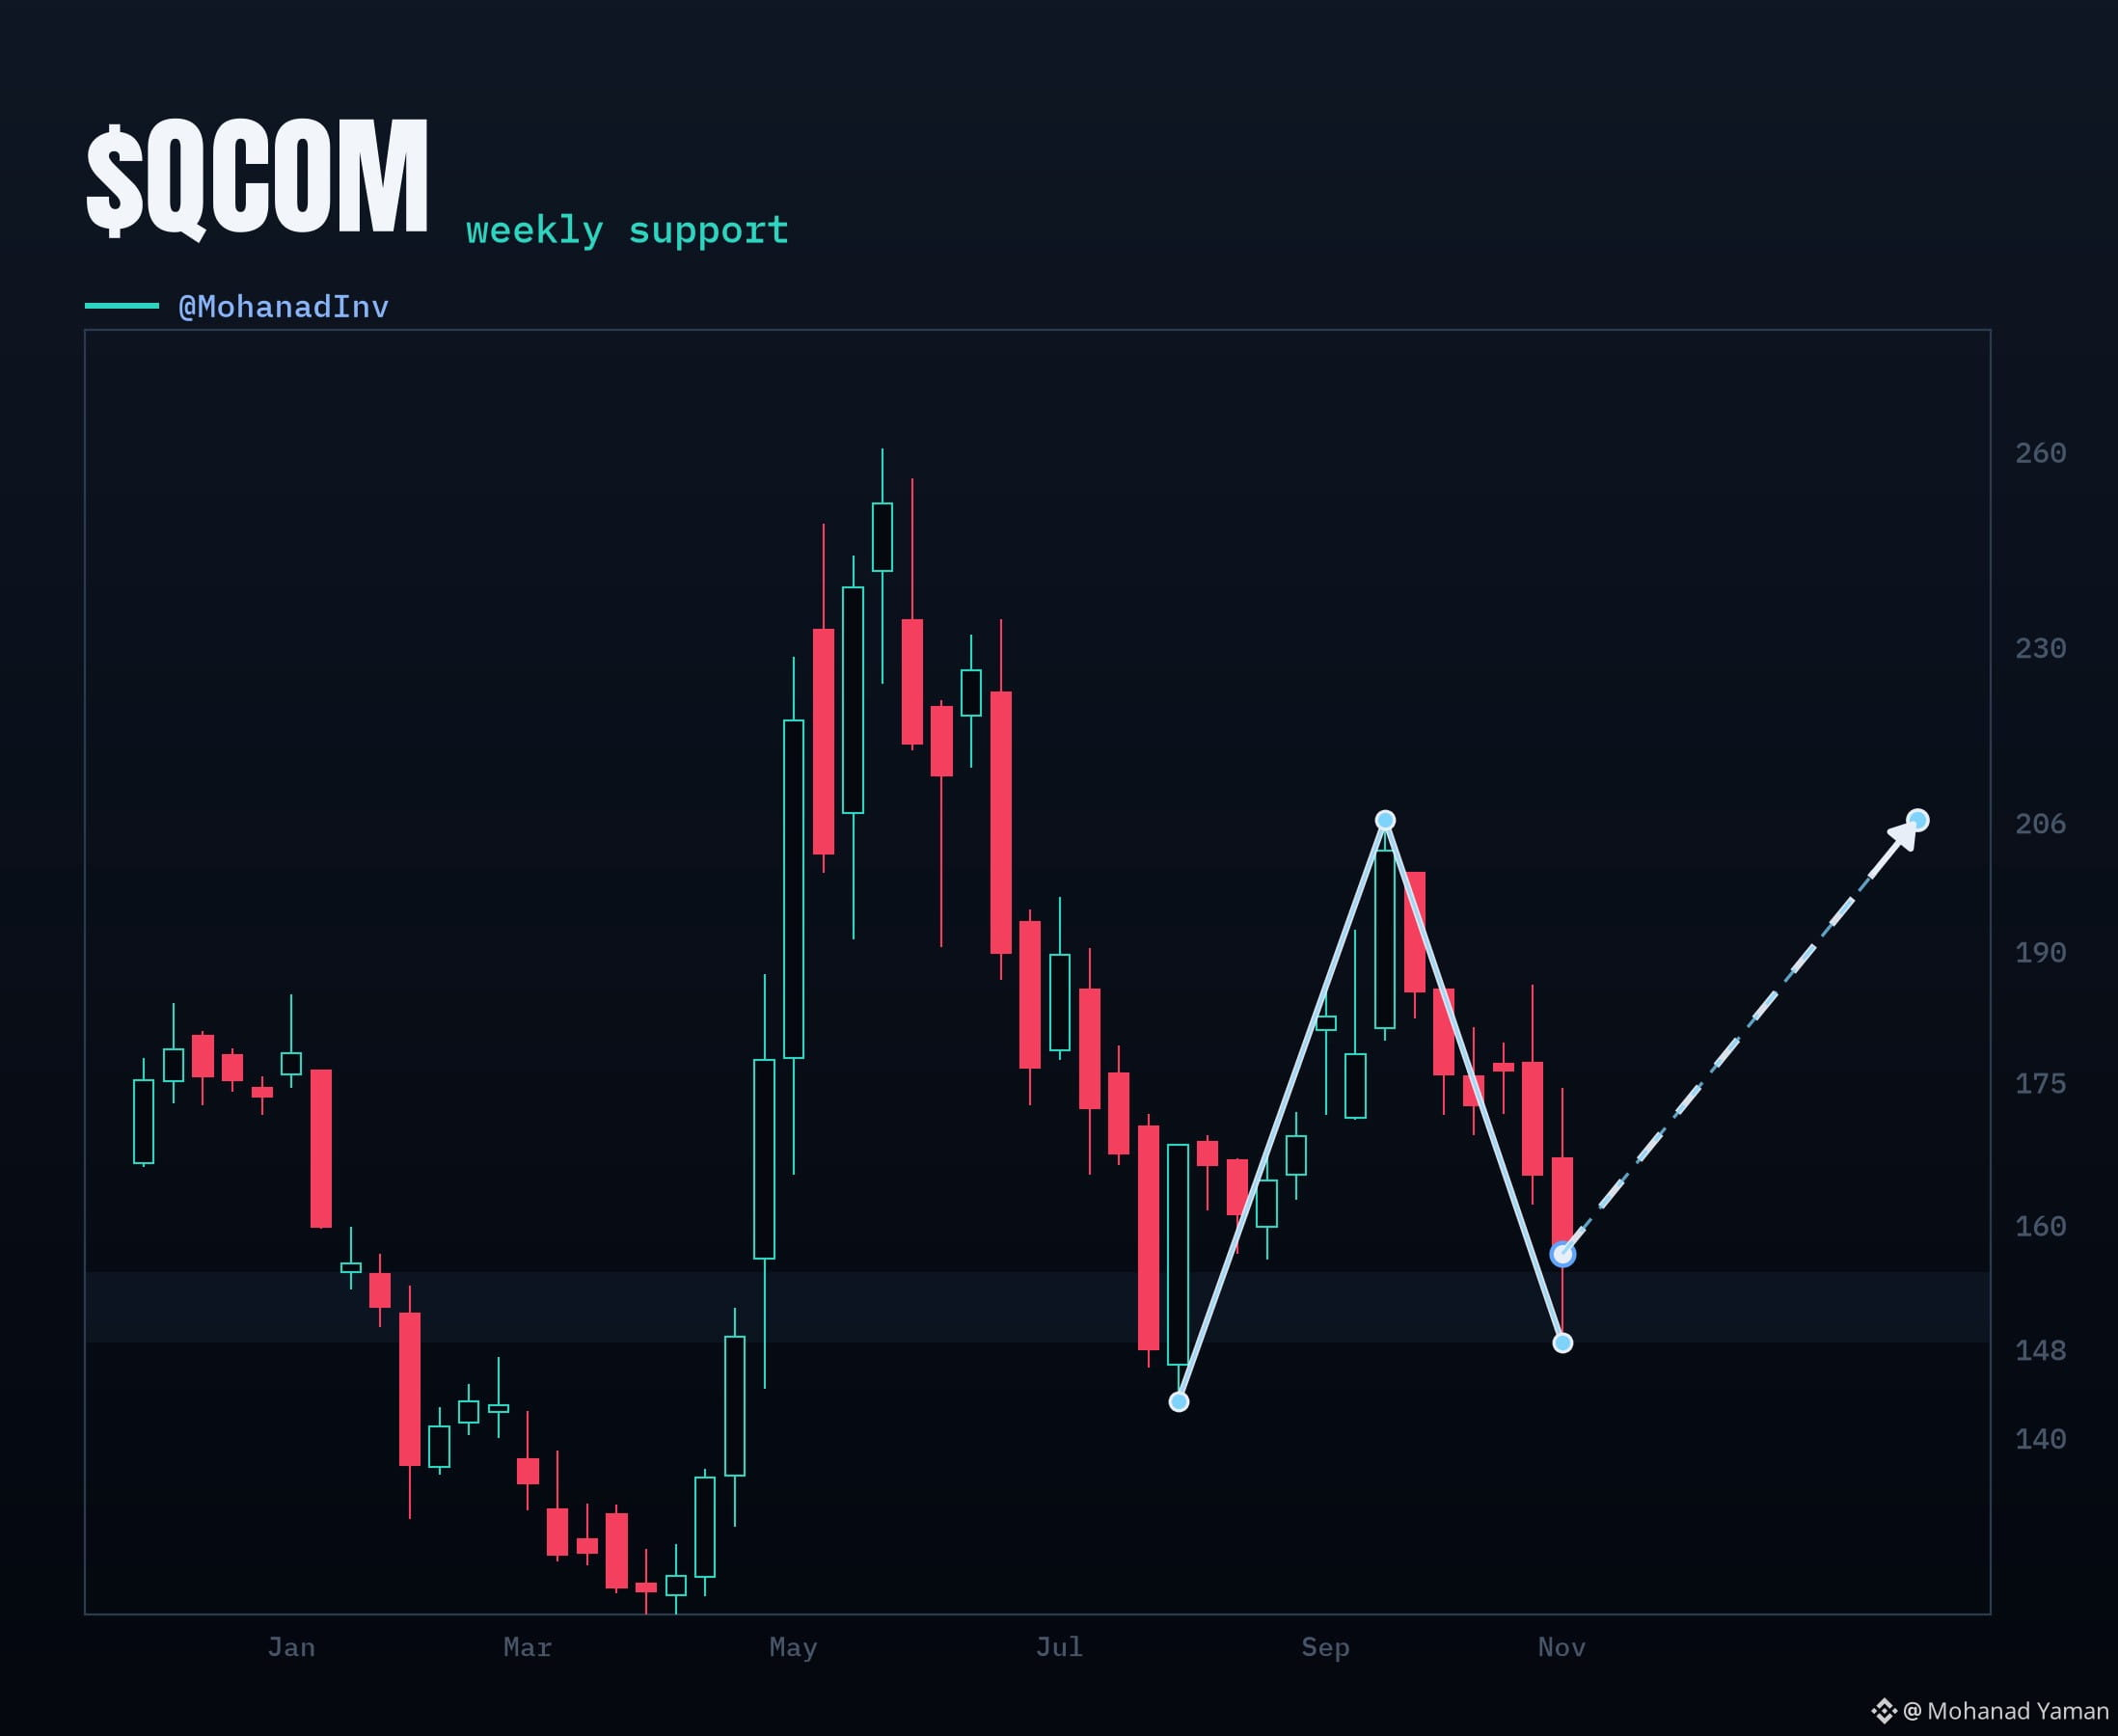
📈 $QCOM weekly chart testing the floor 👀
Deep selloff into support. Hold or break from here? 🤔
Aug low $142.89 → Sep high $205.85
This week tagged $148.25 = 91.5% retrace
Under $148.25 we 📉
No clean setup until a weekly reclaim of $174.37 to $187.16
Educational only · NFA
#stocks
{spot}(QCOMBUSDT)
📈 $QCOM weekly chart testing the floor 👀
Deep selloff into support. Hold or break from here? 🤔
Aug low $142.89 → Sep high $205.85
This week tagged $148.25 = 91.5% retrace
Under $148.25 we 📉
No clean setup until a weekly reclaim of $174.37 to $187.16
Educational only · NFA
#stocks
Deep selloff into support. Hold or break from here? 🤔
Aug low $142.89 → Sep high $205.85
This week tagged $148.25 = 91.5% retrace
Under $148.25 we 📉
No clean setup until a weekly reclaim of $174.37 to $187.16
Educational only · NFA
#stocks
49
·
--
Bullish
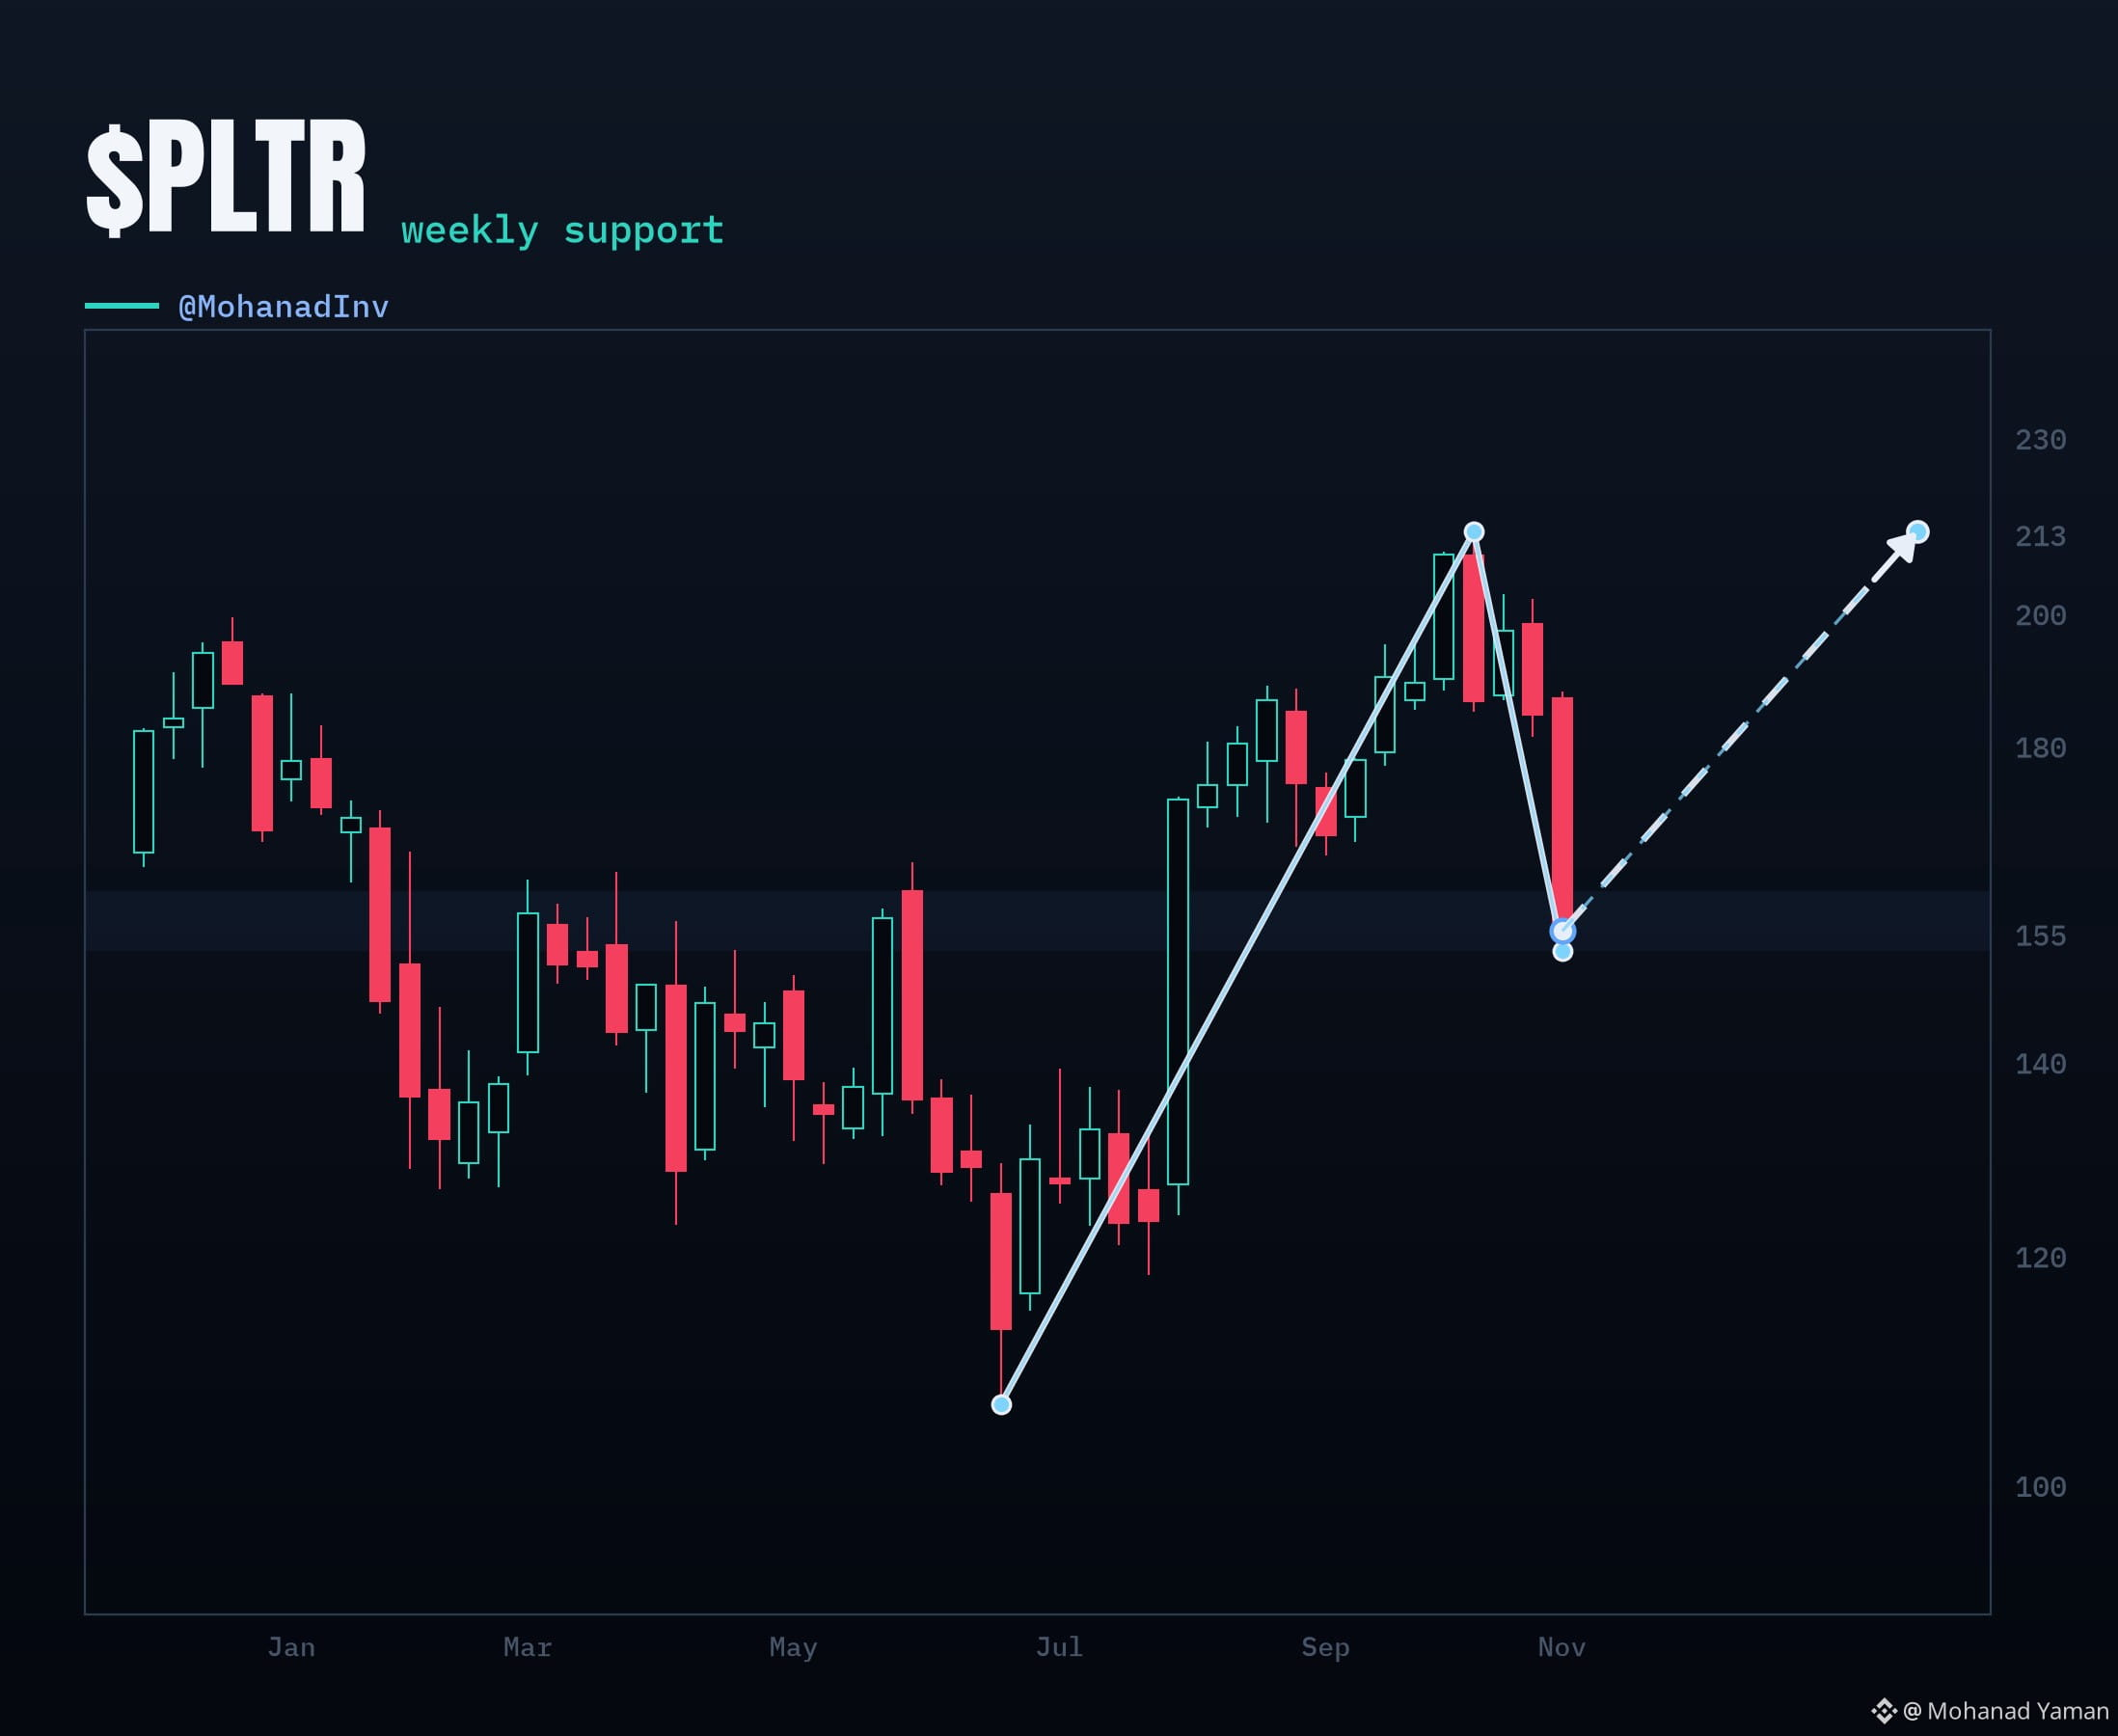
📈 $PLTR weekly chart sitting on support 👀
Jun $106.37 → Oct ATH $212.94
This week tagged $152.60 · 57% off that run
Close $154.99 · Soft $152.60
No clean setup until a weekly reclaim of $180–$188.37
Educational only · NFA
#stocks
{spot}(PLTRBUSDT)
📈 $PLTR weekly chart sitting on support 👀
Jun $106.37 → Oct ATH $212.94
This week tagged $152.60 · 57% off that run
Close $154.99 · Soft $152.60
No clean setup until a weekly reclaim of $180–$188.37
Educational only · NFA
#stocks
Jun $106.37 → Oct ATH $212.94
This week tagged $152.60 · 57% off that run
Close $154.99 · Soft $152.60
No clean setup until a weekly reclaim of $180–$188.37
Educational only · NFA
#stocks
2
522
·
--
Bullish
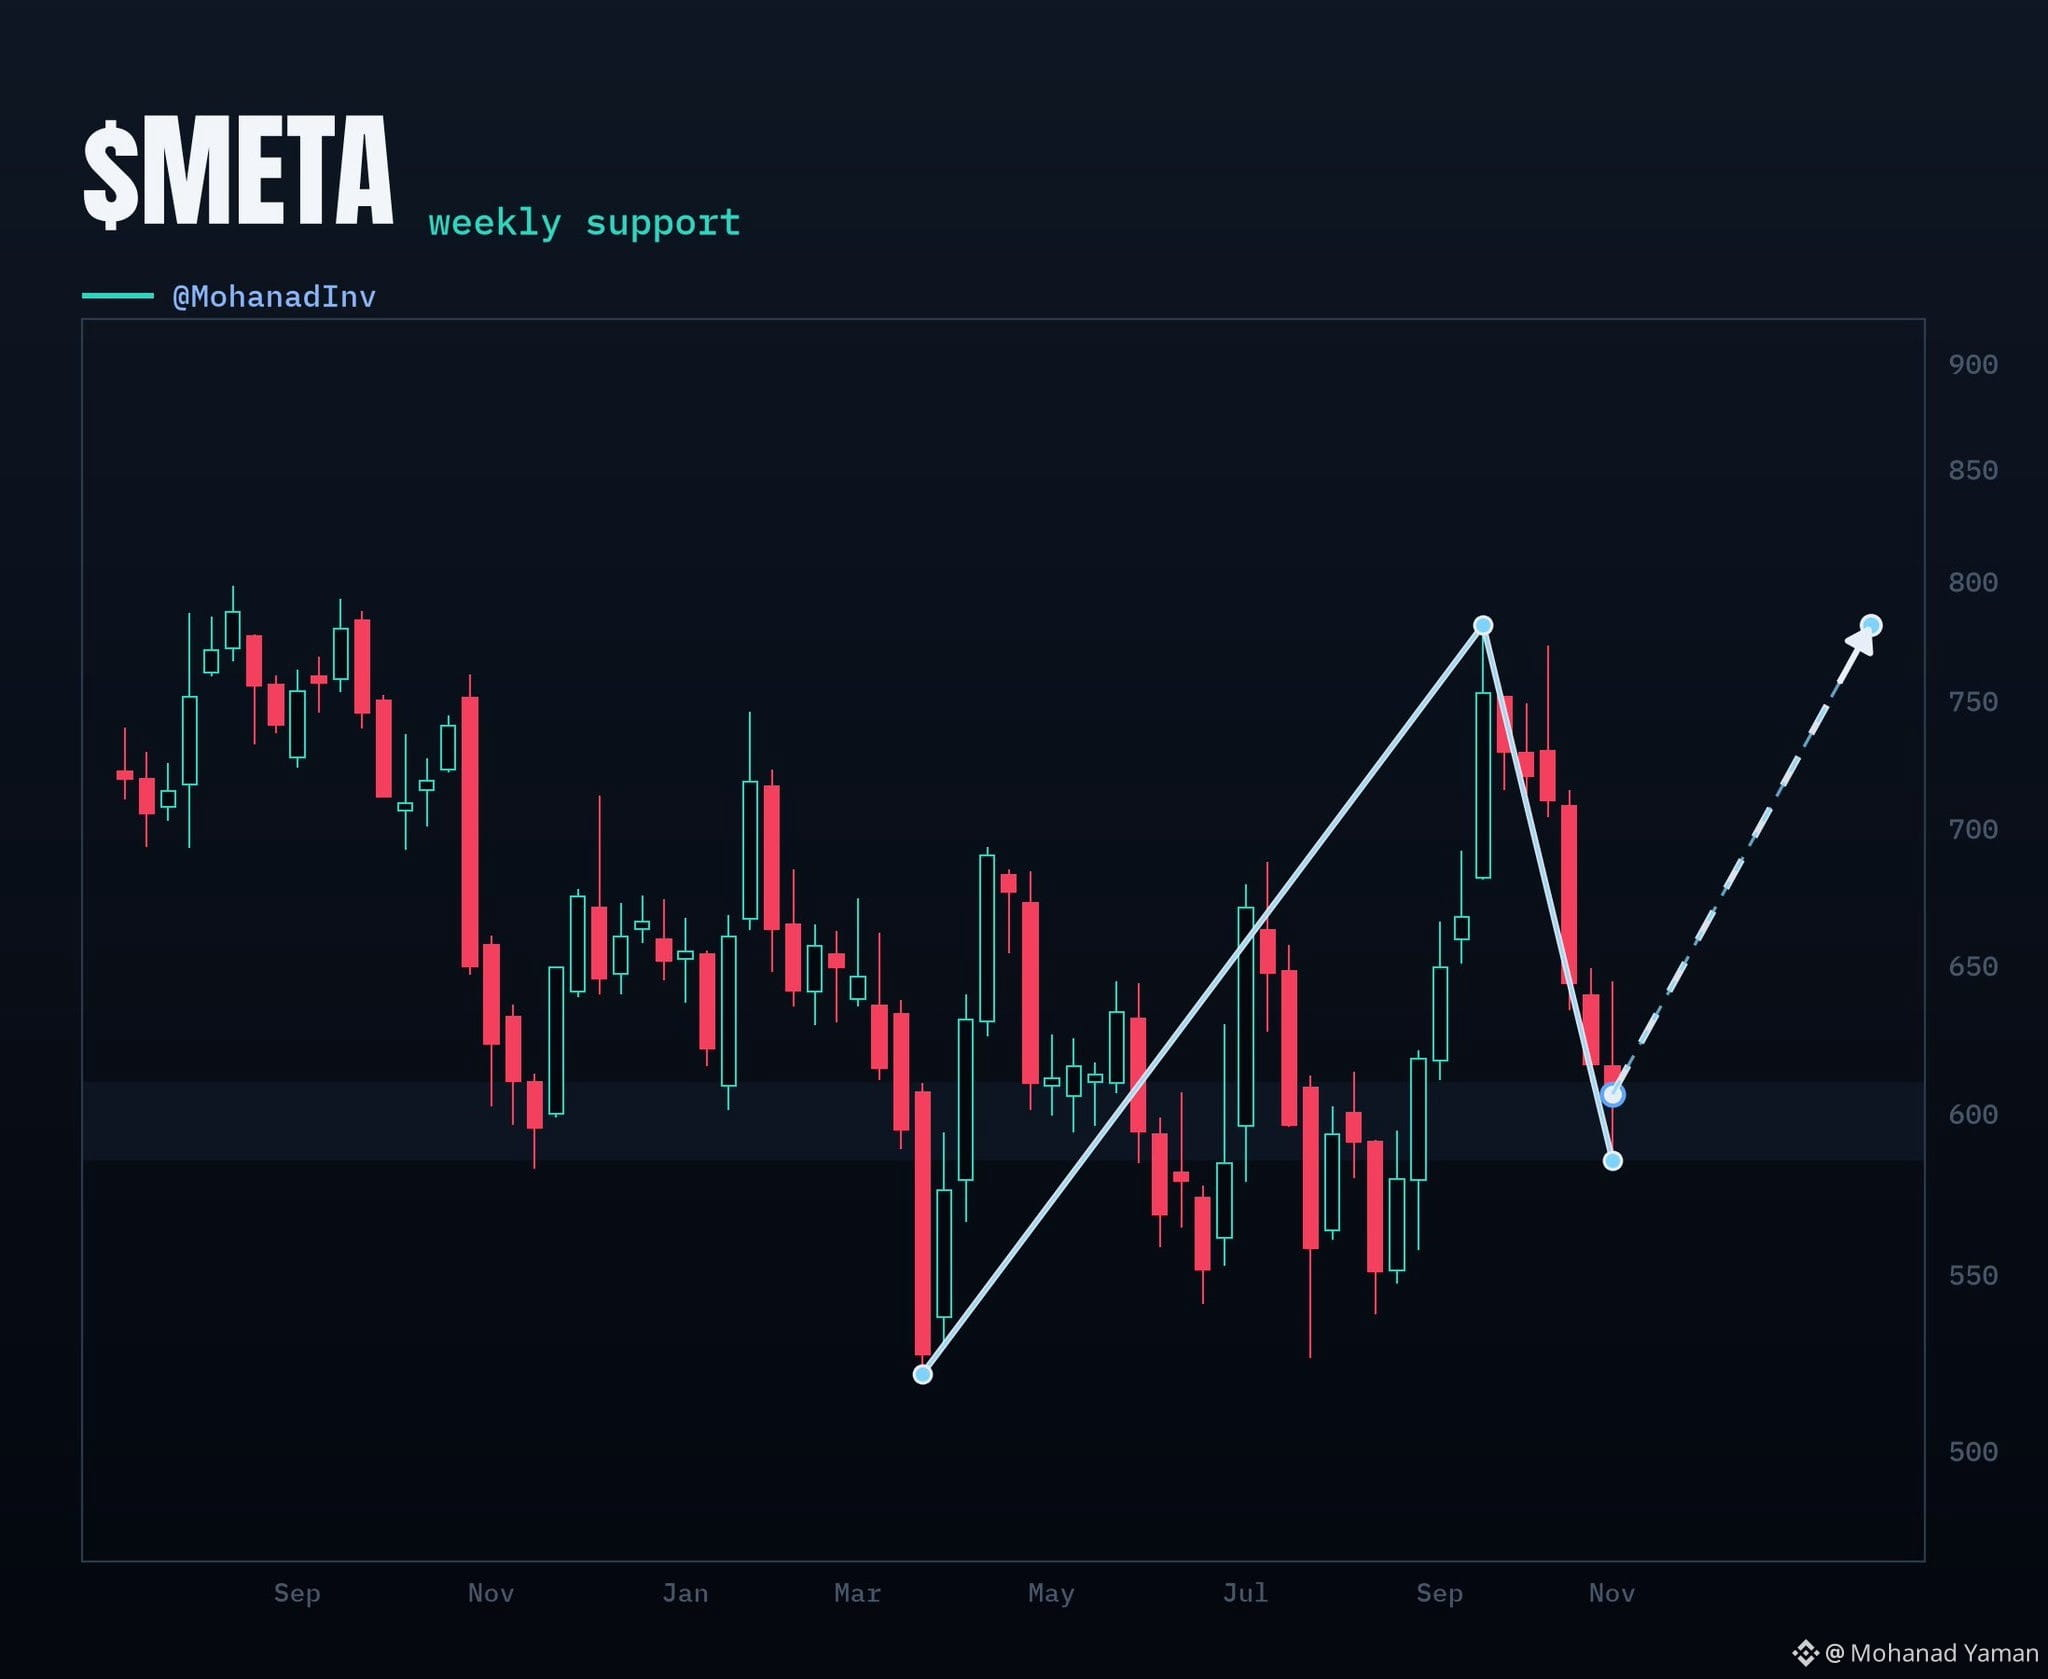
📈 $META weekly chart sitting on support 👀
I like this chart now what do you think?
Mar low $520.26 → Sep high $779.82
This week tagged $583.80 = 75.5% retrace
Close $605.08 · still under weekly Confirm $609 📉
Educational only · NFA
#stocks
{spot}(METABUSDT)
📈 $META weekly chart sitting on support 👀
I like this chart now what do you think?
Mar low $520.26 → Sep high $779.82
This week tagged $583.80 = 75.5% retrace
Close $605.08 · still under weekly Confirm $609 📉
Educational only · NFA
#stocks
I like this chart now what do you think?
Mar low $520.26 → Sep high $779.82
This week tagged $583.80 = 75.5% retrace
Close $605.08 · still under weekly Confirm $609 📉
Educational only · NFA
#stocks
1
513
·
--
Bullish
Verified
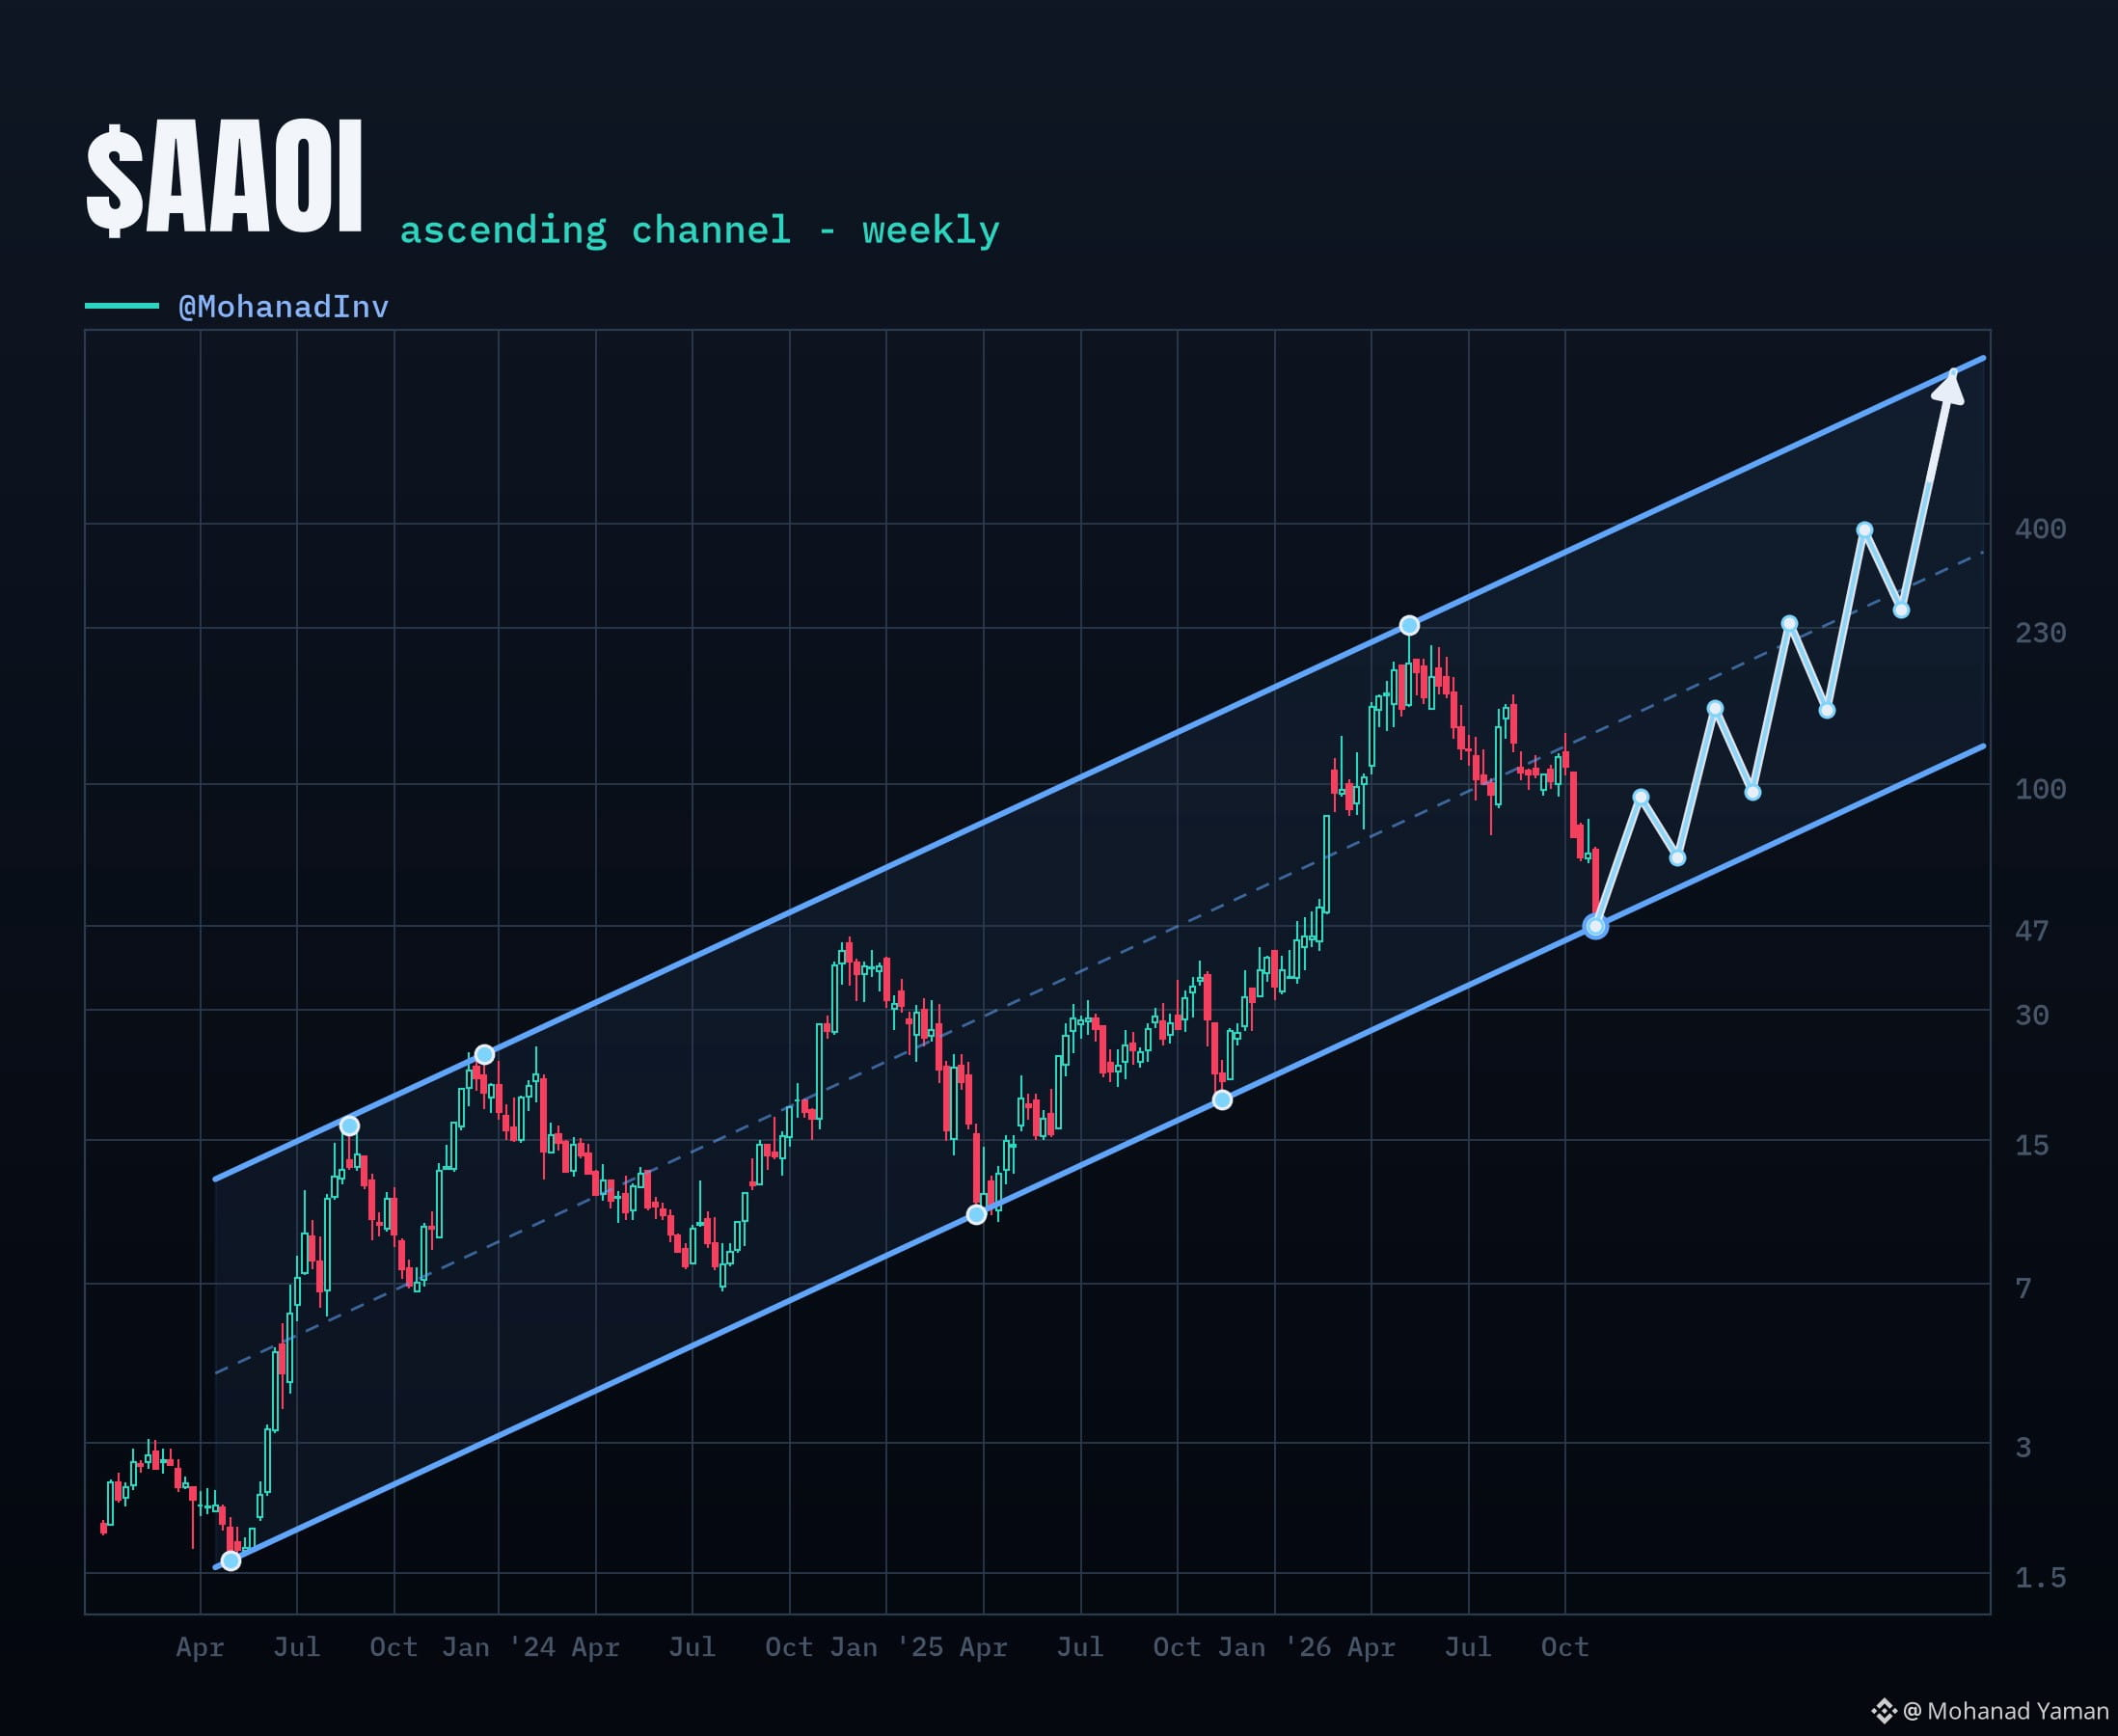
📈 $AAOI just tagged the weekly channel floor 👀
Same weekly ascending channel from $1.60 that ran it to $233 (+14,500%)
This week −34% into the rail · 80% off the ATH 📉
Sitting ON the lower rail. Floor test, not a breakdown ✅
Are we going to Mars? 🚀🪐
Educational post only · NFA
#stocks
{spot}(AAOIBUSDT)
📈 $AAOI just tagged the weekly channel floor 👀
Same weekly ascending channel from $1.60 that ran it to $233 (+14,500%)
This week −34% into the rail · 80% off the ATH 📉
Sitting ON the lower rail. Floor test, not a breakdown ✅
Are we going to Mars? 🚀🪐
Educational post only · NFA
#stocks
Same weekly ascending channel from $1.60 that ran it to $233 (+14,500%)
This week −34% into the rail · 80% off the ATH 📉
Sitting ON the lower rail. Floor test, not a breakdown ✅
Are we going to Mars? 🚀🪐
Educational post only · NFA
#stocks
1
2
890
·
--
Bullish
Verified
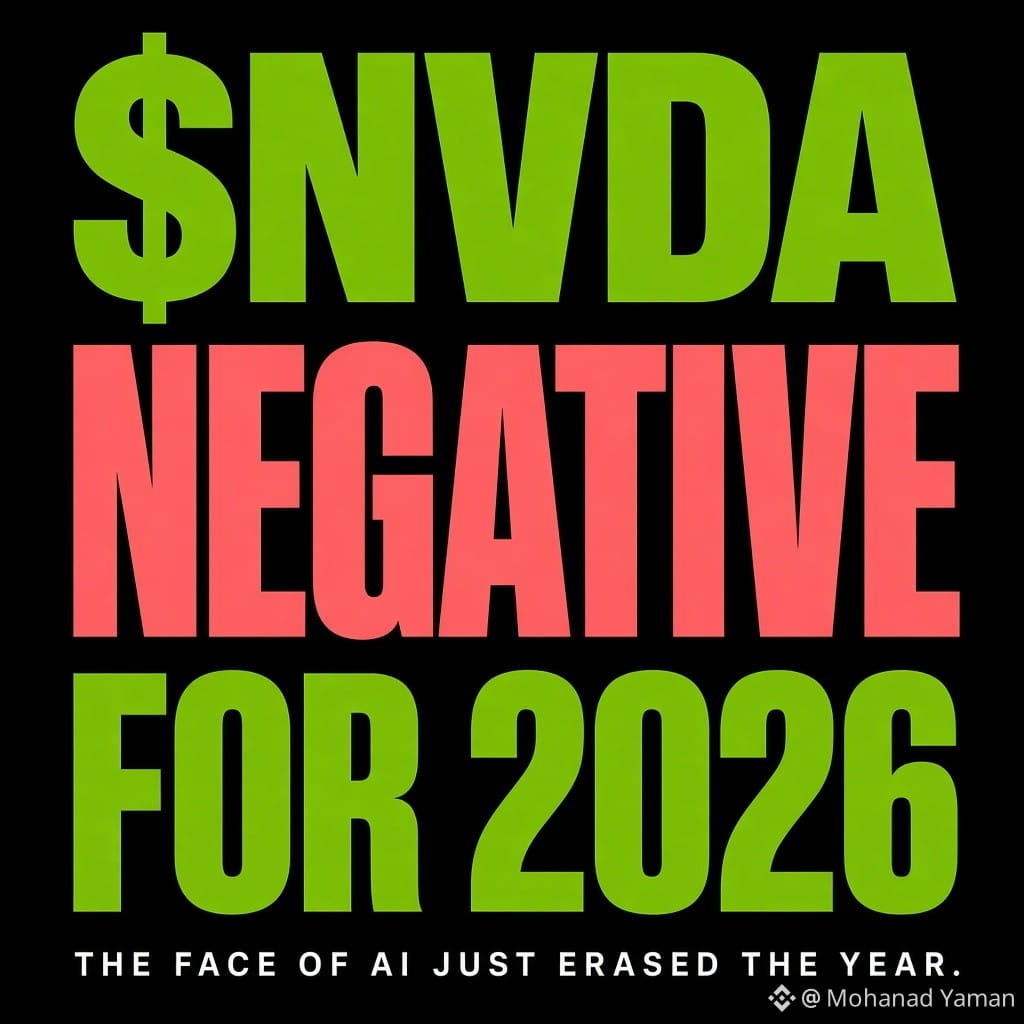
🚨 The face of AI just went red for the year
$NVDA closed at 181 last night. Down 9% on the day 📉
That one session knocked about $450B off its market value 🤯 Worst day since the DeepSeek scare in Jan 2025
Zoom out and it gets uglier
About 24% below the Oct 6 record
Nearly $1.4T in market value gone since that high
Fifth straight losing week
Trading under the 200 day moving average
And now negative for 2026
The Mag 7 lost over $1T yesterday. $NVDA alone took nearly half of that 💥
Earnings are Nov 17. That is the next real test, will it keep dumping or we rally from there? 👀
#stocks
{spot}(NVDABUSDT)
🚨 The face of AI just went red for the year
$NVDA closed at 181 last night. Down 9% on the day 📉
That one session knocked about $450B off its market value 🤯 Worst day since the DeepSeek scare in Jan 2025
Zoom out and it gets uglier
About 24% below the Oct 6 record
Nearly $1.4T in market value gone since that high
Fifth straight losing week
Trading under the 200 day moving average
And now negative for 2026
The Mag 7 lost over $1T yesterday. $NVDA alone took nearly half of that 💥
Earnings are Nov 17. That is the next real test, will it keep dumping or we rally from there? 👀
#stocks
$NVDA closed at 181 last night. Down 9% on the day 📉
That one session knocked about $450B off its market value 🤯 Worst day since the DeepSeek scare in Jan 2025
Zoom out and it gets uglier
About 24% below the Oct 6 record
Nearly $1.4T in market value gone since that high
Fifth straight losing week
Trading under the 200 day moving average
And now negative for 2026
The Mag 7 lost over $1T yesterday. $NVDA alone took nearly half of that 💥
Earnings are Nov 17. That is the next real test, will it keep dumping or we rally from there? 👀
#stocks
810
·
--
Bullish
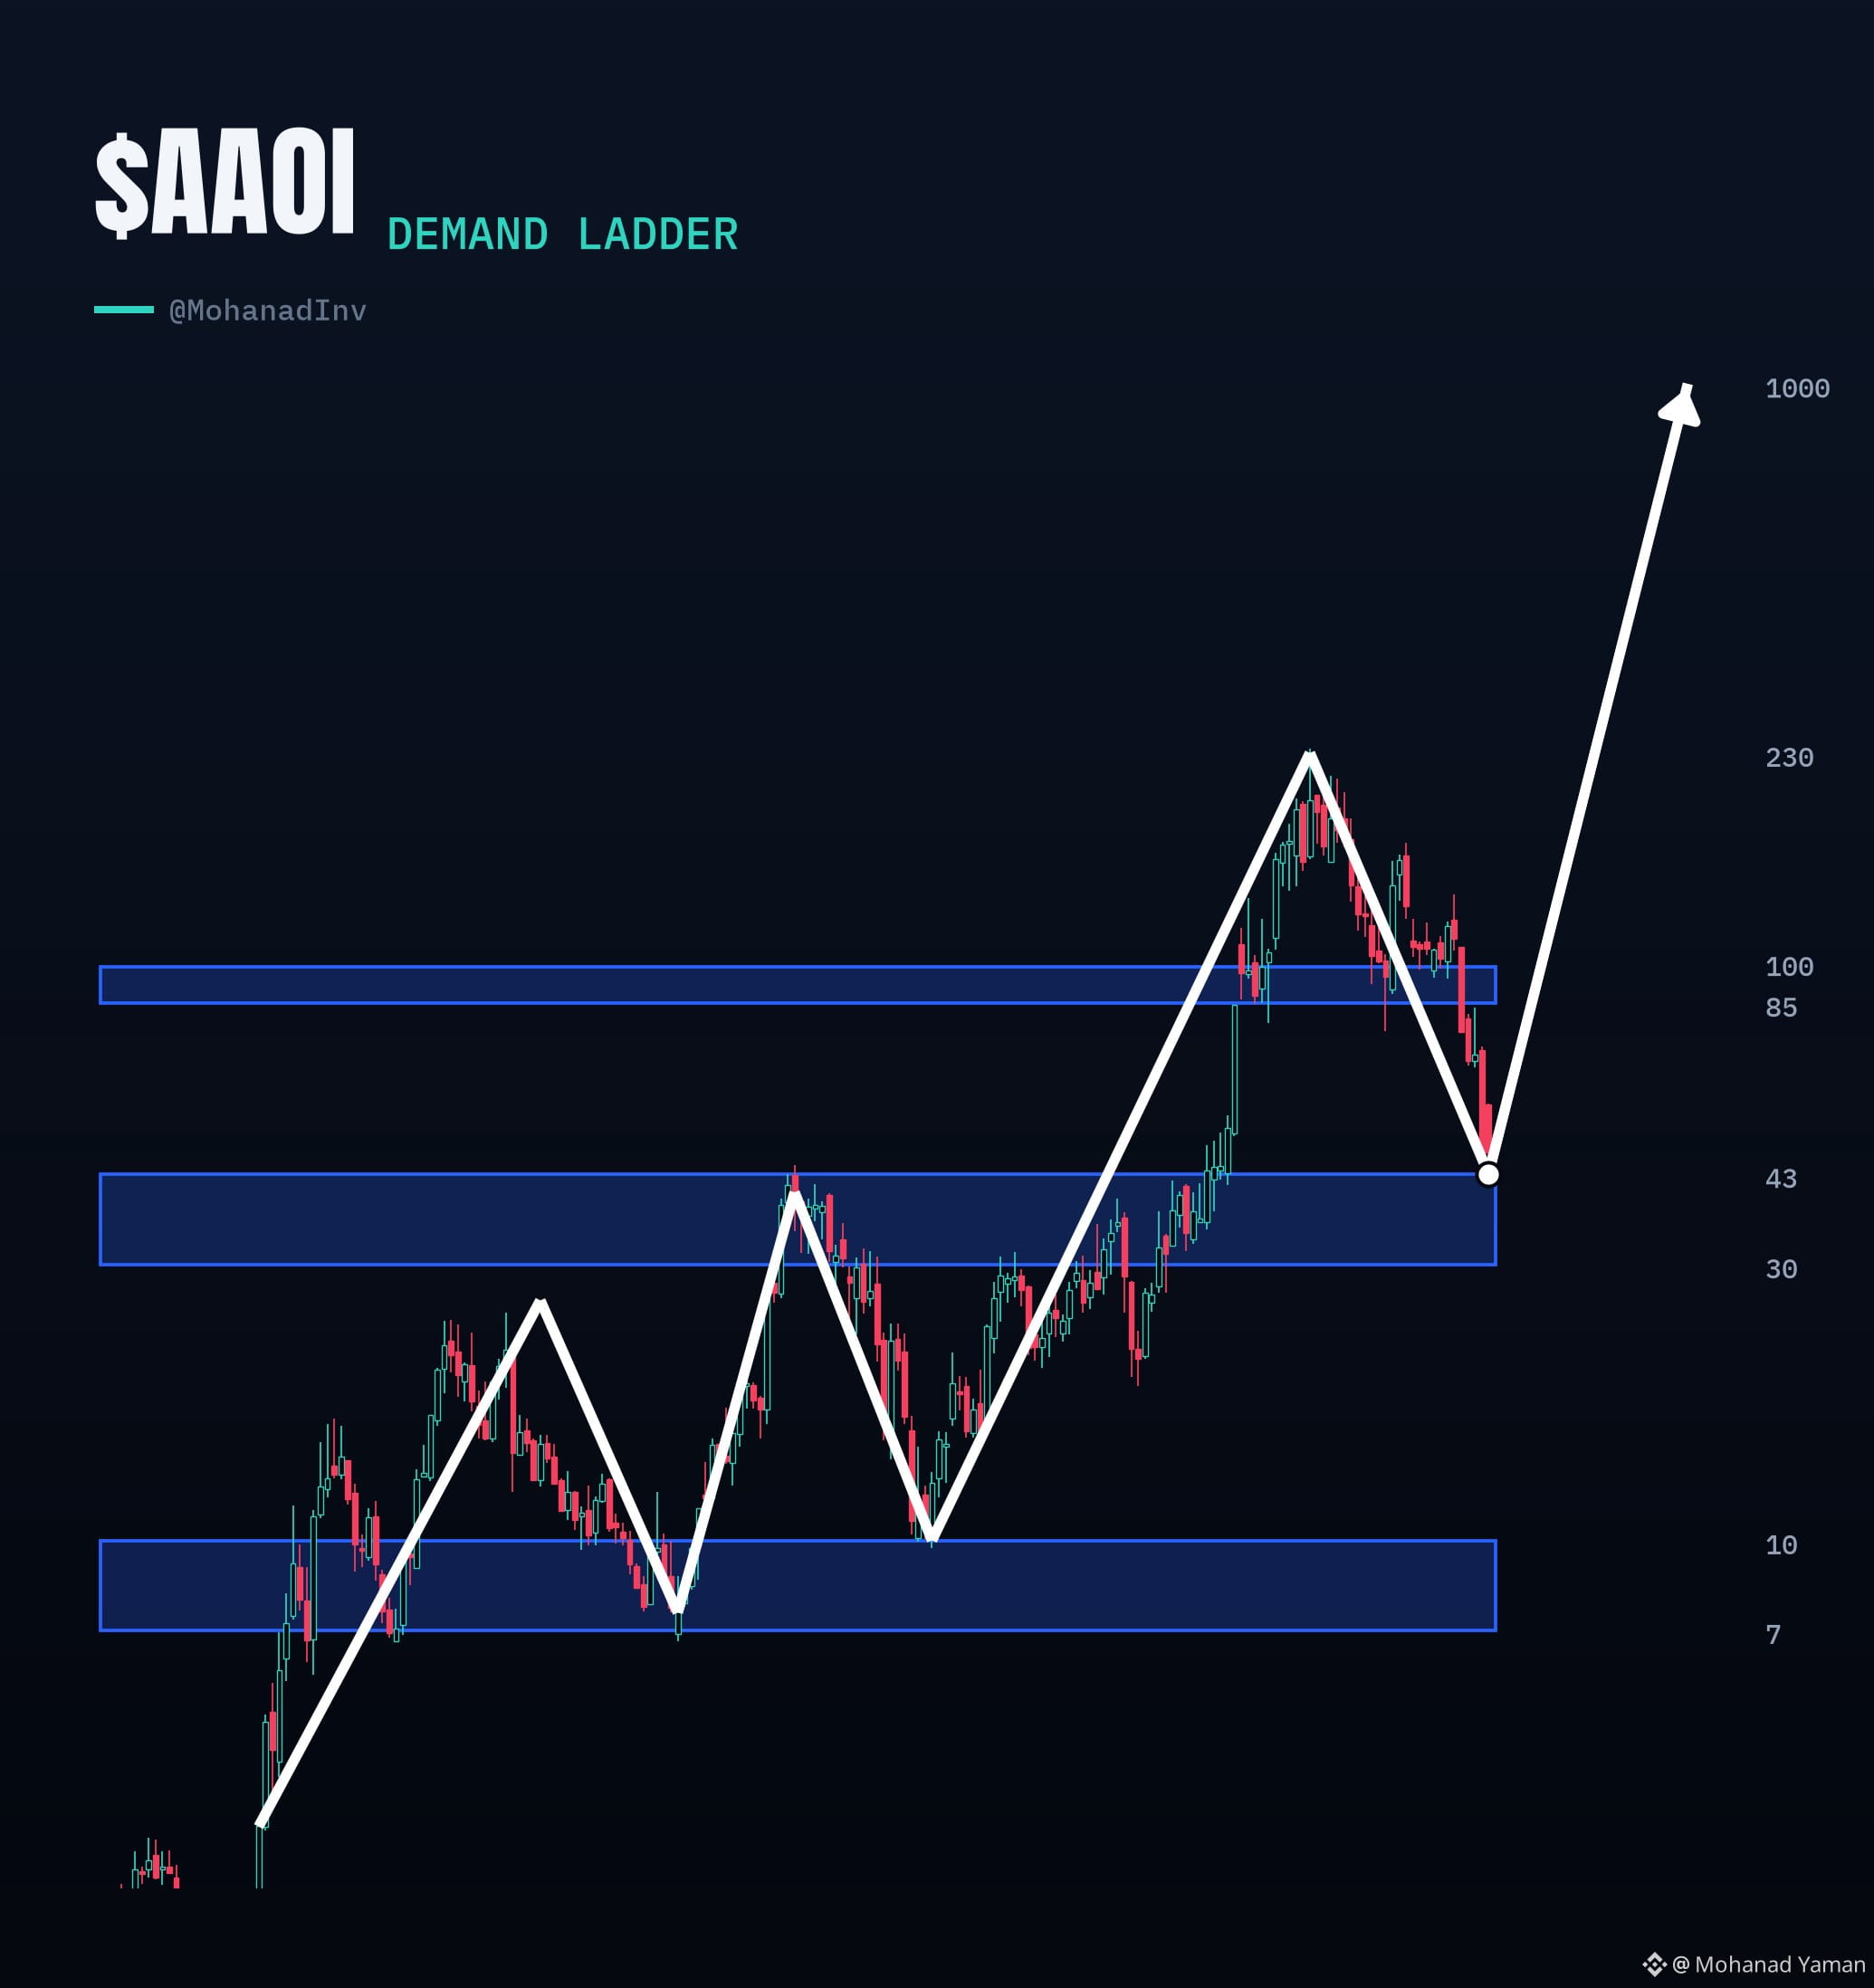
📈 $AAOI I just got handed the next rung on the ladder 👀
Last two times it claimed a demand zone, it ripped to new highs
$7 → $43 (+514%) 🚀
$10 → $230 (+2,200%) 🚀
$43 → $1,000 next 🤔🤔
✅ Q3 reported $270M (+128% YoY) and flipped to profit. The dump was the soft Q4 guide and a slower capacity buildout not demand dying
Same setup. Bigger target. To Uranus next? 🚀🪐
I personally don't know 😅
#stocks
{spot}(AAOIBUSDT)
📈 $AAOI I just got handed the next rung on the ladder 👀
Last two times it claimed a demand zone, it ripped to new highs
$7 → $43 (+514%) 🚀
$10 → $230 (+2,200%) 🚀
$43 → $1,000 next 🤔🤔
✅ Q3 reported $270M (+128% YoY) and flipped to profit. The dump was the soft Q4 guide and a slower capacity buildout not demand dying
Same setup. Bigger target. To Uranus next? 🚀🪐
I personally don't know 😅
#stocks
Last two times it claimed a demand zone, it ripped to new highs
$7 → $43 (+514%) 🚀
$10 → $230 (+2,200%) 🚀
$43 → $1,000 next 🤔🤔
✅ Q3 reported $270M (+128% YoY) and flipped to profit. The dump was the soft Q4 guide and a slower capacity buildout not demand dying
Same setup. Bigger target. To Uranus next? 🚀🪐
I personally don't know 😅
#stocks
1
1.5k
Partly True
$VIX is up over 50% today 😱
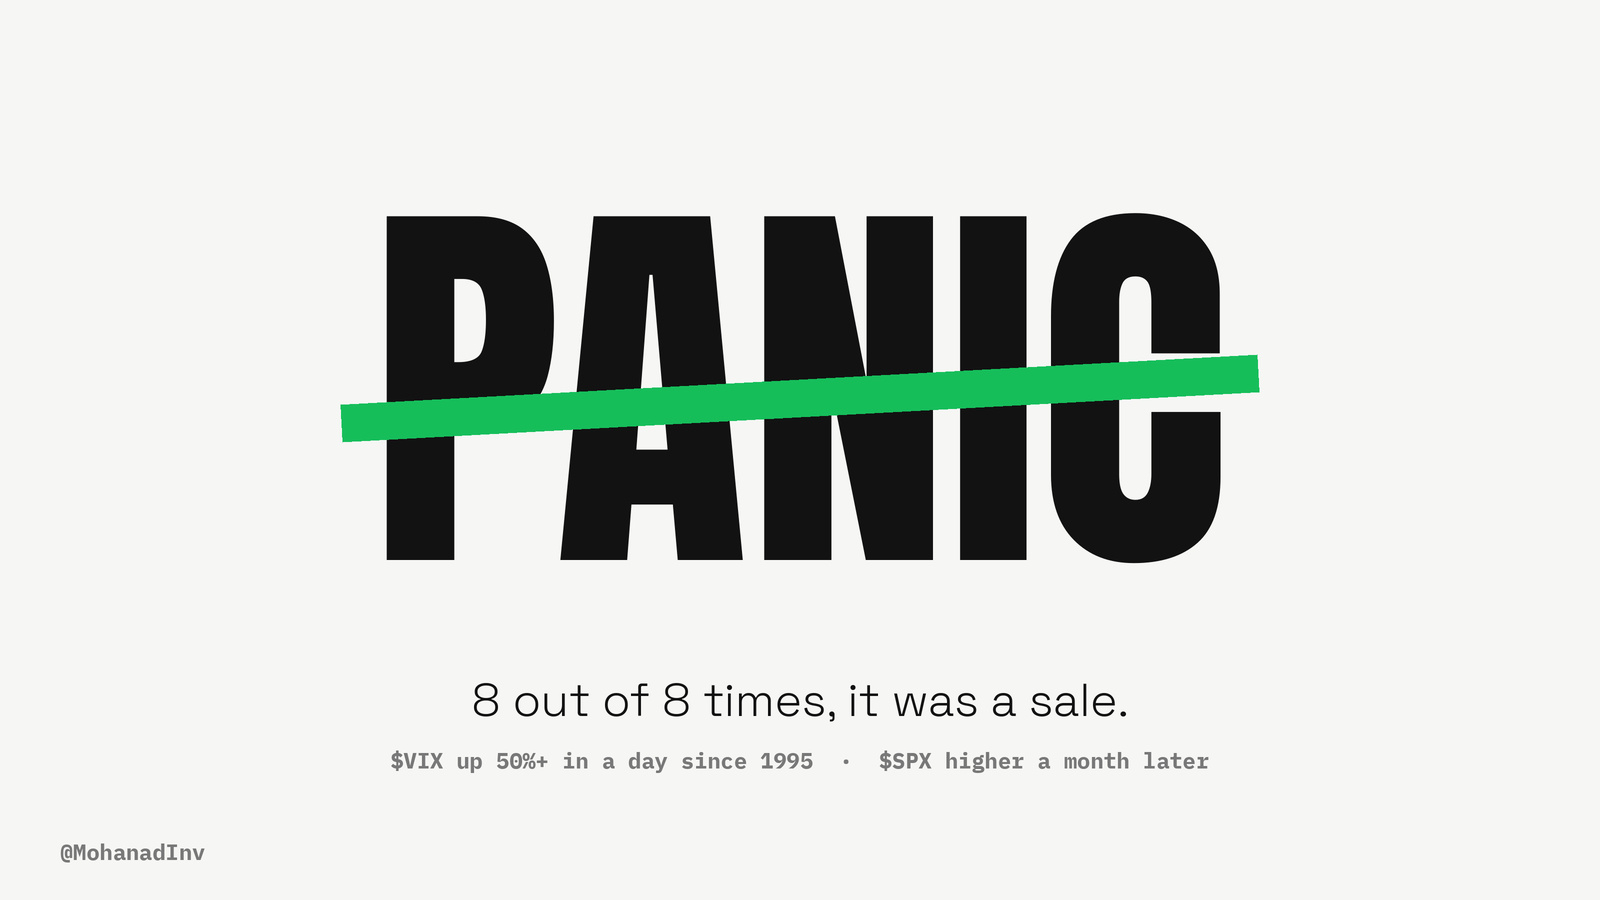
Since 1995 that's happened only 8 times on a closing basis:
Feb 2007, Aug 2011, Feb 2018, Jan 2021, Nov 2021, Aug 2024, Dec 2024, Apr 2025
🟢 A month later, $SPX was higher all 8 times 📈 Median gain about 4%.
Small sample, and not a guarantee. 12 months later, 2007 and Nov 2021 were still lower.
Fear spikes have been better entries than exits. Buying or waiting? 🤔
#stocks
$VIX is up over 50% today 😱
Since 1995 that's happened only 8 times on a closing basis:
Feb 2007, Aug 2011, Feb 2018, Jan 2021, Nov 2021, Aug 2024, Dec 2024, Apr 2025
🟢 A month later, $SPX was higher all 8 times 📈 Median gain about 4%.
Small sample, and not a guarantee. 12 months later, 2007 and Nov 2021 were still lower.
Fear spikes have been better entries than exits. Buying or waiting? 🤔
#stocks
Since 1995 that's happened only 8 times on a closing basis:
Feb 2007, Aug 2011, Feb 2018, Jan 2021, Nov 2021, Aug 2024, Dec 2024, Apr 2025
🟢 A month later, $SPX was higher all 8 times 📈 Median gain about 4%.
Small sample, and not a guarantee. 12 months later, 2007 and Nov 2021 were still lower.
Fear spikes have been better entries than exits. Buying or waiting? 🤔
#stocks
1
1
1.6k
Partly True
$SPX down about 3.7% today 📉
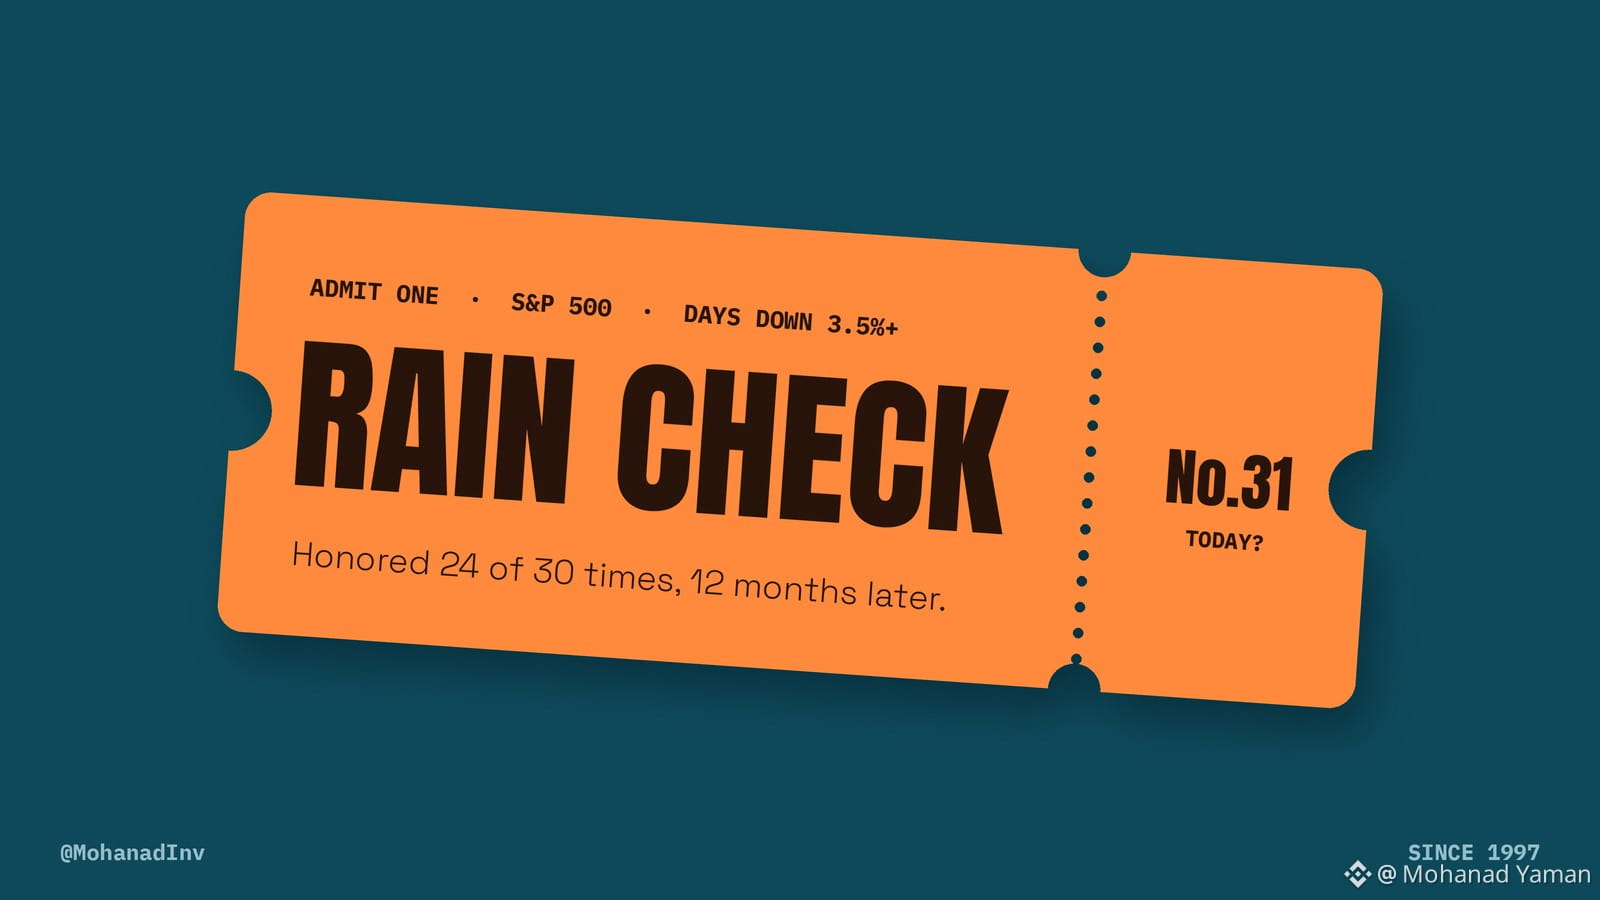
Since 1997 there have been 30 separate selloffs with a day down 3.5% or more.
12 months later, $SPX was higher in 24 of them. Median gain about 20% 📈
The 6 that weren't: 2000 (twice), 2001 (twice), Sep 2008 and Apr 2022. Not every big red day is the bottom.
Big red days have usually been a rain check, not a farewell. Adding or sitting tight? 🤔
#stocks
$SPX down about 3.7% today 📉
Since 1997 there have been 30 separate selloffs with a day down 3.5% or more.
12 months later, $SPX was higher in 24 of them. Median gain about 20% 📈
The 6 that weren't: 2000 (twice), 2001 (twice), Sep 2008 and Apr 2022. Not every big red day is the bottom.
Big red days have usually been a rain check, not a farewell. Adding or sitting tight? 🤔
#stocks
Since 1997 there have been 30 separate selloffs with a day down 3.5% or more.
12 months later, $SPX was higher in 24 of them. Median gain about 20% 📈
The 6 that weren't: 2000 (twice), 2001 (twice), Sep 2008 and Apr 2022. Not every big red day is the bottom.
Big red days have usually been a rain check, not a farewell. Adding or sitting tight? 🤔
#stocks
1.3k
·
--
Bullish
Verified
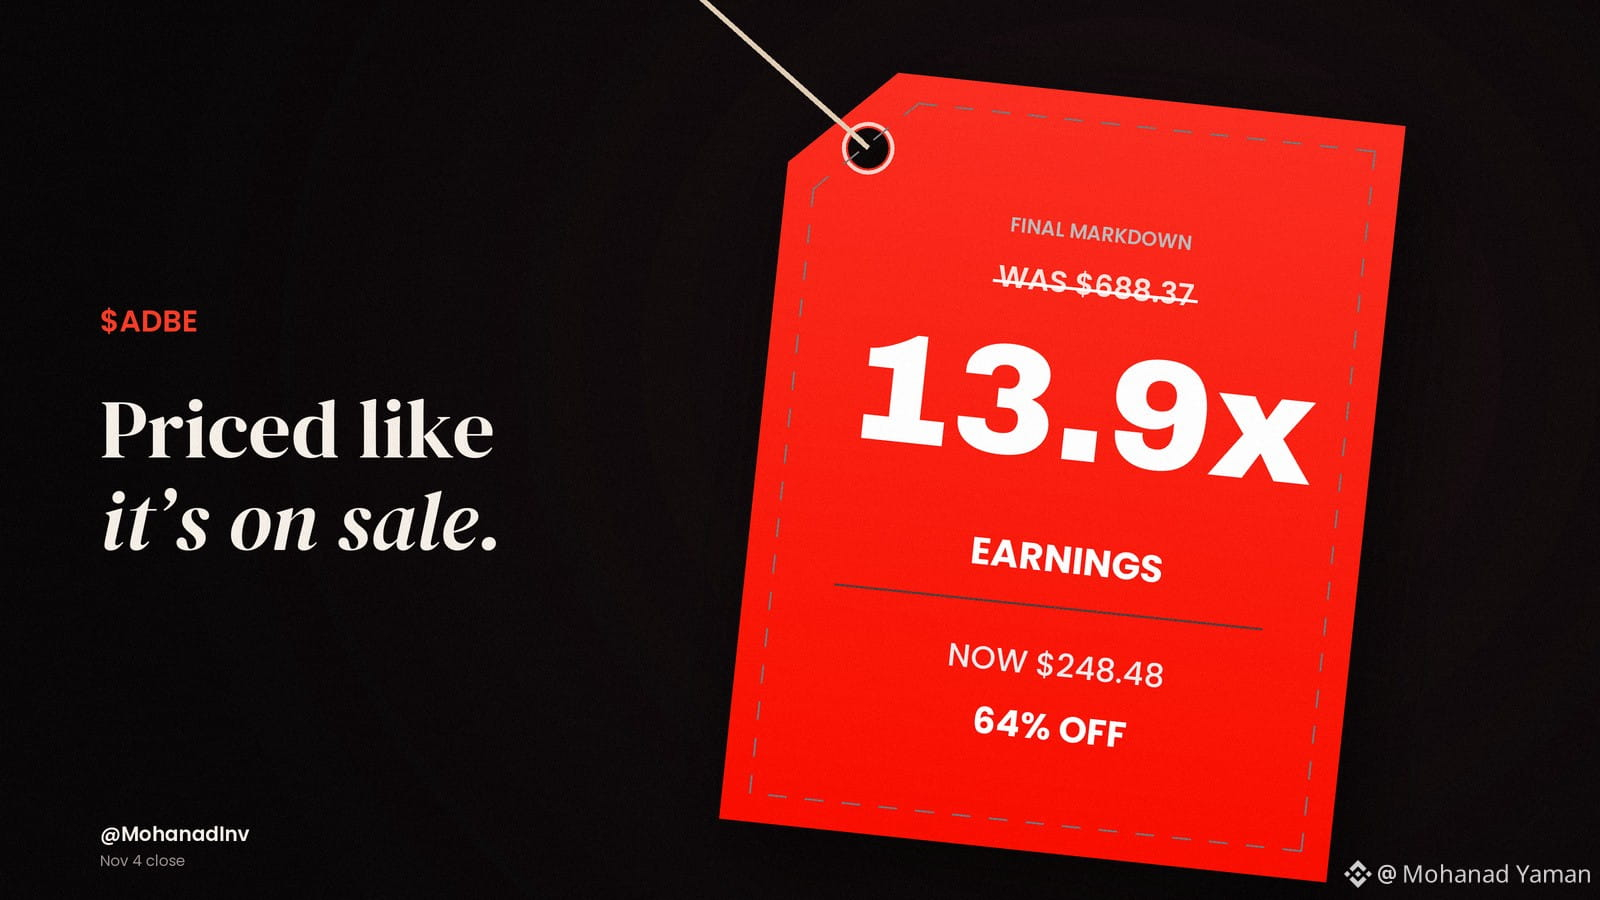
💡 $ADBE now trades at 13.9x earnings.
📉 64% below its 2021 peak and down 29% this year, while revenue is still growing double digits.
The market is pricing Adobe like a company in decline. The numbers don't say that yet. 👀
$ADBE at 13.9x earnings.
Would you buy it here?
#stocks
{spot}(ADBEBUSDT)
💡 $ADBE now trades at 13.9x earnings.
📉 64% below its 2021 peak and down 29% this year, while revenue is still growing double digits.
The market is pricing Adobe like a company in decline. The numbers don't say that yet. 👀
$ADBE at 13.9x earnings.
Would you buy it here?
#stocks
📉 64% below its 2021 peak and down 29% this year, while revenue is still growing double digits.
The market is pricing Adobe like a company in decline. The numbers don't say that yet. 👀
$ADBE at 13.9x earnings.
Would you buy it here?
#stocks
1.2k
·
--
Bullish
Verified
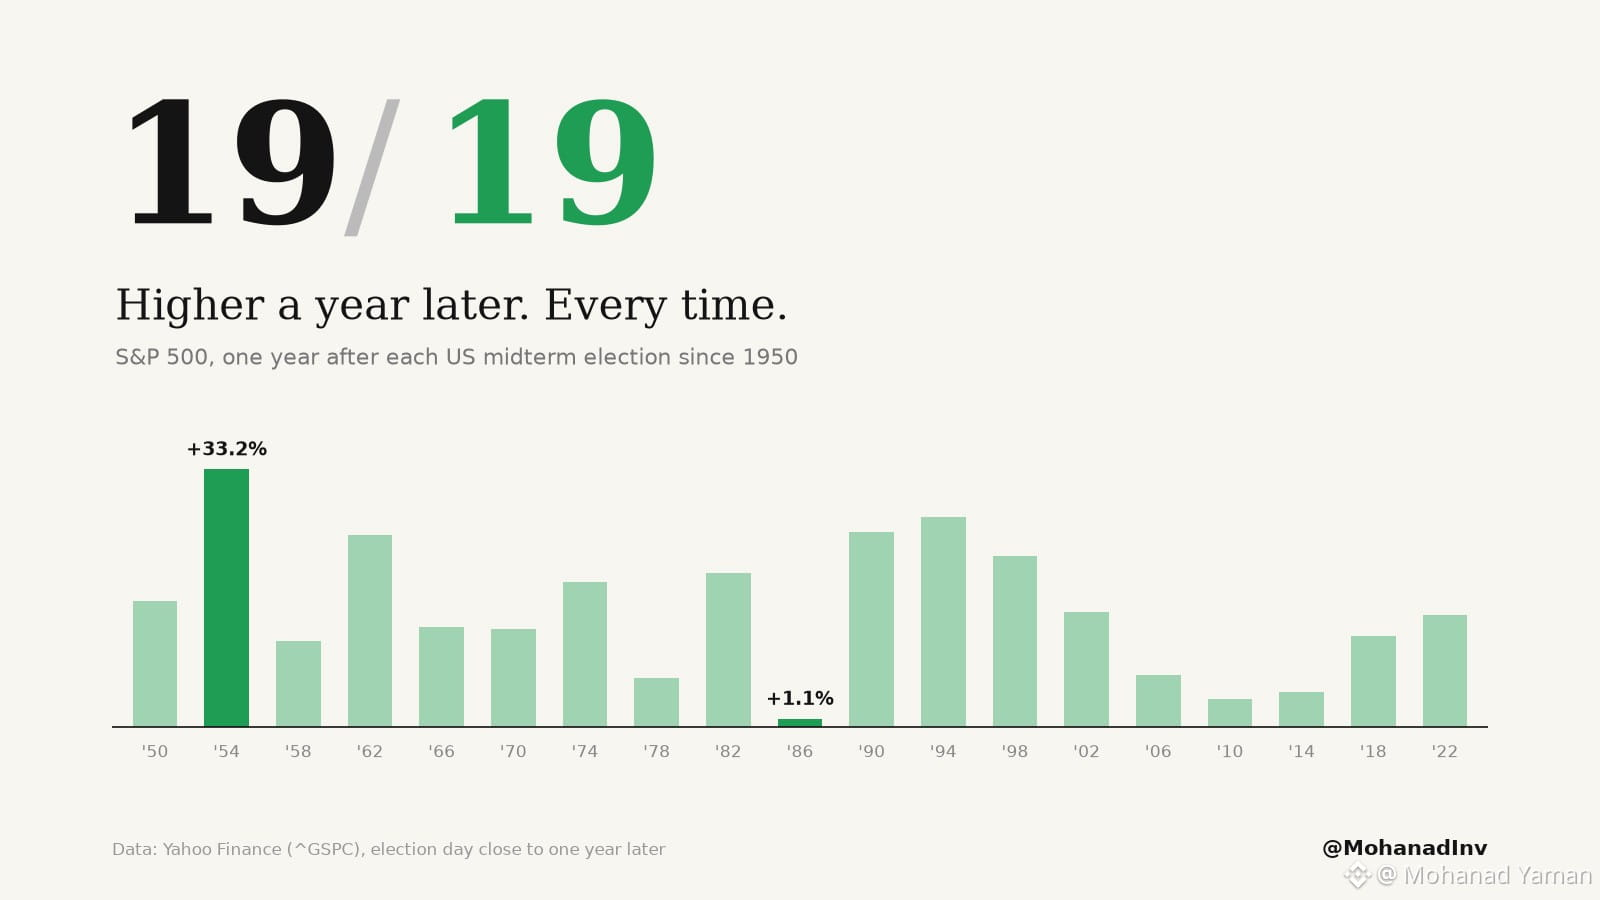
🗳️ 19 midterms since 1950. S&P 500 one year after Election Day: higher all 19 times.
📈 Average 15.1%. Median 14.5%.
Best 33.2% (1954). Worst 1.1% (1986, the window that caught the 1987 crash).
⚠️ 13 of those 19 midterm years saw a 10% drop along the way. 2026's deepest pullback so far: 9.1%.
20 for 20, or is this the year the streak breaks?
#stocks
🗳️ 19 midterms since 1950. S&P 500 one year after Election Day: higher all 19 times.
📈 Average 15.1%. Median 14.5%.
Best 33.2% (1954). Worst 1.1% (1986, the window that caught the 1987 crash).
⚠️ 13 of those 19 midterm years saw a 10% drop along the way. 2026's deepest pullback so far: 9.1%.
20 for 20, or is this the year the streak breaks?
#stocks
📈 Average 15.1%. Median 14.5%.
Best 33.2% (1954). Worst 1.1% (1986, the window that caught the 1987 crash).
⚠️ 13 of those 19 midterm years saw a 10% drop along the way. 2026's deepest pullback so far: 9.1%.
20 for 20, or is this the year the streak breaks?
#stocks
1.9k
·
--
Bullish
Partly True
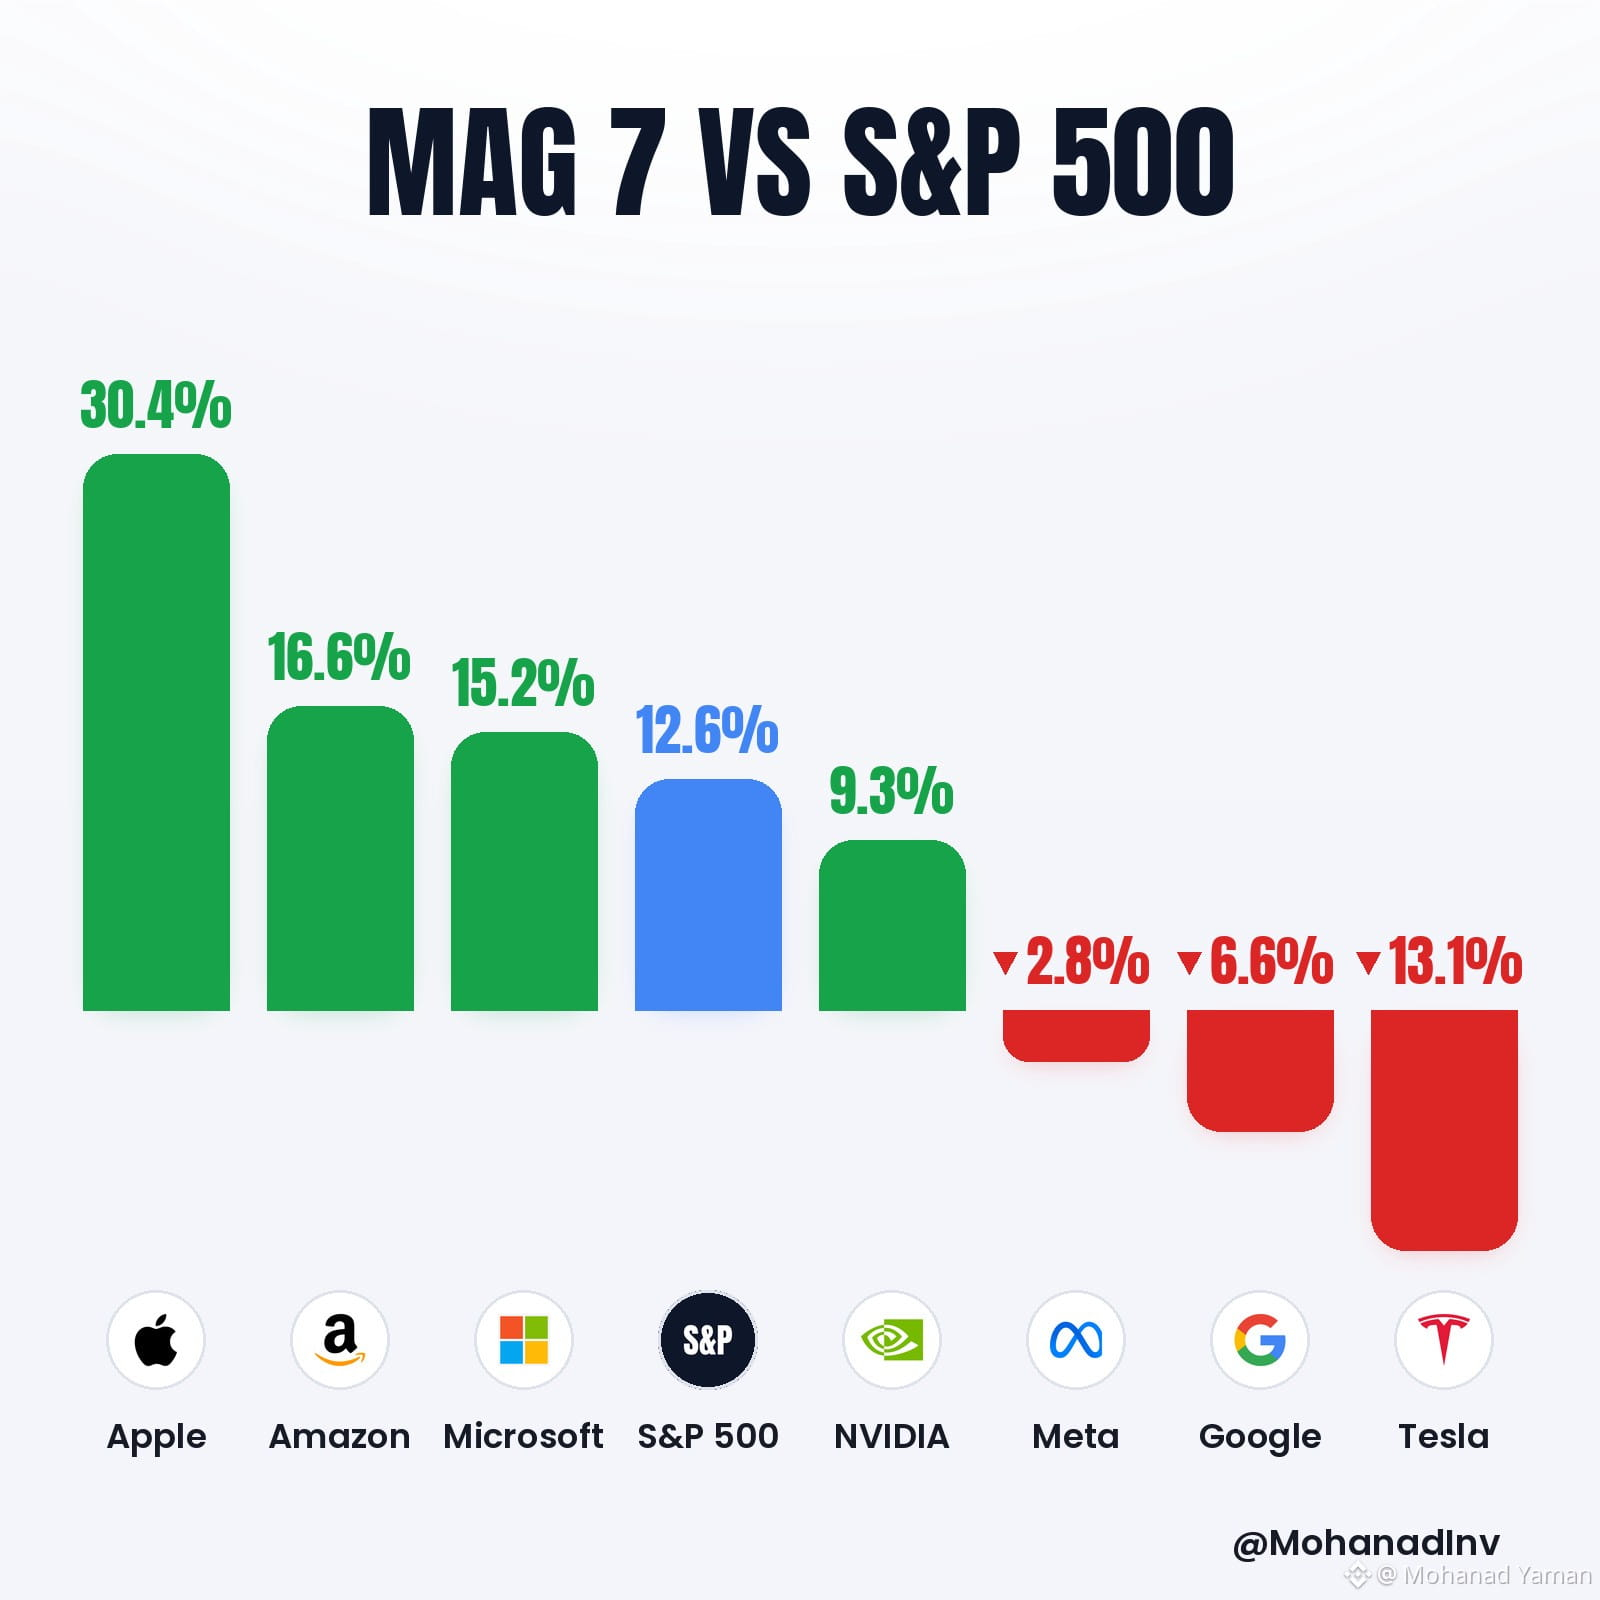
A few days ago only 2 of the Mag 7 were beating the S&P 500. Now it's 3 👀
2026 so far:
1. $AAPL up 30.4%
2. $AMZN up 16.6%
3. $MSFT up 15.2%
📊 $SPX up 12.6%
4. $NVDA up 9.3%
5. $META down 2.8%
6. $GOOGL down 6.6%
7. $TSLA down 13.1%
Biggest change: Amazon went from up 5.6% to up 16.6% and jumped the index. $NVDA slipped below it.
Who's next to climb back above the index?
#stocks
{spot}(AAPLBUSDT)
A few days ago only 2 of the Mag 7 were beating the S&P 500. Now it's 3 👀
2026 so far:
1. $AAPL up 30.4%
2. $AMZN up 16.6%
3. $MSFT up 15.2%
📊 $SPX up 12.6%
4. $NVDA up 9.3%
5. $META down 2.8%
6. $GOOGL down 6.6%
7. $TSLA down 13.1%
Biggest change: Amazon went from up 5.6% to up 16.6% and jumped the index. $NVDA slipped below it.
Who's next to climb back above the index?
#stocks
2026 so far:
1. $AAPL up 30.4%
2. $AMZN up 16.6%
3. $MSFT up 15.2%
📊 $SPX up 12.6%
4. $NVDA up 9.3%
5. $META down 2.8%
6. $GOOGL down 6.6%
7. $TSLA down 13.1%
Biggest change: Amazon went from up 5.6% to up 16.6% and jumped the index. $NVDA slipped below it.
Who's next to climb back above the index?
#stocks
1
415
·
--
Bullish
Verified
A week ago I called $GOOGL the cheapest Big Tech stock 💰
Then earnings hit and it fell 12.6% in one day. Its worst day ever 👀
A week later it's still the cheapest on trailing P/E 📊
$GOOGL 15.2 🏆
$AMZN 21.7
$META 21.8
$NVDA 25.7
$MSFT 29.0
$AAPL 39.3
Down 9.0% since my post, but up 4.1% today off the lows 🟢
Cheap can always get cheaper. But it can also stop. Are you buying or still waiting? 🤔
#stocks
{spot}(GOOGLBUSDT)
A week ago I called $GOOGL the cheapest Big Tech stock 💰
Then earnings hit and it fell 12.6% in one day. Its worst day ever 👀
A week later it's still the cheapest on trailing P/E 📊
$GOOGL 15.2 🏆
$AMZN 21.7
$META 21.8
$NVDA 25.7
$MSFT 29.0
$AAPL 39.3
Down 9.0% since my post, but up 4.1% today off the lows 🟢
Cheap can always get cheaper. But it can also stop. Are you buying or still waiting? 🤔
#stocks
Then earnings hit and it fell 12.6% in one day. Its worst day ever 👀
A week later it's still the cheapest on trailing P/E 📊
$GOOGL 15.2 🏆
$AMZN 21.7
$META 21.8
$NVDA 25.7
$MSFT 29.0
$AAPL 39.3
Down 9.0% since my post, but up 4.1% today off the lows 🟢
Cheap can always get cheaper. But it can also stop. Are you buying or still waiting? 🤔
#stocks
1
2k
·
--
Bullish
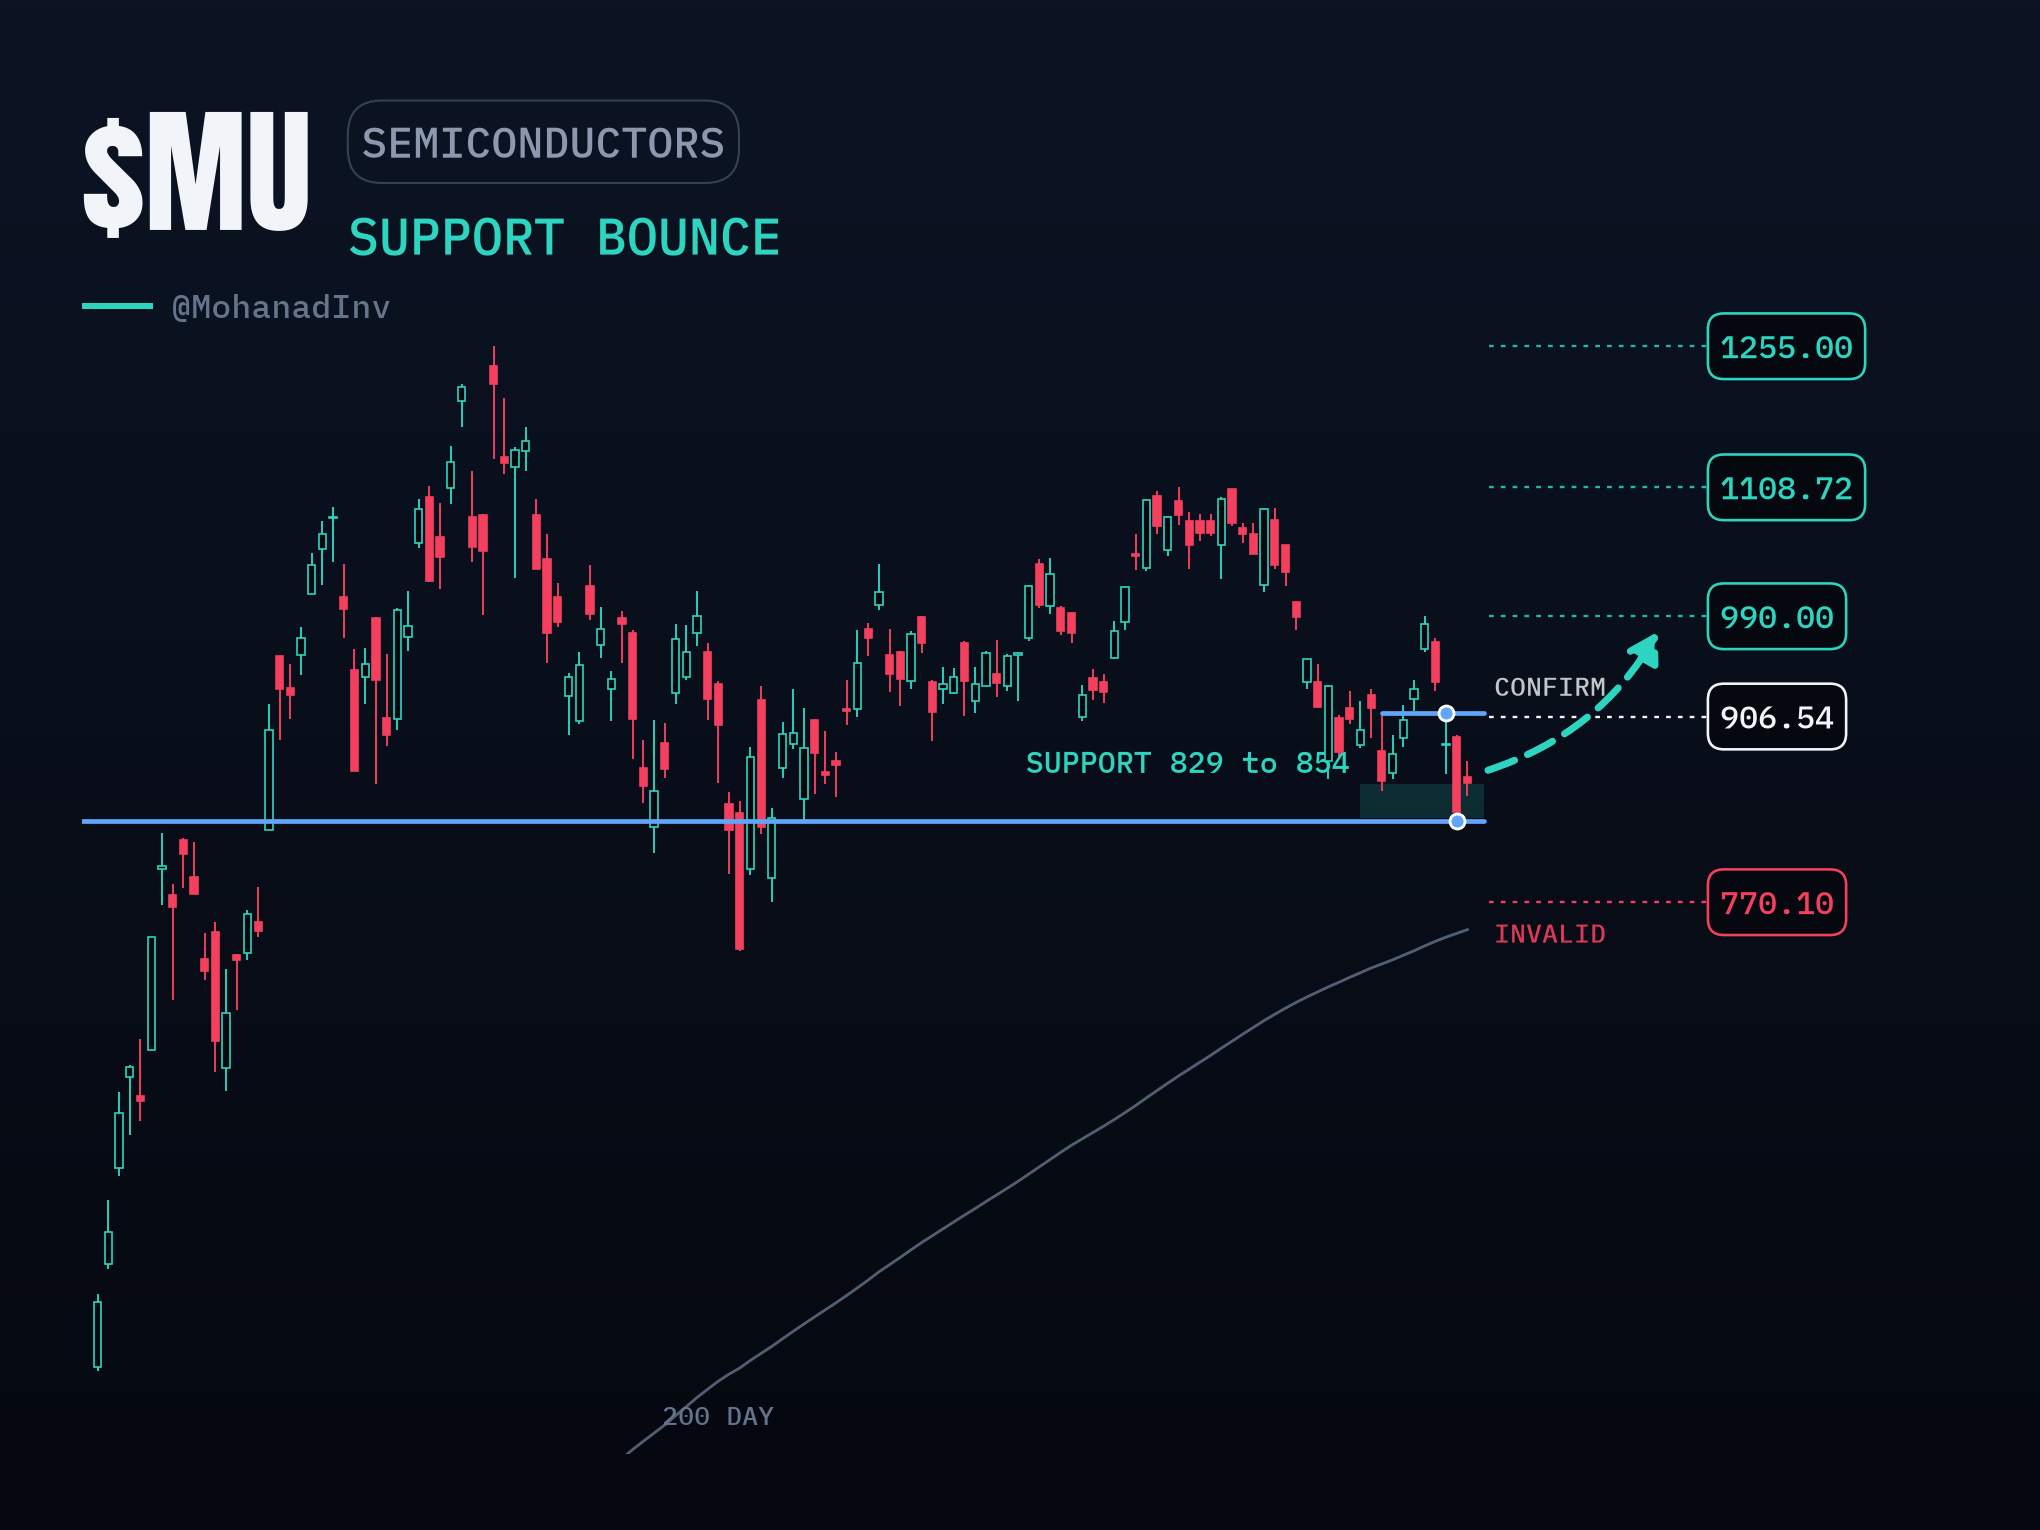
$MU investors is this your buy the dip opportunity?? 👀
$MU haters is this a $300 stock trading at $800?? 👀
This is what I'm watching for now:
✅ Daily close above $906.54 is the first sign
🟢 $990.00 / $1,108.72 / $1,255.00
⛔ Daily close under $770.10 and the bounce is off
This level has caught buyers for months. Does it hold one more time?
#stocks
{spot}(MUBUSDT)
$MU investors is this your buy the dip opportunity?? 👀
$MU haters is this a $300 stock trading at $800?? 👀
This is what I'm watching for now:
✅ Daily close above $906.54 is the first sign
🟢 $990.00 / $1,108.72 / $1,255.00
⛔ Daily close under $770.10 and the bounce is off
This level has caught buyers for months. Does it hold one more time?
#stocks
$MU haters is this a $300 stock trading at $800?? 👀
This is what I'm watching for now:
✅ Daily close above $906.54 is the first sign
🟢 $990.00 / $1,108.72 / $1,255.00
⛔ Daily close under $770.10 and the bounce is off
This level has caught buyers for months. Does it hold one more time?
#stocks
1.8k
·
--
Bullish
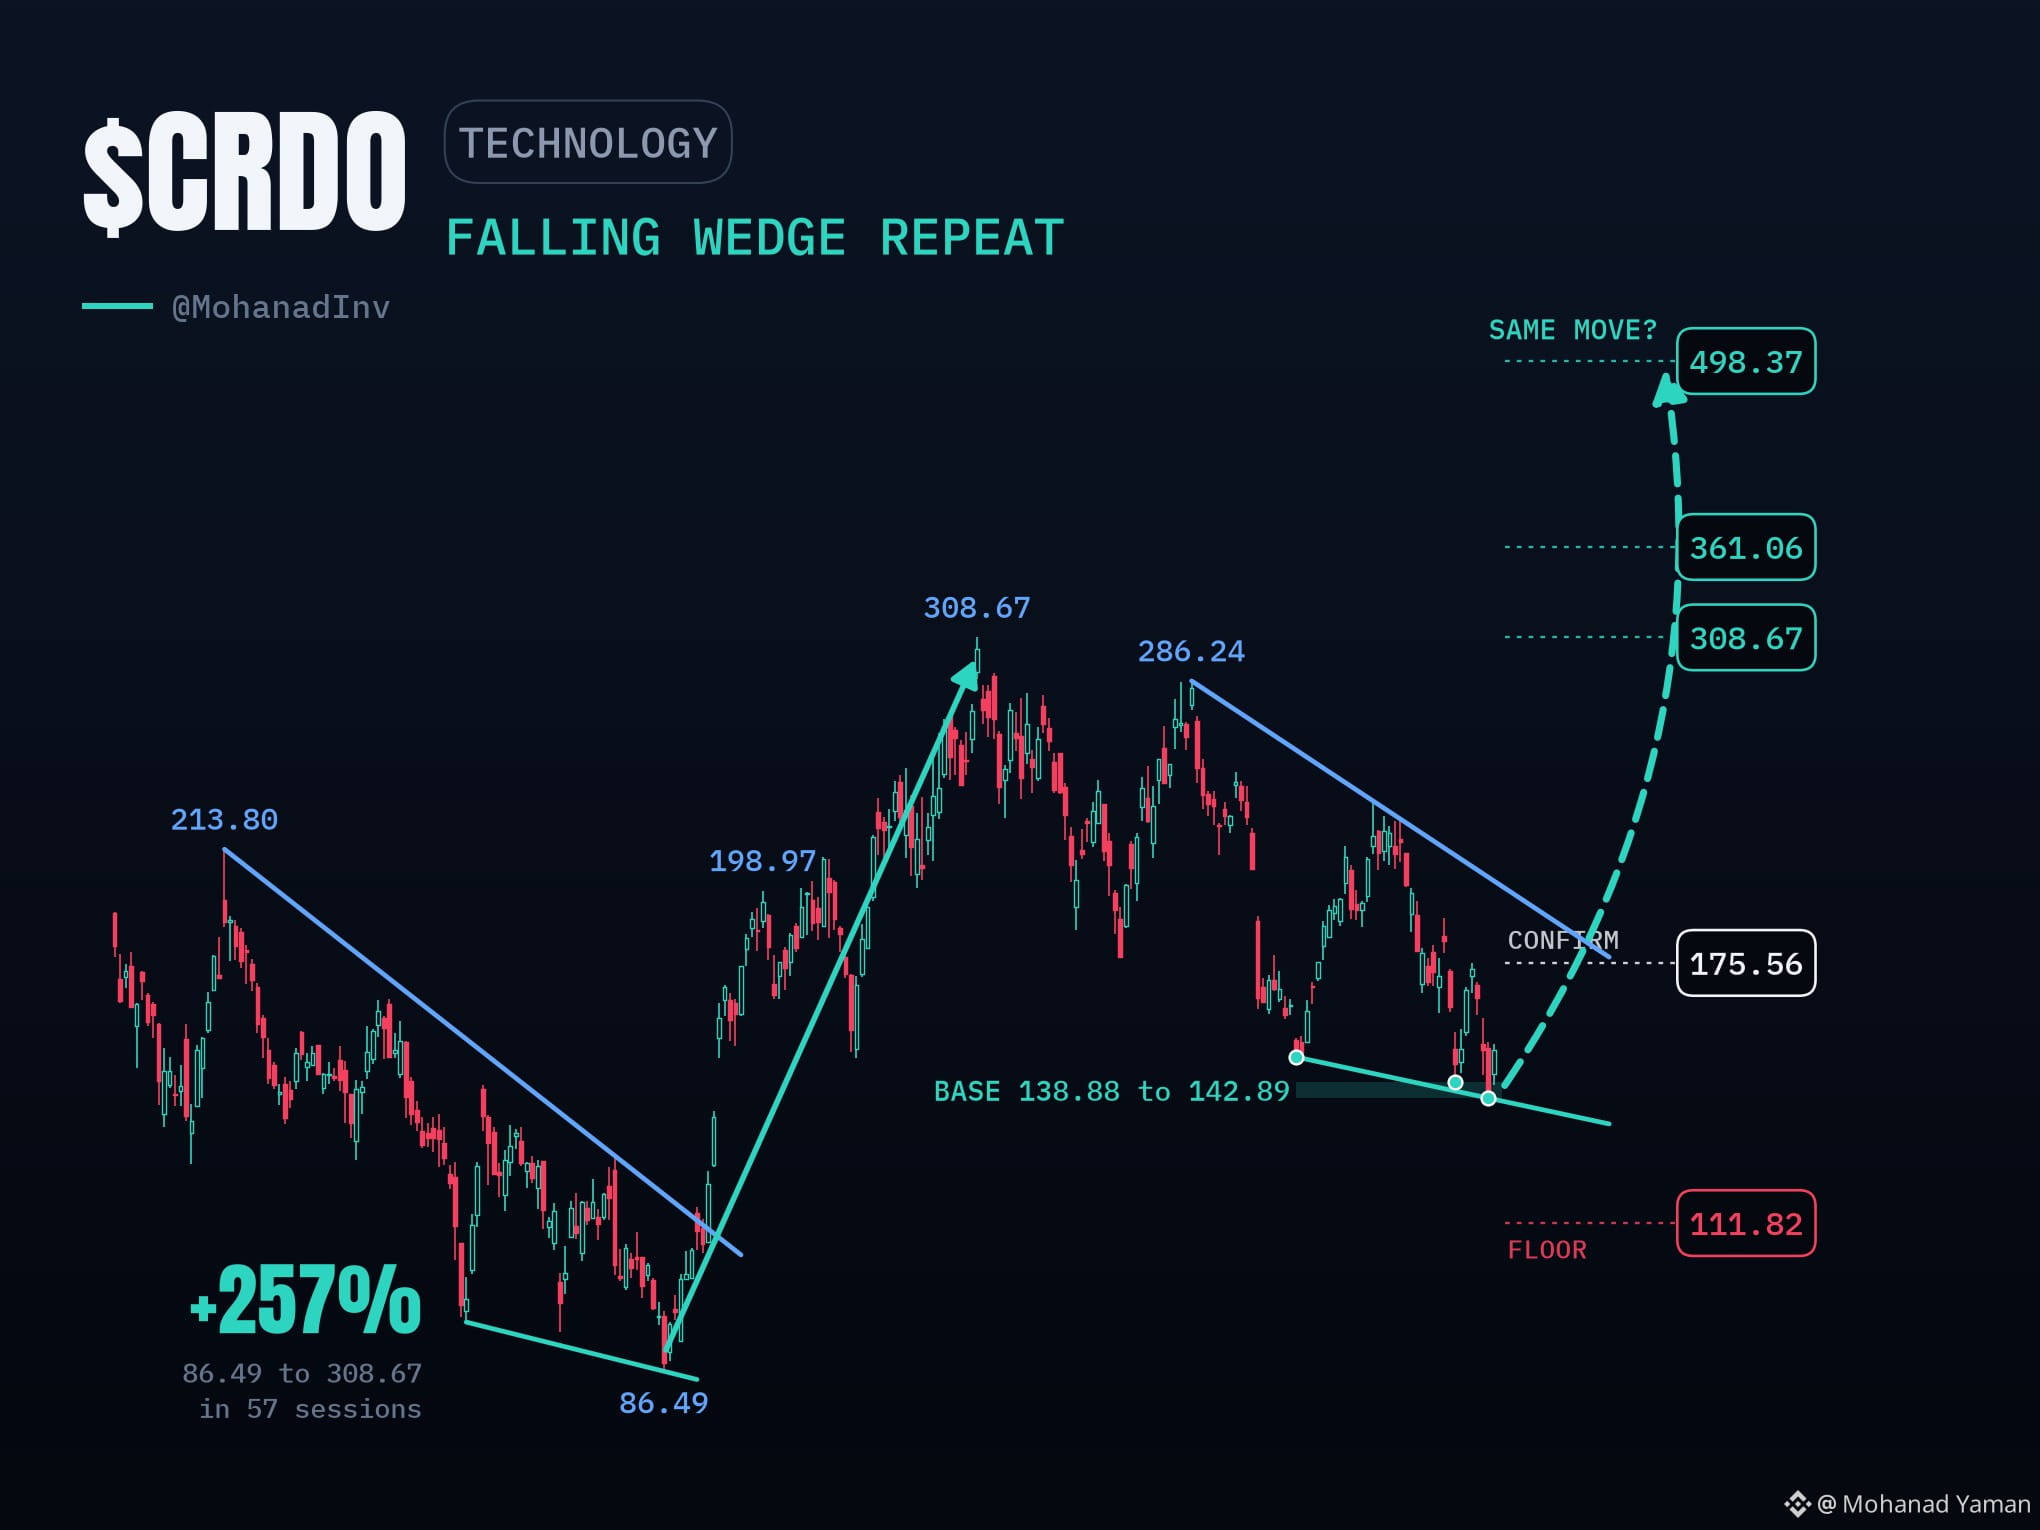
$CRDO is drawing the same chart that ran +257% last time 🔥
Same wedge, round two 👀
Last time: falling wedge from $213.80, base at $86.49, then +257% to $308.67 in 57 sessions.
Now: same falling wedge from $308.67, lows flattening at $149.14, $142.89, $138.88.
🔹 Closed $150.91, under the 20 day $175.56, 200 day $181.02 and 50 day $185.15
🔹 Base $138.88 to $142.89
What I'm watching:
✅ Daily close above $175.56 is the first sign
🚀 Close above the falling rail, near $202 today, is the real break
🟢 $308.67 / $361.06 / $498.37
⛔ Close under $111.82 breaks the structure
History doesn't repeat exactly, but it rhymes. Not a buy call, just how I'm reading it.
Are you playing this one with me, or sitting it out? 🤔
#stocks
{spot}(CRDOBUSDT)
$CRDO is drawing the same chart that ran +257% last time 🔥
Same wedge, round two 👀
Last time: falling wedge from $213.80, base at $86.49, then +257% to $308.67 in 57 sessions.
Now: same falling wedge from $308.67, lows flattening at $149.14, $142.89, $138.88.
🔹 Closed $150.91, under the 20 day $175.56, 200 day $181.02 and 50 day $185.15
🔹 Base $138.88 to $142.89
What I'm watching:
✅ Daily close above $175.56 is the first sign
🚀 Close above the falling rail, near $202 today, is the real break
🟢 $308.67 / $361.06 / $498.37
⛔ Close under $111.82 breaks the structure
History doesn't repeat exactly, but it rhymes. Not a buy call, just how I'm reading it.
Are you playing this one with me, or sitting it out? 🤔
#stocks
Same wedge, round two 👀
Last time: falling wedge from $213.80, base at $86.49, then +257% to $308.67 in 57 sessions.
Now: same falling wedge from $308.67, lows flattening at $149.14, $142.89, $138.88.
🔹 Closed $150.91, under the 20 day $175.56, 200 day $181.02 and 50 day $185.15
🔹 Base $138.88 to $142.89
What I'm watching:
✅ Daily close above $175.56 is the first sign
🚀 Close above the falling rail, near $202 today, is the real break
🟢 $308.67 / $361.06 / $498.37
⛔ Close under $111.82 breaks the structure
History doesn't repeat exactly, but it rhymes. Not a buy call, just how I'm reading it.
Are you playing this one with me, or sitting it out? 🤔
#stocks
1
765
Log in to explore more content
Join global crypto users on Binance Square
⚡️ Get latest and useful information about crypto.
💬 Trusted by the world’s largest crypto exchange.
👍 Discover real insights from verified creators.
Email / Phone number
Trending Topics
BitcoinRebounds$75KAsChipsLead
4,494 views
96 Discussing
Market Watch | Bitcoin Rebounds to $75,600 After Dip Below $75,000 as Chip Stocks Lead Rally on Jobs Beat
Binance News
·10 Likes
·4.1k views
JobsReportRaisesHikeOdds
78,578 views
829 Discussing
US Data Center Rules May Constrain AI Expansion
9,461 views
91 Discussing