
#stocks
stocks
4.7M views
11,845 Discussing
Hot
Latest

·
--
Bullish
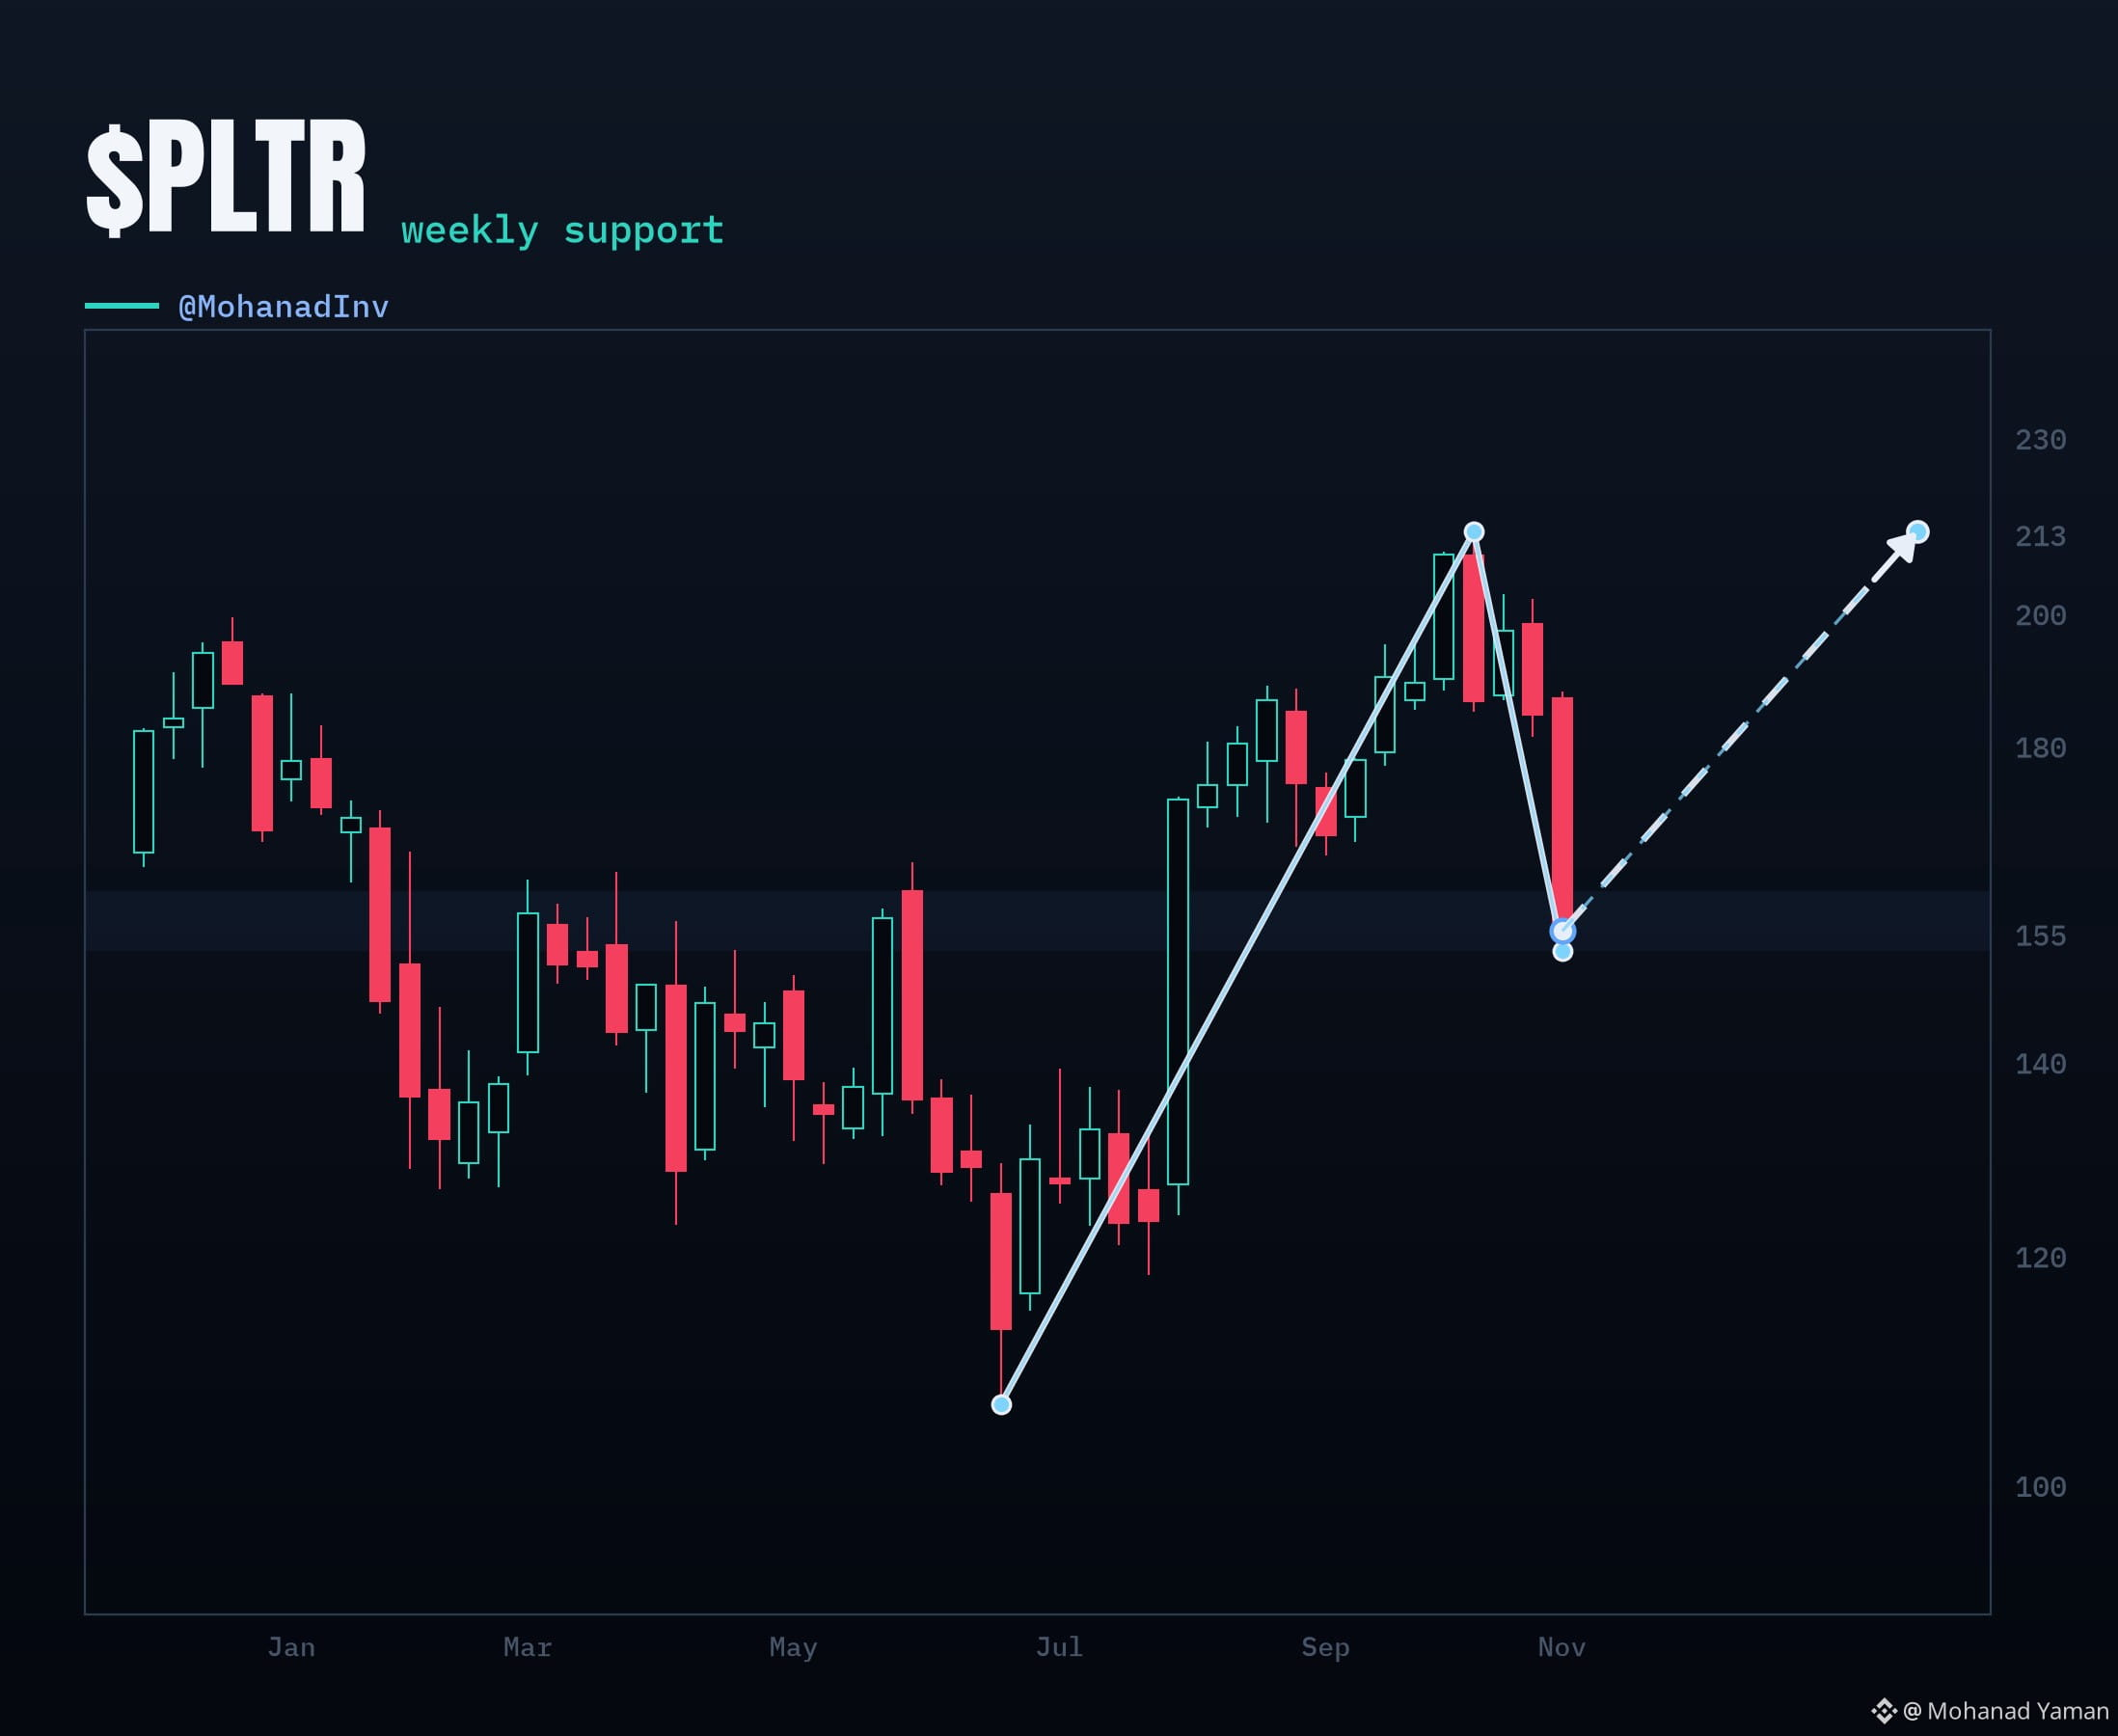
📈 $PLTR weekly chart sitting on support 👀
Jun $106.37 → Oct ATH $212.94
This week tagged $152.60 · 57% off that run
Close $154.99 · Soft $152.60
No clean setup until a weekly reclaim of $180–$188.37
Educational only · NFA
#stocks
{spot}(PLTRBUSDT)
📈 $PLTR weekly chart sitting on support 👀
Jun $106.37 → Oct ATH $212.94
This week tagged $152.60 · 57% off that run
Close $154.99 · Soft $152.60
No clean setup until a weekly reclaim of $180–$188.37
Educational only · NFA
#stocks
Jun $106.37 → Oct ATH $212.94
This week tagged $152.60 · 57% off that run
Close $154.99 · Soft $152.60
No clean setup until a weekly reclaim of $180–$188.37
Educational only · NFA
#stocks
2
531

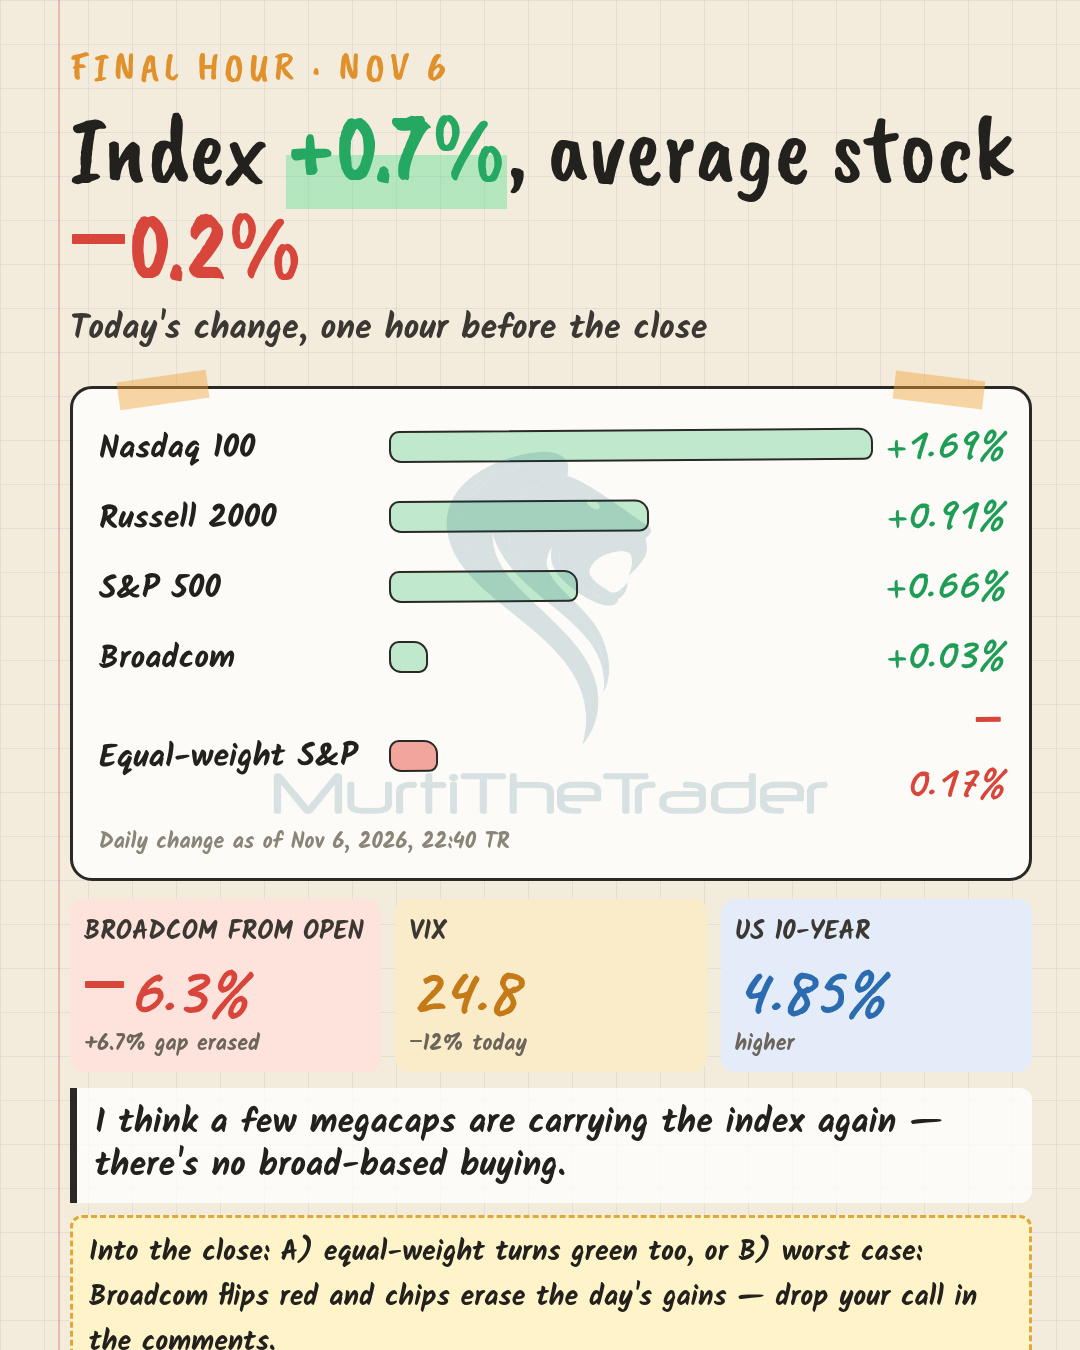
Final hour: S&P 500 +0.7%, but equal-weight S&P −0.2% — the average stock is red today.
→ Broadcom ($AVGO ) gave back its entire +6.7% open gap and is now flat at +0.0%
→ Nasdaq 100 +1.7%, VIX −12% to 24.8
I think a handful of megacaps are carrying the index again — there's no broad-based buying.
Into the close: A) equal-weight turns green too, or B) worst case: Broadcom flips red and chips erase the day's gains — drop your call in the comments.
Watching: $SPY $QQQ $AVGO
#Stocks #Economy #Semiconductors
Final hour: S&P 500 +0.7%, but equal-weight S&P −0.2% — the average stock is red today.
→ Broadcom ($AVGO ) gave back its entire +6.7% open gap and is now flat at +0.0%
→ Nasdaq 100 +1.7%, VIX −12% to 24.8
I think a handful of megacaps are carrying the index again — there's no broad-based buying.
Into the close: A) equal-weight turns green too, or B) worst case: Broadcom flips red and chips erase the day's gains — drop your call in the comments.
Watching: $SPY $QQQ $AVGO
#Stocks #Economy #Semiconductors
→ Broadcom ($AVGO ) gave back its entire +6.7% open gap and is now flat at +0.0%
→ Nasdaq 100 +1.7%, VIX −12% to 24.8
I think a handful of megacaps are carrying the index again — there's no broad-based buying.
Into the close: A) equal-weight turns green too, or B) worst case: Broadcom flips red and chips erase the day's gains — drop your call in the comments.
Watching: $SPY $QQQ $AVGO
#Stocks #Economy #Semiconductors
87
·
--
Bullish
Verified
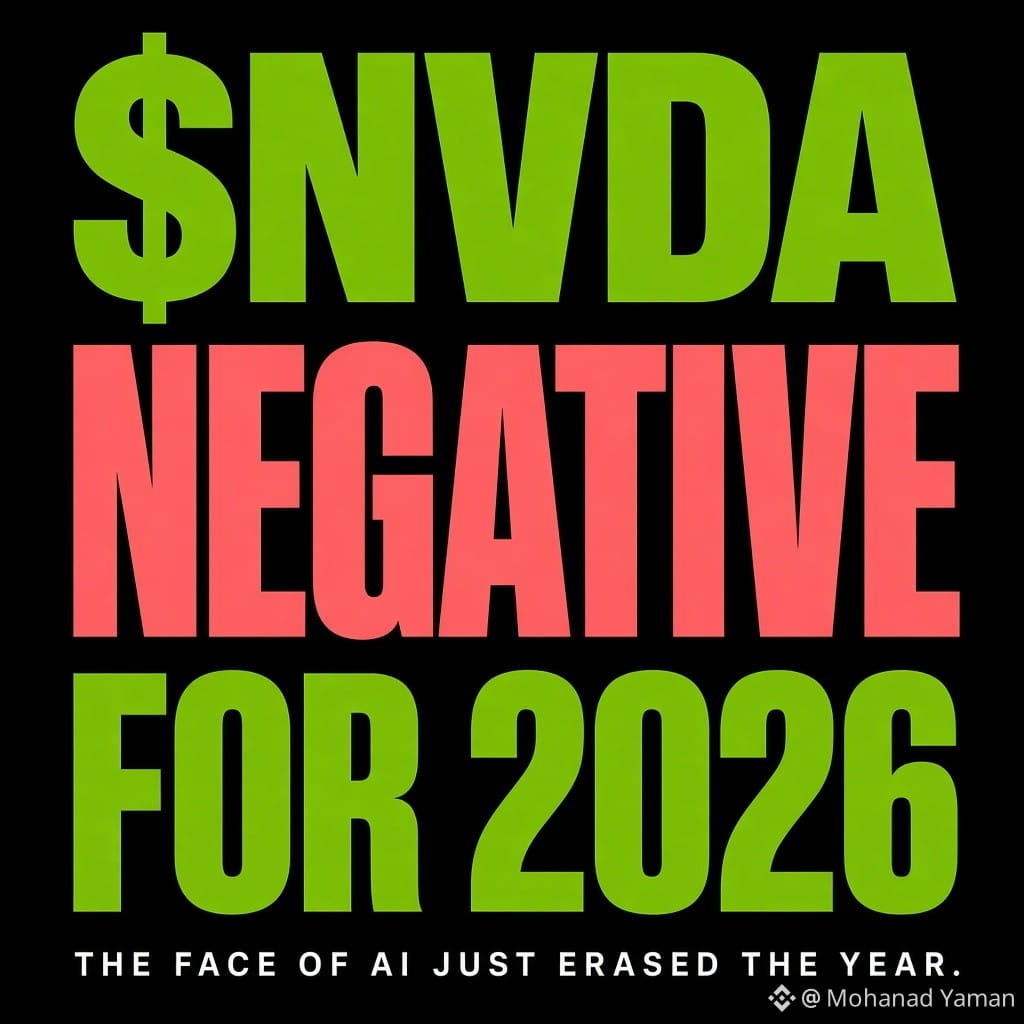
🚨 The face of AI just went red for the year
$NVDA closed at 181 last night. Down 9% on the day 📉
That one session knocked about $450B off its market value 🤯 Worst day since the DeepSeek scare in Jan 2025
Zoom out and it gets uglier
About 24% below the Oct 6 record
Nearly $1.4T in market value gone since that high
Fifth straight losing week
Trading under the 200 day moving average
And now negative for 2026
The Mag 7 lost over $1T yesterday. $NVDA alone took nearly half of that 💥
Earnings are Nov 17. That is the next real test, will it keep dumping or we rally from there? 👀
#stocks
{spot}(NVDABUSDT)
🚨 The face of AI just went red for the year
$NVDA closed at 181 last night. Down 9% on the day 📉
That one session knocked about $450B off its market value 🤯 Worst day since the DeepSeek scare in Jan 2025
Zoom out and it gets uglier
About 24% below the Oct 6 record
Nearly $1.4T in market value gone since that high
Fifth straight losing week
Trading under the 200 day moving average
And now negative for 2026
The Mag 7 lost over $1T yesterday. $NVDA alone took nearly half of that 💥
Earnings are Nov 17. That is the next real test, will it keep dumping or we rally from there? 👀
#stocks
$NVDA closed at 181 last night. Down 9% on the day 📉
That one session knocked about $450B off its market value 🤯 Worst day since the DeepSeek scare in Jan 2025
Zoom out and it gets uglier
About 24% below the Oct 6 record
Nearly $1.4T in market value gone since that high
Fifth straight losing week
Trading under the 200 day moving average
And now negative for 2026
The Mag 7 lost over $1T yesterday. $NVDA alone took nearly half of that 💥
Earnings are Nov 17. That is the next real test, will it keep dumping or we rally from there? 👀
#stocks
827
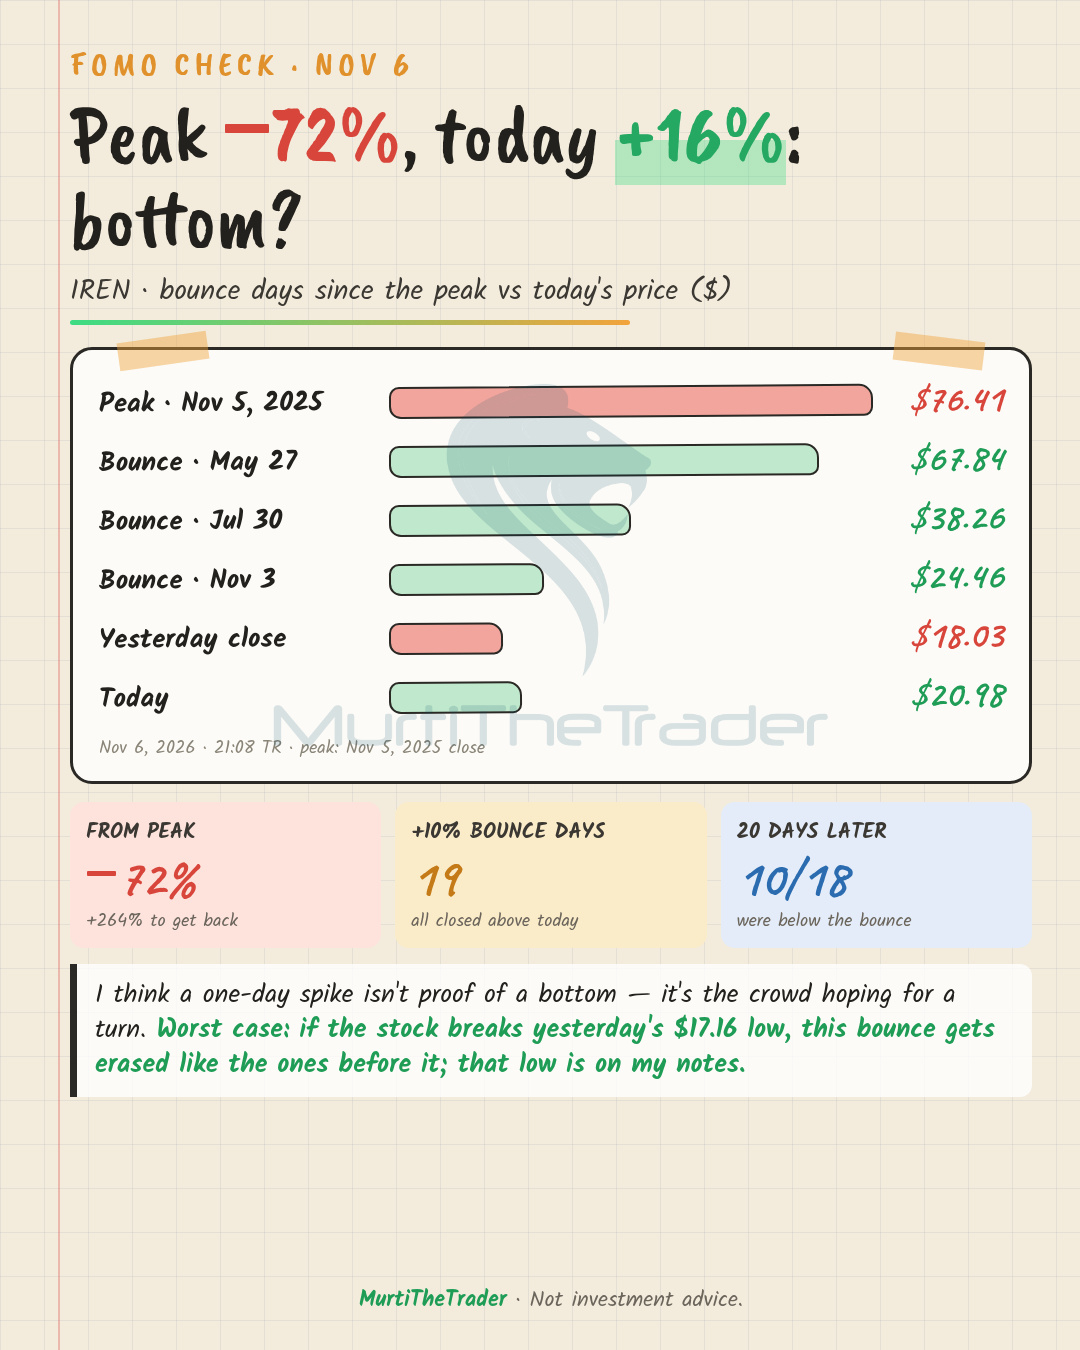
FOMO check: Everyone says "IREN bottomed." The stock is +16% today, but anyone who bought the peak is still −72%.
→ Since the peak it's bounced +10% in a single day 19 times — and every one of those closes was above today's $20.98
→ Biggest flow of the day: ~$1.8M in 2027 calls, ~$1.55M on the sell side
→ Last hour: ~$588k of buying in 2027 puts
I think a one-day spike isn't proof of a bottom — it's hope of a turn. Worst case: if yesterday's $17.16 low breaks, this bounce gets wiped like the ones before it — that low is noted.
Watching: $IREN $SPY $QQQ
#AI #Bitcoin #Stocks
FOMO check: Everyone says "IREN bottomed." The stock is +16% today, but anyone who bought the peak is still −72%.
→ Since the peak it's bounced +10% in a single day 19 times — and every one of those closes was above today's $20.98
→ Biggest flow of the day: ~$1.8M in 2027 calls, ~$1.55M on the sell side
→ Last hour: ~$588k of buying in 2027 puts
I think a one-day spike isn't proof of a bottom — it's hope of a turn. Worst case: if yesterday's $17.16 low breaks, this bounce gets wiped like the ones before it — that low is noted.
Watching: $IREN $SPY $QQQ
#AI #Bitcoin #Stocks
→ Since the peak it's bounced +10% in a single day 19 times — and every one of those closes was above today's $20.98
→ Biggest flow of the day: ~$1.8M in 2027 calls, ~$1.55M on the sell side
→ Last hour: ~$588k of buying in 2027 puts
I think a one-day spike isn't proof of a bottom — it's hope of a turn. Worst case: if yesterday's $17.16 low breaks, this bounce gets wiped like the ones before it — that low is noted.
Watching: $IREN $SPY $QQQ
#AI #Bitcoin #Stocks
190
·
--
Bullish
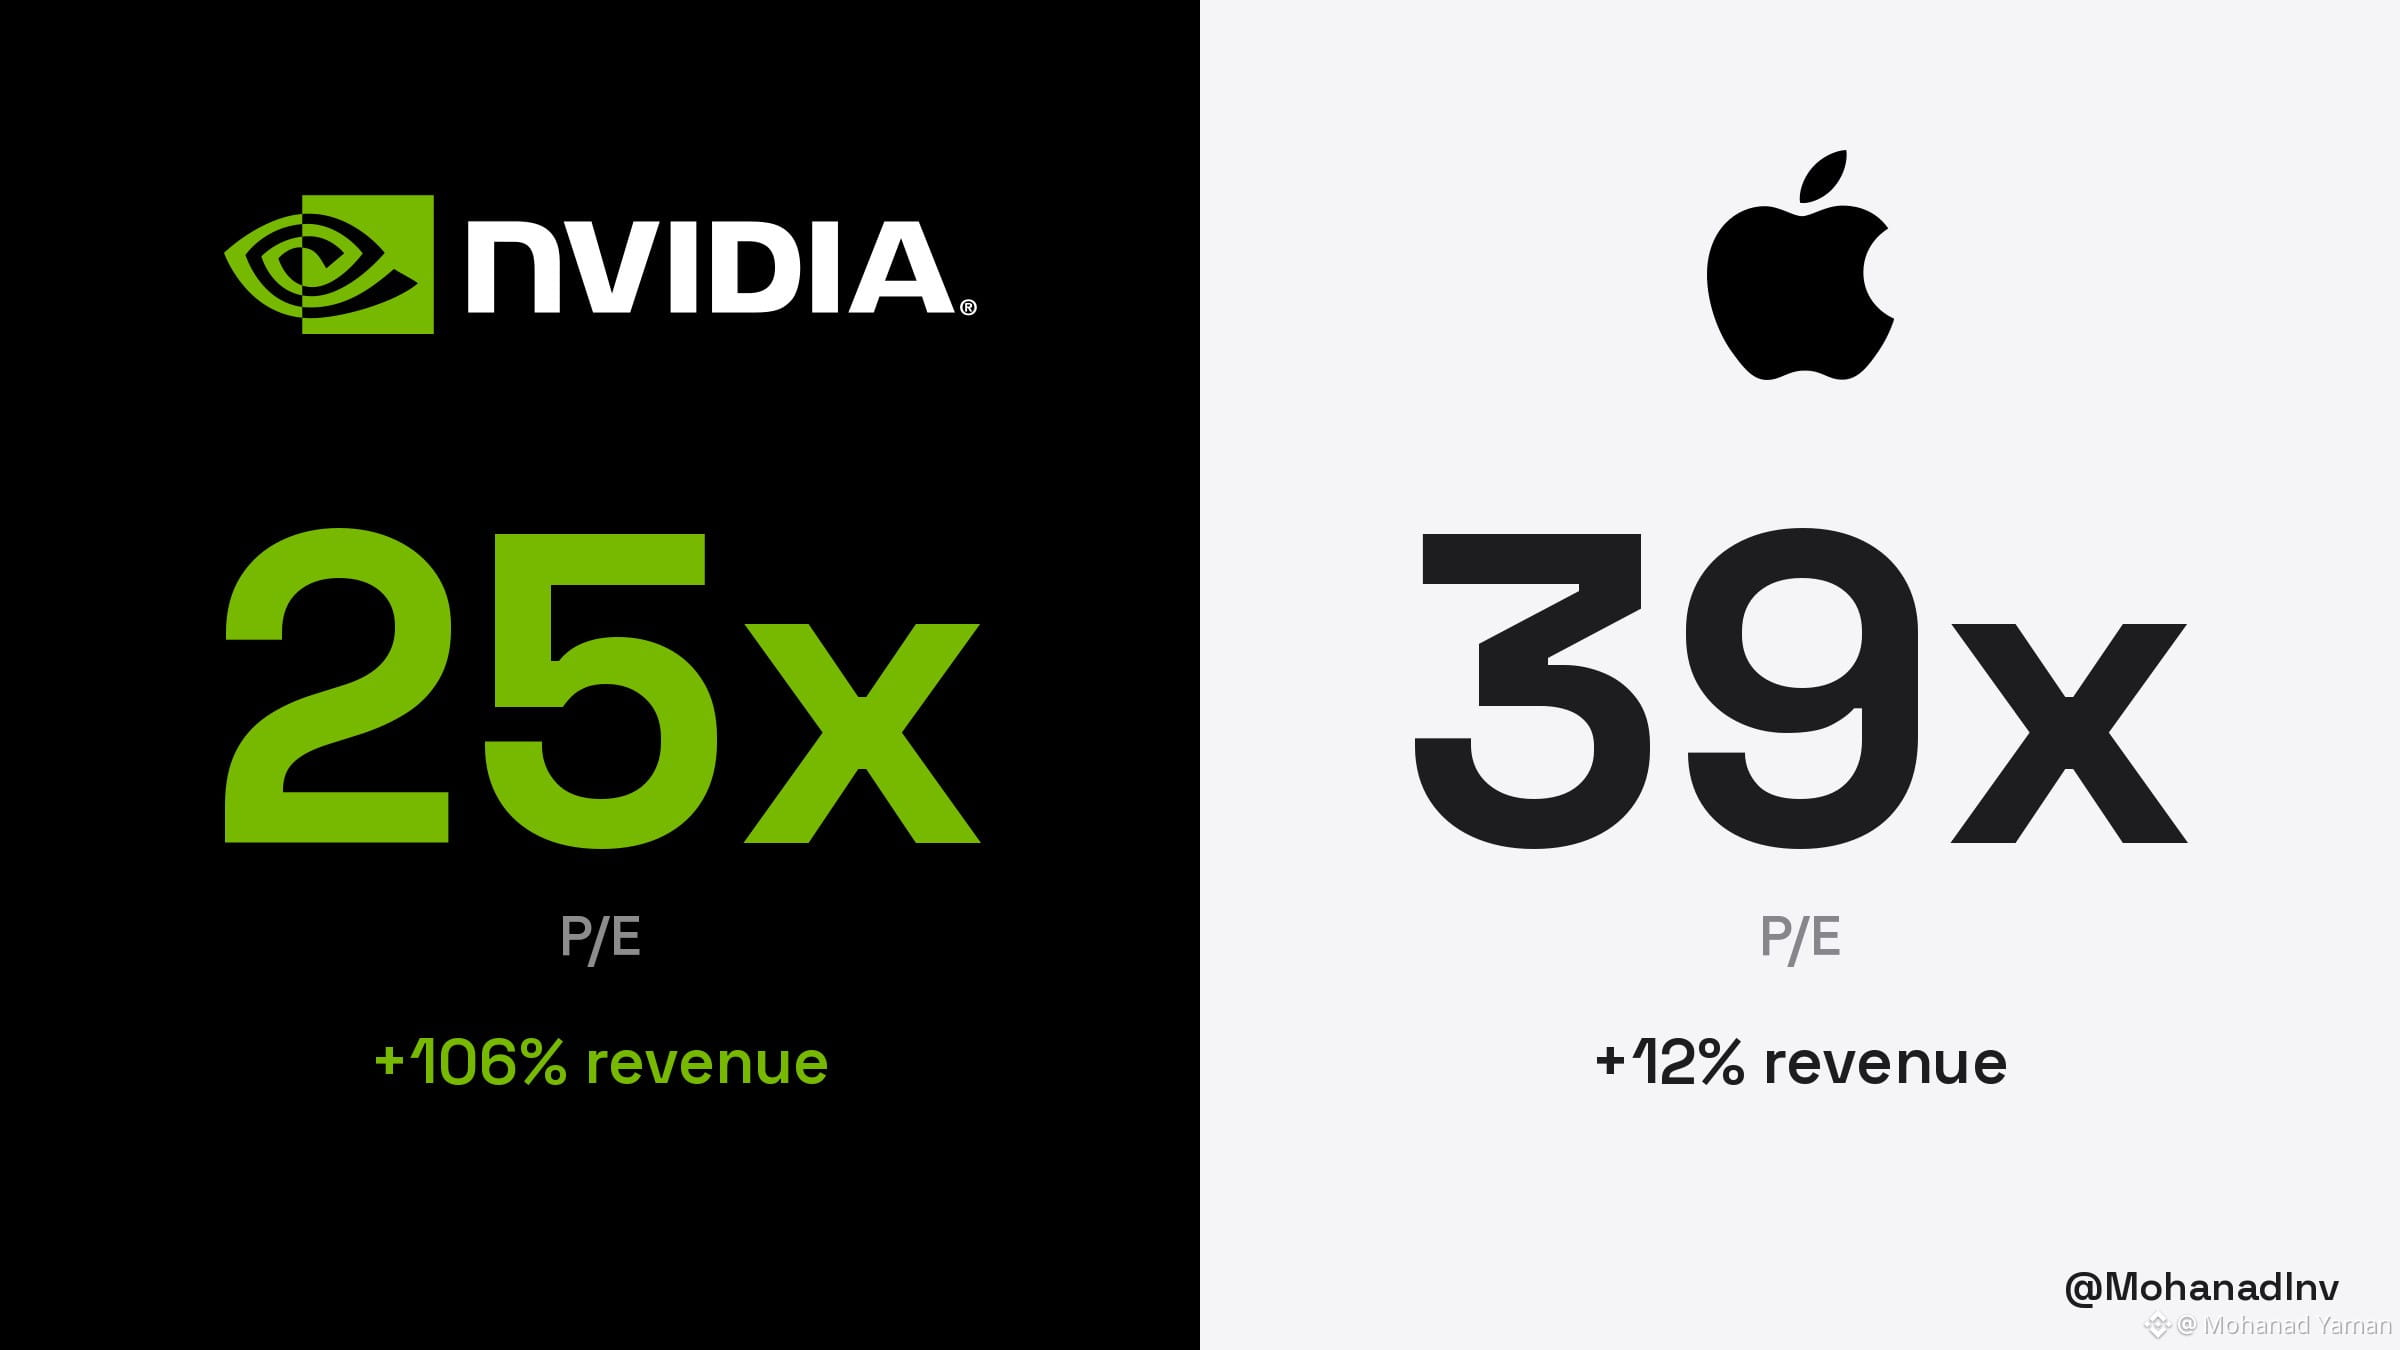
🍏 $AAPL trades at 38.9x trailing GAAP earnings. $NVDA
trades at 25.3x.
📈 Last quarter Apple grew revenue 11.7%. Nvidia grew it 105.9% 🔥
🤔 You're paying more per dollar of profit for the slower grower. Quality premium or overpaying?
#stocks
{spot}(NVDABUSDT)
🍏 $AAPL trades at 38.9x trailing GAAP earnings. $NVDA
trades at 25.3x.
📈 Last quarter Apple grew revenue 11.7%. Nvidia grew it 105.9% 🔥
🤔 You're paying more per dollar of profit for the slower grower. Quality premium or overpaying?
#stocks
trades at 25.3x.
📈 Last quarter Apple grew revenue 11.7%. Nvidia grew it 105.9% 🔥
🤔 You're paying more per dollar of profit for the slower grower. Quality premium or overpaying?
#stocks
144

·
--
Chip Surge: $AMDB Poised for Breakout on Binance Spot 🚀
Advanced Micro Devices (AMDB/USDT) is trading at $447.90 on Binance Spot, up 10.38% in the last 24 hours. $AMDB’s rally reflects the broader semiconductor rebound as demand for AI‑accelerated workloads climbs.
Price action: The stock is coiling just below a key resistance zone, with volume modestly above average but lacking a decisive spike.
Key levels: Immediate support sits around $430.00, a zone that held during the previous pull‑back. Mid‑range pressure is near $440.00, acting as a psychological pivot. Resistance is clustered at $455.00–$460.00; a clean break above $455 would signal the next leg, while a dip back to $430 could re‑anchor the consolidation range.
Short outlook: From a breakout‑watch perspective, a volume surge through $455 would likely launch a bullish breakout, aligning with the sector’s upward thrust. Absent that catalyst, price may retest $430 before resuming the upward bias.
#AMDB #Stocks #BinanceSquare
Chip Surge: $AMDB Poised for Breakout on Binance Spot 🚀
Advanced Micro Devices (AMDB/USDT) is trading at $447.90 on Binance Spot, up 10.38% in the last 24 hours. $AMDB ’s rally reflects the broader semiconductor rebound as demand for AI‑accelerated workloads climbs.
Price action: The stock is coiling just below a key resistance zone, with volume modestly above average but lacking a decisive spike.
Key levels: Immediate support sits around $430.00, a zone that held during the previous pull‑back. Mid‑range pressure is near $440.00, acting as a psychological pivot. Resistance is clustered at $455.00–$460.00; a clean break above $455 would signal the next leg, while a dip back to $430 could re‑anchor the consolidation range.
Short outlook: From a breakout‑watch perspective, a volume surge through $455 would likely launch a bullish breakout, aligning with the sector’s upward thrust. Absent that catalyst, price may retest $430 before resuming the upward bias.
#AMDB #Stocks #BinanceSquare
Advanced Micro Devices (AMDB/USDT) is trading at $447.90 on Binance Spot, up 10.38% in the last 24 hours. $AMDB ’s rally reflects the broader semiconductor rebound as demand for AI‑accelerated workloads climbs.
Price action: The stock is coiling just below a key resistance zone, with volume modestly above average but lacking a decisive spike.
Key levels: Immediate support sits around $430.00, a zone that held during the previous pull‑back. Mid‑range pressure is near $440.00, acting as a psychological pivot. Resistance is clustered at $455.00–$460.00; a clean break above $455 would signal the next leg, while a dip back to $430 could re‑anchor the consolidation range.
Short outlook: From a breakout‑watch perspective, a volume surge through $455 would likely launch a bullish breakout, aligning with the sector’s upward thrust. Absent that catalyst, price may retest $430 before resuming the upward bias.
#AMDB #Stocks #BinanceSquare
·
--
Bullish
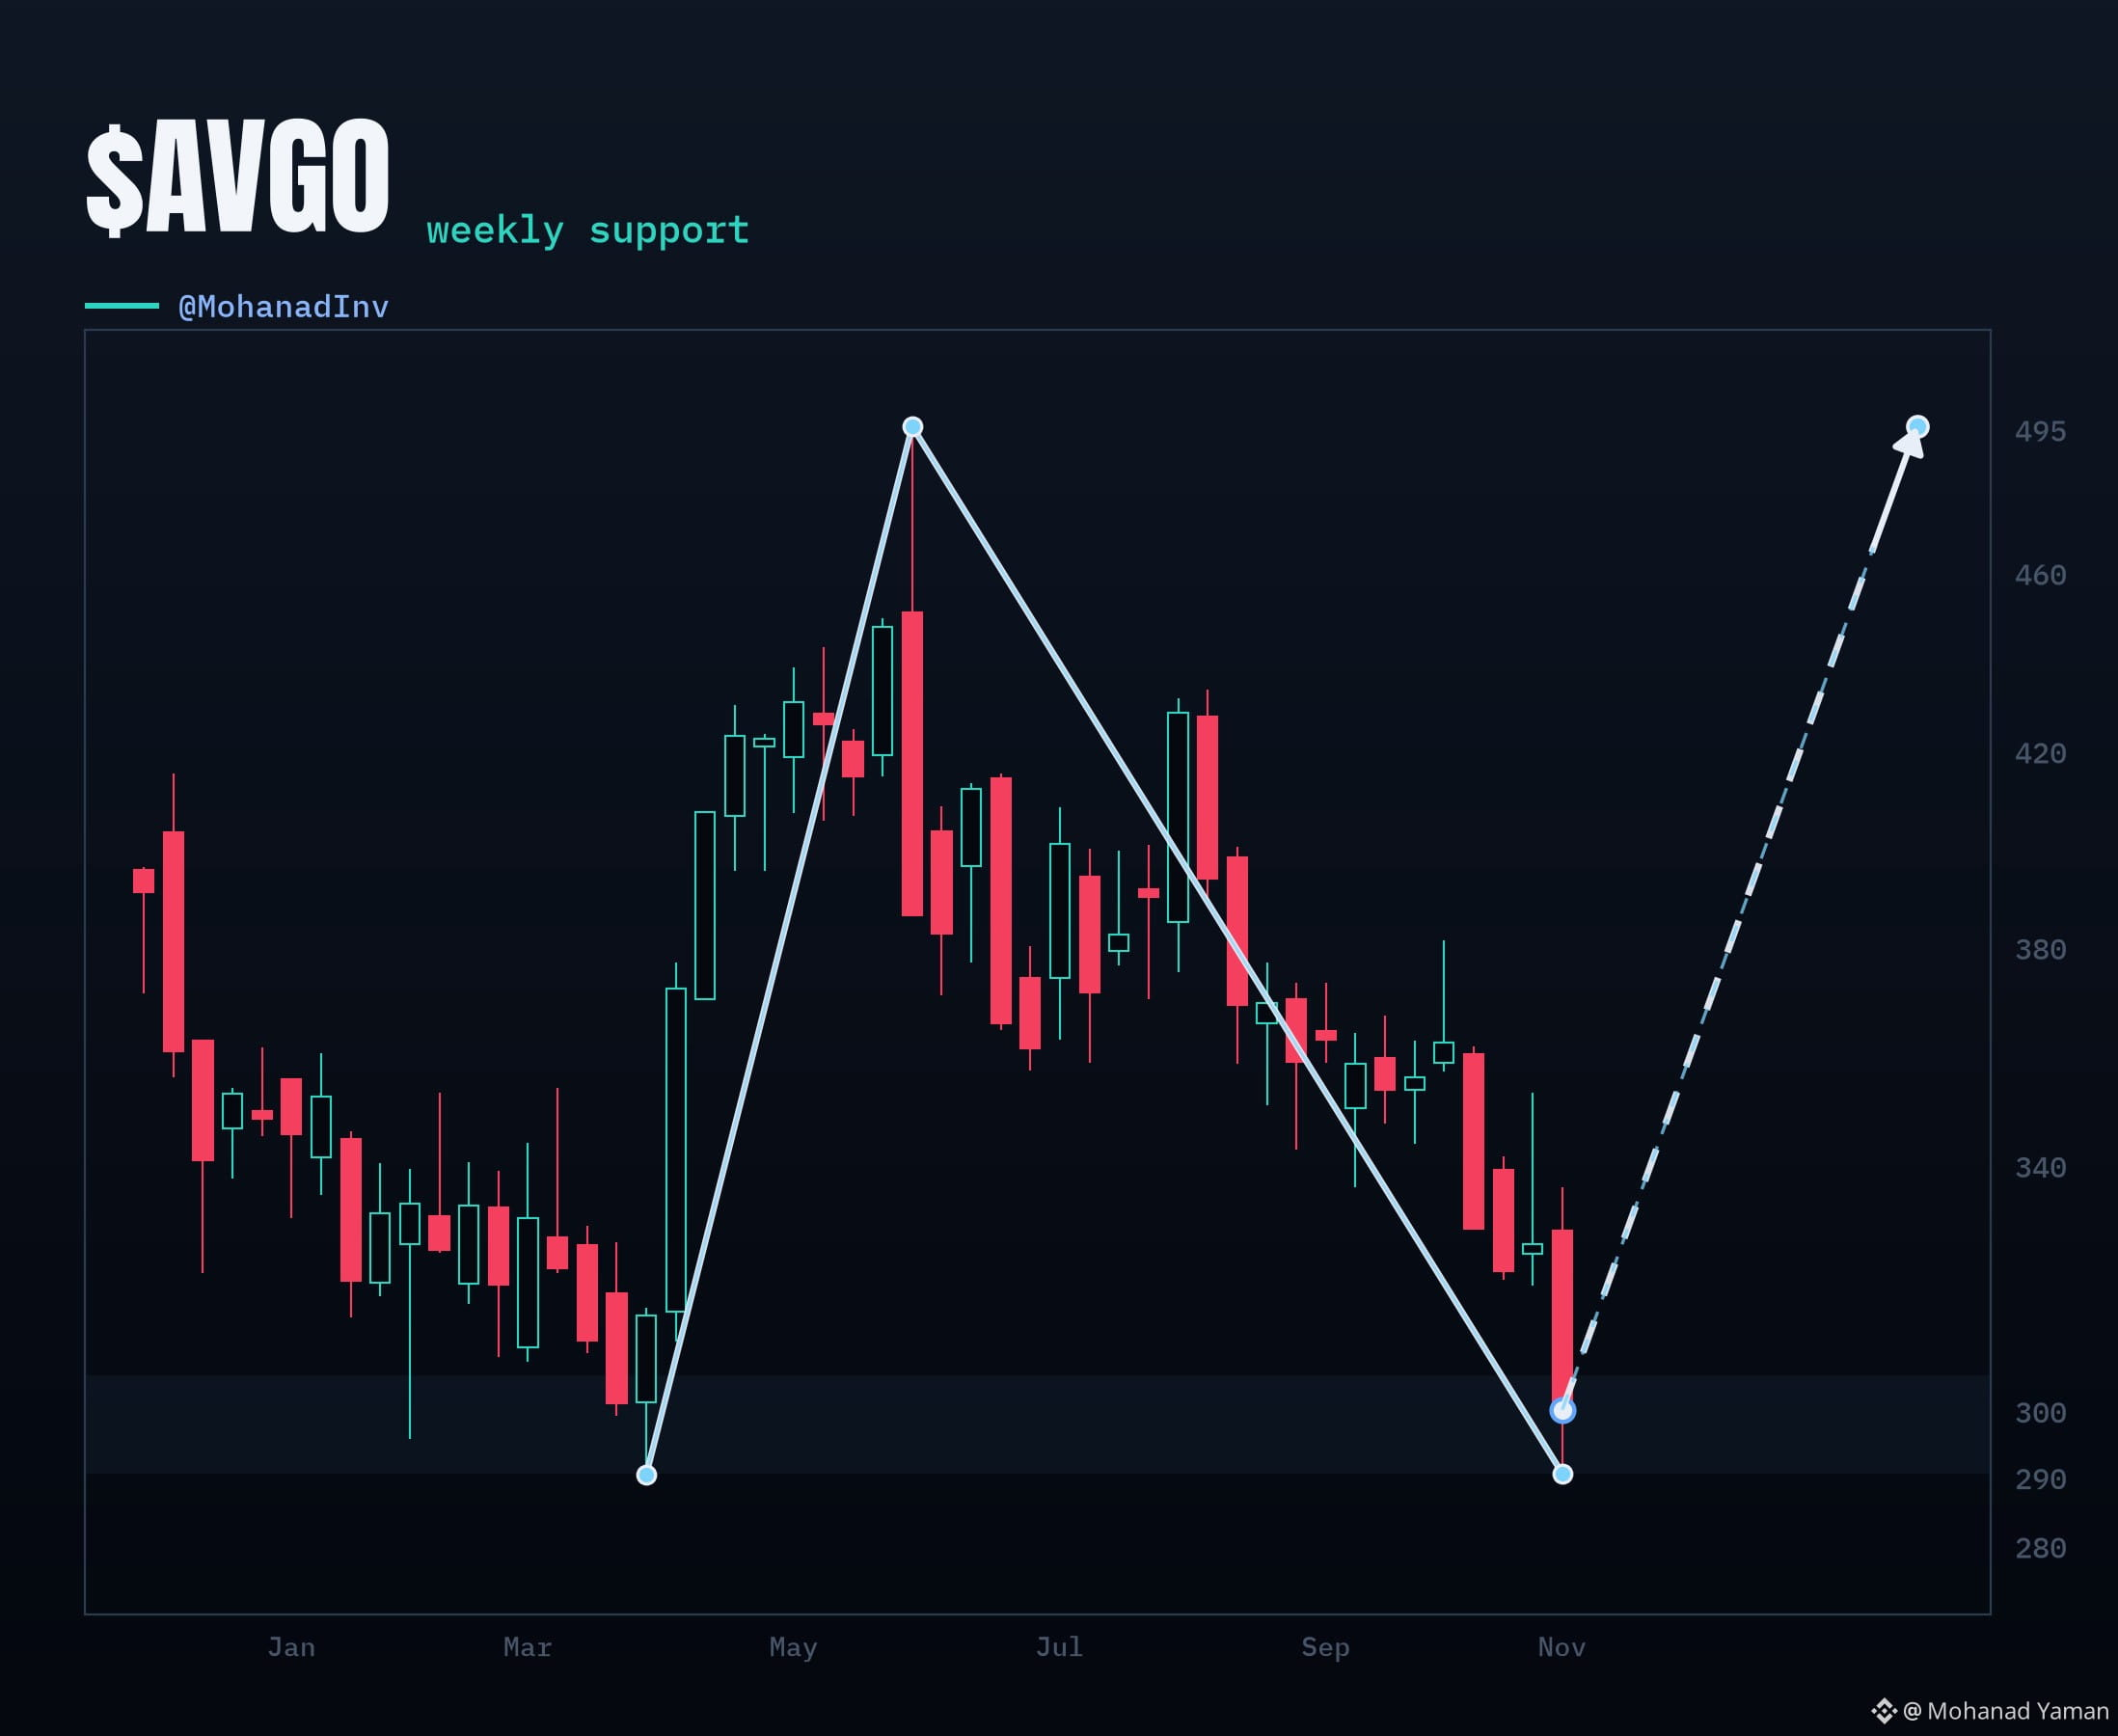
📈 $AVGO sitting on the Mar shelf 👀
✅️ Big selloff. Held over $290.12 this week
📍 From $289.96 up to $495.00 ATH
⬇️ Back to $290.12 this week
📌 Live $299.74 · Invalid under $290.12 📉
Weekly reclaim $368.38 to $416.74 first · then talk setups
Educational only · NFA
#stocks
{spot}(AVGOBUSDT)
📈 $AVGO sitting on the Mar shelf 👀
✅️ Big selloff. Held over $290.12 this week
📍 From $289.96 up to $495.00 ATH
⬇️ Back to $290.12 this week
📌 Live $299.74 · Invalid under $290.12 📉
Weekly reclaim $368.38 to $416.74 first · then talk setups
Educational only · NFA
#stocks
✅️ Big selloff. Held over $290.12 this week
📍 From $289.96 up to $495.00 ATH
⬇️ Back to $290.12 this week
📌 Live $299.74 · Invalid under $290.12 📉
Weekly reclaim $368.38 to $416.74 first · then talk setups
Educational only · NFA
#stocks
87

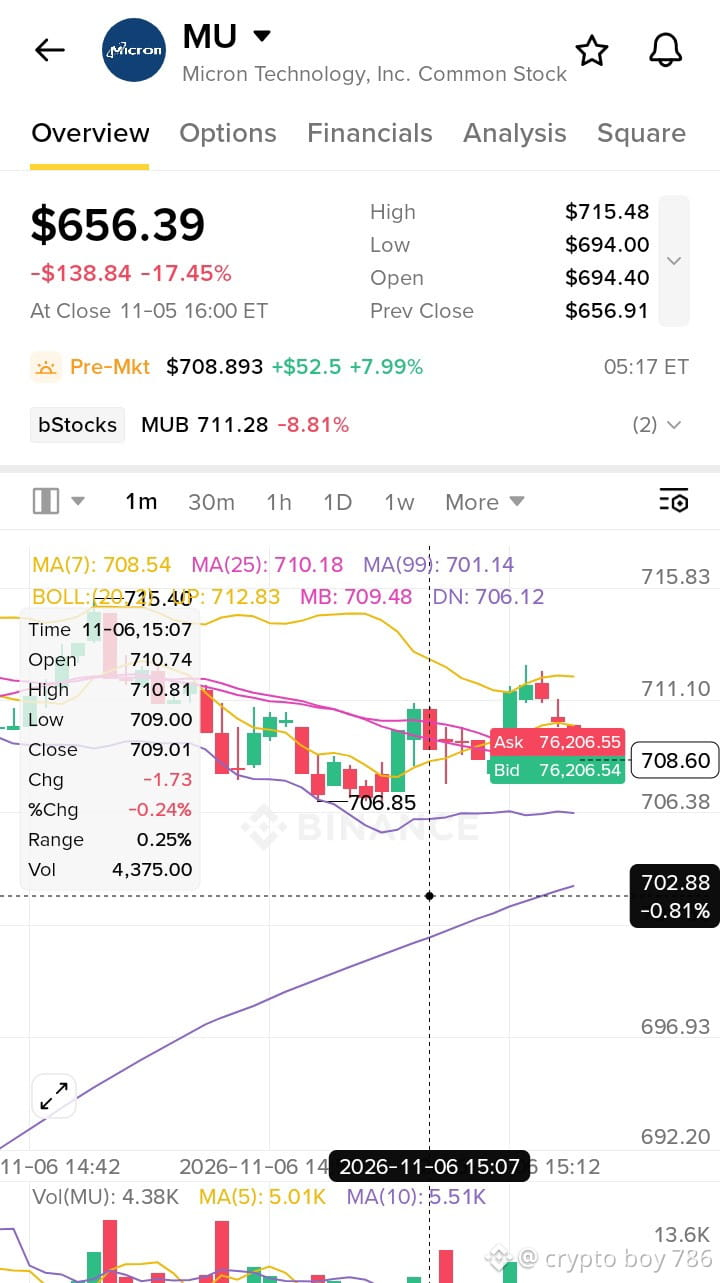
$MU – $712.57 (+8.56%)Micron Technology is leading today's stock performance with an impressive 8.56% gain, bringing its price to $712.57. Strong interest in memory chips and AI infrastructure may be supporting market enthusiasm. This is a notable move, but investors should remain careful about volatility and sudden price changes.
$MU
{future}(MUUSDT)
#BinanceReopensWithdrawalsForMoreAssets #Write2Earn #MU #Micron #Stocks
$MU – $712.57 (+8.56%)Micron Technology is leading today's stock performance with an impressive 8.56% gain, bringing its price to $712.57. Strong interest in memory chips and AI infrastructure may be supporting market enthusiasm. This is a notable move, but investors should remain careful about volatility and sudden price changes.
$MU
#BinanceReopensWithdrawalsForMoreAssets #Write2Earn #MU #Micron #Stocks
$MU
#BinanceReopensWithdrawalsForMoreAssets #Write2Earn #MU #Micron #Stocks
172
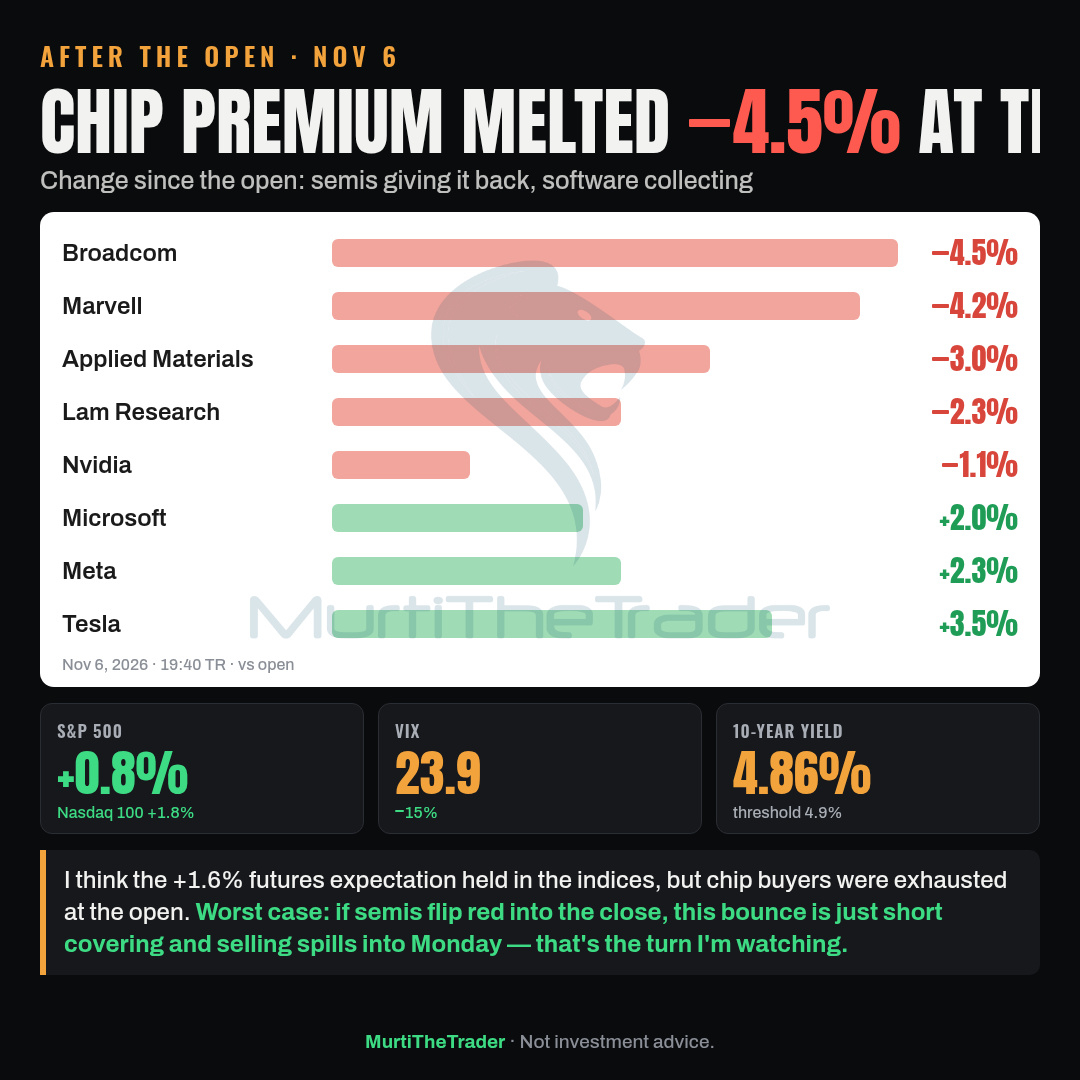
After the open: Broadcom ($AVGO ) started the day +6.7%, melted −4.5% from the open and is now only +1.9%.
→ Marvell ($MRVL ) −4.2%, Applied Materials −3.0%, Lam Research −2.3%
→ Microsoft ($MSFT ) has picked up +2.0% since the open
→ S&P 500 +0.8%, Nasdaq 100 +1.8%, VIX 23.9
I think the +1.6% futures expectation held in the indices, but chip buyers were exhausted at the open. Worst case: if semis flip red into the close, this bounce is just short covering and selling spills into Monday — that's the turn I'm watching.
Watching: $AVGO $MRVL $MSFT
#Semiconductors #AI #Stocks
After the open: Broadcom ($AVGO ) started the day +6.7%, melted −4.5% from the open and is now only +1.9%.
→ Marvell ($MRVL ) −4.2%, Applied Materials −3.0%, Lam Research −2.3%
→ Microsoft ($MSFT ) has picked up +2.0% since the open
→ S&P 500 +0.8%, Nasdaq 100 +1.8%, VIX 23.9
I think the +1.6% futures expectation held in the indices, but chip buyers were exhausted at the open. Worst case: if semis flip red into the close, this bounce is just short covering and selling spills into Monday — that's the turn I'm watching.
Watching: $AVGO $MRVL $MSFT
#Semiconductors #AI #Stocks
→ Marvell ($MRVL ) −4.2%, Applied Materials −3.0%, Lam Research −2.3%
→ Microsoft ($MSFT ) has picked up +2.0% since the open
→ S&P 500 +0.8%, Nasdaq 100 +1.8%, VIX 23.9
I think the +1.6% futures expectation held in the indices, but chip buyers were exhausted at the open. Worst case: if semis flip red into the close, this bounce is just short covering and selling spills into Monday — that's the turn I'm watching.
Watching: $AVGO $MRVL $MSFT
#Semiconductors #AI #Stocks
198
·
--
Cyber Defense Rally: $CRWDB Gains Steam on Binance Spot 🚀
CrowdStrike Holdings tokenized as CRWDB/USDT is trading at $225.96, up 3.95% over the past 24 h on Binance Spot. $CRWDB is benefitting from the broader cyber‑security sector’s earnings beat trend, reinforcing demand for threat‑intelligence platforms.
Price action: The stock opened near $220, surged past $225, and now holds above the $224.50 intraday pivot, indicating strong buying pressure.
Key levels – Immediate support sits at $221.00, a zone that held during the last pull‑back. Resistance clusters around $230.00, the next ceiling that has capped prior rallies. The mid‑range equilibrium is near $225.00, acting as a balance point for short‑term traders.
Short outlook: With momentum building and no adverse news, dips to the $221‑$223 band appear attractive for entry. Expect the bullish continuation to persist as institutional inflows chase sector outperformance, targeting a break above $230.00.
#CRWDB #Stocks #BinanceSquare
Cyber Defense Rally: $CRWDB Gains Steam on Binance Spot 🚀
CrowdStrike Holdings tokenized as CRWDB/USDT is trading at $225.96, up 3.95% over the past 24 h on Binance Spot. $CRWDB is benefitting from the broader cyber‑security sector’s earnings beat trend, reinforcing demand for threat‑intelligence platforms.
Price action: The stock opened near $220, surged past $225, and now holds above the $224.50 intraday pivot, indicating strong buying pressure.
Key levels – Immediate support sits at $221.00, a zone that held during the last pull‑back. Resistance clusters around $230.00, the next ceiling that has capped prior rallies. The mid‑range equilibrium is near $225.00, acting as a balance point for short‑term traders.
Short outlook: With momentum building and no adverse news, dips to the $221‑$223 band appear attractive for entry. Expect the bullish continuation to persist as institutional inflows chase sector outperformance, targeting a break above $230.00.
#CRWDB #Stocks #BinanceSquare
CrowdStrike Holdings tokenized as CRWDB/USDT is trading at $225.96, up 3.95% over the past 24 h on Binance Spot. $CRWDB is benefitting from the broader cyber‑security sector’s earnings beat trend, reinforcing demand for threat‑intelligence platforms.
Price action: The stock opened near $220, surged past $225, and now holds above the $224.50 intraday pivot, indicating strong buying pressure.
Key levels – Immediate support sits at $221.00, a zone that held during the last pull‑back. Resistance clusters around $230.00, the next ceiling that has capped prior rallies. The mid‑range equilibrium is near $225.00, acting as a balance point for short‑term traders.
Short outlook: With momentum building and no adverse news, dips to the $221‑$223 band appear attractive for entry. Expect the bullish continuation to persist as institutional inflows chase sector outperformance, targeting a break above $230.00.
#CRWDB #Stocks #BinanceSquare

·
--
White House economic advisor Kevin Hassett stated that Intel's results are a positive sign for the chip industry.
The comment comes as $INTC has declined 54% over the past 30 days, losing over $310,000,000,000 in value.
#Markets #Stocks
White House economic advisor Kevin Hassett stated that Intel's results are a positive sign for the chip industry.
The comment comes as $INTC has declined 54% over the past 30 days, losing over $310,000,000,000 in value.
#Markets #Stocks
The comment comes as $INTC has declined 54% over the past 30 days, losing over $310,000,000,000 in value.
#Markets #Stocks
260
Partly True
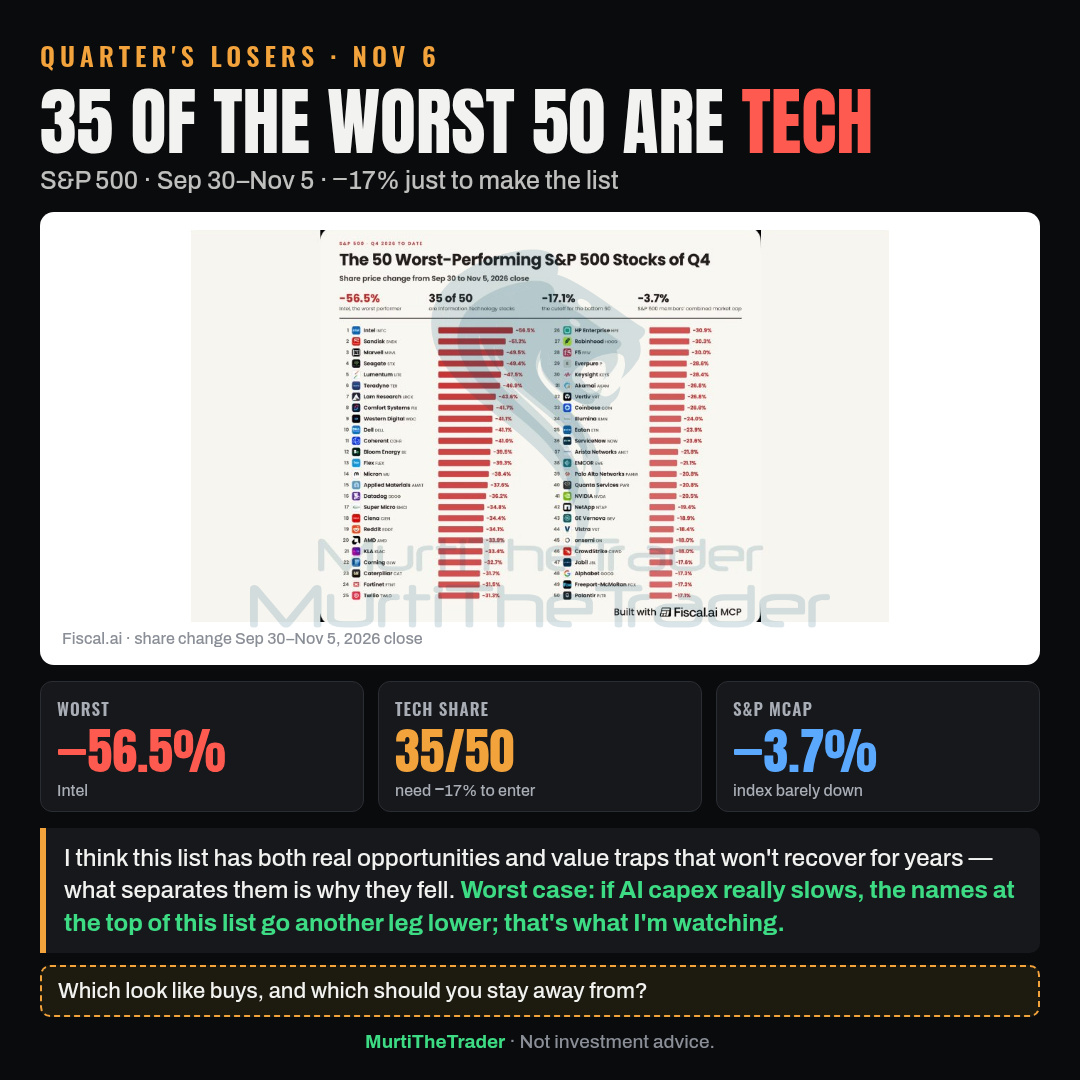
In the S&P 500, 35 of the 50 worst Q4 names are tech — and you need −17% just to make the list (Fiscal.ai data).
→ Intel ($INTC ) −56.5%, Sandisk −51.2%
→ Micron ($MU ) −38.4%, Nvidia ($NVDA ) −20.5%
→ Combined S&P market cap only −3.7%
I think this list has both real opportunities and value traps that won't recover for years — what separates them is why they fell. Worst case: if AI capex really slows, the names at the top go another leg lower; that's what I'm watching.
Which look like buys, and which should you stay away from? Drop it in the comments.
Watching: $INTC $MU $NVDA
#Semiconductors #AI #Stocks
In the S&P 500, 35 of the 50 worst Q4 names are tech — and you need −17% just to make the list (Fiscal.ai data).
→ Intel ($INTC ) −56.5%, Sandisk −51.2%
→ Micron ($MU ) −38.4%, Nvidia ($NVDA ) −20.5%
→ Combined S&P market cap only −3.7%
I think this list has both real opportunities and value traps that won't recover for years — what separates them is why they fell. Worst case: if AI capex really slows, the names at the top go another leg lower; that's what I'm watching.
Which look like buys, and which should you stay away from? Drop it in the comments.
Watching: $INTC $MU $NVDA
#Semiconductors #AI #Stocks
→ Intel ($INTC ) −56.5%, Sandisk −51.2%
→ Micron ($MU ) −38.4%, Nvidia ($NVDA ) −20.5%
→ Combined S&P market cap only −3.7%
I think this list has both real opportunities and value traps that won't recover for years — what separates them is why they fell. Worst case: if AI capex really slows, the names at the top go another leg lower; that's what I'm watching.
Which look like buys, and which should you stay away from? Drop it in the comments.
Watching: $INTC $MU $NVDA
#Semiconductors #AI #Stocks
707
·
--
Bullish
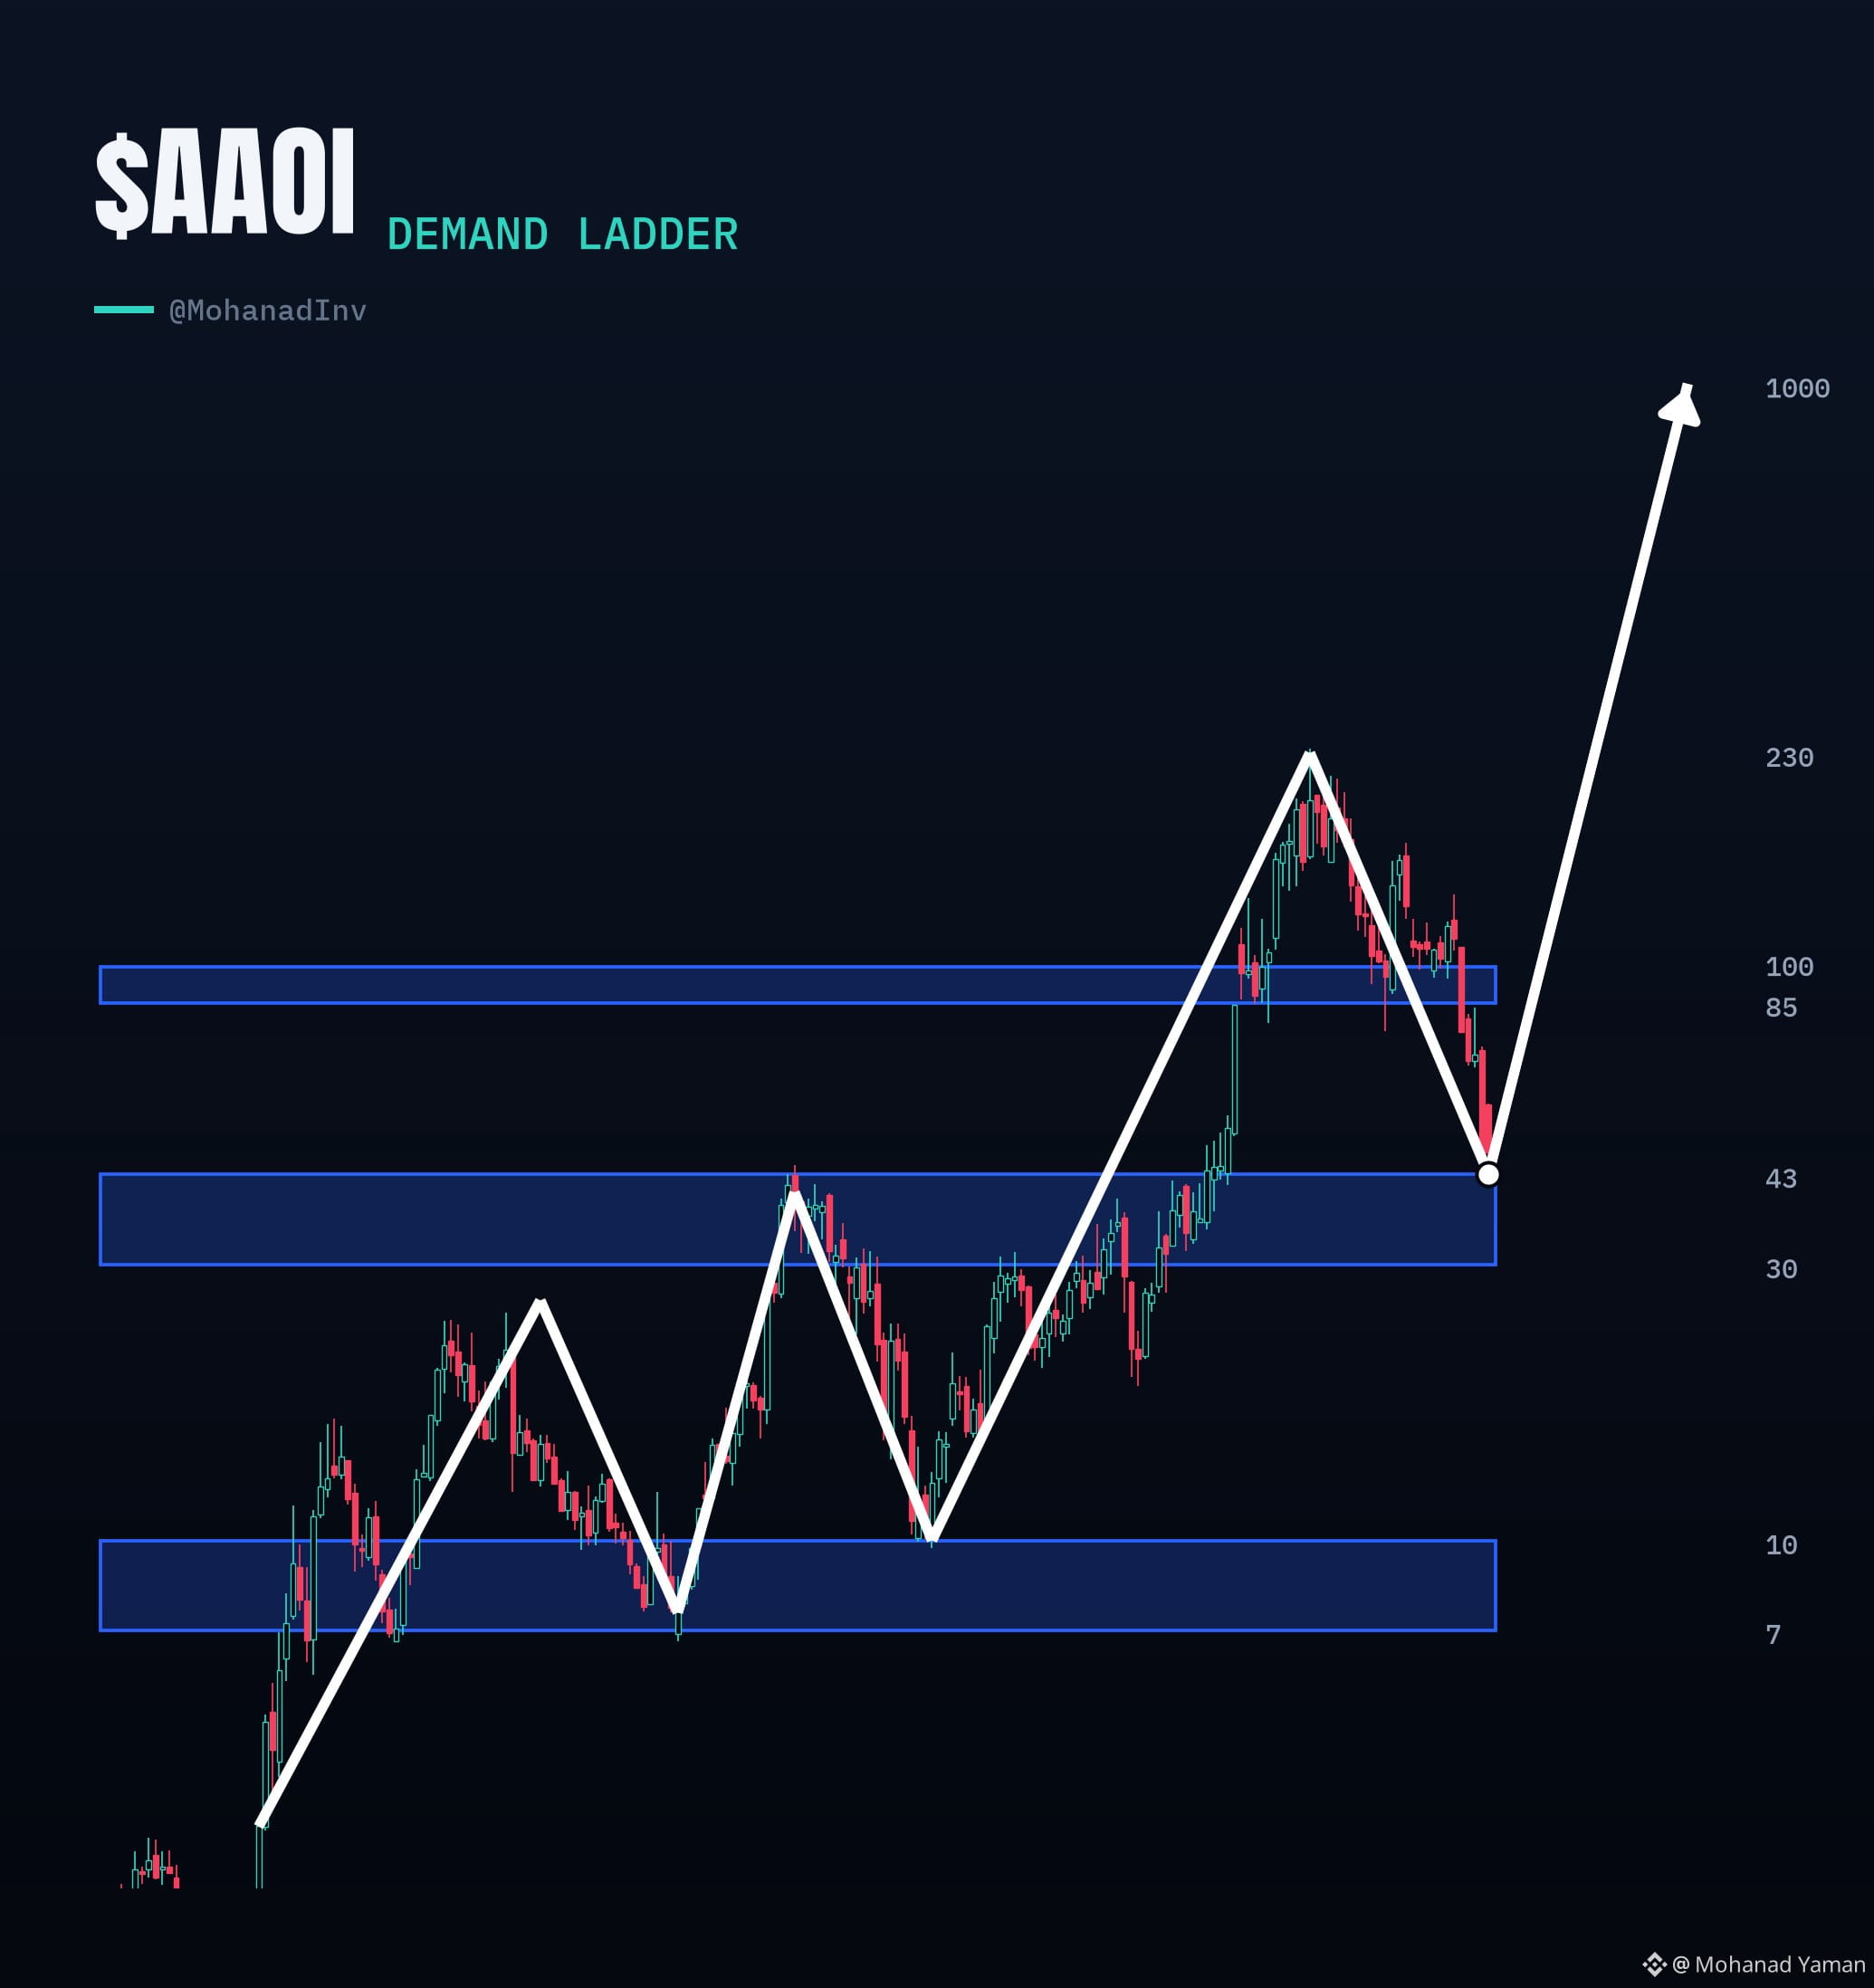
📈 $AAOI I just got handed the next rung on the ladder 👀
Last two times it claimed a demand zone, it ripped to new highs
$7 → $43 (+514%) 🚀
$10 → $230 (+2,200%) 🚀
$43 → $1,000 next 🤔🤔
✅ Q3 reported $270M (+128% YoY) and flipped to profit. The dump was the soft Q4 guide and a slower capacity buildout not demand dying
Same setup. Bigger target. To Uranus next? 🚀🪐
I personally don't know 😅
#stocks
{spot}(AAOIBUSDT)
📈 $AAOI I just got handed the next rung on the ladder 👀
Last two times it claimed a demand zone, it ripped to new highs
$7 → $43 (+514%) 🚀
$10 → $230 (+2,200%) 🚀
$43 → $1,000 next 🤔🤔
✅ Q3 reported $270M (+128% YoY) and flipped to profit. The dump was the soft Q4 guide and a slower capacity buildout not demand dying
Same setup. Bigger target. To Uranus next? 🚀🪐
I personally don't know 😅
#stocks
Last two times it claimed a demand zone, it ripped to new highs
$7 → $43 (+514%) 🚀
$10 → $230 (+2,200%) 🚀
$43 → $1,000 next 🤔🤔
✅ Q3 reported $270M (+128% YoY) and flipped to profit. The dump was the soft Q4 guide and a slower capacity buildout not demand dying
Same setup. Bigger target. To Uranus next? 🚀🪐
I personally don't know 😅
#stocks
Mohammad naeem 519:
$AAOI definitely has an interesting growth story. 📈
The revenue growth and return to profitability are encouraging signs, but reaching $1,000 is a huge target and will require strong execution.
I'm watching future earnings, demand trends, and the company's ability to expand capacity.
Potential is there, but fundamentals and confirmation matter more than hype. Let's see what happens next! 🚀
#AAOI #Stocks #Investing #MarketAnalysis
1
1.6k


·
--
Bearish
Partly True
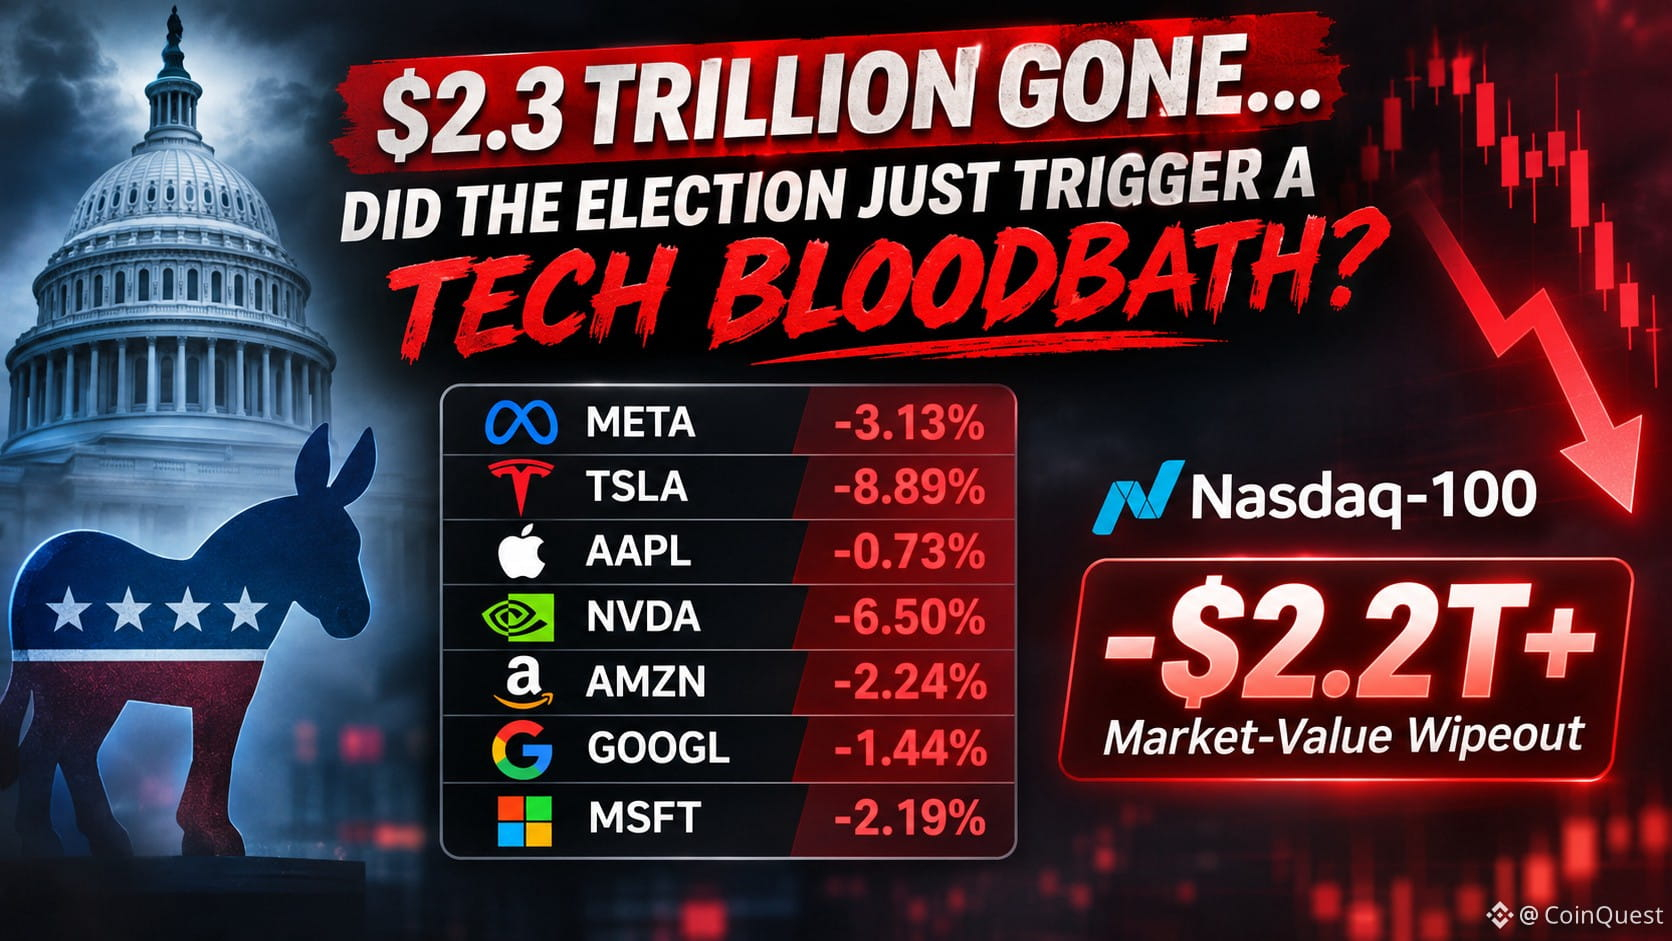
🚨 $2.3 TRILLION GONE… DID THE ELECTION JUST TRIGGER A TECH BLOODBATH?
The Democrats victory was followed by a massive reversal in US stocks… and the Magnificent 7 are taking serious damage.
$META: -3.13%
$TSLA: -8.89%
$AAPL : -0.73%
$NVDA : -6.50%
$AMZN: -2.24%
$GOOGL : -1.44%
$MSFT: -2.19%
The Nasdaq-100 is facing a potential $2.2T+ market-value wipeout as fears around AI regulation and data-center expansion hit the market.
One election… and suddenly the AI trade is facing a completely different Yesterday pump was a BULL TRAP ⁉️😱
#Stocks #USMarkets
🚨 $2.3 TRILLION GONE… DID THE ELECTION JUST TRIGGER A TECH BLOODBATH?
The Democrats victory was followed by a massive reversal in US stocks… and the Magnificent 7 are taking serious damage.
$META: -3.13%
$TSLA: -8.89%
$AAPL : -0.73%
$NVDA : -6.50%
$AMZN: -2.24%
$GOOGL : -1.44%
$MSFT: -2.19%
The Nasdaq-100 is facing a potential $2.2T+ market-value wipeout as fears around AI regulation and data-center expansion hit the market.
One election… and suddenly the AI trade is facing a completely different Yesterday pump was a BULL TRAP ⁉️😱
#Stocks #USMarkets
The Democrats victory was followed by a massive reversal in US stocks… and the Magnificent 7 are taking serious damage.
$META: -3.13%
$TSLA: -8.89%
$AAPL : -0.73%
$NVDA : -6.50%
$AMZN: -2.24%
$GOOGL : -1.44%
$MSFT: -2.19%
The Nasdaq-100 is facing a potential $2.2T+ market-value wipeout as fears around AI regulation and data-center expansion hit the market.
One election… and suddenly the AI trade is facing a completely different Yesterday pump was a BULL TRAP ⁉️😱
#Stocks #USMarkets
3
2.4k
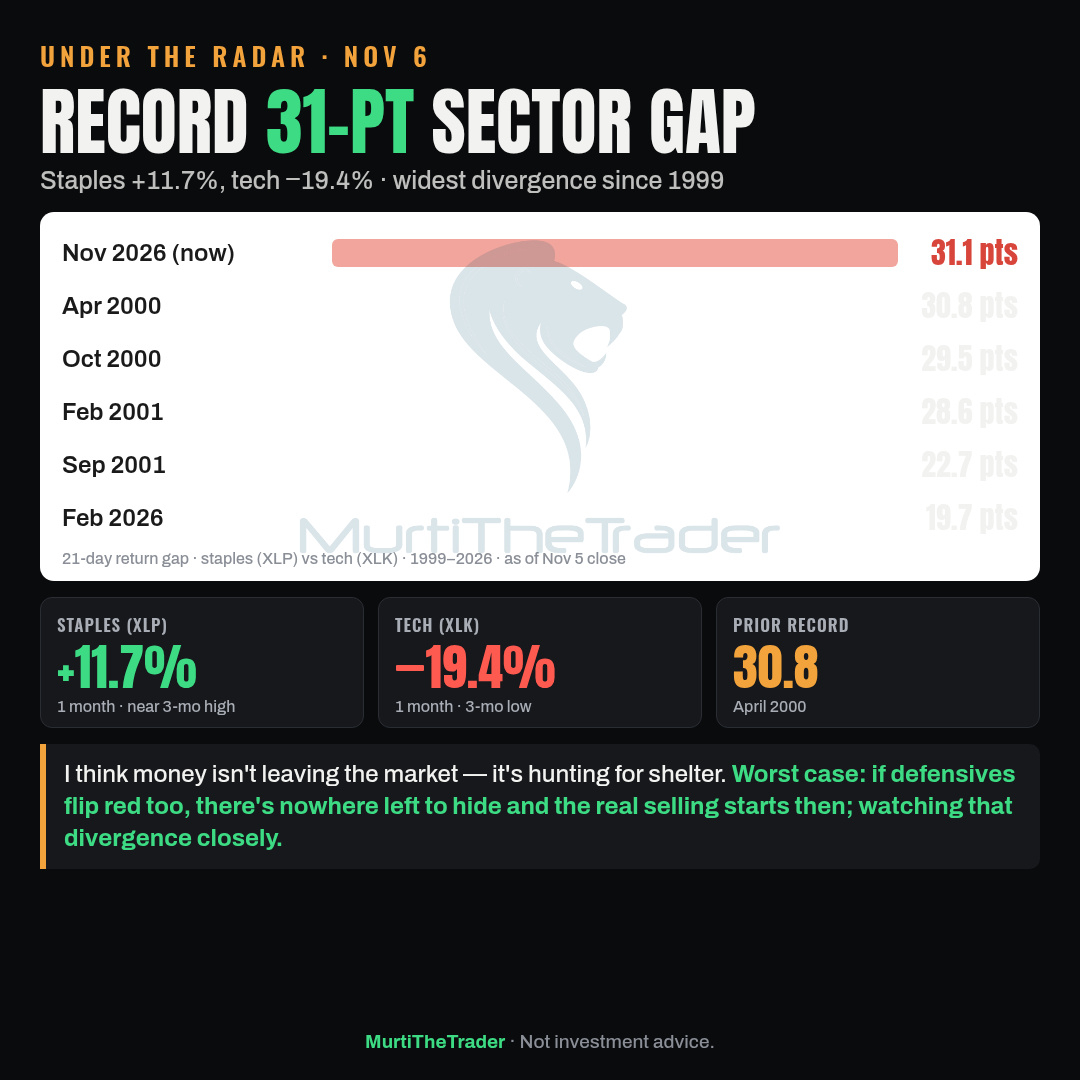
Under the radar: Over the past month consumer staples ($XLP ) are +11.7% while tech ($XLK ) is −19.4% — a 31-point gap, the widest since 1999.
→ Prior record: April 2000 at 30.8 points
→ 4 of the top 5 gaps came from 2000–2001, the years the bubble deflated
→ Staples are near a 3-month high; tech is at a 3-month low
I think money isn't leaving the market — it's hunting for shelter. Worst case: if defensives flip red too, there's nowhere left to hide and the real selling starts then; watching that divergence closely.
Watching: $XLP $XLK $SPY
#Stocks #Economy #Selloff
Under the radar: Over the past month consumer staples ($XLP ) are +11.7% while tech ($XLK ) is −19.4% — a 31-point gap, the widest since 1999.
→ Prior record: April 2000 at 30.8 points
→ 4 of the top 5 gaps came from 2000–2001, the years the bubble deflated
→ Staples are near a 3-month high; tech is at a 3-month low
I think money isn't leaving the market — it's hunting for shelter. Worst case: if defensives flip red too, there's nowhere left to hide and the real selling starts then; watching that divergence closely.
Watching: $XLP $XLK $SPY
#Stocks #Economy #Selloff
→ Prior record: April 2000 at 30.8 points
→ 4 of the top 5 gaps came from 2000–2001, the years the bubble deflated
→ Staples are near a 3-month high; tech is at a 3-month low
I think money isn't leaving the market — it's hunting for shelter. Worst case: if defensives flip red too, there's nowhere left to hide and the real selling starts then; watching that divergence closely.
Watching: $XLP $XLK $SPY
#Stocks #Economy #Selloff
229
Partly True
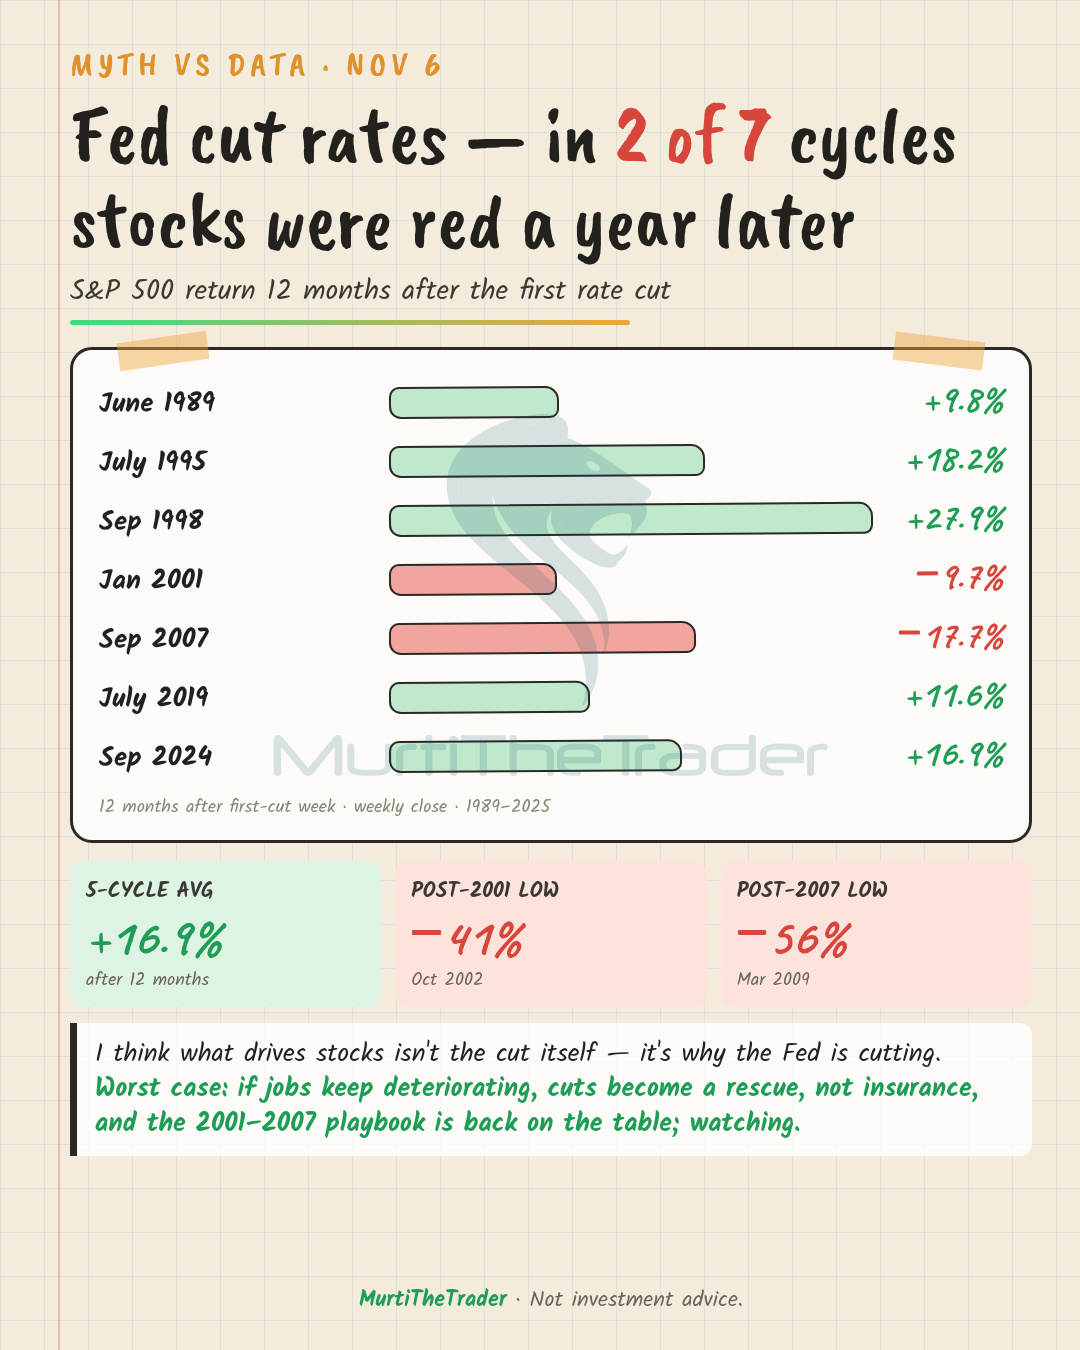
Myth vs data: "When the Fed cuts rates, stocks go up." Since 1989, in 2 of 7 cut cycles the S&P 500 ($SPY ) was still red a year later.
→ 1989, 1995, 1998, 2019, 2024: +9.8% to +27.9% twelve months later
→ 2001: −9.7% at 12 months, −41% into the trough
→ 2007: −17.7% at 12 months, −56% into the trough
I think what drives stocks isn't the cut — it's why the Fed is cutting. Worst case: if employment keeps breaking down, cuts become a rescue, not insurance, and the 2001–2007 pattern is back on the table; watching.
Watching: $SPY $QQQ $IWM
#FOMC #Economy #Stocks
Myth vs data: "When the Fed cuts rates, stocks go up." Since 1989, in 2 of 7 cut cycles the S&P 500 ($SPY ) was still red a year later.
→ 1989, 1995, 1998, 2019, 2024: +9.8% to +27.9% twelve months later
→ 2001: −9.7% at 12 months, −41% into the trough
→ 2007: −17.7% at 12 months, −56% into the trough
I think what drives stocks isn't the cut — it's why the Fed is cutting. Worst case: if employment keeps breaking down, cuts become a rescue, not insurance, and the 2001–2007 pattern is back on the table; watching.
Watching: $SPY $QQQ $IWM
#FOMC #Economy #Stocks
→ 1989, 1995, 1998, 2019, 2024: +9.8% to +27.9% twelve months later
→ 2001: −9.7% at 12 months, −41% into the trough
→ 2007: −17.7% at 12 months, −56% into the trough
I think what drives stocks isn't the cut — it's why the Fed is cutting. Worst case: if employment keeps breaking down, cuts become a rescue, not insurance, and the 2001–2007 pattern is back on the table; watching.
Watching: $SPY $QQQ $IWM
#FOMC #Economy #Stocks
921

·
--
Bullish
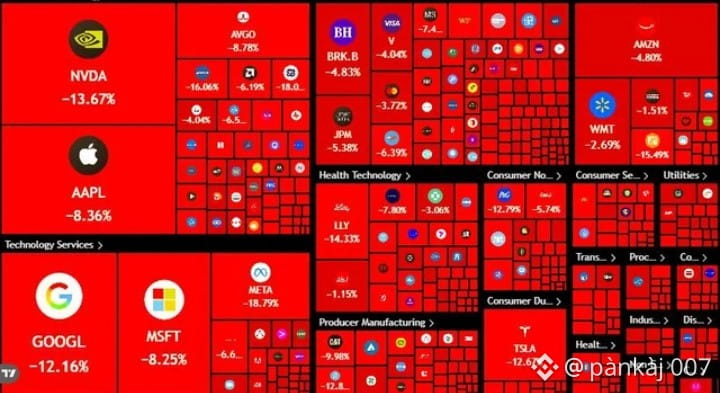
🚨 MARKET CRASH: $2.5 Trillion Wiped Out in Historic Tech Bloodbath! 📉
The market just witnessed one of its most brutal corrections as a massive tech sell-off sent shockwaves across global finance. Hyper-extended valuations in the artificial intelligence sector and new regulatory fears triggered a wave of institutional panic selling.
Here is how the major benchmarks collapsed:
• Nasdaq Composite 📉 Plunged 5.5% straight into official correction territory.
• S&P 500 📉 Tumbled 4.4%, marking its deepest single-day decline in over a year.
• Dow Jones 📉 Plummeted 1,833 points (3.4%), completely erasing its recent record gains.
The Tech Giants Hit Hardest:
• Nvidia ($NVDAB ): 🔴 Dropped 9.3%, wiping out billions in equity value.
• AMD ($AMDB ): 🔴 Plummeted 17% as semiconductor infrastructure faced brutal liquidation.
• SanDisk: 🔴 Crashed 22%, leading the S&P 500 decliners.
With all 11 S&P 500 sectors in the red, Wall Street’s "Fear Index" (VIX) surged 61%. Capital is aggressively fleeing into safe havens, driving the 10-year Treasury yield down to 4.84%.
Traders, how are you positioning your portfolios right now? Are you buying the dip, or shifting entirely into stablecoins and crypto? Let's discuss below! 👇
follow and like for more market news
#MarketUpdate #Nvidia #Stocks #Finance #Trading
$TRX
🚨 MARKET CRASH: $2.5 Trillion Wiped Out in Historic Tech Bloodbath! 📉
The market just witnessed one of its most brutal corrections as a massive tech sell-off sent shockwaves across global finance. Hyper-extended valuations in the artificial intelligence sector and new regulatory fears triggered a wave of institutional panic selling.
Here is how the major benchmarks collapsed:
• Nasdaq Composite 📉 Plunged 5.5% straight into official correction territory.
• S&P 500 📉 Tumbled 4.4%, marking its deepest single-day decline in over a year.
• Dow Jones 📉 Plummeted 1,833 points (3.4%), completely erasing its recent record gains.
The Tech Giants Hit Hardest:
• Nvidia ($NVDAB ): 🔴 Dropped 9.3%, wiping out billions in equity value.
• AMD ($AMDB ): 🔴 Plummeted 17% as semiconductor infrastructure faced brutal liquidation.
• SanDisk: 🔴 Crashed 22%, leading the S&P 500 decliners.
With all 11 S&P 500 sectors in the red, Wall Street’s "Fear Index" (VIX) surged 61%. Capital is aggressively fleeing into safe havens, driving the 10-year Treasury yield down to 4.84%.
Traders, how are you positioning your portfolios right now? Are you buying the dip, or shifting entirely into stablecoins and crypto? Let's discuss below! 👇
follow and like for more market news
#MarketUpdate #Nvidia #Stocks #Finance #Trading
$TRX
The market just witnessed one of its most brutal corrections as a massive tech sell-off sent shockwaves across global finance. Hyper-extended valuations in the artificial intelligence sector and new regulatory fears triggered a wave of institutional panic selling.
Here is how the major benchmarks collapsed:
• Nasdaq Composite 📉 Plunged 5.5% straight into official correction territory.
• S&P 500 📉 Tumbled 4.4%, marking its deepest single-day decline in over a year.
• Dow Jones 📉 Plummeted 1,833 points (3.4%), completely erasing its recent record gains.
The Tech Giants Hit Hardest:
• Nvidia ($NVDAB ): 🔴 Dropped 9.3%, wiping out billions in equity value.
• AMD ($AMDB ): 🔴 Plummeted 17% as semiconductor infrastructure faced brutal liquidation.
• SanDisk: 🔴 Crashed 22%, leading the S&P 500 decliners.
With all 11 S&P 500 sectors in the red, Wall Street’s "Fear Index" (VIX) surged 61%. Capital is aggressively fleeing into safe havens, driving the 10-year Treasury yield down to 4.84%.
Traders, how are you positioning your portfolios right now? Are you buying the dip, or shifting entirely into stablecoins and crypto? Let's discuss below! 👇
follow and like for more market news
#MarketUpdate #Nvidia #Stocks #Finance #Trading
$TRX
1
121

·
--
Micron closed at $656.39 Thursday, down 17.5% in one session and 47.7% from its 52-week high of $1,255.
The important question isn't whether HBM demand disappeared overnight. There's no evidence it did.
It's whether investors are starting to price the next memory cycle before the current one has peaked.
HBM allocations can remain tight while expectations for future pricing, capacity growth and margins deteriorate.
That distinction matters. A memory producer can report strong earnings and still see its valuation contract if the market no longer believes those earnings are sustainable.
I'd watch HBM contract pricing, customer delivery commitments and conventional DRAM supply before calling this either a bargain or the start of a new downcycle.
The stock has already repriced. The industry fundamentals still need to be tested.
#stocks #StocksDown
$MU.US
{stock_us}(MU.US)
Micron closed at $656.39 Thursday, down 17.5% in one session and 47.7% from its 52-week high of $1,255.
The important question isn't whether HBM demand disappeared overnight. There's no evidence it did.
It's whether investors are starting to price the next memory cycle before the current one has peaked.
HBM allocations can remain tight while expectations for future pricing, capacity growth and margins deteriorate.
That distinction matters. A memory producer can report strong earnings and still see its valuation contract if the market no longer believes those earnings are sustainable.
I'd watch HBM contract pricing, customer delivery commitments and conventional DRAM supply before calling this either a bargain or the start of a new downcycle.
The stock has already repriced. The industry fundamentals still need to be tested.
#stocks #StocksDown
$MU.US
The important question isn't whether HBM demand disappeared overnight. There's no evidence it did.
It's whether investors are starting to price the next memory cycle before the current one has peaked.
HBM allocations can remain tight while expectations for future pricing, capacity growth and margins deteriorate.
That distinction matters. A memory producer can report strong earnings and still see its valuation contract if the market no longer believes those earnings are sustainable.
I'd watch HBM contract pricing, customer delivery commitments and conventional DRAM supply before calling this either a bargain or the start of a new downcycle.
The stock has already repriced. The industry fundamentals still need to be tested.
#stocks #StocksDown
$MU.US
MUUS+0.17%
501
Partly True
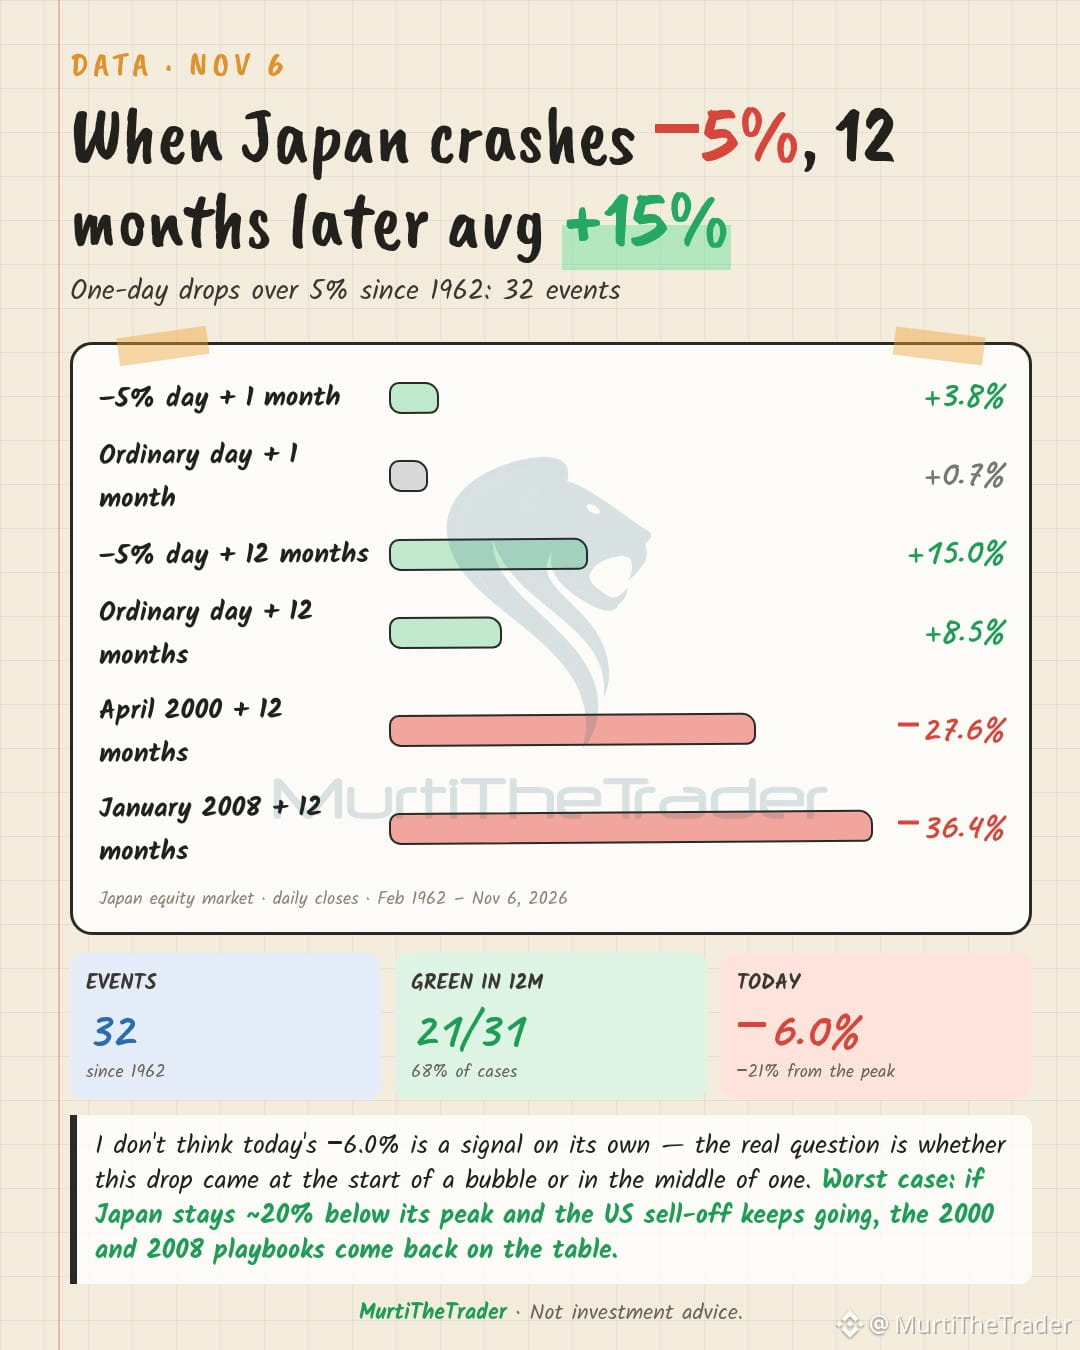
Data: Since 1962, Japan's stock market has dropped more than 5% in a single day 32 times — and 12 months later, 21 of 31 of those were green.
→ 1 month later: avg +3.8% vs +0.7% on a normal day
→ 12 months later: avg +15.0% vs +8.5% on a normal day
→ But April 2000: −27.6%, January 2008: −36.4%
I don't think today's −6.0% is a signal on its own — the real question is whether this drop came at the start of a bubble or in the middle of one.
Watching: $EWJ $SPY $QQQ
#USStocksSlipandCryptoMarketUnderBroadPressure #Stocks #Economy
Data: Since 1962, Japan's stock market has dropped more than 5% in a single day 32 times — and 12 months later, 21 of 31 of those were green.
→ 1 month later: avg +3.8% vs +0.7% on a normal day
→ 12 months later: avg +15.0% vs +8.5% on a normal day
→ But April 2000: −27.6%, January 2008: −36.4%
I don't think today's −6.0% is a signal on its own — the real question is whether this drop came at the start of a bubble or in the middle of one.
Watching: $EWJ $SPY $QQQ
#USStocksSlipandCryptoMarketUnderBroadPressure #Stocks #Economy
→ 1 month later: avg +3.8% vs +0.7% on a normal day
→ 12 months later: avg +15.0% vs +8.5% on a normal day
→ But April 2000: −27.6%, January 2008: −36.4%
I don't think today's −6.0% is a signal on its own — the real question is whether this drop came at the start of a bubble or in the middle of one.
Watching: $EWJ $SPY $QQQ
#USStocksSlipandCryptoMarketUnderBroadPressure #Stocks #Economy
1
840
·
--
South Korea's KOSPI index has triggered a circuit breaker following a sharp market plunge, falling below the 5,000 level.
#Markets #Stocks
South Korea's KOSPI index has triggered a circuit breaker following a sharp market plunge, falling below the 5,000 level.
#Markets #Stocks
#Markets #Stocks
47
Log in to explore more content
Join global crypto users on Binance Square
⚡️ Get latest and useful information about crypto.
💬 Trusted by the world’s largest crypto exchange.
👍 Discover real insights from verified creators.
Email / Phone number
Trending Topics
1
#BitcoinRebounds$75KAsChipsLead
5,485 views
105 Discussing
2
#JobsReportRaisesHikeOdds
85,151 views
856 Discussing
3
#US Data Center Rules May Constrain AI Expansion
10,637 views
94 Discussing
4
#$2TWipedOutHedgeFundsFaceLiquidation
12,708 views
95 Discussing
5
#WillAnthropicListOnTime
11,333 views
239 Discussing
6
#USNovemberMichiganExpectationsIndexPrelimAt50.9
20,149 views
340 Discussing
7
#OilPlungesBelow$100
20,111 views
38 Discussing
8
#TradFiForBeginners
12,183 views
218 Discussing
9
#USMidtermsCouldShakeUpUS-IranTies
39,200 views
507 Discussing
10
#RussianCentralBankNamesBTCETHUSDTForNonQualifiedInvestors
756 views
11 Discussing