
#bitcoinspotetfspost$201mnetoutflowforthirdstraightday
bitcoinspotetfspost$201mnetoutflowforthirdstraightday
4,543 views
41 Discussing
Hot
Latest


🏦 BITCOIN ETF OUTFLOWS — INSTITUTIONAL DEMAND UNDER THE LENS!
Three consecutive days of reported net outflows deserve attention.
ETF flows can provide useful insight into institutional positioning, but they are only one part of the market picture.
I would monitor:
📊 Whether outflows continue
💰 Total ETF assets
📈 Bitcoin's price reaction
💧 Exchange liquidity
🐋 Broader investor activity
If outflows continue while price weakens, traders may become more cautious.
But one flow trend should never replace technical confirmation.
Follow the data, not the emotion.
#BitcoinSpotETFsPost201MNetOutflowForThirdStrai#BitcoinSpotETFsPost$201MNetOutflowForThirdStraightDay
$ETH $SOL $XRP
🏦 BITCOIN ETF OUTFLOWS — INSTITUTIONAL DEMAND UNDER THE LENS!
Three consecutive days of reported net outflows deserve attention.
ETF flows can provide useful insight into institutional positioning, but they are only one part of the market picture.
I would monitor:
📊 Whether outflows continue
💰 Total ETF assets
📈 Bitcoin's price reaction
💧 Exchange liquidity
🐋 Broader investor activity
If outflows continue while price weakens, traders may become more cautious.
But one flow trend should never replace technical confirmation.
Follow the data, not the emotion.
#BitcoinSpotETFsPost201MNetOutflowForThirdStrai#BitcoinSpotETFsPost$201MNetOutflowForThirdStraightDay
$ETH $SOL $XRP
Three consecutive days of reported net outflows deserve attention.
ETF flows can provide useful insight into institutional positioning, but they are only one part of the market picture.
I would monitor:
📊 Whether outflows continue
💰 Total ETF assets
📈 Bitcoin's price reaction
💧 Exchange liquidity
🐋 Broader investor activity
If outflows continue while price weakens, traders may become more cautious.
But one flow trend should never replace technical confirmation.
Follow the data, not the emotion.
#BitcoinSpotETFsPost201MNetOutflowForThirdStrai#BitcoinSpotETFsPost$201MNetOutflowForThirdStraightDay
$ETH $SOL $XRP
184

⚡ Bitcoin Faces a Liquidity and Confidence Test!
Three consecutive days of ETF outflows highlight cautious investor sentiment. With macroeconomic uncertainty and interest-rate expectations influencing markets, Bitcoin needs stronger spot demand to support a sustained recovery.
$BTC $ETH $SOL $AVAX #BitcoinSpotETFsPost$201MNetOutflowForThirdStraightDay
⚡ Bitcoin Faces a Liquidity and Confidence Test!
Three consecutive days of ETF outflows highlight cautious investor sentiment. With macroeconomic uncertainty and interest-rate expectations influencing markets, Bitcoin needs stronger spot demand to support a sustained recovery.
$BTC $ETH $SOL $AVAX #BitcoinSpotETFsPost$201MNetOutflowForThirdStraightDay
Three consecutive days of ETF outflows highlight cautious investor sentiment. With macroeconomic uncertainty and interest-rate expectations influencing markets, Bitcoin needs stronger spot demand to support a sustained recovery.
$BTC $ETH $SOL $AVAX #BitcoinSpotETFsPost$201MNetOutflowForThirdStraightDay
121

BITCOIN ETF BLOODBATH! $201 MILLION OUTFLOW — BLACKROCK'S IBIT LEADS THE SELLING!Institutional investors are sending another warning signal to the crypto market!
U.S. Spot Bitcoin ETFs recorded approximately $201 million in net outflows on November 9, marking their third consecutive trading day of withdrawals.
And the biggest surprise? BlackRock's IBIT alone experienced approximately $213.2 million in outflows!
🏦 WHAT'S HAPPENING WITH INSTITUTIONAL MONEY?
🔴 Total BTC ETF outflows: $201 million
🔴 BlackRock IBIT: $213.2 million outflows
🔴 ARKB: $9.9 million outflows
🟢 Morgan Stanley MSBT: $22.1 million inflows
IBIT has now recorded seven consecutive trading sessions of withdrawals, totaling approximately $1.66 billion.
The institutional demand that previously supported Bitcoin is showing signs of weakness.
🐻 COULD BITCOIN FALL TOWARD $64,000?
Bitcoin recently traded around $74,200, struggling to regain stronger bullish momentum.
If ETF withdrawals continue and buying demand remains weak, another downside move cannot be ruled out.
A deeper correction toward $64,000 is a bearish scenario to watch, not a confirmed price target.
⚠️ Heavy selling could also trigger leveraged long liquidations, increasing short-term volatility.
📊 WHAT SHOULD CRYPTO TRADERS DO NOW?
1️⃣ Avoid emotional trading: Don't panic-sell or blindly chase a falling market.
2️⃣ Manage your risk: Use appropriate stop-loss levels and avoid excessive leverage.
3️⃣ Consider gradual accumulation: If you're investing long term, consider spreading entries rather than investing everything at once.
4️⃣ Watch ETF flows: Sustained positive inflows could provide an important signal that institutional demand is returning.
🔥 MY MARKET TAKE
I'm watching Bitcoin carefully.
The current ETF outflows are concerning, but they don't automatically mean the bull market is over. Morgan Stanley's inflow also shows that institutional activity isn't moving in just one direction.
The next major signals will be Bitcoin's ability to hold support, ETF flow recovery, and broader market sentiment.
💬 THE BIG QUESTION:
Will Bitcoin defend the $74K region, or are we heading toward $64K next?
Are you buying the dip, holding your positions, or waiting for confirmation?
👇 Drop your thoughts in the comments!
$BTC $ETH $INIT
#BitcoinSpotETFsPost$201MNetOutflowForThirdStraightDay
#BitcoinETFs #CryptoMarket #BitcoinCrash #CryptoTrading
{spot}(INITUSDT)
{spot}(ETHUSDT)
{spot}(BTCUSDT)
BITCOIN ETF BLOODBATH! $201 MILLION OUTFLOW — BLACKROCK'S IBIT LEADS THE SELLING!
Institutional investors are sending another warning signal to the crypto market!
U.S. Spot Bitcoin ETFs recorded approximately $201 million in net outflows on November 9, marking their third consecutive trading day of withdrawals.
And the biggest surprise? BlackRock's IBIT alone experienced approximately $213.2 million in outflows!
🏦 WHAT'S HAPPENING WITH INSTITUTIONAL MONEY?
🔴 Total BTC ETF outflows: $201 million
🔴 BlackRock IBIT: $213.2 million outflows
🔴 ARKB: $9.9 million outflows
🟢 Morgan Stanley MSBT: $22.1 million inflows
IBIT has now recorded seven consecutive trading sessions of withdrawals, totaling approximately $1.66 billion.
The institutional demand that previously supported Bitcoin is showing signs of weakness.
🐻 COULD BITCOIN FALL TOWARD $64,000?
Bitcoin recently traded around $74,200, struggling to regain stronger bullish momentum.
If ETF withdrawals continue and buying demand remains weak, another downside move cannot be ruled out.
A deeper correction toward $64,000 is a bearish scenario to watch, not a confirmed price target.
⚠️ Heavy selling could also trigger leveraged long liquidations, increasing short-term volatility.
📊 WHAT SHOULD CRYPTO TRADERS DO NOW?
1️⃣ Avoid emotional trading: Don't panic-sell or blindly chase a falling market.
2️⃣ Manage your risk: Use appropriate stop-loss levels and avoid excessive leverage.
3️⃣ Consider gradual accumulation: If you're investing long term, consider spreading entries rather than investing everything at once.
4️⃣ Watch ETF flows: Sustained positive inflows could provide an important signal that institutional demand is returning.
🔥 MY MARKET TAKE
I'm watching Bitcoin carefully.
The current ETF outflows are concerning, but they don't automatically mean the bull market is over. Morgan Stanley's inflow also shows that institutional activity isn't moving in just one direction.
The next major signals will be Bitcoin's ability to hold support, ETF flow recovery, and broader market sentiment.
💬 THE BIG QUESTION:
Will Bitcoin defend the $74K region, or are we heading toward $64K next?
Are you buying the dip, holding your positions, or waiting for confirmation?
👇 Drop your thoughts in the comments!
$BTC $ETH $INIT
#BitcoinSpotETFsPost$201MNetOutflowForThirdStraightDay
#BitcoinETFs #CryptoMarket #BitcoinCrash #CryptoTrading
U.S. Spot Bitcoin ETFs recorded approximately $201 million in net outflows on November 9, marking their third consecutive trading day of withdrawals.
And the biggest surprise? BlackRock's IBIT alone experienced approximately $213.2 million in outflows!
🏦 WHAT'S HAPPENING WITH INSTITUTIONAL MONEY?
🔴 Total BTC ETF outflows: $201 million
🔴 BlackRock IBIT: $213.2 million outflows
🔴 ARKB: $9.9 million outflows
🟢 Morgan Stanley MSBT: $22.1 million inflows
IBIT has now recorded seven consecutive trading sessions of withdrawals, totaling approximately $1.66 billion.
The institutional demand that previously supported Bitcoin is showing signs of weakness.
🐻 COULD BITCOIN FALL TOWARD $64,000?
Bitcoin recently traded around $74,200, struggling to regain stronger bullish momentum.
If ETF withdrawals continue and buying demand remains weak, another downside move cannot be ruled out.
A deeper correction toward $64,000 is a bearish scenario to watch, not a confirmed price target.
⚠️ Heavy selling could also trigger leveraged long liquidations, increasing short-term volatility.
📊 WHAT SHOULD CRYPTO TRADERS DO NOW?
1️⃣ Avoid emotional trading: Don't panic-sell or blindly chase a falling market.
2️⃣ Manage your risk: Use appropriate stop-loss levels and avoid excessive leverage.
3️⃣ Consider gradual accumulation: If you're investing long term, consider spreading entries rather than investing everything at once.
4️⃣ Watch ETF flows: Sustained positive inflows could provide an important signal that institutional demand is returning.
🔥 MY MARKET TAKE
I'm watching Bitcoin carefully.
The current ETF outflows are concerning, but they don't automatically mean the bull market is over. Morgan Stanley's inflow also shows that institutional activity isn't moving in just one direction.
The next major signals will be Bitcoin's ability to hold support, ETF flow recovery, and broader market sentiment.
💬 THE BIG QUESTION:
Will Bitcoin defend the $74K region, or are we heading toward $64K next?
Are you buying the dip, holding your positions, or waiting for confirmation?
👇 Drop your thoughts in the comments!
$BTC $ETH $INIT
#BitcoinSpotETFsPost$201MNetOutflowForThirdStraightDay
#BitcoinETFs #CryptoMarket #BitcoinCrash #CryptoTrading
272

·
--

Article
Why Is Bitcoin Down Today? BTC Slips Below $75,000 as IBIT Drives 78% of a $2.1 Billion ETF ExitBitcoin changed hands at $74,561 at 08:53 UTC on Nov. 10, back below the $75,000 handle. Spot Bitcoin ETFs bled money in six of their last seven sessions, and the October inflation report lands at 13:30 UTC.
The 24-hour change is almost flat, up 0.2%, so the headline understates the damage. BTC is 2.8% below its Nov. 3 close, 10.1% lower over 30 days, and 40.9% under the October 2025 record of $126,080, according to CoinGecko. The overnight low was $73,999.
Price: $74,561 at 08:53 UTC, 24-hour range of $73,999 to $75,477.
Flows: the seven sessions through Nov. 9 produced a net $2.13 billion of redemptions across US spot Bitcoin funds, per Farside Investors.
Concentration: BlackRock’s IBIT accounted for $1.66 billion, or 77.9%, of that total.
Catalyst: October CPI is scheduled for 08:30 ET, after September’s 3.7% annual print.
The tape at 08:53 UTC
The last time Bitcoin printed a daily close this low was Aug. 21, on CoinGecko’s daily series. It has spent the past three weeks grinding lower from an Oct. 22 close of $84,082, and the bounce toward $80,443 on Nov. 5 lasted a single session before sellers took it back to $76,006.
Market capitalization sits at $1.499 trillion on $24.58 billion of 24-hour volume. The $1,478-wide overnight range is narrow against the moves of the past fortnight, and the price is holding a corridor between two widely watched averages.
What changed today is positioning, not the narrative. Bitcoin is now below its 50-week average and above its 200-day average, squeezed into a band roughly $2,500 wide. That is a decision point, and the CPI print lands inside it.
Six Redemptions in Seven Sessions, and One Fund Behind Most of Them
Farside’s daily fund-level data shows the exit is not spread evenly across the twelve US spot Bitcoin products. BlackRock’s IBIT has carried almost four-fifths of it.
Session IBIT FBTC ARKB GBTC BITB Rest Total
Oct. 30 -233.7 -201.0 -129.5 -53.3 -25.7 0.0 -643.2
Nov. 2 -405.3 6.7 0.0 0.0 0.0 0.0 -398.6
Nov. 3 -95.0 6.8 0.0 0.0 21.9 -49.3 -115.6
Nov. 4 -201.2 236.7 19.9 0.0 15.2 4.0 74.6
Nov. 5 -105.0 -199.9 -18.9 -49.9 0.0 -56.5 -430.2
Nov. 6 -403.0 42.8 -20.1 -11.1 -20.5 0.0 -411.9
Nov. 9 -213.2 0.0 -9.9 0.0 0.0 22.1 -201.0
Seven sessions -1,656.4 -107.9 -158.5 -114.3 -9.1 -79.7 -2,125.9
Figures in US$ millions; negative is net redemption. “Rest” covers MSBT, BTC, EZBC, HODL and BTCO. Source: Farside Investors, daily fund flows through Nov. 9.
Read the FBTC column before drawing conclusions from the total. Fidelity’s fund took in $236.7 million on Nov. 4 and another $42.8 million on Nov. 6, and its seven-session net is a modest -$107.9 million. ARKB lost $158.5 million and GBTC $114.3 million. Neither is a stampede.
IBIT is the outlier. It shed money on all seven sessions, including a $403.0 million redemption on Nov. 6 and $405.3 million on Nov. 2. A fund that size bleeding $1.66 billion in seven sessions reads more like a large allocator trimming or unwinding a position than like retail capitulation.
The usual shape of a retail exit shows up in the smaller, more expensive products first. Those funds are close to flat over the same stretch.
What $2.13 Billion Is in Bitcoin
At the average daily close across those seven sessions, $76,691, the net redemption equals roughly 27,700 BTC. That is more than twice the 13,597 BTC MARA Holdings disclosed selling to retire debt earlier today. IBIT’s own share works out to about 21,600 BTC.
Set it against the cumulative $55.57 billion of net inflows the US spot Bitcoin complex has absorbed since January 2024. Seven sessions just removed 3.8% of that. Meaningful, not structural.
A 40% drawdown from the record is too large to pin on one bad fortnight of ETF accounting. The more likely weight sits with the marginal buyer that arrived through these funds in 2025 and has now stopped arriving.
The distinction matters for anyone trying to read the next month. A 3.8% trim can reverse in two good sessions. A change in the marginal buyer is a slower problem.
Two Averages Now Bracket a Falling Price
The chart below plots daily closes from Oct. 11 to Nov. 10 against the 50-week average, currently $75,667. Bitcoin closed below it on Nov. 9 and stayed below it overnight, extending the break that began when it
Three levels matter, all computed from CoinGecko daily closes through Nov. 9 using simple moving averages:
Support at $73,158 is the 200-day average. A daily close beneath it would put the Aug. 21 close of $73,021 and the August consolidation back in play. That is the invalidation for any recovery thesis built on the long-term trend.
Resistance at $75,667 is the 350-day, or 50-week, average. A close above it would neutralise last week’s breakdown and shift focus back to $78,590, the 20-day average.
Momentum is soft but not washed out. The 14-day relative strength index on the same series reads 35.2, still above the 30 threshold conventionally used to mark oversold conditions.
That combination, price under the long average with RSI just above oversold, is why the next two daily closes matter more than the last ten. Sellers have room to push toward $73,158 without producing a single technical extreme.
The 13:30 UTC Print That Sets the Next Move
The Bureau of Labor Statistics publishes October CPI at 08:30 ET, 13:30 UTC, according to the BLS release calendar. September set the bar high.
The BLS reported that “the index for gasoline rose 9.1 percent in September, accounting for over half of the monthly all items increase,” and that “the energy index increased 5.2 percent over the month.”
The agency added that “the all items index rose 3.7 percent for the 12 months ending September, a larger increase than the 3.4-percent increase reported for the 12 months ending in August.” Core inflation came in at 0.3% monthly and 2.6% annually, per the September release.
The monthly path has been uneven, which is why one print can move rate expectations quickly.
Month Mar Apr May Jun Jul Aug Sep
All items, m/m 0.9% 0.6% 0.5% -0.4% 0.1% 0.4% 0.6%
Core, m/m 0.2% 0.4% 0.2% 0.0% 0.2% 0.3% 0.3%
Source: BLS Consumer Price Index, seasonally adjusted monthly changes.
September’s acceleration came mostly from energy. Gasoline rose 9.1% on the month and energy 5.2%, with the energy index up 20.4% over the year. Core inflation, the part the rate path actually tracks, has run between 0.0% and 0.4% a month since March, and the September print pushed Bitcoin below $82,000 when it landed on Oct. 14.
Three outcomes are worth pre-defining, each with its own trigger rather than a forecast:
Core at 0.2% or lower. The disinflation argument survives, front-end yields would have room to fall, and the setup favours a reclaim attempt at $75,667. Invalidation: a close back under $73,999.
Core at 0.3%. The base case on the September trend. Expect the corridor between $73,158 and $75,667 to hold into the US afternoon, with direction decided by ETF flow data after the close.
Core at 0.4% or higher. A third consecutive upside surprise would harden the case for tighter policy. The 200-day average at $73,158 becomes the line in the sand, and a close below it opens the August range.
Treat each of those as a conditional path, not a prediction. The evidence available today does not establish that ETFs are causing the decline; it shows redemptions and price falling in the same window, with the direction of causation unresolved.
The Case That Flows Are Following Price, Not Leading It
ETF flow data is reported with a lag and reflects orders placed the previous session. When Bitcoin drops 5% in a day, the redemptions printed the next morning are partly a reaction to that drop, not its cause. That is the strongest argument against reading the $2.13 billion as a forward-looking signal.
The Nov. 4 session makes the point. FBTC pulled in $236.7 million and the complex as a whole took in $74.6 million while price rose to a $77,385 close. Bitcoin then fell to $80,443 the next session on a $430.2 million outflow. Flows and price have moved together for a fortnight without a clear leader.
There is also the composition problem. A redemption from IBIT can be a basis-trade unwind, a model-portfolio rebalance, or an allocator trimming a position that is still up on the year. None of those require a directional view on Bitcoin, and none show up in the flow number.
Attributing a $9,521 slide from the Oct. 22 close to one fund’s redemptions is the kind of causal claim the data cannot support.
What the flows do show, without interpretation, is that the largest and cheapest US spot vehicle has been a net seller for seven consecutive sessions while its main competitors have not. Whatever the cause, that is where the marginal supply is coming from.
What Would Flip the Read
Two consecutive sessions of net inflows across the complex would be the first clean break in the pattern, and IBIT specifically turning positive would matter more than the aggregate. On price, a daily close back above $75,667 would neutralise the 50-week breakdown; a close below $73,158 would confirm it.
After today, the next scheduled test is the November CPI report on Dec. 10. Between the two, the flow data at the close is the only high-frequency input that speaks to who is actually selling.#BitcoinSpotETFsPost$201MNetOutflowForThirdStraightDay #BitcoinFiveWeeklyLosses #CPITestsDecemberRateOutlook
Why Is Bitcoin Down Today? BTC Slips Below $75,000 as IBIT Drives 78% of a $2.1 Billion ETF Exit
Bitcoin changed hands at $74,561 at 08:53 UTC on Nov. 10, back below the $75,000 handle. Spot Bitcoin ETFs bled money in six of their last seven sessions, and the October inflation report lands at 13:30 UTC.
The 24-hour change is almost flat, up 0.2%, so the headline understates the damage. BTC is 2.8% below its Nov. 3 close, 10.1% lower over 30 days, and 40.9% under the October 2025 record of $126,080, according to CoinGecko. The overnight low was $73,999.
Price: $74,561 at 08:53 UTC, 24-hour range of $73,999 to $75,477.
Flows: the seven sessions through Nov. 9 produced a net $2.13 billion of redemptions across US spot Bitcoin funds, per Farside Investors.
Concentration: BlackRock’s IBIT accounted for $1.66 billion, or 77.9%, of that total.
Catalyst: October CPI is scheduled for 08:30 ET, after September’s 3.7% annual print.
The tape at 08:53 UTC
The last time Bitcoin printed a daily close this low was Aug. 21, on CoinGecko’s daily series. It has spent the past three weeks grinding lower from an Oct. 22 close of $84,082, and the bounce toward $80,443 on Nov. 5 lasted a single session before sellers took it back to $76,006.
Market capitalization sits at $1.499 trillion on $24.58 billion of 24-hour volume. The $1,478-wide overnight range is narrow against the moves of the past fortnight, and the price is holding a corridor between two widely watched averages.
What changed today is positioning, not the narrative. Bitcoin is now below its 50-week average and above its 200-day average, squeezed into a band roughly $2,500 wide. That is a decision point, and the CPI print lands inside it.
Six Redemptions in Seven Sessions, and One Fund Behind Most of Them
Farside’s daily fund-level data shows the exit is not spread evenly across the twelve US spot Bitcoin products. BlackRock’s IBIT has carried almost four-fifths of it.
Session IBIT FBTC ARKB GBTC BITB Rest Total
Oct. 30 -233.7 -201.0 -129.5 -53.3 -25.7 0.0 -643.2
Nov. 2 -405.3 6.7 0.0 0.0 0.0 0.0 -398.6
Nov. 3 -95.0 6.8 0.0 0.0 21.9 -49.3 -115.6
Nov. 4 -201.2 236.7 19.9 0.0 15.2 4.0 74.6
Nov. 5 -105.0 -199.9 -18.9 -49.9 0.0 -56.5 -430.2
Nov. 6 -403.0 42.8 -20.1 -11.1 -20.5 0.0 -411.9
Nov. 9 -213.2 0.0 -9.9 0.0 0.0 22.1 -201.0
Seven sessions -1,656.4 -107.9 -158.5 -114.3 -9.1 -79.7 -2,125.9
Figures in US$ millions; negative is net redemption. “Rest” covers MSBT, BTC, EZBC, HODL and BTCO. Source: Farside Investors, daily fund flows through Nov. 9.
Read the FBTC column before drawing conclusions from the total. Fidelity’s fund took in $236.7 million on Nov. 4 and another $42.8 million on Nov. 6, and its seven-session net is a modest -$107.9 million. ARKB lost $158.5 million and GBTC $114.3 million. Neither is a stampede.
IBIT is the outlier. It shed money on all seven sessions, including a $403.0 million redemption on Nov. 6 and $405.3 million on Nov. 2. A fund that size bleeding $1.66 billion in seven sessions reads more like a large allocator trimming or unwinding a position than like retail capitulation.
The usual shape of a retail exit shows up in the smaller, more expensive products first. Those funds are close to flat over the same stretch.
What $2.13 Billion Is in Bitcoin
At the average daily close across those seven sessions, $76,691, the net redemption equals roughly 27,700 BTC. That is more than twice the 13,597 BTC MARA Holdings disclosed selling to retire debt earlier today. IBIT’s own share works out to about 21,600 BTC.
Set it against the cumulative $55.57 billion of net inflows the US spot Bitcoin complex has absorbed since January 2024. Seven sessions just removed 3.8% of that. Meaningful, not structural.
A 40% drawdown from the record is too large to pin on one bad fortnight of ETF accounting. The more likely weight sits with the marginal buyer that arrived through these funds in 2025 and has now stopped arriving.
The distinction matters for anyone trying to read the next month. A 3.8% trim can reverse in two good sessions. A change in the marginal buyer is a slower problem.
Two Averages Now Bracket a Falling Price
The chart below plots daily closes from Oct. 11 to Nov. 10 against the 50-week average, currently $75,667. Bitcoin closed below it on Nov. 9 and stayed below it overnight, extending the break that began when it
Three levels matter, all computed from CoinGecko daily closes through Nov. 9 using simple moving averages:
Support at $73,158 is the 200-day average. A daily close beneath it would put the Aug. 21 close of $73,021 and the August consolidation back in play. That is the invalidation for any recovery thesis built on the long-term trend.
Resistance at $75,667 is the 350-day, or 50-week, average. A close above it would neutralise last week’s breakdown and shift focus back to $78,590, the 20-day average.
Momentum is soft but not washed out. The 14-day relative strength index on the same series reads 35.2, still above the 30 threshold conventionally used to mark oversold conditions.
That combination, price under the long average with RSI just above oversold, is why the next two daily closes matter more than the last ten. Sellers have room to push toward $73,158 without producing a single technical extreme.
The 13:30 UTC Print That Sets the Next Move
The Bureau of Labor Statistics publishes October CPI at 08:30 ET, 13:30 UTC, according to the BLS release calendar. September set the bar high.
The BLS reported that “the index for gasoline rose 9.1 percent in September, accounting for over half of the monthly all items increase,” and that “the energy index increased 5.2 percent over the month.”
The agency added that “the all items index rose 3.7 percent for the 12 months ending September, a larger increase than the 3.4-percent increase reported for the 12 months ending in August.” Core inflation came in at 0.3% monthly and 2.6% annually, per the September release.
The monthly path has been uneven, which is why one print can move rate expectations quickly.
Month Mar Apr May Jun Jul Aug Sep
All items, m/m 0.9% 0.6% 0.5% -0.4% 0.1% 0.4% 0.6%
Core, m/m 0.2% 0.4% 0.2% 0.0% 0.2% 0.3% 0.3%
Source: BLS Consumer Price Index, seasonally adjusted monthly changes.
September’s acceleration came mostly from energy. Gasoline rose 9.1% on the month and energy 5.2%, with the energy index up 20.4% over the year. Core inflation, the part the rate path actually tracks, has run between 0.0% and 0.4% a month since March, and the September print pushed Bitcoin below $82,000 when it landed on Oct. 14.
Three outcomes are worth pre-defining, each with its own trigger rather than a forecast:
Core at 0.2% or lower. The disinflation argument survives, front-end yields would have room to fall, and the setup favours a reclaim attempt at $75,667. Invalidation: a close back under $73,999.
Core at 0.3%. The base case on the September trend. Expect the corridor between $73,158 and $75,667 to hold into the US afternoon, with direction decided by ETF flow data after the close.
Core at 0.4% or higher. A third consecutive upside surprise would harden the case for tighter policy. The 200-day average at $73,158 becomes the line in the sand, and a close below it opens the August range.
Treat each of those as a conditional path, not a prediction. The evidence available today does not establish that ETFs are causing the decline; it shows redemptions and price falling in the same window, with the direction of causation unresolved.
The Case That Flows Are Following Price, Not Leading It
ETF flow data is reported with a lag and reflects orders placed the previous session. When Bitcoin drops 5% in a day, the redemptions printed the next morning are partly a reaction to that drop, not its cause. That is the strongest argument against reading the $2.13 billion as a forward-looking signal.
The Nov. 4 session makes the point. FBTC pulled in $236.7 million and the complex as a whole took in $74.6 million while price rose to a $77,385 close. Bitcoin then fell to $80,443 the next session on a $430.2 million outflow. Flows and price have moved together for a fortnight without a clear leader.
There is also the composition problem. A redemption from IBIT can be a basis-trade unwind, a model-portfolio rebalance, or an allocator trimming a position that is still up on the year. None of those require a directional view on Bitcoin, and none show up in the flow number.
Attributing a $9,521 slide from the Oct. 22 close to one fund’s redemptions is the kind of causal claim the data cannot support.
What the flows do show, without interpretation, is that the largest and cheapest US spot vehicle has been a net seller for seven consecutive sessions while its main competitors have not. Whatever the cause, that is where the marginal supply is coming from.
What Would Flip the Read
Two consecutive sessions of net inflows across the complex would be the first clean break in the pattern, and IBIT specifically turning positive would matter more than the aggregate. On price, a daily close back above $75,667 would neutralise the 50-week breakdown; a close below $73,158 would confirm it.
After today, the next scheduled test is the November CPI report on Dec. 10. Between the two, the flow data at the close is the only high-frequency input that speaks to who is actually selling.#BitcoinSpotETFsPost$201MNetOutflowForThirdStraightDay #BitcoinFiveWeeklyLosses #CPITestsDecemberRateOutlook
The 24-hour change is almost flat, up 0.2%, so the headline understates the damage. BTC is 2.8% below its Nov. 3 close, 10.1% lower over 30 days, and 40.9% under the October 2025 record of $126,080, according to CoinGecko. The overnight low was $73,999.
Price: $74,561 at 08:53 UTC, 24-hour range of $73,999 to $75,477.
Flows: the seven sessions through Nov. 9 produced a net $2.13 billion of redemptions across US spot Bitcoin funds, per Farside Investors.
Concentration: BlackRock’s IBIT accounted for $1.66 billion, or 77.9%, of that total.
Catalyst: October CPI is scheduled for 08:30 ET, after September’s 3.7% annual print.
The tape at 08:53 UTC
The last time Bitcoin printed a daily close this low was Aug. 21, on CoinGecko’s daily series. It has spent the past three weeks grinding lower from an Oct. 22 close of $84,082, and the bounce toward $80,443 on Nov. 5 lasted a single session before sellers took it back to $76,006.
Market capitalization sits at $1.499 trillion on $24.58 billion of 24-hour volume. The $1,478-wide overnight range is narrow against the moves of the past fortnight, and the price is holding a corridor between two widely watched averages.
What changed today is positioning, not the narrative. Bitcoin is now below its 50-week average and above its 200-day average, squeezed into a band roughly $2,500 wide. That is a decision point, and the CPI print lands inside it.
Six Redemptions in Seven Sessions, and One Fund Behind Most of Them
Farside’s daily fund-level data shows the exit is not spread evenly across the twelve US spot Bitcoin products. BlackRock’s IBIT has carried almost four-fifths of it.
Session IBIT FBTC ARKB GBTC BITB Rest Total
Oct. 30 -233.7 -201.0 -129.5 -53.3 -25.7 0.0 -643.2
Nov. 2 -405.3 6.7 0.0 0.0 0.0 0.0 -398.6
Nov. 3 -95.0 6.8 0.0 0.0 21.9 -49.3 -115.6
Nov. 4 -201.2 236.7 19.9 0.0 15.2 4.0 74.6
Nov. 5 -105.0 -199.9 -18.9 -49.9 0.0 -56.5 -430.2
Nov. 6 -403.0 42.8 -20.1 -11.1 -20.5 0.0 -411.9
Nov. 9 -213.2 0.0 -9.9 0.0 0.0 22.1 -201.0
Seven sessions -1,656.4 -107.9 -158.5 -114.3 -9.1 -79.7 -2,125.9
Figures in US$ millions; negative is net redemption. “Rest” covers MSBT, BTC, EZBC, HODL and BTCO. Source: Farside Investors, daily fund flows through Nov. 9.
Read the FBTC column before drawing conclusions from the total. Fidelity’s fund took in $236.7 million on Nov. 4 and another $42.8 million on Nov. 6, and its seven-session net is a modest -$107.9 million. ARKB lost $158.5 million and GBTC $114.3 million. Neither is a stampede.
IBIT is the outlier. It shed money on all seven sessions, including a $403.0 million redemption on Nov. 6 and $405.3 million on Nov. 2. A fund that size bleeding $1.66 billion in seven sessions reads more like a large allocator trimming or unwinding a position than like retail capitulation.
The usual shape of a retail exit shows up in the smaller, more expensive products first. Those funds are close to flat over the same stretch.
What $2.13 Billion Is in Bitcoin
At the average daily close across those seven sessions, $76,691, the net redemption equals roughly 27,700 BTC. That is more than twice the 13,597 BTC MARA Holdings disclosed selling to retire debt earlier today. IBIT’s own share works out to about 21,600 BTC.
Set it against the cumulative $55.57 billion of net inflows the US spot Bitcoin complex has absorbed since January 2024. Seven sessions just removed 3.8% of that. Meaningful, not structural.
A 40% drawdown from the record is too large to pin on one bad fortnight of ETF accounting. The more likely weight sits with the marginal buyer that arrived through these funds in 2025 and has now stopped arriving.
The distinction matters for anyone trying to read the next month. A 3.8% trim can reverse in two good sessions. A change in the marginal buyer is a slower problem.
Two Averages Now Bracket a Falling Price
The chart below plots daily closes from Oct. 11 to Nov. 10 against the 50-week average, currently $75,667. Bitcoin closed below it on Nov. 9 and stayed below it overnight, extending the break that began when it
Three levels matter, all computed from CoinGecko daily closes through Nov. 9 using simple moving averages:
Support at $73,158 is the 200-day average. A daily close beneath it would put the Aug. 21 close of $73,021 and the August consolidation back in play. That is the invalidation for any recovery thesis built on the long-term trend.
Resistance at $75,667 is the 350-day, or 50-week, average. A close above it would neutralise last week’s breakdown and shift focus back to $78,590, the 20-day average.
Momentum is soft but not washed out. The 14-day relative strength index on the same series reads 35.2, still above the 30 threshold conventionally used to mark oversold conditions.
That combination, price under the long average with RSI just above oversold, is why the next two daily closes matter more than the last ten. Sellers have room to push toward $73,158 without producing a single technical extreme.
The 13:30 UTC Print That Sets the Next Move
The Bureau of Labor Statistics publishes October CPI at 08:30 ET, 13:30 UTC, according to the BLS release calendar. September set the bar high.
The BLS reported that “the index for gasoline rose 9.1 percent in September, accounting for over half of the monthly all items increase,” and that “the energy index increased 5.2 percent over the month.”
The agency added that “the all items index rose 3.7 percent for the 12 months ending September, a larger increase than the 3.4-percent increase reported for the 12 months ending in August.” Core inflation came in at 0.3% monthly and 2.6% annually, per the September release.
The monthly path has been uneven, which is why one print can move rate expectations quickly.
Month Mar Apr May Jun Jul Aug Sep
All items, m/m 0.9% 0.6% 0.5% -0.4% 0.1% 0.4% 0.6%
Core, m/m 0.2% 0.4% 0.2% 0.0% 0.2% 0.3% 0.3%
Source: BLS Consumer Price Index, seasonally adjusted monthly changes.
September’s acceleration came mostly from energy. Gasoline rose 9.1% on the month and energy 5.2%, with the energy index up 20.4% over the year. Core inflation, the part the rate path actually tracks, has run between 0.0% and 0.4% a month since March, and the September print pushed Bitcoin below $82,000 when it landed on Oct. 14.
Three outcomes are worth pre-defining, each with its own trigger rather than a forecast:
Core at 0.2% or lower. The disinflation argument survives, front-end yields would have room to fall, and the setup favours a reclaim attempt at $75,667. Invalidation: a close back under $73,999.
Core at 0.3%. The base case on the September trend. Expect the corridor between $73,158 and $75,667 to hold into the US afternoon, with direction decided by ETF flow data after the close.
Core at 0.4% or higher. A third consecutive upside surprise would harden the case for tighter policy. The 200-day average at $73,158 becomes the line in the sand, and a close below it opens the August range.
Treat each of those as a conditional path, not a prediction. The evidence available today does not establish that ETFs are causing the decline; it shows redemptions and price falling in the same window, with the direction of causation unresolved.
The Case That Flows Are Following Price, Not Leading It
ETF flow data is reported with a lag and reflects orders placed the previous session. When Bitcoin drops 5% in a day, the redemptions printed the next morning are partly a reaction to that drop, not its cause. That is the strongest argument against reading the $2.13 billion as a forward-looking signal.
The Nov. 4 session makes the point. FBTC pulled in $236.7 million and the complex as a whole took in $74.6 million while price rose to a $77,385 close. Bitcoin then fell to $80,443 the next session on a $430.2 million outflow. Flows and price have moved together for a fortnight without a clear leader.
There is also the composition problem. A redemption from IBIT can be a basis-trade unwind, a model-portfolio rebalance, or an allocator trimming a position that is still up on the year. None of those require a directional view on Bitcoin, and none show up in the flow number.
Attributing a $9,521 slide from the Oct. 22 close to one fund’s redemptions is the kind of causal claim the data cannot support.
What the flows do show, without interpretation, is that the largest and cheapest US spot vehicle has been a net seller for seven consecutive sessions while its main competitors have not. Whatever the cause, that is where the marginal supply is coming from.
What Would Flip the Read
Two consecutive sessions of net inflows across the complex would be the first clean break in the pattern, and IBIT specifically turning positive would matter more than the aggregate. On price, a daily close back above $75,667 would neutralise the 50-week breakdown; a close below $73,158 would confirm it.
After today, the next scheduled test is the November CPI report on Dec. 10. Between the two, the flow data at the close is the only high-frequency input that speaks to who is actually selling.#BitcoinSpotETFsPost$201MNetOutflowForThirdStraightDay #BitcoinFiveWeeklyLosses #CPITestsDecemberRateOutlook
BTC-5.19%
BLKUS+0.56%
303

·
--
Bearish
#BitcoinSpotETFsPost$201MNetOutflowForThirdStraightDay
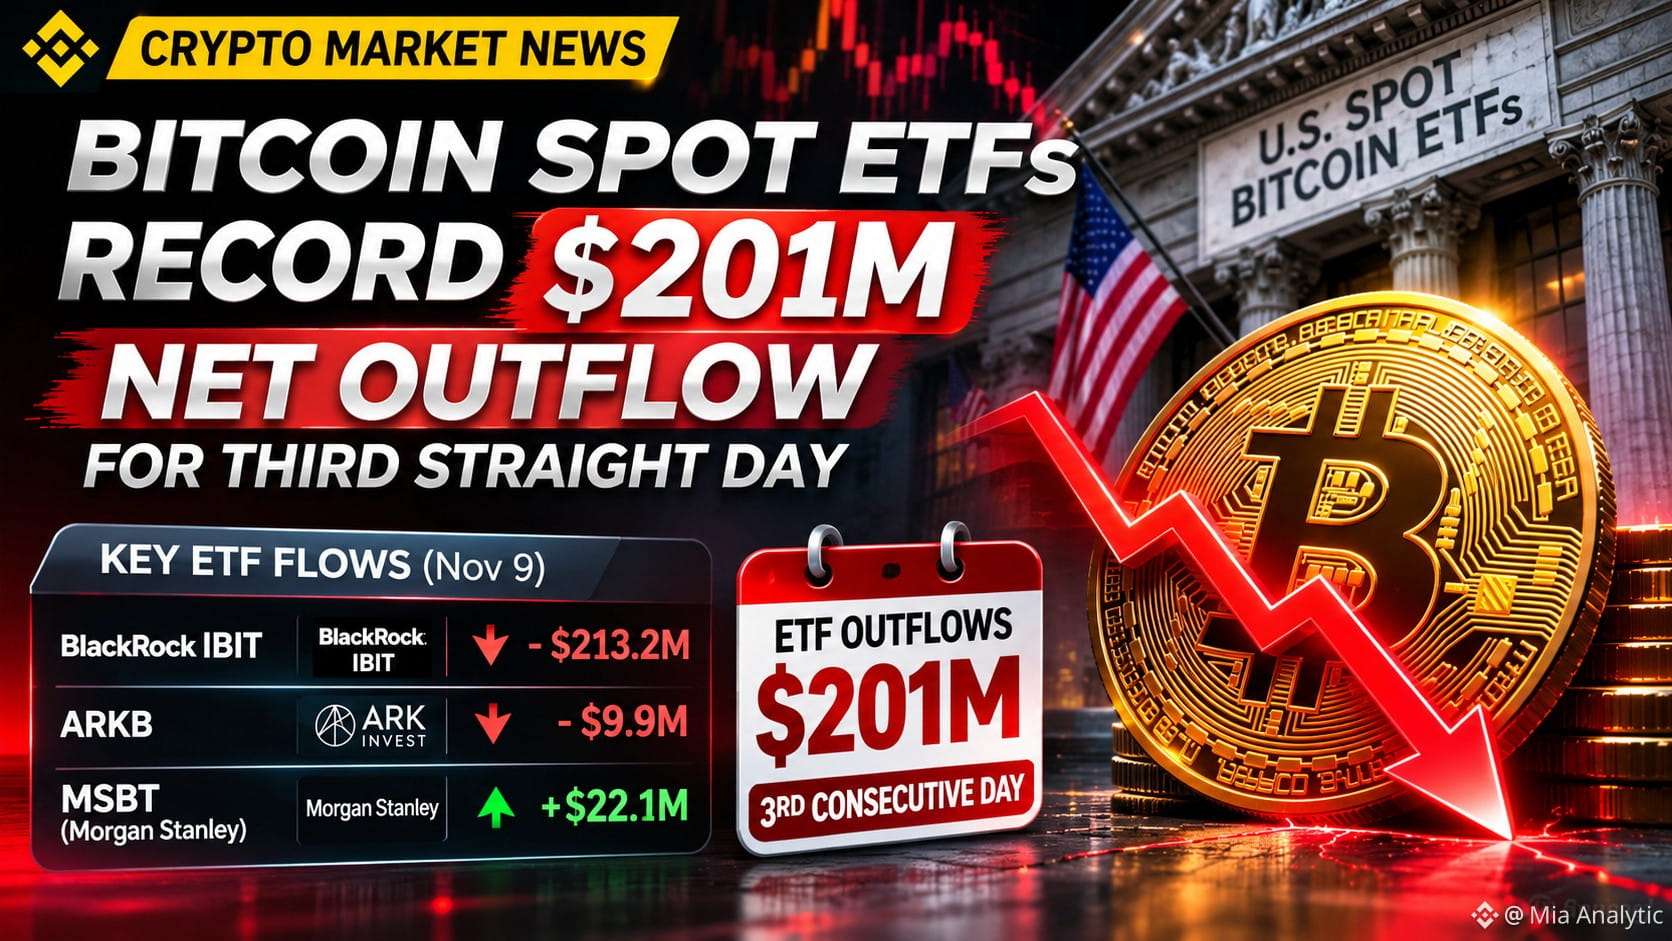
🚨 Bitcoin Spot ETFs Record $201M Outflow for Third Straight Day
U.S. spot Bitcoin ETFs recorded approximately $201 million in net outflows on Nov. 9, marking the third consecutive trading day of withdrawals.
BlackRock’s IBIT led the outflows with $213.2M, while ARKB saw $9.9M leave the fund. Morgan Stanley’s MSBT was the main positive exception, attracting about $22.1M.
The key point for traders is the persistence of the selling pressure, not simply the $201M figure. ETF flows are an important indicator of institutional demand, so continued net withdrawals can weigh on sentiment and reduce a major source of spot-market buying pressure.
However, Monday’s outflow was smaller than the previous session, suggesting the pace of withdrawals has moderated. Traders will be watching whether ETF flows stabilize or extend the streak in the coming sessions.
Bottom line: The current ETF flow picture remains cautious/bearish, but one should watch the next few sessions before treating the trend as a decisive shift in institutional positioning.
#Bitcoin #BTC #BitcoinETF #CryptoMarket
$AKE $BARD $TST
{future}(TSTUSDT)
{future}(BARDUSDT)
{future}(AKEUSDT)
#BitcoinSpotETFsPost$201MNetOutflowForThirdStraightDay
🚨 Bitcoin Spot ETFs Record $201M Outflow for Third Straight Day
U.S. spot Bitcoin ETFs recorded approximately $201 million in net outflows on Nov. 9, marking the third consecutive trading day of withdrawals.
BlackRock’s IBIT led the outflows with $213.2M, while ARKB saw $9.9M leave the fund. Morgan Stanley’s MSBT was the main positive exception, attracting about $22.1M.
The key point for traders is the persistence of the selling pressure, not simply the $201M figure. ETF flows are an important indicator of institutional demand, so continued net withdrawals can weigh on sentiment and reduce a major source of spot-market buying pressure.
However, Monday’s outflow was smaller than the previous session, suggesting the pace of withdrawals has moderated. Traders will be watching whether ETF flows stabilize or extend the streak in the coming sessions.
Bottom line: The current ETF flow picture remains cautious/bearish, but one should watch the next few sessions before treating the trend as a decisive shift in institutional positioning.
#Bitcoin #BTC #BitcoinETF #CryptoMarket
$AKE $BARD $TST
🚨 Bitcoin Spot ETFs Record $201M Outflow for Third Straight Day
U.S. spot Bitcoin ETFs recorded approximately $201 million in net outflows on Nov. 9, marking the third consecutive trading day of withdrawals.
BlackRock’s IBIT led the outflows with $213.2M, while ARKB saw $9.9M leave the fund. Morgan Stanley’s MSBT was the main positive exception, attracting about $22.1M.
The key point for traders is the persistence of the selling pressure, not simply the $201M figure. ETF flows are an important indicator of institutional demand, so continued net withdrawals can weigh on sentiment and reduce a major source of spot-market buying pressure.
However, Monday’s outflow was smaller than the previous session, suggesting the pace of withdrawals has moderated. Traders will be watching whether ETF flows stabilize or extend the streak in the coming sessions.
Bottom line: The current ETF flow picture remains cautious/bearish, but one should watch the next few sessions before treating the trend as a decisive shift in institutional positioning.
#Bitcoin #BTC #BitcoinETF #CryptoMarket
$AKE $BARD $TST
136
BITCOIN SPOT ETFs: $201M NET OUTFLOW — 3RD STRAIGHT DAY!🚨 BITCOIN SPOT ETFs: $201M NET OUTFLOW — 3RD STRAIGHT DAY!
Institutional money is leaving continuously — everyone is scared before CPI?
Bitcoin Spot ETFs posted a net outflow for the THIRD straight day. Total: $201M+ in a single day.
And the biggest hit came from BlackRock:
BlackRock Outflows (Yesterday):
- IBIT (Bitcoin ETF): -$213.23M
- ETHA (Ethereum ETF): -$118.28M / $119.3M
- Both combined: -$332.5M in a single session!
Why Is Money Flowing Out?
1. CPI FEAR — Today 8:30 AM ET (6:30 PM PKT) October CPI is coming
2. Fed HIKE Fear — 80%+ chance of a 25 bps hike in December
3. 3 Days Of Continuous Selling — Institutions are reducing risk, in wait & watch mode
What Does It Mean?
When money flows out of ETFs, it means Wall Street’s big players are selling BTC — they are reducing exposure before seeing the CPI result.
If CPI Comes HOT (0.4%+):
- More outflow will come
- BTC can go further down
If CPI Comes SOFT (0.1%):
- This same outflow will turn into INFLOW tomorrow
- BTC will see a sharp bounce
This 3-day outflow is not panic — it’s a WAIT for CPI.
What’s your plan?
🔴 = Sold before CPI, I am safe
🟢 = This is the dip, I am BUYING
#BitcoinSpotETFsPost$201MNetOutflowForThirdStraightDay
#ETFs #blackRock
#Bitcoin
#cpi
$BTC $ETH $IBIT.ETF
BITCOIN SPOT ETFs: $201M NET OUTFLOW — 3RD STRAIGHT DAY!
🚨 BITCOIN SPOT ETFs: $201M NET OUTFLOW — 3RD STRAIGHT DAY!
Institutional money is leaving continuously — everyone is scared before CPI?
Bitcoin Spot ETFs posted a net outflow for the THIRD straight day. Total: $201M+ in a single day.
And the biggest hit came from BlackRock:
BlackRock Outflows (Yesterday):
- IBIT (Bitcoin ETF): -$213.23M
- ETHA (Ethereum ETF): -$118.28M / $119.3M
- Both combined: -$332.5M in a single session!
Why Is Money Flowing Out?
1. CPI FEAR — Today 8:30 AM ET (6:30 PM PKT) October CPI is coming
2. Fed HIKE Fear — 80%+ chance of a 25 bps hike in December
3. 3 Days Of Continuous Selling — Institutions are reducing risk, in wait & watch mode
What Does It Mean?
When money flows out of ETFs, it means Wall Street’s big players are selling BTC — they are reducing exposure before seeing the CPI result.
If CPI Comes HOT (0.4%+):
- More outflow will come
- BTC can go further down
If CPI Comes SOFT (0.1%):
- This same outflow will turn into INFLOW tomorrow
- BTC will see a sharp bounce
This 3-day outflow is not panic — it’s a WAIT for CPI.
What’s your plan?
🔴 = Sold before CPI, I am safe
🟢 = This is the dip, I am BUYING
#BitcoinSpotETFsPost$201MNetOutflowForThirdStraightDay
#ETFs #blackRock
#Bitcoin
#cpi
$BTC $ETH $IBIT.ETF
Institutional money is leaving continuously — everyone is scared before CPI?
Bitcoin Spot ETFs posted a net outflow for the THIRD straight day. Total: $201M+ in a single day.
And the biggest hit came from BlackRock:
BlackRock Outflows (Yesterday):
- IBIT (Bitcoin ETF): -$213.23M
- ETHA (Ethereum ETF): -$118.28M / $119.3M
- Both combined: -$332.5M in a single session!
Why Is Money Flowing Out?
1. CPI FEAR — Today 8:30 AM ET (6:30 PM PKT) October CPI is coming
2. Fed HIKE Fear — 80%+ chance of a 25 bps hike in December
3. 3 Days Of Continuous Selling — Institutions are reducing risk, in wait & watch mode
What Does It Mean?
When money flows out of ETFs, it means Wall Street’s big players are selling BTC — they are reducing exposure before seeing the CPI result.
If CPI Comes HOT (0.4%+):
- More outflow will come
- BTC can go further down
If CPI Comes SOFT (0.1%):
- This same outflow will turn into INFLOW tomorrow
- BTC will see a sharp bounce
This 3-day outflow is not panic — it’s a WAIT for CPI.
What’s your plan?
🔴 = Sold before CPI, I am safe
🟢 = This is the dip, I am BUYING
#BitcoinSpotETFsPost$201MNetOutflowForThirdStraightDay
#ETFs #blackRock
#Bitcoin
#cpi
$BTC $ETH $IBIT.ETF
93

·
--
Bullish
Partly True
#BitcoinSpotETFsPost$201MNetOutflowForThirdStraightDay
🚨 BITCOIN SLIPS BELOW $75K AS IBIT DRIVES 78% OF $2.1B SPOT ETF OUTFLOWS AHEAD OF U.S. CPI! 📉📊
Bitcoin ($BTC) is currently trading around $74,561 after dipping to an overnight low of $73,999, extending a three-week corrective channel down 10.1% over the last 30 days and 40.9% off its October 2025 all-time high ($126,080).
With $2.13 Billion pulled from U.S. Spot Bitcoin ETFs across six of the last seven sessions, all eyes now turn to the October U.S. CPI release (13:30 UTC) to determine whether price holds its 200-day moving average or breaks into a deeper structural correction.
📌 ETF Flow Breakdown: IBIT Institutional De-Risking vs. Retail Holding
The $2.13 Billion net outflow across the U.S. spot Bitcoin ETF complex shows high institutional concentration:
🏦 BlackRock’s IBIT Leads Outflows: IBIT alone accounted for $1.66 Billion (77.9%) of total net redemptions over the 7-session stretch, including massive single-day outflows of $405.3M (Nov 2) and $403.0M (Nov 6).
🛡️ Competitors Hold Relatively Steady: Fidelity’s FBTC logged a modest net exit of -$107.9M (cushioned by +$236.7M on Nov 4), while ARKB (-$158.5M) and GBTC (-$114.3M) saw routine rebalancing.
$INIT
{future}(INITUSDT)
📉 Key Technical Levels: Bracketed Between Two Major Moving Averages
Bitcoin is currently squeezed inside a tight $2,500 decision band:
🚧 Resistance ($75,667): The 50-week (350-day) simple moving average. A daily close above this level neutralizes last week's breakdown and re-opens targets toward the 20-day SMA ($78,590).
$HYPE
{future}(HYPEUSDT)
🛡️ Critical Support ($73,158): The 200-day simple moving average. A daily close beneath $73,158 invalidates recovery setups and risks retesting the August consolidation floor (~$73,021).
📊 RSI Check: The 14-day RSI sits at 35.2—momentum is soft, but not yet oversold (<30), leaving sellers technical room to test $73,158.
$ONE
{future}(ONEUSDT)
#NvidiaInvestigatesAfterHuang’sAffairApology #BitcoinFiveWeeklyLosses #CPI数据 #Binance
#BitcoinSpotETFsPost$201MNetOutflowForThirdStraightDay
🚨 BITCOIN SLIPS BELOW $75K AS IBIT DRIVES 78% OF $2.1B SPOT ETF OUTFLOWS AHEAD OF U.S. CPI! 📉📊
Bitcoin ($BTC) is currently trading around $74,561 after dipping to an overnight low of $73,999, extending a three-week corrective channel down 10.1% over the last 30 days and 40.9% off its October 2025 all-time high ($126,080).
With $2.13 Billion pulled from U.S. Spot Bitcoin ETFs across six of the last seven sessions, all eyes now turn to the October U.S. CPI release (13:30 UTC) to determine whether price holds its 200-day moving average or breaks into a deeper structural correction.
📌 ETF Flow Breakdown: IBIT Institutional De-Risking vs. Retail Holding
The $2.13 Billion net outflow across the U.S. spot Bitcoin ETF complex shows high institutional concentration:
🏦 BlackRock’s IBIT Leads Outflows: IBIT alone accounted for $1.66 Billion (77.9%) of total net redemptions over the 7-session stretch, including massive single-day outflows of $405.3M (Nov 2) and $403.0M (Nov 6).
🛡️ Competitors Hold Relatively Steady: Fidelity’s FBTC logged a modest net exit of -$107.9M (cushioned by +$236.7M on Nov 4), while ARKB (-$158.5M) and GBTC (-$114.3M) saw routine rebalancing.
$INIT
📉 Key Technical Levels: Bracketed Between Two Major Moving Averages
Bitcoin is currently squeezed inside a tight $2,500 decision band:
🚧 Resistance ($75,667): The 50-week (350-day) simple moving average. A daily close above this level neutralizes last week's breakdown and re-opens targets toward the 20-day SMA ($78,590).
$HYPE
🛡️ Critical Support ($73,158): The 200-day simple moving average. A daily close beneath $73,158 invalidates recovery setups and risks retesting the August consolidation floor (~$73,021).
📊 RSI Check: The 14-day RSI sits at 35.2—momentum is soft, but not yet oversold (<30), leaving sellers technical room to test $73,158.
$ONE
#NvidiaInvestigatesAfterHuang’sAffairApology #BitcoinFiveWeeklyLosses #CPI数据 #Binance
🚨 BITCOIN SLIPS BELOW $75K AS IBIT DRIVES 78% OF $2.1B SPOT ETF OUTFLOWS AHEAD OF U.S. CPI! 📉📊
Bitcoin ($BTC) is currently trading around $74,561 after dipping to an overnight low of $73,999, extending a three-week corrective channel down 10.1% over the last 30 days and 40.9% off its October 2025 all-time high ($126,080).
With $2.13 Billion pulled from U.S. Spot Bitcoin ETFs across six of the last seven sessions, all eyes now turn to the October U.S. CPI release (13:30 UTC) to determine whether price holds its 200-day moving average or breaks into a deeper structural correction.
📌 ETF Flow Breakdown: IBIT Institutional De-Risking vs. Retail Holding
The $2.13 Billion net outflow across the U.S. spot Bitcoin ETF complex shows high institutional concentration:
🏦 BlackRock’s IBIT Leads Outflows: IBIT alone accounted for $1.66 Billion (77.9%) of total net redemptions over the 7-session stretch, including massive single-day outflows of $405.3M (Nov 2) and $403.0M (Nov 6).
🛡️ Competitors Hold Relatively Steady: Fidelity’s FBTC logged a modest net exit of -$107.9M (cushioned by +$236.7M on Nov 4), while ARKB (-$158.5M) and GBTC (-$114.3M) saw routine rebalancing.
$INIT
📉 Key Technical Levels: Bracketed Between Two Major Moving Averages
Bitcoin is currently squeezed inside a tight $2,500 decision band:
🚧 Resistance ($75,667): The 50-week (350-day) simple moving average. A daily close above this level neutralizes last week's breakdown and re-opens targets toward the 20-day SMA ($78,590).
$HYPE
🛡️ Critical Support ($73,158): The 200-day simple moving average. A daily close beneath $73,158 invalidates recovery setups and risks retesting the August consolidation floor (~$73,021).
📊 RSI Check: The 14-day RSI sits at 35.2—momentum is soft, but not yet oversold (<30), leaving sellers technical room to test $73,158.
$ONE
#NvidiaInvestigatesAfterHuang’sAffairApology #BitcoinFiveWeeklyLosses #CPI数据 #Binance

1
388
📉 Bitcoin ETFs Record Third Consecutive Day of Outflows!
US spot Bitcoin ETFs recorded $201 million in net withdrawals on November 9. The continued outflows highlight cautious institutional sentiment as investors reassess crypto market exposure. $BTC $ETH $BNB #BitcoinSpotETFsPost$201MNetOutflowForThirdStraightDay
📉 Bitcoin ETFs Record Third Consecutive Day of Outflows!
US spot Bitcoin ETFs recorded $201 million in net withdrawals on November 9. The continued outflows highlight cautious institutional sentiment as investors reassess crypto market exposure. $BTC $ETH $BNB #BitcoinSpotETFsPost$201MNetOutflowForThirdStraightDay
US spot Bitcoin ETFs recorded $201 million in net withdrawals on November 9. The continued outflows highlight cautious institutional sentiment as investors reassess crypto market exposure. $BTC $ETH $BNB #BitcoinSpotETFsPost$201MNetOutflowForThirdStraightDay
59
🏦 BlackRock Leads the ETF Outflow Story!
BlackRock's IBIT recorded approximately $213.2 million in daily withdrawals, exceeding the overall market's net outflow. Meanwhile, Morgan Stanley's MSBT attracted fresh capital. ETF flows remain mixed. $BTC $ETH $SOL #BitcoinSpotETFsPost$201MNetOutflowForThirdStraightDay
🏦 BlackRock Leads the ETF Outflow Story!
BlackRock's IBIT recorded approximately $213.2 million in daily withdrawals, exceeding the overall market's net outflow. Meanwhile, Morgan Stanley's MSBT attracted fresh capital. ETF flows remain mixed. $BTC $ETH $SOL #BitcoinSpotETFsPost$201MNetOutflowForThirdStraightDay
BlackRock's IBIT recorded approximately $213.2 million in daily withdrawals, exceeding the overall market's net outflow. Meanwhile, Morgan Stanley's MSBT attracted fresh capital. ETF flows remain mixed. $BTC $ETH $SOL #BitcoinSpotETFsPost$201MNetOutflowForThirdStraightDay
65

·
--
BITCOIN ETF OUTFLOWS HIT $201 MILLION — THREE STRAIGHT DAYS OF SELLING PRESSURE
Bitcoin institutional demand is facing another warning signal as US spot Bitcoin ETFs recorded $201 million in net outflows on November 9, marking the third consecutive trading day of withdrawals.
BlackRock’s IBIT led the outflows with approximately $213.2 million, while Morgan Stanley’s MSBT attracted around $22.1 million in fresh capital.
Why does this matter?
Three consecutive outflow sessions suggest institutional appetite is cooling. However, ETF withdrawals do not automatically mean Bitcoin's long-term bullish outlook is over.
The wider crypto market is also showing caution, with Binance's market overview reporting a Fear & Greed Index of 28 (Fear).
What to watch next:
- Whether ETF outflows continue or reverse
- Whether BlackRock IBIT sees fresh inflows
- Whether Bitcoin can regain stronger buying momentum
- Whether institutional demand returns across major funds
{future}(BTCUSDT)
The big question: Is this temporary institutional profit-taking, or the beginning of a deeper Bitcoin correction?
#BitcoinSpotETFsPost$201MNetOutflowForThirdStraightDay
BITCOIN ETF OUTFLOWS HIT $201 MILLION — THREE STRAIGHT DAYS OF SELLING PRESSURE
Bitcoin institutional demand is facing another warning signal as US spot Bitcoin ETFs recorded $201 million in net outflows on November 9, marking the third consecutive trading day of withdrawals.
BlackRock’s IBIT led the outflows with approximately $213.2 million, while Morgan Stanley’s MSBT attracted around $22.1 million in fresh capital.
Why does this matter?
Three consecutive outflow sessions suggest institutional appetite is cooling. However, ETF withdrawals do not automatically mean Bitcoin's long-term bullish outlook is over.
The wider crypto market is also showing caution, with Binance's market overview reporting a Fear & Greed Index of 28 (Fear).
What to watch next:
- Whether ETF outflows continue or reverse
- Whether BlackRock IBIT sees fresh inflows
- Whether Bitcoin can regain stronger buying momentum
- Whether institutional demand returns across major funds
The big question: Is this temporary institutional profit-taking, or the beginning of a deeper Bitcoin correction?
#BitcoinSpotETFsPost$201MNetOutflowForThirdStraightDay
Bitcoin institutional demand is facing another warning signal as US spot Bitcoin ETFs recorded $201 million in net outflows on November 9, marking the third consecutive trading day of withdrawals.
BlackRock’s IBIT led the outflows with approximately $213.2 million, while Morgan Stanley’s MSBT attracted around $22.1 million in fresh capital.
Why does this matter?
Three consecutive outflow sessions suggest institutional appetite is cooling. However, ETF withdrawals do not automatically mean Bitcoin's long-term bullish outlook is over.
The wider crypto market is also showing caution, with Binance's market overview reporting a Fear & Greed Index of 28 (Fear).
What to watch next:
- Whether ETF outflows continue or reverse
- Whether BlackRock IBIT sees fresh inflows
- Whether Bitcoin can regain stronger buying momentum
- Whether institutional demand returns across major funds
The big question: Is this temporary institutional profit-taking, or the beginning of a deeper Bitcoin correction?
#BitcoinSpotETFsPost$201MNetOutflowForThirdStraightDay

BTC-5.19%
BLKUS+0.56%
120

Partly True
Article
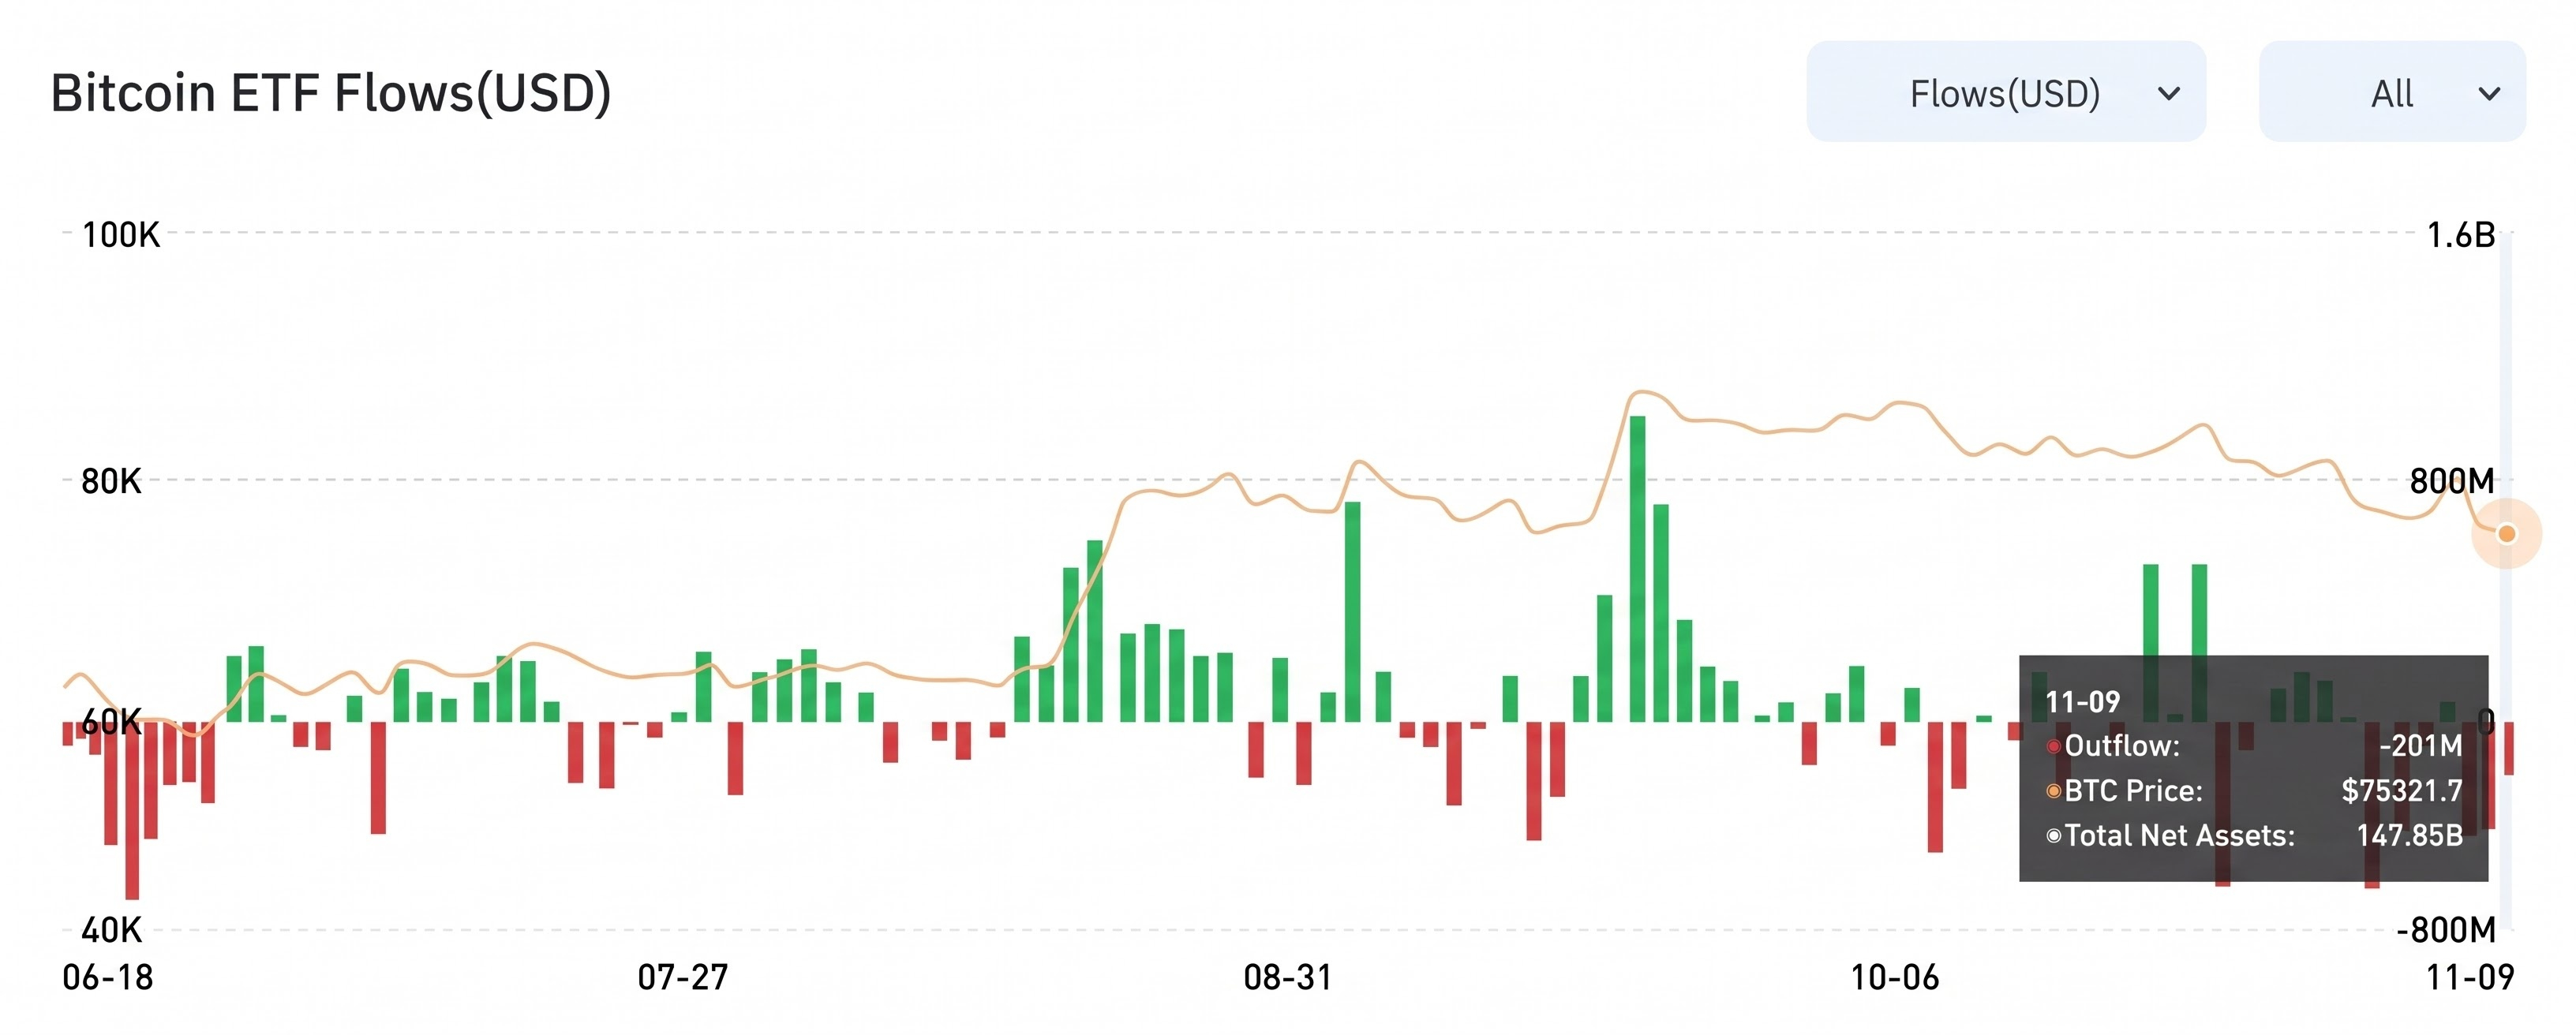
Bitcoin Spot ETFs Post $201M Net Outflow For Third Straight DayThe institutional tide is shifting! 🚨 For the third consecutive day, US Spot Bitcoin ETFs have recorded capital flight, with a massive $201 million exiting the market on November 9.
Here is the exact data breakdown:
📉 Daily Net Outflow: -$201M
💰 BTC Price: $75,321.7
💼 Total Net Assets: $147.85B
What Does This Mean for Traders?
Three straight days of red show institutional players are cooling off. With major funds like BlackRock's IBIT driving the withdrawals, it signals aggressive profit-taking and portfolio rebalancing as Bitcoin holds near the $75K mark.
Is a Dump Imminent?
Don't panic yet. ETF flows are only one piece of the puzzle. While a $201M daily drop is notable, the staggering $147.85B in total ETF net assets provides a heavy structural floor. Retail volume, on-chain metrics, and macro conditions are still heavily in play.
My Trading Gameplan:
I am closely monitoring the $75K support zone. If this outflow trend extends into a fourth day, expect elevated short-term volatility. Keep your leverage low, manage risk strictly, and trade the chart—not just the headline news.
Are you buying the dip or waiting for confirmation? Drop your thoughts below! 👇
$BTC $SOXL $MVLL
{future}(MVLLUSDT)
{future}(SOXLUSDT)
{future}(BTCUSDT)
#BitcoinSpotETFsPost$201MNetOutflowForThirdStraightDay #bitcoin #cryptotrading #BitcoinETFs #BinanceSquare
Bitcoin Spot ETFs Post $201M Net Outflow For Third Straight Day
The institutional tide is shifting! 🚨 For the third consecutive day, US Spot Bitcoin ETFs have recorded capital flight, with a massive $201 million exiting the market on November 9.
Here is the exact data breakdown:
📉 Daily Net Outflow: -$201M
💰 BTC Price: $75,321.7
💼 Total Net Assets: $147.85B
What Does This Mean for Traders?
Three straight days of red show institutional players are cooling off. With major funds like BlackRock's IBIT driving the withdrawals, it signals aggressive profit-taking and portfolio rebalancing as Bitcoin holds near the $75K mark.
Is a Dump Imminent?
Don't panic yet. ETF flows are only one piece of the puzzle. While a $201M daily drop is notable, the staggering $147.85B in total ETF net assets provides a heavy structural floor. Retail volume, on-chain metrics, and macro conditions are still heavily in play.
My Trading Gameplan:
I am closely monitoring the $75K support zone. If this outflow trend extends into a fourth day, expect elevated short-term volatility. Keep your leverage low, manage risk strictly, and trade the chart—not just the headline news.
Are you buying the dip or waiting for confirmation? Drop your thoughts below! 👇
$BTC $SOXL $MVLL
#BitcoinSpotETFsPost$201MNetOutflowForThirdStraightDay #bitcoin #cryptotrading #BitcoinETFs #BinanceSquare
Here is the exact data breakdown:
📉 Daily Net Outflow: -$201M
💰 BTC Price: $75,321.7
💼 Total Net Assets: $147.85B
What Does This Mean for Traders?
Three straight days of red show institutional players are cooling off. With major funds like BlackRock's IBIT driving the withdrawals, it signals aggressive profit-taking and portfolio rebalancing as Bitcoin holds near the $75K mark.
Is a Dump Imminent?
Don't panic yet. ETF flows are only one piece of the puzzle. While a $201M daily drop is notable, the staggering $147.85B in total ETF net assets provides a heavy structural floor. Retail volume, on-chain metrics, and macro conditions are still heavily in play.
My Trading Gameplan:
I am closely monitoring the $75K support zone. If this outflow trend extends into a fourth day, expect elevated short-term volatility. Keep your leverage low, manage risk strictly, and trade the chart—not just the headline news.
Are you buying the dip or waiting for confirmation? Drop your thoughts below! 👇
$BTC $SOXL $MVLL
#BitcoinSpotETFsPost$201MNetOutflowForThirdStraightDay #bitcoin #cryptotrading #BitcoinETFs #BinanceSquare
1
382

·
--
Bearish
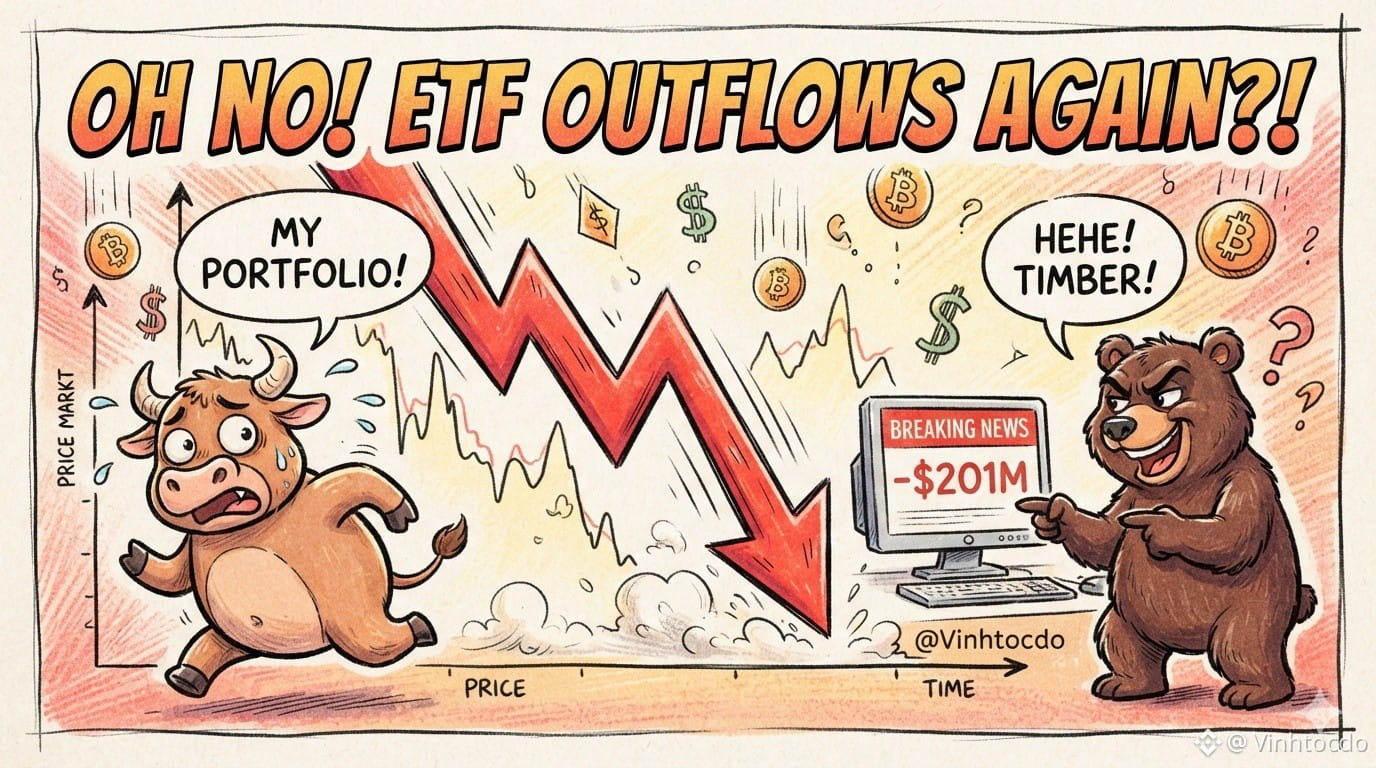
It’s over, folks! 📉 Bitcoin Spot ETFs just “evaporated” another $201 million, marking three straight days of heavy outflows.
What a buzzkill! Even BlackRock’s “big brother,” IBIT, saw a record $213 million in net outflows in a single day, while Morgan Stanley just can’t keep carrying the load.
With selling like this, the million-dollar question is: will BTC break below 64k?
Looking at sentiment right now, the bears are roaring while the bulls are running for cover. If money keeps fleeing these whale-sized funds, a retest of the 64k zone is entirely possible, wiping out highly leveraged Long positions.
What should traders do right now?
1. Close the app and go to sleep: Don’t get trigger-happy, or you might end up with nothing.
2. Set a stop-loss: Protect your money first.
3. DCA your way through it: If you believe in the future, split your capital and accumulate gradually.
Note: This is not financial advice!
#BitcoinSpotETFsPost$201MNetOutflowForThirdStraightDay #BitcoinETFs #CryptoMarket #BitcoinCrash #CryptoTrading #VINHTOCDO
👉 Click below to trade and support me:
$BTC
{spot}(BTCUSDT)
$ETH
{spot}(ETHUSDT)
$INIT
{future}(INITUSDT)
It’s over, folks! 📉 Bitcoin Spot ETFs just “evaporated” another $201 million, marking three straight days of heavy outflows.
What a buzzkill! Even BlackRock’s “big brother,” IBIT, saw a record $213 million in net outflows in a single day, while Morgan Stanley just can’t keep carrying the load.
With selling like this, the million-dollar question is: will BTC break below 64k?
Looking at sentiment right now, the bears are roaring while the bulls are running for cover. If money keeps fleeing these whale-sized funds, a retest of the 64k zone is entirely possible, wiping out highly leveraged Long positions.
What should traders do right now?
1. Close the app and go to sleep: Don’t get trigger-happy, or you might end up with nothing.
2. Set a stop-loss: Protect your money first.
3. DCA your way through it: If you believe in the future, split your capital and accumulate gradually.
Note: This is not financial advice!
#BitcoinSpotETFsPost$201MNetOutflowForThirdStraightDay #BitcoinETFs #CryptoMarket #BitcoinCrash #CryptoTrading #VINHTOCDO
👉 Click below to trade and support me:
$BTC
$ETH
$INIT
What a buzzkill! Even BlackRock’s “big brother,” IBIT, saw a record $213 million in net outflows in a single day, while Morgan Stanley just can’t keep carrying the load.
With selling like this, the million-dollar question is: will BTC break below 64k?
Looking at sentiment right now, the bears are roaring while the bulls are running for cover. If money keeps fleeing these whale-sized funds, a retest of the 64k zone is entirely possible, wiping out highly leveraged Long positions.
What should traders do right now?
1. Close the app and go to sleep: Don’t get trigger-happy, or you might end up with nothing.
2. Set a stop-loss: Protect your money first.
3. DCA your way through it: If you believe in the future, split your capital and accumulate gradually.
Note: This is not financial advice!
#BitcoinSpotETFsPost$201MNetOutflowForThirdStraightDay #BitcoinETFs #CryptoMarket #BitcoinCrash #CryptoTrading #VINHTOCDO
👉 Click below to trade and support me:
$BTC
$ETH
$INIT
3
1.4k
💡 ETF Flows Are an Important Bitcoin Signal!
Spot Bitcoin ETFs provide insight into investor demand, but daily withdrawals do not automatically mean long-term confidence has disappeared. Watch whether institutional flows stabilize in the coming sessions.
$BTC $BNB $ETH $ADA #BitcoinSpotETFsPost$201MNetOutflowForThirdStraightDay
💡 ETF Flows Are an Important Bitcoin Signal!
Spot Bitcoin ETFs provide insight into investor demand, but daily withdrawals do not automatically mean long-term confidence has disappeared. Watch whether institutional flows stabilize in the coming sessions.
$BTC $BNB $ETH $ADA #BitcoinSpotETFsPost$201MNetOutflowForThirdStraightDay
Spot Bitcoin ETFs provide insight into investor demand, but daily withdrawals do not automatically mean long-term confidence has disappeared. Watch whether institutional flows stabilize in the coming sessions.
$BTC $BNB $ETH $ADA #BitcoinSpotETFsPost$201MNetOutflowForThirdStraightDay
33

·
--

Article
MarketThe crypto market is bleeding... Bitcoin breaks below $75,000, and altcoins follow! [1]
Crypto markets are experiencing a sharp and sudden downturn, with Bitcoin (BTC) falling below the $75,000 mark to around $74,000. The market has lost more than $1 billion due to forced liquidations of futures contracts in just 24 hours. [1, 2, 3, 4]
Market
The crypto market is bleeding... Bitcoin breaks below $75,000, and altcoins follow! [1]
Crypto markets are experiencing a sharp and sudden downturn, with Bitcoin (BTC) falling below the $75,000 mark to around $74,000. The market has lost more than $1 billion due to forced liquidations of futures contracts in just 24 hours. [1, 2, 3, 4]
Crypto markets are experiencing a sharp and sudden downturn, with Bitcoin (BTC) falling below the $75,000 mark to around $74,000. The market has lost more than $1 billion due to forced liquidations of futures contracts in just 24 hours. [1, 2, 3, 4]
1
288

·
--
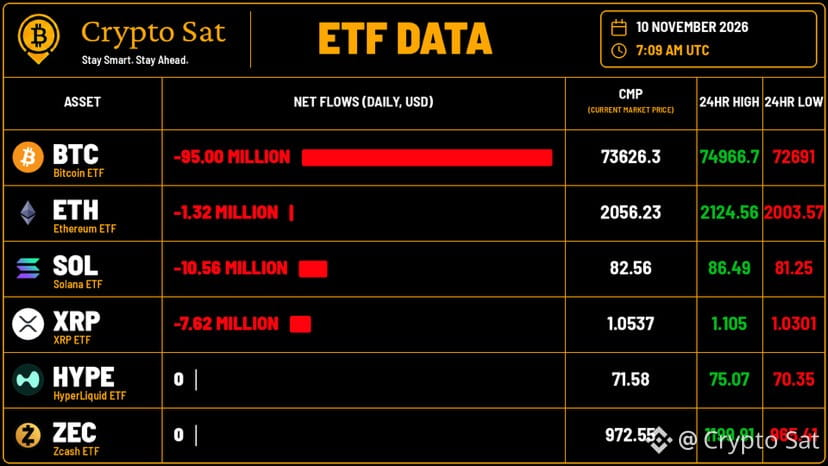
ETF Flows Update (10 November 2026)
• $BTC : -$95.00 Million
• $ETH : -$1.32 Million
• $XRP : -$7.62 Million
• $SOL : -$10.56 Million
• $HYPE : $0
• $ZEC : $0
Bitcoin ETF recorded outflows of $95.00M on November 10. Ethereum posted a modest outflow of $1.32M, Solana saw outflows of $10.56M, XRP saw outflows of $7.62M, while Hyperliquid and ZEC remained flat.
{future}(SOLUSDT)
{future}(ZECUSDT)
{future}(BTCUSDT)
#BitcoinSpotETFsPost$201MNetOutflowForThirdStraightDay
ETF Flows Update (10 November 2026)
• $BTC : -$95.00 Million • $ETH : -$1.32 Million • $XRP : -$7.62 Million • $SOL : -$10.56 Million • $HYPE : $0 • $ZEC : $0
Bitcoin ETF recorded outflows of $95.00M on November 10. Ethereum posted a modest outflow of $1.32M, Solana saw outflows of $10.56M, XRP saw outflows of $7.62M, while Hyperliquid and ZEC remained flat.
#BitcoinSpotETFsPost$201MNetOutflowForThirdStraightDay
• $BTC : -$95.00 Million • $ETH : -$1.32 Million • $XRP : -$7.62 Million • $SOL : -$10.56 Million • $HYPE : $0 • $ZEC : $0
Bitcoin ETF recorded outflows of $95.00M on November 10. Ethereum posted a modest outflow of $1.32M, Solana saw outflows of $10.56M, XRP saw outflows of $7.62M, while Hyperliquid and ZEC remained flat.
#BitcoinSpotETFsPost$201MNetOutflowForThirdStraightDay
331

🚨 $SOXL TODAY: ANOTHER DIP OR RECOVERY LOADING?
{future}(SOXLUSDT)
SOXL is facing selling pressure after its recent massive bounce! 📉
🟢 Support: $52–$53
🟢 Strong support: $47–$48
🔴 Resistance: $56–$57.50
🚀 Next upside zone: $59.50–$62
If buyers reclaim $57.50 with strong volume, recovery momentum could return.
But losing $52 may expose another downside move.
My strategy: Wait for confirmation. Don't chase volatility!
Are you buying this dip or waiting for a breakout? 👀
⚠️ SOXL is a 3x DAILY leveraged ETF. High risk, especially when held for multiple days.
DYOR • Manage risk • Not financial advice.#AnthropicRejectsIPODelayValuationinQuestion #BitcoinFiveWeeklyLosses #NvidiaInvestigatesAfterHuang’sAffairApology #BitcoinSpotETFsPost$201MNetOutflowForThirdStraightDay
🚨 $SOXL TODAY: ANOTHER DIP OR RECOVERY LOADING?
SOXL is facing selling pressure after its recent massive bounce! 📉
🟢 Support: $52–$53
🟢 Strong support: $47–$48
🔴 Resistance: $56–$57.50
🚀 Next upside zone: $59.50–$62
If buyers reclaim $57.50 with strong volume, recovery momentum could return.
But losing $52 may expose another downside move.
My strategy: Wait for confirmation. Don't chase volatility!
Are you buying this dip or waiting for a breakout? 👀
⚠️ SOXL is a 3x DAILY leveraged ETF. High risk, especially when held for multiple days.
DYOR • Manage risk • Not financial advice.#AnthropicRejectsIPODelayValuationinQuestion #BitcoinFiveWeeklyLosses #NvidiaInvestigatesAfterHuang’sAffairApology #BitcoinSpotETFsPost$201MNetOutflowForThirdStraightDay
SOXL is facing selling pressure after its recent massive bounce! 📉
🟢 Support: $52–$53
🟢 Strong support: $47–$48
🔴 Resistance: $56–$57.50
🚀 Next upside zone: $59.50–$62
If buyers reclaim $57.50 with strong volume, recovery momentum could return.
But losing $52 may expose another downside move.
My strategy: Wait for confirmation. Don't chase volatility!
Are you buying this dip or waiting for a breakout? 👀
⚠️ SOXL is a 3x DAILY leveraged ETF. High risk, especially when held for multiple days.
DYOR • Manage risk • Not financial advice.#AnthropicRejectsIPODelayValuationinQuestion #BitcoinFiveWeeklyLosses #NvidiaInvestigatesAfterHuang’sAffairApology #BitcoinSpotETFsPost$201MNetOutflowForThirdStraightDay

550

·
--

Article
📊 **Can Nvidia's Earnings Calm Market Anxiety? AI Demand Faces Its Biggest Test** 🤖The market is jittery about AI valuations, and all eyes are on Nvidia. 👀 The company's next report could either spark a tech rally or deepen the sell-offs. 🎢
**📅 The Date to Mark**
Nvidia is scheduled to report fiscal Q3 2027 results on Tuesday, Nov. 17, after the US close, with a conference call at 5:00 p.m. ET. ⏰ The quarter covers late July to late October 2026. 🗓️
**🎯 The Number Everyone Is Watching**
Nvidia guided Q3 revenue to $108.0 billion, plus or minus 2%, above a consensus near $104 billion. 💰 Some pre-earnings projections suggest it could even clear the top of its own range, at $113 billion to $114 billion. 🚀 When expectations run this high, a "good" number can still disappoint. 😬
**🏗️ Why Blackwell and Vera Rubin Matter**
In Q2, Nvidia posted $96.2 billion in revenue, up 106% year over year, with Data Center revenue of $89 billion, up 117%. 📈 Blackwell Ultra drove that Data Center strength. 🔥 Now Vera Rubin, which began volume shipments in early August, is expected to be about 20% of Q3 Data Center revenue. 🔧 A smooth ramp would support the case that AI demand is still accelerating. ✅
**🟢 The Bull Case: What Could Spark a Rally**
- 💪 Revenue above the $108B guide
- 📣 A confident Q4 outlook that signals continued growth
- 🧮 Gross margin holding near the 74% guidance
- 🏭 Evidence that Vera Rubin demand is outpacing supply
**🔴 The Bear Case: What Could Deepen Sell-Offs**
- 📉 Revenue that merely meets expectations
- 🛑 A cautious or conservative outlook
- 💸 A margin drop below guidance
- 🏛️ New export restrictions or China-related surprises
Nvidia's latest 10-Q also shows long-term supply and capacity commitments of $279 billion, up from $119 billion one quarter earlier. 😮 Investors will want to see that this spending is backed by real demand. 🔍
**🪙 What It Means for Crypto**
Nvidia doesn't directly move crypto prices, but both markets react to the same mood: risk-on or risk-off. 🌊 A strong report could lift appetite for growth assets, including Bitcoin and altcoins like $INIT. 🌤️ A weak one could push investors toward safety, and smaller altcoins tend to swing harder in both directions. ⚡ Traders should expect higher volatility around the release. 🎢
**✅ Final Takeaway**
Nvidia's earnings are a major sentiment test for AI and for risk assets. 🎯 The guidance and the demand outlook may matter more than the headline beat. 🧠 Size your positions carefully, avoid over-leverage, and let the data guide you rather than the hype. 🛡️
*This is not financial advice. Always do your own research.* 🙏
**:** #NvidiaEarnings 💚 #AIStocks 🤖 #CryptoMarket 🪙 #Bitcoin ₿ #MarketAnalysis 📊
---
#CanNvidiaEarningsEaseMarketConcerns? #ADPWeeklyEstimateShowsUSPrivatePayrollsUp19750 #BitcoinFiveWeeklyLosses #AIChipSlumpNasdaq #BitcoinSpotETFsPost$201MNetOutflowForThirdStraightDay
Sources:
- [CME Group: Nvidia earnings date](https://www.cmelitegroup.com/knowledge-hub/nvidia-earnings-date-fiscal-q3-2027-report-time-guidance-and-expected-move/?nocache=1)
- [Crypto Briefing: Q3 FY2027 preview](https://cryptobriefing.com/nvidia-q3-fy2027-preview-279-billion-supply/)
- [Zacks: Nvidia Q2 results](https://www.zacks.com/stock/news/2981086/{https:/www.zackstrade.com/2019-1-dollar})
- [StockHub: Q2 earnings call](https://stockhub.kr/en/insights/view_1787778662493_qnf75rbqx)
📊 **Can Nvidia's Earnings Calm Market Anxiety? AI Demand Faces Its Biggest Test** 🤖
The market is jittery about AI valuations, and all eyes are on Nvidia. 👀 The company's next report could either spark a tech rally or deepen the sell-offs. 🎢
**📅 The Date to Mark**
Nvidia is scheduled to report fiscal Q3 2027 results on Tuesday, Nov. 17, after the US close, with a conference call at 5:00 p.m. ET. ⏰ The quarter covers late July to late October 2026. 🗓️
**🎯 The Number Everyone Is Watching**
Nvidia guided Q3 revenue to $108.0 billion, plus or minus 2%, above a consensus near $104 billion. 💰 Some pre-earnings projections suggest it could even clear the top of its own range, at $113 billion to $114 billion. 🚀 When expectations run this high, a "good" number can still disappoint. 😬
**🏗️ Why Blackwell and Vera Rubin Matter**
In Q2, Nvidia posted $96.2 billion in revenue, up 106% year over year, with Data Center revenue of $89 billion, up 117%. 📈 Blackwell Ultra drove that Data Center strength. 🔥 Now Vera Rubin, which began volume shipments in early August, is expected to be about 20% of Q3 Data Center revenue. 🔧 A smooth ramp would support the case that AI demand is still accelerating. ✅
**🟢 The Bull Case: What Could Spark a Rally**
- 💪 Revenue above the $108B guide
- 📣 A confident Q4 outlook that signals continued growth
- 🧮 Gross margin holding near the 74% guidance
- 🏭 Evidence that Vera Rubin demand is outpacing supply
**🔴 The Bear Case: What Could Deepen Sell-Offs**
- 📉 Revenue that merely meets expectations
- 🛑 A cautious or conservative outlook
- 💸 A margin drop below guidance
- 🏛️ New export restrictions or China-related surprises
Nvidia's latest 10-Q also shows long-term supply and capacity commitments of $279 billion, up from $119 billion one quarter earlier. 😮 Investors will want to see that this spending is backed by real demand. 🔍
**🪙 What It Means for Crypto**
Nvidia doesn't directly move crypto prices, but both markets react to the same mood: risk-on or risk-off. 🌊 A strong report could lift appetite for growth assets, including Bitcoin and altcoins like $INIT. 🌤️ A weak one could push investors toward safety, and smaller altcoins tend to swing harder in both directions. ⚡ Traders should expect higher volatility around the release. 🎢
**✅ Final Takeaway**
Nvidia's earnings are a major sentiment test for AI and for risk assets. 🎯 The guidance and the demand outlook may matter more than the headline beat. 🧠 Size your positions carefully, avoid over-leverage, and let the data guide you rather than the hype. 🛡️
*This is not financial advice. Always do your own research.* 🙏
**:** #NvidiaEarnings 💚 #AIStocks 🤖 #CryptoMarket 🪙 #Bitcoin ₿ #MarketAnalysis 📊
---
#CanNvidiaEarningsEaseMarketConcerns? #ADPWeeklyEstimateShowsUSPrivatePayrollsUp19750 #BitcoinFiveWeeklyLosses #AIChipSlumpNasdaq #BitcoinSpotETFsPost$201MNetOutflowForThirdStraightDay
Sources:
- [CME Group: Nvidia earnings date](https://www.cmelitegroup.com/knowledge-hub/nvidia-earnings-date-fiscal-q3-2027-report-time-guidance-and-expected-move/?nocache=1)
- [Crypto Briefing: Q3 FY2027 preview](https://cryptobriefing.com/nvidia-q3-fy2027-preview-279-billion-supply/)
- [Zacks: Nvidia Q2 results](https://www.zacks.com/stock/news/2981086/{https:/www.zackstrade.com/2019-1-dollar})
- [StockHub: Q2 earnings call](https://stockhub.kr/en/insights/view_1787778662493_qnf75rbqx)
**📅 The Date to Mark**
Nvidia is scheduled to report fiscal Q3 2027 results on Tuesday, Nov. 17, after the US close, with a conference call at 5:00 p.m. ET. ⏰ The quarter covers late July to late October 2026. 🗓️
**🎯 The Number Everyone Is Watching**
Nvidia guided Q3 revenue to $108.0 billion, plus or minus 2%, above a consensus near $104 billion. 💰 Some pre-earnings projections suggest it could even clear the top of its own range, at $113 billion to $114 billion. 🚀 When expectations run this high, a "good" number can still disappoint. 😬
**🏗️ Why Blackwell and Vera Rubin Matter**
In Q2, Nvidia posted $96.2 billion in revenue, up 106% year over year, with Data Center revenue of $89 billion, up 117%. 📈 Blackwell Ultra drove that Data Center strength. 🔥 Now Vera Rubin, which began volume shipments in early August, is expected to be about 20% of Q3 Data Center revenue. 🔧 A smooth ramp would support the case that AI demand is still accelerating. ✅
**🟢 The Bull Case: What Could Spark a Rally**
- 💪 Revenue above the $108B guide
- 📣 A confident Q4 outlook that signals continued growth
- 🧮 Gross margin holding near the 74% guidance
- 🏭 Evidence that Vera Rubin demand is outpacing supply
**🔴 The Bear Case: What Could Deepen Sell-Offs**
- 📉 Revenue that merely meets expectations
- 🛑 A cautious or conservative outlook
- 💸 A margin drop below guidance
- 🏛️ New export restrictions or China-related surprises
Nvidia's latest 10-Q also shows long-term supply and capacity commitments of $279 billion, up from $119 billion one quarter earlier. 😮 Investors will want to see that this spending is backed by real demand. 🔍
**🪙 What It Means for Crypto**
Nvidia doesn't directly move crypto prices, but both markets react to the same mood: risk-on or risk-off. 🌊 A strong report could lift appetite for growth assets, including Bitcoin and altcoins like $INIT. 🌤️ A weak one could push investors toward safety, and smaller altcoins tend to swing harder in both directions. ⚡ Traders should expect higher volatility around the release. 🎢
**✅ Final Takeaway**
Nvidia's earnings are a major sentiment test for AI and for risk assets. 🎯 The guidance and the demand outlook may matter more than the headline beat. 🧠 Size your positions carefully, avoid over-leverage, and let the data guide you rather than the hype. 🛡️
*This is not financial advice. Always do your own research.* 🙏
**:** #NvidiaEarnings 💚 #AIStocks 🤖 #CryptoMarket 🪙 #Bitcoin ₿ #MarketAnalysis 📊
---
#CanNvidiaEarningsEaseMarketConcerns? #ADPWeeklyEstimateShowsUSPrivatePayrollsUp19750 #BitcoinFiveWeeklyLosses #AIChipSlumpNasdaq #BitcoinSpotETFsPost$201MNetOutflowForThirdStraightDay
Sources:
- [CME Group: Nvidia earnings date](https://www.cmelitegroup.com/knowledge-hub/nvidia-earnings-date-fiscal-q3-2027-report-time-guidance-and-expected-move/?nocache=1)
- [Crypto Briefing: Q3 FY2027 preview](https://cryptobriefing.com/nvidia-q3-fy2027-preview-279-billion-supply/)
- [Zacks: Nvidia Q2 results](https://www.zacks.com/stock/news/2981086/{https:/www.zackstrade.com/2019-1-dollar})
- [StockHub: Q2 earnings call](https://stockhub.kr/en/insights/view_1787778662493_qnf75rbqx)
1
298
·
--

Article
📉 Bitcoin Under Pressure: Five Weeks of Losses and a Key Level Slips Away 🪙#BitcoinFiveWeeklyLosses
Bitcoin has had a rough stretch. 😬 After weeks of selling, the price has slid into the mid-$70,000s and traders are asking whether the damage is over. 🤔
📊 Where Price Stands
Bitcoin was trading near $75,500 on Friday, Nov. 6, down more than 3% for the week and heading for its fifth straight weekly loss. 📉 Fortune's price page showed about $76,024 that morning, a drop of roughly $4,200 from the day before. 💸 Prices have swung wildly: Bitcoin moved from about $75K to $81K within a day, then fell back. 🎢 The $74,000 figure in the post is around the lower end of this recent range, so treat it as the area price has been testing, not a confirmed live quote. ⚠️
💥 What Is Driving the Selling
- 🏦 ETF outflows: Bitcoin and Ether ETFs lost a combined $530 million on Nov. 5, and six funds recorded withdrawals, cutting short that week's ETF demand recovery. 💧
- 🏢 Big sellers: BlackRock sold $105 million of Bitcoin, its fifth straight day of selling. 🔻
- 💣 Liquidations: The crypto market shed about $140 billion in four hours at one point, triggering more than $1 billion in liquidations. 🌊
- 🤖 Tech weakness: An AI-related stock sell-off has spilled into crypto, with Ether falling 7% at one stage. 📉
🧱 Key Levels Are Breaking
Analysts had flagged $76,000 as a critical level for November. 🎯 Losing it leaves Bitcoin exposed to a deeper correction, especially if ETF outflows continue. ⚠️ Earlier this year, traders also watched the $70,000 to $73,000 zone as support, so that area may come back into focus. 👀
🌐 The Macro Backdrop
Markets rallied on Monday as oil fell on US-Iran talk hopes, but Bitcoin sat that rally out. 🤨 That suggests crypto is struggling with its own pressures, not just following stocks. 🧩 Rate-hike expectations also weigh on risk assets: December hike pricing was near 80% after the strong October jobs report. 🏛️ Higher rates tend to reduce appetite for speculative assets. 🧊
🧭 What Traders Are Watching
- 📈 Whether weekly ETF flows turn positive
- 🎯 Whether Bitcoin can reclaim $76,000
- 🌡️ Inflation data and Fed commentary ahead of December
- 💚 Nvidia's Nov. 17 earnings and tech sentiment
- 🕊️ US-Iran headlines and oil prices
🛡️ Why Risk Management Matters Now
Five weeks of losses can tempt people to catch the bottom or panic sell. 😰 Both are risky. Volatility tends to stay high until a clear recovery signal appears, so avoid heavy leverage, size positions carefully and use stop-losses. 🔐 Long-term holders may prefer to stay patient, while short-term traders should respect the trend. ⚖️
✅ Final Takeaway
Bitcoin is under real pressure from ETF outflows, big sellers and weak tech sentiment. 🐻 A recovery needs steadier ETF demand and a move back above key resistance. 🐂 Until then, caution and discipline matter more than predictions. 🧠
This is not financial advice. Always do your own research. 🙏
Sources:
- [FXStreet: Bitcoin Weekly Forecast, Nov. 6](https://www.fxstreet.com/cryptocurrencies/news/bitcoin-weekly-forecast-bears-tighten-grip-as-btc-eyes-fifth-weekly-loss-202611061148)
- [Fortune: Price of Bitcoin, Nov. 6, 2026](https://fortune.com/article/price-of-bitcoin-11-06-2026/)
- [Coinalyze news feed: ETF outflows and liquidations](https://coinalyze.net/bitcoin/usdc/deribit/btc_usdc-10nov26/price-chart-live/)
- [Coinalyze news feed: BlackRock selling](https://coinalyze.net/bitcoin/usdc/deribit/btc_usdc-8nov26/price-chart-live/)
- [Coinalyze news feed: $76,000 level](https://coinalyze.net/bitcoin/usdc/deribit/btc_usdc-7nov26/price-chart-live/)
- [The Weekend Spread: The Close, Nov. 9](https://theweekendspread.substack.com/p/the-close-monday-november-9-2026)
- [Bitcoin Magazine: earlier support levels](https://bitcoinmagazine.com/markets/bitcoin-price-falls-below-73000)#BitcoinSpotETFsPost$201MNetOutflowForThirdStraightDay #AIChipSlumpNasdaq #HotCPIDecemberHikePriced #NvidiaInvestigatesAfterHuang’sAffairApology
📉 Bitcoin Under Pressure: Five Weeks of Losses and a Key Level Slips Away 🪙
#BitcoinFiveWeeklyLosses
Bitcoin has had a rough stretch. 😬 After weeks of selling, the price has slid into the mid-$70,000s and traders are asking whether the damage is over. 🤔
📊 Where Price Stands
Bitcoin was trading near $75,500 on Friday, Nov. 6, down more than 3% for the week and heading for its fifth straight weekly loss. 📉 Fortune's price page showed about $76,024 that morning, a drop of roughly $4,200 from the day before. 💸 Prices have swung wildly: Bitcoin moved from about $75K to $81K within a day, then fell back. 🎢 The $74,000 figure in the post is around the lower end of this recent range, so treat it as the area price has been testing, not a confirmed live quote. ⚠️
💥 What Is Driving the Selling
- 🏦 ETF outflows: Bitcoin and Ether ETFs lost a combined $530 million on Nov. 5, and six funds recorded withdrawals, cutting short that week's ETF demand recovery. 💧
- 🏢 Big sellers: BlackRock sold $105 million of Bitcoin, its fifth straight day of selling. 🔻
- 💣 Liquidations: The crypto market shed about $140 billion in four hours at one point, triggering more than $1 billion in liquidations. 🌊
- 🤖 Tech weakness: An AI-related stock sell-off has spilled into crypto, with Ether falling 7% at one stage. 📉
🧱 Key Levels Are Breaking
Analysts had flagged $76,000 as a critical level for November. 🎯 Losing it leaves Bitcoin exposed to a deeper correction, especially if ETF outflows continue. ⚠️ Earlier this year, traders also watched the $70,000 to $73,000 zone as support, so that area may come back into focus. 👀
🌐 The Macro Backdrop
Markets rallied on Monday as oil fell on US-Iran talk hopes, but Bitcoin sat that rally out. 🤨 That suggests crypto is struggling with its own pressures, not just following stocks. 🧩 Rate-hike expectations also weigh on risk assets: December hike pricing was near 80% after the strong October jobs report. 🏛️ Higher rates tend to reduce appetite for speculative assets. 🧊
🧭 What Traders Are Watching
- 📈 Whether weekly ETF flows turn positive
- 🎯 Whether Bitcoin can reclaim $76,000
- 🌡️ Inflation data and Fed commentary ahead of December
- 💚 Nvidia's Nov. 17 earnings and tech sentiment
- 🕊️ US-Iran headlines and oil prices
🛡️ Why Risk Management Matters Now
Five weeks of losses can tempt people to catch the bottom or panic sell. 😰 Both are risky. Volatility tends to stay high until a clear recovery signal appears, so avoid heavy leverage, size positions carefully and use stop-losses. 🔐 Long-term holders may prefer to stay patient, while short-term traders should respect the trend. ⚖️
✅ Final Takeaway
Bitcoin is under real pressure from ETF outflows, big sellers and weak tech sentiment. 🐻 A recovery needs steadier ETF demand and a move back above key resistance. 🐂 Until then, caution and discipline matter more than predictions. 🧠
This is not financial advice. Always do your own research. 🙏
Sources:
- [FXStreet: Bitcoin Weekly Forecast, Nov. 6](https://www.fxstreet.com/cryptocurrencies/news/bitcoin-weekly-forecast-bears-tighten-grip-as-btc-eyes-fifth-weekly-loss-202611061148)
- [Fortune: Price of Bitcoin, Nov. 6, 2026](https://fortune.com/article/price-of-bitcoin-11-06-2026/)
- [Coinalyze news feed: ETF outflows and liquidations](https://coinalyze.net/bitcoin/usdc/deribit/btc_usdc-10nov26/price-chart-live/)
- [Coinalyze news feed: BlackRock selling](https://coinalyze.net/bitcoin/usdc/deribit/btc_usdc-8nov26/price-chart-live/)
- [Coinalyze news feed: $76,000 level](https://coinalyze.net/bitcoin/usdc/deribit/btc_usdc-7nov26/price-chart-live/)
- [The Weekend Spread: The Close, Nov. 9](https://theweekendspread.substack.com/p/the-close-monday-november-9-2026)
- [Bitcoin Magazine: earlier support levels](https://bitcoinmagazine.com/markets/bitcoin-price-falls-below-73000)#BitcoinSpotETFsPost$201MNetOutflowForThirdStraightDay #AIChipSlumpNasdaq #HotCPIDecemberHikePriced #NvidiaInvestigatesAfterHuang’sAffairApology
Bitcoin has had a rough stretch. 😬 After weeks of selling, the price has slid into the mid-$70,000s and traders are asking whether the damage is over. 🤔
📊 Where Price Stands
Bitcoin was trading near $75,500 on Friday, Nov. 6, down more than 3% for the week and heading for its fifth straight weekly loss. 📉 Fortune's price page showed about $76,024 that morning, a drop of roughly $4,200 from the day before. 💸 Prices have swung wildly: Bitcoin moved from about $75K to $81K within a day, then fell back. 🎢 The $74,000 figure in the post is around the lower end of this recent range, so treat it as the area price has been testing, not a confirmed live quote. ⚠️
💥 What Is Driving the Selling
- 🏦 ETF outflows: Bitcoin and Ether ETFs lost a combined $530 million on Nov. 5, and six funds recorded withdrawals, cutting short that week's ETF demand recovery. 💧
- 🏢 Big sellers: BlackRock sold $105 million of Bitcoin, its fifth straight day of selling. 🔻
- 💣 Liquidations: The crypto market shed about $140 billion in four hours at one point, triggering more than $1 billion in liquidations. 🌊
- 🤖 Tech weakness: An AI-related stock sell-off has spilled into crypto, with Ether falling 7% at one stage. 📉
🧱 Key Levels Are Breaking
Analysts had flagged $76,000 as a critical level for November. 🎯 Losing it leaves Bitcoin exposed to a deeper correction, especially if ETF outflows continue. ⚠️ Earlier this year, traders also watched the $70,000 to $73,000 zone as support, so that area may come back into focus. 👀
🌐 The Macro Backdrop
Markets rallied on Monday as oil fell on US-Iran talk hopes, but Bitcoin sat that rally out. 🤨 That suggests crypto is struggling with its own pressures, not just following stocks. 🧩 Rate-hike expectations also weigh on risk assets: December hike pricing was near 80% after the strong October jobs report. 🏛️ Higher rates tend to reduce appetite for speculative assets. 🧊
🧭 What Traders Are Watching
- 📈 Whether weekly ETF flows turn positive
- 🎯 Whether Bitcoin can reclaim $76,000
- 🌡️ Inflation data and Fed commentary ahead of December
- 💚 Nvidia's Nov. 17 earnings and tech sentiment
- 🕊️ US-Iran headlines and oil prices
🛡️ Why Risk Management Matters Now
Five weeks of losses can tempt people to catch the bottom or panic sell. 😰 Both are risky. Volatility tends to stay high until a clear recovery signal appears, so avoid heavy leverage, size positions carefully and use stop-losses. 🔐 Long-term holders may prefer to stay patient, while short-term traders should respect the trend. ⚖️
✅ Final Takeaway
Bitcoin is under real pressure from ETF outflows, big sellers and weak tech sentiment. 🐻 A recovery needs steadier ETF demand and a move back above key resistance. 🐂 Until then, caution and discipline matter more than predictions. 🧠
This is not financial advice. Always do your own research. 🙏
Sources:
- [FXStreet: Bitcoin Weekly Forecast, Nov. 6](https://www.fxstreet.com/cryptocurrencies/news/bitcoin-weekly-forecast-bears-tighten-grip-as-btc-eyes-fifth-weekly-loss-202611061148)
- [Fortune: Price of Bitcoin, Nov. 6, 2026](https://fortune.com/article/price-of-bitcoin-11-06-2026/)
- [Coinalyze news feed: ETF outflows and liquidations](https://coinalyze.net/bitcoin/usdc/deribit/btc_usdc-10nov26/price-chart-live/)
- [Coinalyze news feed: BlackRock selling](https://coinalyze.net/bitcoin/usdc/deribit/btc_usdc-8nov26/price-chart-live/)
- [Coinalyze news feed: $76,000 level](https://coinalyze.net/bitcoin/usdc/deribit/btc_usdc-7nov26/price-chart-live/)
- [The Weekend Spread: The Close, Nov. 9](https://theweekendspread.substack.com/p/the-close-monday-november-9-2026)
- [Bitcoin Magazine: earlier support levels](https://bitcoinmagazine.com/markets/bitcoin-price-falls-below-73000)#BitcoinSpotETFsPost$201MNetOutflowForThirdStraightDay #AIChipSlumpNasdaq #HotCPIDecemberHikePriced #NvidiaInvestigatesAfterHuang’sAffairApology
1
155
·
--

Article
🌍 **US-Iran Talk Hopes Spark a Powerful Market Rebound, But Is It Built to Last?** 📈#US-IranTalksFuelStrongStockMarketRebound
Global markets got a big lift this week as signs of diplomacy between Washington and Tehran pushed oil lower. 🛢️ But the story has already taken a twist since Monday. 🔄
**🚀 Monday's Rally by the Numbers**
On Monday, Nov. 9, the Dow rose 1,104 points, or 2.15%, to close at 52,389.75. The S&P 500 gained 2.35% to 7,549.94, its best day since April 8, and the Nasdaq Composite climbed 2.74% to 25,253.14. 📊 The rally was broad: all 11 S&P 500 sectors advanced, and small companies outperformed the largest stocks. 🏢
**🛢️ Oil Was the Trigger**
Brent crude fell roughly 5% to about $93, and WTI dropped about 4% to near $87. ⬇️ The decline followed President Trump saying fresh strikes on Iran were highly unlikely while talks progress, and a report that Qatar's prime minister was at the White House to discuss a possible Hormuz deal. 🤝 Brent has been falling from above $112 at the start of the month, and it lost 16.4% the week before. 📉 Cheaper oil eases inflation worries, which helps explain the rally. 💡
**🥇 Other Markets Reacted Too**
Gold gained about 1.9% to near $4,140 as the dollar softened. 🪙 Chip stocks rebounded broadly, even though Nvidia itself fell. 💚 The bounce also came after a rough week: the S&P 500's previous week was its worst since April 2025. 😬
**⚠️ But Peace Is Not Confirmed**
Reports about the Iran deal were disputed, and U.S. Secretary of State Marco Rubio called some Iranian demands "outrageous and ridiculous." 🚧 Without a signed agreement, any breakdown in talks could reverse sentiment quickly. ⚡ Oil prices have also been swinging on unconfirmed headlines, which makes the move fragile. 🎢
**🔄 Tuesday Brought a Reality Check**
Asian markets did extend the recovery on Tuesday, but U.S. stocks pulled back. 📉 The S&P 500 fell, dragged down by an Nvidia sell-off and rate-hike fears after hot inflation data, and the Nasdaq closed 0.74% lower at 25,065.87. 🌡️ That shows the rally depended on oil and positioning, while rates and inflation are still a major risk. 🏦 December rate-hike pricing was near 80% after last Friday's strong jobs report. 🎯
**🪙 What It Means for Crypto**
Bitcoin sat out Monday's rally, which suggests crypto is not simply following stocks right now. 🤔 Still, oil, inflation and Fed expectations affect liquidity, and altcoins like $BNB can swing sharply when risk sentiment changes. 🌊 If peace talks hold and oil keeps falling, risk appetite could improve. 🌤️ If talks fail or inflation stays hot, volatility could return. ⛈️
**🔍 What to Watch Next**
- 🕊️ Confirmation or collapse of US-Iran talks and a possible Hormuz deal
- 🛢️ Brent and WTI levels, especially moves below $90
- 📈 Inflation data and Fed commentary ahead of December
- 💚 Nvidia's Nov. 17 earnings, which will shape tech sentiment
**✅ Final Takeaway**
Can this recovery become a sustained global bull run? 🐂 It is too early to say. A lasting peace deal, steady oil and cooling inflation would all need to line up. 🧩 Until then, expect sharp swings, keep leverage low and focus on risk management. 🛡️
*This is not financial advice. Always do your own research.* 🙏
**:** #IranTalks 🕊️ #StockMarket 📈 #OilPrices 🛢️ #CryptoMarket 🪙 #BNB 🔶
---#
Sources:
- [CNBC: Stock market news for Nov. 9, 2026](https://www.cnbc.com/2026/11/08/stock-market-today-live-updates.html)
- [CNBC: Tuesday live updates](https://www.cnbc.com/2026/11/09/stock-market-today-live-updates.html)
- [The Weekend Spread: The Close, Nov. 9](https://theweekendspread.substack.com/p/the-close-monday-november-9-2026)
- [BabyPips: Market recap, Nov. 9](https://www.babypips.com/news/daily-financial-forex-market-recap-2026-11-09)
- [AP via DTN: US stocks rally](https://www.dtnpf.com/agriculture/web/ag/news/world-policy/article/2026/11/09/us-stocks-rally-recover-last-weeks)
- [Reading the Market, Nov. 9](https://stephenkates.substack.com/p/reading-the-market-november-9-2026)
- [JournalArta: Oil price today](https://journalarta.com/en/2026/11/09/oil-price-today-brent-falls-4-96-to-93-44-on-iran-peace-hopes-as-gold-climbs/)#BitcoinFiveWeeklyLosses #AIChipSlumpNasdaq #BitcoinSpotETFsPost$201MNetOutflowForThirdStraightDay #HotCPIDecemberHikePriced
🌍 **US-Iran Talk Hopes Spark a Powerful Market Rebound, But Is It Built to Last?** 📈
#US-IranTalksFuelStrongStockMarketRebound
Global markets got a big lift this week as signs of diplomacy between Washington and Tehran pushed oil lower. 🛢️ But the story has already taken a twist since Monday. 🔄
**🚀 Monday's Rally by the Numbers**
On Monday, Nov. 9, the Dow rose 1,104 points, or 2.15%, to close at 52,389.75. The S&P 500 gained 2.35% to 7,549.94, its best day since April 8, and the Nasdaq Composite climbed 2.74% to 25,253.14. 📊 The rally was broad: all 11 S&P 500 sectors advanced, and small companies outperformed the largest stocks. 🏢
**🛢️ Oil Was the Trigger**
Brent crude fell roughly 5% to about $93, and WTI dropped about 4% to near $87. ⬇️ The decline followed President Trump saying fresh strikes on Iran were highly unlikely while talks progress, and a report that Qatar's prime minister was at the White House to discuss a possible Hormuz deal. 🤝 Brent has been falling from above $112 at the start of the month, and it lost 16.4% the week before. 📉 Cheaper oil eases inflation worries, which helps explain the rally. 💡
**🥇 Other Markets Reacted Too**
Gold gained about 1.9% to near $4,140 as the dollar softened. 🪙 Chip stocks rebounded broadly, even though Nvidia itself fell. 💚 The bounce also came after a rough week: the S&P 500's previous week was its worst since April 2025. 😬
**⚠️ But Peace Is Not Confirmed**
Reports about the Iran deal were disputed, and U.S. Secretary of State Marco Rubio called some Iranian demands "outrageous and ridiculous." 🚧 Without a signed agreement, any breakdown in talks could reverse sentiment quickly. ⚡ Oil prices have also been swinging on unconfirmed headlines, which makes the move fragile. 🎢
**🔄 Tuesday Brought a Reality Check**
Asian markets did extend the recovery on Tuesday, but U.S. stocks pulled back. 📉 The S&P 500 fell, dragged down by an Nvidia sell-off and rate-hike fears after hot inflation data, and the Nasdaq closed 0.74% lower at 25,065.87. 🌡️ That shows the rally depended on oil and positioning, while rates and inflation are still a major risk. 🏦 December rate-hike pricing was near 80% after last Friday's strong jobs report. 🎯
**🪙 What It Means for Crypto**
Bitcoin sat out Monday's rally, which suggests crypto is not simply following stocks right now. 🤔 Still, oil, inflation and Fed expectations affect liquidity, and altcoins like $BNB can swing sharply when risk sentiment changes. 🌊 If peace talks hold and oil keeps falling, risk appetite could improve. 🌤️ If talks fail or inflation stays hot, volatility could return. ⛈️
**🔍 What to Watch Next**
- 🕊️ Confirmation or collapse of US-Iran talks and a possible Hormuz deal
- 🛢️ Brent and WTI levels, especially moves below $90
- 📈 Inflation data and Fed commentary ahead of December
- 💚 Nvidia's Nov. 17 earnings, which will shape tech sentiment
**✅ Final Takeaway**
Can this recovery become a sustained global bull run? 🐂 It is too early to say. A lasting peace deal, steady oil and cooling inflation would all need to line up. 🧩 Until then, expect sharp swings, keep leverage low and focus on risk management. 🛡️
*This is not financial advice. Always do your own research.* 🙏
**:** #IranTalks 🕊️ #StockMarket 📈 #OilPrices 🛢️ #CryptoMarket 🪙 #BNB 🔶
---#
Sources:
- [CNBC: Stock market news for Nov. 9, 2026](https://www.cnbc.com/2026/11/08/stock-market-today-live-updates.html)
- [CNBC: Tuesday live updates](https://www.cnbc.com/2026/11/09/stock-market-today-live-updates.html)
- [The Weekend Spread: The Close, Nov. 9](https://theweekendspread.substack.com/p/the-close-monday-november-9-2026)
- [BabyPips: Market recap, Nov. 9](https://www.babypips.com/news/daily-financial-forex-market-recap-2026-11-09)
- [AP via DTN: US stocks rally](https://www.dtnpf.com/agriculture/web/ag/news/world-policy/article/2026/11/09/us-stocks-rally-recover-last-weeks)
- [Reading the Market, Nov. 9](https://stephenkates.substack.com/p/reading-the-market-november-9-2026)
- [JournalArta: Oil price today](https://journalarta.com/en/2026/11/09/oil-price-today-brent-falls-4-96-to-93-44-on-iran-peace-hopes-as-gold-climbs/)#BitcoinFiveWeeklyLosses #AIChipSlumpNasdaq #BitcoinSpotETFsPost$201MNetOutflowForThirdStraightDay #HotCPIDecemberHikePriced
Global markets got a big lift this week as signs of diplomacy between Washington and Tehran pushed oil lower. 🛢️ But the story has already taken a twist since Monday. 🔄
**🚀 Monday's Rally by the Numbers**
On Monday, Nov. 9, the Dow rose 1,104 points, or 2.15%, to close at 52,389.75. The S&P 500 gained 2.35% to 7,549.94, its best day since April 8, and the Nasdaq Composite climbed 2.74% to 25,253.14. 📊 The rally was broad: all 11 S&P 500 sectors advanced, and small companies outperformed the largest stocks. 🏢
**🛢️ Oil Was the Trigger**
Brent crude fell roughly 5% to about $93, and WTI dropped about 4% to near $87. ⬇️ The decline followed President Trump saying fresh strikes on Iran were highly unlikely while talks progress, and a report that Qatar's prime minister was at the White House to discuss a possible Hormuz deal. 🤝 Brent has been falling from above $112 at the start of the month, and it lost 16.4% the week before. 📉 Cheaper oil eases inflation worries, which helps explain the rally. 💡
**🥇 Other Markets Reacted Too**
Gold gained about 1.9% to near $4,140 as the dollar softened. 🪙 Chip stocks rebounded broadly, even though Nvidia itself fell. 💚 The bounce also came after a rough week: the S&P 500's previous week was its worst since April 2025. 😬
**⚠️ But Peace Is Not Confirmed**
Reports about the Iran deal were disputed, and U.S. Secretary of State Marco Rubio called some Iranian demands "outrageous and ridiculous." 🚧 Without a signed agreement, any breakdown in talks could reverse sentiment quickly. ⚡ Oil prices have also been swinging on unconfirmed headlines, which makes the move fragile. 🎢
**🔄 Tuesday Brought a Reality Check**
Asian markets did extend the recovery on Tuesday, but U.S. stocks pulled back. 📉 The S&P 500 fell, dragged down by an Nvidia sell-off and rate-hike fears after hot inflation data, and the Nasdaq closed 0.74% lower at 25,065.87. 🌡️ That shows the rally depended on oil and positioning, while rates and inflation are still a major risk. 🏦 December rate-hike pricing was near 80% after last Friday's strong jobs report. 🎯
**🪙 What It Means for Crypto**
Bitcoin sat out Monday's rally, which suggests crypto is not simply following stocks right now. 🤔 Still, oil, inflation and Fed expectations affect liquidity, and altcoins like $BNB can swing sharply when risk sentiment changes. 🌊 If peace talks hold and oil keeps falling, risk appetite could improve. 🌤️ If talks fail or inflation stays hot, volatility could return. ⛈️
**🔍 What to Watch Next**
- 🕊️ Confirmation or collapse of US-Iran talks and a possible Hormuz deal
- 🛢️ Brent and WTI levels, especially moves below $90
- 📈 Inflation data and Fed commentary ahead of December
- 💚 Nvidia's Nov. 17 earnings, which will shape tech sentiment
**✅ Final Takeaway**
Can this recovery become a sustained global bull run? 🐂 It is too early to say. A lasting peace deal, steady oil and cooling inflation would all need to line up. 🧩 Until then, expect sharp swings, keep leverage low and focus on risk management. 🛡️
*This is not financial advice. Always do your own research.* 🙏
**:** #IranTalks 🕊️ #StockMarket 📈 #OilPrices 🛢️ #CryptoMarket 🪙 #BNB 🔶
---#
Sources:
- [CNBC: Stock market news for Nov. 9, 2026](https://www.cnbc.com/2026/11/08/stock-market-today-live-updates.html)
- [CNBC: Tuesday live updates](https://www.cnbc.com/2026/11/09/stock-market-today-live-updates.html)
- [The Weekend Spread: The Close, Nov. 9](https://theweekendspread.substack.com/p/the-close-monday-november-9-2026)
- [BabyPips: Market recap, Nov. 9](https://www.babypips.com/news/daily-financial-forex-market-recap-2026-11-09)
- [AP via DTN: US stocks rally](https://www.dtnpf.com/agriculture/web/ag/news/world-policy/article/2026/11/09/us-stocks-rally-recover-last-weeks)
- [Reading the Market, Nov. 9](https://stephenkates.substack.com/p/reading-the-market-november-9-2026)
- [JournalArta: Oil price today](https://journalarta.com/en/2026/11/09/oil-price-today-brent-falls-4-96-to-93-44-on-iran-peace-hopes-as-gold-climbs/)#BitcoinFiveWeeklyLosses #AIChipSlumpNasdaq #BitcoinSpotETFsPost$201MNetOutflowForThirdStraightDay #HotCPIDecemberHikePriced
390

·
--

Article
⚠️ **Anthropic's IPO Backers Read Like an AI Supply-Chain Checklist** 🤖 #TrumpMediaAdds1510BTCInQ3
Anthropic's IPO plans are drawing attention, and not only for the size of the offering. The list of reported backers covers nearly every layer of the AI stack. 📊
**🏭 Who Is Reportedly Investing?**
According to reports, Google, Nvidia, AMD, Broadcom, Micron, Microsoft and TSMC plan to invest a combined $26B through a private placement at the IPO price. 💰 That puts chipmakers, memory suppliers, cloud providers and a leading foundry on the same cap table. 🧩
**🔗 More Than a Bet on Claude**
These companies aren't only backing a product. They are backing a customer. 🛒 As Anthropic grows, it needs more of everything these suppliers sell:
- 🧠 **Chips:** GPUs and custom accelerators to train and run models
- 💾 **Memory:** High-bandwidth memory for AI workloads
- ☁️ **Cloud capacity:** Data center space and compute at scale
- 🏗️ **Manufacturing:** Advanced chip fabrication
For suppliers, equity in Anthropic is partly a way to secure long-term demand for their own products. 🔄
**💵 The Valuation Question**
Anthropic is reportedly targeting an IPO valuation of roughly $1T, or $1.4T on a fully diluted basis. 🚀 That is an enormous number, and it raises the key question for public investors: how much growth is already built into the price? 🤔
**⚖️ Who Gets What?**
- 🏢 **Suppliers** get equity and a stake in a fast-growing customer.
- 🧪 **Anthropic** gets funding to expand its compute and capacity.
- 📈 **Public investors** get to decide how much this relationship is worth.
**⚠️ Risks to Consider**
Circular financing is a real concern. 🔁 When suppliers invest in a customer who then spends that money back with them, demand can look stronger than it is. Investors should also watch spending commitments, competition, and how the market reacts to such a large valuation. 🔍
**🎯 Final Takeaway**
The IPO is a test of how the market values the AI supply chain as a whole, not just one company. Treat reported figures with care until official filings confirm them. 📑
*This is not financial advice. Always do your own research.* 🙏
**:** #AnthropicIPO 🚀 #AIStocks 🤖 #Nvidia 💚 #TechInvesting 📊 #IPONews 🔔
---
#BitcoinSpotETFsPost$201MNetOutflowForThirdStraightDay #AIChipSlumpNasdaq #BitcoinFiveWeeklyLosses #US-IranTalksFuelStrongStockMarketRebound
⚠️ **Anthropic's IPO Backers Read Like an AI Supply-Chain Checklist** 🤖
#TrumpMediaAdds1510BTCInQ3
Anthropic's IPO plans are drawing attention, and not only for the size of the offering. The list of reported backers covers nearly every layer of the AI stack. 📊
**🏭 Who Is Reportedly Investing?**
According to reports, Google, Nvidia, AMD, Broadcom, Micron, Microsoft and TSMC plan to invest a combined $26B through a private placement at the IPO price. 💰 That puts chipmakers, memory suppliers, cloud providers and a leading foundry on the same cap table. 🧩
**🔗 More Than a Bet on Claude**
These companies aren't only backing a product. They are backing a customer. 🛒 As Anthropic grows, it needs more of everything these suppliers sell:
- 🧠 **Chips:** GPUs and custom accelerators to train and run models
- 💾 **Memory:** High-bandwidth memory for AI workloads
- ☁️ **Cloud capacity:** Data center space and compute at scale
- 🏗️ **Manufacturing:** Advanced chip fabrication
For suppliers, equity in Anthropic is partly a way to secure long-term demand for their own products. 🔄
**💵 The Valuation Question**
Anthropic is reportedly targeting an IPO valuation of roughly $1T, or $1.4T on a fully diluted basis. 🚀 That is an enormous number, and it raises the key question for public investors: how much growth is already built into the price? 🤔
**⚖️ Who Gets What?**
- 🏢 **Suppliers** get equity and a stake in a fast-growing customer.
- 🧪 **Anthropic** gets funding to expand its compute and capacity.
- 📈 **Public investors** get to decide how much this relationship is worth.
**⚠️ Risks to Consider**
Circular financing is a real concern. 🔁 When suppliers invest in a customer who then spends that money back with them, demand can look stronger than it is. Investors should also watch spending commitments, competition, and how the market reacts to such a large valuation. 🔍
**🎯 Final Takeaway**
The IPO is a test of how the market values the AI supply chain as a whole, not just one company. Treat reported figures with care until official filings confirm them. 📑
*This is not financial advice. Always do your own research.* 🙏
**:** #AnthropicIPO 🚀 #AIStocks 🤖 #Nvidia 💚 #TechInvesting 📊 #IPONews 🔔
---
#BitcoinSpotETFsPost$201MNetOutflowForThirdStraightDay #AIChipSlumpNasdaq #BitcoinFiveWeeklyLosses #US-IranTalksFuelStrongStockMarketRebound
Anthropic's IPO plans are drawing attention, and not only for the size of the offering. The list of reported backers covers nearly every layer of the AI stack. 📊
**🏭 Who Is Reportedly Investing?**
According to reports, Google, Nvidia, AMD, Broadcom, Micron, Microsoft and TSMC plan to invest a combined $26B through a private placement at the IPO price. 💰 That puts chipmakers, memory suppliers, cloud providers and a leading foundry on the same cap table. 🧩
**🔗 More Than a Bet on Claude**
These companies aren't only backing a product. They are backing a customer. 🛒 As Anthropic grows, it needs more of everything these suppliers sell:
- 🧠 **Chips:** GPUs and custom accelerators to train and run models
- 💾 **Memory:** High-bandwidth memory for AI workloads
- ☁️ **Cloud capacity:** Data center space and compute at scale
- 🏗️ **Manufacturing:** Advanced chip fabrication
For suppliers, equity in Anthropic is partly a way to secure long-term demand for their own products. 🔄
**💵 The Valuation Question**
Anthropic is reportedly targeting an IPO valuation of roughly $1T, or $1.4T on a fully diluted basis. 🚀 That is an enormous number, and it raises the key question for public investors: how much growth is already built into the price? 🤔
**⚖️ Who Gets What?**
- 🏢 **Suppliers** get equity and a stake in a fast-growing customer.
- 🧪 **Anthropic** gets funding to expand its compute and capacity.
- 📈 **Public investors** get to decide how much this relationship is worth.
**⚠️ Risks to Consider**
Circular financing is a real concern. 🔁 When suppliers invest in a customer who then spends that money back with them, demand can look stronger than it is. Investors should also watch spending commitments, competition, and how the market reacts to such a large valuation. 🔍
**🎯 Final Takeaway**
The IPO is a test of how the market values the AI supply chain as a whole, not just one company. Treat reported figures with care until official filings confirm them. 📑
*This is not financial advice. Always do your own research.* 🙏
**:** #AnthropicIPO 🚀 #AIStocks 🤖 #Nvidia 💚 #TechInvesting 📊 #IPONews 🔔
---
#BitcoinSpotETFsPost$201MNetOutflowForThirdStraightDay #AIChipSlumpNasdaq #BitcoinFiveWeeklyLosses #US-IranTalksFuelStrongStockMarketRebound
1
321
Log in to explore more content
Join global crypto users on Binance Square
⚡️ Get latest and useful information about crypto.
💬 Trusted by the world’s largest crypto exchange.
👍 Discover real insights from verified creators.
Email / Phone number
Trending Topics
1
#WhatWillDriveCryptoandStocks’NextRebound?
63,812 views
875 Discussing
2
#BitcoinBreaksBelow200WeekMovingAverage
0 views
2 Discussing
3
#Anthropic’s6xIPODemandSignalsPotentialRecordRaise
20,314 views
414 Discussing
4
#USCryptoETFsLose$1.48BInFiveDays
320 views
11 Discussing
5
#KoreaDigitalAssetBasicActFinalDraftExpectedEarlyJanuary
91 views
7 Discussing
6
#RippleRLUSDMarketCapSurpassesPayPalPYUSD
0 views
0 Discussing
7
#JaneStreetNearlyOctuplesFidelityBitcoinETFHoldings
6,991 views
130 Discussing
8
#HuangExitNvidiaStrategyInFocus
215,819 views
1,780 Discussing
9
#AnthropicRejectsIPODelayValuationinQuestion
839,699 views
5,897 Discussing
10
#FlopLabsTestnetAndAirdropToLaunchNov24
2,057 views
48 Discussing