
#bitcoinfiveweeklylosses
bitcoinfiveweeklylosses
Bitcoin has closed lower for five straight weeks, trading around $75,950 on Nov 9. Last week's AI stock selloff spread to crypto: more than $1B in liquidations over 24 hours, and BTC fell 5.3%. IBIT's ETF outflow streak reached five sessions. Fed funds futures price about an 80% chance of a December hike. US CPI is due Tuesday. Does $75,000 hold? 👇
Hot
Latest


·
--
Article
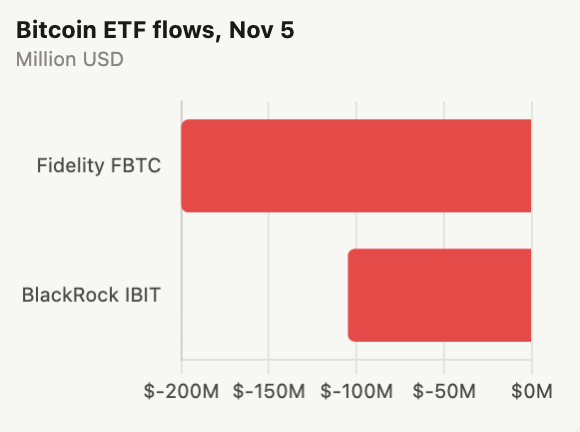
Bitcoin News | Bitcoin Slides for Five Straight Weeks as AI Stock Rout Spills Into CryptoBitcoin has closed lower for five straight weeks, and last week’s sharp selloff in AI stocks added to the pressure. The price now sits between its 50-day moving average at $81,800 and its 200-day average at $73,200, trading around $75,950 on November 8.AI Stock Selloff Spreads to CryptoThe Nasdaq Composite fell about 5.5% on November 5, its worst day since April 2025, on concerns that Democratic control of Congress could slow the AI data center buildout. Chip stocks had their worst session since the March 2020 Covid selloff.The losses hit AI hardware hardest. For the week:Sandisk fell 27.4%Micron dropped 22%The VanEck Semiconductor ETF (SMH) fell 11.2%The Nasdaq lost 3.4% overallThe selling spread to crypto. More than $1 billion in leveraged positions were liquidated over 24 hours, according to CoinGlass. Bitcoin liquidations reached $1.27 billion, about $1.1 billion of it from long positions. Over the same period, bitcoin fell 5.3% and ether 7.3%.Wall Street Cut Risk Across the BoardMorgan Stanley’s derivatives team said leveraged ETFs sold a record $57 billion of US stocks on November 5, the most since data began in 2007. Hedge fund net leverage fell 5 points in a single day, the fifth-largest drop since 2010, and retail selling in the first 90 minutes was the second-largest since 2016.Morgan Stanley also noted that stocks are moving more closely together, a sign that risk-cutting is spreading. Bitcoin has followed the same pattern: it fell with stocks during the selloff but did not join Friday’s rebound in chip stocks.Bitcoin ETFs See OutflowsBitcoin ETFs saw withdrawals as markets fell. On November 5, Fidelity’s FBTC lost about $200 million and BlackRock’s IBIT lost $105 million, extending IBIT’s outflow streak to five sessions, according to Farside Investors.Rate Hike Bets Add PressureA strong US jobs report added to the strain. The US added 165,000 jobs in October, far above the 65,000 forecast, and unemployment fell to 4.1%. Fed funds futures now price about an 80% chance of a December rate hike, according to LSEG. Higher rates tend to weigh on riskier assets such as tech stocks and crypto.US October CPI data, due Tuesday at 13:30 UTC, is the next test.Funding Rates Turn NeutralDerivatives data shows the selling has calmed. BTC funding rates are in the neutral range at 0.0081% to 0.0087%, according to CoinGlass, and ETH funding has also risen into neutral territory.On-chain data still shows heavy short positioning. Analyst KillaXBT noted that long-to-short ratios are at extremes that have coincided with past market bottoms.Key Levels: $90,000 Upside, $72,000 DownsideLevelWhat it is~$90,000Upside target if support holds, some analysts say~$82,000Trapped long positions that could cap a rebound$81,80050-day moving average$75,000–77,000This week’s key range$73,200200-day moving average$72,000–73,000Downside target if $75,000 breaksA rebound could be helped by oversold signals and buy orders below the price, while a break under $75,000 would open the way to the 200-day average.
Bitcoin News | Bitcoin Slides for Five Straight Weeks as AI Stock Rout Spills Into Crypto
Bitcoin has closed lower for five straight weeks, and last week’s sharp selloff in AI stocks added to the pressure. The price now sits between its 50-day moving average at $81,800 and its 200-day average at $73,200, trading around $75,950 on November 8.AI Stock Selloff Spreads to CryptoThe Nasdaq Composite fell about 5.5% on November 5, its worst day since April 2025, on concerns that Democratic control of Congress could slow the AI data center buildout. Chip stocks had their worst session since the March 2020 Covid selloff.The losses hit AI hardware hardest. For the week:Sandisk fell 27.4%Micron dropped 22%The VanEck Semiconductor ETF (SMH) fell 11.2%The Nasdaq lost 3.4% overallThe selling spread to crypto. More than $1 billion in leveraged positions were liquidated over 24 hours, according to CoinGlass. Bitcoin liquidations reached $1.27 billion, about $1.1 billion of it from long positions. Over the same period, bitcoin fell 5.3% and ether 7.3%.Wall Street Cut Risk Across the BoardMorgan Stanley’s derivatives team said leveraged ETFs sold a record $57 billion of US stocks on November 5, the most since data began in 2007. Hedge fund net leverage fell 5 points in a single day, the fifth-largest drop since 2010, and retail selling in the first 90 minutes was the second-largest since 2016.Morgan Stanley also noted that stocks are moving more closely together, a sign that risk-cutting is spreading. Bitcoin has followed the same pattern: it fell with stocks during the selloff but did not join Friday’s rebound in chip stocks.Bitcoin ETFs See OutflowsBitcoin ETFs saw withdrawals as markets fell. On November 5, Fidelity’s FBTC lost about $200 million and BlackRock’s IBIT lost $105 million, extending IBIT’s outflow streak to five sessions, according to Farside Investors.Rate Hike Bets Add PressureA strong US jobs report added to the strain. The US added 165,000 jobs in October, far above the 65,000 forecast, and unemployment fell to 4.1%. Fed funds futures now price about an 80% chance of a December rate hike, according to LSEG. Higher rates tend to weigh on riskier assets such as tech stocks and crypto.US October CPI data, due Tuesday at 13:30 UTC, is the next test.Funding Rates Turn NeutralDerivatives data shows the selling has calmed. BTC funding rates are in the neutral range at 0.0081% to 0.0087%, according to CoinGlass, and ETH funding has also risen into neutral territory.On-chain data still shows heavy short positioning. Analyst KillaXBT noted that long-to-short ratios are at extremes that have coincided with past market bottoms.Key Levels: $90,000 Upside, $72,000 DownsideLevelWhat it is~$90,000Upside target if support holds, some analysts say~$82,000Trapped long positions that could cap a rebound$81,80050-day moving average$75,000–77,000This week’s key range$73,200200-day moving average$72,000–73,000Downside target if $75,000 breaksA rebound could be helped by oversold signals and buy orders below the price, while a break under $75,000 would open the way to the 200-day average.
9
12.4k

🚨 BTC at a Make-or-Break Pivot 🚨
Bitcoin just printed its 5th consecutive weekly red candle, fighting to hold the line at $75,000. If you’ve been in the market long enough, you know this kind of sustained selling pressure is rare—and it usually signals maximum fear.
Take a close look at the technical breakdown.
We are currently testing a critical confluence of support. The $75,000 to $76,000 zone acts as the average cost basis for short-term holders. It is the ultimate line in the sand right now.
📊 The Trader’s Playbook:
🔹 The Bulls: If this $75K support holds strong, we could see an aggressive bounce as late shorters get squeezed. Reclaiming the $82,000 resistance is the first major step to opening a path back toward $87,000.
🔹 The Bears: If we lose this base on high volume, the market could quickly slide. Breaking below the $73,000 to $74,000 zone would leave BTC exposed to a much deeper retracement.
Professional trading isn't about perfectly guessing the bottom; it's about reacting to key levels with strict risk management. Five weeks of bleeding shakes out weak hands, but it’s exactly where smart money starts building strategic, calculated positions.
What’s your move here? Are you buying the fear or waiting for a deeper dip? Let me know below! 👇
$BTC $ETH $SOL
#bitcoinfiveweeklylosses
#BTC #CryptoTrading #BinanceSquare
🚨 BTC at a Make-or-Break Pivot 🚨
Bitcoin just printed its 5th consecutive weekly red candle, fighting to hold the line at $75,000. If you’ve been in the market long enough, you know this kind of sustained selling pressure is rare—and it usually signals maximum fear.
Take a close look at the technical breakdown.
We are currently testing a critical confluence of support. The $75,000 to $76,000 zone acts as the average cost basis for short-term holders. It is the ultimate line in the sand right now.
📊 The Trader’s Playbook:
🔹 The Bulls: If this $75K support holds strong, we could see an aggressive bounce as late shorters get squeezed. Reclaiming the $82,000 resistance is the first major step to opening a path back toward $87,000.
🔹 The Bears: If we lose this base on high volume, the market could quickly slide. Breaking below the $73,000 to $74,000 zone would leave BTC exposed to a much deeper retracement.
Professional trading isn't about perfectly guessing the bottom; it's about reacting to key levels with strict risk management. Five weeks of bleeding shakes out weak hands, but it’s exactly where smart money starts building strategic, calculated positions.
What’s your move here? Are you buying the fear or waiting for a deeper dip? Let me know below! 👇
$BTC $ETH $SOL
#bitcoinfiveweeklylosses
#BTC #CryptoTrading #BinanceSquare
Bitcoin just printed its 5th consecutive weekly red candle, fighting to hold the line at $75,000. If you’ve been in the market long enough, you know this kind of sustained selling pressure is rare—and it usually signals maximum fear.
Take a close look at the technical breakdown.
We are currently testing a critical confluence of support. The $75,000 to $76,000 zone acts as the average cost basis for short-term holders. It is the ultimate line in the sand right now.
📊 The Trader’s Playbook:
🔹 The Bulls: If this $75K support holds strong, we could see an aggressive bounce as late shorters get squeezed. Reclaiming the $82,000 resistance is the first major step to opening a path back toward $87,000.
🔹 The Bears: If we lose this base on high volume, the market could quickly slide. Breaking below the $73,000 to $74,000 zone would leave BTC exposed to a much deeper retracement.
Professional trading isn't about perfectly guessing the bottom; it's about reacting to key levels with strict risk management. Five weeks of bleeding shakes out weak hands, but it’s exactly where smart money starts building strategic, calculated positions.
What’s your move here? Are you buying the fear or waiting for a deeper dip? Let me know below! 👇
$BTC $ETH $SOL
#bitcoinfiveweeklylosses
#BTC #CryptoTrading #BinanceSquare

2
3.5k

·
--
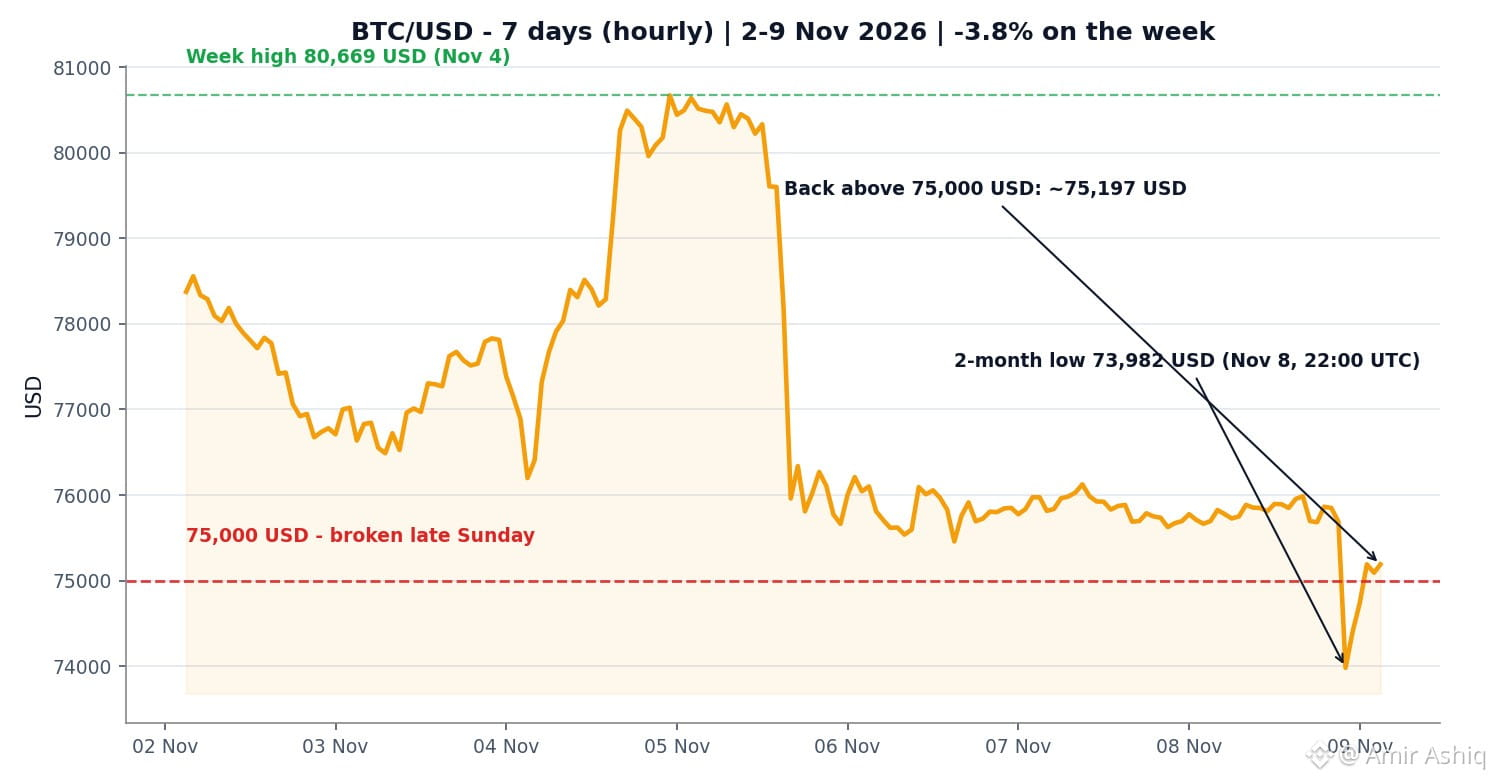
🚨 $BTC JUST BROKE BELOW 75,000 USD — BUT THE BOUNCE BACK SAYS MORE THAN THE DIP
Bitcoin slipped to 73,982 USD late on Sunday — its lowest in more than two months — then clawed back above 75,000 USD by morning.
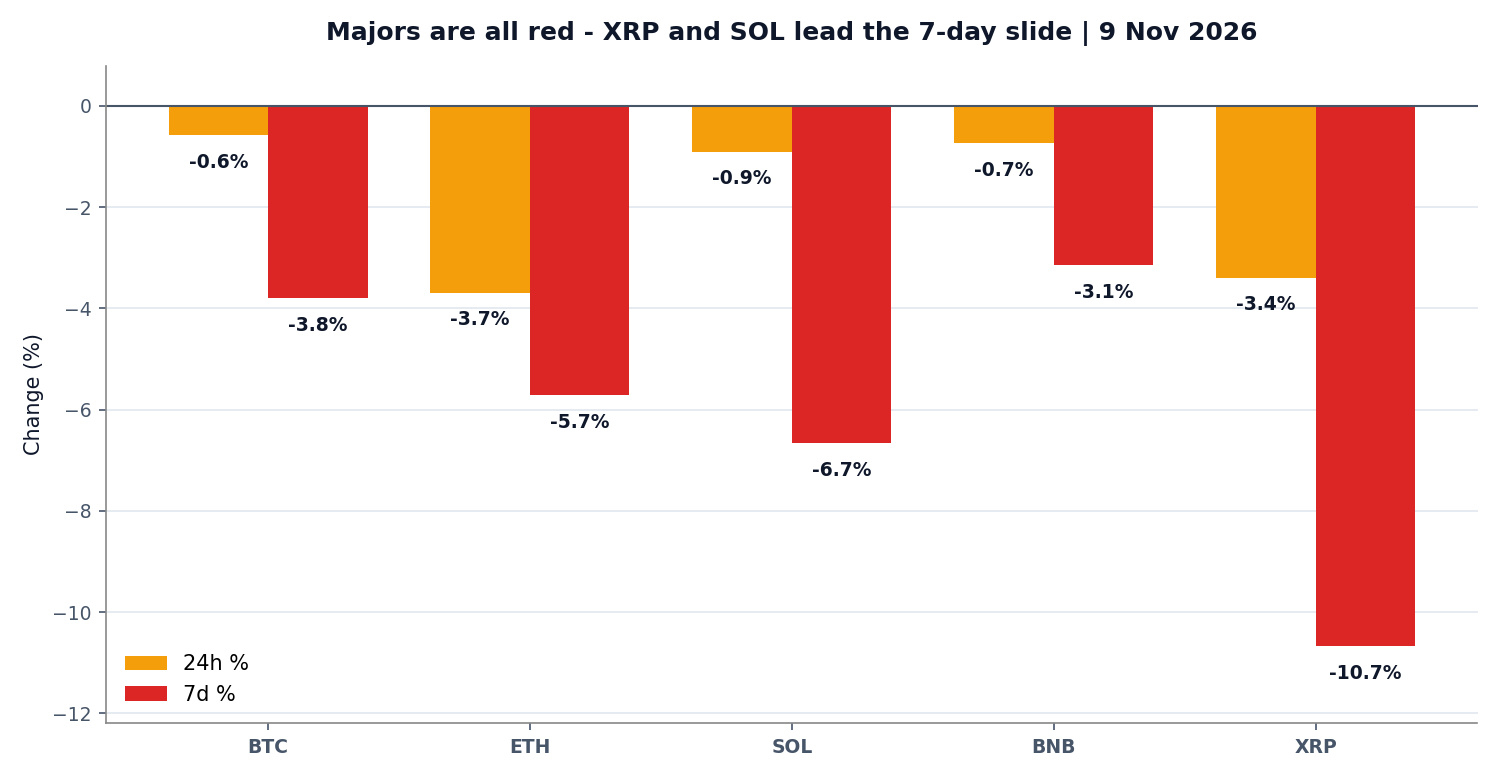
$ETH fell harder, down 3.7% in 24 hours to 2,147 USD, and $XRP slid 3.4% to 1.12 USD. The market is now nursing a fifth straight weekly loss.
Here's what the data shows:
📉 About 856 million USD liquidated in 24 hours, mostly longs — forced selling, not a quiet drift
📊 Fear & Greed at 29 (Fear) — five straight weeks in the red for $BTC
💧 US spot $BTC ETFs are now 914 million USD negative for 2026 after a 1.28 billion USD outflow week
Thin weekend liquidity makes moves bigger in both directions — a watched level breaks fast, and bounces back just as fast.
CPI lands Tuesday at 8:30 ET, the last big inflation read before the December Fed meeting. Volatility usually stays elevated around prints like that.
Did the overnight dip shake you out, or did you hold through it? 👇
Not financial advice — educational purposes only.
#BitcoinFiveWeeklyLosses #Bitcoin #Ethereum #crypto
🚨 $BTC JUST BROKE BELOW 75,000 USD — BUT THE BOUNCE BACK SAYS MORE THAN THE DIP
Bitcoin slipped to 73,982 USD late on Sunday — its lowest in more than two months — then clawed back above 75,000 USD by morning.
$ETH fell harder, down 3.7% in 24 hours to 2,147 USD, and $XRP slid 3.4% to 1.12 USD. The market is now nursing a fifth straight weekly loss.
Here's what the data shows:
📉 About 856 million USD liquidated in 24 hours, mostly longs — forced selling, not a quiet drift
📊 Fear & Greed at 29 (Fear) — five straight weeks in the red for $BTC
💧 US spot $BTC ETFs are now 914 million USD negative for 2026 after a 1.28 billion USD outflow week
Thin weekend liquidity makes moves bigger in both directions — a watched level breaks fast, and bounces back just as fast.
CPI lands Tuesday at 8:30 ET, the last big inflation read before the December Fed meeting. Volatility usually stays elevated around prints like that.
Did the overnight dip shake you out, or did you hold through it? 👇
Not financial advice — educational purposes only.
#BitcoinFiveWeeklyLosses #Bitcoin #Ethereum #crypto
Bitcoin slipped to 73,982 USD late on Sunday — its lowest in more than two months — then clawed back above 75,000 USD by morning.
$ETH fell harder, down 3.7% in 24 hours to 2,147 USD, and $XRP slid 3.4% to 1.12 USD. The market is now nursing a fifth straight weekly loss.
Here's what the data shows:
📉 About 856 million USD liquidated in 24 hours, mostly longs — forced selling, not a quiet drift
📊 Fear & Greed at 29 (Fear) — five straight weeks in the red for $BTC
💧 US spot $BTC ETFs are now 914 million USD negative for 2026 after a 1.28 billion USD outflow week
Thin weekend liquidity makes moves bigger in both directions — a watched level breaks fast, and bounces back just as fast.
CPI lands Tuesday at 8:30 ET, the last big inflation read before the December Fed meeting. Volatility usually stays elevated around prints like that.
Did the overnight dip shake you out, or did you hold through it? 👇
Not financial advice — educational purposes only.
#BitcoinFiveWeeklyLosses #Bitcoin #Ethereum #crypto
1
568

·
--
#bitcoinfiveweeklylosses
🚨 Five red weeks. But is Bitcoin running out of sellers—or running out of buyers?
$BTC has closed lower for five consecutive weeks, slipping about 13.5% from its Oct. 4 weekly close. The latest selloff pushed it to $73,708 on Nov. 8, its lowest since August, per Reuters.
The bigger warning is capital flow: U.S. spot Bitcoin ETFs shed roughly $1.28B during Nov. 2–6, their worst week since late June. That is evidence of weaker ETF demand—not proof that every institutional holder is exiting.
Macro pressure is adding to the strain: a stronger-than-expected jobs report has lifted rate-hike concerns, while US midterm uncertainty and the recent AI-led risk-off move have weighed on crypto.
Here’s the twist: five losing weeks are rare, but history alone does not call a bottom. Watch whether ETF flows stabilize and BTC can reclaim $75K–$78K; a sustained break below the recent $73.7K low would keep downside risk alive.
Capitulation—or just another pause before lower?
Not financial advice.
#Bitcoin #BitcoinETF #CryptoMarket
{future}(BTCUSDT)
#bitcoinfiveweeklylosses
🚨 Five red weeks. But is Bitcoin running out of sellers—or running out of buyers?
$BTC has closed lower for five consecutive weeks, slipping about 13.5% from its Oct. 4 weekly close. The latest selloff pushed it to $73,708 on Nov. 8, its lowest since August, per Reuters.
The bigger warning is capital flow: U.S. spot Bitcoin ETFs shed roughly $1.28B during Nov. 2–6, their worst week since late June. That is evidence of weaker ETF demand—not proof that every institutional holder is exiting.
Macro pressure is adding to the strain: a stronger-than-expected jobs report has lifted rate-hike concerns, while US midterm uncertainty and the recent AI-led risk-off move have weighed on crypto.
Here’s the twist: five losing weeks are rare, but history alone does not call a bottom. Watch whether ETF flows stabilize and BTC can reclaim $75K–$78K; a sustained break below the recent $73.7K low would keep downside risk alive.
Capitulation—or just another pause before lower?
Not financial advice.
#Bitcoin #BitcoinETF #CryptoMarket
🚨 Five red weeks. But is Bitcoin running out of sellers—or running out of buyers?
$BTC has closed lower for five consecutive weeks, slipping about 13.5% from its Oct. 4 weekly close. The latest selloff pushed it to $73,708 on Nov. 8, its lowest since August, per Reuters.
The bigger warning is capital flow: U.S. spot Bitcoin ETFs shed roughly $1.28B during Nov. 2–6, their worst week since late June. That is evidence of weaker ETF demand—not proof that every institutional holder is exiting.
Macro pressure is adding to the strain: a stronger-than-expected jobs report has lifted rate-hike concerns, while US midterm uncertainty and the recent AI-led risk-off move have weighed on crypto.
Here’s the twist: five losing weeks are rare, but history alone does not call a bottom. Watch whether ETF flows stabilize and BTC can reclaim $75K–$78K; a sustained break below the recent $73.7K low would keep downside risk alive.
Capitulation—or just another pause before lower?
Not financial advice.
#Bitcoin #BitcoinETF #CryptoMarket

Trader M08:
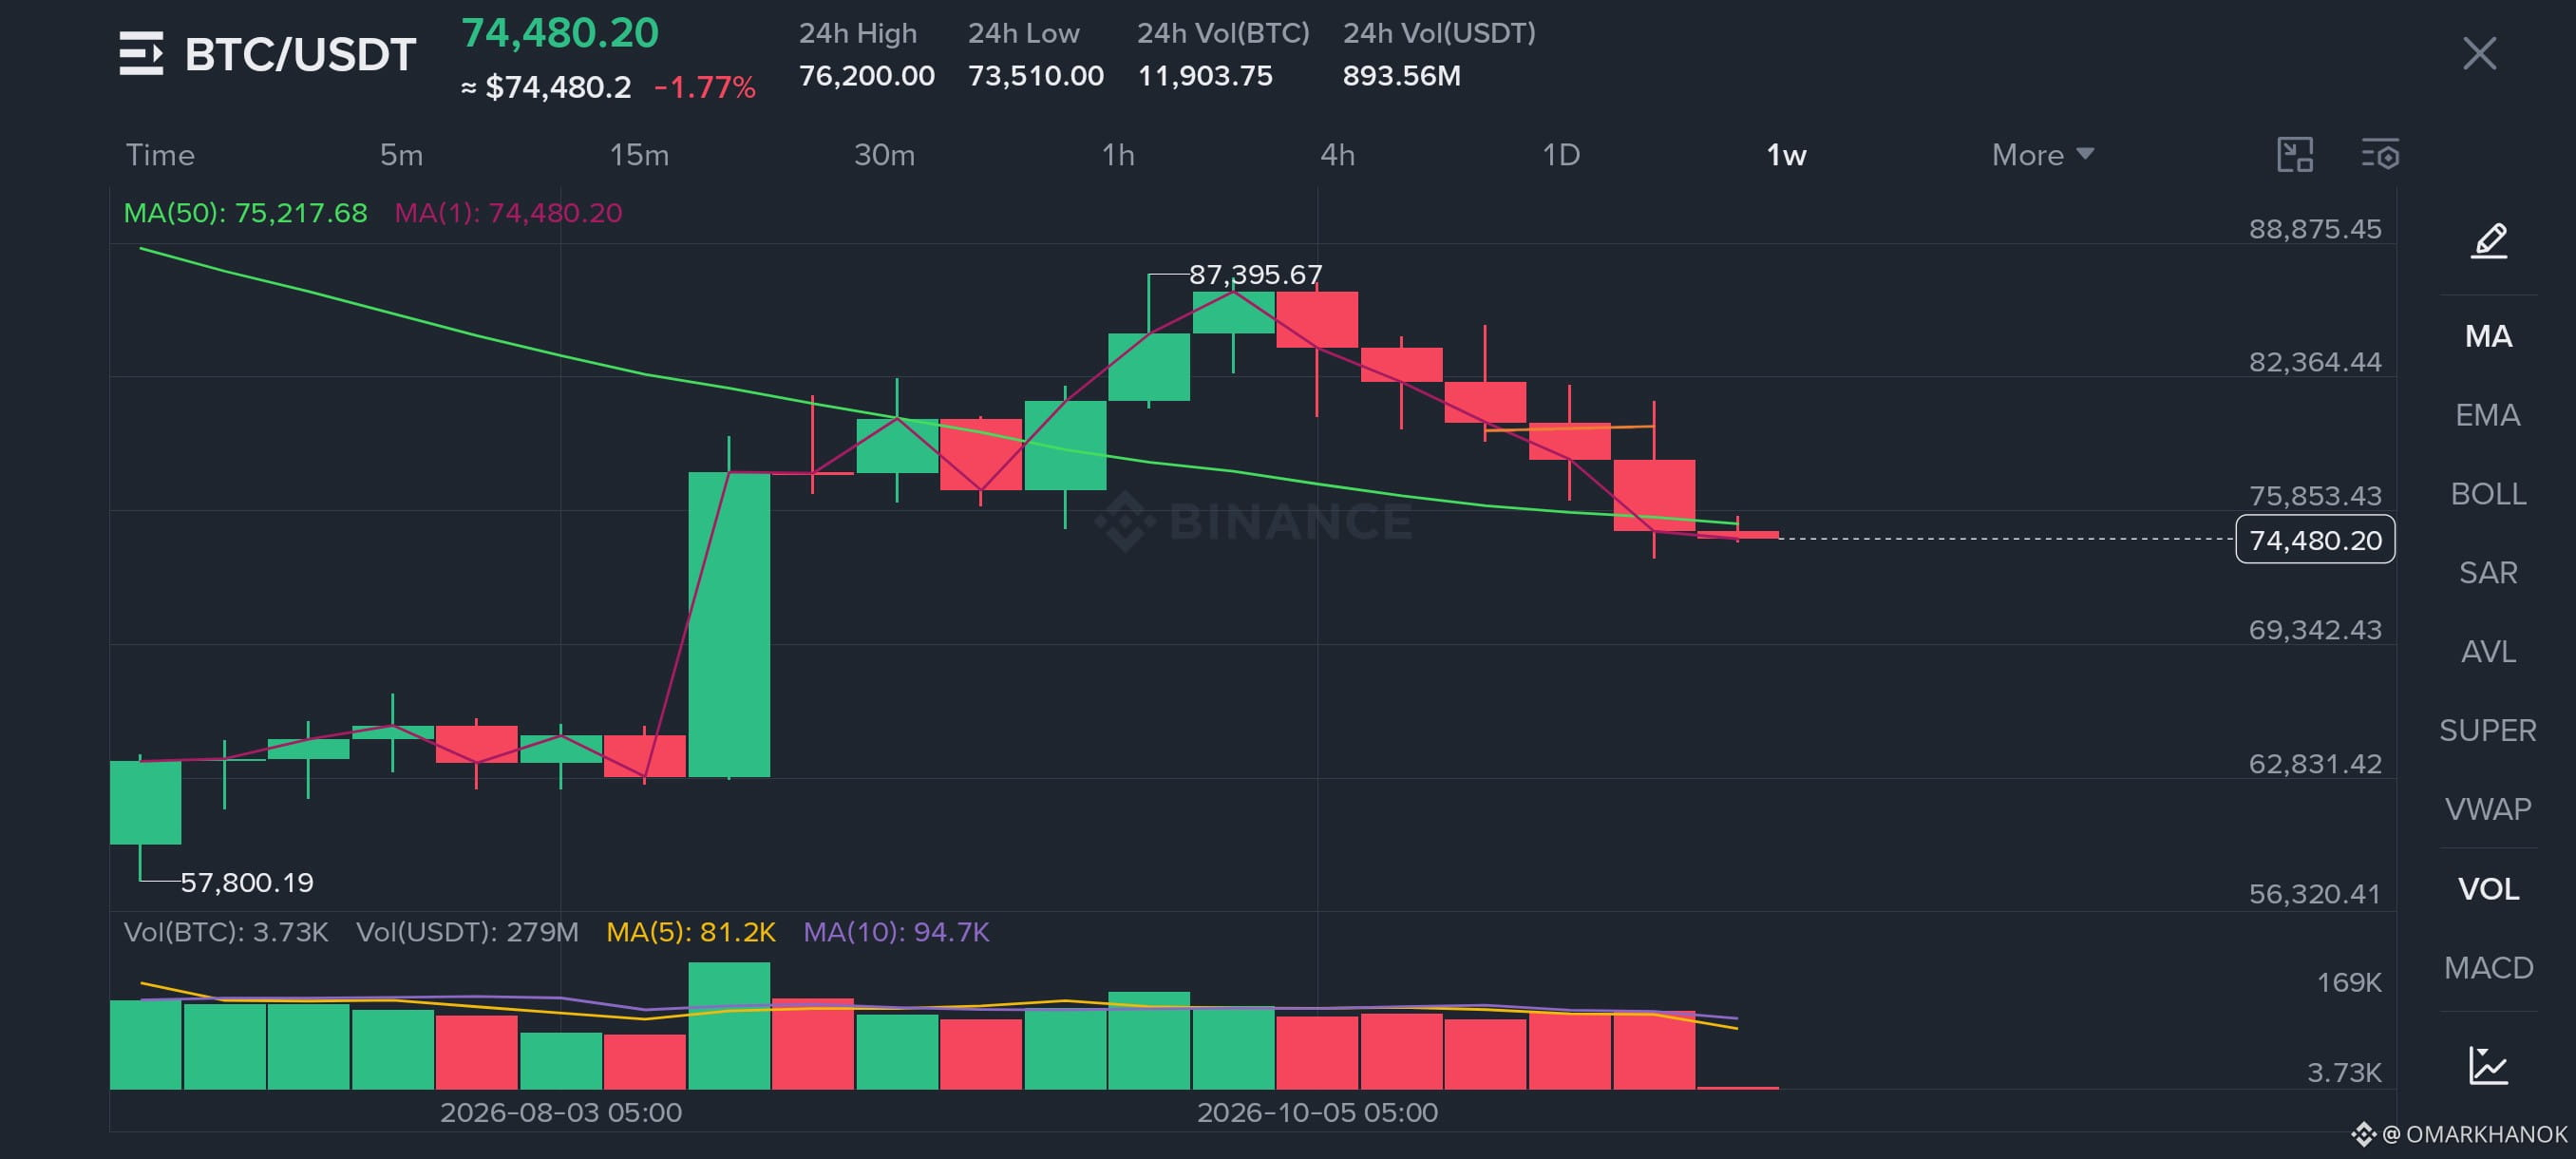
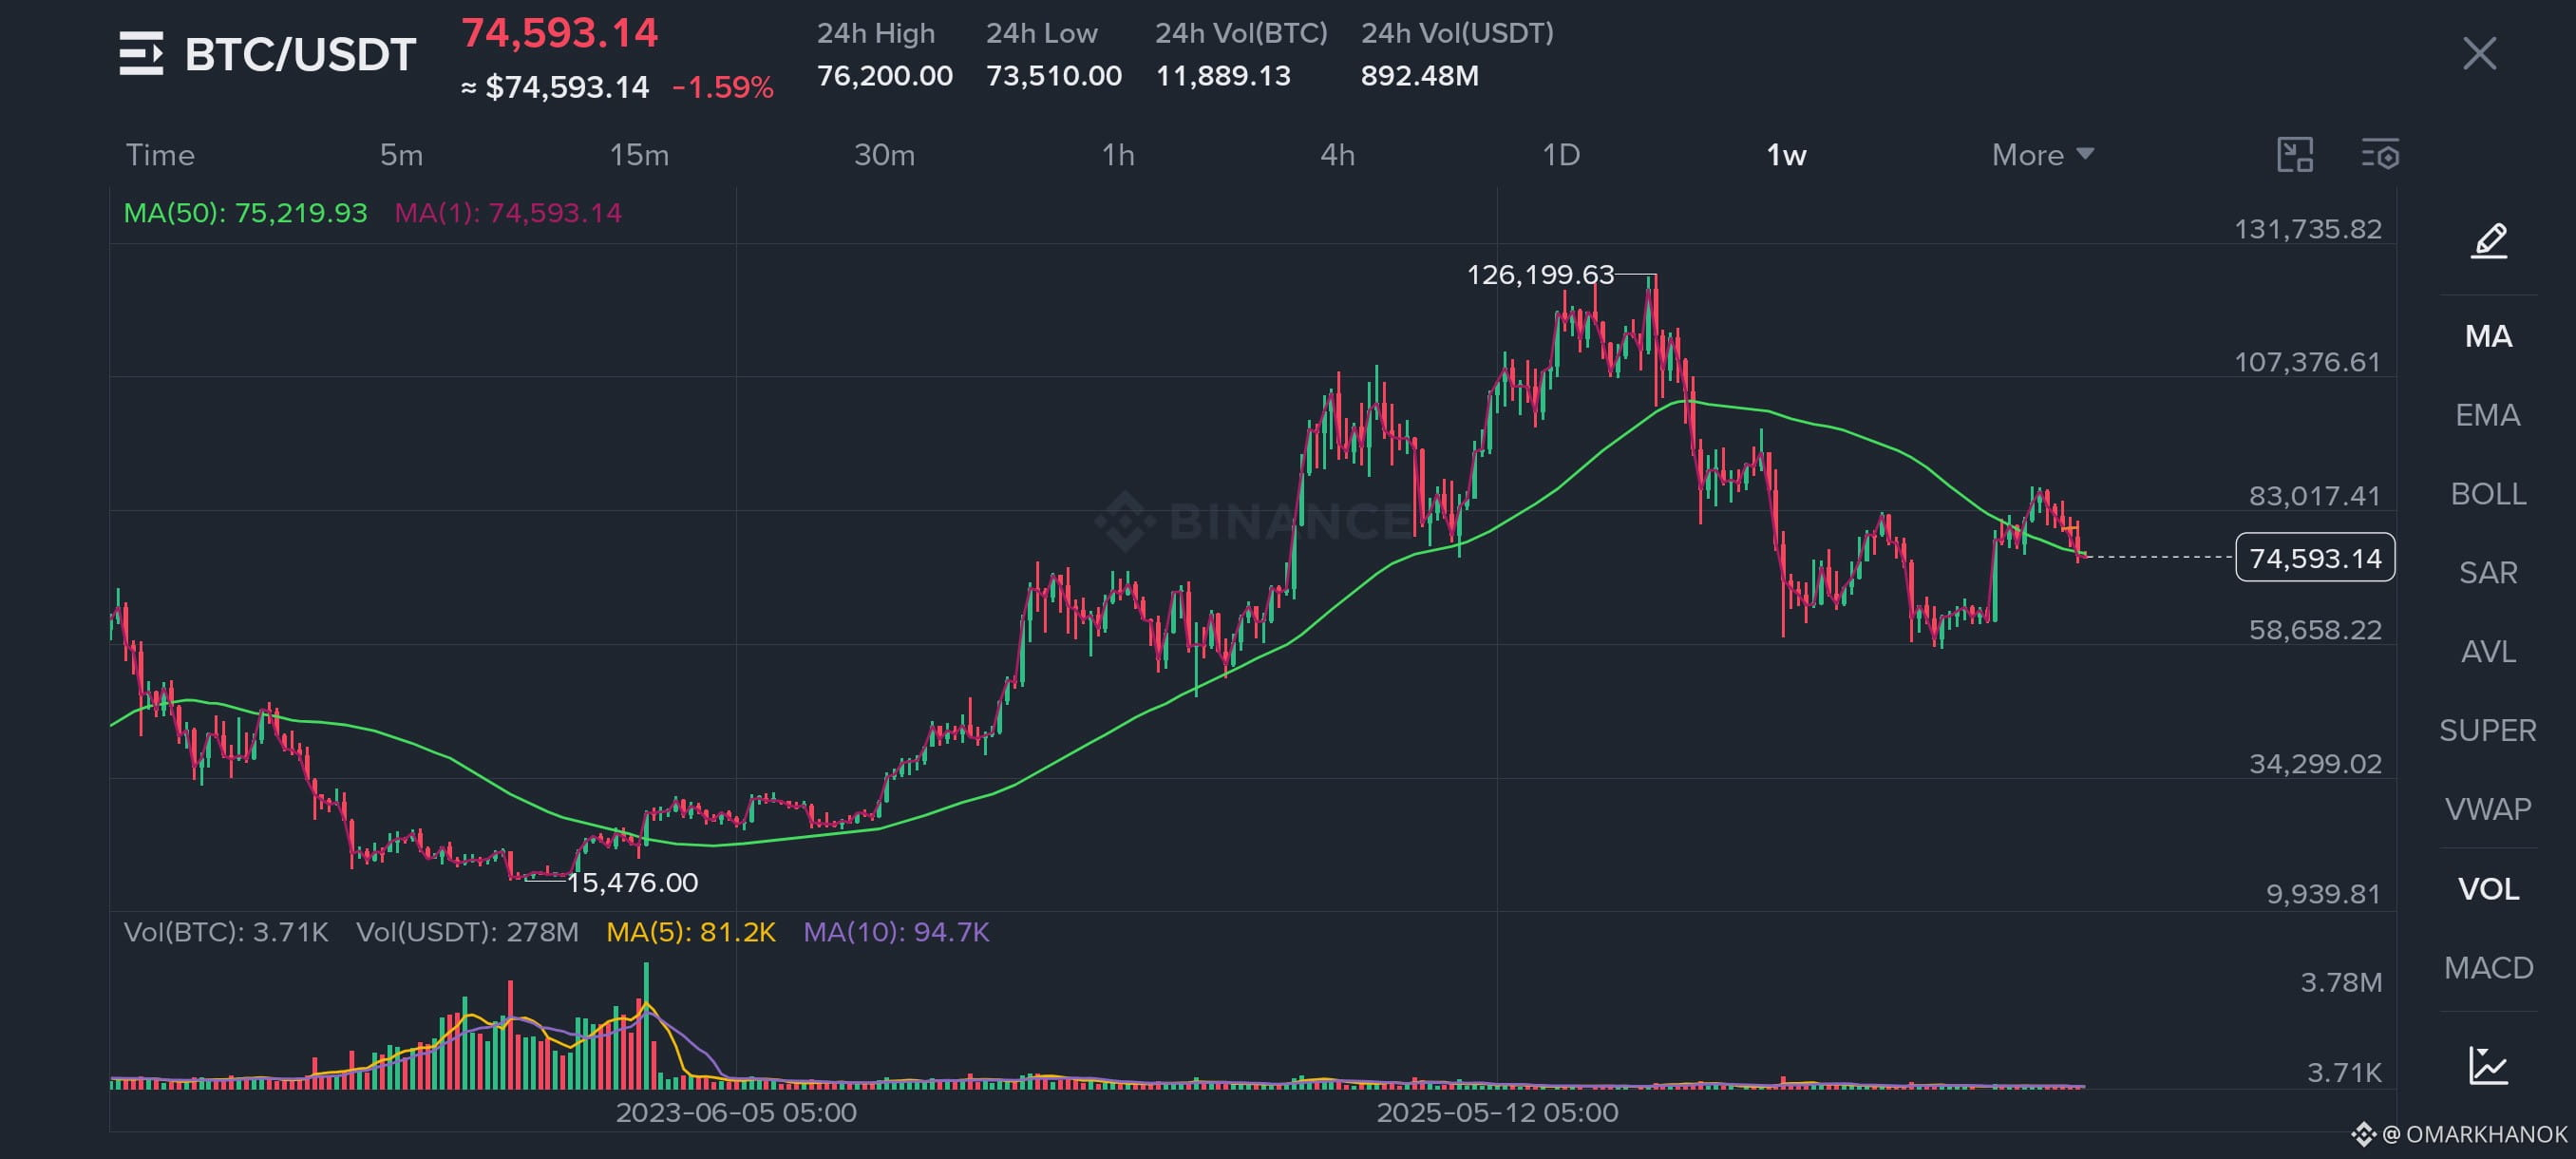
Small data point on that low: Binance spot wicked a bit deeper, to 73,510, and the weekly candle closed at 74,851. This week has held between 74,320 and 75,599 so far, so price is still under the 75K line you flagged. For me a daily close back above 75K matters more than the wick, since that is where your reclaim zone starts.
1
2
2.8k

NEW WEEK: $BTC BIAS (Nov 9, 2026)
#BitcoinFiveWeeklyLosses
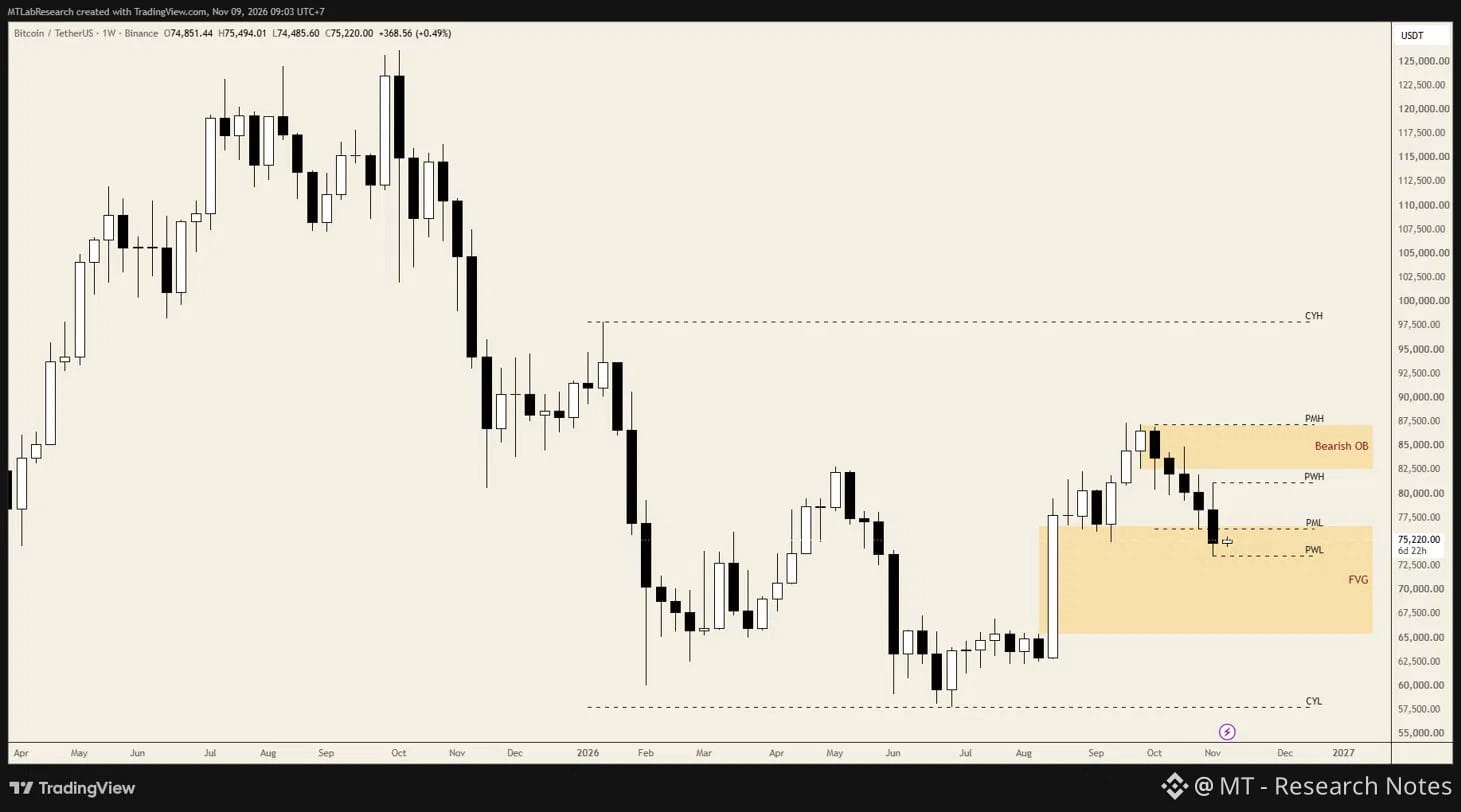
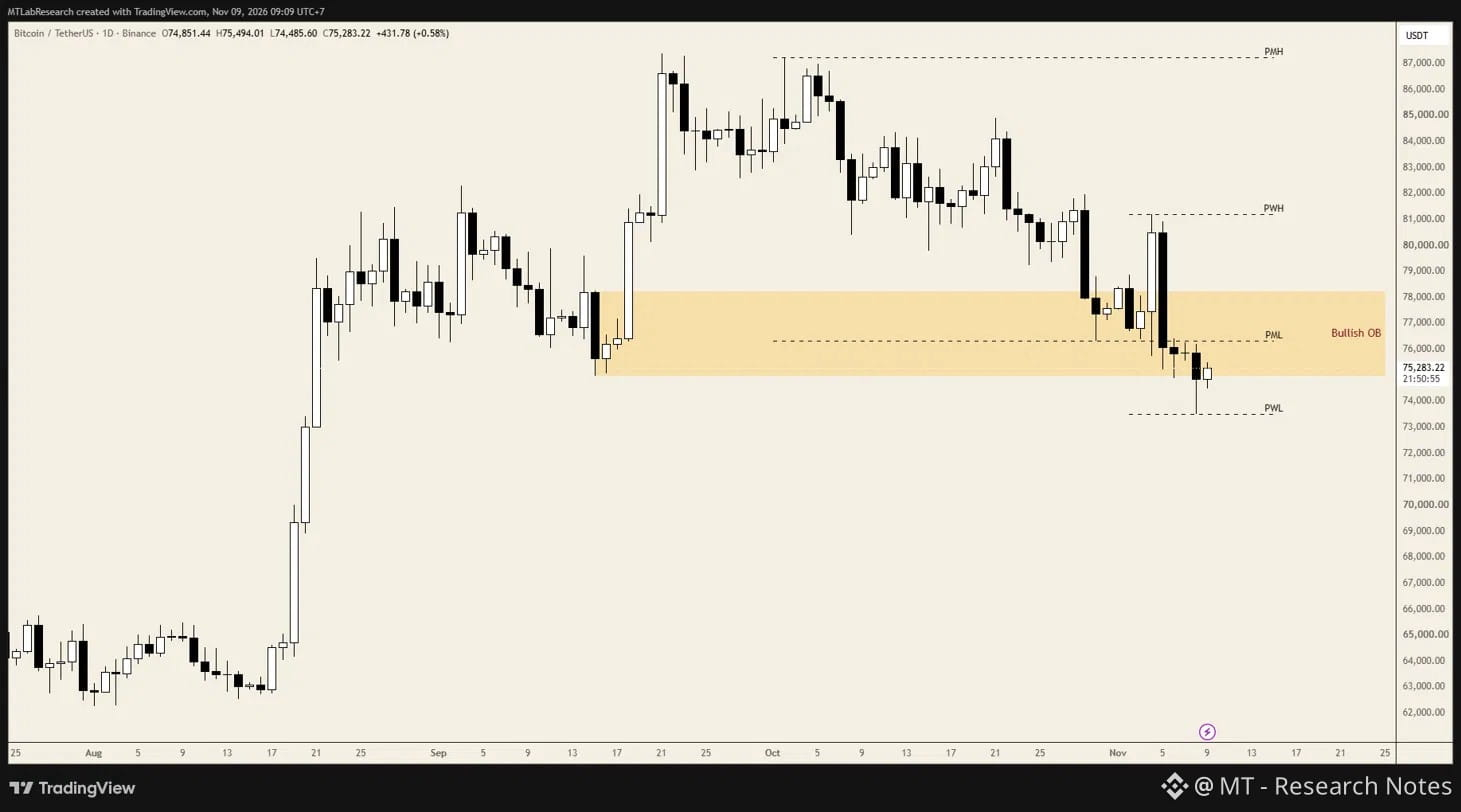
Last week, price fell from 81,100 to 73,500 and the week closed below last month's low. Lower highs and lower lows on the weekly.
Weekly: 5 red candles in a row, each with a lower high and a lower low. Price is reaching the price gap (FVG) left by the big August candle, about 65,400 to 76,500. A break below last week's low likely means a 6th red week. Bulls only get confident again if price takes back last month's high and the zone sellers defended (bearish order block), about 82,500 to 87,200.
Daily: Price is sitting in the zone buyers defended before (bullish order block), about 75,000 to 78,200. If it can't hold inside the zone or start to recover, the next few days can get worse.
Key levels:
- Resistance:
87,200 (PMH, last month's high)
81,100 (PWH, last week's high)
76,300 (PML, last month's low)
- Support:
73,500 (PWL, last week's low)
Experience, not financial advice.
{future}(BTCUSDT)
NEW WEEK: $BTC BIAS (Nov 9, 2026)
#BitcoinFiveWeeklyLosses
Last week, price fell from 81,100 to 73,500 and the week closed below last month's low. Lower highs and lower lows on the weekly.
Weekly: 5 red candles in a row, each with a lower high and a lower low. Price is reaching the price gap (FVG) left by the big August candle, about 65,400 to 76,500. A break below last week's low likely means a 6th red week. Bulls only get confident again if price takes back last month's high and the zone sellers defended (bearish order block), about 82,500 to 87,200.
Daily: Price is sitting in the zone buyers defended before (bullish order block), about 75,000 to 78,200. If it can't hold inside the zone or start to recover, the next few days can get worse.
Key levels:
- Resistance:
87,200 (PMH, last month's high)
81,100 (PWH, last week's high)
76,300 (PML, last month's low)
- Support:
73,500 (PWL, last week's low)
Experience, not financial advice.
#BitcoinFiveWeeklyLosses
Last week, price fell from 81,100 to 73,500 and the week closed below last month's low. Lower highs and lower lows on the weekly.
Weekly: 5 red candles in a row, each with a lower high and a lower low. Price is reaching the price gap (FVG) left by the big August candle, about 65,400 to 76,500. A break below last week's low likely means a 6th red week. Bulls only get confident again if price takes back last month's high and the zone sellers defended (bearish order block), about 82,500 to 87,200.
Daily: Price is sitting in the zone buyers defended before (bullish order block), about 75,000 to 78,200. If it can't hold inside the zone or start to recover, the next few days can get worse.
Key levels:
- Resistance:
87,200 (PMH, last month's high)
81,100 (PWH, last week's high)
76,300 (PML, last month's low)
- Support:
73,500 (PWL, last week's low)
Experience, not financial advice.
352

·
--
Bearish
Bitcoin ‼️
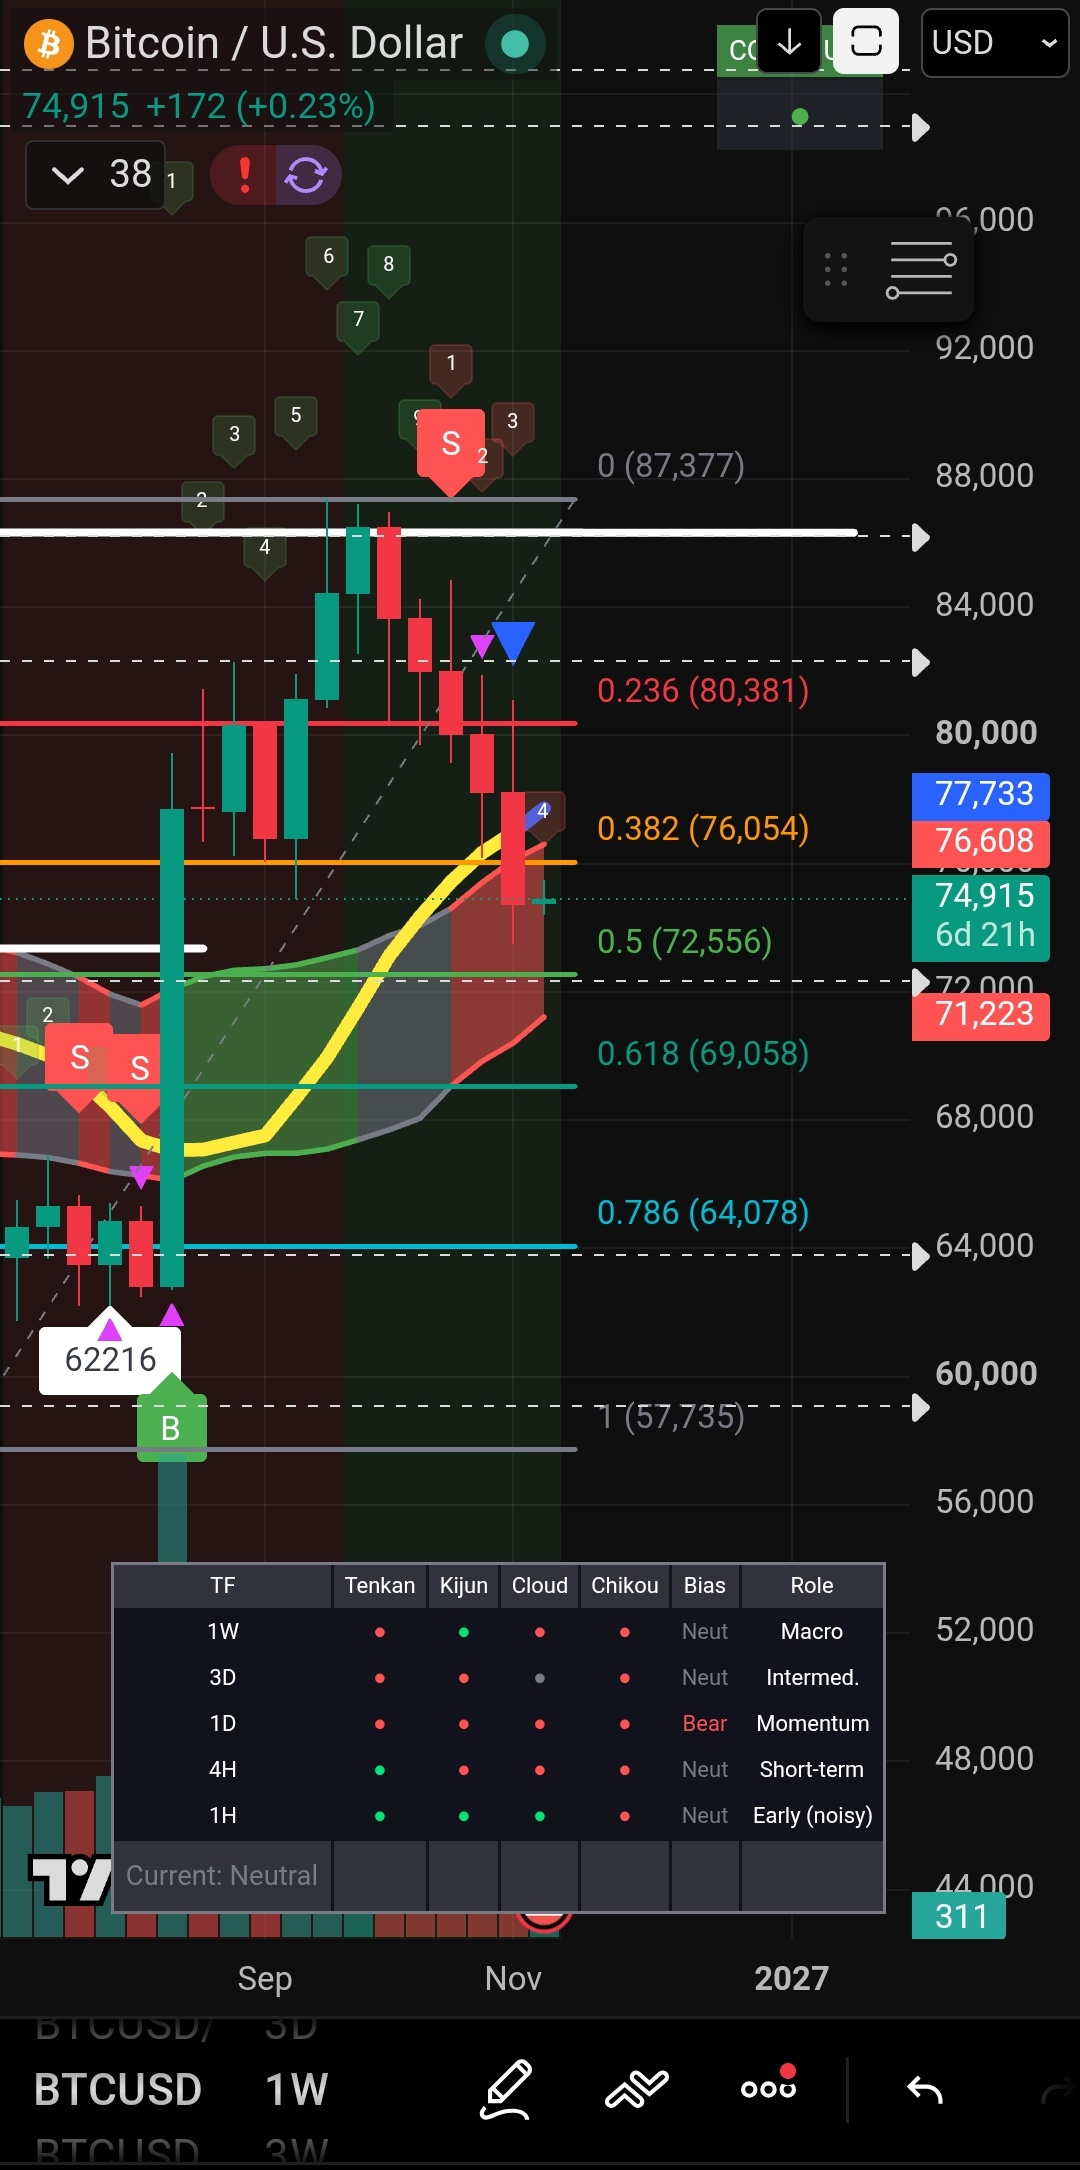
Weekly Close:$74743
Another red candle week. Now 5 consecutive $BTC red candles.
A -4.6% drop further.
$72k(Fib 0.5) inching closer.
Momentum 🔵 now negative.
Bears 🐻 are winning this round.
Still a bull market though.
Trend:
4H-🩸
1D-🩸
3D-🩸
1W-🩸
1M-🟢
#BitcoinFiveWeeklyLosses
Bitcoin ‼️
Weekly Close:$74743
Another red candle week. Now 5 consecutive $BTC red candles.
A -4.6% drop further.
$72k(Fib 0.5) inching closer.
Momentum 🔵 now negative.
Bears 🐻 are winning this round.
Still a bull market though.
Trend:
4H-🩸
1D-🩸
3D-🩸
1W-🩸
1M-🟢
#BitcoinFiveWeeklyLosses
Weekly Close:$74743
Another red candle week. Now 5 consecutive $BTC red candles.
A -4.6% drop further.
$72k(Fib 0.5) inching closer.
Momentum 🔵 now negative.
Bears 🐻 are winning this round.
Still a bull market though.
Trend:
4H-🩸
1D-🩸
3D-🩸
1W-🩸
1M-🟢
#BitcoinFiveWeeklyLosses
User-6279aa89:
Follow me and I’ll follow you back; let’s grow together on Binance Square. newbies
1
658

#BitcoinFiveWeeklyLosses 🚨 BITCOIN FACES FIFTH CONSECUTIVE WEEKLY LOSS — IS $70K NEXT?
Bitcoin is under serious selling pressure, trading near $76,000, approximately 40% below its October peak.
📉 WHAT'S DRIVING THE DECLINE?
💸 ETF Outflows: $1.28 billion in weekly Bitcoin ETF outflows.
🏦 Fed Rate Fears: Strong U.S. jobs data is increasing expectations of higher interest rates.
🤖 AI Stock Sell-Off: Technology market weakness is spreading into crypto.
⚠️ Massive Liquidations: More than $1 billion in crypto liquidations has intensified selling pressure.
🎯 CRITICAL BTC PRICE LEVELS
PriceSignificance$87,000Recovery target$81K–$82KKey resistance$76,000Immediate support$73,779Major support$70,000Critical downside target
🔥 WHAT HAPPENS NEXT?
Bullish Scenario: Bitcoin reclaims $81K–$82K, potentially opening the door toward $87K.
Bearish Scenario: A confirmed breakdown below $75K could expose BTC to $73K–$70K, with deeper downside risk if selling accelerates.
⚠️ THE BIG QUESTION: Is Bitcoin approaching a major macro bottom, or is another correction waiting ahead?
The next weekly close could be critical for market direction.
💬 What do you expect next?
BTC rebounds toward $87K?
BTC falls toward $70K?
👇 Share your analysis in the comments.
#Bitcoin #BTC #CryptoMarket #BitcoinPrice #CryptoNews #ETFOutflows #FederalReserve #MarketCrash #Binance #CryptoTrading
Not financial advice. Cryptocurrency markets are highly volatile. Manage risk carefully and avoid excessive leverage.
#BitcoinFiveWeeklyLosses 🚨 BITCOIN FACES FIFTH CONSECUTIVE WEEKLY LOSS — IS $70K NEXT?
Bitcoin is under serious selling pressure, trading near $76,000, approximately 40% below its October peak.
📉 WHAT'S DRIVING THE DECLINE?
💸 ETF Outflows: $1.28 billion in weekly Bitcoin ETF outflows.
🏦 Fed Rate Fears: Strong U.S. jobs data is increasing expectations of higher interest rates.
🤖 AI Stock Sell-Off: Technology market weakness is spreading into crypto.
⚠️ Massive Liquidations: More than $1 billion in crypto liquidations has intensified selling pressure.
🎯 CRITICAL BTC PRICE LEVELS
PriceSignificance$87,000Recovery target$81K–$82KKey resistance$76,000Immediate support$73,779Major support$70,000Critical downside target
🔥 WHAT HAPPENS NEXT?
Bullish Scenario: Bitcoin reclaims $81K–$82K, potentially opening the door toward $87K.
Bearish Scenario: A confirmed breakdown below $75K could expose BTC to $73K–$70K, with deeper downside risk if selling accelerates.
⚠️ THE BIG QUESTION: Is Bitcoin approaching a major macro bottom, or is another correction waiting ahead?
The next weekly close could be critical for market direction.
💬 What do you expect next?
BTC rebounds toward $87K?
BTC falls toward $70K?
👇 Share your analysis in the comments.
#Bitcoin #BTC #CryptoMarket #BitcoinPrice #CryptoNews #ETFOutflows #FederalReserve #MarketCrash #Binance #CryptoTrading
Not financial advice. Cryptocurrency markets are highly volatile. Manage risk carefully and avoid excessive leverage.
Bitcoin is under serious selling pressure, trading near $76,000, approximately 40% below its October peak.
📉 WHAT'S DRIVING THE DECLINE?
💸 ETF Outflows: $1.28 billion in weekly Bitcoin ETF outflows.
🏦 Fed Rate Fears: Strong U.S. jobs data is increasing expectations of higher interest rates.
🤖 AI Stock Sell-Off: Technology market weakness is spreading into crypto.
⚠️ Massive Liquidations: More than $1 billion in crypto liquidations has intensified selling pressure.
🎯 CRITICAL BTC PRICE LEVELS
PriceSignificance$87,000Recovery target$81K–$82KKey resistance$76,000Immediate support$73,779Major support$70,000Critical downside target
🔥 WHAT HAPPENS NEXT?
Bullish Scenario: Bitcoin reclaims $81K–$82K, potentially opening the door toward $87K.
Bearish Scenario: A confirmed breakdown below $75K could expose BTC to $73K–$70K, with deeper downside risk if selling accelerates.
⚠️ THE BIG QUESTION: Is Bitcoin approaching a major macro bottom, or is another correction waiting ahead?
The next weekly close could be critical for market direction.
💬 What do you expect next?
BTC rebounds toward $87K?
BTC falls toward $70K?
👇 Share your analysis in the comments.
#Bitcoin #BTC #CryptoMarket #BitcoinPrice #CryptoNews #ETFOutflows #FederalReserve #MarketCrash #Binance #CryptoTrading
Not financial advice. Cryptocurrency markets are highly volatile. Manage risk carefully and avoid excessive leverage.
135

·
--
FIVE WEEKS DOWN.
Bitcoin has now closed lower for five straight weeks, and the AI selloff is adding to the pressure.
ETF outflows, liquidations, and weak sentiment are keeping the market heavy.
Is this the bottom forming, or is more pain still ahead?
Your view — Buy the dip or wait for a clear reversal?
#Bitcoin #BTC #Crypto #MarketNews🚀📊🌌💹✨📈💡🛰️🌍🔥 #BitcoinFiveWeeklyLosses
FIVE WEEKS DOWN.
Bitcoin has now closed lower for five straight weeks, and the AI selloff is adding to the pressure.
ETF outflows, liquidations, and weak sentiment are keeping the market heavy.
Is this the bottom forming, or is more pain still ahead?
Your view — Buy the dip or wait for a clear reversal?
#Bitcoin #BTC #Crypto #MarketNews🚀📊🌌💹✨📈💡🛰️🌍🔥 #BitcoinFiveWeeklyLosses
Bitcoin has now closed lower for five straight weeks, and the AI selloff is adding to the pressure.
ETF outflows, liquidations, and weak sentiment are keeping the market heavy.
Is this the bottom forming, or is more pain still ahead?
Your view — Buy the dip or wait for a clear reversal?
#Bitcoin #BTC #Crypto #MarketNews🚀📊🌌💹✨📈💡🛰️🌍🔥 #BitcoinFiveWeeklyLosses

2
1
264


Article
Bitcoin Faces Five Straight Weeks of Losses!#bitcoinfiveweeklylosses
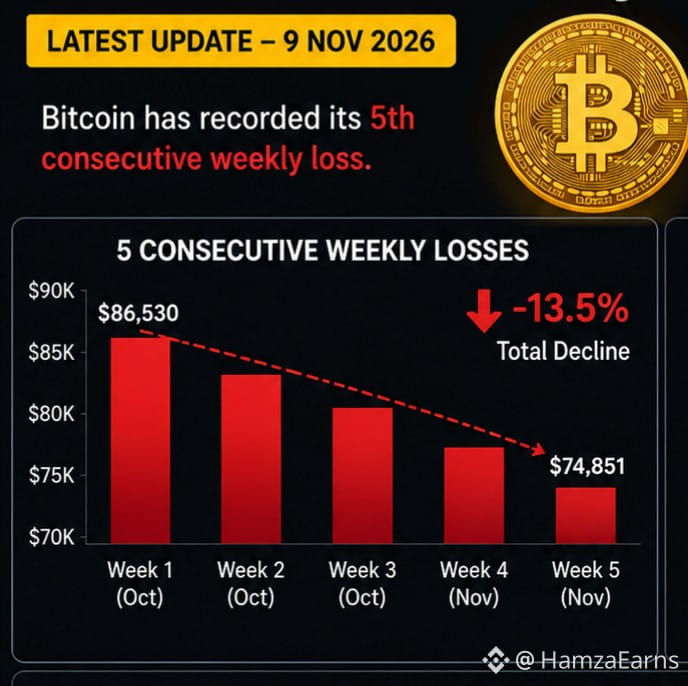
Bitcoin has recorded five weekly losses in a row, showing continued pressure in the crypto market. BTC has fallen from around $86,530 to $74,851, a drop of nearly 13.5% during this period.
This ongoing decline has made investors more careful. Market fear is also growing, and traders are watching Bitcoin closely for signs of recovery.
The big question now is: Can Bitcoin break this losing streak and move back up, or will the market fall further?
Stay alert and follow the market before making any trading decisions.
LONG Setup (Buy)
Entry: $75,100–$75,300Stop Loss: $74,400Target 1: $75,600Target 2: $76,00
SHORT Setup (Sell)
Entry: $74,400–$74,600Stop Loss: $75,200Target 1: $73,500Target 2: $72,800
Important Levels
Resistance: $75,600Support: $74,400Strong Support: $73,500
Note candle : Hour candle
#BTC #CryptoMarket #BİNANCE #BitcoinNews
$BTC
{spot}(BTCUSDT)
Bitcoin Faces Five Straight Weeks of Losses!
#bitcoinfiveweeklylosses
Bitcoin has recorded five weekly losses in a row, showing continued pressure in the crypto market. BTC has fallen from around $86,530 to $74,851, a drop of nearly 13.5% during this period.
This ongoing decline has made investors more careful. Market fear is also growing, and traders are watching Bitcoin closely for signs of recovery.
The big question now is: Can Bitcoin break this losing streak and move back up, or will the market fall further?
Stay alert and follow the market before making any trading decisions.
LONG Setup (Buy)
Entry: $75,100–$75,300Stop Loss: $74,400Target 1: $75,600Target 2: $76,00
SHORT Setup (Sell)
Entry: $74,400–$74,600Stop Loss: $75,200Target 1: $73,500Target 2: $72,800
Important Levels
Resistance: $75,600Support: $74,400Strong Support: $73,500
Note candle : Hour candle
#BTC #CryptoMarket #BİNANCE #BitcoinNews
$BTC
Bitcoin has recorded five weekly losses in a row, showing continued pressure in the crypto market. BTC has fallen from around $86,530 to $74,851, a drop of nearly 13.5% during this period.
This ongoing decline has made investors more careful. Market fear is also growing, and traders are watching Bitcoin closely for signs of recovery.
The big question now is: Can Bitcoin break this losing streak and move back up, or will the market fall further?
Stay alert and follow the market before making any trading decisions.
LONG Setup (Buy)
Entry: $75,100–$75,300Stop Loss: $74,400Target 1: $75,600Target 2: $76,00
SHORT Setup (Sell)
Entry: $74,400–$74,600Stop Loss: $75,200Target 1: $73,500Target 2: $72,800
Important Levels
Resistance: $75,600Support: $74,400Strong Support: $73,500
Note candle : Hour candle
#BTC #CryptoMarket #BİNANCE #BitcoinNews
$BTC
245

·
--
Five red weeks in a row and my feed is still full of 'bottom is in' calls 😅
$BTC is parked around $75K, squeezed between the 50 day average up near $81.8K and the 200 day down at ~$73.2K. Last week's AI stock sell off spilled straight into crypto and honestly nobody escaped that one.
The real test now is Tuesday's US CPI print. That decides where December rate expectations go from here.
So what's your move buying this dip, waiting for CPI, or just sitting on your hands?
#BitcoinFiveWeeklyLosses
Five red weeks in a row and my feed is still full of 'bottom is in' calls 😅
$BTC is parked around $75K, squeezed between the 50 day average up near $81.8K and the 200 day down at ~$73.2K. Last week's AI stock sell off spilled straight into crypto and honestly nobody escaped that one.
The real test now is Tuesday's US CPI print. That decides where December rate expectations go from here.
So what's your move buying this dip, waiting for CPI, or just sitting on your hands?
#BitcoinFiveWeeklyLosses
$BTC is parked around $75K, squeezed between the 50 day average up near $81.8K and the 200 day down at ~$73.2K. Last week's AI stock sell off spilled straight into crypto and honestly nobody escaped that one.
The real test now is Tuesday's US CPI print. That decides where December rate expectations go from here.
So what's your move buying this dip, waiting for CPI, or just sitting on your hands?
#BitcoinFiveWeeklyLosses

2
244
#BitcoinFiveWeeklyLosses 🚨 BITCOIN FACES FIVE CONSECUTIVE WEEKLY LOSSES!
📉 Bitcoin is extending its painful downtrend, approaching the $76,000 level and marking its fifth consecutive weekly loss.
⚠️ BTC is now approximately 40% below its October peak, raising concerns about continued selling pressure, weakening market sentiment, and further downside risk.
🔴 KEY MARKET SIGNALS:
Five consecutive weekly losses.
Price approaching $76,000.
Approximately 40% below its October high.
Bearish momentum remains a major concern.
🔥 IS THIS THE BEGINNING OF A DEEPER BEAR MARKET, OR A POTENTIAL BUYING OPPORTUNITY?
Watch key support levels, market liquidity, and institutional demand. Avoid excessive leverage during high volatility.
💬 What is your prediction for Bitcoin's next move?
#BitcoinFiveWeeklyLosses #Bitcoin #BTC #CryptoMarket #BitcoinCrash #CryptoNews #Binance #BTCAnalysis
Not financial advice. Cryptocurrency markets involve significant risk.
#BitcoinFiveWeeklyLosses 🚨 BITCOIN FACES FIVE CONSECUTIVE WEEKLY LOSSES!
📉 Bitcoin is extending its painful downtrend, approaching the $76,000 level and marking its fifth consecutive weekly loss.
⚠️ BTC is now approximately 40% below its October peak, raising concerns about continued selling pressure, weakening market sentiment, and further downside risk.
🔴 KEY MARKET SIGNALS:
Five consecutive weekly losses.
Price approaching $76,000.
Approximately 40% below its October high.
Bearish momentum remains a major concern.
🔥 IS THIS THE BEGINNING OF A DEEPER BEAR MARKET, OR A POTENTIAL BUYING OPPORTUNITY?
Watch key support levels, market liquidity, and institutional demand. Avoid excessive leverage during high volatility.
💬 What is your prediction for Bitcoin's next move?
#BitcoinFiveWeeklyLosses #Bitcoin #BTC #CryptoMarket #BitcoinCrash #CryptoNews #Binance #BTCAnalysis
Not financial advice. Cryptocurrency markets involve significant risk.
📉 Bitcoin is extending its painful downtrend, approaching the $76,000 level and marking its fifth consecutive weekly loss.
⚠️ BTC is now approximately 40% below its October peak, raising concerns about continued selling pressure, weakening market sentiment, and further downside risk.
🔴 KEY MARKET SIGNALS:
Five consecutive weekly losses.
Price approaching $76,000.
Approximately 40% below its October high.
Bearish momentum remains a major concern.
🔥 IS THIS THE BEGINNING OF A DEEPER BEAR MARKET, OR A POTENTIAL BUYING OPPORTUNITY?
Watch key support levels, market liquidity, and institutional demand. Avoid excessive leverage during high volatility.
💬 What is your prediction for Bitcoin's next move?
#BitcoinFiveWeeklyLosses #Bitcoin #BTC #CryptoMarket #BitcoinCrash #CryptoNews #Binance #BTCAnalysis
Not financial advice. Cryptocurrency markets involve significant risk.
22

·
--
Bullish
#bitcoinfiveweeklylosses
🚨 BITCOIN RECORDS 5 CONSECUTIVE WEEKLY LOSSES — IS THE BOTTOM FINALLY NEAR?
Bitcoin is facing one of its toughest stretches, recording five consecutive weekly losses for the first time in months.
BTC has fallen from around $86,500 in early October to approximately $75,000, putting growing pressure on investor confidence.
But here's what makes this situation interesting:
📉 What's Driving the Pressure?
Around $1.28 billion flowed out of US spot Bitcoin ETFs in one week.
Selling pressure continues to dominate the market.
Investors are becoming more cautious.
BTC is struggling to reclaim important moving averages.
🔥 What Happens Next?
There are two possible scenarios:
🟢 Bullish: Buyers defend the $73K–$75K region, ETF outflows slow down, and Bitcoin starts recovering toward $80K–$82K.
🔴 Bearish: BTC loses the $73K support zone, potentially opening the door to another deeper correction.
History shows that long losing streaks don't guarantee an immediate recovery. The next move depends on buying demand, liquidity, and institutional flows.
Five red weeks don't necessarily mean Bitcoin is finished. Sometimes the biggest opportunities emerge when market confidence is at its weakest.
Are we approaching a major $BTC reversal, or is another crash coming?
#bitcoin #BTC #CryptoMarket
#bitcoinfiveweeklylosses
🚨 BITCOIN RECORDS 5 CONSECUTIVE WEEKLY LOSSES — IS THE BOTTOM FINALLY NEAR?
Bitcoin is facing one of its toughest stretches, recording five consecutive weekly losses for the first time in months.
BTC has fallen from around $86,500 in early October to approximately $75,000, putting growing pressure on investor confidence.
But here's what makes this situation interesting:
📉 What's Driving the Pressure?
Around $1.28 billion flowed out of US spot Bitcoin ETFs in one week.
Selling pressure continues to dominate the market.
Investors are becoming more cautious.
BTC is struggling to reclaim important moving averages.
🔥 What Happens Next?
There are two possible scenarios:
🟢 Bullish: Buyers defend the $73K–$75K region, ETF outflows slow down, and Bitcoin starts recovering toward $80K–$82K.
🔴 Bearish: BTC loses the $73K support zone, potentially opening the door to another deeper correction.
History shows that long losing streaks don't guarantee an immediate recovery. The next move depends on buying demand, liquidity, and institutional flows.
Five red weeks don't necessarily mean Bitcoin is finished. Sometimes the biggest opportunities emerge when market confidence is at its weakest.
Are we approaching a major $BTC reversal, or is another crash coming?
#bitcoin #BTC #CryptoMarket
🚨 BITCOIN RECORDS 5 CONSECUTIVE WEEKLY LOSSES — IS THE BOTTOM FINALLY NEAR?
Bitcoin is facing one of its toughest stretches, recording five consecutive weekly losses for the first time in months.
BTC has fallen from around $86,500 in early October to approximately $75,000, putting growing pressure on investor confidence.
But here's what makes this situation interesting:
📉 What's Driving the Pressure?
Around $1.28 billion flowed out of US spot Bitcoin ETFs in one week.
Selling pressure continues to dominate the market.
Investors are becoming more cautious.
BTC is struggling to reclaim important moving averages.
🔥 What Happens Next?
There are two possible scenarios:
🟢 Bullish: Buyers defend the $73K–$75K region, ETF outflows slow down, and Bitcoin starts recovering toward $80K–$82K.
🔴 Bearish: BTC loses the $73K support zone, potentially opening the door to another deeper correction.
History shows that long losing streaks don't guarantee an immediate recovery. The next move depends on buying demand, liquidity, and institutional flows.
Five red weeks don't necessarily mean Bitcoin is finished. Sometimes the biggest opportunities emerge when market confidence is at its weakest.
Are we approaching a major $BTC reversal, or is another crash coming?
#bitcoin #BTC #CryptoMarket
4

·
--
🚨 BITCOIN JUST CLOSED 5 CONSECUTIVE WEEKS IN THE RED! 🔴
Is Bitcoin losing its strength, or is the market preparing for its next big move? 👀
📉 The Numbers:
• 5 consecutive weekly losses.
• BTC dropped from approximately $86,530 to $74,851.
• Around 13.5% decline from early October.
• Selling pressure and ETF outflows are adding to market uncertainty.
🔥 But here's the big question:
Is this the beginning of a deeper Bitcoin correction, or could this be an opportunity for long-term investors?
📊 I'm watching three things:
1️⃣ Can BTC reclaim the $75K zone?
2️⃣ Will buyers defend the recent lows?
3️⃣ Will ETF inflows return?
💬 YOUR TURN:
What do you think comes next?
🟢 BTC RECOVERS
🔴 BTC DROPS FURTHER
Drop your prediction below! 👇
#BitcoinFiveWeeklyLosses #Bitcoin #BTC☀ #CryptoMarket #BitcoinAnalysis #CryptoTrading #BinanceSquare #BTCUSD #CryptoNews #TradingCommunity
🚨 BITCOIN JUST CLOSED 5 CONSECUTIVE WEEKS IN THE RED! 🔴
Is Bitcoin losing its strength, or is the market preparing for its next big move? 👀
📉 The Numbers:
• 5 consecutive weekly losses.
• BTC dropped from approximately $86,530 to $74,851.
• Around 13.5% decline from early October.
• Selling pressure and ETF outflows are adding to market uncertainty.
🔥 But here's the big question:
Is this the beginning of a deeper Bitcoin correction, or could this be an opportunity for long-term investors?
📊 I'm watching three things:
1️⃣ Can BTC reclaim the $75K zone?
2️⃣ Will buyers defend the recent lows?
3️⃣ Will ETF inflows return?
💬 YOUR TURN:
What do you think comes next?
🟢 BTC RECOVERS
🔴 BTC DROPS FURTHER
Drop your prediction below! 👇
#BitcoinFiveWeeklyLosses #Bitcoin #BTC☀ #CryptoMarket #BitcoinAnalysis #CryptoTrading #BinanceSquare #BTCUSD #CryptoNews #TradingCommunity
Is Bitcoin losing its strength, or is the market preparing for its next big move? 👀
📉 The Numbers:
• 5 consecutive weekly losses.
• BTC dropped from approximately $86,530 to $74,851.
• Around 13.5% decline from early October.
• Selling pressure and ETF outflows are adding to market uncertainty.
🔥 But here's the big question:
Is this the beginning of a deeper Bitcoin correction, or could this be an opportunity for long-term investors?
📊 I'm watching three things:
1️⃣ Can BTC reclaim the $75K zone?
2️⃣ Will buyers defend the recent lows?
3️⃣ Will ETF inflows return?
💬 YOUR TURN:
What do you think comes next?
🟢 BTC RECOVERS
🔴 BTC DROPS FURTHER
Drop your prediction below! 👇
#BitcoinFiveWeeklyLosses #Bitcoin #BTC☀ #CryptoMarket #BitcoinAnalysis #CryptoTrading #BinanceSquare #BTCUSD #CryptoNews #TradingCommunity

108

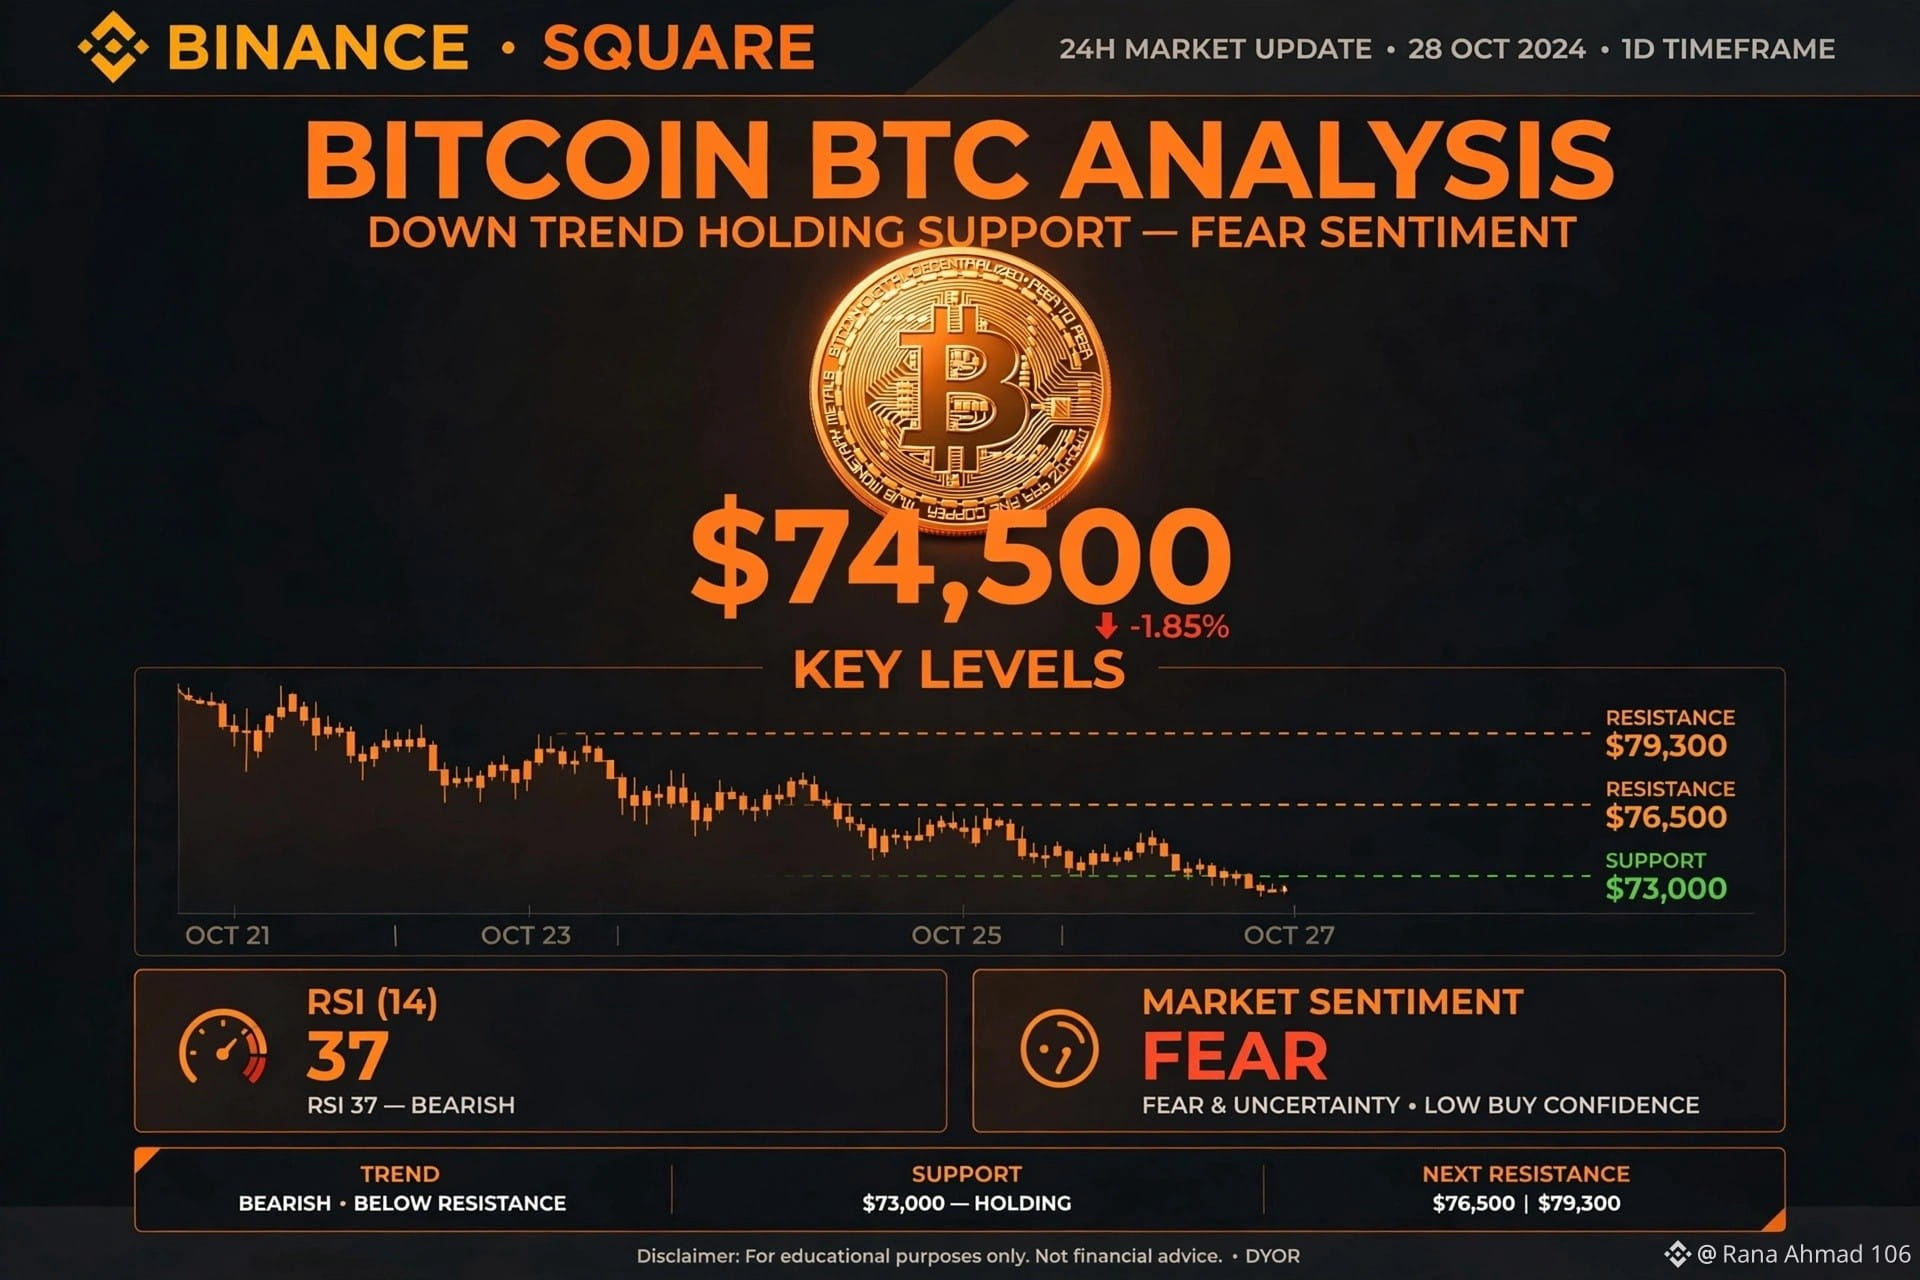
$BTC $74,500 - Defending $73K Support?
*Post:*
Bitcoin (BTC) is trading at $74,500 after 5 weeks of decline.
RSI: 37 - Near Oversold
Fear & Greed: 29 - Fear
Dominance: 60.2%
ETF Outflow: $1.28B this week
My Levels:
Support: $73,000 - $74,000
Resistance: $76,500
Next Resistance: $79,300
Breakdown Target: $70,000
If BTC holds $73K, bounce to $79K is possible.
If it breaks $73K, $70K is next.
Tuesday CPI report will decide the next move.
Are you buying this dip or waiting?
#BTC #Bitcoin #Crypto #Binance #Altcoins #BinanceReopensWithdrawalsForMoreAssets #BitcoinFiveWeeklyLosses
{spot}(BTCUSDT)
$BTC $74,500 - Defending $73K Support?
*Post:*
Bitcoin (BTC) is trading at $74,500 after 5 weeks of decline.
RSI: 37 - Near Oversold
Fear & Greed: 29 - Fear
Dominance: 60.2%
ETF Outflow: $1.28B this week
My Levels:
Support: $73,000 - $74,000
Resistance: $76,500
Next Resistance: $79,300
Breakdown Target: $70,000
If BTC holds $73K, bounce to $79K is possible.
If it breaks $73K, $70K is next.
Tuesday CPI report will decide the next move.
Are you buying this dip or waiting?
#BTC #Bitcoin #Crypto #Binance #Altcoins #BinanceReopensWithdrawalsForMoreAssets #BitcoinFiveWeeklyLosses
*Post:*
Bitcoin (BTC) is trading at $74,500 after 5 weeks of decline.
RSI: 37 - Near Oversold
Fear & Greed: 29 - Fear
Dominance: 60.2%
ETF Outflow: $1.28B this week
My Levels:
Support: $73,000 - $74,000
Resistance: $76,500
Next Resistance: $79,300
Breakdown Target: $70,000
If BTC holds $73K, bounce to $79K is possible.
If it breaks $73K, $70K is next.
Tuesday CPI report will decide the next move.
Are you buying this dip or waiting?
#BTC #Bitcoin #Crypto #Binance #Altcoins #BinanceReopensWithdrawalsForMoreAssets #BitcoinFiveWeeklyLosses
22

·
--
🚨 BITCOIN JUST RECORDED 5 CONSECUTIVE WEEKLY LOSSES — IS THIS THE BIGGEST BUYING OPPORTUNITY OR MORE PAIN AHEAD?
Bitcoin has closed five weeks in a row in the red, with its latest weekly close below $75,000.
But here's what every crypto investor should be watching:
🔥 WHY THE MARKET IS UNDER PRESSURE:
1. Bitcoin has lost momentum after weeks of selling pressure.
2. Spot Bitcoin ETFs recorded approximately $1.28 billion in weekly outflows.
3. Nearly $745 million in crypto liquidations hit the market in just one hour.
4. Investors are watching economic uncertainty and upcoming US inflation data.
📊 KEY BTC LEVELS TO WATCH:
- $73,500 – Immediate support zone
- $75,000 – Critical psychological level
- $76,500 – First recovery resistance
- $78,000 – Important bullish recovery level
MY STRATEGY:
I am watching this correction closely. I don't believe in panic selling, but I also won't buy blindly.
Money management first. Wait for confirmation, buy strong support zones, and always protect your capital with proper risk management.
The big question is: IS THIS A TEMPORARY CORRECTION BEFORE THE NEXT BULLISH MOVE, OR THE START OF A DEEPER BEARISH TREND?
WHAT'S YOUR MOVE RIGHT NOW?
LONG BTC, SHORT $BTC , OR BUY THE DIP?
$BNB $LINK
Share your strategy in the comments. Let's see who is ready for the next big Bitcoin move.
trade accordingly 👇
{future}(BTCUSDT)
{future}(ETHUSDT)
{future}(SOLUSDT)
#Bitcoin #BTC #CryptoMarket #BitcoinFiveWeeklyLosses #BinanceSquareFamily
🚨 BITCOIN JUST RECORDED 5 CONSECUTIVE WEEKLY LOSSES — IS THIS THE BIGGEST BUYING OPPORTUNITY OR MORE PAIN AHEAD?
Bitcoin has closed five weeks in a row in the red, with its latest weekly close below $75,000.
But here's what every crypto investor should be watching:
🔥 WHY THE MARKET IS UNDER PRESSURE:
1. Bitcoin has lost momentum after weeks of selling pressure.
2. Spot Bitcoin ETFs recorded approximately $1.28 billion in weekly outflows.
3. Nearly $745 million in crypto liquidations hit the market in just one hour.
4. Investors are watching economic uncertainty and upcoming US inflation data.
📊 KEY BTC LEVELS TO WATCH:
- $73,500 – Immediate support zone
- $75,000 – Critical psychological level
- $76,500 – First recovery resistance
- $78,000 – Important bullish recovery level
MY STRATEGY:
I am watching this correction closely. I don't believe in panic selling, but I also won't buy blindly.
Money management first. Wait for confirmation, buy strong support zones, and always protect your capital with proper risk management.
The big question is: IS THIS A TEMPORARY CORRECTION BEFORE THE NEXT BULLISH MOVE, OR THE START OF A DEEPER BEARISH TREND?
WHAT'S YOUR MOVE RIGHT NOW?
LONG BTC, SHORT $BTC , OR BUY THE DIP?
$BNB $LINK
Share your strategy in the comments. Let's see who is ready for the next big Bitcoin move.
trade accordingly 👇
#Bitcoin #BTC #CryptoMarket #BitcoinFiveWeeklyLosses #BinanceSquareFamily
Bitcoin has closed five weeks in a row in the red, with its latest weekly close below $75,000.
But here's what every crypto investor should be watching:
🔥 WHY THE MARKET IS UNDER PRESSURE:
1. Bitcoin has lost momentum after weeks of selling pressure.
2. Spot Bitcoin ETFs recorded approximately $1.28 billion in weekly outflows.
3. Nearly $745 million in crypto liquidations hit the market in just one hour.
4. Investors are watching economic uncertainty and upcoming US inflation data.
📊 KEY BTC LEVELS TO WATCH:
- $73,500 – Immediate support zone
- $75,000 – Critical psychological level
- $76,500 – First recovery resistance
- $78,000 – Important bullish recovery level
MY STRATEGY:
I am watching this correction closely. I don't believe in panic selling, but I also won't buy blindly.
Money management first. Wait for confirmation, buy strong support zones, and always protect your capital with proper risk management.
The big question is: IS THIS A TEMPORARY CORRECTION BEFORE THE NEXT BULLISH MOVE, OR THE START OF A DEEPER BEARISH TREND?
WHAT'S YOUR MOVE RIGHT NOW?
LONG BTC, SHORT $BTC , OR BUY THE DIP?
$BNB $LINK
Share your strategy in the comments. Let's see who is ready for the next big Bitcoin move.
trade accordingly 👇
#Bitcoin #BTC #CryptoMarket #BitcoinFiveWeeklyLosses #BinanceSquareFamily
84

#BitcoinFiveWeeklyLosses
Is the bottom in, or are bears taking full control? 📉
Bitcoin has officially closed lower for five straight weeks, hitting a continuous losing streak not seen since earlier this year. Trading around $76,000, BTC is facing immense macroeconomic and industry-specific headwinds.
Here is what is driving the market pullback:
• AI & Tech Stock Spillover: A brutal selloff in tech giants and AI chip stocks dragged the Nasdaq Composite down. This risk-off sentiment immediately bled into digital assets.
• Massive Liquidations: The sudden downside move triggered over $1 billion in total crypto liquidations over a 24-hour window, forcing long positions to close and compounding the selling pressure.
• ETF Outflow Exodus: Institutional momentum slowed down significantly, with spot Bitcoin ETFs shedding hundreds of millions of dollars. Major funds like BlackRock's IBIT marked a five-session outflow streak.
• U.S. Midterm Election Hangover: Initial market optimism quickly faded into regulatory uncertainty as traders evaluate what a Democrat-controlled U.S. Congress will mean for future crypto legislation.
What to watch next:
Traders are closely watching whether Bitcoin can hold the critical $75,000 support level. With crucial U.S. CPI inflation data dropping on Tuesday and the market pricing in high odds of a Federal Reserve interest rate hike in December, volatility is guaranteed to spike.
Are you buying this dip, or waiting for lower targets? 👇
#BitcoinFiveWeeklyLosses #BTC #CryptoMarket #CryptoNews
📊 Market Context Data
Grayscale Bitcoin Mini Trust ETF (BTC)
US$33.50
-10.52% since 2 Oct 2026
Closed: 2:00 am • Disclaimer
After hours: 6:00 am
US$33.54
0.12%
14 Oct26 Oct7 Nov34353637
2 Oct 2026 - 7 Nov 2026
Open 33.36
High 33.59
Low 33.05
52-wk high 47.07
52-wk low25.65
$BTC
$BTTC
#BitcoinFiveWeeklyLosses
Is the bottom in, or are bears taking full control? 📉
Bitcoin has officially closed lower for five straight weeks, hitting a continuous losing streak not seen since earlier this year. Trading around $76,000, BTC is facing immense macroeconomic and industry-specific headwinds.
Here is what is driving the market pullback:
• AI & Tech Stock Spillover: A brutal selloff in tech giants and AI chip stocks dragged the Nasdaq Composite down. This risk-off sentiment immediately bled into digital assets.
• Massive Liquidations: The sudden downside move triggered over $1 billion in total crypto liquidations over a 24-hour window, forcing long positions to close and compounding the selling pressure.
• ETF Outflow Exodus: Institutional momentum slowed down significantly, with spot Bitcoin ETFs shedding hundreds of millions of dollars. Major funds like BlackRock's IBIT marked a five-session outflow streak.
• U.S. Midterm Election Hangover: Initial market optimism quickly faded into regulatory uncertainty as traders evaluate what a Democrat-controlled U.S. Congress will mean for future crypto legislation.
What to watch next:
Traders are closely watching whether Bitcoin can hold the critical $75,000 support level. With crucial U.S. CPI inflation data dropping on Tuesday and the market pricing in high odds of a Federal Reserve interest rate hike in December, volatility is guaranteed to spike.
Are you buying this dip, or waiting for lower targets? 👇
#BitcoinFiveWeeklyLosses #BTC #CryptoMarket #CryptoNews
📊 Market Context Data
Grayscale Bitcoin Mini Trust ETF (BTC)
US$33.50
-10.52% since 2 Oct 2026
Closed: 2:00 am • Disclaimer
After hours: 6:00 am
US$33.54
0.12%
14 Oct26 Oct7 Nov34353637
2 Oct 2026 - 7 Nov 2026
Open 33.36
High 33.59
Low 33.05
52-wk high 47.07
52-wk low25.65
$BTC
$BTTC
Is the bottom in, or are bears taking full control? 📉
Bitcoin has officially closed lower for five straight weeks, hitting a continuous losing streak not seen since earlier this year. Trading around $76,000, BTC is facing immense macroeconomic and industry-specific headwinds.
Here is what is driving the market pullback:
• AI & Tech Stock Spillover: A brutal selloff in tech giants and AI chip stocks dragged the Nasdaq Composite down. This risk-off sentiment immediately bled into digital assets.
• Massive Liquidations: The sudden downside move triggered over $1 billion in total crypto liquidations over a 24-hour window, forcing long positions to close and compounding the selling pressure.
• ETF Outflow Exodus: Institutional momentum slowed down significantly, with spot Bitcoin ETFs shedding hundreds of millions of dollars. Major funds like BlackRock's IBIT marked a five-session outflow streak.
• U.S. Midterm Election Hangover: Initial market optimism quickly faded into regulatory uncertainty as traders evaluate what a Democrat-controlled U.S. Congress will mean for future crypto legislation.
What to watch next:
Traders are closely watching whether Bitcoin can hold the critical $75,000 support level. With crucial U.S. CPI inflation data dropping on Tuesday and the market pricing in high odds of a Federal Reserve interest rate hike in December, volatility is guaranteed to spike.
Are you buying this dip, or waiting for lower targets? 👇
#BitcoinFiveWeeklyLosses #BTC #CryptoMarket #CryptoNews
📊 Market Context Data
Grayscale Bitcoin Mini Trust ETF (BTC)
US$33.50
-10.52% since 2 Oct 2026
Closed: 2:00 am • Disclaimer
After hours: 6:00 am
US$33.54
0.12%
14 Oct26 Oct7 Nov34353637
2 Oct 2026 - 7 Nov 2026
Open 33.36
High 33.59
Low 33.05
52-wk high 47.07
52-wk low25.65
$BTC
$BTTC
105

#BitcoinFiveWeeklyLosses
🚨 BITCOIN FACES A TOUGH STREAK! 🥶📉
$BTC is reportedly heading toward its fifth consecutive weekly loss, putting market confidence to the test.
But here's the big question: Is this a temporary correction before the next rally, or are we entering a deeper bearish phase?
🐂 Bulls: Is a recovery coming?
🐻 Bears: Could more downside be ahead?
👇 What's your BTC outlook right now?
#Bitcoin #BTC #ETH #CryptoMarket #BitcoinNews #BinanceSquare
This is for educational purposes only, not financial advice (NFA). Always do your own research (DYOR).
$ETH $SOL
#BitcoinFiveWeeklyLosses
🚨 BITCOIN FACES A TOUGH STREAK! 🥶📉
$BTC is reportedly heading toward its fifth consecutive weekly loss, putting market confidence to the test.
But here's the big question: Is this a temporary correction before the next rally, or are we entering a deeper bearish phase?
🐂 Bulls: Is a recovery coming?
🐻 Bears: Could more downside be ahead?
👇 What's your BTC outlook right now?
#Bitcoin #BTC #ETH #CryptoMarket #BitcoinNews #BinanceSquare
This is for educational purposes only, not financial advice (NFA). Always do your own research (DYOR).
$ETH $SOL
🚨 BITCOIN FACES A TOUGH STREAK! 🥶📉
$BTC is reportedly heading toward its fifth consecutive weekly loss, putting market confidence to the test.
But here's the big question: Is this a temporary correction before the next rally, or are we entering a deeper bearish phase?
🐂 Bulls: Is a recovery coming?
🐻 Bears: Could more downside be ahead?
👇 What's your BTC outlook right now?
#Bitcoin #BTC #ETH #CryptoMarket #BitcoinNews #BinanceSquare
This is for educational purposes only, not financial advice (NFA). Always do your own research (DYOR).
$ETH $SOL

4

·
--
Bullish
📉 Bitcoin Faces Five Consecutive Weekly Losses!
Bitcoin has recorded its fifth straight weekly loss, showing continued pressure in the crypto market.
Latest Update:
- Bitcoin closed near $74,851.
- BTC dropped around 4.5% during the latest week.
- Around $745 million in crypto positions were liquidated in one hour.
- Bitcoin ETFs recorded approximately $1.28 billion in weekly outflows.
What Does This Mean?
Investors are showing caution, and selling pressure remains high.
Coins to Watch:
$BTC $ETH $BNB $SOL $XRP
What's Next?
If Bitcoin recovers, market confidence may improve. But further selling could push prices lower.
⚠️ Crypto markets are volatile. Always do your own research before investing.
#BitcoinFiveWeeklyLosses #bitcoin #BTC #CryptoMarket #BinanceSquare
{spot}(BNBUSDT)
{spot}(BTCUSDT)
{spot}(ETHUSDT)
📉 Bitcoin Faces Five Consecutive Weekly Losses!
Bitcoin has recorded its fifth straight weekly loss, showing continued pressure in the crypto market.
Latest Update:
- Bitcoin closed near $74,851.
- BTC dropped around 4.5% during the latest week.
- Around $745 million in crypto positions were liquidated in one hour.
- Bitcoin ETFs recorded approximately $1.28 billion in weekly outflows.
What Does This Mean?
Investors are showing caution, and selling pressure remains high.
Coins to Watch:
$BTC $ETH $BNB $SOL $XRP
What's Next?
If Bitcoin recovers, market confidence may improve. But further selling could push prices lower.
⚠️ Crypto markets are volatile. Always do your own research before investing.
#BitcoinFiveWeeklyLosses #bitcoin #BTC #CryptoMarket #BinanceSquare
Bitcoin has recorded its fifth straight weekly loss, showing continued pressure in the crypto market.
Latest Update:
- Bitcoin closed near $74,851.
- BTC dropped around 4.5% during the latest week.
- Around $745 million in crypto positions were liquidated in one hour.
- Bitcoin ETFs recorded approximately $1.28 billion in weekly outflows.
What Does This Mean?
Investors are showing caution, and selling pressure remains high.
Coins to Watch:
$BTC $ETH $BNB $SOL $XRP
What's Next?
If Bitcoin recovers, market confidence may improve. But further selling could push prices lower.
⚠️ Crypto markets are volatile. Always do your own research before investing.
#BitcoinFiveWeeklyLosses #bitcoin #BTC #CryptoMarket #BinanceSquare
113

·
--
News
Top 3 Price Predictions: Bitcoin, Ethereum, Ripple – Bears in control, with next support at BT09 Nov 2026, 03:24:49
Bitcoin trades around $75,530 on Monday, having closed below key EMAs, with next support at $70,000.
Ethereum is around $2,155 after correcting over 6.5% last week, as bears target the psychological $2,000 level.
XRP trades around $1.11 on Monday after correcting over 10% last week, with the next key zone around $1.
Bitcoin (BTC), Ethereum (ETH) and Ripple (XRP) bears remain in control, with the top three cryptocurrencies correcting over 4%, 6% and 10%, respectively, last week and marking their fifth consecutive weeks of losses. BTC trades around $75,530 on Monday after closing below key Exponential Moving Averages (EMAs), leaving the $70,000 level as its next major support. Meanwhile, ETH hovers near $2,155, while XRP trades around $1.11, with both altcoins facing downside risks toward $2,000 and $1, respectively.
Bitcoin closes below major supports
Bitcoin price trades at $75,530 on Monday, maintaining a bearish near-term tone as it holds below key Exponential Moving Averages (EMAs). The 200-day EMA at $76,463 acts as the first overhead cap, followed higher by the 100-day EMA at $77,635 and the 50-day EMA near $79,327, all reinforcing a structure of persistent topside supply.
Momentum conditions remain soft, with the Relative Strength Index (RSI) hovering in the high-30s and the Moving Average Convergence Divergence (MACD) stuck in negative territory, hinting that selling pressure still outweighs dip-buying interest.
On the topside, immediate resistance is located at the 200-day EMA around $76,463, ahead of a secondary barrier at the 100-day EMA near $77,635 and a deeper recovery hurdle at the 50-day EMA close to $79,327. Further up, a horizontal resistance line at $85,000 marks a stronger bullish validation level where buyers would need to reclaim ground to challenge the broader bearish bias.
On the downside, the absence of nearby mapped support suggests that any break lower from current levels would send BTC toward the psychological support zone around $70,000 before stabilizing.
BTC/USDT daily chart
Ethereum bears eye $2,000 mark
Ethereum price trades at $2,155 on Monday, maintaining a bearish near-term bias as it remains well below the 200-day EMA at $2,311, the 100-day EMA at $2,337, and the 50-day EMA at $2,372. The loss of the previously upward-sloping support trendline, now broken around $2,432, reinforces a corrective tone, while the RSI hovering near 35 and the MACD in negative territory suggest lingering downside momentum rather than outright capitulation.
On the topside, initial resistance is seen at the 200-day EMA near $2,311, followed by the 100-day EMA at $2,337 and the 50-day EMA at $2,372, with a more notable horizontal barrier at $2,400 and the former rising trendline break zone around $2,432 capping any stronger rebound.
On the downside, the next meaningful support sits around the key $2,000 level ahead of the prior horizontal base around $1,823, where buyers would be expected to show more robust interest if the current decline extends.
ETH/USDT daily chart
XRP bears aiming for next key support
XRP price trades at $1.119 on Monday, extending a bearish near-term tone as it holds well below the 50-day, 100-day and 200-day EMAs clustered between roughly $1.303 and $1.368.
The Relative Strength Index (RSI) at 28 sits in oversold territory. At the same time, the Moving Average Convergence Divergence (MACD) indicator remains negative, which together hint at persistent downside pressure even as the market risks a short-term pause or modest bounce from depressed levels.
On the topside, initial resistance appears at $1.160, ahead of a stronger cap near $1.300 and the nearby EMA cluster between the 50-day EMA at $1.303 and the 100-day EMA at $1.308; beyond that, the 200-day EMA at $1.368 and horizontal levels at $1.540 and $1.900 define higher barriers.
On the downside, the nearest meaningful support is located at the psychological $1.000 handle, where a break would likely expose the pair to a deeper bearish extension in the sessions ahead.
XRP/USDT daily chart
(The technical analysis of this story was written with the help of an AI tool. Know more.)
Cryptocurrency prices FAQs
How do new token launches or listings affect cryptocurrency prices?
Token launches influence demand and adoption among market participants. Listings on crypto exchanges deepen the liquidity for an asset and add new participants to an asset’s network. This is typically bullish for a digital asset.
How do hacks affect cryptocurrency prices?
How do macroeconomic releases and events affect cryptocurrency prices?
How do major crypto upgrades like halvings, hard forks affect cryptocurrency prices?
#BitcoinFiveWeeklyLosses #ETHETFsApproved #TradingCommunity
Source:Fxstreet
News Top 3 Price Predictions: Bitcoin, Ethereum, Ripple – Bears in control, with next support at BT
09 Nov 2026, 03:24:49
Bitcoin trades around $75,530 on Monday, having closed below key EMAs, with next support at $70,000.
Ethereum is around $2,155 after correcting over 6.5% last week, as bears target the psychological $2,000 level.
XRP trades around $1.11 on Monday after correcting over 10% last week, with the next key zone around $1.
Bitcoin (BTC), Ethereum (ETH) and Ripple (XRP) bears remain in control, with the top three cryptocurrencies correcting over 4%, 6% and 10%, respectively, last week and marking their fifth consecutive weeks of losses. BTC trades around $75,530 on Monday after closing below key Exponential Moving Averages (EMAs), leaving the $70,000 level as its next major support. Meanwhile, ETH hovers near $2,155, while XRP trades around $1.11, with both altcoins facing downside risks toward $2,000 and $1, respectively.
Bitcoin closes below major supports
Bitcoin price trades at $75,530 on Monday, maintaining a bearish near-term tone as it holds below key Exponential Moving Averages (EMAs). The 200-day EMA at $76,463 acts as the first overhead cap, followed higher by the 100-day EMA at $77,635 and the 50-day EMA near $79,327, all reinforcing a structure of persistent topside supply.
Momentum conditions remain soft, with the Relative Strength Index (RSI) hovering in the high-30s and the Moving Average Convergence Divergence (MACD) stuck in negative territory, hinting that selling pressure still outweighs dip-buying interest.
On the topside, immediate resistance is located at the 200-day EMA around $76,463, ahead of a secondary barrier at the 100-day EMA near $77,635 and a deeper recovery hurdle at the 50-day EMA close to $79,327. Further up, a horizontal resistance line at $85,000 marks a stronger bullish validation level where buyers would need to reclaim ground to challenge the broader bearish bias.
On the downside, the absence of nearby mapped support suggests that any break lower from current levels would send BTC toward the psychological support zone around $70,000 before stabilizing.
BTC/USDT daily chart
Ethereum bears eye $2,000 mark
Ethereum price trades at $2,155 on Monday, maintaining a bearish near-term bias as it remains well below the 200-day EMA at $2,311, the 100-day EMA at $2,337, and the 50-day EMA at $2,372. The loss of the previously upward-sloping support trendline, now broken around $2,432, reinforces a corrective tone, while the RSI hovering near 35 and the MACD in negative territory suggest lingering downside momentum rather than outright capitulation.
On the topside, initial resistance is seen at the 200-day EMA near $2,311, followed by the 100-day EMA at $2,337 and the 50-day EMA at $2,372, with a more notable horizontal barrier at $2,400 and the former rising trendline break zone around $2,432 capping any stronger rebound.
On the downside, the next meaningful support sits around the key $2,000 level ahead of the prior horizontal base around $1,823, where buyers would be expected to show more robust interest if the current decline extends.
ETH/USDT daily chart
XRP bears aiming for next key support
XRP price trades at $1.119 on Monday, extending a bearish near-term tone as it holds well below the 50-day, 100-day and 200-day EMAs clustered between roughly $1.303 and $1.368.
The Relative Strength Index (RSI) at 28 sits in oversold territory. At the same time, the Moving Average Convergence Divergence (MACD) indicator remains negative, which together hint at persistent downside pressure even as the market risks a short-term pause or modest bounce from depressed levels.
On the topside, initial resistance appears at $1.160, ahead of a stronger cap near $1.300 and the nearby EMA cluster between the 50-day EMA at $1.303 and the 100-day EMA at $1.308; beyond that, the 200-day EMA at $1.368 and horizontal levels at $1.540 and $1.900 define higher barriers.
On the downside, the nearest meaningful support is located at the psychological $1.000 handle, where a break would likely expose the pair to a deeper bearish extension in the sessions ahead.
XRP/USDT daily chart
(The technical analysis of this story was written with the help of an AI tool. Know more.)
Cryptocurrency prices FAQs
How do new token launches or listings affect cryptocurrency prices?
Token launches influence demand and adoption among market participants. Listings on crypto exchanges deepen the liquidity for an asset and add new participants to an asset’s network. This is typically bullish for a digital asset.
How do hacks affect cryptocurrency prices?
How do macroeconomic releases and events affect cryptocurrency prices?
How do major crypto upgrades like halvings, hard forks affect cryptocurrency prices?
#BitcoinFiveWeeklyLosses #ETHETFsApproved #TradingCommunity
Source:Fxstreet
Bitcoin trades around $75,530 on Monday, having closed below key EMAs, with next support at $70,000.
Ethereum is around $2,155 after correcting over 6.5% last week, as bears target the psychological $2,000 level.
XRP trades around $1.11 on Monday after correcting over 10% last week, with the next key zone around $1.
Bitcoin (BTC), Ethereum (ETH) and Ripple (XRP) bears remain in control, with the top three cryptocurrencies correcting over 4%, 6% and 10%, respectively, last week and marking their fifth consecutive weeks of losses. BTC trades around $75,530 on Monday after closing below key Exponential Moving Averages (EMAs), leaving the $70,000 level as its next major support. Meanwhile, ETH hovers near $2,155, while XRP trades around $1.11, with both altcoins facing downside risks toward $2,000 and $1, respectively.
Bitcoin closes below major supports
Bitcoin price trades at $75,530 on Monday, maintaining a bearish near-term tone as it holds below key Exponential Moving Averages (EMAs). The 200-day EMA at $76,463 acts as the first overhead cap, followed higher by the 100-day EMA at $77,635 and the 50-day EMA near $79,327, all reinforcing a structure of persistent topside supply.
Momentum conditions remain soft, with the Relative Strength Index (RSI) hovering in the high-30s and the Moving Average Convergence Divergence (MACD) stuck in negative territory, hinting that selling pressure still outweighs dip-buying interest.
On the topside, immediate resistance is located at the 200-day EMA around $76,463, ahead of a secondary barrier at the 100-day EMA near $77,635 and a deeper recovery hurdle at the 50-day EMA close to $79,327. Further up, a horizontal resistance line at $85,000 marks a stronger bullish validation level where buyers would need to reclaim ground to challenge the broader bearish bias.
On the downside, the absence of nearby mapped support suggests that any break lower from current levels would send BTC toward the psychological support zone around $70,000 before stabilizing.
BTC/USDT daily chart
Ethereum bears eye $2,000 mark
Ethereum price trades at $2,155 on Monday, maintaining a bearish near-term bias as it remains well below the 200-day EMA at $2,311, the 100-day EMA at $2,337, and the 50-day EMA at $2,372. The loss of the previously upward-sloping support trendline, now broken around $2,432, reinforces a corrective tone, while the RSI hovering near 35 and the MACD in negative territory suggest lingering downside momentum rather than outright capitulation.
On the topside, initial resistance is seen at the 200-day EMA near $2,311, followed by the 100-day EMA at $2,337 and the 50-day EMA at $2,372, with a more notable horizontal barrier at $2,400 and the former rising trendline break zone around $2,432 capping any stronger rebound.
On the downside, the next meaningful support sits around the key $2,000 level ahead of the prior horizontal base around $1,823, where buyers would be expected to show more robust interest if the current decline extends.
ETH/USDT daily chart
XRP bears aiming for next key support
XRP price trades at $1.119 on Monday, extending a bearish near-term tone as it holds well below the 50-day, 100-day and 200-day EMAs clustered between roughly $1.303 and $1.368.
The Relative Strength Index (RSI) at 28 sits in oversold territory. At the same time, the Moving Average Convergence Divergence (MACD) indicator remains negative, which together hint at persistent downside pressure even as the market risks a short-term pause or modest bounce from depressed levels.
On the topside, initial resistance appears at $1.160, ahead of a stronger cap near $1.300 and the nearby EMA cluster between the 50-day EMA at $1.303 and the 100-day EMA at $1.308; beyond that, the 200-day EMA at $1.368 and horizontal levels at $1.540 and $1.900 define higher barriers.
On the downside, the nearest meaningful support is located at the psychological $1.000 handle, where a break would likely expose the pair to a deeper bearish extension in the sessions ahead.
XRP/USDT daily chart
(The technical analysis of this story was written with the help of an AI tool. Know more.)
Cryptocurrency prices FAQs
How do new token launches or listings affect cryptocurrency prices?
Token launches influence demand and adoption among market participants. Listings on crypto exchanges deepen the liquidity for an asset and add new participants to an asset’s network. This is typically bullish for a digital asset.
How do hacks affect cryptocurrency prices?
How do macroeconomic releases and events affect cryptocurrency prices?
How do major crypto upgrades like halvings, hard forks affect cryptocurrency prices?
#BitcoinFiveWeeklyLosses #ETHETFsApproved #TradingCommunity
Source:Fxstreet
136

·
--
#BitcoinFiveWeeklyLosses
Bitcoin's 5 weeks of losses — explained simply 📉
Imagine you own Bitcoin.$BTC
For five weeks in a row, its price has gone down instead of up. This is called 5 consecutive losing weeks.
Why is Bitcoin falling?
💰 Investors are selling Bitcoin.
🏦 Big investment funds are taking money out.
😟 People are worried about the economy.
📉 Traders who borrowed money are being forced to sell.
What could happen next?
🟢 Bitcoin goes up: Buyers return and the price recovers.$BTC
🔴 Bitcoin goes down: More people sell and the price falls further.
🟡 Bitcoin stays sideways: Buyers and sellers balance each other.
Remember: Five red weeks do not mean Bitcoin must keep falling. A recovery is still possible.
Note: The infographic uses the figures from the previous update; treat them as reported figures, not independently verified live prices.
{spot}(BTCUSDT)
#BitcoinFiveWeeklyLosses
Bitcoin's 5 weeks of losses — explained simply 📉
Imagine you own Bitcoin.$BTC
For five weeks in a row, its price has gone down instead of up. This is called 5 consecutive losing weeks.
Why is Bitcoin falling?
💰 Investors are selling Bitcoin.
🏦 Big investment funds are taking money out.
😟 People are worried about the economy.
📉 Traders who borrowed money are being forced to sell.
What could happen next?
🟢 Bitcoin goes up: Buyers return and the price recovers.$BTC
🔴 Bitcoin goes down: More people sell and the price falls further.
🟡 Bitcoin stays sideways: Buyers and sellers balance each other.
Remember: Five red weeks do not mean Bitcoin must keep falling. A recovery is still possible.
Note: The infographic uses the figures from the previous update; treat them as reported figures, not independently verified live prices.
Bitcoin's 5 weeks of losses — explained simply 📉
Imagine you own Bitcoin.$BTC
For five weeks in a row, its price has gone down instead of up. This is called 5 consecutive losing weeks.
Why is Bitcoin falling?
💰 Investors are selling Bitcoin.
🏦 Big investment funds are taking money out.
😟 People are worried about the economy.
📉 Traders who borrowed money are being forced to sell.
What could happen next?
🟢 Bitcoin goes up: Buyers return and the price recovers.$BTC
🔴 Bitcoin goes down: More people sell and the price falls further.
🟡 Bitcoin stays sideways: Buyers and sellers balance each other.
Remember: Five red weeks do not mean Bitcoin must keep falling. A recovery is still possible.
Note: The infographic uses the figures from the previous update; treat them as reported figures, not independently verified live prices.
82

·
--
#BitcoinFiveWeeklyLosses
📉 Five Red Weekly Candles Took Bitcoin From $86.5K to $74.9K
BTC has now closed lower five weeks running, and this week opens with ETF selling and Tuesday's CPI ahead.
📊 Weekly close fell 13.5%, from $86,530 (Sep 28 week) to $74,851
📉 Last week alone: -4.5%, from a $78,354 open
🏦 IBIT: six straight outflow sessions, about $1.44B in total
⚠️ US spot BTC ETFs lost $1.28B from Nov 2 to Nov 6
The catch: Fidelity's FBTC still took in $93.1M that week, so not every buyer left.
Sixth red week, or a green close above $75K by Sunday? 👇
$BTC
#BitcoinFiveWeeklyLosses #Bitcoin #ETF
#BitcoinFiveWeeklyLosses
📉 Five Red Weekly Candles Took Bitcoin From $86.5K to $74.9K
BTC has now closed lower five weeks running, and this week opens with ETF selling and Tuesday's CPI ahead.
📊 Weekly close fell 13.5%, from $86,530 (Sep 28 week) to $74,851
📉 Last week alone: -4.5%, from a $78,354 open
🏦 IBIT: six straight outflow sessions, about $1.44B in total
⚠️ US spot BTC ETFs lost $1.28B from Nov 2 to Nov 6
The catch: Fidelity's FBTC still took in $93.1M that week, so not every buyer left.
Sixth red week, or a green close above $75K by Sunday? 👇
$BTC
#BitcoinFiveWeeklyLosses #Bitcoin #ETF
📉 Five Red Weekly Candles Took Bitcoin From $86.5K to $74.9K
BTC has now closed lower five weeks running, and this week opens with ETF selling and Tuesday's CPI ahead.
📊 Weekly close fell 13.5%, from $86,530 (Sep 28 week) to $74,851
📉 Last week alone: -4.5%, from a $78,354 open
🏦 IBIT: six straight outflow sessions, about $1.44B in total
⚠️ US spot BTC ETFs lost $1.28B from Nov 2 to Nov 6
The catch: Fidelity's FBTC still took in $93.1M that week, so not every buyer left.
Sixth red week, or a green close above $75K by Sunday? 👇
$BTC
#BitcoinFiveWeeklyLosses #Bitcoin #ETF
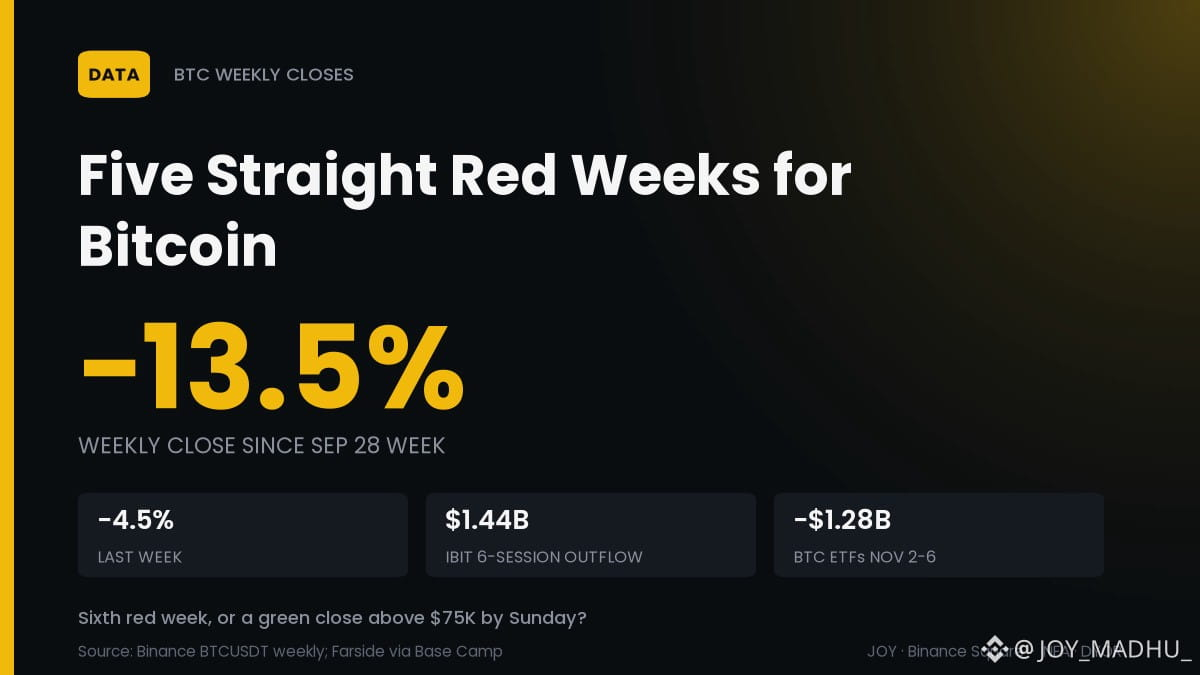
61
Log in to explore more content
Join global crypto users on Binance Square
⚡️ Get latest and useful information about crypto.
💬 Trusted by the world’s largest crypto exchange.
👍 Discover real insights from verified creators.
Email / Phone number
Trending Topics
1
#BinanceReopensWithdrawalsForMoreAssets
1.7M views
6,901 Discussing
2
#BitcoinFiveWeeklyLosses
26,238 views
584 Discussing
3
#AIChipSlumpNasdaq
13,735 views
328 Discussing
4
#NvidiaInvestigatesAfterHuang’sAffairApology
11,521 views
178 Discussing
5
#EthereumSpotETFsPost$365MWeeklyOutflow
262 views
16 Discussing
6
#TradFiForBeginners
249,830 views
2,230 Discussing
7
#SouthKoreaDraftLawTargets15To20%ShareholderCap
178,234 views
922 Discussing
8
#KeplrAdvisesSocialLoginUsersToTransferAssets
83,212 views
636 Discussing
9
#TetherPlans€28.8MForJuventusCapitalIncrease
58,721 views
470 Discussing
10
#JobsReportRaisesHikeOdds
1M views
4,644 Discussing