

#cpi
cpi
5M views
7,571 Discussing
Hot
Latest

·
--
Article
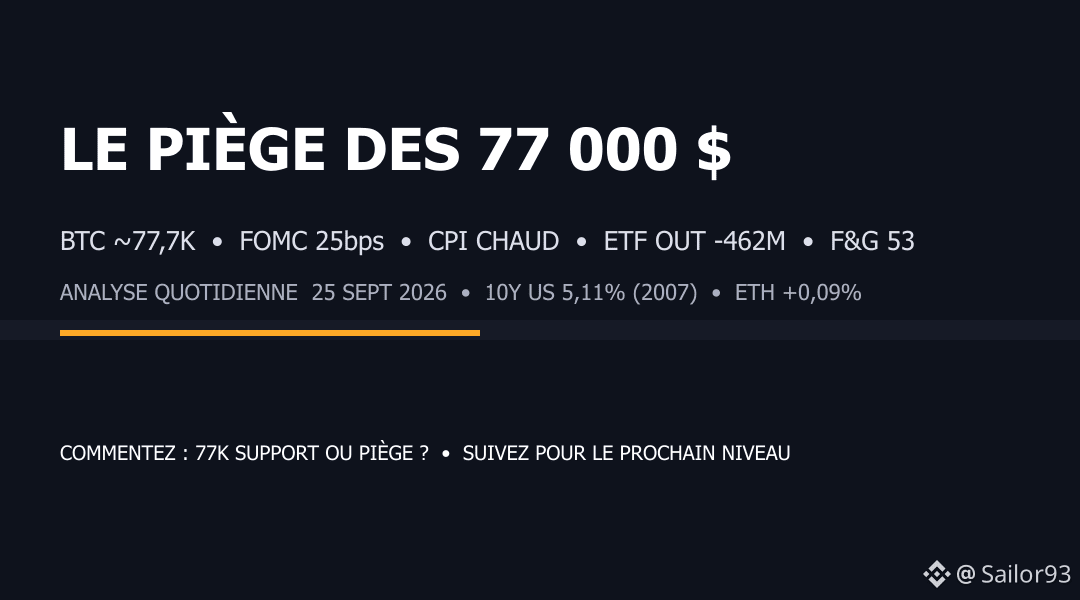
THE TRAP OF $77,000THE TRAP OF $77,000
77K is not support. It’s a death line.
• CPI 11/09 (core hot) made the FOMC rewrite: 88.5% probability of a 25 bps hike on 09/16 → BTC fell from 79.8K to 77K in 48h. The ETFs sold $462.7M over 4 sessions.
• Liquidation clusters: 75-76K longs / 82K shorts. If 77K breaks = cascade. If 82K holds = short squeeze for 1.95B$. Nothing in between.
• Macro: 10Y US 5.11% (2007 peak). ETH flat (+0.09%). F&G 53 (neutral). The market no longer believes in a soft landing.
Commentary: does 77K hold or break? Follow for daily analysis.
THE TRAP OF $77,000
THE TRAP OF $77,000
77K is not support. It’s a death line.
• CPI 11/09 (core hot) made the FOMC rewrite: 88.5% probability of a 25 bps hike on 09/16 → BTC fell from 79.8K to 77K in 48h. The ETFs sold $462.7M over 4 sessions.
• Liquidation clusters: 75-76K longs / 82K shorts. If 77K breaks = cascade. If 82K holds = short squeeze for 1.95B$. Nothing in between.
• Macro: 10Y US 5.11% (2007 peak). ETH flat (+0.09%). F&G 53 (neutral). The market no longer believes in a soft landing.
Commentary: does 77K hold or break? Follow for daily analysis.
77K is not support. It’s a death line.
• CPI 11/09 (core hot) made the FOMC rewrite: 88.5% probability of a 25 bps hike on 09/16 → BTC fell from 79.8K to 77K in 48h. The ETFs sold $462.7M over 4 sessions.
• Liquidation clusters: 75-76K longs / 82K shorts. If 77K breaks = cascade. If 82K holds = short squeeze for 1.95B$. Nothing in between.
• Macro: 10Y US 5.11% (2007 peak). ETH flat (+0.09%). F&G 53 (neutral). The market no longer believes in a soft landing.
Commentary: does 77K hold or break? Follow for daily analysis.
14
·
--
The CPI has shattered expectations: +80% chance of a Fed rate hike, BTC drops back below 77k after a spike to 79.8k — do you feel the trap?
- Liquidations >732M $ over 24h, Bitcoin ETFs outflow 462.7M $ this week (the largest weekly outflows in 10 weeks)
- ETH holds around 2,600 $ (+0.09% weekly) while altcoins struggle; Fear & Greed at 55 (Neutral)
- BTC currently around $84,300, rebounding after the CPI shock — the 84k level becomes key to continuing the bounce
What’s your scenario: continuation of the rebound toward 90k or a fresh rejection below 80k? Let us know in the comments!
Subscribe for our daily crypto analyses, straight to the point.
#CPI #Fed
The CPI has shattered expectations: +80% chance of a Fed rate hike, BTC drops back below 77k after a spike to 79.8k — do you feel the trap?
- Liquidations >732M $ over 24h, Bitcoin ETFs outflow 462.7M $ this week (the largest weekly outflows in 10 weeks)
- ETH holds around 2,600 $ (+0.09% weekly) while altcoins struggle; Fear & Greed at 55 (Neutral)
- BTC currently around $84,300, rebounding after the CPI shock — the 84k level becomes key to continuing the bounce
What’s your scenario: continuation of the rebound toward 90k or a fresh rejection below 80k? Let us know in the comments!
Subscribe for our daily crypto analyses, straight to the point.
#CPI #Fed
- Liquidations >732M $ over 24h, Bitcoin ETFs outflow 462.7M $ this week (the largest weekly outflows in 10 weeks)
- ETH holds around 2,600 $ (+0.09% weekly) while altcoins struggle; Fear & Greed at 55 (Neutral)
- BTC currently around $84,300, rebounding after the CPI shock — the 84k level becomes key to continuing the bounce
What’s your scenario: continuation of the rebound toward 90k or a fresh rejection below 80k? Let us know in the comments!
Subscribe for our daily crypto analyses, straight to the point.
#CPI #Fed
39

·
--
Most market participants still believe macro data triggers rational price discovery, but history shows inflation prints almost always create the most predatory liquidity sweeps.
We have all watched a screen in disbelief as a sudden red wick liquidates a carefully planned position before reversing entirely. It is agonizing to get the macro direction right while still getting stopped out by short-term noise.
When August CPI dropped with headline inflation holding steady at 3.4% YoY, $BTC reacted in textbook fashion by dipping from the $77,200 area down toward $76,063 within minutes. Inexperienced participants panic and market-sell into the red, convinced a structural breakdown is underway, while patient money simply treats these knee-jerk pullbacks as discounted liquidity.
Having traded through multiple cycles, I have seen this exact playbook play out across both $BTC and $ETH countless times. Volatility events around economic data are rarely about the numbers themselves, but rather about shaking out high leverage and resetting funding rates before the prevailing trend reasserts itself.
Did this quick flush shake your conviction or did you use the dip to accumulate?
#Bitcoin #CryptoTrading #CPI
Most market participants still believe macro data triggers rational price discovery, but history shows inflation prints almost always create the most predatory liquidity sweeps.
We have all watched a screen in disbelief as a sudden red wick liquidates a carefully planned position before reversing entirely. It is agonizing to get the macro direction right while still getting stopped out by short-term noise.
When August CPI dropped with headline inflation holding steady at 3.4% YoY, $BTC reacted in textbook fashion by dipping from the $77,200 area down toward $76,063 within minutes. Inexperienced participants panic and market-sell into the red, convinced a structural breakdown is underway, while patient money simply treats these knee-jerk pullbacks as discounted liquidity.
Having traded through multiple cycles, I have seen this exact playbook play out across both $BTC and $ETH countless times. Volatility events around economic data are rarely about the numbers themselves, but rather about shaking out high leverage and resetting funding rates before the prevailing trend reasserts itself.
Did this quick flush shake your conviction or did you use the dip to accumulate?
#Bitcoin #CryptoTrading #CPI
We have all watched a screen in disbelief as a sudden red wick liquidates a carefully planned position before reversing entirely. It is agonizing to get the macro direction right while still getting stopped out by short-term noise.
When August CPI dropped with headline inflation holding steady at 3.4% YoY, $BTC reacted in textbook fashion by dipping from the $77,200 area down toward $76,063 within minutes. Inexperienced participants panic and market-sell into the red, convinced a structural breakdown is underway, while patient money simply treats these knee-jerk pullbacks as discounted liquidity.
Having traded through multiple cycles, I have seen this exact playbook play out across both $BTC and $ETH countless times. Volatility events around economic data are rarely about the numbers themselves, but rather about shaking out high leverage and resetting funding rates before the prevailing trend reasserts itself.
Did this quick flush shake your conviction or did you use the dip to accumulate?
#Bitcoin #CryptoTrading #CPI

13

If you're still panic dumping $BTC on every CPI print, stop now.
This kind of headline reaction has traders losing money on FOMO entries and panic exits. You buy the first dip only to see it drop more, or sell too early and miss the recovery.
The August CPI report just printed 3.4% year over year, holding steady. $BTC immediately moved down from the $77,200 area to around $76,063.
Bears argue this shows inflation remaining sticky, which delays rate cuts and could pressure prices lower. Bulls say it was in line so the dip is overdone and a bounce is likely.
I think the bulls have it right this time. Similar setups have seen $ETH and $SOL lead the rebound once the dust settles.
Where do you think this goes from here?
#Bitcoin #CPI #Crypto
If you're still panic dumping $BTC on every CPI print, stop now.
This kind of headline reaction has traders losing money on FOMO entries and panic exits. You buy the first dip only to see it drop more, or sell too early and miss the recovery.
The August CPI report just printed 3.4% year over year, holding steady. $BTC immediately moved down from the $77,200 area to around $76,063.
Bears argue this shows inflation remaining sticky, which delays rate cuts and could pressure prices lower. Bulls say it was in line so the dip is overdone and a bounce is likely.
I think the bulls have it right this time. Similar setups have seen $ETH and $SOL lead the rebound once the dust settles.
Where do you think this goes from here?
#Bitcoin #CPI #Crypto
This kind of headline reaction has traders losing money on FOMO entries and panic exits. You buy the first dip only to see it drop more, or sell too early and miss the recovery.
The August CPI report just printed 3.4% year over year, holding steady. $BTC immediately moved down from the $77,200 area to around $76,063.
Bears argue this shows inflation remaining sticky, which delays rate cuts and could pressure prices lower. Bulls say it was in line so the dip is overdone and a bounce is likely.
I think the bulls have it right this time. Similar setups have seen $ETH and $SOL lead the rebound once the dust settles.
Where do you think this goes from here?
#Bitcoin #CPI #Crypto
36
·
--
Picture this: the August CPI numbers just crossed the wire holding steady at 3.4% YoY, and within minutes, traders were dumping positions into thin order books.
Most retail traders get completely chopped up trying to scalp macro headlines, usually panic-selling the local wick right into liquidity traps.
When the report landed, $BTC swiftly slid from the $77,200 area down toward $76,063. We saw almost the exact same reaction during previous quarterly prints, where a quick 1.5% drop liquidated overeager longs before buyers stepped back in. Even correlated assets like $ETH experienced momentary sweeps across Binance books as trading bots reacted to the headline number before human participants could process the nuance.
The takeaway here is straightforward. Isolated macro prints like steady CPI figures usually create short-term liquidity events rather than structural trend shifts, clearing out leverage on majors and $SOL while long-term positioning remains intact.
Where do you see price heading once the dust from this report settles?
#Bitcoin #CryptoTrading #CPI
Picture this: the August CPI numbers just crossed the wire holding steady at 3.4% YoY, and within minutes, traders were dumping positions into thin order books.
Most retail traders get completely chopped up trying to scalp macro headlines, usually panic-selling the local wick right into liquidity traps.
When the report landed, $BTC swiftly slid from the $77,200 area down toward $76,063. We saw almost the exact same reaction during previous quarterly prints, where a quick 1.5% drop liquidated overeager longs before buyers stepped back in. Even correlated assets like $ETH experienced momentary sweeps across Binance books as trading bots reacted to the headline number before human participants could process the nuance.
The takeaway here is straightforward. Isolated macro prints like steady CPI figures usually create short-term liquidity events rather than structural trend shifts, clearing out leverage on majors and $SOL while long-term positioning remains intact.
Where do you see price heading once the dust from this report settles?
#Bitcoin #CryptoTrading #CPI
Most retail traders get completely chopped up trying to scalp macro headlines, usually panic-selling the local wick right into liquidity traps.
When the report landed, $BTC swiftly slid from the $77,200 area down toward $76,063. We saw almost the exact same reaction during previous quarterly prints, where a quick 1.5% drop liquidated overeager longs before buyers stepped back in. Even correlated assets like $ETH experienced momentary sweeps across Binance books as trading bots reacted to the headline number before human participants could process the nuance.
The takeaway here is straightforward. Isolated macro prints like steady CPI figures usually create short-term liquidity events rather than structural trend shifts, clearing out leverage on majors and $SOL while long-term positioning remains intact.
Where do you see price heading once the dust from this report settles?
#Bitcoin #CryptoTrading #CPI
32
everyone thinks macro data prints mean immediate moon missions, but actually it is where most retail liquidity gets swallowed whole.
getting chopped up trying to scalp high-volatility news drops is how accounts get wiped before the real trend even starts. most traders panic-sell the sudden red wick only to watch price recover ten minutes later.
look at the august cpi print coming in flat at 3.4% yoy. the immediate reaction was classic stop-hunting behavior, dumping $BTC from around the $77,200 area straight down to $76,063 in a flash.
if you rushed in with high leverage expecting a clean breakout, market makers just swept your stops ser. even $ETH caught collateral chop while the books reset. ngl, jumping into instant headline volatility without waiting for the dust to settle is pure pain.
did you get wicked out on that dip or are you waiting for the range to settle before bidding?
#Bitcoin #CPI #CryptoTrading
everyone thinks macro data prints mean immediate moon missions, but actually it is where most retail liquidity gets swallowed whole.
getting chopped up trying to scalp high-volatility news drops is how accounts get wiped before the real trend even starts. most traders panic-sell the sudden red wick only to watch price recover ten minutes later.
look at the august cpi print coming in flat at 3.4% yoy. the immediate reaction was classic stop-hunting behavior, dumping $BTC from around the $77,200 area straight down to $76,063 in a flash.
if you rushed in with high leverage expecting a clean breakout, market makers just swept your stops ser. even $ETH caught collateral chop while the books reset. ngl, jumping into instant headline volatility without waiting for the dust to settle is pure pain.
did you get wicked out on that dip or are you waiting for the range to settle before bidding?
#Bitcoin #CPI #CryptoTrading
getting chopped up trying to scalp high-volatility news drops is how accounts get wiped before the real trend even starts. most traders panic-sell the sudden red wick only to watch price recover ten minutes later.
look at the august cpi print coming in flat at 3.4% yoy. the immediate reaction was classic stop-hunting behavior, dumping $BTC from around the $77,200 area straight down to $76,063 in a flash.
if you rushed in with high leverage expecting a clean breakout, market makers just swept your stops ser. even $ETH caught collateral chop while the books reset. ngl, jumping into instant headline volatility without waiting for the dust to settle is pure pain.
did you get wicked out on that dip or are you waiting for the range to settle before bidding?
#Bitcoin #CPI #CryptoTrading
10
·
--
If you are still panic-selling every time macro data drops, you are just funding someone else's liquidity.
Getting chopped up on knee-jerk reactions to routine economic releases is how most traders bleed their portfolios dry before the real trend even starts.
The August CPI just hit at a steady 3.4% YoY, and predictably, $BTC took a sudden slide from the $77,200 area down toward $76,063 within minutes. It is the exact same playbook we saw during last year's mid-cycle prints, where brief panic wiped out overleveraged positions before spot buyers stepped in to absorb the dip.
Meanwhile, assets like $ETH and $SOL barely flinched through the initial noise, showing how fragmented market reactions get during these releases. The market loves treating steady inflation numbers like an unexpected shock, but watching price action scramble over tenths of a percentage point never gets old.
Are we looking at standard post-data chop before continuation, or is the macro backdrop starting to weigh heavier on this range?
#Bitcoin #CryptoTrading #CPI
If you are still panic-selling every time macro data drops, you are just funding someone else's liquidity.
Getting chopped up on knee-jerk reactions to routine economic releases is how most traders bleed their portfolios dry before the real trend even starts.
The August CPI just hit at a steady 3.4% YoY, and predictably, $BTC took a sudden slide from the $77,200 area down toward $76,063 within minutes. It is the exact same playbook we saw during last year's mid-cycle prints, where brief panic wiped out overleveraged positions before spot buyers stepped in to absorb the dip.
Meanwhile, assets like $ETH and $SOL barely flinched through the initial noise, showing how fragmented market reactions get during these releases. The market loves treating steady inflation numbers like an unexpected shock, but watching price action scramble over tenths of a percentage point never gets old.
Are we looking at standard post-data chop before continuation, or is the macro backdrop starting to weigh heavier on this range?
#Bitcoin #CryptoTrading #CPI
Getting chopped up on knee-jerk reactions to routine economic releases is how most traders bleed their portfolios dry before the real trend even starts.
The August CPI just hit at a steady 3.4% YoY, and predictably, $BTC took a sudden slide from the $77,200 area down toward $76,063 within minutes. It is the exact same playbook we saw during last year's mid-cycle prints, where brief panic wiped out overleveraged positions before spot buyers stepped in to absorb the dip.
Meanwhile, assets like $ETH and $SOL barely flinched through the initial noise, showing how fragmented market reactions get during these releases. The market loves treating steady inflation numbers like an unexpected shock, but watching price action scramble over tenths of a percentage point never gets old.
Are we looking at standard post-data chop before continuation, or is the macro backdrop starting to weigh heavier on this range?
#Bitcoin #CryptoTrading #CPI

43
·
--
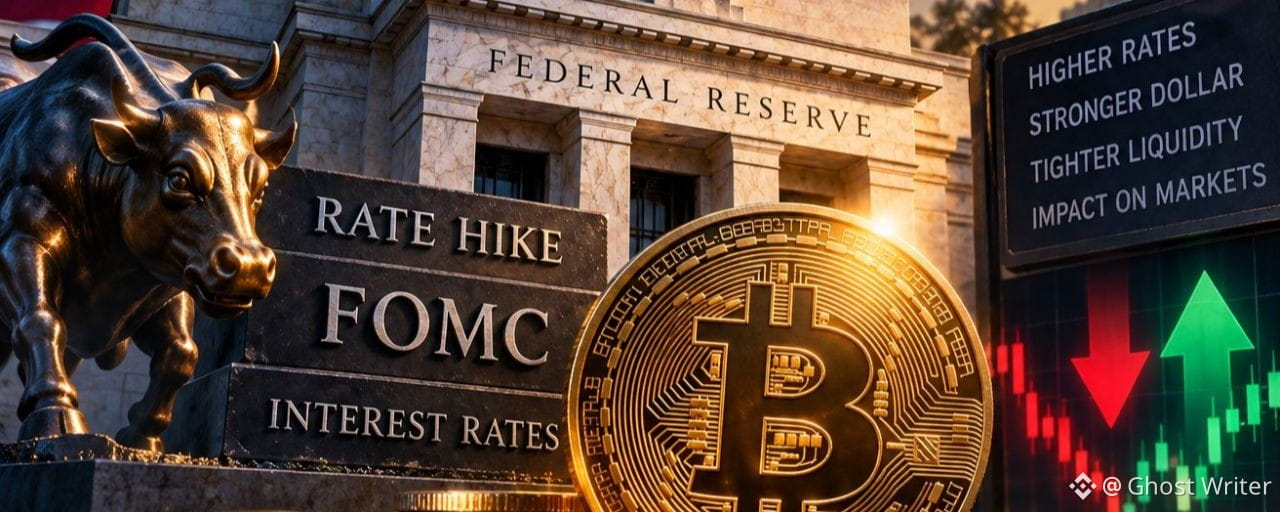
#FedRateWatch The markets enter one of the most sensitive moments of the week with the Federal Reserve meeting and the interest-rate decision
Recent U.S. inflation data gave markets an important signal: the CPI rose in August by 0.4% month-on-month, while Core CPI rose by 0.3%, and annual inflation reached 3.4%. This means price pressures are still above the Fed’s 2% target �
Reuters
Therefore, market expectations increased for a 25-basis-point rate hike, and the most important question is no longer only whether the Fed will raise rates, but what it will say about the next steps
For BTC, stocks, and gold, higher rates may mean tighter liquidity conditions and higher bond yields, so we may see strong volatility in high-risk assets
But if the rate hike is already priced in the market, then the real reaction could be tied to the Fed’s tone and its expectations for future decisions
I will monitor BTC, the dollar, and bond yields before making any trading decision, and I won’t chase the first move after the news
Do you expect the Fed’s decision to be the start of a longer rate-hike cycle, or just a single hike?
#FedRateWatch #Bitcoin #CPI #crypto
#FedRateWatch The markets enter one of the most sensitive moments of the week with the Federal Reserve meeting and the interest-rate decision
Recent U.S. inflation data gave markets an important signal: the CPI rose in August by 0.4% month-on-month, while Core CPI rose by 0.3%, and annual inflation reached 3.4%. This means price pressures are still above the Fed’s 2% target �
Reuters
Therefore, market expectations increased for a 25-basis-point rate hike, and the most important question is no longer only whether the Fed will raise rates, but what it will say about the next steps
For BTC, stocks, and gold, higher rates may mean tighter liquidity conditions and higher bond yields, so we may see strong volatility in high-risk assets
But if the rate hike is already priced in the market, then the real reaction could be tied to the Fed’s tone and its expectations for future decisions
I will monitor BTC, the dollar, and bond yields before making any trading decision, and I won’t chase the first move after the news
Do you expect the Fed’s decision to be the start of a longer rate-hike cycle, or just a single hike?
#FedRateWatch #Bitcoin #CPI #crypto
Recent U.S. inflation data gave markets an important signal: the CPI rose in August by 0.4% month-on-month, while Core CPI rose by 0.3%, and annual inflation reached 3.4%. This means price pressures are still above the Fed’s 2% target �
Reuters
Therefore, market expectations increased for a 25-basis-point rate hike, and the most important question is no longer only whether the Fed will raise rates, but what it will say about the next steps
For BTC, stocks, and gold, higher rates may mean tighter liquidity conditions and higher bond yields, so we may see strong volatility in high-risk assets
But if the rate hike is already priced in the market, then the real reaction could be tied to the Fed’s tone and its expectations for future decisions
I will monitor BTC, the dollar, and bond yields before making any trading decision, and I won’t chase the first move after the news
Do you expect the Fed’s decision to be the start of a longer rate-hike cycle, or just a single hike?
#FedRateWatch #Bitcoin #CPI #crypto
1
87

·
--
Article
The Fed Is About to Hike a Number the Market Already Paid For. The Real Risk Is DecemberAlmost nobody is arguing about 25 basis points anymore 🤔
Look at the probability chart. A month ago, holding at 3.50–3.75% was the popular bet. A week ago it was a fight. Now the 3.75–4.00% bucket is a wall, close to 94%. That means Wednesday’s decision is not the event. The event is whether the statement treats August inflation as a messy month, or as the first brick of a new tightening cycle.
That distinction is where most posts go flat. They ask “hike or hold?” The market already answered. The tradeable question is: one insurance hike, or the start of a bill that keeps arriving?
The print that looks soft and hard at the same time
August #CPI did something awkward.
Headline rose 0.4% on the month and 3.4% over the year. Core CPI includes food and energy stripped out, rose 0.3% month-over-month versus a 0.2% consensus. The annual core rate still eased to 2.4%, the slowest since 2021.
So you can write two honest headlines from the same release:
“Underlying inflation is the coolest in five years.”“The monthly core run-rate just accelerated.”
The Fed lives in the second sentence. Year-over-year core is a rear-view mirror still digesting older, hotter prints. Officials vote on whether the latest month looks like progress or like a pause that failed. Energy did the loud part: +2.1% on the month, +16.3% over the year. That is not the same animal as 2022 demand-overheating. It is a supply bruise sitting on a labor market that still printed firm payrolls.
A 25bp hike can be rational as insurance. It is a much weaker case as the opening of a multi-meeting campaign — unless the press conference pretends energy is “just inflation” and ignores the source.
Why a fully priced hike still moves risk
If 90% is already in the price, why would Bitcoin, Nasdaq, or gold $XAU care?
Because assets do not reprice the 25bp. They reprice the path.
Tech is duration. A hike that sounds like “we are done after this” is a shrug. A hike that keeps December alive is a valuation haircut. Long-duration names feel language before they feel the funds rate.Gold splits in two. If the story is sticky inflation and messy geopolitics, gold keeps a bid. If the story is higher real rates and a stronger dollar, gold pays the rate tax like everything else.Bitcoin is the awkward guest. Some weeks it still tags along with Nasdaq beta. Other stretches this year it has spent more time walking next to gold. Into a priced hike, the first hour is usually a liquidity squeeze. The second hour is a referendum on whether the Fed sounded finished.
That is why “BTC dumps on hikes” is a lazy rule. BTC dumped in 2022 because the path was many hikes from zero. A single, widely advertised 25bp from 3.50–3.75% is a different machine. The damage lives in the adjective: “ongoing,” “further,” “restrictive for longer.”
One-off versus cycle: A simple test
A cycle needs the Fed to believe demand is the problem.
Watch three things Wednesday, not the vote itself:
Do they call energy a temporary shock or a reason to keep tightening?Does the statement keep “further firming” on the table, or does it go back to data-dependence without a threat?Do the dots show one move, or a staircase?
If it is one-and-done language, the 90% odds were the whole show. Risk can even bid the fact that uncertainty just collapsed. If the dots lean hawkish, the market has to price a second invoice it has only half-written.
What I am doing with Bitcoin
I am not using FOMC as an entry trigger.
I hold $BTC as a multi-year position. The plan is boring on purpose. If the statement is hotter than a fully priced hike and spot gives a cleaner level than the coins I already own, I add on a fixed DCA size. Same rules as any other dip I did not cause. No leverage into the announcement. No “I knew they’d hike” after the fact.
{spot}(BTCUSDT)
The edge this week is not prediction. It is refusing to confuse a 25bp that everyone sees with a cycle that nobody has proven.
Most feeds will celebrate or panic at 2:00 p.m. Eastern. The useful work starts in the paragraph after the decision, the one that tells you whether September was an insurance premium, or the first line of a longer tab.
#FedRateWatch #TrendingTopic
Educational only. Not financial advice. Size for both paths.
The Fed Is About to Hike a Number the Market Already Paid For. The Real Risk Is December
Almost nobody is arguing about 25 basis points anymore 🤔
Look at the probability chart. A month ago, holding at 3.50–3.75% was the popular bet. A week ago it was a fight. Now the 3.75–4.00% bucket is a wall, close to 94%. That means Wednesday’s decision is not the event. The event is whether the statement treats August inflation as a messy month, or as the first brick of a new tightening cycle.
That distinction is where most posts go flat. They ask “hike or hold?” The market already answered. The tradeable question is: one insurance hike, or the start of a bill that keeps arriving?
The print that looks soft and hard at the same time
August #CPI did something awkward.
Headline rose 0.4% on the month and 3.4% over the year. Core CPI includes food and energy stripped out, rose 0.3% month-over-month versus a 0.2% consensus. The annual core rate still eased to 2.4%, the slowest since 2021.
So you can write two honest headlines from the same release:
“Underlying inflation is the coolest in five years.”“The monthly core run-rate just accelerated.”
The Fed lives in the second sentence. Year-over-year core is a rear-view mirror still digesting older, hotter prints. Officials vote on whether the latest month looks like progress or like a pause that failed. Energy did the loud part: +2.1% on the month, +16.3% over the year. That is not the same animal as 2022 demand-overheating. It is a supply bruise sitting on a labor market that still printed firm payrolls.
A 25bp hike can be rational as insurance. It is a much weaker case as the opening of a multi-meeting campaign — unless the press conference pretends energy is “just inflation” and ignores the source.
Why a fully priced hike still moves risk
If 90% is already in the price, why would Bitcoin, Nasdaq, or gold $XAU care?
Because assets do not reprice the 25bp. They reprice the path.
Tech is duration. A hike that sounds like “we are done after this” is a shrug. A hike that keeps December alive is a valuation haircut. Long-duration names feel language before they feel the funds rate.Gold splits in two. If the story is sticky inflation and messy geopolitics, gold keeps a bid. If the story is higher real rates and a stronger dollar, gold pays the rate tax like everything else.Bitcoin is the awkward guest. Some weeks it still tags along with Nasdaq beta. Other stretches this year it has spent more time walking next to gold. Into a priced hike, the first hour is usually a liquidity squeeze. The second hour is a referendum on whether the Fed sounded finished.
That is why “BTC dumps on hikes” is a lazy rule. BTC dumped in 2022 because the path was many hikes from zero. A single, widely advertised 25bp from 3.50–3.75% is a different machine. The damage lives in the adjective: “ongoing,” “further,” “restrictive for longer.”
One-off versus cycle: A simple test
A cycle needs the Fed to believe demand is the problem.
Watch three things Wednesday, not the vote itself:
Do they call energy a temporary shock or a reason to keep tightening?Does the statement keep “further firming” on the table, or does it go back to data-dependence without a threat?Do the dots show one move, or a staircase?
If it is one-and-done language, the 90% odds were the whole show. Risk can even bid the fact that uncertainty just collapsed. If the dots lean hawkish, the market has to price a second invoice it has only half-written.
What I am doing with Bitcoin
I am not using FOMC as an entry trigger.
I hold $BTC as a multi-year position. The plan is boring on purpose. If the statement is hotter than a fully priced hike and spot gives a cleaner level than the coins I already own, I add on a fixed DCA size. Same rules as any other dip I did not cause. No leverage into the announcement. No “I knew they’d hike” after the fact.
The edge this week is not prediction. It is refusing to confuse a 25bp that everyone sees with a cycle that nobody has proven.
Most feeds will celebrate or panic at 2:00 p.m. Eastern. The useful work starts in the paragraph after the decision, the one that tells you whether September was an insurance premium, or the first line of a longer tab.
#FedRateWatch #TrendingTopic
Educational only. Not financial advice. Size for both paths.
Look at the probability chart. A month ago, holding at 3.50–3.75% was the popular bet. A week ago it was a fight. Now the 3.75–4.00% bucket is a wall, close to 94%. That means Wednesday’s decision is not the event. The event is whether the statement treats August inflation as a messy month, or as the first brick of a new tightening cycle.
That distinction is where most posts go flat. They ask “hike or hold?” The market already answered. The tradeable question is: one insurance hike, or the start of a bill that keeps arriving?
The print that looks soft and hard at the same time
August #CPI did something awkward.
Headline rose 0.4% on the month and 3.4% over the year. Core CPI includes food and energy stripped out, rose 0.3% month-over-month versus a 0.2% consensus. The annual core rate still eased to 2.4%, the slowest since 2021.
So you can write two honest headlines from the same release:
“Underlying inflation is the coolest in five years.”“The monthly core run-rate just accelerated.”
The Fed lives in the second sentence. Year-over-year core is a rear-view mirror still digesting older, hotter prints. Officials vote on whether the latest month looks like progress or like a pause that failed. Energy did the loud part: +2.1% on the month, +16.3% over the year. That is not the same animal as 2022 demand-overheating. It is a supply bruise sitting on a labor market that still printed firm payrolls.
A 25bp hike can be rational as insurance. It is a much weaker case as the opening of a multi-meeting campaign — unless the press conference pretends energy is “just inflation” and ignores the source.
Why a fully priced hike still moves risk
If 90% is already in the price, why would Bitcoin, Nasdaq, or gold $XAU care?
Because assets do not reprice the 25bp. They reprice the path.
Tech is duration. A hike that sounds like “we are done after this” is a shrug. A hike that keeps December alive is a valuation haircut. Long-duration names feel language before they feel the funds rate.Gold splits in two. If the story is sticky inflation and messy geopolitics, gold keeps a bid. If the story is higher real rates and a stronger dollar, gold pays the rate tax like everything else.Bitcoin is the awkward guest. Some weeks it still tags along with Nasdaq beta. Other stretches this year it has spent more time walking next to gold. Into a priced hike, the first hour is usually a liquidity squeeze. The second hour is a referendum on whether the Fed sounded finished.
That is why “BTC dumps on hikes” is a lazy rule. BTC dumped in 2022 because the path was many hikes from zero. A single, widely advertised 25bp from 3.50–3.75% is a different machine. The damage lives in the adjective: “ongoing,” “further,” “restrictive for longer.”
One-off versus cycle: A simple test
A cycle needs the Fed to believe demand is the problem.
Watch three things Wednesday, not the vote itself:
Do they call energy a temporary shock or a reason to keep tightening?Does the statement keep “further firming” on the table, or does it go back to data-dependence without a threat?Do the dots show one move, or a staircase?
If it is one-and-done language, the 90% odds were the whole show. Risk can even bid the fact that uncertainty just collapsed. If the dots lean hawkish, the market has to price a second invoice it has only half-written.
What I am doing with Bitcoin
I am not using FOMC as an entry trigger.
I hold $BTC as a multi-year position. The plan is boring on purpose. If the statement is hotter than a fully priced hike and spot gives a cleaner level than the coins I already own, I add on a fixed DCA size. Same rules as any other dip I did not cause. No leverage into the announcement. No “I knew they’d hike” after the fact.
The edge this week is not prediction. It is refusing to confuse a 25bp that everyone sees with a cycle that nobody has proven.
Most feeds will celebrate or panic at 2:00 p.m. Eastern. The useful work starts in the paragraph after the decision, the one that tells you whether September was an insurance premium, or the first line of a longer tab.
#FedRateWatch #TrendingTopic
Educational only. Not financial advice. Size for both paths.
2
245

·
--
📊 August CPI year-on-year 3.4% and month-on-month 0.4%, beating expectations🔥. Inflation is like a kid who won’t get up—no matter how you call, it won’t budge. The old craftsman can only pull out a feather duster🪶 → Inflation’s stickiness means higher rates for longer, and the “liquidity-flood bull market script” for big pie has had a page torn out📜; the stash of copycat coins is already starting to tremble🥶.#cpi
📊 August CPI year-on-year 3.4% and month-on-month 0.4%, beating expectations🔥. Inflation is like a kid who won’t get up—no matter how you call, it won’t budge. The old craftsman can only pull out a feather duster🪶 → Inflation’s stickiness means higher rates for longer, and the “liquidity-flood bull market script” for big pie has had a page torn out📜; the stash of copycat coins is already starting to tremble🥶.#cpi
1
74


🇺🇸 What is the CPI?
CPI are the initials for Consumer Price Index — Consumer Price Index.
🛒 What does it measure? The average change in the prices of the basket of goods and services that a typical consumer buys: groceries, clothing, rent, transportation, services… a bit of everything.
📊 How does it work? The U.S. government compares how much that basket costs today versus a year ago. If it went up by 3.4%, then the annual inflation rate was 3.4%.
👉 Why does it matter? It’s THE inflation thermometer — the number everyone watches (including the Fed) to decide what to do with interest rates
⚠️ This does not constitute financial advice. Cryptocurrencies are volatile. DYOR
#CPI #Inflación #Cripto
🇺🇸 What is the CPI?
CPI are the initials for Consumer Price Index — Consumer Price Index.
🛒 What does it measure? The average change in the prices of the basket of goods and services that a typical consumer buys: groceries, clothing, rent, transportation, services… a bit of everything.
📊 How does it work? The U.S. government compares how much that basket costs today versus a year ago. If it went up by 3.4%, then the annual inflation rate was 3.4%.
👉 Why does it matter? It’s THE inflation thermometer — the number everyone watches (including the Fed) to decide what to do with interest rates
⚠️ This does not constitute financial advice. Cryptocurrencies are volatile. DYOR
#CPI #Inflación #Cripto
CPI are the initials for Consumer Price Index — Consumer Price Index.
🛒 What does it measure? The average change in the prices of the basket of goods and services that a typical consumer buys: groceries, clothing, rent, transportation, services… a bit of everything.
📊 How does it work? The U.S. government compares how much that basket costs today versus a year ago. If it went up by 3.4%, then the annual inflation rate was 3.4%.
👉 Why does it matter? It’s THE inflation thermometer — the number everyone watches (including the Fed) to decide what to do with interest rates
⚠️ This does not constitute financial advice. Cryptocurrencies are volatile. DYOR
#CPI #Inflación #Cripto
4
693

·
--

Article
$100 Oil, Priced-In Hike: Why Crypto Is Deleveraging Ahead of CPICrypto markets are entering an important macro week.
The September rate hike is now largely priced in, but the bigger question for risk assets is no longer simply what the Fed does.
The bigger question is:
Can oil stay above $100?
Brent crude moving above $100 has pushed inflation expectations and long-term bond yields higher. At the same time, crypto flows have weakened, leverage has declined, and options are showing a more defensive market structure.
This does not necessarily mean a major bearish trend has started.
It looks more like defensive consolidation with volatility gradually increasing.
■ 1. Oil Has Become the Bigger Macro Variable
Strong payroll data pushed expectations for tighter monetary policy higher, while geopolitical tensions around the Strait of Hormuz pushed Brent above $100.
That combination matters because expensive energy can keep inflation elevated.
The US 10Y yield moving above 4.8% adds another layer of pressure. Higher yields generally make risk assets less attractive because investors can earn better returns from relatively safer assets.
But there is an important distinction:
The September rate hike is already largely priced in.
So another hike itself may not create a major shock.
The bigger risk is oil remaining above $100 for an extended period.
If Brent pulls back, inflation expectations could ease and pressure on yields could decline.
That would create a much more supportive environment for BTC and other risk assets.
■ 2. Crypto Flows Are Losing Momentum
One of the most interesting developments this week is the simultaneous weakness in two important liquidity channels:
• Spot ETF flows turned negative.
• Stablecoin net issuance also moved negative.
The combined outflow was relatively small, below $500M, but the direction is important.
For several weeks, ETF demand had been providing a marginal bid to Bitcoin.
When that bid disappears, price has to rely more heavily on existing positioning.
This helps explain why BTC has struggled to establish a strong upside move.
■ 3. Leverage Is Coming Out of the Market
Open interest also declined.
BTC market capitalization was down around 2.2% from the previous Friday, while USD-denominated OI fell roughly 3.2%.
The OI/market-cap ratio moved toward 0.034, below the mid-August level around 0.038.
In simple terms:
Traders are reducing leverage.
This is not automatically bearish.
Actually, there can be a positive side to deleveraging.
When excessive leverage leaves the market, the probability of another large liquidation cascade can decrease.
The problem is that leverage leaving the market also means there is currently less aggressive capital pushing prices higher.
So the market becomes quieter, but also more sensitive to the next macro catalyst.
■ 4. Options Are Saying “Be Careful”
Bitcoin volatility has started to increase.
DVOL moved from around 38 to approximately 40.2 while BTC remained relatively range-bound.
That combination is worth watching.
Normally, a stable price with rising implied volatility suggests that traders are paying more for protection against a larger future move.
The put side of the options market has also repriced faster than the call side.
However, 25D risk reversals remain close to neutral.
So this is not strong evidence of an imminent crash.
It is better interpreted as:
The market is becoming more defensive and preparing for larger movement.
■ 5. Why BTC Has Not Collapsed
Despite the macro pressure, BTC has not experienced an additional major discount.
BTC’s two-week decline has broadly tracked equities.
That is important.
If BTC were collapsing significantly faster than traditional risk assets, it would suggest crypto-specific stress.
Instead, the current behavior looks more like a macro-driven risk-off environment.
The marginal buyer has stepped back.
Leverage has already been reduced.
Forced selling appears relatively limited.
And there is not enough fresh demand to create a strong upside breakout.
That is why I would describe the current structure as:
Defensive consolidation, not yet a confirmed trend reversal.
■ 6. The Interesting Part: Alts Are Outperforming BTC
One unusual development is happening underneath the BTC weakness.
BTC was down around 1.7% over the week, while TOTAL3 gained approximately 1.3%.
BTC dominance also declined around 0.7 percentage points.
This means capital has been rotating toward altcoins even while Bitcoin was under pressure.
The sequencing is particularly interesting.
During BTC’s weakness, TOTAL3 continued showing relative strength.
That tells us the alt market has not completely lost risk appetite.
But there is an important condition.
BTC must hold its consolidation structure.
If BTC remains stable, BTC dominance could continue moving toward support around 58, potentially giving alts more room to outperform.
■ 7. CPI Is the Next Major Gate
This is where everything comes together.
A softer-than-expected CPI could reduce pressure on Treasury yields and rate expectations.
That could support BTC, weaken BTC dominance and allow the current altcoin resilience to continue.
But a hotter CPI creates the opposite setup.
Higher inflation expectations could push yields higher again.
If BTC simultaneously loses its key consolidation support, the current altcoin resilience could disappear quickly.
So I would watch the reaction rather than simply the CPI number itself.
Soft CPI + BTC holds support = constructive
Hot CPI + BTC breaks support = defensive/risk-off
■ My Market Take
The current market does not look like a clean bullish breakout environment.
But it also does not yet look like a confirmed major bearish reversal.
The key variables are:
■ Oil: Does Brent remain above $100?
■ Yields: Does the US 10Y continue climbing above 4.8%?
■ Flows: Do ETF and stablecoin outflows continue?
■ Leverage: Does OI keep falling?
■ BTC: Can price hold its consolidation range?
■ BTC.D: Can dominance continue declining?
■ CPI: Does inflation provide relief or add another layer of pressure?
For me, oil is currently the macro variable to watch first, while CPI is the immediate catalyst.
If oil retreats and CPI comes in soft, the market could quickly shift from defensive consolidation toward risk-on positioning.
If oil stays above $100 and CPI is hot, the pressure on yields and crypto could increase.
Until that confirmation arrives, the cleaner approach is to respect the range, avoid excessive leverage and let price action confirm the next direction.
#Bitcoin #CryptoMarket #CPI #ArifAlpha
{spot}(BTCUSDT)
{future}(BZUSDT)
$100 Oil, Priced-In Hike: Why Crypto Is Deleveraging Ahead of CPI
Crypto markets are entering an important macro week.
The September rate hike is now largely priced in, but the bigger question for risk assets is no longer simply what the Fed does.
The bigger question is:
Can oil stay above $100?
Brent crude moving above $100 has pushed inflation expectations and long-term bond yields higher. At the same time, crypto flows have weakened, leverage has declined, and options are showing a more defensive market structure.
This does not necessarily mean a major bearish trend has started.
It looks more like defensive consolidation with volatility gradually increasing.
■ 1. Oil Has Become the Bigger Macro Variable
Strong payroll data pushed expectations for tighter monetary policy higher, while geopolitical tensions around the Strait of Hormuz pushed Brent above $100.
That combination matters because expensive energy can keep inflation elevated.
The US 10Y yield moving above 4.8% adds another layer of pressure. Higher yields generally make risk assets less attractive because investors can earn better returns from relatively safer assets.
But there is an important distinction:
The September rate hike is already largely priced in.
So another hike itself may not create a major shock.
The bigger risk is oil remaining above $100 for an extended period.
If Brent pulls back, inflation expectations could ease and pressure on yields could decline.
That would create a much more supportive environment for BTC and other risk assets.
■ 2. Crypto Flows Are Losing Momentum
One of the most interesting developments this week is the simultaneous weakness in two important liquidity channels:
• Spot ETF flows turned negative.
• Stablecoin net issuance also moved negative.
The combined outflow was relatively small, below $500M, but the direction is important.
For several weeks, ETF demand had been providing a marginal bid to Bitcoin.
When that bid disappears, price has to rely more heavily on existing positioning.
This helps explain why BTC has struggled to establish a strong upside move.
■ 3. Leverage Is Coming Out of the Market
Open interest also declined.
BTC market capitalization was down around 2.2% from the previous Friday, while USD-denominated OI fell roughly 3.2%.
The OI/market-cap ratio moved toward 0.034, below the mid-August level around 0.038.
In simple terms:
Traders are reducing leverage.
This is not automatically bearish.
Actually, there can be a positive side to deleveraging.
When excessive leverage leaves the market, the probability of another large liquidation cascade can decrease.
The problem is that leverage leaving the market also means there is currently less aggressive capital pushing prices higher.
So the market becomes quieter, but also more sensitive to the next macro catalyst.
■ 4. Options Are Saying “Be Careful”
Bitcoin volatility has started to increase.
DVOL moved from around 38 to approximately 40.2 while BTC remained relatively range-bound.
That combination is worth watching.
Normally, a stable price with rising implied volatility suggests that traders are paying more for protection against a larger future move.
The put side of the options market has also repriced faster than the call side.
However, 25D risk reversals remain close to neutral.
So this is not strong evidence of an imminent crash.
It is better interpreted as:
The market is becoming more defensive and preparing for larger movement.
■ 5. Why BTC Has Not Collapsed
Despite the macro pressure, BTC has not experienced an additional major discount.
BTC’s two-week decline has broadly tracked equities.
That is important.
If BTC were collapsing significantly faster than traditional risk assets, it would suggest crypto-specific stress.
Instead, the current behavior looks more like a macro-driven risk-off environment.
The marginal buyer has stepped back.
Leverage has already been reduced.
Forced selling appears relatively limited.
And there is not enough fresh demand to create a strong upside breakout.
That is why I would describe the current structure as:
Defensive consolidation, not yet a confirmed trend reversal.
■ 6. The Interesting Part: Alts Are Outperforming BTC
One unusual development is happening underneath the BTC weakness.
BTC was down around 1.7% over the week, while TOTAL3 gained approximately 1.3%.
BTC dominance also declined around 0.7 percentage points.
This means capital has been rotating toward altcoins even while Bitcoin was under pressure.
The sequencing is particularly interesting.
During BTC’s weakness, TOTAL3 continued showing relative strength.
That tells us the alt market has not completely lost risk appetite.
But there is an important condition.
BTC must hold its consolidation structure.
If BTC remains stable, BTC dominance could continue moving toward support around 58, potentially giving alts more room to outperform.
■ 7. CPI Is the Next Major Gate
This is where everything comes together.
A softer-than-expected CPI could reduce pressure on Treasury yields and rate expectations.
That could support BTC, weaken BTC dominance and allow the current altcoin resilience to continue.
But a hotter CPI creates the opposite setup.
Higher inflation expectations could push yields higher again.
If BTC simultaneously loses its key consolidation support, the current altcoin resilience could disappear quickly.
So I would watch the reaction rather than simply the CPI number itself.
Soft CPI + BTC holds support = constructive
Hot CPI + BTC breaks support = defensive/risk-off
■ My Market Take
The current market does not look like a clean bullish breakout environment.
But it also does not yet look like a confirmed major bearish reversal.
The key variables are:
■ Oil: Does Brent remain above $100?
■ Yields: Does the US 10Y continue climbing above 4.8%?
■ Flows: Do ETF and stablecoin outflows continue?
■ Leverage: Does OI keep falling?
■ BTC: Can price hold its consolidation range?
■ BTC.D: Can dominance continue declining?
■ CPI: Does inflation provide relief or add another layer of pressure?
For me, oil is currently the macro variable to watch first, while CPI is the immediate catalyst.
If oil retreats and CPI comes in soft, the market could quickly shift from defensive consolidation toward risk-on positioning.
If oil stays above $100 and CPI is hot, the pressure on yields and crypto could increase.
Until that confirmation arrives, the cleaner approach is to respect the range, avoid excessive leverage and let price action confirm the next direction.
#Bitcoin #CryptoMarket #CPI #ArifAlpha
The September rate hike is now largely priced in, but the bigger question for risk assets is no longer simply what the Fed does.
The bigger question is:
Can oil stay above $100?
Brent crude moving above $100 has pushed inflation expectations and long-term bond yields higher. At the same time, crypto flows have weakened, leverage has declined, and options are showing a more defensive market structure.
This does not necessarily mean a major bearish trend has started.
It looks more like defensive consolidation with volatility gradually increasing.
■ 1. Oil Has Become the Bigger Macro Variable
Strong payroll data pushed expectations for tighter monetary policy higher, while geopolitical tensions around the Strait of Hormuz pushed Brent above $100.
That combination matters because expensive energy can keep inflation elevated.
The US 10Y yield moving above 4.8% adds another layer of pressure. Higher yields generally make risk assets less attractive because investors can earn better returns from relatively safer assets.
But there is an important distinction:
The September rate hike is already largely priced in.
So another hike itself may not create a major shock.
The bigger risk is oil remaining above $100 for an extended period.
If Brent pulls back, inflation expectations could ease and pressure on yields could decline.
That would create a much more supportive environment for BTC and other risk assets.
■ 2. Crypto Flows Are Losing Momentum
One of the most interesting developments this week is the simultaneous weakness in two important liquidity channels:
• Spot ETF flows turned negative.
• Stablecoin net issuance also moved negative.
The combined outflow was relatively small, below $500M, but the direction is important.
For several weeks, ETF demand had been providing a marginal bid to Bitcoin.
When that bid disappears, price has to rely more heavily on existing positioning.
This helps explain why BTC has struggled to establish a strong upside move.
■ 3. Leverage Is Coming Out of the Market
Open interest also declined.
BTC market capitalization was down around 2.2% from the previous Friday, while USD-denominated OI fell roughly 3.2%.
The OI/market-cap ratio moved toward 0.034, below the mid-August level around 0.038.
In simple terms:
Traders are reducing leverage.
This is not automatically bearish.
Actually, there can be a positive side to deleveraging.
When excessive leverage leaves the market, the probability of another large liquidation cascade can decrease.
The problem is that leverage leaving the market also means there is currently less aggressive capital pushing prices higher.
So the market becomes quieter, but also more sensitive to the next macro catalyst.
■ 4. Options Are Saying “Be Careful”
Bitcoin volatility has started to increase.
DVOL moved from around 38 to approximately 40.2 while BTC remained relatively range-bound.
That combination is worth watching.
Normally, a stable price with rising implied volatility suggests that traders are paying more for protection against a larger future move.
The put side of the options market has also repriced faster than the call side.
However, 25D risk reversals remain close to neutral.
So this is not strong evidence of an imminent crash.
It is better interpreted as:
The market is becoming more defensive and preparing for larger movement.
■ 5. Why BTC Has Not Collapsed
Despite the macro pressure, BTC has not experienced an additional major discount.
BTC’s two-week decline has broadly tracked equities.
That is important.
If BTC were collapsing significantly faster than traditional risk assets, it would suggest crypto-specific stress.
Instead, the current behavior looks more like a macro-driven risk-off environment.
The marginal buyer has stepped back.
Leverage has already been reduced.
Forced selling appears relatively limited.
And there is not enough fresh demand to create a strong upside breakout.
That is why I would describe the current structure as:
Defensive consolidation, not yet a confirmed trend reversal.
■ 6. The Interesting Part: Alts Are Outperforming BTC
One unusual development is happening underneath the BTC weakness.
BTC was down around 1.7% over the week, while TOTAL3 gained approximately 1.3%.
BTC dominance also declined around 0.7 percentage points.
This means capital has been rotating toward altcoins even while Bitcoin was under pressure.
The sequencing is particularly interesting.
During BTC’s weakness, TOTAL3 continued showing relative strength.
That tells us the alt market has not completely lost risk appetite.
But there is an important condition.
BTC must hold its consolidation structure.
If BTC remains stable, BTC dominance could continue moving toward support around 58, potentially giving alts more room to outperform.
■ 7. CPI Is the Next Major Gate
This is where everything comes together.
A softer-than-expected CPI could reduce pressure on Treasury yields and rate expectations.
That could support BTC, weaken BTC dominance and allow the current altcoin resilience to continue.
But a hotter CPI creates the opposite setup.
Higher inflation expectations could push yields higher again.
If BTC simultaneously loses its key consolidation support, the current altcoin resilience could disappear quickly.
So I would watch the reaction rather than simply the CPI number itself.
Soft CPI + BTC holds support = constructive
Hot CPI + BTC breaks support = defensive/risk-off
■ My Market Take
The current market does not look like a clean bullish breakout environment.
But it also does not yet look like a confirmed major bearish reversal.
The key variables are:
■ Oil: Does Brent remain above $100?
■ Yields: Does the US 10Y continue climbing above 4.8%?
■ Flows: Do ETF and stablecoin outflows continue?
■ Leverage: Does OI keep falling?
■ BTC: Can price hold its consolidation range?
■ BTC.D: Can dominance continue declining?
■ CPI: Does inflation provide relief or add another layer of pressure?
For me, oil is currently the macro variable to watch first, while CPI is the immediate catalyst.
If oil retreats and CPI comes in soft, the market could quickly shift from defensive consolidation toward risk-on positioning.
If oil stays above $100 and CPI is hot, the pressure on yields and crypto could increase.
Until that confirmation arrives, the cleaner approach is to respect the range, avoid excessive leverage and let price action confirm the next direction.
#Bitcoin #CryptoMarket #CPI #ArifAlpha
153

·
--
Verified
🔥 Will the Federal Reserve raise interest rates this week?
And what impact will it have on the markets?
📈 The core Consumer Price Index (CPI) rose in August by 0.3% month-on-month, while odds of a 25-basis-point rate hike this week have moved closer to 90%.
🤔 The most important question: Are we looking at a single rate hike, or the start of a longer cycle of monetary tightening?
If a hike happens, we may see downward pressure on BTC and technology stocks, due to higher borrowing costs and a reduced appetite for risk. As for gold, it may face temporary pressure—especially if bond yields and the US dollar rise.
🦅 As a trader, what is my trading plan?
👇 Here’s the answer 👇
1- I won’t rush after the market’s first move. I’ll wait for the decision to be issued, then I’ll monitor Bitcoin’s and the US dollar’s reaction, along with bond yields.
2- For Bitcoin: if it holds its support and strong demand appears, I’ll look for a gradual entry with a clear stop-loss. But if support breaks, I’ll wait for price stabilization instead of chasing the downside.
3- Technology stocks: I’ll monitor them cautiously, because higher rates may weigh on growth stocks. I won’t buy until a technical signal appears that confirms buyers’ strength.
4- Gold: I’ll watch how price reacts to the US dollar and yields. If there’s a temporary pullback while the overall trend remains strong, I may look for a well-considered buying opportunity.
.
$XAU $BTC
{spot}(BTCUSDT)
{future}(XAUUSDT)
{spot}(XAUTUSDT)
.
.
#CPI #Fed
#美联储加息是否已成定局
#FedRateWatch
🔥 Will the Federal Reserve raise interest rates this week?
And what impact will it have on the markets?
📈 The core Consumer Price Index (CPI) rose in August by 0.3% month-on-month, while odds of a 25-basis-point rate hike this week have moved closer to 90%.
🤔 The most important question: Are we looking at a single rate hike, or the start of a longer cycle of monetary tightening?
If a hike happens, we may see downward pressure on BTC and technology stocks, due to higher borrowing costs and a reduced appetite for risk. As for gold, it may face temporary pressure—especially if bond yields and the US dollar rise.
🦅 As a trader, what is my trading plan?
👇 Here’s the answer 👇
1- I won’t rush after the market’s first move. I’ll wait for the decision to be issued, then I’ll monitor Bitcoin’s and the US dollar’s reaction, along with bond yields.
2- For Bitcoin: if it holds its support and strong demand appears, I’ll look for a gradual entry with a clear stop-loss. But if support breaks, I’ll wait for price stabilization instead of chasing the downside.
3- Technology stocks: I’ll monitor them cautiously, because higher rates may weigh on growth stocks. I won’t buy until a technical signal appears that confirms buyers’ strength.
4- Gold: I’ll watch how price reacts to the US dollar and yields. If there’s a temporary pullback while the overall trend remains strong, I may look for a well-considered buying opportunity.
.
$XAU $BTC
.
.
#CPI #Fed
#美联储加息是否已成定局
#FedRateWatch
And what impact will it have on the markets?
📈 The core Consumer Price Index (CPI) rose in August by 0.3% month-on-month, while odds of a 25-basis-point rate hike this week have moved closer to 90%.
🤔 The most important question: Are we looking at a single rate hike, or the start of a longer cycle of monetary tightening?
If a hike happens, we may see downward pressure on BTC and technology stocks, due to higher borrowing costs and a reduced appetite for risk. As for gold, it may face temporary pressure—especially if bond yields and the US dollar rise.
🦅 As a trader, what is my trading plan?
👇 Here’s the answer 👇
1- I won’t rush after the market’s first move. I’ll wait for the decision to be issued, then I’ll monitor Bitcoin’s and the US dollar’s reaction, along with bond yields.
2- For Bitcoin: if it holds its support and strong demand appears, I’ll look for a gradual entry with a clear stop-loss. But if support breaks, I’ll wait for price stabilization instead of chasing the downside.
3- Technology stocks: I’ll monitor them cautiously, because higher rates may weigh on growth stocks. I won’t buy until a technical signal appears that confirms buyers’ strength.
4- Gold: I’ll watch how price reacts to the US dollar and yields. If there’s a temporary pullback while the overall trend remains strong, I may look for a well-considered buying opportunity.
.
$XAU $BTC
.
.
#CPI #Fed
#美联储加息是否已成定局
#FedRateWatch

3
376
·
--
Article
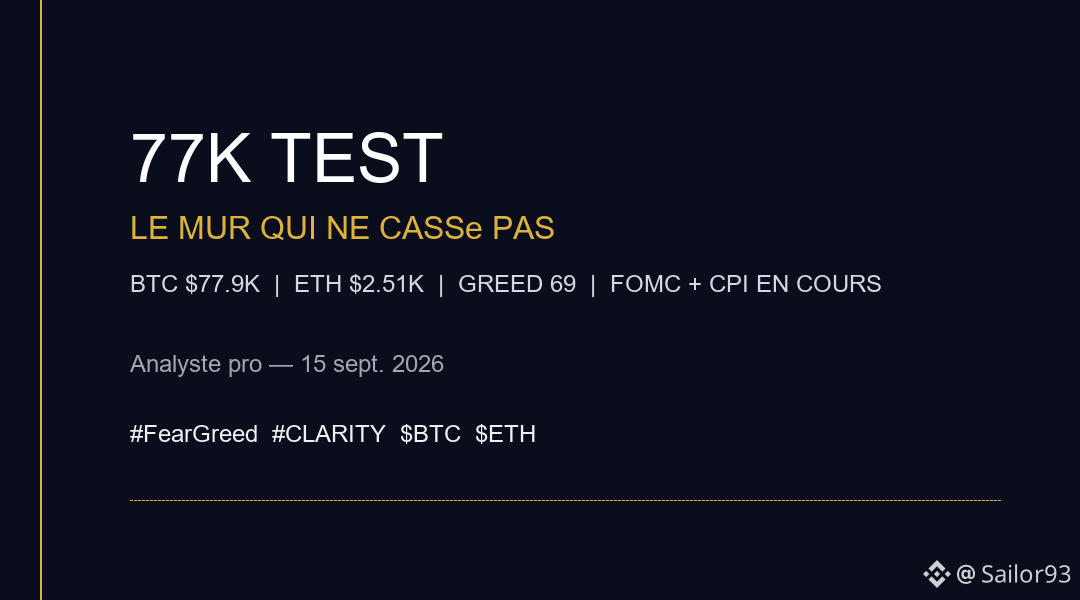
77K TEST — The wall that doesn’t break77K TEST — THE WALL THAT DOESN’T BREAK
BTC 7,983 (+1.6% / 24h) — ETH 514 (+1.3%) — total volume $1.8B. Fear & Greed: 69 (Greed). This isn’t euphoria—it's armed consolidation.
• 77 000 $ reinvest. 50-day EMA ~72.7 K, 200-day ~72.9 K: the cushion is thick. But the MACD is negative and the RSI is slipping back toward 58—no immediate breakout.
• August CPI 3.4% YoY / Core 2.4% (lowest in 5 years). Goldman revised: +25 bps FOMC Sep 15-16 expected probability ~90% bearish. TL / dollar stronger = BTC pressure.
77K TEST — The wall that doesn’t break
77K TEST — THE WALL THAT DOESN’T BREAK
BTC 7,983 (+1.6% / 24h) — ETH 514 (+1.3%) — total volume $1.8B. Fear & Greed: 69 (Greed). This isn’t euphoria—it's armed consolidation.
• 77 000 $ reinvest. 50-day EMA ~72.7 K, 200-day ~72.9 K: the cushion is thick. But the MACD is negative and the RSI is slipping back toward 58—no immediate breakout.
• August CPI 3.4% YoY / Core 2.4% (lowest in 5 years). Goldman revised: +25 bps FOMC Sep 15-16 expected probability ~90% bearish. TL / dollar stronger = BTC pressure.
BTC 7,983 (+1.6% / 24h) — ETH 514 (+1.3%) — total volume $1.8B. Fear & Greed: 69 (Greed). This isn’t euphoria—it's armed consolidation.
• 77 000 $ reinvest. 50-day EMA ~72.7 K, 200-day ~72.9 K: the cushion is thick. But the MACD is negative and the RSI is slipping back toward 58—no immediate breakout.
• August CPI 3.4% YoY / Core 2.4% (lowest in 5 years). Goldman revised: +25 bps FOMC Sep 15-16 expected probability ~90% bearish. TL / dollar stronger = BTC pressure.
7

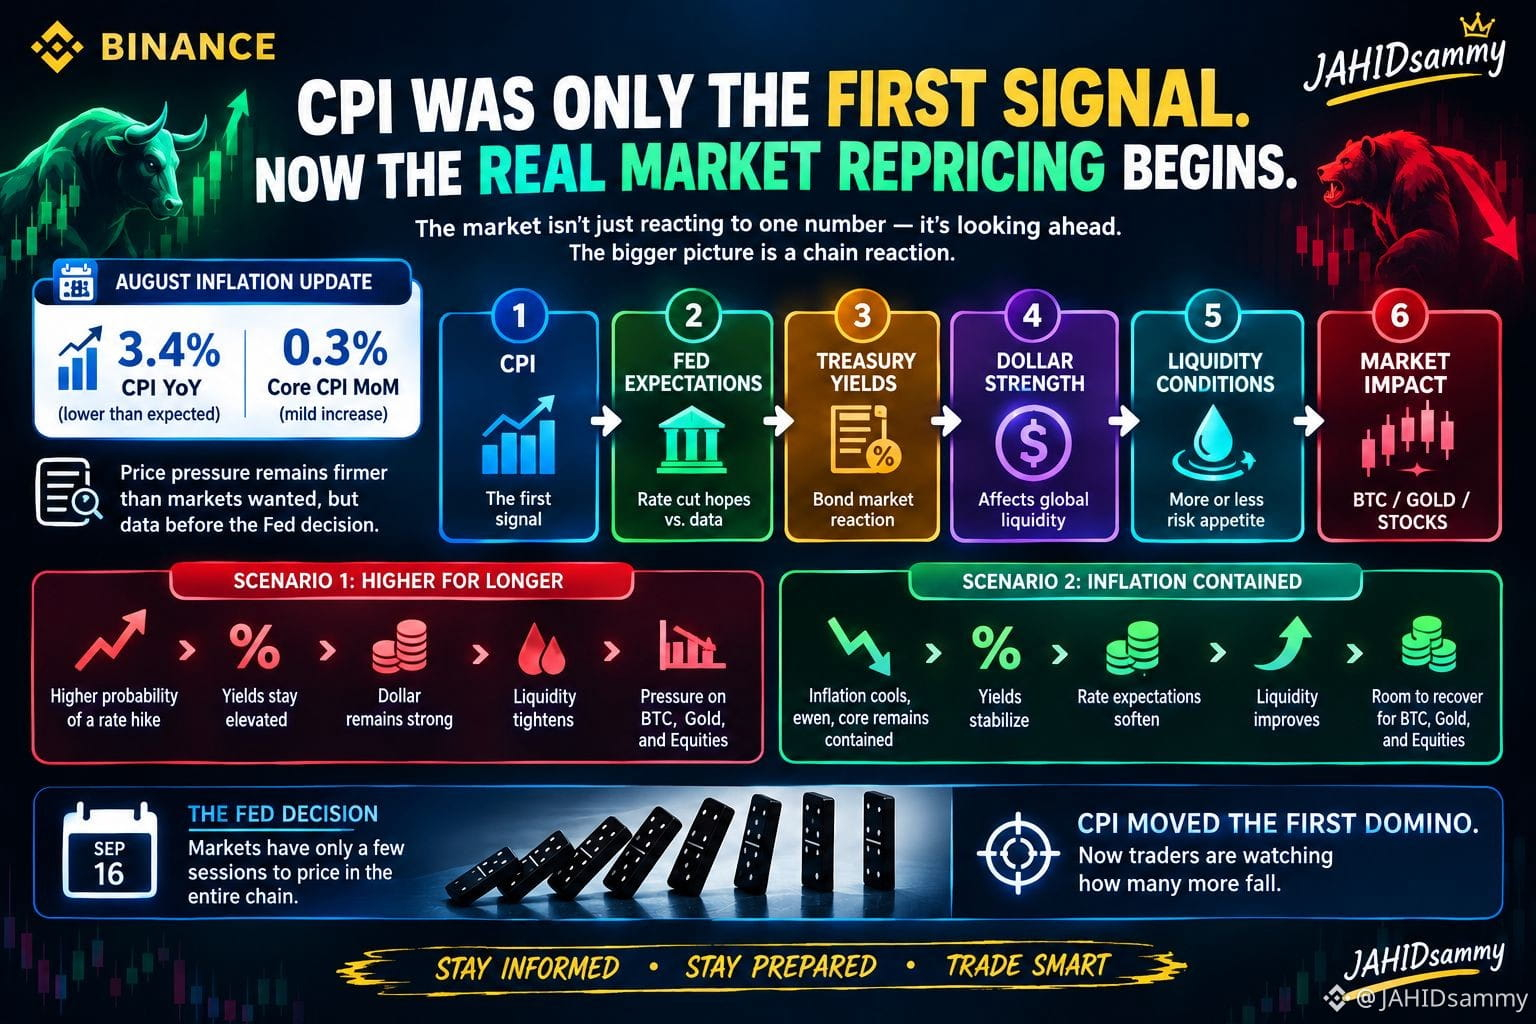
🔥 CPI was only the first signal — now the real market repricing begins.
Inflation → Fed expectations → Treasury yields → Dollar strength → Liquidity → BTC, Gold & Stocks 📊
Which scenario do you think comes next: Higher for Longer or Inflation Contained? 👇
#Bitcoin #BTC #Crypto #CPI #Fed #Inflation #MarketAnalysis #FedHikeOddsRiseTo89% inance #JAHIDsammy
🔥 CPI was only the first signal — now the real market repricing begins.
Inflation → Fed expectations → Treasury yields → Dollar strength → Liquidity → BTC, Gold & Stocks 📊
Which scenario do you think comes next: Higher for Longer or Inflation Contained? 👇
#Bitcoin #BTC #Crypto #CPI #Fed #Inflation #MarketAnalysis #FedHikeOddsRiseTo89% inance #JAHIDsammy
Inflation → Fed expectations → Treasury yields → Dollar strength → Liquidity → BTC, Gold & Stocks 📊
Which scenario do you think comes next: Higher for Longer or Inflation Contained? 👇
#Bitcoin #BTC #Crypto #CPI #Fed #Inflation #MarketAnalysis #FedHikeOddsRiseTo89% inance #JAHIDsammy
216

·
--
Bearish
🌡️ CPI — the good news and the hidden warning
The headline numbers looked reassuring. CPI came in at 3.4% YoY — exactly as expected, unchanged from July. Core CPI dropped to 2.4% YoY — the lowest level since February 2026. Inflation excluding food and energy is genuinely approaching the Fed's 2% target. That is real progress and the market noticed — $BTC initially dumped then recovered back above $77,000 within the same hour. 👀
But here is what most posts won't tell you. The monthly core CPI came in at 0.3% — above the 0.2% consensus. Every single analyst forecast was between 0.16% and 0.24%. The actual came in at 0.29% — beating the entire forecast range. At an annualised pace that is 3.5% — well above the Fed's target. Shelter, airfares, education and used cars led the acceleration. The annual number looks good. The monthly number does not. 🧠
✅ CPI YoY: 3.4% — in line with forecast
✅ Core CPI YoY: 2.4% — lowest since February, approaching 2% target
⚠️ Core CPI MoM: 0.3% — above 0.2% consensus, beat entire forecast range
⚠️ Annualised monthly pace: 3.5% — not consistent with 2% target
🏠 Shelter, airfares, education: all accelerating this month
#cpi #dyor #inflation #corecpi
{future}(BTCUSDT)
{future}(ETHUSDT)
{future}(BNBUSDT)
🌡️ CPI — the good news and the hidden warning
The headline numbers looked reassuring. CPI came in at 3.4% YoY — exactly as expected, unchanged from July. Core CPI dropped to 2.4% YoY — the lowest level since February 2026. Inflation excluding food and energy is genuinely approaching the Fed's 2% target. That is real progress and the market noticed — $BTC initially dumped then recovered back above $77,000 within the same hour. 👀
But here is what most posts won't tell you. The monthly core CPI came in at 0.3% — above the 0.2% consensus. Every single analyst forecast was between 0.16% and 0.24%. The actual came in at 0.29% — beating the entire forecast range. At an annualised pace that is 3.5% — well above the Fed's target. Shelter, airfares, education and used cars led the acceleration. The annual number looks good. The monthly number does not. 🧠
✅ CPI YoY: 3.4% — in line with forecast
✅ Core CPI YoY: 2.4% — lowest since February, approaching 2% target
⚠️ Core CPI MoM: 0.3% — above 0.2% consensus, beat entire forecast range
⚠️ Annualised monthly pace: 3.5% — not consistent with 2% target
🏠 Shelter, airfares, education: all accelerating this month
#cpi #dyor #inflation #corecpi
The headline numbers looked reassuring. CPI came in at 3.4% YoY — exactly as expected, unchanged from July. Core CPI dropped to 2.4% YoY — the lowest level since February 2026. Inflation excluding food and energy is genuinely approaching the Fed's 2% target. That is real progress and the market noticed — $BTC initially dumped then recovered back above $77,000 within the same hour. 👀
But here is what most posts won't tell you. The monthly core CPI came in at 0.3% — above the 0.2% consensus. Every single analyst forecast was between 0.16% and 0.24%. The actual came in at 0.29% — beating the entire forecast range. At an annualised pace that is 3.5% — well above the Fed's target. Shelter, airfares, education and used cars led the acceleration. The annual number looks good. The monthly number does not. 🧠
✅ CPI YoY: 3.4% — in line with forecast
✅ Core CPI YoY: 2.4% — lowest since February, approaching 2% target
⚠️ Core CPI MoM: 0.3% — above 0.2% consensus, beat entire forecast range
⚠️ Annualised monthly pace: 3.5% — not consistent with 2% target
🏠 Shelter, airfares, education: all accelerating this month
#cpi #dyor #inflation #corecpi
53
·
--
Bearish
🔑 week in short
$BTC 📉 $79,200 → $76,300 — controlled consolidation after +22% 😮💨
✅ Core CPI YoY: 2.4% — real progress toward 2% target
⚠️ Core CPI MoM: 0.3% — beat entire forecast range, too hot
🚨 PPI YoY: 5.4% — pipeline hot, more inflation coming
🛢️ Brent: $111 — Houthis attacking Saudi infrastructure again
🚨 Rate hike probability: 85% — September 15-16 FOMC
📅 Next: FOMC September 15-16 — most important Fed decision of 2026
The good news is real — core CPI at 2.4% is the best reading since the war started. The bad news is also real — the monthly acceleration and PPI pipeline mean that improvement may not last. $BTC absorbed both messages and closed at $76,300 — still 20% above where it was three weeks ago. FOMC September 15-16 is now 4 days away. With rate hike probability at 85% — the market is not pricing a hold. It is pricing a hike. If Warsh surprises and holds — $BTC could explode toward $85K. If he hikes — $BTC tests $70K support. The most binary Fed decision of
2026 is days away. 🎯
#CPI #PPI #FOMC #DYOR
{future}(BTCUSDT)
{future}(XAGUSDT)
{future}(XAUUSDT)
🔑 week in short
$BTC 📉 $79,200 → $76,300 — controlled consolidation after +22% 😮💨
✅ Core CPI YoY: 2.4% — real progress toward 2% target
⚠️ Core CPI MoM: 0.3% — beat entire forecast range, too hot
🚨 PPI YoY: 5.4% — pipeline hot, more inflation coming
🛢️ Brent: $111 — Houthis attacking Saudi infrastructure again
🚨 Rate hike probability: 85% — September 15-16 FOMC
📅 Next: FOMC September 15-16 — most important Fed decision of 2026
The good news is real — core CPI at 2.4% is the best reading since the war started. The bad news is also real — the monthly acceleration and PPI pipeline mean that improvement may not last. $BTC absorbed both messages and closed at $76,300 — still 20% above where it was three weeks ago. FOMC September 15-16 is now 4 days away. With rate hike probability at 85% — the market is not pricing a hold. It is pricing a hike. If Warsh surprises and holds — $BTC could explode toward $85K. If he hikes — $BTC tests $70K support. The most binary Fed decision of
2026 is days away. 🎯
#CPI #PPI #FOMC #DYOR
$BTC 📉 $79,200 → $76,300 — controlled consolidation after +22% 😮💨
✅ Core CPI YoY: 2.4% — real progress toward 2% target
⚠️ Core CPI MoM: 0.3% — beat entire forecast range, too hot
🚨 PPI YoY: 5.4% — pipeline hot, more inflation coming
🛢️ Brent: $111 — Houthis attacking Saudi infrastructure again
🚨 Rate hike probability: 85% — September 15-16 FOMC
📅 Next: FOMC September 15-16 — most important Fed decision of 2026
The good news is real — core CPI at 2.4% is the best reading since the war started. The bad news is also real — the monthly acceleration and PPI pipeline mean that improvement may not last. $BTC absorbed both messages and closed at $76,300 — still 20% above where it was three weeks ago. FOMC September 15-16 is now 4 days away. With rate hike probability at 85% — the market is not pricing a hold. It is pricing a hike. If Warsh surprises and holds — $BTC could explode toward $85K. If he hikes — $BTC tests $70K support. The most binary Fed decision of
2026 is days away. 🎯
#CPI #PPI #FOMC #DYOR
266
·
--
CPI RATE HIKE IMMINENTTHE TRAP AT 76K: BTC JAMMED, ETH EXPLODES, AND THE MARKET IS WAITING FOR THE FOMC LIKE A VERDICT.
The CPI just came out: 3.4% YoY, core CPI 0.3% (above expectations). FedWatch gives a 88% probability of a 25bps rate hike at the FOMC on September 16. Immediate outcome: BTC drops below 77K, ETH breaks 2,531 (+2.18%), and $665M in liquidations swept the market—$250M of that on ETH alone.
• stuck between the 76K support and the 79.5K resistance. The whales haven’t moved in a week (5.23M BTC)—they’re waiting for the FOMC. A soft CPI opens 82.3K; a hot print puts the 78K cluster at risk.
CPI RATE HIKE IMMINENT
THE TRAP AT 76K: BTC JAMMED, ETH EXPLODES, AND THE MARKET IS WAITING FOR THE FOMC LIKE A VERDICT.
The CPI just came out: 3.4% YoY, core CPI 0.3% (above expectations). FedWatch gives a 88% probability of a 25bps rate hike at the FOMC on September 16. Immediate outcome: BTC drops below 77K, ETH breaks 2,531 (+2.18%), and $665M in liquidations swept the market—$250M of that on ETH alone.
• stuck between the 76K support and the 79.5K resistance. The whales haven’t moved in a week (5.23M BTC)—they’re waiting for the FOMC. A soft CPI opens 82.3K; a hot print puts the 78K cluster at risk.
The CPI just came out: 3.4% YoY, core CPI 0.3% (above expectations). FedWatch gives a 88% probability of a 25bps rate hike at the FOMC on September 16. Immediate outcome: BTC drops below 77K, ETH breaks 2,531 (+2.18%), and $665M in liquidations swept the market—$250M of that on ETH alone.
• stuck between the 76K support and the 79.5K resistance. The whales haven’t moved in a week (5.23M BTC)—they’re waiting for the FOMC. A soft CPI opens 82.3K; a hot print puts the 78K cluster at risk.
57

·
--
🔥 CPI hits hard—by September, the rate-hike probability has surged to 90%!
August CPI again came in hotter than expected. The core month-over-month rose 0.3%, directly slapping market expectations. Overnight, traders pushed the rate-hike odds from 70% to 90%. BTC is holding up though—after dipping to 76,000 it was bought back, and it’s now hovering around 78,000. XRP is up 8%, SOL is up 3%. The only pain is that in the past 24 hours, 80,000 people were liquidated—ouch.
FOMC tomorrow just after midnight is a make-or-break moment. Above 82,000, $1.95 billion in short positions are waiting to get liquidated. If 76,000 breaks, leveraged longs will be swept away. Volatility is squeezed to the limit—don’t go all-in tonight. Getting hit on both sides isn’t worth it.
#BTC #美联储 #CPI
🔥 CPI hits hard—by September, the rate-hike probability has surged to 90%!
August CPI again came in hotter than expected. The core month-over-month rose 0.3%, directly slapping market expectations. Overnight, traders pushed the rate-hike odds from 70% to 90%. BTC is holding up though—after dipping to 76,000 it was bought back, and it’s now hovering around 78,000. XRP is up 8%, SOL is up 3%. The only pain is that in the past 24 hours, 80,000 people were liquidated—ouch.
FOMC tomorrow just after midnight is a make-or-break moment. Above 82,000, $1.95 billion in short positions are waiting to get liquidated. If 76,000 breaks, leveraged longs will be swept away. Volatility is squeezed to the limit—don’t go all-in tonight. Getting hit on both sides isn’t worth it.
#BTC #美联储 #CPI
August CPI again came in hotter than expected. The core month-over-month rose 0.3%, directly slapping market expectations. Overnight, traders pushed the rate-hike odds from 70% to 90%. BTC is holding up though—after dipping to 76,000 it was bought back, and it’s now hovering around 78,000. XRP is up 8%, SOL is up 3%. The only pain is that in the past 24 hours, 80,000 people were liquidated—ouch.
FOMC tomorrow just after midnight is a make-or-break moment. Above 82,000, $1.95 billion in short positions are waiting to get liquidated. If 76,000 breaks, leveraged longs will be swept away. Volatility is squeezed to the limit—don’t go all-in tonight. Getting hit on both sides isn’t worth it.
#BTC #美联储 #CPI
213

Log in to explore more content
Join global crypto users on Binance Square
⚡️ Get latest and useful information about crypto.
💬 Trusted by the world’s largest crypto exchange.
👍 Discover real insights from verified creators.
Email / Phone number
Trending Topics
1
#BitcoinSpotETFsNetInflow$191M
775 views
74 Discussing
2
#CFTCUpdatesGuidanceOnTokenizedAssets
11,442 views
559 Discussing
3
#BitgetSays$352MAffectedInHack
2,585 views
39 Discussing
4
#BinanceWillListHyperliquid(HYPE)
196,761 views
3,148 Discussing
5
#BrazilOrdersReportingOf$10KSelfCustodyTransfers
952 views
41 Discussing
6
#FedProposesRulesForBankIssuedStablecoins
11,547 views
405 Discussing
7
#OndoFinanceSoughtSaleAfterFoundersDeath
7,900 views
266 Discussing
8
#FedOctoberRateHikeOddsRiseTo69.7%
77,644 views
1,370 Discussing
9
#BitcoinFallsBelow$83,000
5,131 views
19 Discussing
10
#BitcoinFallsToAround$84,600ThisWeek
0 views
0 Discussing