
MIH imtiaj
418 Posts

MIH imtiaj
Report
Block User
636 Following
183 Followers
993 Liked
Posts
·
--
Article
$TRUMP Can Touch $77 Again? 🤑From $2 to $77 — Is a Massive Comeback Still Possible?
Can $TRUMP touch $77 again?
This question is no longer just about a meme coin price target. It is really about how liquidity, market cycles, narrative, demand, and token supply can interact to create an extreme move.
TRUMP once traded near the $77 area. But the market environment is completely different today.
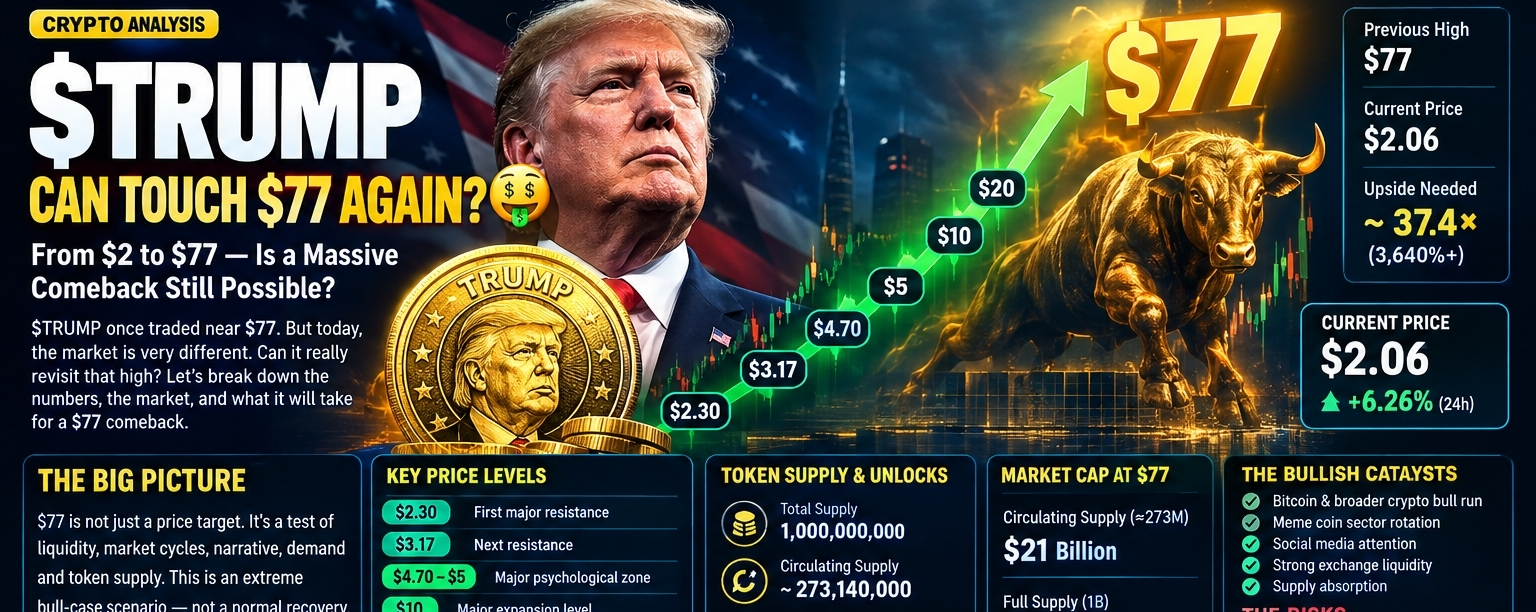
As of September 18, 2026, Official TRUMP is trading around $2.06, with the token up roughly 6.26% over 24 hours and trading near its recent 30-day high. In the current structure, around $1.52 has acted as an important support area, while $2.30 is a key resistance level.
So the real question is:
$2 → $77 — impossible, or could another massive crypto bull cycle make it happen?
Instead of relying on emotion, the better approach is to look at the mathematics and market structure.
📊 First, Look at the Math
If TRUMP is around $2.06, reaching $77 would require approximately:
$2.06 → $77 = ~37.4×
That means the token would need roughly 3,640%+ upside from the current level.
This is not a normal rally.
To see a move of this magnitude, the market would likely need:
Massive new liquidity
A strong expansion in the meme-coin sector
A renewed viral narrative around TRUMP
Higher exchange volume
Strong retail demand
Large capital inflows
And enough demand to absorb additional token supply
In other words:
$77 is not a normal technical target. It is an extreme bull-case scenario.
🔥 Why Could the $77 Narrative Return?
One of the most powerful forces in crypto is narrative.
For meme coins, traditional valuation is often only one part of the equation. Attention, social-media activity, liquidity, and speculation can play a major role.
The same applies to TRUMP.
If the crypto market enters another aggressive risk-on phase and capital rotates back into meme coins, high-beta assets could experience significant moves.
TRUMP has already demonstrated extreme volatility in the past. Therefore, moves such as:
$2 → $5 → $10
are not mathematically impossible.
But there is an important distinction:
A move to $10 and a move to $77 are not the same event.
📈 $2.30 Is the First Major Test
The $2.30 area is an important resistance level in the current structure.
CoinLore's recent technical data identifies around $2.30 as resistance, with the next resistance areas near $3.17 and $4.71.
A potential bullish roadmap could look like:
$2.30 breakout → $3.17 → $4.70 → $5+
Each resistance reclaim would provide another piece of market-structure confirmation.
If TRUMP can produce a strong daily close above $2.30 while volume expands, the structure could become more constructive.
But repeated rejection around $2.30 would suggest that buyers still lack enough momentum.
🚀 $5, $10 and $20 — The Real Intermediate Checkpoints
Instead of focusing directly on $77, it makes more sense to divide the larger scenario into multiple stages.
Potential bullish roadmap:
$2.30 → First breakout confirmation
$3.17 → Next resistance
$4.70–$5 → Major psychological zone
$10 → Major expansion level
$20 → High-speculation territory
$50 → Extreme bull-market territory
$77 → Previous-high recovery scenario
These are scenario levels, not predictions.
Once the price moves above $10, market capitalization becomes increasingly important. At that stage, token supply and liquidity could matter just as much as the chart itself.
⚠️ The Biggest Factor: $TRUMP Supply
This is where many traders could make a mistake.
TRUMP has a total supply of 1 billion tokens, while the current circulating supply is around 273.14 million.
That means a substantial amount of supply remains outside the current circulating supply.
According to tokenomics data, TRUMP has a long-term vesting and unlock structure, with a significant insider allocation.
One particularly important factor is scheduled unlock activity.
On September 18, 2026, approximately 28.7 million TRUMP tokens are listed as scheduled to unlock, with an estimated value of around $55.7 million.
That matters because when additional tokens enter the market, selling pressure can increase if demand is not strong enough to absorb the new supply.
So the key question is not simply:
“How high can the price go?”
The better question is:
“Is there enough demand to absorb the new supply?”
🧮 What Would $77 Mean for Market Cap?
This may be the most important calculation of all.
If the circulating supply remains around 273 million tokens and TRUMP reaches $77, the implied market capitalization would be approximately:
273M × $77 ≈ $21 billion
Using the full 1 billion token supply for a fully diluted valuation:
1B × $77 = $77 billion FDV
So a return to $77 would not simply mean a meme coin going higher.
It would place TRUMP into tens-of-billions-of-dollars valuation territory.
That is why $77 should not be treated as a base-case target. Reaching that level would require a dramatic expansion in liquidity and demand.
🔥 So, Is $77 Impossible?
No.
But possible and probable are two different things.
Crypto markets have historically produced extreme moves, especially during strong bull cycles. Some assets have reached valuations far beyond what traditional fundamentals initially suggested.
TRUMP's own price history shows that the asset can experience extreme volatility. Therefore, a future speculative cycle could theoretically produce a very large upside move.
But reaching $77 would require more than simply remembering the previous high.
The market would need to generate a completely new demand and liquidity cycle capable of supporting that valuation.
📊 What Could Become Bullish Catalysts for TRUMP?
1️⃣ Bitcoin & the Broader Crypto Market
If BTC enters another strong expansion phase and capital begins rotating into altcoins and meme coins, the liquidity environment for high-beta assets could improve.
2️⃣ Meme Coin Sector Rotation
If the meme-coin narrative becomes dominant again, TRUMP could potentially capture part of that speculative liquidity.
3️⃣ Social-Media Attention
TRUMP's recognition and narrative exposure can become important during periods of intense market attention.
If social engagement rises alongside trading volume, speculative demand could increase.
4️⃣ Strong Exchange Liquidity
Higher trading volume and deeper liquidity on major exchanges can make it easier for larger capital to enter and exit positions.
5️⃣ Supply Absorption
This may be the most important factor.
If TRUMP can absorb newly unlocked supply while continuing to create higher lows and reclaim resistance levels, the bullish market structure could become stronger.
⚠️ But the Risks Are Equally Significant
TRUMP is not a low-volatility asset.
Several factors deserve close attention:
Token Unlocks: New supply can create additional selling pressure.
Extreme Volatility: Large percentage moves can occur within hours or days.
Narrative Dependency: Meme assets can be highly sensitive to changes in social attention and market sentiment.
Liquidity Risk: If volume declines, price can move sharply in either direction.
Valuation Risk: At $77, the implied valuation would become extremely large.
Leverage Risk: High volatility combined with leverage can significantly increase liquidation risk.
🧠 My $TRUMP Market Watchlist
If I were monitoring the long-term TRUMP recovery scenario, I would not focus directly on $77.
Instead, I would watch several key developments:
$2.30 reclaim
↓
$3.17 breakout
↓
$4.70–$5 hold
↓
$10 psychological level
↓
Volume + Open Interest + Funding
↓
Price reaction after token unlocks
↓
Broader meme-coin liquidity
↓
BTC trend
One of the most important signals would be the breakout and retest.
A price simply breaking above resistance does not automatically confirm a sustainable bullish trend.
The real question is whether the breakout level can later hold as support.
💰 The $77 Scenario — What Would It Take?
In an extreme bullish scenario, TRUMP could potentially require an environment where several factors align:
BTC strengthens → Altcoin liquidity expands → Meme sector heats up → TRUMP volume explodes → New supply gets absorbed → Major resistance levels turn into support → Large speculative liquidity enters → The narrative becomes viral again.
Every step matters.
If one major component fails, the $77 scenario could remain far away.
🔥 Final Take
Can $TRUMP touch $77 again?
Mathematically, yes.
But from a current price near $2, reaching $77 would require roughly a 37× move.
At the current circulating supply, $77 would imply approximately a $21 billion market cap, while using the full 1 billion token supply would imply an FDV of roughly $77 billion.
That means this would not be a normal recovery.
It would represent an extreme bull-market + massive liquidity + powerful narrative revival scenario.
For now, the more important levels are not $77.
Watch the progression:
$2.30 → $3.17 → $4.70 → $5 → $10
If TRUM#TRUMP can reclaim these levels one by one while maintaining volume, liquidity, and stronger market structure, then the historical $77 level becomes a more meaningful long-term scenario to discuss.
But before thinking about $77, the biggest question remains:
Can TRUMP survive the supply pressure and build a new demand cycle? 👀
Because in the meme-coin market, hype can start a rally—
but sustained liquidity is what keeps the rally alive.
DYOR. NFA.
Given the volatility of this asset, position sizing and leverage management remain critical.
#TRUMP #TrumpNFT #TrumpCrypto #Binance #trumpcoin
{spot}(TRUMPUSDT)
$TRUMP Can Touch $77 Again? 🤑
From $2 to $77 — Is a Massive Comeback Still Possible?
Can $TRUMP touch $77 again?
This question is no longer just about a meme coin price target. It is really about how liquidity, market cycles, narrative, demand, and token supply can interact to create an extreme move.
TRUMP once traded near the $77 area. But the market environment is completely different today.
As of September 18, 2026, Official TRUMP is trading around $2.06, with the token up roughly 6.26% over 24 hours and trading near its recent 30-day high. In the current structure, around $1.52 has acted as an important support area, while $2.30 is a key resistance level.
So the real question is:
$2 → $77 — impossible, or could another massive crypto bull cycle make it happen?
Instead of relying on emotion, the better approach is to look at the mathematics and market structure.
📊 First, Look at the Math
If TRUMP is around $2.06, reaching $77 would require approximately:
$2.06 → $77 = ~37.4×
That means the token would need roughly 3,640%+ upside from the current level.
This is not a normal rally.
To see a move of this magnitude, the market would likely need:
Massive new liquidity
A strong expansion in the meme-coin sector
A renewed viral narrative around TRUMP
Higher exchange volume
Strong retail demand
Large capital inflows
And enough demand to absorb additional token supply
In other words:
$77 is not a normal technical target. It is an extreme bull-case scenario.
🔥 Why Could the $77 Narrative Return?
One of the most powerful forces in crypto is narrative.
For meme coins, traditional valuation is often only one part of the equation. Attention, social-media activity, liquidity, and speculation can play a major role.
The same applies to TRUMP.
If the crypto market enters another aggressive risk-on phase and capital rotates back into meme coins, high-beta assets could experience significant moves.
TRUMP has already demonstrated extreme volatility in the past. Therefore, moves such as:
$2 → $5 → $10
are not mathematically impossible.
But there is an important distinction:
A move to $10 and a move to $77 are not the same event.
📈 $2.30 Is the First Major Test
The $2.30 area is an important resistance level in the current structure.
CoinLore's recent technical data identifies around $2.30 as resistance, with the next resistance areas near $3.17 and $4.71.
A potential bullish roadmap could look like:
$2.30 breakout → $3.17 → $4.70 → $5+
Each resistance reclaim would provide another piece of market-structure confirmation.
If TRUMP can produce a strong daily close above $2.30 while volume expands, the structure could become more constructive.
But repeated rejection around $2.30 would suggest that buyers still lack enough momentum.
🚀 $5, $10 and $20 — The Real Intermediate Checkpoints
Instead of focusing directly on $77, it makes more sense to divide the larger scenario into multiple stages.
Potential bullish roadmap:
$2.30 → First breakout confirmation
$3.17 → Next resistance
$4.70–$5 → Major psychological zone
$10 → Major expansion level
$20 → High-speculation territory
$50 → Extreme bull-market territory
$77 → Previous-high recovery scenario
These are scenario levels, not predictions.
Once the price moves above $10, market capitalization becomes increasingly important. At that stage, token supply and liquidity could matter just as much as the chart itself.
⚠️ The Biggest Factor: $TRUMP Supply
This is where many traders could make a mistake.
TRUMP has a total supply of 1 billion tokens, while the current circulating supply is around 273.14 million.
That means a substantial amount of supply remains outside the current circulating supply.
According to tokenomics data, TRUMP has a long-term vesting and unlock structure, with a significant insider allocation.
One particularly important factor is scheduled unlock activity.
On September 18, 2026, approximately 28.7 million TRUMP tokens are listed as scheduled to unlock, with an estimated value of around $55.7 million.
That matters because when additional tokens enter the market, selling pressure can increase if demand is not strong enough to absorb the new supply.
So the key question is not simply:
“How high can the price go?”
The better question is:
“Is there enough demand to absorb the new supply?”
🧮 What Would $77 Mean for Market Cap?
This may be the most important calculation of all.
If the circulating supply remains around 273 million tokens and TRUMP reaches $77, the implied market capitalization would be approximately:
273M × $77 ≈ $21 billion
Using the full 1 billion token supply for a fully diluted valuation:
1B × $77 = $77 billion FDV
So a return to $77 would not simply mean a meme coin going higher.
It would place TRUMP into tens-of-billions-of-dollars valuation territory.
That is why $77 should not be treated as a base-case target. Reaching that level would require a dramatic expansion in liquidity and demand.
🔥 So, Is $77 Impossible?
No.
But possible and probable are two different things.
Crypto markets have historically produced extreme moves, especially during strong bull cycles. Some assets have reached valuations far beyond what traditional fundamentals initially suggested.
TRUMP's own price history shows that the asset can experience extreme volatility. Therefore, a future speculative cycle could theoretically produce a very large upside move.
But reaching $77 would require more than simply remembering the previous high.
The market would need to generate a completely new demand and liquidity cycle capable of supporting that valuation.
📊 What Could Become Bullish Catalysts for TRUMP?
1️⃣ Bitcoin & the Broader Crypto Market
If BTC enters another strong expansion phase and capital begins rotating into altcoins and meme coins, the liquidity environment for high-beta assets could improve.
2️⃣ Meme Coin Sector Rotation
If the meme-coin narrative becomes dominant again, TRUMP could potentially capture part of that speculative liquidity.
3️⃣ Social-Media Attention
TRUMP's recognition and narrative exposure can become important during periods of intense market attention.
If social engagement rises alongside trading volume, speculative demand could increase.
4️⃣ Strong Exchange Liquidity
Higher trading volume and deeper liquidity on major exchanges can make it easier for larger capital to enter and exit positions.
5️⃣ Supply Absorption
This may be the most important factor.
If TRUMP can absorb newly unlocked supply while continuing to create higher lows and reclaim resistance levels, the bullish market structure could become stronger.
⚠️ But the Risks Are Equally Significant
TRUMP is not a low-volatility asset.
Several factors deserve close attention:
Token Unlocks: New supply can create additional selling pressure.
Extreme Volatility: Large percentage moves can occur within hours or days.
Narrative Dependency: Meme assets can be highly sensitive to changes in social attention and market sentiment.
Liquidity Risk: If volume declines, price can move sharply in either direction.
Valuation Risk: At $77, the implied valuation would become extremely large.
Leverage Risk: High volatility combined with leverage can significantly increase liquidation risk.
🧠 My $TRUMP Market Watchlist
If I were monitoring the long-term TRUMP recovery scenario, I would not focus directly on $77.
Instead, I would watch several key developments:
$2.30 reclaim
↓
$3.17 breakout
↓
$4.70–$5 hold
↓
$10 psychological level
↓
Volume + Open Interest + Funding
↓
Price reaction after token unlocks
↓
Broader meme-coin liquidity
↓
BTC trend
One of the most important signals would be the breakout and retest.
A price simply breaking above resistance does not automatically confirm a sustainable bullish trend.
The real question is whether the breakout level can later hold as support.
💰 The $77 Scenario — What Would It Take?
In an extreme bullish scenario, TRUMP could potentially require an environment where several factors align:
BTC strengthens → Altcoin liquidity expands → Meme sector heats up → TRUMP volume explodes → New supply gets absorbed → Major resistance levels turn into support → Large speculative liquidity enters → The narrative becomes viral again.
Every step matters.
If one major component fails, the $77 scenario could remain far away.
🔥 Final Take
Can $TRUMP touch $77 again?
Mathematically, yes.
But from a current price near $2, reaching $77 would require roughly a 37× move.
At the current circulating supply, $77 would imply approximately a $21 billion market cap, while using the full 1 billion token supply would imply an FDV of roughly $77 billion.
That means this would not be a normal recovery.
It would represent an extreme bull-market + massive liquidity + powerful narrative revival scenario.
For now, the more important levels are not $77.
Watch the progression:
$2.30 → $3.17 → $4.70 → $5 → $10
If TRUM#TRUMP can reclaim these levels one by one while maintaining volume, liquidity, and stronger market structure, then the historical $77 level becomes a more meaningful long-term scenario to discuss.
But before thinking about $77, the biggest question remains:
Can TRUMP survive the supply pressure and build a new demand cycle? 👀
Because in the meme-coin market, hype can start a rally—
but sustained liquidity is what keeps the rally alive.
DYOR. NFA.
Given the volatility of this asset, position sizing and leverage management remain critical.
#TRUMP #TrumpNFT #TrumpCrypto #Binance #trumpcoin
Can $TRUMP touch $77 again?
This question is no longer just about a meme coin price target. It is really about how liquidity, market cycles, narrative, demand, and token supply can interact to create an extreme move.
TRUMP once traded near the $77 area. But the market environment is completely different today.
As of September 18, 2026, Official TRUMP is trading around $2.06, with the token up roughly 6.26% over 24 hours and trading near its recent 30-day high. In the current structure, around $1.52 has acted as an important support area, while $2.30 is a key resistance level.
So the real question is:
$2 → $77 — impossible, or could another massive crypto bull cycle make it happen?
Instead of relying on emotion, the better approach is to look at the mathematics and market structure.
📊 First, Look at the Math
If TRUMP is around $2.06, reaching $77 would require approximately:
$2.06 → $77 = ~37.4×
That means the token would need roughly 3,640%+ upside from the current level.
This is not a normal rally.
To see a move of this magnitude, the market would likely need:
Massive new liquidity
A strong expansion in the meme-coin sector
A renewed viral narrative around TRUMP
Higher exchange volume
Strong retail demand
Large capital inflows
And enough demand to absorb additional token supply
In other words:
$77 is not a normal technical target. It is an extreme bull-case scenario.
🔥 Why Could the $77 Narrative Return?
One of the most powerful forces in crypto is narrative.
For meme coins, traditional valuation is often only one part of the equation. Attention, social-media activity, liquidity, and speculation can play a major role.
The same applies to TRUMP.
If the crypto market enters another aggressive risk-on phase and capital rotates back into meme coins, high-beta assets could experience significant moves.
TRUMP has already demonstrated extreme volatility in the past. Therefore, moves such as:
$2 → $5 → $10
are not mathematically impossible.
But there is an important distinction:
A move to $10 and a move to $77 are not the same event.
📈 $2.30 Is the First Major Test
The $2.30 area is an important resistance level in the current structure.
CoinLore's recent technical data identifies around $2.30 as resistance, with the next resistance areas near $3.17 and $4.71.
A potential bullish roadmap could look like:
$2.30 breakout → $3.17 → $4.70 → $5+
Each resistance reclaim would provide another piece of market-structure confirmation.
If TRUMP can produce a strong daily close above $2.30 while volume expands, the structure could become more constructive.
But repeated rejection around $2.30 would suggest that buyers still lack enough momentum.
🚀 $5, $10 and $20 — The Real Intermediate Checkpoints
Instead of focusing directly on $77, it makes more sense to divide the larger scenario into multiple stages.
Potential bullish roadmap:
$2.30 → First breakout confirmation
$3.17 → Next resistance
$4.70–$5 → Major psychological zone
$10 → Major expansion level
$20 → High-speculation territory
$50 → Extreme bull-market territory
$77 → Previous-high recovery scenario
These are scenario levels, not predictions.
Once the price moves above $10, market capitalization becomes increasingly important. At that stage, token supply and liquidity could matter just as much as the chart itself.
⚠️ The Biggest Factor: $TRUMP Supply
This is where many traders could make a mistake.
TRUMP has a total supply of 1 billion tokens, while the current circulating supply is around 273.14 million.
That means a substantial amount of supply remains outside the current circulating supply.
According to tokenomics data, TRUMP has a long-term vesting and unlock structure, with a significant insider allocation.
One particularly important factor is scheduled unlock activity.
On September 18, 2026, approximately 28.7 million TRUMP tokens are listed as scheduled to unlock, with an estimated value of around $55.7 million.
That matters because when additional tokens enter the market, selling pressure can increase if demand is not strong enough to absorb the new supply.
So the key question is not simply:
“How high can the price go?”
The better question is:
“Is there enough demand to absorb the new supply?”
🧮 What Would $77 Mean for Market Cap?
This may be the most important calculation of all.
If the circulating supply remains around 273 million tokens and TRUMP reaches $77, the implied market capitalization would be approximately:
273M × $77 ≈ $21 billion
Using the full 1 billion token supply for a fully diluted valuation:
1B × $77 = $77 billion FDV
So a return to $77 would not simply mean a meme coin going higher.
It would place TRUMP into tens-of-billions-of-dollars valuation territory.
That is why $77 should not be treated as a base-case target. Reaching that level would require a dramatic expansion in liquidity and demand.
🔥 So, Is $77 Impossible?
No.
But possible and probable are two different things.
Crypto markets have historically produced extreme moves, especially during strong bull cycles. Some assets have reached valuations far beyond what traditional fundamentals initially suggested.
TRUMP's own price history shows that the asset can experience extreme volatility. Therefore, a future speculative cycle could theoretically produce a very large upside move.
But reaching $77 would require more than simply remembering the previous high.
The market would need to generate a completely new demand and liquidity cycle capable of supporting that valuation.
📊 What Could Become Bullish Catalysts for TRUMP?
1️⃣ Bitcoin & the Broader Crypto Market
If BTC enters another strong expansion phase and capital begins rotating into altcoins and meme coins, the liquidity environment for high-beta assets could improve.
2️⃣ Meme Coin Sector Rotation
If the meme-coin narrative becomes dominant again, TRUMP could potentially capture part of that speculative liquidity.
3️⃣ Social-Media Attention
TRUMP's recognition and narrative exposure can become important during periods of intense market attention.
If social engagement rises alongside trading volume, speculative demand could increase.
4️⃣ Strong Exchange Liquidity
Higher trading volume and deeper liquidity on major exchanges can make it easier for larger capital to enter and exit positions.
5️⃣ Supply Absorption
This may be the most important factor.
If TRUMP can absorb newly unlocked supply while continuing to create higher lows and reclaim resistance levels, the bullish market structure could become stronger.
⚠️ But the Risks Are Equally Significant
TRUMP is not a low-volatility asset.
Several factors deserve close attention:
Token Unlocks: New supply can create additional selling pressure.
Extreme Volatility: Large percentage moves can occur within hours or days.
Narrative Dependency: Meme assets can be highly sensitive to changes in social attention and market sentiment.
Liquidity Risk: If volume declines, price can move sharply in either direction.
Valuation Risk: At $77, the implied valuation would become extremely large.
Leverage Risk: High volatility combined with leverage can significantly increase liquidation risk.
🧠 My $TRUMP Market Watchlist
If I were monitoring the long-term TRUMP recovery scenario, I would not focus directly on $77.
Instead, I would watch several key developments:
$2.30 reclaim
↓
$3.17 breakout
↓
$4.70–$5 hold
↓
$10 psychological level
↓
Volume + Open Interest + Funding
↓
Price reaction after token unlocks
↓
Broader meme-coin liquidity
↓
BTC trend
One of the most important signals would be the breakout and retest.
A price simply breaking above resistance does not automatically confirm a sustainable bullish trend.
The real question is whether the breakout level can later hold as support.
💰 The $77 Scenario — What Would It Take?
In an extreme bullish scenario, TRUMP could potentially require an environment where several factors align:
BTC strengthens → Altcoin liquidity expands → Meme sector heats up → TRUMP volume explodes → New supply gets absorbed → Major resistance levels turn into support → Large speculative liquidity enters → The narrative becomes viral again.
Every step matters.
If one major component fails, the $77 scenario could remain far away.
🔥 Final Take
Can $TRUMP touch $77 again?
Mathematically, yes.
But from a current price near $2, reaching $77 would require roughly a 37× move.
At the current circulating supply, $77 would imply approximately a $21 billion market cap, while using the full 1 billion token supply would imply an FDV of roughly $77 billion.
That means this would not be a normal recovery.
It would represent an extreme bull-market + massive liquidity + powerful narrative revival scenario.
For now, the more important levels are not $77.
Watch the progression:
$2.30 → $3.17 → $4.70 → $5 → $10
If TRUM#TRUMP can reclaim these levels one by one while maintaining volume, liquidity, and stronger market structure, then the historical $77 level becomes a more meaningful long-term scenario to discuss.
But before thinking about $77, the biggest question remains:
Can TRUMP survive the supply pressure and build a new demand cycle? 👀
Because in the meme-coin market, hype can start a rally—
but sustained liquidity is what keeps the rally alive.
DYOR. NFA.
Given the volatility of this asset, position sizing and leverage management remain critical.
#TRUMP #TrumpNFT #TrumpCrypto #Binance #trumpcoin
4
1.4k
·
--
Article
HYPE JUST FLIPPED THE MARKET NARRATIVE 🚨$HYPE is no longer behaving like an ordinary altcoin.
While the broader crypto market has been moving through volatility, Hyperliquid has quietly turned into one of the most closely watched names in the market.
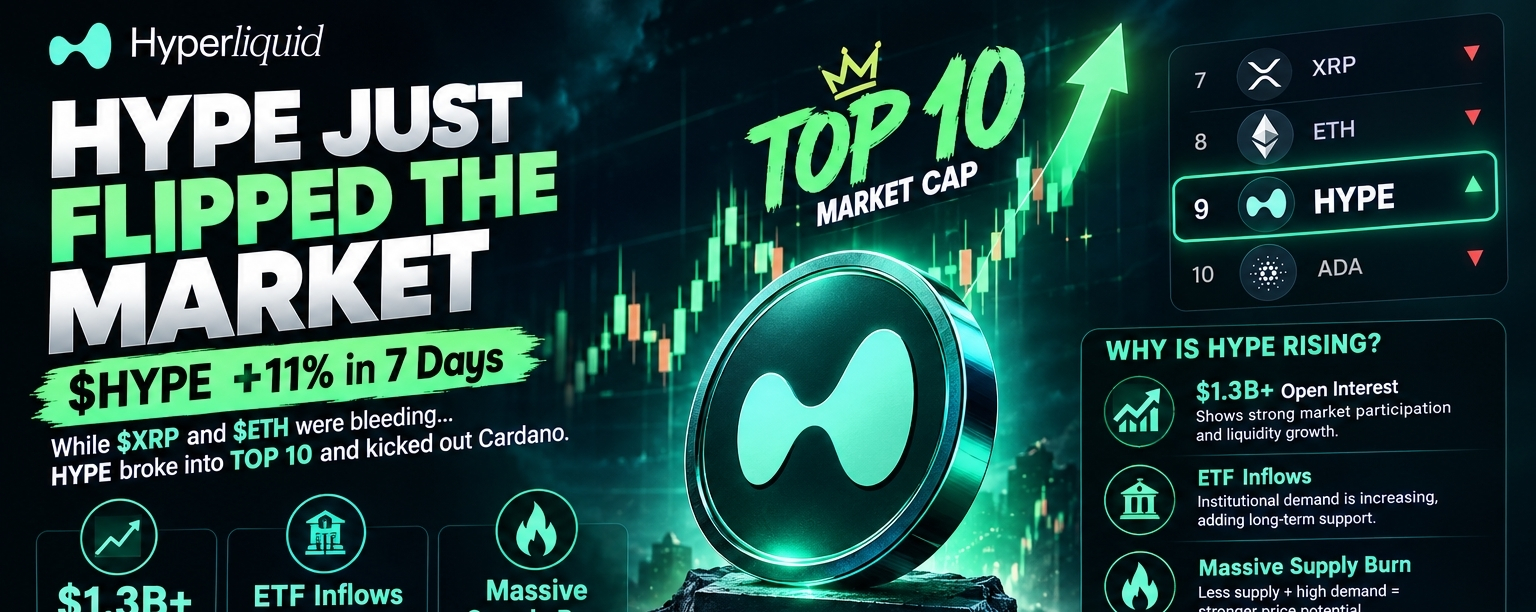
Over the past 7 days, HYPE has gained roughly 11–12%, while its market capitalization has pushed above $22 billion, placing it around the Top 10 crypto assets by market cap in current market data.
That matters.
Because this is no longer simply a story about a token going up.
It is becoming a story about market share, derivatives liquidity, institutional access, token economics and capital rotation.
And that is where the HYPE thesis becomes interesting.
🔥 From Altcoin Rally to Market Dominance
The most important change is not the percentage gain itself.
It is the fact that HYPE is now competing for attention with much larger and more established crypto assets.
Current market data shows $HYPE around $89, with a market cap of approximately $22.4B and 24-hour trading volume around $1.4B.
At the same time, Hyperliquid's own derivatives ecosystem has reached a massive scale.
Recent data shows total open interest across the Hyperliquid exchange at roughly $15.2B, while HYPE-USD alone accounts for approximately $1.9B in open interest.
That tells us something important:
Liquidity is following the ecosystem.
And in crypto, liquidity often becomes one of the strongest drivers of attention.
📊 The $1B+ Open Interest Signal
Open interest is not automatically bullish.
In fact, extremely high OI can increase liquidation risk when leverage becomes crowded.
But it does show where traders are allocating derivatives capital.
Hyperliquid's total OI recently reached approximately $14.3B, according to The Block, approaching the levels seen immediately before the major October 2025 deleveraging event.
This is a critical point for investors.
The same data that demonstrates Hyperliquid's growth also demonstrates its risk.
More OI means:
More liquidity → more trading activity → more potential protocol revenue
but also:
More leverage → more crowded positioning → greater liquidation risk.
So the real question is not simply:
“Is OI high?”
The better question is:
“Is the growth in OI translating into sustainable protocol economics?”
That is what I would watch next.
🏦 ETF Narrative Is Changing the Game
Another major development is the growing effort to bring HYPE into traditional investment structures.
Recent reporting has highlighted institutional and ETF-related demand around HYPE, while current market coverage has also linked the recent rally with ETF flows and whale accumulation.
However, investors should be careful with the headline:
HYPE ETF inflows are not consistently beating BTC and $ETH ETFs every period.
There have been periods of strong HYPE inflows, but there have also been periods of outflows. For example, data reported for the week ending September 4 showed BTC funds attracting significantly more capital while HYPE and other major altcoin products experienced declining flows.
So I would not build the entire HYPE thesis around ETF flows.
Instead, I see the ETF narrative as another potential institutional access channel.
And that could become more important if demand remains persistent.
🔥 The Supply-Burn Story Is Even More Interesting
This is where HYPE's tokenomics deserve attention.
Current tracking based on Hyperliquid's official API balance shows approximately 47.29 million HYPE recorded as burned as of September 18, 2026. The burn mechanism removes HYPE from circulating and total supply.
This is not a guarantee that price will rise.
But from an economic perspective, it creates an interesting relationship:
Higher network activity → more fees → more HYPE-related buyback/burn activity → potentially tighter supply.
The Block has reported that Hyperliquid's core crypto perpetual markets route close to 97% of generated fees into HYPE buybacks, which helps explain why trading activity can have a direct economic connection to the token.
That is an important distinction.
A token with high trading volume is one thing.
A token where a meaningful portion of the economic activity can feed back into token demand and supply reduction is another.
🧠 This Is Why HYPE Is Different
The market is full of tokens that pump because of:
narrative
hype
social media
listings
speculation
short-term liquidity
But HYPE's current narrative is increasingly connected to actual market infrastructure.
Hyperliquid operates a major decentralized perpetual-futures venue, and its ecosystem has developed substantial trading volume and open interest.
That creates a potential feedback loop:
More traders
↓
More volume
↓
More fees
↓
More economic activity around the protocol
↓
More attention from whales and institutions
↓
Potentially stronger demand for HYPE
↓
Higher valuation attracts even more attention
This kind of reflexive cycle is one reason momentum can accelerate quickly.
But the same mechanism works in reverse if volume, liquidity or demand deteriorates.
⚠️ The Risk Nobody Should Ignore
This is the part I would not ignore simply because HYPE is trending.
When an asset moves aggressively and reaches new highs, FOMO becomes part of the market structure.
Recent technical coverage has already noted pullbacks following overbought conditions.
And the derivatives market adds another layer of risk.
With billions of dollars in open interest across Hyperliquid, a sharp move in either direction can trigger liquidations and increase volatility. The exchange previously experienced a dramatic OI contraction during the October 2025 crash, when total OI fell from about $14.7B to $6.5B in a single day.
So chasing a vertical candle simply because HYPE is breaking into the Top 10 can be dangerous.
Strong fundamentals do not eliminate bad entries.
📈 What I Am Watching From Here
For me, the next phase of the HYPE story comes down to several things:
1️⃣ Can HYPE maintain Top-10 market-cap territory?
Breaking into the Top 10 is one thing.
Staying there is another.
If market capitalization remains elevated even during broader market weakness, that would show stronger relative demand.
2️⃣ Does open interest continue growing sustainably?
Rising OI together with rising volume can demonstrate expanding participation.
But if OI rises much faster than spot demand, leverage may become increasingly crowded.
3️⃣ Are ETF flows becoming persistent?
One strong inflow day is not enough.
What matters is whether institutional products can maintain net demand over multiple weeks.
4️⃣ Does the burn rate remain meaningful?
The supply-reduction mechanism becomes more interesting if protocol activity remains high enough to generate persistent buyback/burn pressure.
5️⃣ Can HYPE hold its breakout structure?
Momentum is strongest when price breaks out and successfully converts the previous resistance area into support.
A failed breakout followed by aggressive OI unwinding would tell a very different story.
💰 Investment Perspective
I don't think the interesting part of HYPE is simply:
“It is up 11%.”
The more important question is:
“Why is the market willing to assign HYPE a multi-billion-dollar valuation?”
The answer increasingly involves:
Hyperliquid's trading infrastructure + derivatives liquidity + protocol economics + buyback/burn mechanism + growing institutional interest.
That combination makes HYPE one of the more interesting assets to monitor in the current altcoin market.
But interesting does not mean risk-free.
After a strong move, I would rather watch for pullbacks, retests, volume confirmation and healthier leverage conditions than blindly chase a green candle.
🔥 Final Take
HYPE's move is becoming bigger than a simple altcoin pump.
The market is beginning to price Hyperliquid not merely as another crypto project, but as a major piece of decentralized trading infrastructure.
With roughly $22B+ market capitalization, billions in exchange-wide open interest, a growing institutional/ETF narrative and tens of millions of HYPE already recorded as burned, the token now has several fundamental forces working around the same ecosystem.
But the next stage will be decided by execution.
Can HYPE maintain demand?
Can protocol activity keep generating economic value?
Can supply reduction continue?
And most importantly:
Can the market absorb the leverage without another major deleveraging event?
That is what I'm watching.
Because if the fundamentals continue expanding while the market structure remains healthy, the HYPE story could become much bigger than a short-term rally.
Are you watching HYPE — or are you already positioned? 👇
DYOR. NFA. Don't chase pumps. Protect your capital and manage leverage carefully.
#HYPE #Hyperliquid #Crypto #BinanceSquare #HYPEJumpsOver11%
{future}(HYPEUSDT)
{spot}(HYPERUSDT)
{spot}(ETHUSDT)
HYPE JUST FLIPPED THE MARKET NARRATIVE 🚨
$HYPE is no longer behaving like an ordinary altcoin.
While the broader crypto market has been moving through volatility, Hyperliquid has quietly turned into one of the most closely watched names in the market.
Over the past 7 days, HYPE has gained roughly 11–12%, while its market capitalization has pushed above $22 billion, placing it around the Top 10 crypto assets by market cap in current market data.
That matters.
Because this is no longer simply a story about a token going up.
It is becoming a story about market share, derivatives liquidity, institutional access, token economics and capital rotation.
And that is where the HYPE thesis becomes interesting.
🔥 From Altcoin Rally to Market Dominance
The most important change is not the percentage gain itself.
It is the fact that HYPE is now competing for attention with much larger and more established crypto assets.
Current market data shows $HYPE around $89, with a market cap of approximately $22.4B and 24-hour trading volume around $1.4B.
At the same time, Hyperliquid's own derivatives ecosystem has reached a massive scale.
Recent data shows total open interest across the Hyperliquid exchange at roughly $15.2B, while HYPE-USD alone accounts for approximately $1.9B in open interest.
That tells us something important:
Liquidity is following the ecosystem.
And in crypto, liquidity often becomes one of the strongest drivers of attention.
📊 The $1B+ Open Interest Signal
Open interest is not automatically bullish.
In fact, extremely high OI can increase liquidation risk when leverage becomes crowded.
But it does show where traders are allocating derivatives capital.
Hyperliquid's total OI recently reached approximately $14.3B, according to The Block, approaching the levels seen immediately before the major October 2025 deleveraging event.
This is a critical point for investors.
The same data that demonstrates Hyperliquid's growth also demonstrates its risk.
More OI means:
More liquidity → more trading activity → more potential protocol revenue
but also:
More leverage → more crowded positioning → greater liquidation risk.
So the real question is not simply:
“Is OI high?”
The better question is:
“Is the growth in OI translating into sustainable protocol economics?”
That is what I would watch next.
🏦 ETF Narrative Is Changing the Game
Another major development is the growing effort to bring HYPE into traditional investment structures.
Recent reporting has highlighted institutional and ETF-related demand around HYPE, while current market coverage has also linked the recent rally with ETF flows and whale accumulation.
However, investors should be careful with the headline:
HYPE ETF inflows are not consistently beating BTC and $ETH ETFs every period.
There have been periods of strong HYPE inflows, but there have also been periods of outflows. For example, data reported for the week ending September 4 showed BTC funds attracting significantly more capital while HYPE and other major altcoin products experienced declining flows.
So I would not build the entire HYPE thesis around ETF flows.
Instead, I see the ETF narrative as another potential institutional access channel.
And that could become more important if demand remains persistent.
🔥 The Supply-Burn Story Is Even More Interesting
This is where HYPE's tokenomics deserve attention.
Current tracking based on Hyperliquid's official API balance shows approximately 47.29 million HYPE recorded as burned as of September 18, 2026. The burn mechanism removes HYPE from circulating and total supply.
This is not a guarantee that price will rise.
But from an economic perspective, it creates an interesting relationship:
Higher network activity → more fees → more HYPE-related buyback/burn activity → potentially tighter supply.
The Block has reported that Hyperliquid's core crypto perpetual markets route close to 97% of generated fees into HYPE buybacks, which helps explain why trading activity can have a direct economic connection to the token.
That is an important distinction.
A token with high trading volume is one thing.
A token where a meaningful portion of the economic activity can feed back into token demand and supply reduction is another.
🧠 This Is Why HYPE Is Different
The market is full of tokens that pump because of:
narrative
hype
social media
listings
speculation
short-term liquidity
But HYPE's current narrative is increasingly connected to actual market infrastructure.
Hyperliquid operates a major decentralized perpetual-futures venue, and its ecosystem has developed substantial trading volume and open interest.
That creates a potential feedback loop:
More traders
↓
More volume
↓
More fees
↓
More economic activity around the protocol
↓
More attention from whales and institutions
↓
Potentially stronger demand for HYPE
↓
Higher valuation attracts even more attention
This kind of reflexive cycle is one reason momentum can accelerate quickly.
But the same mechanism works in reverse if volume, liquidity or demand deteriorates.
⚠️ The Risk Nobody Should Ignore
This is the part I would not ignore simply because HYPE is trending.
When an asset moves aggressively and reaches new highs, FOMO becomes part of the market structure.
Recent technical coverage has already noted pullbacks following overbought conditions.
And the derivatives market adds another layer of risk.
With billions of dollars in open interest across Hyperliquid, a sharp move in either direction can trigger liquidations and increase volatility. The exchange previously experienced a dramatic OI contraction during the October 2025 crash, when total OI fell from about $14.7B to $6.5B in a single day.
So chasing a vertical candle simply because HYPE is breaking into the Top 10 can be dangerous.
Strong fundamentals do not eliminate bad entries.
📈 What I Am Watching From Here
For me, the next phase of the HYPE story comes down to several things:
1️⃣ Can HYPE maintain Top-10 market-cap territory?
Breaking into the Top 10 is one thing.
Staying there is another.
If market capitalization remains elevated even during broader market weakness, that would show stronger relative demand.
2️⃣ Does open interest continue growing sustainably?
Rising OI together with rising volume can demonstrate expanding participation.
But if OI rises much faster than spot demand, leverage may become increasingly crowded.
3️⃣ Are ETF flows becoming persistent?
One strong inflow day is not enough.
What matters is whether institutional products can maintain net demand over multiple weeks.
4️⃣ Does the burn rate remain meaningful?
The supply-reduction mechanism becomes more interesting if protocol activity remains high enough to generate persistent buyback/burn pressure.
5️⃣ Can HYPE hold its breakout structure?
Momentum is strongest when price breaks out and successfully converts the previous resistance area into support.
A failed breakout followed by aggressive OI unwinding would tell a very different story.
💰 Investment Perspective
I don't think the interesting part of HYPE is simply:
“It is up 11%.”
The more important question is:
“Why is the market willing to assign HYPE a multi-billion-dollar valuation?”
The answer increasingly involves:
Hyperliquid's trading infrastructure + derivatives liquidity + protocol economics + buyback/burn mechanism + growing institutional interest.
That combination makes HYPE one of the more interesting assets to monitor in the current altcoin market.
But interesting does not mean risk-free.
After a strong move, I would rather watch for pullbacks, retests, volume confirmation and healthier leverage conditions than blindly chase a green candle.
🔥 Final Take
HYPE's move is becoming bigger than a simple altcoin pump.
The market is beginning to price Hyperliquid not merely as another crypto project, but as a major piece of decentralized trading infrastructure.
With roughly $22B+ market capitalization, billions in exchange-wide open interest, a growing institutional/ETF narrative and tens of millions of HYPE already recorded as burned, the token now has several fundamental forces working around the same ecosystem.
But the next stage will be decided by execution.
Can HYPE maintain demand?
Can protocol activity keep generating economic value?
Can supply reduction continue?
And most importantly:
Can the market absorb the leverage without another major deleveraging event?
That is what I'm watching.
Because if the fundamentals continue expanding while the market structure remains healthy, the HYPE story could become much bigger than a short-term rally.
Are you watching HYPE — or are you already positioned? 👇
DYOR. NFA. Don't chase pumps. Protect your capital and manage leverage carefully.
#HYPE #Hyperliquid #Crypto #BinanceSquare #HYPEJumpsOver11%
While the broader crypto market has been moving through volatility, Hyperliquid has quietly turned into one of the most closely watched names in the market.
Over the past 7 days, HYPE has gained roughly 11–12%, while its market capitalization has pushed above $22 billion, placing it around the Top 10 crypto assets by market cap in current market data.
That matters.
Because this is no longer simply a story about a token going up.
It is becoming a story about market share, derivatives liquidity, institutional access, token economics and capital rotation.
And that is where the HYPE thesis becomes interesting.
🔥 From Altcoin Rally to Market Dominance
The most important change is not the percentage gain itself.
It is the fact that HYPE is now competing for attention with much larger and more established crypto assets.
Current market data shows $HYPE around $89, with a market cap of approximately $22.4B and 24-hour trading volume around $1.4B.
At the same time, Hyperliquid's own derivatives ecosystem has reached a massive scale.
Recent data shows total open interest across the Hyperliquid exchange at roughly $15.2B, while HYPE-USD alone accounts for approximately $1.9B in open interest.
That tells us something important:
Liquidity is following the ecosystem.
And in crypto, liquidity often becomes one of the strongest drivers of attention.
📊 The $1B+ Open Interest Signal
Open interest is not automatically bullish.
In fact, extremely high OI can increase liquidation risk when leverage becomes crowded.
But it does show where traders are allocating derivatives capital.
Hyperliquid's total OI recently reached approximately $14.3B, according to The Block, approaching the levels seen immediately before the major October 2025 deleveraging event.
This is a critical point for investors.
The same data that demonstrates Hyperliquid's growth also demonstrates its risk.
More OI means:
More liquidity → more trading activity → more potential protocol revenue
but also:
More leverage → more crowded positioning → greater liquidation risk.
So the real question is not simply:
“Is OI high?”
The better question is:
“Is the growth in OI translating into sustainable protocol economics?”
That is what I would watch next.
🏦 ETF Narrative Is Changing the Game
Another major development is the growing effort to bring HYPE into traditional investment structures.
Recent reporting has highlighted institutional and ETF-related demand around HYPE, while current market coverage has also linked the recent rally with ETF flows and whale accumulation.
However, investors should be careful with the headline:
HYPE ETF inflows are not consistently beating BTC and $ETH ETFs every period.
There have been periods of strong HYPE inflows, but there have also been periods of outflows. For example, data reported for the week ending September 4 showed BTC funds attracting significantly more capital while HYPE and other major altcoin products experienced declining flows.
So I would not build the entire HYPE thesis around ETF flows.
Instead, I see the ETF narrative as another potential institutional access channel.
And that could become more important if demand remains persistent.
🔥 The Supply-Burn Story Is Even More Interesting
This is where HYPE's tokenomics deserve attention.
Current tracking based on Hyperliquid's official API balance shows approximately 47.29 million HYPE recorded as burned as of September 18, 2026. The burn mechanism removes HYPE from circulating and total supply.
This is not a guarantee that price will rise.
But from an economic perspective, it creates an interesting relationship:
Higher network activity → more fees → more HYPE-related buyback/burn activity → potentially tighter supply.
The Block has reported that Hyperliquid's core crypto perpetual markets route close to 97% of generated fees into HYPE buybacks, which helps explain why trading activity can have a direct economic connection to the token.
That is an important distinction.
A token with high trading volume is one thing.
A token where a meaningful portion of the economic activity can feed back into token demand and supply reduction is another.
🧠 This Is Why HYPE Is Different
The market is full of tokens that pump because of:
narrative
hype
social media
listings
speculation
short-term liquidity
But HYPE's current narrative is increasingly connected to actual market infrastructure.
Hyperliquid operates a major decentralized perpetual-futures venue, and its ecosystem has developed substantial trading volume and open interest.
That creates a potential feedback loop:
More traders
↓
More volume
↓
More fees
↓
More economic activity around the protocol
↓
More attention from whales and institutions
↓
Potentially stronger demand for HYPE
↓
Higher valuation attracts even more attention
This kind of reflexive cycle is one reason momentum can accelerate quickly.
But the same mechanism works in reverse if volume, liquidity or demand deteriorates.
⚠️ The Risk Nobody Should Ignore
This is the part I would not ignore simply because HYPE is trending.
When an asset moves aggressively and reaches new highs, FOMO becomes part of the market structure.
Recent technical coverage has already noted pullbacks following overbought conditions.
And the derivatives market adds another layer of risk.
With billions of dollars in open interest across Hyperliquid, a sharp move in either direction can trigger liquidations and increase volatility. The exchange previously experienced a dramatic OI contraction during the October 2025 crash, when total OI fell from about $14.7B to $6.5B in a single day.
So chasing a vertical candle simply because HYPE is breaking into the Top 10 can be dangerous.
Strong fundamentals do not eliminate bad entries.
📈 What I Am Watching From Here
For me, the next phase of the HYPE story comes down to several things:
1️⃣ Can HYPE maintain Top-10 market-cap territory?
Breaking into the Top 10 is one thing.
Staying there is another.
If market capitalization remains elevated even during broader market weakness, that would show stronger relative demand.
2️⃣ Does open interest continue growing sustainably?
Rising OI together with rising volume can demonstrate expanding participation.
But if OI rises much faster than spot demand, leverage may become increasingly crowded.
3️⃣ Are ETF flows becoming persistent?
One strong inflow day is not enough.
What matters is whether institutional products can maintain net demand over multiple weeks.
4️⃣ Does the burn rate remain meaningful?
The supply-reduction mechanism becomes more interesting if protocol activity remains high enough to generate persistent buyback/burn pressure.
5️⃣ Can HYPE hold its breakout structure?
Momentum is strongest when price breaks out and successfully converts the previous resistance area into support.
A failed breakout followed by aggressive OI unwinding would tell a very different story.
💰 Investment Perspective
I don't think the interesting part of HYPE is simply:
“It is up 11%.”
The more important question is:
“Why is the market willing to assign HYPE a multi-billion-dollar valuation?”
The answer increasingly involves:
Hyperliquid's trading infrastructure + derivatives liquidity + protocol economics + buyback/burn mechanism + growing institutional interest.
That combination makes HYPE one of the more interesting assets to monitor in the current altcoin market.
But interesting does not mean risk-free.
After a strong move, I would rather watch for pullbacks, retests, volume confirmation and healthier leverage conditions than blindly chase a green candle.
🔥 Final Take
HYPE's move is becoming bigger than a simple altcoin pump.
The market is beginning to price Hyperliquid not merely as another crypto project, but as a major piece of decentralized trading infrastructure.
With roughly $22B+ market capitalization, billions in exchange-wide open interest, a growing institutional/ETF narrative and tens of millions of HYPE already recorded as burned, the token now has several fundamental forces working around the same ecosystem.
But the next stage will be decided by execution.
Can HYPE maintain demand?
Can protocol activity keep generating economic value?
Can supply reduction continue?
And most importantly:
Can the market absorb the leverage without another major deleveraging event?
That is what I'm watching.
Because if the fundamentals continue expanding while the market structure remains healthy, the HYPE story could become much bigger than a short-term rally.
Are you watching HYPE — or are you already positioned? 👇
DYOR. NFA. Don't chase pumps. Protect your capital and manage leverage carefully.
#HYPE #Hyperliquid #Crypto #BinanceSquare #HYPEJumpsOver11%
1
167
·
--
Article
$ZEC: From $20K in Funding Fees to $1.8K—A Trader’s Experience and the Investment Case for ZcashA previous position cost me $20,000 in funding fees. This one has cost me only $1,800 so far. That difference is more than just a number. It raises an important question about the cost of holding leveraged positions, funding rates, and trading strategy in the futures market.
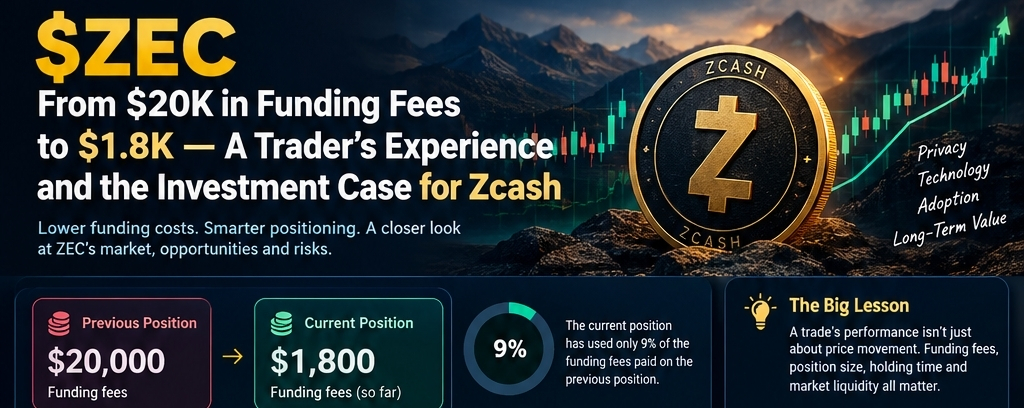
My previous funding cost: $20,000
Current funding cost: $1,800
The current position has used approximately 9% of the funding fees paid on the previous position.
The key lesson is that a trade’s performance cannot be measured by price movement alone. Funding fees, position size, holding time, and market liquidity all matter. When we connect this experience with the market structure and investment narrative surrounding Zcash, several important points emerge for futures traders and crypto investors.
1. Why Funding Fees Matter More Than Many Traders Realize
Funding fees are periodic payments exchanged between long and short traders in perpetual futures contracts. They are generally calculated based on the position’s notional value and the funding rate.
When funding is positive, long traders typically pay short traders. When funding is negative, the opposite may happen.
A trader can be correct about the market direction and still lose a significant amount of money if the cost of maintaining a leveraged position becomes too high.
Imagine holding a large position for an extended period. Even if the market does not move against you, funding fees can gradually reduce your capital. This means that getting the entry price right is only one part of the equation. Managing the cost of staying in the trade is equally important.
In my example, the difference is clear:
Previous funding fees: $20,000.
Current funding fees: $1,800.
Difference: $18,200.
Current fees represent approximately 9% of the previous position’s funding cost.
These numbers do not represent trading profit. They represent the cost of maintaining positions. That distinction matters because a lower funding bill does not automatically mean a profitable trade.
2. Zcash and the Current Market Narrative
Zcash has attracted attention because of its privacy-focused technology, network development, and recent market momentum.
The project uses zero-knowledge proofs to enable privacy-preserving transactions. This gives Zcash a distinct identity within the cryptocurrency market and makes it relevant to investors interested in financial privacy and decentralized technology.
The broader market narrative around ZEC can be divided into three areas.
Privacy and Zero-Knowledge Technology
Zcash’s core value proposition is the ability to verify transactions without necessarily revealing all transaction details. As interest in financial privacy and privacy-preserving digital systems develops, this technology may remain an important part of the project’s long-term narrative.
Network Development
Network upgrades can affect transaction efficiency, user experience, and the future direction of a blockchain. However, investors should distinguish between a proposed upgrade, a governance vote, and an upgrade that has actually been implemented.
Market Activity
ZEC’s price movement and derivatives activity can create opportunities, but they also increase the importance of monitoring funding rates, open interest, and liquidity. Strong momentum does not eliminate risk.
3. The Connection Between Funding Fees and $ZEC
A rising cryptocurrency does not automatically make every long position profitable.
When funding rates are positive and position sizes are large, the cost of holding a long position can increase over time. A trader needs to consider whether the expected price movement is sufficient to cover the funding expense.
For example, a hypothetical $100,000 notional position with a daily funding rate of 0.05% would generate:
Daily funding cost: $50
Over 30 days, the total would be approximately $1,500, assuming the position size and funding rate remain unchanged.
This is only an illustrative calculation, not a current ZEC funding rate.
The lesson is simple: before holding a leveraged position, ask three questions.
What is the current funding rate?
How long do I plan to hold the position?
After funding costs, is the potential return reasonable relative to the risk?
4. The Investment Case for Zcash
Zcash’s long-term value cannot be assessed through a chart alone. Its technology, supply structure, adoption, and market liquidity all deserve consideration.
Limited Supply
Zcash has a maximum supply of 21 million coins, similar to Bitcoin’s fixed-supply model. Limited supply can contribute to a scarcity narrative, but scarcity alone does not guarantee price appreciation. Demand, utility, adoption, and market conditions remain important.
Privacy as a Distinctive Narrative
Privacy-focused digital assets serve a different purpose from many general-purpose cryptocurrencies. Zcash’s zero-knowledge technology gives it a recognizable position in this segment.
However, the long-term investment case depends on whether that technology attracts sustained usage and demand, not simply whether the privacy narrative becomes popular during a market rally.
Network Upgrades and Development
Network improvements can strengthen the project’s technical foundation. Investors should verify the details of each upgrade, including its proposal, governance status, and implementation.
A proposed change should not be treated as a completed development until it is confirmed.
5. The Biggest Risks During a Strong ZEC Rally
Overextended Momentum
When a cryptocurrency rises rapidly, late buyers may enter after much of the move has already occurred. A small correction can then create substantial losses, particularly for leveraged traders.
Breakout confirmation, retests, and volume behavior are useful areas to monitor.
Funding and Leverage
High positive funding can increase the cost of long positions. At the same time, excessive open interest can make the market vulnerable to liquidations in either direction.
A trader should not assume that a strong price trend will continue indefinitely.
Bitcoin and Macro Conditions
ZEC remains part of the broader cryptocurrency market. Bitcoin’s direction, liquidity conditions, interest rates, and overall risk appetite can influence altcoin performance.
A strong $ZEC -specific narrative may support demand, but it does not make the asset immune to broader market corrections.
6. A Practical Trading Framework
The current funding cost is lower than the previous position’s cost, but $1,800 is still a meaningful expense.
A practical approach to managing a leveraged position includes:
Track funding rates: Review the current rate before opening or extending a position.
Control position size: Avoid using excessive leverage simply because the market is moving in your favor.
Define an invalidation level: Decide in advance when the trade thesis is no longer valid.
Monitor open interest and volume: Price movement alone does not reveal the full market structure.
Consider partial profit-taking: If the position moves substantially in your favor, reducing exposure can lower future funding costs and protect part of the gains.
Avoid chasing pumps: A strong rally can continue, but entering late with high leverage creates a different risk profile from holding an earlier position.
7. What Investors Should Watch in ZEC
Market factor
Why it matters
Spot volume
Helps assess the strength of buying activity
Funding rate
Measures the cost of maintaining a leveraged position
Open interest
Shows changes in derivatives positioning
Support and retests
Helps evaluate breakout sustainability
Network development
Provides insight into technical progress
Bitcoin direction
Reflects broader crypto market risk
For ZEC, the important question is not simply how high the price can go. It is whether the market structure, demand, and risk conditions support the position being taken.
Conclusion: Is Lower Funding Cost the Real Success?
The experience of paying $20K in funding fees on one position and only $1.8K on another highlights an important lesson about trading.
A successful trading strategy is not only about identifying a rising asset. It is also about managing the cost of holding the position, controlling leverage, and protecting capital.
Zcash has a distinct privacy-focused technology narrative and an active market that can attract attention from traders and investors. But these factors do not guarantee future price appreciation.
The most important takeaway is this:
Trading is not only about how much profit you make. It is also about how much it costs to achieve that profit.
In a volatile market like $ZEC , capital preservation, disciplined position sizing, and a clear risk-management plan can be more valuable than chasing every price move.
DYOR • NFA • Leverage is risky.
{spot}(ZECUSDT)
#zec #BitcoinSurpasses$77000 #cryptouniverseofficial #Binance #BinanceSquare
$ZEC: From $20K in Funding Fees to $1.8K—A Trader’s Experience and the Investment Case for Zcash
A previous position cost me $20,000 in funding fees. This one has cost me only $1,800 so far. That difference is more than just a number. It raises an important question about the cost of holding leveraged positions, funding rates, and trading strategy in the futures market.
My previous funding cost: $20,000
Current funding cost: $1,800
The current position has used approximately 9% of the funding fees paid on the previous position.
The key lesson is that a trade’s performance cannot be measured by price movement alone. Funding fees, position size, holding time, and market liquidity all matter. When we connect this experience with the market structure and investment narrative surrounding Zcash, several important points emerge for futures traders and crypto investors.
1. Why Funding Fees Matter More Than Many Traders Realize
Funding fees are periodic payments exchanged between long and short traders in perpetual futures contracts. They are generally calculated based on the position’s notional value and the funding rate.
When funding is positive, long traders typically pay short traders. When funding is negative, the opposite may happen.
A trader can be correct about the market direction and still lose a significant amount of money if the cost of maintaining a leveraged position becomes too high.
Imagine holding a large position for an extended period. Even if the market does not move against you, funding fees can gradually reduce your capital. This means that getting the entry price right is only one part of the equation. Managing the cost of staying in the trade is equally important.
In my example, the difference is clear:
Previous funding fees: $20,000.
Current funding fees: $1,800.
Difference: $18,200.
Current fees represent approximately 9% of the previous position’s funding cost.
These numbers do not represent trading profit. They represent the cost of maintaining positions. That distinction matters because a lower funding bill does not automatically mean a profitable trade.
2. Zcash and the Current Market Narrative
Zcash has attracted attention because of its privacy-focused technology, network development, and recent market momentum.
The project uses zero-knowledge proofs to enable privacy-preserving transactions. This gives Zcash a distinct identity within the cryptocurrency market and makes it relevant to investors interested in financial privacy and decentralized technology.
The broader market narrative around ZEC can be divided into three areas.
Privacy and Zero-Knowledge Technology
Zcash’s core value proposition is the ability to verify transactions without necessarily revealing all transaction details. As interest in financial privacy and privacy-preserving digital systems develops, this technology may remain an important part of the project’s long-term narrative.
Network Development
Network upgrades can affect transaction efficiency, user experience, and the future direction of a blockchain. However, investors should distinguish between a proposed upgrade, a governance vote, and an upgrade that has actually been implemented.
Market Activity
ZEC’s price movement and derivatives activity can create opportunities, but they also increase the importance of monitoring funding rates, open interest, and liquidity. Strong momentum does not eliminate risk.
3. The Connection Between Funding Fees and $ZEC
A rising cryptocurrency does not automatically make every long position profitable.
When funding rates are positive and position sizes are large, the cost of holding a long position can increase over time. A trader needs to consider whether the expected price movement is sufficient to cover the funding expense.
For example, a hypothetical $100,000 notional position with a daily funding rate of 0.05% would generate:
Daily funding cost: $50
Over 30 days, the total would be approximately $1,500, assuming the position size and funding rate remain unchanged.
This is only an illustrative calculation, not a current ZEC funding rate.
The lesson is simple: before holding a leveraged position, ask three questions.
What is the current funding rate?
How long do I plan to hold the position?
After funding costs, is the potential return reasonable relative to the risk?
4. The Investment Case for Zcash
Zcash’s long-term value cannot be assessed through a chart alone. Its technology, supply structure, adoption, and market liquidity all deserve consideration.
Limited Supply
Zcash has a maximum supply of 21 million coins, similar to Bitcoin’s fixed-supply model. Limited supply can contribute to a scarcity narrative, but scarcity alone does not guarantee price appreciation. Demand, utility, adoption, and market conditions remain important.
Privacy as a Distinctive Narrative
Privacy-focused digital assets serve a different purpose from many general-purpose cryptocurrencies. Zcash’s zero-knowledge technology gives it a recognizable position in this segment.
However, the long-term investment case depends on whether that technology attracts sustained usage and demand, not simply whether the privacy narrative becomes popular during a market rally.
Network Upgrades and Development
Network improvements can strengthen the project’s technical foundation. Investors should verify the details of each upgrade, including its proposal, governance status, and implementation.
A proposed change should not be treated as a completed development until it is confirmed.
5. The Biggest Risks During a Strong ZEC Rally
Overextended Momentum
When a cryptocurrency rises rapidly, late buyers may enter after much of the move has already occurred. A small correction can then create substantial losses, particularly for leveraged traders.
Breakout confirmation, retests, and volume behavior are useful areas to monitor.
Funding and Leverage
High positive funding can increase the cost of long positions. At the same time, excessive open interest can make the market vulnerable to liquidations in either direction.
A trader should not assume that a strong price trend will continue indefinitely.
Bitcoin and Macro Conditions
ZEC remains part of the broader cryptocurrency market. Bitcoin’s direction, liquidity conditions, interest rates, and overall risk appetite can influence altcoin performance.
A strong $ZEC -specific narrative may support demand, but it does not make the asset immune to broader market corrections.
6. A Practical Trading Framework
The current funding cost is lower than the previous position’s cost, but $1,800 is still a meaningful expense.
A practical approach to managing a leveraged position includes:
Track funding rates: Review the current rate before opening or extending a position.
Control position size: Avoid using excessive leverage simply because the market is moving in your favor.
Define an invalidation level: Decide in advance when the trade thesis is no longer valid.
Monitor open interest and volume: Price movement alone does not reveal the full market structure.
Consider partial profit-taking: If the position moves substantially in your favor, reducing exposure can lower future funding costs and protect part of the gains.
Avoid chasing pumps: A strong rally can continue, but entering late with high leverage creates a different risk profile from holding an earlier position.
7. What Investors Should Watch in ZEC
Market factor
Why it matters
Spot volume
Helps assess the strength of buying activity
Funding rate
Measures the cost of maintaining a leveraged position
Open interest
Shows changes in derivatives positioning
Support and retests
Helps evaluate breakout sustainability
Network development
Provides insight into technical progress
Bitcoin direction
Reflects broader crypto market risk
For ZEC, the important question is not simply how high the price can go. It is whether the market structure, demand, and risk conditions support the position being taken.
Conclusion: Is Lower Funding Cost the Real Success?
The experience of paying $20K in funding fees on one position and only $1.8K on another highlights an important lesson about trading.
A successful trading strategy is not only about identifying a rising asset. It is also about managing the cost of holding the position, controlling leverage, and protecting capital.
Zcash has a distinct privacy-focused technology narrative and an active market that can attract attention from traders and investors. But these factors do not guarantee future price appreciation.
The most important takeaway is this:
Trading is not only about how much profit you make. It is also about how much it costs to achieve that profit.
In a volatile market like $ZEC , capital preservation, disciplined position sizing, and a clear risk-management plan can be more valuable than chasing every price move.
DYOR • NFA • Leverage is risky.
#zec #BitcoinSurpasses$77000 #cryptouniverseofficial #Binance #BinanceSquare
My previous funding cost: $20,000
Current funding cost: $1,800
The current position has used approximately 9% of the funding fees paid on the previous position.
The key lesson is that a trade’s performance cannot be measured by price movement alone. Funding fees, position size, holding time, and market liquidity all matter. When we connect this experience with the market structure and investment narrative surrounding Zcash, several important points emerge for futures traders and crypto investors.
1. Why Funding Fees Matter More Than Many Traders Realize
Funding fees are periodic payments exchanged between long and short traders in perpetual futures contracts. They are generally calculated based on the position’s notional value and the funding rate.
When funding is positive, long traders typically pay short traders. When funding is negative, the opposite may happen.
A trader can be correct about the market direction and still lose a significant amount of money if the cost of maintaining a leveraged position becomes too high.
Imagine holding a large position for an extended period. Even if the market does not move against you, funding fees can gradually reduce your capital. This means that getting the entry price right is only one part of the equation. Managing the cost of staying in the trade is equally important.
In my example, the difference is clear:
Previous funding fees: $20,000.
Current funding fees: $1,800.
Difference: $18,200.
Current fees represent approximately 9% of the previous position’s funding cost.
These numbers do not represent trading profit. They represent the cost of maintaining positions. That distinction matters because a lower funding bill does not automatically mean a profitable trade.
2. Zcash and the Current Market Narrative
Zcash has attracted attention because of its privacy-focused technology, network development, and recent market momentum.
The project uses zero-knowledge proofs to enable privacy-preserving transactions. This gives Zcash a distinct identity within the cryptocurrency market and makes it relevant to investors interested in financial privacy and decentralized technology.
The broader market narrative around ZEC can be divided into three areas.
Privacy and Zero-Knowledge Technology
Zcash’s core value proposition is the ability to verify transactions without necessarily revealing all transaction details. As interest in financial privacy and privacy-preserving digital systems develops, this technology may remain an important part of the project’s long-term narrative.
Network Development
Network upgrades can affect transaction efficiency, user experience, and the future direction of a blockchain. However, investors should distinguish between a proposed upgrade, a governance vote, and an upgrade that has actually been implemented.
Market Activity
ZEC’s price movement and derivatives activity can create opportunities, but they also increase the importance of monitoring funding rates, open interest, and liquidity. Strong momentum does not eliminate risk.
3. The Connection Between Funding Fees and $ZEC
A rising cryptocurrency does not automatically make every long position profitable.
When funding rates are positive and position sizes are large, the cost of holding a long position can increase over time. A trader needs to consider whether the expected price movement is sufficient to cover the funding expense.
For example, a hypothetical $100,000 notional position with a daily funding rate of 0.05% would generate:
Daily funding cost: $50
Over 30 days, the total would be approximately $1,500, assuming the position size and funding rate remain unchanged.
This is only an illustrative calculation, not a current ZEC funding rate.
The lesson is simple: before holding a leveraged position, ask three questions.
What is the current funding rate?
How long do I plan to hold the position?
After funding costs, is the potential return reasonable relative to the risk?
4. The Investment Case for Zcash
Zcash’s long-term value cannot be assessed through a chart alone. Its technology, supply structure, adoption, and market liquidity all deserve consideration.
Limited Supply
Zcash has a maximum supply of 21 million coins, similar to Bitcoin’s fixed-supply model. Limited supply can contribute to a scarcity narrative, but scarcity alone does not guarantee price appreciation. Demand, utility, adoption, and market conditions remain important.
Privacy as a Distinctive Narrative
Privacy-focused digital assets serve a different purpose from many general-purpose cryptocurrencies. Zcash’s zero-knowledge technology gives it a recognizable position in this segment.
However, the long-term investment case depends on whether that technology attracts sustained usage and demand, not simply whether the privacy narrative becomes popular during a market rally.
Network Upgrades and Development
Network improvements can strengthen the project’s technical foundation. Investors should verify the details of each upgrade, including its proposal, governance status, and implementation.
A proposed change should not be treated as a completed development until it is confirmed.
5. The Biggest Risks During a Strong ZEC Rally
Overextended Momentum
When a cryptocurrency rises rapidly, late buyers may enter after much of the move has already occurred. A small correction can then create substantial losses, particularly for leveraged traders.
Breakout confirmation, retests, and volume behavior are useful areas to monitor.
Funding and Leverage
High positive funding can increase the cost of long positions. At the same time, excessive open interest can make the market vulnerable to liquidations in either direction.
A trader should not assume that a strong price trend will continue indefinitely.
Bitcoin and Macro Conditions
ZEC remains part of the broader cryptocurrency market. Bitcoin’s direction, liquidity conditions, interest rates, and overall risk appetite can influence altcoin performance.
A strong $ZEC -specific narrative may support demand, but it does not make the asset immune to broader market corrections.
6. A Practical Trading Framework
The current funding cost is lower than the previous position’s cost, but $1,800 is still a meaningful expense.
A practical approach to managing a leveraged position includes:
Track funding rates: Review the current rate before opening or extending a position.
Control position size: Avoid using excessive leverage simply because the market is moving in your favor.
Define an invalidation level: Decide in advance when the trade thesis is no longer valid.
Monitor open interest and volume: Price movement alone does not reveal the full market structure.
Consider partial profit-taking: If the position moves substantially in your favor, reducing exposure can lower future funding costs and protect part of the gains.
Avoid chasing pumps: A strong rally can continue, but entering late with high leverage creates a different risk profile from holding an earlier position.
7. What Investors Should Watch in ZEC
Market factor
Why it matters
Spot volume
Helps assess the strength of buying activity
Funding rate
Measures the cost of maintaining a leveraged position
Open interest
Shows changes in derivatives positioning
Support and retests
Helps evaluate breakout sustainability
Network development
Provides insight into technical progress
Bitcoin direction
Reflects broader crypto market risk
For ZEC, the important question is not simply how high the price can go. It is whether the market structure, demand, and risk conditions support the position being taken.
Conclusion: Is Lower Funding Cost the Real Success?
The experience of paying $20K in funding fees on one position and only $1.8K on another highlights an important lesson about trading.
A successful trading strategy is not only about identifying a rising asset. It is also about managing the cost of holding the position, controlling leverage, and protecting capital.
Zcash has a distinct privacy-focused technology narrative and an active market that can attract attention from traders and investors. But these factors do not guarantee future price appreciation.
The most important takeaway is this:
Trading is not only about how much profit you make. It is also about how much it costs to achieve that profit.
In a volatile market like $ZEC , capital preservation, disciplined position sizing, and a clear risk-management plan can be more valuable than chasing every price move.
DYOR • NFA • Leverage is risky.
#zec #BitcoinSurpasses$77000 #cryptouniverseofficial #Binance #BinanceSquare
1
323
·
--
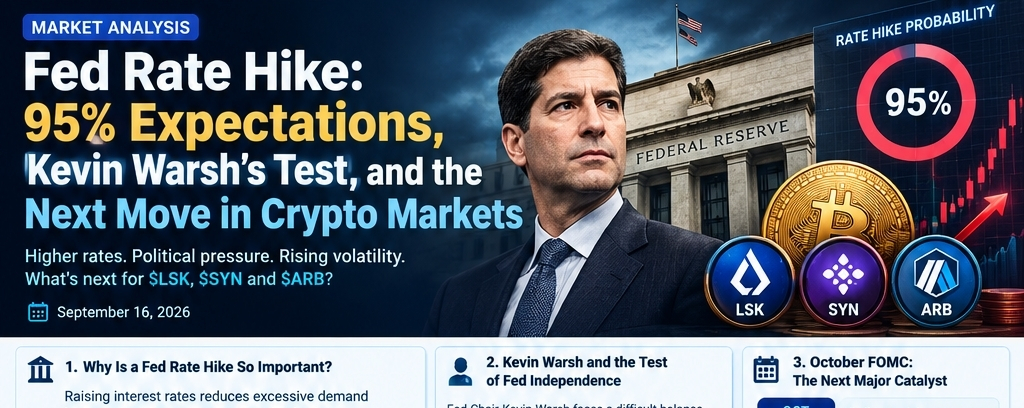
Article
Fed Rate Hike: 95% Expectations, Kevin Warsh’s Test, and the Next Move in Crypto MarketsMacro & Crypto Market Analysis | September 16, 2026
Introduction
With U.S. inflation remaining above the Federal Reserve’s 2% target, markets have developed strong expectations for another interest-rate hike. According to the report, traders are pricing in a nearly 95% probability of a 25-basis-point increase.
However, the bigger question is not simply whether rates will rise. It is how Federal Reserve Chair Kevin Warsh will respond to persistent inflation and political pressure, and whether further rate hikes could follow in the coming months.
This matters for crypto because higher interest rates can affect the U.S. dollar, bond yields, market liquidity, and investor appetite for risk. As a result, altcoins such as LSK, SYN, and ARB could face both opportunities and risks depending on Bitcoin’s direction and broader market conditions.
1. Why Is a Fed Rate Hike So Important?
The primary purpose of raising interest rates is to reduce excessive demand by increasing borrowing costs and bringing inflation closer to the central bank’s target.
However, the impact is not the same across every market. Higher rates can make bonds and cash more attractive, while increasing the cost of capital for companies and investors.
For crypto traders, the key transmission mechanism is:
Fed Rate Hike → Higher Borrowing Costs → Tighter Financial Conditions → Potential Pressure on Risk Assets
This does not mean that every rate hike will automatically cause crypto prices to fall. If the decision has already been priced in, markets may react positively after the announcement. The difference between expectations and the actual decision often matters more than the headline itself.
2. Kevin Warsh and the Test of Fed Independence
Federal Reserve Chair Kevin Warsh faces an important policy moment as inflation remains elevated and political pressure for lower interest rates continues.
President Donald Trump has called for lower rates, while persistent inflation could require the Federal Reserve to maintain a restrictive monetary policy. This creates a difficult balance between supporting economic activity and maintaining price stability.
For investors, the most important question is whether the September hike represents a one-time adjustment or the beginning of a more aggressive tightening cycle.
The answer will depend on upcoming inflation data, employment figures, oil prices, and the Fed’s forward guidance.
3. October FOMC: The Next Major Market Catalyst
The next scheduled FOMC meeting is set for October 27–28, 2026, with the policy decision expected on October 28.
The October meeting could become a major catalyst because investors will have new inflation, employment, and economic growth data after the September decision.
If inflation remains elevated, expectations for additional rate hikes could increase. On the other hand, signs of cooling inflation could lead markets to reassess the need for further tightening.
The reported 43% probability of a second consecutive hike should be treated as a market expectation rather than a confirmed outcome.
4. Potential Impact on Crypto Markets
The reaction of Bitcoin and altcoins to a rate hike will depend on three major factors:
1. Whether the decision matches expectations
If markets have already priced in a 25-basis-point hike, the announcement may have a limited immediate impact.
2. The chairman’s forward guidance
If Kevin Warsh signals that additional hikes may be necessary, bond yields and the dollar could strengthen, potentially creating pressure on risk assets.
3. Liquidity and leverage
Changes in funding rates, open interest, and liquidations can increase volatility, particularly in smaller altcoins.
Therefore, a Fed rate hike does not automatically mean that every cryptocurrency will decline. Bitcoin’s market structure, liquidity conditions, and investor positioning remain equally important.
LSK, SYN, and ARB: Three Altcoins Worth Watching
5. $LSK — Lisk: Market Structure After a Rally
Ticker: LSK
Lisk is an Ethereum-based Layer 2 blockchain focused on scaling and developer ecosystems.
The main investment question for LSK is whether a rapid price increase is being supported by genuine demand and network development, or whether the move is primarily driven by short-term speculation.
Recent market analysis has highlighted volatility in the altcoin sector and the importance of monitoring support levels, trading volume, and Bitcoin’s direction.
Investment Thesis
Lisk’s Layer 2 infrastructure and developer-focused narrative could create opportunities if network usage and ecosystem activity continue to grow.
However, the token’s price needs to remain aligned with actual adoption, developer activity, and long-term demand.
What Traders Should Watch
Daily and 4H market structure.
Volume confirmation during breakouts.
Bitcoin’s overall trend.
Funding rates and open interest.
Whether previous resistance levels turn into support.
Investment perspective: Rather than chasing a sharp rally, investors may focus on whether LSK can build a stronger market structure and demonstrate sustainable demand.
6. $SYN — Synapse: Cross-Chain Infrastructure and Derivatives
Ticker: SYN
Synapse is associated with cross-chain infrastructure and a growing derivatives-focused narrative.
Recent analysis has highlighted its Hypercall options DEX as a potential area of development. The important question is whether this narrative translates into real users, trading volume, and sustainable protocol activity.
Potential Investment Thesis
Growing demand for cross-chain liquidity could support the broader ecosystem.
New products and integrations may create additional use cases.
Increased trading volume can attract attention, but volume alone does not guarantee long-term demand.
Risks
Smaller altcoins can experience sharp price movements when liquidity declines. If Bitcoin weakens during a period of restrictive monetary policy, selling pressure could spread quickly into smaller tokens.
Watchlist: The previously reported $0.08 support and $0.09 resistance levels can be monitored as historical reference points, but they must be verified against the live chart before making any trading decision.
7. $ARB — Arbitrum: Layer 2 Adoption, Unlocks, and Valuation
Ticker: ARB
Arbitrum is an Ethereum Layer 2 network focused on transaction scaling and ecosystem development.
The investment case for ARB depends on network usage, DeFi activity, token supply, unlock schedules, and broader market liquidity.
Recent market analysis highlighted a reported token unlock of approximately 93 million ARB on September 16, 2026. Token unlocks can create additional selling pressure, particularly when demand is weak.
Why ARB Remains on the Watchlist
Layer 2 adoption: Growing use of Ethereum scaling infrastructure could strengthen the long-term ecosystem narrative.
Token unlocks: Additional supply entering the market may affect price performance and investor positioning.
Technical structure: A rally supported by volume and sustainable support levels is more informative than a short-lived price spike.
Investment Perspective
The key question is whether recent price movements are supported by new demand or whether traders are taking profits around supply events.
Investors should consider both Arbitrum’s network activity and the valuation of the ARB token itself.
8. Comparing the Three Altcoins
Token
Core Narrative
Key Focus
LSK
Layer 2 and developer ecosystem
Market structure, volume, adoption
SYN
Cross-chain and derivatives
Product adoption, liquidity
ARB
Ethereum Layer 2
Network usage, unlocks, valuation
A strong project narrative does not automatically make a token a strong investment. Supply, valuation, liquidity, and market demand can all influence returns.
9. Risk Management Before the Fed Decision
Scenario 1: Expected Hike, Softer Guidance
If the Fed raises rates by 25 basis points but signals caution about future hikes, markets could interpret the decision as less restrictive than feared.
Bitcoin and altcoins may experience a relief rally, although this is not guaranteed.
Scenario 2: Rate Hike and Hawkish Guidance
If the Fed signals that additional hikes may be necessary, higher bond yields and a stronger dollar could create pressure on risk assets.
In this environment, smaller altcoins may face increased volatility and liquidity risks.
Scenario 3: No Rate Hike
If the Fed pauses, markets could react positively to lower rate expectations. However, a pause could also raise concerns that inflation remains difficult to control.
A pause does not automatically mean that crypto markets will turn bullish.
Final Thoughts: Macro First, Narrative Second
The reported 95% rate-hike expectation is an important market signal, but the bigger issue is how the Federal Reserve’s future policy will affect liquidity and risk appetite.
LSK, SYN, and ARB each have distinct narratives, but their performance remains connected to Bitcoin’s market structure, broader liquidity, and genuine project demand.
Before entering any position, investors should consider not only the potential upside but also token unlocks, trading volume, support levels, and funding conditions.
DYOR • NFA
Crypto markets are highly volatile. Changes in interest rates, political decisions, token supply, and liquidity can cause rapid price movements. Always conduct your own research and size positions according to your risk tolerance.
Sources
Reuters — Warsh’s words may matter more than the anticipated Fed rate hike.
Federal Reserve — FOMC meeting calendar.
CoinMarketCap — Lisk price analysis.
CoinMarketCap — Synapse price analysis.
CoinMarketCap — Arbitrum price analysis.
{spot}(ARBUSDT)
{spot}(SYNUSDT)
{spot}(LSKUSDT)
#FedRateWatch #LSK #SYN #ARB #Binance
Fed Rate Hike: 95% Expectations, Kevin Warsh’s Test, and the Next Move in Crypto Markets
Macro & Crypto Market Analysis | September 16, 2026
Introduction
With U.S. inflation remaining above the Federal Reserve’s 2% target, markets have developed strong expectations for another interest-rate hike. According to the report, traders are pricing in a nearly 95% probability of a 25-basis-point increase.
However, the bigger question is not simply whether rates will rise. It is how Federal Reserve Chair Kevin Warsh will respond to persistent inflation and political pressure, and whether further rate hikes could follow in the coming months.
This matters for crypto because higher interest rates can affect the U.S. dollar, bond yields, market liquidity, and investor appetite for risk. As a result, altcoins such as LSK, SYN, and ARB could face both opportunities and risks depending on Bitcoin’s direction and broader market conditions.
1. Why Is a Fed Rate Hike So Important?
The primary purpose of raising interest rates is to reduce excessive demand by increasing borrowing costs and bringing inflation closer to the central bank’s target.
However, the impact is not the same across every market. Higher rates can make bonds and cash more attractive, while increasing the cost of capital for companies and investors.
For crypto traders, the key transmission mechanism is:
Fed Rate Hike → Higher Borrowing Costs → Tighter Financial Conditions → Potential Pressure on Risk Assets
This does not mean that every rate hike will automatically cause crypto prices to fall. If the decision has already been priced in, markets may react positively after the announcement. The difference between expectations and the actual decision often matters more than the headline itself.
2. Kevin Warsh and the Test of Fed Independence
Federal Reserve Chair Kevin Warsh faces an important policy moment as inflation remains elevated and political pressure for lower interest rates continues.
President Donald Trump has called for lower rates, while persistent inflation could require the Federal Reserve to maintain a restrictive monetary policy. This creates a difficult balance between supporting economic activity and maintaining price stability.
For investors, the most important question is whether the September hike represents a one-time adjustment or the beginning of a more aggressive tightening cycle.
The answer will depend on upcoming inflation data, employment figures, oil prices, and the Fed’s forward guidance.
3. October FOMC: The Next Major Market Catalyst
The next scheduled FOMC meeting is set for October 27–28, 2026, with the policy decision expected on October 28.
The October meeting could become a major catalyst because investors will have new inflation, employment, and economic growth data after the September decision.
If inflation remains elevated, expectations for additional rate hikes could increase. On the other hand, signs of cooling inflation could lead markets to reassess the need for further tightening.
The reported 43% probability of a second consecutive hike should be treated as a market expectation rather than a confirmed outcome.
4. Potential Impact on Crypto Markets
The reaction of Bitcoin and altcoins to a rate hike will depend on three major factors:
1. Whether the decision matches expectations
If markets have already priced in a 25-basis-point hike, the announcement may have a limited immediate impact.
2. The chairman’s forward guidance
If Kevin Warsh signals that additional hikes may be necessary, bond yields and the dollar could strengthen, potentially creating pressure on risk assets.
3. Liquidity and leverage
Changes in funding rates, open interest, and liquidations can increase volatility, particularly in smaller altcoins.
Therefore, a Fed rate hike does not automatically mean that every cryptocurrency will decline. Bitcoin’s market structure, liquidity conditions, and investor positioning remain equally important.
LSK, SYN, and ARB: Three Altcoins Worth Watching
5. $LSK — Lisk: Market Structure After a Rally
Ticker: LSK
Lisk is an Ethereum-based Layer 2 blockchain focused on scaling and developer ecosystems.
The main investment question for LSK is whether a rapid price increase is being supported by genuine demand and network development, or whether the move is primarily driven by short-term speculation.
Recent market analysis has highlighted volatility in the altcoin sector and the importance of monitoring support levels, trading volume, and Bitcoin’s direction.
Investment Thesis
Lisk’s Layer 2 infrastructure and developer-focused narrative could create opportunities if network usage and ecosystem activity continue to grow.
However, the token’s price needs to remain aligned with actual adoption, developer activity, and long-term demand.
What Traders Should Watch
Daily and 4H market structure.
Volume confirmation during breakouts.
Bitcoin’s overall trend.
Funding rates and open interest.
Whether previous resistance levels turn into support.
Investment perspective: Rather than chasing a sharp rally, investors may focus on whether LSK can build a stronger market structure and demonstrate sustainable demand.
6. $SYN — Synapse: Cross-Chain Infrastructure and Derivatives
Ticker: SYN
Synapse is associated with cross-chain infrastructure and a growing derivatives-focused narrative.
Recent analysis has highlighted its Hypercall options DEX as a potential area of development. The important question is whether this narrative translates into real users, trading volume, and sustainable protocol activity.
Potential Investment Thesis
Growing demand for cross-chain liquidity could support the broader ecosystem.
New products and integrations may create additional use cases.
Increased trading volume can attract attention, but volume alone does not guarantee long-term demand.
Risks
Smaller altcoins can experience sharp price movements when liquidity declines. If Bitcoin weakens during a period of restrictive monetary policy, selling pressure could spread quickly into smaller tokens.
Watchlist: The previously reported $0.08 support and $0.09 resistance levels can be monitored as historical reference points, but they must be verified against the live chart before making any trading decision.
7. $ARB — Arbitrum: Layer 2 Adoption, Unlocks, and Valuation
Ticker: ARB
Arbitrum is an Ethereum Layer 2 network focused on transaction scaling and ecosystem development.
The investment case for ARB depends on network usage, DeFi activity, token supply, unlock schedules, and broader market liquidity.
Recent market analysis highlighted a reported token unlock of approximately 93 million ARB on September 16, 2026. Token unlocks can create additional selling pressure, particularly when demand is weak.
Why ARB Remains on the Watchlist
Layer 2 adoption: Growing use of Ethereum scaling infrastructure could strengthen the long-term ecosystem narrative.
Token unlocks: Additional supply entering the market may affect price performance and investor positioning.
Technical structure: A rally supported by volume and sustainable support levels is more informative than a short-lived price spike.
Investment Perspective
The key question is whether recent price movements are supported by new demand or whether traders are taking profits around supply events.
Investors should consider both Arbitrum’s network activity and the valuation of the ARB token itself.
8. Comparing the Three Altcoins
Token
Core Narrative
Key Focus
LSK
Layer 2 and developer ecosystem
Market structure, volume, adoption
SYN
Cross-chain and derivatives
Product adoption, liquidity
ARB
Ethereum Layer 2
Network usage, unlocks, valuation
A strong project narrative does not automatically make a token a strong investment. Supply, valuation, liquidity, and market demand can all influence returns.
9. Risk Management Before the Fed Decision
Scenario 1: Expected Hike, Softer Guidance
If the Fed raises rates by 25 basis points but signals caution about future hikes, markets could interpret the decision as less restrictive than feared.
Bitcoin and altcoins may experience a relief rally, although this is not guaranteed.
Scenario 2: Rate Hike and Hawkish Guidance
If the Fed signals that additional hikes may be necessary, higher bond yields and a stronger dollar could create pressure on risk assets.
In this environment, smaller altcoins may face increased volatility and liquidity risks.
Scenario 3: No Rate Hike
If the Fed pauses, markets could react positively to lower rate expectations. However, a pause could also raise concerns that inflation remains difficult to control.
A pause does not automatically mean that crypto markets will turn bullish.
Final Thoughts: Macro First, Narrative Second
The reported 95% rate-hike expectation is an important market signal, but the bigger issue is how the Federal Reserve’s future policy will affect liquidity and risk appetite.
LSK, SYN, and ARB each have distinct narratives, but their performance remains connected to Bitcoin’s market structure, broader liquidity, and genuine project demand.
Before entering any position, investors should consider not only the potential upside but also token unlocks, trading volume, support levels, and funding conditions.
DYOR • NFA
Crypto markets are highly volatile. Changes in interest rates, political decisions, token supply, and liquidity can cause rapid price movements. Always conduct your own research and size positions according to your risk tolerance.
Sources
Reuters — Warsh’s words may matter more than the anticipated Fed rate hike.
Federal Reserve — FOMC meeting calendar.
CoinMarketCap — Lisk price analysis.
CoinMarketCap — Synapse price analysis.
CoinMarketCap — Arbitrum price analysis.
#FedRateWatch #LSK #SYN #ARB #Binance
Introduction
With U.S. inflation remaining above the Federal Reserve’s 2% target, markets have developed strong expectations for another interest-rate hike. According to the report, traders are pricing in a nearly 95% probability of a 25-basis-point increase.
However, the bigger question is not simply whether rates will rise. It is how Federal Reserve Chair Kevin Warsh will respond to persistent inflation and political pressure, and whether further rate hikes could follow in the coming months.
This matters for crypto because higher interest rates can affect the U.S. dollar, bond yields, market liquidity, and investor appetite for risk. As a result, altcoins such as LSK, SYN, and ARB could face both opportunities and risks depending on Bitcoin’s direction and broader market conditions.
1. Why Is a Fed Rate Hike So Important?
The primary purpose of raising interest rates is to reduce excessive demand by increasing borrowing costs and bringing inflation closer to the central bank’s target.
However, the impact is not the same across every market. Higher rates can make bonds and cash more attractive, while increasing the cost of capital for companies and investors.
For crypto traders, the key transmission mechanism is:
Fed Rate Hike → Higher Borrowing Costs → Tighter Financial Conditions → Potential Pressure on Risk Assets
This does not mean that every rate hike will automatically cause crypto prices to fall. If the decision has already been priced in, markets may react positively after the announcement. The difference between expectations and the actual decision often matters more than the headline itself.
2. Kevin Warsh and the Test of Fed Independence
Federal Reserve Chair Kevin Warsh faces an important policy moment as inflation remains elevated and political pressure for lower interest rates continues.
President Donald Trump has called for lower rates, while persistent inflation could require the Federal Reserve to maintain a restrictive monetary policy. This creates a difficult balance between supporting economic activity and maintaining price stability.
For investors, the most important question is whether the September hike represents a one-time adjustment or the beginning of a more aggressive tightening cycle.
The answer will depend on upcoming inflation data, employment figures, oil prices, and the Fed’s forward guidance.
3. October FOMC: The Next Major Market Catalyst
The next scheduled FOMC meeting is set for October 27–28, 2026, with the policy decision expected on October 28.
The October meeting could become a major catalyst because investors will have new inflation, employment, and economic growth data after the September decision.
If inflation remains elevated, expectations for additional rate hikes could increase. On the other hand, signs of cooling inflation could lead markets to reassess the need for further tightening.
The reported 43% probability of a second consecutive hike should be treated as a market expectation rather than a confirmed outcome.
4. Potential Impact on Crypto Markets
The reaction of Bitcoin and altcoins to a rate hike will depend on three major factors:
1. Whether the decision matches expectations
If markets have already priced in a 25-basis-point hike, the announcement may have a limited immediate impact.
2. The chairman’s forward guidance
If Kevin Warsh signals that additional hikes may be necessary, bond yields and the dollar could strengthen, potentially creating pressure on risk assets.
3. Liquidity and leverage
Changes in funding rates, open interest, and liquidations can increase volatility, particularly in smaller altcoins.
Therefore, a Fed rate hike does not automatically mean that every cryptocurrency will decline. Bitcoin’s market structure, liquidity conditions, and investor positioning remain equally important.
LSK, SYN, and ARB: Three Altcoins Worth Watching
5. $LSK — Lisk: Market Structure After a Rally
Ticker: LSK
Lisk is an Ethereum-based Layer 2 blockchain focused on scaling and developer ecosystems.
The main investment question for LSK is whether a rapid price increase is being supported by genuine demand and network development, or whether the move is primarily driven by short-term speculation.
Recent market analysis has highlighted volatility in the altcoin sector and the importance of monitoring support levels, trading volume, and Bitcoin’s direction.
Investment Thesis
Lisk’s Layer 2 infrastructure and developer-focused narrative could create opportunities if network usage and ecosystem activity continue to grow.
However, the token’s price needs to remain aligned with actual adoption, developer activity, and long-term demand.
What Traders Should Watch
Daily and 4H market structure.
Volume confirmation during breakouts.
Bitcoin’s overall trend.
Funding rates and open interest.
Whether previous resistance levels turn into support.
Investment perspective: Rather than chasing a sharp rally, investors may focus on whether LSK can build a stronger market structure and demonstrate sustainable demand.
6. $SYN — Synapse: Cross-Chain Infrastructure and Derivatives
Ticker: SYN
Synapse is associated with cross-chain infrastructure and a growing derivatives-focused narrative.
Recent analysis has highlighted its Hypercall options DEX as a potential area of development. The important question is whether this narrative translates into real users, trading volume, and sustainable protocol activity.
Potential Investment Thesis
Growing demand for cross-chain liquidity could support the broader ecosystem.
New products and integrations may create additional use cases.
Increased trading volume can attract attention, but volume alone does not guarantee long-term demand.
Risks
Smaller altcoins can experience sharp price movements when liquidity declines. If Bitcoin weakens during a period of restrictive monetary policy, selling pressure could spread quickly into smaller tokens.
Watchlist: The previously reported $0.08 support and $0.09 resistance levels can be monitored as historical reference points, but they must be verified against the live chart before making any trading decision.
7. $ARB — Arbitrum: Layer 2 Adoption, Unlocks, and Valuation
Ticker: ARB
Arbitrum is an Ethereum Layer 2 network focused on transaction scaling and ecosystem development.
The investment case for ARB depends on network usage, DeFi activity, token supply, unlock schedules, and broader market liquidity.
Recent market analysis highlighted a reported token unlock of approximately 93 million ARB on September 16, 2026. Token unlocks can create additional selling pressure, particularly when demand is weak.
Why ARB Remains on the Watchlist
Layer 2 adoption: Growing use of Ethereum scaling infrastructure could strengthen the long-term ecosystem narrative.
Token unlocks: Additional supply entering the market may affect price performance and investor positioning.
Technical structure: A rally supported by volume and sustainable support levels is more informative than a short-lived price spike.
Investment Perspective
The key question is whether recent price movements are supported by new demand or whether traders are taking profits around supply events.
Investors should consider both Arbitrum’s network activity and the valuation of the ARB token itself.
8. Comparing the Three Altcoins
Token
Core Narrative
Key Focus
LSK
Layer 2 and developer ecosystem
Market structure, volume, adoption
SYN
Cross-chain and derivatives
Product adoption, liquidity
ARB
Ethereum Layer 2
Network usage, unlocks, valuation
A strong project narrative does not automatically make a token a strong investment. Supply, valuation, liquidity, and market demand can all influence returns.
9. Risk Management Before the Fed Decision
Scenario 1: Expected Hike, Softer Guidance
If the Fed raises rates by 25 basis points but signals caution about future hikes, markets could interpret the decision as less restrictive than feared.
Bitcoin and altcoins may experience a relief rally, although this is not guaranteed.
Scenario 2: Rate Hike and Hawkish Guidance
If the Fed signals that additional hikes may be necessary, higher bond yields and a stronger dollar could create pressure on risk assets.
In this environment, smaller altcoins may face increased volatility and liquidity risks.
Scenario 3: No Rate Hike
If the Fed pauses, markets could react positively to lower rate expectations. However, a pause could also raise concerns that inflation remains difficult to control.
A pause does not automatically mean that crypto markets will turn bullish.
Final Thoughts: Macro First, Narrative Second
The reported 95% rate-hike expectation is an important market signal, but the bigger issue is how the Federal Reserve’s future policy will affect liquidity and risk appetite.
LSK, SYN, and ARB each have distinct narratives, but their performance remains connected to Bitcoin’s market structure, broader liquidity, and genuine project demand.
Before entering any position, investors should consider not only the potential upside but also token unlocks, trading volume, support levels, and funding conditions.
DYOR • NFA
Crypto markets are highly volatile. Changes in interest rates, political decisions, token supply, and liquidity can cause rapid price movements. Always conduct your own research and size positions according to your risk tolerance.
Sources
Reuters — Warsh’s words may matter more than the anticipated Fed rate hike.
Federal Reserve — FOMC meeting calendar.
CoinMarketCap — Lisk price analysis.
CoinMarketCap — Synapse price analysis.
CoinMarketCap — Arbitrum price analysis.
#FedRateWatch #LSK #SYN #ARB #Binance
1
297
·
--
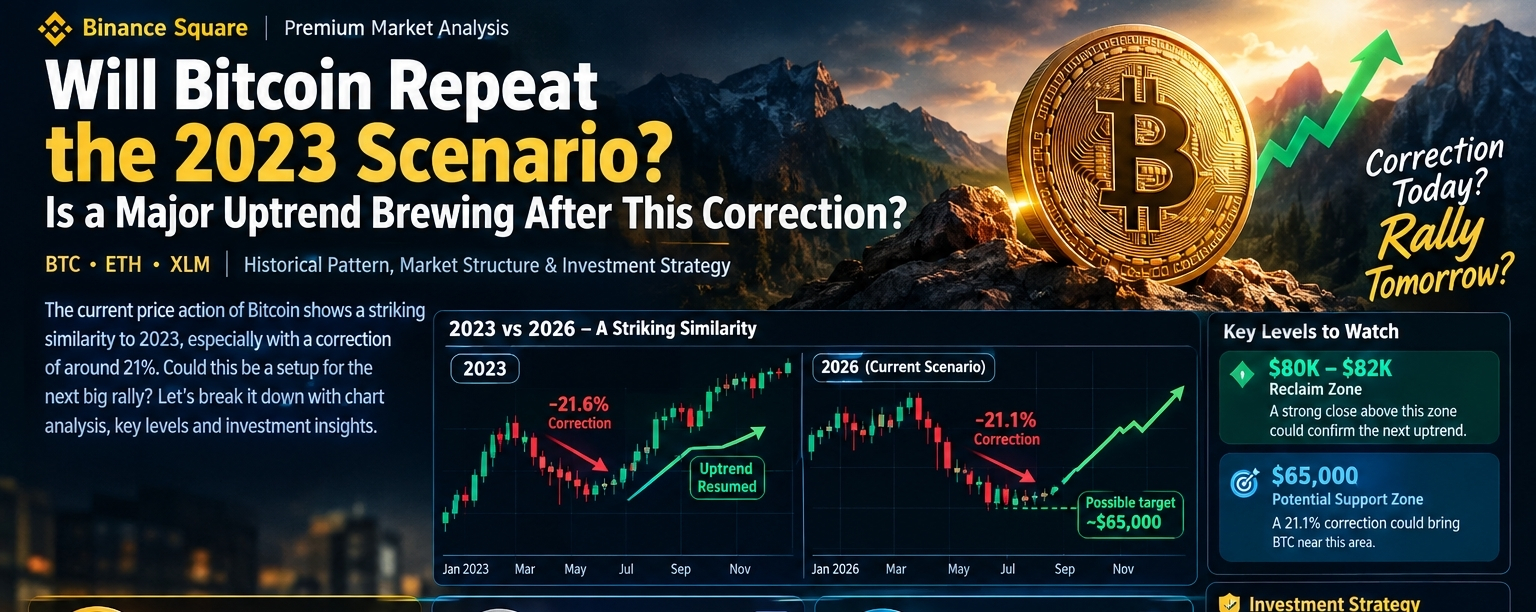
Article
Will Bitcoin Repeat the 2023 Scenario? Is a Major Uptrend Brewing After This Correction?BTC • ETH • XLM | Historical Pattern, Market Structure & Investment Strategy
Is Bitcoin Preparing for Another Major Rally?
There are moments in the crypto market when the current price action shows a striking resemblance to an important phase from the past. Bitcoin’s 2023 price movement and the current 2026 scenario are being compared for exactly this reason. The similarity in their approximately 21% corrections has caught the attention of investors.
But the real question is: Is this correction a preparation for a new major uptrend, or could it be the beginning of a deeper market decline?
To understand these possibilities, we need to look beyond the chart pattern. Bitcoin’s support and resistance levels, market structure, liquidity, institutional demand, and the performance of major altcoins such as Ethereum and Stellar all deserve attention.
1. What Can We Learn From Bitcoin’s 2023 Correction?
In 2023, Bitcoin experienced a correction of approximately 21.6% during a broader uptrend. The market subsequently resumed its upward movement. This is why the current price action is being compared with that period, as the present scenario suggests a similar correction of roughly 21.1%.
The difference between the two corrections is only 0.5 percentage points. That makes the comparison interesting, but it does not guarantee the same outcome.
A key investment insight is that a major correction does not always mean the uptrend has ended. In a strong market, corrections can reduce excessive leverage and create opportunities for new buyers to enter.
However, the macroeconomic environment, liquidity conditions, and institutional participation in 2023 were different from today. Therefore, assuming that the same percentage correction will produce the same result would be risky.
2. Could $65,000 Become a Potential Accumulation Zone?
According to the chart comparison, applying a correction of approximately 21.1% to the reference price could bring Bitcoin toward the $65,000 area. This is a potential scenario, not a confirmed future price target.
The $65K region could become attractive if:
Previous demand zones or support levels hold.
Selling pressure weakens and buying interest increases.
Bitcoin forms a strong higher-timeframe candle close.
Open Interest remains healthy rather than rising excessively through leverage.
Spot buying provides genuine demand.
On the other hand, if Bitcoin reaches this area and continues forming lower highs and lower lows, it should not automatically be considered an accumulation zone.
The strength of a support zone is determined by how the market reacts there, not simply by the price reaching that level.
3. The $80,000–$82,000 Reclaim: A Key Confirmation
One of the most important technical levels in this scenario is the $80,000–$82,000 region.
A potential bullish sequence could look like this:
Correction → Base Formation → Resistance Reclaim → Potential Higher High
If Bitcoin reclaims $80K–$82K with a strong close and successfully retests that zone as support, market confidence could improve. This would strengthen the possibility of a new upward wave.
However, a single wick or temporary pump is not enough. Traders should monitor daily closes, trading volume, spot demand, and futures funding rates together. A breakout supported by weak volume can easily turn into a false breakout.
4. Bitcoin ($BTC ): A New Opportunity After the Correction?
Bitcoin’s correction is not just a chart pattern. It could play an important role in determining the next direction of the entire crypto market, as BTC remains a major indicator of liquidity and risk appetite.
If Bitcoin holds a potential demand zone near $65K and begins forming a strong base, investor confidence could gradually return. A successful base formation followed by a reclaim of $80K–$82K could create a new bullish market structure.
But there is also a clear risk. If Bitcoin fails to hold its support and selling pressure continues, treating the 21% correction as merely a temporary dip could be a mistake.
Important BTC Signals to Watch
Bullish confirmation: Support holds, a higher low forms, and Bitcoin closes strongly above $80K–$82K.
Bearish confirmation: Support breaks, lower highs and lower lows develop, and rebounds occur with weak volume.
5. Ethereum ($ETH ): A Potential Rotation Candidate
Ethereum could attract renewed investor interest if Bitcoin stabilizes and begins another strong uptrend. ETH’s potential upside depends not only on Bitcoin’s performance but also on its own market structure and relative strength against BTC.
Ethereum’s investment case is supported by its smart contract ecosystem, DeFi, Layer-2 networks, and large developer community. However, strong fundamentals do not guarantee short-term price appreciation. ETH remains sensitive to Bitcoin’s direction, macro liquidity, and overall risk appetite.
A More Investment-Friendly ETH Strategy
A potential bullish scenario would be Bitcoin reclaiming its key resistance levels first, followed by Ethereum forming a higher low and breaking its own resistance.
This could create an opportunity to consider gradual entries rather than chasing a sudden pump.
If Bitcoin cannot hold its potential $65K support zone, Ethereum could experience even greater volatility because of its higher-beta characteristics. Therefore, taking excessive risk in ETH without confirmation from Bitcoin may not be a prudent approach.
6. Stellar ($XLM ): The Potential of the Payments Narrative
Stellar is another project that could attract investor attention if the crypto market enters a new bullish phase.
Its core focus is enabling fast, relatively low-cost cross-border payments and digital asset transfers. This gives XLM a different investment narrative from Bitcoin and Ethereum.
However, a strong payments narrative alone does not guarantee that the token price will rise. Investors should evaluate network usage, real-world adoption, liquidity, token supply, and broader market conditions.
How Could XLM Benefit From BTC and ETH Strength?
If Bitcoin begins a strong uptrend and capital rotates into major altcoins such as Ethereum, projects like Stellar could benefit from broader market momentum.
But XLM should not be purchased solely because Bitcoin may recover from its correction. Long-term adoption and actual network utility remain important factors in evaluating its investment potential.
7. How to Analyze These Three Cryptocurrencies Together
A potential market rotation framework could be:
1. Bitcoin leads: BTC holds support and reclaims $80K–$82K.
2. Ethereum confirms: ETH breaks resistance and demonstrates relative strength.
3. Altcoin rotation: Payment-focused projects such as XLM begin attracting stronger demand and trading volume.
This is a possible market scenario, not a guaranteed sequence. Sometimes BTC, ETH, and XLM can rise together, while at other times their strength may appear at different stages.
8. Risk Management Before Investing
No matter how attractive a correction scenario appears, capital preservation should remain the priority.
Bitcoin may or may not reach $65K. Likewise, a repeat of the 2023 uptrend is not guaranteed.
Some practical principles to consider:
Consider scaling into positions rather than investing all capital at once.
Avoid excessive leverage without confirmation of Bitcoin’s trend.
Monitor liquidity and market structure when evaluating ETH and XLM.
Reduce positions according to predetermined risk limits if support breaks.
Compare funding rates, Open Interest, and liquidation data with price action.
Do not enter the market out of FOMO simply because a historical chart pattern looks similar.
Conclusion: Is This Correction Creating an Opportunity for the Next Major Rally?
The comparison between Bitcoin’s 2023 and 2026 price action raises an important question. The similarity in their approximately 21% corrections and the potential $65K zone create an interesting scenario for investors.
If BTC finds support near that area and reclaims $80K–$82K, the possibility of a new uptrend could increase.
But history does not guarantee the same result. The scenario must be confirmed through price structure, liquidity, and genuine buying demand.
In my view, the most important factor is not the depth of the correction, but how the market reacts afterward. If Bitcoin strengthens, cryptocurrencies such as ETH and XLM could also attract renewed investment interest. If support breaks, however, greater caution will be necessary.
DYOR. Before making any trading or investment decision, consider your own risk tolerance and capital. This is not financial advice.
What Do You Think?
Are we seeing a correction before the next major Bitcoin uptrend, or could the market experience another deeper decline?
#Bitcoin #BTC #ETH #XLM #BinanceSquare
{spot}(BTCUSDT)
{spot}(ETHUSDT)
{spot}(XLMUSDT)
Will Bitcoin Repeat the 2023 Scenario? Is a Major Uptrend Brewing After This Correction?
BTC • ETH • XLM | Historical Pattern, Market Structure & Investment Strategy
Is Bitcoin Preparing for Another Major Rally?
There are moments in the crypto market when the current price action shows a striking resemblance to an important phase from the past. Bitcoin’s 2023 price movement and the current 2026 scenario are being compared for exactly this reason. The similarity in their approximately 21% corrections has caught the attention of investors.
But the real question is: Is this correction a preparation for a new major uptrend, or could it be the beginning of a deeper market decline?
To understand these possibilities, we need to look beyond the chart pattern. Bitcoin’s support and resistance levels, market structure, liquidity, institutional demand, and the performance of major altcoins such as Ethereum and Stellar all deserve attention.
1. What Can We Learn From Bitcoin’s 2023 Correction?
In 2023, Bitcoin experienced a correction of approximately 21.6% during a broader uptrend. The market subsequently resumed its upward movement. This is why the current price action is being compared with that period, as the present scenario suggests a similar correction of roughly 21.1%.
The difference between the two corrections is only 0.5 percentage points. That makes the comparison interesting, but it does not guarantee the same outcome.
A key investment insight is that a major correction does not always mean the uptrend has ended. In a strong market, corrections can reduce excessive leverage and create opportunities for new buyers to enter.
However, the macroeconomic environment, liquidity conditions, and institutional participation in 2023 were different from today. Therefore, assuming that the same percentage correction will produce the same result would be risky.
2. Could $65,000 Become a Potential Accumulation Zone?
According to the chart comparison, applying a correction of approximately 21.1% to the reference price could bring Bitcoin toward the $65,000 area. This is a potential scenario, not a confirmed future price target.
The $65K region could become attractive if:
Previous demand zones or support levels hold.
Selling pressure weakens and buying interest increases.
Bitcoin forms a strong higher-timeframe candle close.
Open Interest remains healthy rather than rising excessively through leverage.
Spot buying provides genuine demand.
On the other hand, if Bitcoin reaches this area and continues forming lower highs and lower lows, it should not automatically be considered an accumulation zone.
The strength of a support zone is determined by how the market reacts there, not simply by the price reaching that level.
3. The $80,000–$82,000 Reclaim: A Key Confirmation
One of the most important technical levels in this scenario is the $80,000–$82,000 region.
A potential bullish sequence could look like this:
Correction → Base Formation → Resistance Reclaim → Potential Higher High
If Bitcoin reclaims $80K–$82K with a strong close and successfully retests that zone as support, market confidence could improve. This would strengthen the possibility of a new upward wave.
However, a single wick or temporary pump is not enough. Traders should monitor daily closes, trading volume, spot demand, and futures funding rates together. A breakout supported by weak volume can easily turn into a false breakout.
4. Bitcoin ($BTC ): A New Opportunity After the Correction?
Bitcoin’s correction is not just a chart pattern. It could play an important role in determining the next direction of the entire crypto market, as BTC remains a major indicator of liquidity and risk appetite.
If Bitcoin holds a potential demand zone near $65K and begins forming a strong base, investor confidence could gradually return. A successful base formation followed by a reclaim of $80K–$82K could create a new bullish market structure.
But there is also a clear risk. If Bitcoin fails to hold its support and selling pressure continues, treating the 21% correction as merely a temporary dip could be a mistake.
Important BTC Signals to Watch
Bullish confirmation: Support holds, a higher low forms, and Bitcoin closes strongly above $80K–$82K.
Bearish confirmation: Support breaks, lower highs and lower lows develop, and rebounds occur with weak volume.
5. Ethereum ($ETH ): A Potential Rotation Candidate
Ethereum could attract renewed investor interest if Bitcoin stabilizes and begins another strong uptrend. ETH’s potential upside depends not only on Bitcoin’s performance but also on its own market structure and relative strength against BTC.
Ethereum’s investment case is supported by its smart contract ecosystem, DeFi, Layer-2 networks, and large developer community. However, strong fundamentals do not guarantee short-term price appreciation. ETH remains sensitive to Bitcoin’s direction, macro liquidity, and overall risk appetite.
A More Investment-Friendly ETH Strategy
A potential bullish scenario would be Bitcoin reclaiming its key resistance levels first, followed by Ethereum forming a higher low and breaking its own resistance.
This could create an opportunity to consider gradual entries rather than chasing a sudden pump.
If Bitcoin cannot hold its potential $65K support zone, Ethereum could experience even greater volatility because of its higher-beta characteristics. Therefore, taking excessive risk in ETH without confirmation from Bitcoin may not be a prudent approach.
6. Stellar ($XLM ): The Potential of the Payments Narrative
Stellar is another project that could attract investor attention if the crypto market enters a new bullish phase.
Its core focus is enabling fast, relatively low-cost cross-border payments and digital asset transfers. This gives XLM a different investment narrative from Bitcoin and Ethereum.
However, a strong payments narrative alone does not guarantee that the token price will rise. Investors should evaluate network usage, real-world adoption, liquidity, token supply, and broader market conditions.
How Could XLM Benefit From BTC and ETH Strength?
If Bitcoin begins a strong uptrend and capital rotates into major altcoins such as Ethereum, projects like Stellar could benefit from broader market momentum.
But XLM should not be purchased solely because Bitcoin may recover from its correction. Long-term adoption and actual network utility remain important factors in evaluating its investment potential.
7. How to Analyze These Three Cryptocurrencies Together
A potential market rotation framework could be:
1. Bitcoin leads: BTC holds support and reclaims $80K–$82K.
2. Ethereum confirms: ETH breaks resistance and demonstrates relative strength.
3. Altcoin rotation: Payment-focused projects such as XLM begin attracting stronger demand and trading volume.
This is a possible market scenario, not a guaranteed sequence. Sometimes BTC, ETH, and XLM can rise together, while at other times their strength may appear at different stages.
8. Risk Management Before Investing
No matter how attractive a correction scenario appears, capital preservation should remain the priority.
Bitcoin may or may not reach $65K. Likewise, a repeat of the 2023 uptrend is not guaranteed.
Some practical principles to consider:
Consider scaling into positions rather than investing all capital at once.
Avoid excessive leverage without confirmation of Bitcoin’s trend.
Monitor liquidity and market structure when evaluating ETH and XLM.
Reduce positions according to predetermined risk limits if support breaks.
Compare funding rates, Open Interest, and liquidation data with price action.
Do not enter the market out of FOMO simply because a historical chart pattern looks similar.
Conclusion: Is This Correction Creating an Opportunity for the Next Major Rally?
The comparison between Bitcoin’s 2023 and 2026 price action raises an important question. The similarity in their approximately 21% corrections and the potential $65K zone create an interesting scenario for investors.
If BTC finds support near that area and reclaims $80K–$82K, the possibility of a new uptrend could increase.
But history does not guarantee the same result. The scenario must be confirmed through price structure, liquidity, and genuine buying demand.
In my view, the most important factor is not the depth of the correction, but how the market reacts afterward. If Bitcoin strengthens, cryptocurrencies such as ETH and XLM could also attract renewed investment interest. If support breaks, however, greater caution will be necessary.
DYOR. Before making any trading or investment decision, consider your own risk tolerance and capital. This is not financial advice.
What Do You Think?
Are we seeing a correction before the next major Bitcoin uptrend, or could the market experience another deeper decline?
#Bitcoin #BTC #ETH #XLM #BinanceSquare
Is Bitcoin Preparing for Another Major Rally?
There are moments in the crypto market when the current price action shows a striking resemblance to an important phase from the past. Bitcoin’s 2023 price movement and the current 2026 scenario are being compared for exactly this reason. The similarity in their approximately 21% corrections has caught the attention of investors.
But the real question is: Is this correction a preparation for a new major uptrend, or could it be the beginning of a deeper market decline?
To understand these possibilities, we need to look beyond the chart pattern. Bitcoin’s support and resistance levels, market structure, liquidity, institutional demand, and the performance of major altcoins such as Ethereum and Stellar all deserve attention.
1. What Can We Learn From Bitcoin’s 2023 Correction?
In 2023, Bitcoin experienced a correction of approximately 21.6% during a broader uptrend. The market subsequently resumed its upward movement. This is why the current price action is being compared with that period, as the present scenario suggests a similar correction of roughly 21.1%.
The difference between the two corrections is only 0.5 percentage points. That makes the comparison interesting, but it does not guarantee the same outcome.
A key investment insight is that a major correction does not always mean the uptrend has ended. In a strong market, corrections can reduce excessive leverage and create opportunities for new buyers to enter.
However, the macroeconomic environment, liquidity conditions, and institutional participation in 2023 were different from today. Therefore, assuming that the same percentage correction will produce the same result would be risky.
2. Could $65,000 Become a Potential Accumulation Zone?
According to the chart comparison, applying a correction of approximately 21.1% to the reference price could bring Bitcoin toward the $65,000 area. This is a potential scenario, not a confirmed future price target.
The $65K region could become attractive if:
Previous demand zones or support levels hold.
Selling pressure weakens and buying interest increases.
Bitcoin forms a strong higher-timeframe candle close.
Open Interest remains healthy rather than rising excessively through leverage.
Spot buying provides genuine demand.
On the other hand, if Bitcoin reaches this area and continues forming lower highs and lower lows, it should not automatically be considered an accumulation zone.
The strength of a support zone is determined by how the market reacts there, not simply by the price reaching that level.
3. The $80,000–$82,000 Reclaim: A Key Confirmation
One of the most important technical levels in this scenario is the $80,000–$82,000 region.
A potential bullish sequence could look like this:
Correction → Base Formation → Resistance Reclaim → Potential Higher High
If Bitcoin reclaims $80K–$82K with a strong close and successfully retests that zone as support, market confidence could improve. This would strengthen the possibility of a new upward wave.
However, a single wick or temporary pump is not enough. Traders should monitor daily closes, trading volume, spot demand, and futures funding rates together. A breakout supported by weak volume can easily turn into a false breakout.
4. Bitcoin ($BTC ): A New Opportunity After the Correction?
Bitcoin’s correction is not just a chart pattern. It could play an important role in determining the next direction of the entire crypto market, as BTC remains a major indicator of liquidity and risk appetite.
If Bitcoin holds a potential demand zone near $65K and begins forming a strong base, investor confidence could gradually return. A successful base formation followed by a reclaim of $80K–$82K could create a new bullish market structure.
But there is also a clear risk. If Bitcoin fails to hold its support and selling pressure continues, treating the 21% correction as merely a temporary dip could be a mistake.
Important BTC Signals to Watch
Bullish confirmation: Support holds, a higher low forms, and Bitcoin closes strongly above $80K–$82K.
Bearish confirmation: Support breaks, lower highs and lower lows develop, and rebounds occur with weak volume.
5. Ethereum ($ETH ): A Potential Rotation Candidate
Ethereum could attract renewed investor interest if Bitcoin stabilizes and begins another strong uptrend. ETH’s potential upside depends not only on Bitcoin’s performance but also on its own market structure and relative strength against BTC.
Ethereum’s investment case is supported by its smart contract ecosystem, DeFi, Layer-2 networks, and large developer community. However, strong fundamentals do not guarantee short-term price appreciation. ETH remains sensitive to Bitcoin’s direction, macro liquidity, and overall risk appetite.
A More Investment-Friendly ETH Strategy
A potential bullish scenario would be Bitcoin reclaiming its key resistance levels first, followed by Ethereum forming a higher low and breaking its own resistance.
This could create an opportunity to consider gradual entries rather than chasing a sudden pump.
If Bitcoin cannot hold its potential $65K support zone, Ethereum could experience even greater volatility because of its higher-beta characteristics. Therefore, taking excessive risk in ETH without confirmation from Bitcoin may not be a prudent approach.
6. Stellar ($XLM ): The Potential of the Payments Narrative
Stellar is another project that could attract investor attention if the crypto market enters a new bullish phase.
Its core focus is enabling fast, relatively low-cost cross-border payments and digital asset transfers. This gives XLM a different investment narrative from Bitcoin and Ethereum.
However, a strong payments narrative alone does not guarantee that the token price will rise. Investors should evaluate network usage, real-world adoption, liquidity, token supply, and broader market conditions.
How Could XLM Benefit From BTC and ETH Strength?
If Bitcoin begins a strong uptrend and capital rotates into major altcoins such as Ethereum, projects like Stellar could benefit from broader market momentum.
But XLM should not be purchased solely because Bitcoin may recover from its correction. Long-term adoption and actual network utility remain important factors in evaluating its investment potential.
7. How to Analyze These Three Cryptocurrencies Together
A potential market rotation framework could be:
1. Bitcoin leads: BTC holds support and reclaims $80K–$82K.
2. Ethereum confirms: ETH breaks resistance and demonstrates relative strength.
3. Altcoin rotation: Payment-focused projects such as XLM begin attracting stronger demand and trading volume.
This is a possible market scenario, not a guaranteed sequence. Sometimes BTC, ETH, and XLM can rise together, while at other times their strength may appear at different stages.
8. Risk Management Before Investing
No matter how attractive a correction scenario appears, capital preservation should remain the priority.
Bitcoin may or may not reach $65K. Likewise, a repeat of the 2023 uptrend is not guaranteed.
Some practical principles to consider:
Consider scaling into positions rather than investing all capital at once.
Avoid excessive leverage without confirmation of Bitcoin’s trend.
Monitor liquidity and market structure when evaluating ETH and XLM.
Reduce positions according to predetermined risk limits if support breaks.
Compare funding rates, Open Interest, and liquidation data with price action.
Do not enter the market out of FOMO simply because a historical chart pattern looks similar.
Conclusion: Is This Correction Creating an Opportunity for the Next Major Rally?
The comparison between Bitcoin’s 2023 and 2026 price action raises an important question. The similarity in their approximately 21% corrections and the potential $65K zone create an interesting scenario for investors.
If BTC finds support near that area and reclaims $80K–$82K, the possibility of a new uptrend could increase.
But history does not guarantee the same result. The scenario must be confirmed through price structure, liquidity, and genuine buying demand.
In my view, the most important factor is not the depth of the correction, but how the market reacts afterward. If Bitcoin strengthens, cryptocurrencies such as ETH and XLM could also attract renewed investment interest. If support breaks, however, greater caution will be necessary.
DYOR. Before making any trading or investment decision, consider your own risk tolerance and capital. This is not financial advice.
What Do You Think?
Are we seeing a correction before the next major Bitcoin uptrend, or could the market experience another deeper decline?
#Bitcoin #BTC #ETH #XLM #BinanceSquare
1
123
·
--
Article
$XAU ALWAYS 😎 — STOP GAMBLING ON ALTCOINS‼️Be a Real Trader, Not a Chaser. Grow Slow, Grow Strong. 🏆
The crypto market has taught investors one important lesson: a coin can rise hundreds of percent in a short time, but that does not mean the next buyer will make money.
One day, an altcoin is everywhere on social media. The next day, liquidity disappears, the chart turns red, and the same traders who were celebrating a new high are looking for an exit.
That is why I believe every serious trader should ask a different question before entering the market:
Am I investing in an asset with a reason to hold it, or am I gambling on the next candle?
For me, $XAU represents a different way of thinking. Gold is not a shortcut to overnight wealth. It is an asset that can play a role in long-term wealth preservation, portfolio diversification, and disciplined trading.
Meanwhile, altcoins can offer extraordinary opportunities, but their volatility, liquidity risks, token unlocks, and speculative demand make them unsuitable for treating every trade like a guaranteed investment.
The goal is not to avoid risk completely. The goal is to take risk that you understand.
Why I Keep Gold on the Radar
Gold has a long history as a store of value and a portfolio diversification asset. Its investment case comes from several different sources: demand for a safe-haven asset, central-bank purchases, inflation concerns, and uncertainty surrounding currencies and government debt.
But gold is not a guaranteed safe haven in every market condition. The recent market action is a reminder of that.
On September 15, 2026, gold futures were reported around $4,310 per troy ounce after falling 1.3%, while the U.S. dollar strengthened and the 10-year Treasury yield briefly moved above 5%. Higher yields and a stronger dollar can create pressure on gold because it does not pay interest. <Cite refs={["turn0news17","turn0news18"]}/>
This is exactly why I do not see gold as a coin that only goes up. I see it as an asset that deserves a place in a disciplined investment strategy.
The real value of gold
Gold can be attractive when investors want to reduce exposure to financial-market risk. It can also benefit from demand for diversification and official-sector purchases. However, it can experience sharp corrections, particularly when real yields rise or investors move toward cash and interest-bearing assets. <Cite refs={["turn0news18","turn0news21"]}/>
A trader who understands this will not buy gold simply because the internet says, “Gold always goes up.”
The better approach is to understand why gold is moving, where buyers may defend the price, and how much capital is appropriate for the trade.
Stop Chasing Altcoin Pumps
Altcoins are not all the same. Some projects have real technology, active development, useful networks, and long-term potential. Others are driven primarily by attention, liquidity, and speculation.
The problem begins when traders stop distinguishing between the two.
A coin rises 100%, 200%, or even 400% in a short period. Social media starts talking about the next 10x. Traders enter without a plan, often using leverage, because they believe missing the move is worse than taking the risk.
That mindset is dangerous.
A parabolic rally can continue longer than expected, but it can also reverse violently. Low liquidity, concentrated ownership, funding costs, and token unlocks can make an exit more difficult than an entry.
The difference between trading and gambling
A real trader does not need to predict every pump.
A real trader knows:
Where to enter.
Where the trade becomes invalid.
How much capital to risk.
When to take partial profit.
When to stay out of the market.
If you cannot answer these questions before entering a position, you are not managing a trade. You are hoping.
And hope is not a risk-management strategy.
Gold vs. Altcoins: Two Different Investment Mindsets
The comparison is not about declaring gold superior to every cryptocurrency. It is about understanding the different roles these assets can play.
Factor
Gold ($XAU )
Altcoins
Main investment case
Wealth preservation and diversification
Technology, adoption, and speculative growth
Volatility
Can be volatile, especially during macro shocks
Often extremely volatile
Income
Physical gold does not generate income
Most altcoins do not generate guaranteed income
Key risks
Yields, dollar strength, inflation, liquidity
Token unlocks, liquidity, leverage, competition
Suitable mindset
Gold can still lose value. Altcoins can also produce life-changing returns. Neither asset removes the need for research or risk management.
The smarter decision depends on your time horizon, financial goals, and ability to withstand losses.
What the Current Gold Market Is Telling Us
Gold's recent decline shows that even a strong long-term narrative can face short-term pressure.
The current macro environment is especially important because higher oil prices can increase inflation concerns, potentially keeping interest-rate expectations elevated. That combination can support the dollar and Treasury yields while weighing on non-yielding assets such as gold. <Cite refs={["turn0news19","turn0news17"]}/>
At the same time, investment demand for gold remains a factor to monitor. Reports have highlighted renewed gold ETF inflows during July and August 2026, alongside continued interest in gold as a diversification asset. <Cite refs={["turn0news21","turn0news22"]}/>
This creates a market with competing forces:
Bullish factors: Diversification demand, central-bank buying, and uncertainty around inflation and government debt.
Bearish factors: Higher real yields, a stronger dollar, and tighter monetary-policy expectations.
The conclusion is not that gold must rise tomorrow. The conclusion is that a disciplined investor should watch both sides of the market before committing capital.
My Trading Plan: Patience Over FOMO
I do not want to buy an asset simply because it is trending. I want to understand the setup first.
1. Wait for confirmation
If gold is falling, I would rather wait for a clear support reaction or a confirmed change in structure than buy every dip.
For short-term traders, a reclaim of resistance followed by a successful retest can provide a more structured entry. A breakdown below support, on the other hand, may signal that the correction is not finished.
The exact levels must come from the current chart and trading timeframe. I would not use an old support level as a guaranteed entry.
2. Protect capital
Position sizing is more important than predicting the next target.
For example, a trader with $1,000 in capital who risks 1% on a trade has a planned maximum loss of $10 before fees and slippage. That does not guarantee the actual loss will stay at $10, but it creates a framework for managing risk.
The same principle applies to gold, BTC, ETH, and altcoins.
No all-in trades. No emotional revenge trades. No excessive leverage just to recover a previous loss.
3. Take profits when the trade gives them
A good trade does not have to capture the entire move.
Partial profit-taking and a trailing stop can help manage a position after a strong rally. The goal is to protect capital and let profitable trades develop without turning a winning position into an avoidable loss.
4. Keep some cash available
Cash is not a failure to invest. It is flexibility.
When the market becomes overheated, holding cash allows a trader to wait for better opportunities rather than entering a weak setup out of fear of missing out.
A Long-Term Investor's Perspective
Gold can be part of a diversified portfolio, but it should not automatically replace every other asset.
A portfolio might include a mix of cash reserves, productive assets, and selected investments based on the individual's goals and risk tolerance. The appropriate allocation depends on circumstances, and no single asset is a guaranteed protection against every type of loss.
For a trader who is heavily exposed to speculative altcoins, reducing unnecessary leverage and diversifying across different asset types may be more valuable than chasing another high-risk coin.
The objective is simple:
Protect the money you already have before trying to multiply it.
Final Thoughts
XAU ALWAYS is more than a slogan to me. It represents patience, discipline, and the idea that a strong investment strategy should not depend on chasing every market trend.
Altcoins can offer opportunities, but the market does not owe anyone a profit. Gold can offer diversification, but it can also experience sharp declines. The best approach is to understand the asset, respect the risk, and make decisions based on a plan.
I would rather grow slowly with a strategy I understand than lose capital chasing a coin because everyone on social media is calling for the next 10x.
Be a real trader.
Grow slow. Grow strong. 🏆
DYOR | NFA | Risk management first
Patience and capital preservation
#GOLD #XAU #altcoins #Investment #RiskManagement
{spot}(XAUTUSDT)
$XAU ALWAYS 😎 — STOP GAMBLING ON ALTCOINS‼️
Be a Real Trader, Not a Chaser. Grow Slow, Grow Strong. 🏆
The crypto market has taught investors one important lesson: a coin can rise hundreds of percent in a short time, but that does not mean the next buyer will make money.
One day, an altcoin is everywhere on social media. The next day, liquidity disappears, the chart turns red, and the same traders who were celebrating a new high are looking for an exit.
That is why I believe every serious trader should ask a different question before entering the market:
Am I investing in an asset with a reason to hold it, or am I gambling on the next candle?
For me, $XAU represents a different way of thinking. Gold is not a shortcut to overnight wealth. It is an asset that can play a role in long-term wealth preservation, portfolio diversification, and disciplined trading.
Meanwhile, altcoins can offer extraordinary opportunities, but their volatility, liquidity risks, token unlocks, and speculative demand make them unsuitable for treating every trade like a guaranteed investment.
The goal is not to avoid risk completely. The goal is to take risk that you understand.
Why I Keep Gold on the Radar
Gold has a long history as a store of value and a portfolio diversification asset. Its investment case comes from several different sources: demand for a safe-haven asset, central-bank purchases, inflation concerns, and uncertainty surrounding currencies and government debt.
But gold is not a guaranteed safe haven in every market condition. The recent market action is a reminder of that.
On September 15, 2026, gold futures were reported around $4,310 per troy ounce after falling 1.3%, while the U.S. dollar strengthened and the 10-year Treasury yield briefly moved above 5%. Higher yields and a stronger dollar can create pressure on gold because it does not pay interest. <Cite refs={["turn0news17","turn0news18"]}/>
This is exactly why I do not see gold as a coin that only goes up. I see it as an asset that deserves a place in a disciplined investment strategy.
The real value of gold
Gold can be attractive when investors want to reduce exposure to financial-market risk. It can also benefit from demand for diversification and official-sector purchases. However, it can experience sharp corrections, particularly when real yields rise or investors move toward cash and interest-bearing assets. <Cite refs={["turn0news18","turn0news21"]}/>
A trader who understands this will not buy gold simply because the internet says, “Gold always goes up.”
The better approach is to understand why gold is moving, where buyers may defend the price, and how much capital is appropriate for the trade.
Stop Chasing Altcoin Pumps
Altcoins are not all the same. Some projects have real technology, active development, useful networks, and long-term potential. Others are driven primarily by attention, liquidity, and speculation.
The problem begins when traders stop distinguishing between the two.
A coin rises 100%, 200%, or even 400% in a short period. Social media starts talking about the next 10x. Traders enter without a plan, often using leverage, because they believe missing the move is worse than taking the risk.
That mindset is dangerous.
A parabolic rally can continue longer than expected, but it can also reverse violently. Low liquidity, concentrated ownership, funding costs, and token unlocks can make an exit more difficult than an entry.
The difference between trading and gambling
A real trader does not need to predict every pump.
A real trader knows:
Where to enter.
Where the trade becomes invalid.
How much capital to risk.
When to take partial profit.
When to stay out of the market.
If you cannot answer these questions before entering a position, you are not managing a trade. You are hoping.
And hope is not a risk-management strategy.
Gold vs. Altcoins: Two Different Investment Mindsets
The comparison is not about declaring gold superior to every cryptocurrency. It is about understanding the different roles these assets can play.
Factor
Gold ($XAU )
Altcoins
Main investment case
Wealth preservation and diversification
Technology, adoption, and speculative growth
Volatility
Can be volatile, especially during macro shocks
Often extremely volatile
Income
Physical gold does not generate income
Most altcoins do not generate guaranteed income
Key risks
Yields, dollar strength, inflation, liquidity
Token unlocks, liquidity, leverage, competition
Suitable mindset
Gold can still lose value. Altcoins can also produce life-changing returns. Neither asset removes the need for research or risk management.
The smarter decision depends on your time horizon, financial goals, and ability to withstand losses.
What the Current Gold Market Is Telling Us
Gold's recent decline shows that even a strong long-term narrative can face short-term pressure.
The current macro environment is especially important because higher oil prices can increase inflation concerns, potentially keeping interest-rate expectations elevated. That combination can support the dollar and Treasury yields while weighing on non-yielding assets such as gold. <Cite refs={["turn0news19","turn0news17"]}/>
At the same time, investment demand for gold remains a factor to monitor. Reports have highlighted renewed gold ETF inflows during July and August 2026, alongside continued interest in gold as a diversification asset. <Cite refs={["turn0news21","turn0news22"]}/>
This creates a market with competing forces:
Bullish factors: Diversification demand, central-bank buying, and uncertainty around inflation and government debt.
Bearish factors: Higher real yields, a stronger dollar, and tighter monetary-policy expectations.
The conclusion is not that gold must rise tomorrow. The conclusion is that a disciplined investor should watch both sides of the market before committing capital.
My Trading Plan: Patience Over FOMO
I do not want to buy an asset simply because it is trending. I want to understand the setup first.
1. Wait for confirmation
If gold is falling, I would rather wait for a clear support reaction or a confirmed change in structure than buy every dip.
For short-term traders, a reclaim of resistance followed by a successful retest can provide a more structured entry. A breakdown below support, on the other hand, may signal that the correction is not finished.
The exact levels must come from the current chart and trading timeframe. I would not use an old support level as a guaranteed entry.
2. Protect capital
Position sizing is more important than predicting the next target.
For example, a trader with $1,000 in capital who risks 1% on a trade has a planned maximum loss of $10 before fees and slippage. That does not guarantee the actual loss will stay at $10, but it creates a framework for managing risk.
The same principle applies to gold, BTC, ETH, and altcoins.
No all-in trades. No emotional revenge trades. No excessive leverage just to recover a previous loss.
3. Take profits when the trade gives them
A good trade does not have to capture the entire move.
Partial profit-taking and a trailing stop can help manage a position after a strong rally. The goal is to protect capital and let profitable trades develop without turning a winning position into an avoidable loss.
4. Keep some cash available
Cash is not a failure to invest. It is flexibility.
When the market becomes overheated, holding cash allows a trader to wait for better opportunities rather than entering a weak setup out of fear of missing out.
A Long-Term Investor's Perspective
Gold can be part of a diversified portfolio, but it should not automatically replace every other asset.
A portfolio might include a mix of cash reserves, productive assets, and selected investments based on the individual's goals and risk tolerance. The appropriate allocation depends on circumstances, and no single asset is a guaranteed protection against every type of loss.
For a trader who is heavily exposed to speculative altcoins, reducing unnecessary leverage and diversifying across different asset types may be more valuable than chasing another high-risk coin.
The objective is simple:
Protect the money you already have before trying to multiply it.
Final Thoughts
XAU ALWAYS is more than a slogan to me. It represents patience, discipline, and the idea that a strong investment strategy should not depend on chasing every market trend.
Altcoins can offer opportunities, but the market does not owe anyone a profit. Gold can offer diversification, but it can also experience sharp declines. The best approach is to understand the asset, respect the risk, and make decisions based on a plan.
I would rather grow slowly with a strategy I understand than lose capital chasing a coin because everyone on social media is calling for the next 10x.
Be a real trader.
Grow slow. Grow strong. 🏆
DYOR | NFA | Risk management first
Patience and capital preservation
#GOLD #XAU #altcoins #Investment #RiskManagement
The crypto market has taught investors one important lesson: a coin can rise hundreds of percent in a short time, but that does not mean the next buyer will make money.
One day, an altcoin is everywhere on social media. The next day, liquidity disappears, the chart turns red, and the same traders who were celebrating a new high are looking for an exit.
That is why I believe every serious trader should ask a different question before entering the market:
Am I investing in an asset with a reason to hold it, or am I gambling on the next candle?
For me, $XAU represents a different way of thinking. Gold is not a shortcut to overnight wealth. It is an asset that can play a role in long-term wealth preservation, portfolio diversification, and disciplined trading.
Meanwhile, altcoins can offer extraordinary opportunities, but their volatility, liquidity risks, token unlocks, and speculative demand make them unsuitable for treating every trade like a guaranteed investment.
The goal is not to avoid risk completely. The goal is to take risk that you understand.
Why I Keep Gold on the Radar
Gold has a long history as a store of value and a portfolio diversification asset. Its investment case comes from several different sources: demand for a safe-haven asset, central-bank purchases, inflation concerns, and uncertainty surrounding currencies and government debt.
But gold is not a guaranteed safe haven in every market condition. The recent market action is a reminder of that.
On September 15, 2026, gold futures were reported around $4,310 per troy ounce after falling 1.3%, while the U.S. dollar strengthened and the 10-year Treasury yield briefly moved above 5%. Higher yields and a stronger dollar can create pressure on gold because it does not pay interest. <Cite refs={["turn0news17","turn0news18"]}/>
This is exactly why I do not see gold as a coin that only goes up. I see it as an asset that deserves a place in a disciplined investment strategy.
The real value of gold
Gold can be attractive when investors want to reduce exposure to financial-market risk. It can also benefit from demand for diversification and official-sector purchases. However, it can experience sharp corrections, particularly when real yields rise or investors move toward cash and interest-bearing assets. <Cite refs={["turn0news18","turn0news21"]}/>
A trader who understands this will not buy gold simply because the internet says, “Gold always goes up.”
The better approach is to understand why gold is moving, where buyers may defend the price, and how much capital is appropriate for the trade.
Stop Chasing Altcoin Pumps
Altcoins are not all the same. Some projects have real technology, active development, useful networks, and long-term potential. Others are driven primarily by attention, liquidity, and speculation.
The problem begins when traders stop distinguishing between the two.
A coin rises 100%, 200%, or even 400% in a short period. Social media starts talking about the next 10x. Traders enter without a plan, often using leverage, because they believe missing the move is worse than taking the risk.
That mindset is dangerous.
A parabolic rally can continue longer than expected, but it can also reverse violently. Low liquidity, concentrated ownership, funding costs, and token unlocks can make an exit more difficult than an entry.
The difference between trading and gambling
A real trader does not need to predict every pump.
A real trader knows:
Where to enter.
Where the trade becomes invalid.
How much capital to risk.
When to take partial profit.
When to stay out of the market.
If you cannot answer these questions before entering a position, you are not managing a trade. You are hoping.
And hope is not a risk-management strategy.
Gold vs. Altcoins: Two Different Investment Mindsets
The comparison is not about declaring gold superior to every cryptocurrency. It is about understanding the different roles these assets can play.
Factor
Gold ($XAU )
Altcoins
Main investment case
Wealth preservation and diversification
Technology, adoption, and speculative growth
Volatility
Can be volatile, especially during macro shocks
Often extremely volatile
Income
Physical gold does not generate income
Most altcoins do not generate guaranteed income
Key risks
Yields, dollar strength, inflation, liquidity
Token unlocks, liquidity, leverage, competition
Suitable mindset
Gold can still lose value. Altcoins can also produce life-changing returns. Neither asset removes the need for research or risk management.
The smarter decision depends on your time horizon, financial goals, and ability to withstand losses.
What the Current Gold Market Is Telling Us
Gold's recent decline shows that even a strong long-term narrative can face short-term pressure.
The current macro environment is especially important because higher oil prices can increase inflation concerns, potentially keeping interest-rate expectations elevated. That combination can support the dollar and Treasury yields while weighing on non-yielding assets such as gold. <Cite refs={["turn0news19","turn0news17"]}/>
At the same time, investment demand for gold remains a factor to monitor. Reports have highlighted renewed gold ETF inflows during July and August 2026, alongside continued interest in gold as a diversification asset. <Cite refs={["turn0news21","turn0news22"]}/>
This creates a market with competing forces:
Bullish factors: Diversification demand, central-bank buying, and uncertainty around inflation and government debt.
Bearish factors: Higher real yields, a stronger dollar, and tighter monetary-policy expectations.
The conclusion is not that gold must rise tomorrow. The conclusion is that a disciplined investor should watch both sides of the market before committing capital.
My Trading Plan: Patience Over FOMO
I do not want to buy an asset simply because it is trending. I want to understand the setup first.
1. Wait for confirmation
If gold is falling, I would rather wait for a clear support reaction or a confirmed change in structure than buy every dip.
For short-term traders, a reclaim of resistance followed by a successful retest can provide a more structured entry. A breakdown below support, on the other hand, may signal that the correction is not finished.
The exact levels must come from the current chart and trading timeframe. I would not use an old support level as a guaranteed entry.
2. Protect capital
Position sizing is more important than predicting the next target.
For example, a trader with $1,000 in capital who risks 1% on a trade has a planned maximum loss of $10 before fees and slippage. That does not guarantee the actual loss will stay at $10, but it creates a framework for managing risk.
The same principle applies to gold, BTC, ETH, and altcoins.
No all-in trades. No emotional revenge trades. No excessive leverage just to recover a previous loss.
3. Take profits when the trade gives them
A good trade does not have to capture the entire move.
Partial profit-taking and a trailing stop can help manage a position after a strong rally. The goal is to protect capital and let profitable trades develop without turning a winning position into an avoidable loss.
4. Keep some cash available
Cash is not a failure to invest. It is flexibility.
When the market becomes overheated, holding cash allows a trader to wait for better opportunities rather than entering a weak setup out of fear of missing out.
A Long-Term Investor's Perspective
Gold can be part of a diversified portfolio, but it should not automatically replace every other asset.
A portfolio might include a mix of cash reserves, productive assets, and selected investments based on the individual's goals and risk tolerance. The appropriate allocation depends on circumstances, and no single asset is a guaranteed protection against every type of loss.
For a trader who is heavily exposed to speculative altcoins, reducing unnecessary leverage and diversifying across different asset types may be more valuable than chasing another high-risk coin.
The objective is simple:
Protect the money you already have before trying to multiply it.
Final Thoughts
XAU ALWAYS is more than a slogan to me. It represents patience, discipline, and the idea that a strong investment strategy should not depend on chasing every market trend.
Altcoins can offer opportunities, but the market does not owe anyone a profit. Gold can offer diversification, but it can also experience sharp declines. The best approach is to understand the asset, respect the risk, and make decisions based on a plan.
I would rather grow slowly with a strategy I understand than lose capital chasing a coin because everyone on social media is calling for the next 10x.
Be a real trader.
Grow slow. Grow strong. 🏆
DYOR | NFA | Risk management first
Patience and capital preservation
#GOLD #XAU #altcoins #Investment #RiskManagement
1
171
·
--
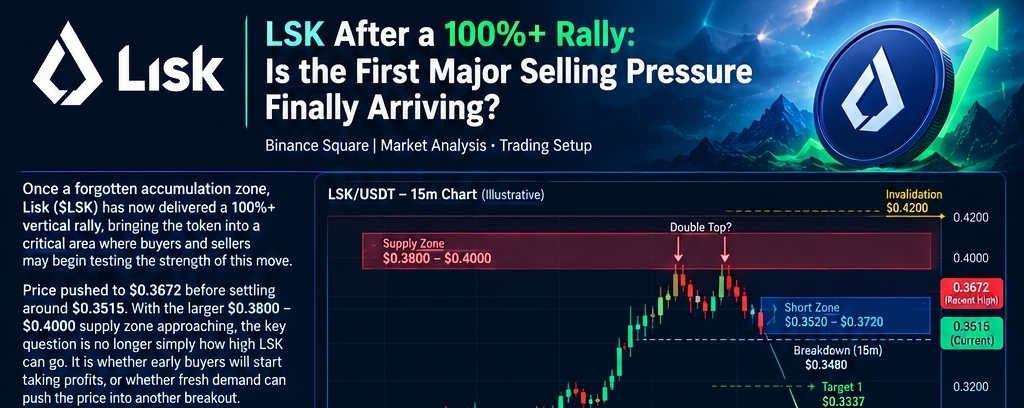
Article
LSK After a 100%+ Rally: Is the First Major Selling Pressure Finally Arriving?Binance Square | Market Analysis · Trading Setup
Once a forgotten accumulation zone, Lisk ($LSK ) has now delivered a 100%+ vertical rally, bringing the token into a critical area where buyers and sellers may begin testing the strength of this move.
Price pushed to $0.3672 before settling around $0.3515. With the larger $0.3800–$0.4000 supply zone approaching, the key question is no longer simply how high LSK can go. It is whether early buyers will start taking profits, or whether fresh demand can push the price into another breakout.
For me, this is not the place to chase green candles. After such an aggressive move, I would rather watch the supply zone, selling pressure, and confirmation before considering a trade.
Why This Area Matters After the Rally
When a token breaks out of a long accumulation range and moves sharply higher, market conditions can change. During accumulation, buyers may have had the opportunity to build positions at relatively lower prices. After a major rally, however, some of those buyers may start taking profits, while new traders may hesitate to enter at elevated levels.
The important point is that a 100%+ rally does not automatically mean a correction is coming. At the same time, a strong rally does not guarantee that the price will continue higher. The next move will depend on whether buyers can hold the breakout, whether new demand continues to develop, and how sellers respond around the supply zone.
$LSK Price Action: Buyers Are Approaching a Major Test
The current setup is built around the price levels mentioned in the market snapshot:
Recent high: $0.3672
Current reference price: $0.3515
Major supply zone: $0.3800–$0.4000
Potential short observation range: $0.3520–$0.3720
From $0.3515, the lower boundary of the supply zone is approximately 8.1% higher, while the upper boundary is around 13.8% higher.
This makes the area worth watching, but not an automatic sell signal. A supply zone represents a potential area of selling interest, not a guaranteed reversal point.
1. $0.3800–$0.4000: The First Major Barrier
This range is currently one of the most important areas to monitor. Previous sellers or profit-taking traders may become active here, but the actual strength of the zone must be confirmed through price action and volume.
If LSK reaches this area and repeatedly fails to move higher, it could indicate that fresh demand is weakening at elevated prices. On the other hand, a strong breakout above the zone with expanding volume could turn previous resistance into potential support.
2. What Is Happening on the 15-Minute Chart?
The recent price action shows repeated upper wicks near the highs, according to the provided setup. This may suggest that buyers are pushing price higher, but sellers are responding around those levels.
A possible double top is also forming near the highs. However, two similar highs do not confirm a double top by themselves. A break below the neckline or the intervening low, followed by sustained weakness, would provide stronger confirmation.
My Trading Plan: Confirmation Over Green Candles
I am not interested in blindly shorting strength. Instead, I would watch the $0.3520–$0.3720 area and wait for price to show whether sellers are actually taking control.
Potential Short Setup
Entry observation range: $0.3520–$0.3720
Confirmation: A bearish rejection, lower high, or a confirmed 15-minute breakdown below $0.3480.
First target: $0.3337
Second target: $0.2921
Invalidation: $0.4200
These are conditional trading levels from the original setup, not guaranteed entry prices or profit targets.
Why $0.3480 Matters
A 15-minute breakdown below $0.3480 could indicate that short-term buyers are losing control. If the breakdown occurs with increasing volume and price remains below the level, the bearish scenario becomes more credible.
But one candle closing below support is not enough for me to enter a short. Fast-moving tokens often sweep liquidity before reversing back into the previous range. That is why I would prefer to see a retest, a lower high, and sustained selling volume before taking the setup seriously.
Targets: Protect Capital Before Chasing Profit
The two downside targets are $0.3337 and $0.2921.
From the $0.3515 reference price:
$0.3337 represents approximately 5.1% downside.
$0.2921 represents approximately 16.9% downside.
The first target could be an area to consider taking partial profits if the trade confirms. The second target is much farther away, and strong support forming before $0.2921 could weaken the case for holding the short.
A good risk-management plan should define the invalidation before entering. With a fast-moving token, slippage, funding fees, and liquidation risk can make the actual loss larger than expected. That is why I would avoid excessive leverage and calculate position size based on the amount I am willing to lose.
Investment-Friendly Analysis: What Could Support the Rally?
A price rally should not be evaluated only by its percentage increase. For Lisk, long-term investment analysis should also consider network activity, developer progress, ecosystem growth, token economics, liquidity, and genuine demand.
Lisk is a blockchain project, and its long-term valuation depends on whether the network can build meaningful utility and attract sustained activity. However, a 100%+ price increase does not mean that its underlying value has increased by the same amount.
Before considering LSK as a long-term investment, I would focus on three questions:
Is spot-market buying increasing alongside the rally?
How are volume and market structure behaving as price approaches the supply zone?
Do the current market capitalization, token supply, unlocks, or potential new supply create additional downside risk at higher prices?
Without verifying these factors, it would be premature to call LSK undervalued or guarantee long-term returns. A short-term bearish setup also does not automatically invalidate the project's long-term potential.
When Would This Setup Be Invalidated?
The most important part of a short trade is knowing when the thesis is wrong.
A strong breakout above $0.3800–$0.4000 with expanding volume could indicate that sellers are weaker than expected.
Sustained acceptance above $0.4200 would invalidate the bearish scenario described in this setup.
If price reclaims $0.3672 without a confirmed breakdown below $0.3480, there would be little reason to rush into a short.
One important distinction: $0.4200 is a technical invalidation level, not a guarantee of the maximum loss. Slippage and liquidation risk can cause actual losses to exceed the planned amount, especially in highly volatile tokens.
Final Thoughts: Sometimes Waiting Is the Trade
For me, LSK is now in a situation where the price has already made a major move, but the next direction remains unconfirmed.
A bearish rejection around $0.3520–$0.3720, followed by a 15-minute breakdown below $0.3480, could make the downside scenario more credible. Conversely, a strong breakout and sustained acceptance above the supply zone would weaken the short thesis.
That is why I am not simply looking for the next green candle.
After a rally this aggressive, the interesting trade is sometimes not finding where the next buyers are waiting.
It is finding where the first serious sellers are waiting—and whether their selling pressure is strong enough to change the market structure.
DYOR: This is not financial advice. Before entering any trade, evaluate your risk tolerance, liquidity, fees, funding costs, and invalidation level. Never chase a pump or risk more capital than you can afford to lose.
{spot}(LSKUSDT)
#LSK #LSKUSDT #cryptouniverseofficial #Binance
LSK After a 100%+ Rally: Is the First Major Selling Pressure Finally Arriving?
Binance Square | Market Analysis · Trading Setup
Once a forgotten accumulation zone, Lisk ($LSK ) has now delivered a 100%+ vertical rally, bringing the token into a critical area where buyers and sellers may begin testing the strength of this move.
Price pushed to $0.3672 before settling around $0.3515. With the larger $0.3800–$0.4000 supply zone approaching, the key question is no longer simply how high LSK can go. It is whether early buyers will start taking profits, or whether fresh demand can push the price into another breakout.
For me, this is not the place to chase green candles. After such an aggressive move, I would rather watch the supply zone, selling pressure, and confirmation before considering a trade.
Why This Area Matters After the Rally
When a token breaks out of a long accumulation range and moves sharply higher, market conditions can change. During accumulation, buyers may have had the opportunity to build positions at relatively lower prices. After a major rally, however, some of those buyers may start taking profits, while new traders may hesitate to enter at elevated levels.
The important point is that a 100%+ rally does not automatically mean a correction is coming. At the same time, a strong rally does not guarantee that the price will continue higher. The next move will depend on whether buyers can hold the breakout, whether new demand continues to develop, and how sellers respond around the supply zone.
$LSK Price Action: Buyers Are Approaching a Major Test
The current setup is built around the price levels mentioned in the market snapshot:
Recent high: $0.3672
Current reference price: $0.3515
Major supply zone: $0.3800–$0.4000
Potential short observation range: $0.3520–$0.3720
From $0.3515, the lower boundary of the supply zone is approximately 8.1% higher, while the upper boundary is around 13.8% higher.
This makes the area worth watching, but not an automatic sell signal. A supply zone represents a potential area of selling interest, not a guaranteed reversal point.
1. $0.3800–$0.4000: The First Major Barrier
This range is currently one of the most important areas to monitor. Previous sellers or profit-taking traders may become active here, but the actual strength of the zone must be confirmed through price action and volume.
If LSK reaches this area and repeatedly fails to move higher, it could indicate that fresh demand is weakening at elevated prices. On the other hand, a strong breakout above the zone with expanding volume could turn previous resistance into potential support.
2. What Is Happening on the 15-Minute Chart?
The recent price action shows repeated upper wicks near the highs, according to the provided setup. This may suggest that buyers are pushing price higher, but sellers are responding around those levels.
A possible double top is also forming near the highs. However, two similar highs do not confirm a double top by themselves. A break below the neckline or the intervening low, followed by sustained weakness, would provide stronger confirmation.
My Trading Plan: Confirmation Over Green Candles
I am not interested in blindly shorting strength. Instead, I would watch the $0.3520–$0.3720 area and wait for price to show whether sellers are actually taking control.
Potential Short Setup
Entry observation range: $0.3520–$0.3720
Confirmation: A bearish rejection, lower high, or a confirmed 15-minute breakdown below $0.3480.
First target: $0.3337
Second target: $0.2921
Invalidation: $0.4200
These are conditional trading levels from the original setup, not guaranteed entry prices or profit targets.
Why $0.3480 Matters
A 15-minute breakdown below $0.3480 could indicate that short-term buyers are losing control. If the breakdown occurs with increasing volume and price remains below the level, the bearish scenario becomes more credible.
But one candle closing below support is not enough for me to enter a short. Fast-moving tokens often sweep liquidity before reversing back into the previous range. That is why I would prefer to see a retest, a lower high, and sustained selling volume before taking the setup seriously.
Targets: Protect Capital Before Chasing Profit
The two downside targets are $0.3337 and $0.2921.
From the $0.3515 reference price:
$0.3337 represents approximately 5.1% downside.
$0.2921 represents approximately 16.9% downside.
The first target could be an area to consider taking partial profits if the trade confirms. The second target is much farther away, and strong support forming before $0.2921 could weaken the case for holding the short.
A good risk-management plan should define the invalidation before entering. With a fast-moving token, slippage, funding fees, and liquidation risk can make the actual loss larger than expected. That is why I would avoid excessive leverage and calculate position size based on the amount I am willing to lose.
Investment-Friendly Analysis: What Could Support the Rally?
A price rally should not be evaluated only by its percentage increase. For Lisk, long-term investment analysis should also consider network activity, developer progress, ecosystem growth, token economics, liquidity, and genuine demand.
Lisk is a blockchain project, and its long-term valuation depends on whether the network can build meaningful utility and attract sustained activity. However, a 100%+ price increase does not mean that its underlying value has increased by the same amount.
Before considering LSK as a long-term investment, I would focus on three questions:
Is spot-market buying increasing alongside the rally?
How are volume and market structure behaving as price approaches the supply zone?
Do the current market capitalization, token supply, unlocks, or potential new supply create additional downside risk at higher prices?
Without verifying these factors, it would be premature to call LSK undervalued or guarantee long-term returns. A short-term bearish setup also does not automatically invalidate the project's long-term potential.
When Would This Setup Be Invalidated?
The most important part of a short trade is knowing when the thesis is wrong.
A strong breakout above $0.3800–$0.4000 with expanding volume could indicate that sellers are weaker than expected.
Sustained acceptance above $0.4200 would invalidate the bearish scenario described in this setup.
If price reclaims $0.3672 without a confirmed breakdown below $0.3480, there would be little reason to rush into a short.
One important distinction: $0.4200 is a technical invalidation level, not a guarantee of the maximum loss. Slippage and liquidation risk can cause actual losses to exceed the planned amount, especially in highly volatile tokens.
Final Thoughts: Sometimes Waiting Is the Trade
For me, LSK is now in a situation where the price has already made a major move, but the next direction remains unconfirmed.
A bearish rejection around $0.3520–$0.3720, followed by a 15-minute breakdown below $0.3480, could make the downside scenario more credible. Conversely, a strong breakout and sustained acceptance above the supply zone would weaken the short thesis.
That is why I am not simply looking for the next green candle.
After a rally this aggressive, the interesting trade is sometimes not finding where the next buyers are waiting.
It is finding where the first serious sellers are waiting—and whether their selling pressure is strong enough to change the market structure.
DYOR: This is not financial advice. Before entering any trade, evaluate your risk tolerance, liquidity, fees, funding costs, and invalidation level. Never chase a pump or risk more capital than you can afford to lose.
#LSK #LSKUSDT #cryptouniverseofficial #Binance
Once a forgotten accumulation zone, Lisk ($LSK ) has now delivered a 100%+ vertical rally, bringing the token into a critical area where buyers and sellers may begin testing the strength of this move.
Price pushed to $0.3672 before settling around $0.3515. With the larger $0.3800–$0.4000 supply zone approaching, the key question is no longer simply how high LSK can go. It is whether early buyers will start taking profits, or whether fresh demand can push the price into another breakout.
For me, this is not the place to chase green candles. After such an aggressive move, I would rather watch the supply zone, selling pressure, and confirmation before considering a trade.
Why This Area Matters After the Rally
When a token breaks out of a long accumulation range and moves sharply higher, market conditions can change. During accumulation, buyers may have had the opportunity to build positions at relatively lower prices. After a major rally, however, some of those buyers may start taking profits, while new traders may hesitate to enter at elevated levels.
The important point is that a 100%+ rally does not automatically mean a correction is coming. At the same time, a strong rally does not guarantee that the price will continue higher. The next move will depend on whether buyers can hold the breakout, whether new demand continues to develop, and how sellers respond around the supply zone.
$LSK Price Action: Buyers Are Approaching a Major Test
The current setup is built around the price levels mentioned in the market snapshot:
Recent high: $0.3672
Current reference price: $0.3515
Major supply zone: $0.3800–$0.4000
Potential short observation range: $0.3520–$0.3720
From $0.3515, the lower boundary of the supply zone is approximately 8.1% higher, while the upper boundary is around 13.8% higher.
This makes the area worth watching, but not an automatic sell signal. A supply zone represents a potential area of selling interest, not a guaranteed reversal point.
1. $0.3800–$0.4000: The First Major Barrier
This range is currently one of the most important areas to monitor. Previous sellers or profit-taking traders may become active here, but the actual strength of the zone must be confirmed through price action and volume.
If LSK reaches this area and repeatedly fails to move higher, it could indicate that fresh demand is weakening at elevated prices. On the other hand, a strong breakout above the zone with expanding volume could turn previous resistance into potential support.
2. What Is Happening on the 15-Minute Chart?
The recent price action shows repeated upper wicks near the highs, according to the provided setup. This may suggest that buyers are pushing price higher, but sellers are responding around those levels.
A possible double top is also forming near the highs. However, two similar highs do not confirm a double top by themselves. A break below the neckline or the intervening low, followed by sustained weakness, would provide stronger confirmation.
My Trading Plan: Confirmation Over Green Candles
I am not interested in blindly shorting strength. Instead, I would watch the $0.3520–$0.3720 area and wait for price to show whether sellers are actually taking control.
Potential Short Setup
Entry observation range: $0.3520–$0.3720
Confirmation: A bearish rejection, lower high, or a confirmed 15-minute breakdown below $0.3480.
First target: $0.3337
Second target: $0.2921
Invalidation: $0.4200
These are conditional trading levels from the original setup, not guaranteed entry prices or profit targets.
Why $0.3480 Matters
A 15-minute breakdown below $0.3480 could indicate that short-term buyers are losing control. If the breakdown occurs with increasing volume and price remains below the level, the bearish scenario becomes more credible.
But one candle closing below support is not enough for me to enter a short. Fast-moving tokens often sweep liquidity before reversing back into the previous range. That is why I would prefer to see a retest, a lower high, and sustained selling volume before taking the setup seriously.
Targets: Protect Capital Before Chasing Profit
The two downside targets are $0.3337 and $0.2921.
From the $0.3515 reference price:
$0.3337 represents approximately 5.1% downside.
$0.2921 represents approximately 16.9% downside.
The first target could be an area to consider taking partial profits if the trade confirms. The second target is much farther away, and strong support forming before $0.2921 could weaken the case for holding the short.
A good risk-management plan should define the invalidation before entering. With a fast-moving token, slippage, funding fees, and liquidation risk can make the actual loss larger than expected. That is why I would avoid excessive leverage and calculate position size based on the amount I am willing to lose.
Investment-Friendly Analysis: What Could Support the Rally?
A price rally should not be evaluated only by its percentage increase. For Lisk, long-term investment analysis should also consider network activity, developer progress, ecosystem growth, token economics, liquidity, and genuine demand.
Lisk is a blockchain project, and its long-term valuation depends on whether the network can build meaningful utility and attract sustained activity. However, a 100%+ price increase does not mean that its underlying value has increased by the same amount.
Before considering LSK as a long-term investment, I would focus on three questions:
Is spot-market buying increasing alongside the rally?
How are volume and market structure behaving as price approaches the supply zone?
Do the current market capitalization, token supply, unlocks, or potential new supply create additional downside risk at higher prices?
Without verifying these factors, it would be premature to call LSK undervalued or guarantee long-term returns. A short-term bearish setup also does not automatically invalidate the project's long-term potential.
When Would This Setup Be Invalidated?
The most important part of a short trade is knowing when the thesis is wrong.
A strong breakout above $0.3800–$0.4000 with expanding volume could indicate that sellers are weaker than expected.
Sustained acceptance above $0.4200 would invalidate the bearish scenario described in this setup.
If price reclaims $0.3672 without a confirmed breakdown below $0.3480, there would be little reason to rush into a short.
One important distinction: $0.4200 is a technical invalidation level, not a guarantee of the maximum loss. Slippage and liquidation risk can cause actual losses to exceed the planned amount, especially in highly volatile tokens.
Final Thoughts: Sometimes Waiting Is the Trade
For me, LSK is now in a situation where the price has already made a major move, but the next direction remains unconfirmed.
A bearish rejection around $0.3520–$0.3720, followed by a 15-minute breakdown below $0.3480, could make the downside scenario more credible. Conversely, a strong breakout and sustained acceptance above the supply zone would weaken the short thesis.
That is why I am not simply looking for the next green candle.
After a rally this aggressive, the interesting trade is sometimes not finding where the next buyers are waiting.
It is finding where the first serious sellers are waiting—and whether their selling pressure is strong enough to change the market structure.
DYOR: This is not financial advice. Before entering any trade, evaluate your risk tolerance, liquidity, fees, funding costs, and invalidation level. Never chase a pump or risk more capital than you can afford to lose.
#LSK #LSKUSDT #cryptouniverseofficial #Binance
1
225
·
--
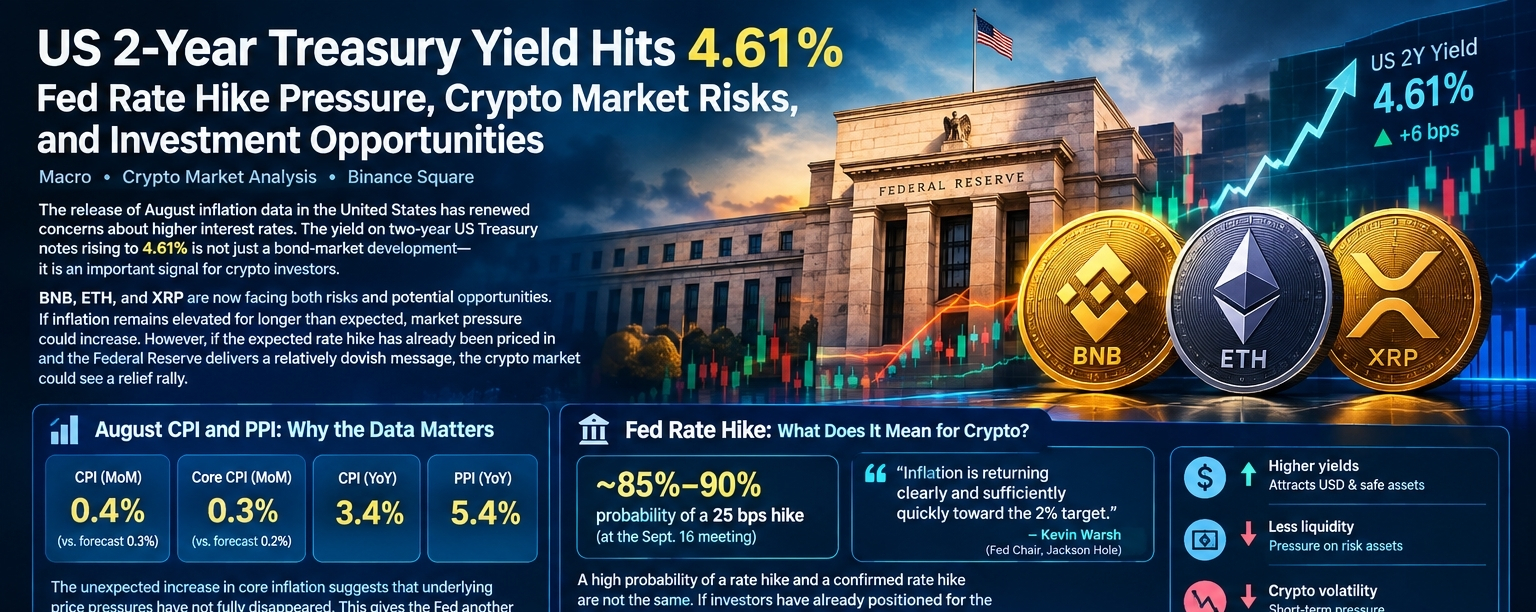
Article
US 2-Year Treasury Yield Hits 4.61%: Fed Rate Hike Pressure, Crypto Market Risks, and Investment OppMacro • Crypto Market Analysis • Binance Square
The release of August inflation data in the United States has renewed concerns about higher interest rates. The yield on two-year US Treasury notes rising to 4.61% is not just a bond-market development—it is an important signal for crypto investors.
BNB, ETH, and XRP are now facing both risks and potential opportunities. If inflation remains elevated for longer than expected, market pressure could increase. However, if the expected rate hike has already been priced in and the Federal Reserve delivers a relatively dovish message, the crypto market could see a relief rally.
August CPI and PPI: Why the Data Matters
According to the Reuters report, the US Consumer Price Index (CPI) rose 0.4% month-over-month in August, while annual inflation stood at 3.4%. Core CPI, which excludes food and energy, increased 0.3% month-over-month, above the market consensus of 0.2%.
The Producer Price Index (PPI) also climbed to 5.4% year-over-year in August, highlighting continued pressure on producer costs.
The unexpected increase in core inflation is important because it suggests that underlying price pressures have not fully disappeared. This gives the Federal Reserve another reason to remain cautious about easing monetary policy.
Fed Rate Hike: What Does It Mean for Crypto?
Market expectations for a 25-basis-point rate hike at the Federal Reserve meeting ending September 16 have strengthened following the August CPI report.
However, a high probability of a rate hike and a confirmed rate hike are not the same thing. If investors have already positioned for the decision, the announcement itself may not trigger another major sell-off. Instead, the Fed’s forward guidance and its view on future rate decisions could become the next major market catalyst.
Fed Chair Kevin Warsh emphasized at Jackson Hole whether inflation is returning clearly and sufficiently quickly toward the 2% target. If confidence in disinflation remains weak, further policy action may be necessary.
Higher interest rates can increase the attractiveness of the US dollar and Treasury yields. This may put pressure on risk assets as investors reconsider how much capital they want to allocate to volatile investments.
$BNB : A Macro Stress Test for the Binance Ecosystem
BNB’s investment case is not limited to the overall direction of the crypto market. The usage of BNB Chain, on-chain activity, and the practical utility of the Binance ecosystem are important factors in its long-term valuation.
Higher interest rates and tighter liquidity could create short-term pressure on BNB. However, if network activity remains stable, a market correction could create an opportunity for long-term investors to monitor.
What should investors watch?
- BNB’s relative strength compared with BTC and ETH.
- Reliable on-chain data showing activity and usage on BNB Chain.
- Buying interest and volume at important support levels.
- BNB’s performance relative to BTC after the Fed decision.
BNB should not be viewed simply as an asset that rises whenever the broader market moves higher. Long-term investment analysis should consider both real network usage and price strength.
$ETH : A Major Test for Interest Rates and the Digital Economy
Ethereum’s investment thesis is built around its role as infrastructure for smart contracts, DeFi, stablecoins, and digital applications.
At the same time, ETH’s valuation is sensitive to changes in interest rates and market liquidity. Higher Treasury yields can attract investors toward relatively safer, interest-bearing assets, potentially reducing the capital available for high-risk investments.
Two Possible Scenarios for ETH
Bearish scenario: Rising yields, a stronger dollar, and reduced risk appetite could increase selling pressure. If ETH loses important support levels, the decline could accelerate, particularly for leveraged traders facing liquidations.
Bullish scenario: If the rate hike is already priced in, yields stabilize, and buyers return, ETH could recover. A breakout above important resistance with strong volume would improve the market structure and potentially restore investor confidence.
The more balanced approach is to evaluate Ethereum’s long-term network usage, DeFi and stablecoin activity, and overall valuation alongside its price action.
$XRP : A Distinct Investment Thesis Despite Rate Hike Pressure
XRP’s investment case is connected to payments, cross-border settlement, and the potential utility of the XRP Ledger. This makes its long-term thesis different from that of BTC or ETH.
However, real-world adoption does not automatically guarantee a higher token price. Demand, actual usage, investor expectations, and overall market liquidity all influence valuation.
The Investment Case for XRP
XRP could attract long-term interest if its use in payment infrastructure continues to develop. Its relative strength against BTC may also provide a useful signal of demand during periods of market stress.
Investors should monitor important support levels, volume-backed breakouts, and evidence of real network utility. XRP should not be valued solely on the basis of a payment narrative; its valuation and practical usage need to be considered together.
How Should We Analyze the Market Going Forward?
The following four factors deserve particular attention before and after the Fed’s decision:
1. US 2-Year Treasury Yield and the Dollar
Is the yield continuing to rise, or is it stabilizing? If a stronger dollar is accompanied by weakness in crypto, that could indicate increasing macro pressure.
2. BTC Leadership
Can Bitcoin maintain its daily trend and hold important support levels? Weakness in BTC can increase pressure on ETH, XRP, and BNB.
3. Altcoin Relative Strength
Which of the three assets is outperforming BTC? Relative strength can help identify where demand is holding up better.
4. Volume, Open Interest, and Funding
Are trading volumes supporting price movements? Is excessive leverage building in the futures market? These indicators can help assess the risk of sudden volatility and liquidations.
Final Thoughts
The August CPI and PPI data have made the Federal Reserve’s inflation challenge more visible. Rising Treasury yields can naturally create short-term volatility in crypto markets. But not every correction is a long-term investment opportunity, and not every rate hike means a guaranteed market crash.
For BNB, ETH, and XRP, the most important factors are fundamental utility, market liquidity, price strength, and risk management.
Instead of entering the market out of FOMO before the Fed decision, a more disciplined approach is to consider gradual entries, relatively lower-risk spot exposure, and a clear investment plan.
DYOR — This is not financial advice. Crypto markets are highly volatile. Before investing in any asset, consider your risk tolerance, available capital, and the possibility of losses.
{spot}(BNBUSDT)
{spot}(ETHUSDT)
{spot}(XRPUSDT)
#US2YearYieldRisesTo4.61% #US10YearTreasuryYieldNears5% #BNB #ETH #xrp
US 2-Year Treasury Yield Hits 4.61%: Fed Rate Hike Pressure, Crypto Market Risks, and Investment Opp
Macro • Crypto Market Analysis • Binance Square
The release of August inflation data in the United States has renewed concerns about higher interest rates. The yield on two-year US Treasury notes rising to 4.61% is not just a bond-market development—it is an important signal for crypto investors.
BNB, ETH, and XRP are now facing both risks and potential opportunities. If inflation remains elevated for longer than expected, market pressure could increase. However, if the expected rate hike has already been priced in and the Federal Reserve delivers a relatively dovish message, the crypto market could see a relief rally.
August CPI and PPI: Why the Data Matters
According to the Reuters report, the US Consumer Price Index (CPI) rose 0.4% month-over-month in August, while annual inflation stood at 3.4%. Core CPI, which excludes food and energy, increased 0.3% month-over-month, above the market consensus of 0.2%.
The Producer Price Index (PPI) also climbed to 5.4% year-over-year in August, highlighting continued pressure on producer costs.
The unexpected increase in core inflation is important because it suggests that underlying price pressures have not fully disappeared. This gives the Federal Reserve another reason to remain cautious about easing monetary policy.
Fed Rate Hike: What Does It Mean for Crypto?
Market expectations for a 25-basis-point rate hike at the Federal Reserve meeting ending September 16 have strengthened following the August CPI report.
However, a high probability of a rate hike and a confirmed rate hike are not the same thing. If investors have already positioned for the decision, the announcement itself may not trigger another major sell-off. Instead, the Fed’s forward guidance and its view on future rate decisions could become the next major market catalyst.
Fed Chair Kevin Warsh emphasized at Jackson Hole whether inflation is returning clearly and sufficiently quickly toward the 2% target. If confidence in disinflation remains weak, further policy action may be necessary.
Higher interest rates can increase the attractiveness of the US dollar and Treasury yields. This may put pressure on risk assets as investors reconsider how much capital they want to allocate to volatile investments.
$BNB : A Macro Stress Test for the Binance Ecosystem
BNB’s investment case is not limited to the overall direction of the crypto market. The usage of BNB Chain, on-chain activity, and the practical utility of the Binance ecosystem are important factors in its long-term valuation.
Higher interest rates and tighter liquidity could create short-term pressure on BNB. However, if network activity remains stable, a market correction could create an opportunity for long-term investors to monitor.
What should investors watch?
- BNB’s relative strength compared with BTC and ETH.
- Reliable on-chain data showing activity and usage on BNB Chain.
- Buying interest and volume at important support levels.
- BNB’s performance relative to BTC after the Fed decision.
BNB should not be viewed simply as an asset that rises whenever the broader market moves higher. Long-term investment analysis should consider both real network usage and price strength.
$ETH : A Major Test for Interest Rates and the Digital Economy
Ethereum’s investment thesis is built around its role as infrastructure for smart contracts, DeFi, stablecoins, and digital applications.
At the same time, ETH’s valuation is sensitive to changes in interest rates and market liquidity. Higher Treasury yields can attract investors toward relatively safer, interest-bearing assets, potentially reducing the capital available for high-risk investments.
Two Possible Scenarios for ETH
Bearish scenario: Rising yields, a stronger dollar, and reduced risk appetite could increase selling pressure. If ETH loses important support levels, the decline could accelerate, particularly for leveraged traders facing liquidations.
Bullish scenario: If the rate hike is already priced in, yields stabilize, and buyers return, ETH could recover. A breakout above important resistance with strong volume would improve the market structure and potentially restore investor confidence.
The more balanced approach is to evaluate Ethereum’s long-term network usage, DeFi and stablecoin activity, and overall valuation alongside its price action.
$XRP : A Distinct Investment Thesis Despite Rate Hike Pressure
XRP’s investment case is connected to payments, cross-border settlement, and the potential utility of the XRP Ledger. This makes its long-term thesis different from that of BTC or ETH.
However, real-world adoption does not automatically guarantee a higher token price. Demand, actual usage, investor expectations, and overall market liquidity all influence valuation.
The Investment Case for XRP
XRP could attract long-term interest if its use in payment infrastructure continues to develop. Its relative strength against BTC may also provide a useful signal of demand during periods of market stress.
Investors should monitor important support levels, volume-backed breakouts, and evidence of real network utility. XRP should not be valued solely on the basis of a payment narrative; its valuation and practical usage need to be considered together.
How Should We Analyze the Market Going Forward?
The following four factors deserve particular attention before and after the Fed’s decision:
1. US 2-Year Treasury Yield and the Dollar
Is the yield continuing to rise, or is it stabilizing? If a stronger dollar is accompanied by weakness in crypto, that could indicate increasing macro pressure.
2. BTC Leadership
Can Bitcoin maintain its daily trend and hold important support levels? Weakness in BTC can increase pressure on ETH, XRP, and BNB.
3. Altcoin Relative Strength
Which of the three assets is outperforming BTC? Relative strength can help identify where demand is holding up better.
4. Volume, Open Interest, and Funding
Are trading volumes supporting price movements? Is excessive leverage building in the futures market? These indicators can help assess the risk of sudden volatility and liquidations.
Final Thoughts
The August CPI and PPI data have made the Federal Reserve’s inflation challenge more visible. Rising Treasury yields can naturally create short-term volatility in crypto markets. But not every correction is a long-term investment opportunity, and not every rate hike means a guaranteed market crash.
For BNB, ETH, and XRP, the most important factors are fundamental utility, market liquidity, price strength, and risk management.
Instead of entering the market out of FOMO before the Fed decision, a more disciplined approach is to consider gradual entries, relatively lower-risk spot exposure, and a clear investment plan.
DYOR — This is not financial advice. Crypto markets are highly volatile. Before investing in any asset, consider your risk tolerance, available capital, and the possibility of losses.
#US2YearYieldRisesTo4.61% #US10YearTreasuryYieldNears5% #BNB #ETH #xrp
The release of August inflation data in the United States has renewed concerns about higher interest rates. The yield on two-year US Treasury notes rising to 4.61% is not just a bond-market development—it is an important signal for crypto investors.
BNB, ETH, and XRP are now facing both risks and potential opportunities. If inflation remains elevated for longer than expected, market pressure could increase. However, if the expected rate hike has already been priced in and the Federal Reserve delivers a relatively dovish message, the crypto market could see a relief rally.
August CPI and PPI: Why the Data Matters
According to the Reuters report, the US Consumer Price Index (CPI) rose 0.4% month-over-month in August, while annual inflation stood at 3.4%. Core CPI, which excludes food and energy, increased 0.3% month-over-month, above the market consensus of 0.2%.
The Producer Price Index (PPI) also climbed to 5.4% year-over-year in August, highlighting continued pressure on producer costs.
The unexpected increase in core inflation is important because it suggests that underlying price pressures have not fully disappeared. This gives the Federal Reserve another reason to remain cautious about easing monetary policy.
Fed Rate Hike: What Does It Mean for Crypto?
Market expectations for a 25-basis-point rate hike at the Federal Reserve meeting ending September 16 have strengthened following the August CPI report.
However, a high probability of a rate hike and a confirmed rate hike are not the same thing. If investors have already positioned for the decision, the announcement itself may not trigger another major sell-off. Instead, the Fed’s forward guidance and its view on future rate decisions could become the next major market catalyst.
Fed Chair Kevin Warsh emphasized at Jackson Hole whether inflation is returning clearly and sufficiently quickly toward the 2% target. If confidence in disinflation remains weak, further policy action may be necessary.
Higher interest rates can increase the attractiveness of the US dollar and Treasury yields. This may put pressure on risk assets as investors reconsider how much capital they want to allocate to volatile investments.
$BNB : A Macro Stress Test for the Binance Ecosystem
BNB’s investment case is not limited to the overall direction of the crypto market. The usage of BNB Chain, on-chain activity, and the practical utility of the Binance ecosystem are important factors in its long-term valuation.
Higher interest rates and tighter liquidity could create short-term pressure on BNB. However, if network activity remains stable, a market correction could create an opportunity for long-term investors to monitor.
What should investors watch?
- BNB’s relative strength compared with BTC and ETH.
- Reliable on-chain data showing activity and usage on BNB Chain.
- Buying interest and volume at important support levels.
- BNB’s performance relative to BTC after the Fed decision.
BNB should not be viewed simply as an asset that rises whenever the broader market moves higher. Long-term investment analysis should consider both real network usage and price strength.
$ETH : A Major Test for Interest Rates and the Digital Economy
Ethereum’s investment thesis is built around its role as infrastructure for smart contracts, DeFi, stablecoins, and digital applications.
At the same time, ETH’s valuation is sensitive to changes in interest rates and market liquidity. Higher Treasury yields can attract investors toward relatively safer, interest-bearing assets, potentially reducing the capital available for high-risk investments.
Two Possible Scenarios for ETH
Bearish scenario: Rising yields, a stronger dollar, and reduced risk appetite could increase selling pressure. If ETH loses important support levels, the decline could accelerate, particularly for leveraged traders facing liquidations.
Bullish scenario: If the rate hike is already priced in, yields stabilize, and buyers return, ETH could recover. A breakout above important resistance with strong volume would improve the market structure and potentially restore investor confidence.
The more balanced approach is to evaluate Ethereum’s long-term network usage, DeFi and stablecoin activity, and overall valuation alongside its price action.
$XRP : A Distinct Investment Thesis Despite Rate Hike Pressure
XRP’s investment case is connected to payments, cross-border settlement, and the potential utility of the XRP Ledger. This makes its long-term thesis different from that of BTC or ETH.
However, real-world adoption does not automatically guarantee a higher token price. Demand, actual usage, investor expectations, and overall market liquidity all influence valuation.
The Investment Case for XRP
XRP could attract long-term interest if its use in payment infrastructure continues to develop. Its relative strength against BTC may also provide a useful signal of demand during periods of market stress.
Investors should monitor important support levels, volume-backed breakouts, and evidence of real network utility. XRP should not be valued solely on the basis of a payment narrative; its valuation and practical usage need to be considered together.
How Should We Analyze the Market Going Forward?
The following four factors deserve particular attention before and after the Fed’s decision:
1. US 2-Year Treasury Yield and the Dollar
Is the yield continuing to rise, or is it stabilizing? If a stronger dollar is accompanied by weakness in crypto, that could indicate increasing macro pressure.
2. BTC Leadership
Can Bitcoin maintain its daily trend and hold important support levels? Weakness in BTC can increase pressure on ETH, XRP, and BNB.
3. Altcoin Relative Strength
Which of the three assets is outperforming BTC? Relative strength can help identify where demand is holding up better.
4. Volume, Open Interest, and Funding
Are trading volumes supporting price movements? Is excessive leverage building in the futures market? These indicators can help assess the risk of sudden volatility and liquidations.
Final Thoughts
The August CPI and PPI data have made the Federal Reserve’s inflation challenge more visible. Rising Treasury yields can naturally create short-term volatility in crypto markets. But not every correction is a long-term investment opportunity, and not every rate hike means a guaranteed market crash.
For BNB, ETH, and XRP, the most important factors are fundamental utility, market liquidity, price strength, and risk management.
Instead of entering the market out of FOMO before the Fed decision, a more disciplined approach is to consider gradual entries, relatively lower-risk spot exposure, and a clear investment plan.
DYOR — This is not financial advice. Crypto markets are highly volatile. Before investing in any asset, consider your risk tolerance, available capital, and the possibility of losses.
#US2YearYieldRisesTo4.61% #US10YearTreasuryYieldNears5% #BNB #ETH #xrp
1
171
·
--

Article
Will CPI Open the Door for the Fed’s Next Rate Hike? 👀🔥 US Inflation, Interest Rates & Crypto Market — The Next Big Move
After US Nonfarm Payrolls came in stronger than expected, the most important question facing the market now is: Will the Federal Reserve raise interest rates again, or will it finally pause?
With CPI data ahead, the answer to this question is important not only for the traditional stock market but also for Bitcoin, altcoins, gold, and the entire global liquidity cycle.
My current market bias is slightly bearish. However, if inflation comes in lower than expected, sentiment could turn bullish very quickly.
Strong Jobs Data: Why It Matters
Strong employment data generally gives the Fed room to maintain a restrictive monetary policy to control inflation. If the labor market remains stable, policymakers may feel less urgency to cut interest rates.
However, one thing is important to remember: Strong NFP does not necessarily mean a rate hike is guaranteed.
The Fed considers inflation, employment, economic growth, and financial conditions together. If CPI comes in higher than expected, the probability of a rate hike could increase. On the other hand, if inflation continues to decline gradually, expectations of a pause or a rate cut later on could strengthen.
Three Possible CPI Scenarios
1️⃣ Hot CPI — Risk Assets Under Pressure
If both headline and core CPI come in higher than expected, Treasury yields and rate-hike expectations could rise.
Potential impacts include:
• Selling pressure on tech stocks
• Volatility in Bitcoin and altcoins
• Increased risk of leverage liquidations
• Potential strengthening of the dollar
Higher rates generally put pressure on liquidity. Therefore, taking bullish positions with excessive leverage could be risky in this situation.
2️⃣ Cool CPI — Relief Rally Incoming?
If inflation data comes in lower than expected, the need for aggressive tightening by the Fed could decrease.
This could create the possibility of lower Treasury yields and increased risk appetite. Bitcoin and other risk assets could experience a relief rally.
However, a sustained bull market is not guaranteed simply because CPI comes in lower. Confirmation through price action, volume, and liquidity is necessary.
3️⃣ Mixed CPI — Volatility Before Direction
Headline CPI could come in higher while core CPI falls, or vice versa. In such a situation, the initial reaction could be misleading.
Often, the market quickly sells off after looking at the headline data, then changes direction after analyzing core inflation and Fed expectations.
For this reason, it is better to avoid impulsive trades during the first few minutes after the CPI release.
Bitcoin & Crypto Market Outlook
Bitcoin is now deeply connected to macro liquidity and institutional risk appetite.
If CPI comes in hot and yields rise, downside pressure could develop in $BTC and altcoins. In particular, altcoins that have already experienced significant rallies could face more intense profit-taking.
On the other hand, cool CPI + falling yields + strong BTC volume would increase the possibility of a bullish reversal.
I prefer to avoid aggressive leverage ahead of the CPI release. Whether price can hold support levels and whether the retest after a breakout is successful will be the key confirmations.
Gold$XAU : Why I’m Staying Defensive
Amid the current macro uncertainty, gold is a defensive allocation in my view.
If inflation and geopolitical uncertainty increase, demand for gold as a safe haven could rise. However, higher real yields and a stronger dollar could put pressure on gold.
In other words, there is no guarantee that gold will rise simply because CPI comes in hot.
In my view, holding some gold for portfolio diversification and avoiding putting all capital into high-risk assets at once is more important.
What I’m Watching Next
🔎 US CPI headline and core inflation
🔎 Fed rate-hike expectations
🔎 US 2-year Treasury yield
🔎 BTC support, volume, and Open Interest
🔎 Gold and Dollar reaction
🔎 Relative strength of tech stocks
Final Thoughts
CPI is not just an economic report—it is an important signal for the Fed’s next policy direction and global liquidity.
My bias remains slightly bearish until the trend in inflation and yields shifts in favor of risk assets.
However, if CPI comes in cooler than expected, market sentiment could turn bullish very quickly.
I am currently holding some gold, remaining cautious on tech stocks, and waiting for confirmation in crypto.
Trade the data, not the emotion. Protect your capital before chasing the next rally.
DYOR. This is not financial advice.
#CPIWatch #CryptoDawar #bitcoin #CPIWatch #GOLD
{spot}(BTCUSDT)
Will CPI Open the Door for the Fed’s Next Rate Hike? 👀
🔥 US Inflation, Interest Rates & Crypto Market — The Next Big Move
After US Nonfarm Payrolls came in stronger than expected, the most important question facing the market now is: Will the Federal Reserve raise interest rates again, or will it finally pause?
With CPI data ahead, the answer to this question is important not only for the traditional stock market but also for Bitcoin, altcoins, gold, and the entire global liquidity cycle.
My current market bias is slightly bearish. However, if inflation comes in lower than expected, sentiment could turn bullish very quickly.
Strong Jobs Data: Why It Matters
Strong employment data generally gives the Fed room to maintain a restrictive monetary policy to control inflation. If the labor market remains stable, policymakers may feel less urgency to cut interest rates.
However, one thing is important to remember: Strong NFP does not necessarily mean a rate hike is guaranteed.
The Fed considers inflation, employment, economic growth, and financial conditions together. If CPI comes in higher than expected, the probability of a rate hike could increase. On the other hand, if inflation continues to decline gradually, expectations of a pause or a rate cut later on could strengthen.
Three Possible CPI Scenarios
1️⃣ Hot CPI — Risk Assets Under Pressure
If both headline and core CPI come in higher than expected, Treasury yields and rate-hike expectations could rise.
Potential impacts include:
• Selling pressure on tech stocks
• Volatility in Bitcoin and altcoins
• Increased risk of leverage liquidations
• Potential strengthening of the dollar
Higher rates generally put pressure on liquidity. Therefore, taking bullish positions with excessive leverage could be risky in this situation.
2️⃣ Cool CPI — Relief Rally Incoming?
If inflation data comes in lower than expected, the need for aggressive tightening by the Fed could decrease.
This could create the possibility of lower Treasury yields and increased risk appetite. Bitcoin and other risk assets could experience a relief rally.
However, a sustained bull market is not guaranteed simply because CPI comes in lower. Confirmation through price action, volume, and liquidity is necessary.
3️⃣ Mixed CPI — Volatility Before Direction
Headline CPI could come in higher while core CPI falls, or vice versa. In such a situation, the initial reaction could be misleading.
Often, the market quickly sells off after looking at the headline data, then changes direction after analyzing core inflation and Fed expectations.
For this reason, it is better to avoid impulsive trades during the first few minutes after the CPI release.
Bitcoin & Crypto Market Outlook
Bitcoin is now deeply connected to macro liquidity and institutional risk appetite.
If CPI comes in hot and yields rise, downside pressure could develop in $BTC and altcoins. In particular, altcoins that have already experienced significant rallies could face more intense profit-taking.
On the other hand, cool CPI + falling yields + strong BTC volume would increase the possibility of a bullish reversal.
I prefer to avoid aggressive leverage ahead of the CPI release. Whether price can hold support levels and whether the retest after a breakout is successful will be the key confirmations.
Gold$XAU : Why I’m Staying Defensive
Amid the current macro uncertainty, gold is a defensive allocation in my view.
If inflation and geopolitical uncertainty increase, demand for gold as a safe haven could rise. However, higher real yields and a stronger dollar could put pressure on gold.
In other words, there is no guarantee that gold will rise simply because CPI comes in hot.
In my view, holding some gold for portfolio diversification and avoiding putting all capital into high-risk assets at once is more important.
What I’m Watching Next
🔎 US CPI headline and core inflation
🔎 Fed rate-hike expectations
🔎 US 2-year Treasury yield
🔎 BTC support, volume, and Open Interest
🔎 Gold and Dollar reaction
🔎 Relative strength of tech stocks
Final Thoughts
CPI is not just an economic report—it is an important signal for the Fed’s next policy direction and global liquidity.
My bias remains slightly bearish until the trend in inflation and yields shifts in favor of risk assets.
However, if CPI comes in cooler than expected, market sentiment could turn bullish very quickly.
I am currently holding some gold, remaining cautious on tech stocks, and waiting for confirmation in crypto.
Trade the data, not the emotion. Protect your capital before chasing the next rally.
DYOR. This is not financial advice.
#CPIWatch #CryptoDawar #bitcoin #CPIWatch #GOLD
After US Nonfarm Payrolls came in stronger than expected, the most important question facing the market now is: Will the Federal Reserve raise interest rates again, or will it finally pause?
With CPI data ahead, the answer to this question is important not only for the traditional stock market but also for Bitcoin, altcoins, gold, and the entire global liquidity cycle.
My current market bias is slightly bearish. However, if inflation comes in lower than expected, sentiment could turn bullish very quickly.
Strong Jobs Data: Why It Matters
Strong employment data generally gives the Fed room to maintain a restrictive monetary policy to control inflation. If the labor market remains stable, policymakers may feel less urgency to cut interest rates.
However, one thing is important to remember: Strong NFP does not necessarily mean a rate hike is guaranteed.
The Fed considers inflation, employment, economic growth, and financial conditions together. If CPI comes in higher than expected, the probability of a rate hike could increase. On the other hand, if inflation continues to decline gradually, expectations of a pause or a rate cut later on could strengthen.
Three Possible CPI Scenarios
1️⃣ Hot CPI — Risk Assets Under Pressure
If both headline and core CPI come in higher than expected, Treasury yields and rate-hike expectations could rise.
Potential impacts include:
• Selling pressure on tech stocks
• Volatility in Bitcoin and altcoins
• Increased risk of leverage liquidations
• Potential strengthening of the dollar
Higher rates generally put pressure on liquidity. Therefore, taking bullish positions with excessive leverage could be risky in this situation.
2️⃣ Cool CPI — Relief Rally Incoming?
If inflation data comes in lower than expected, the need for aggressive tightening by the Fed could decrease.
This could create the possibility of lower Treasury yields and increased risk appetite. Bitcoin and other risk assets could experience a relief rally.
However, a sustained bull market is not guaranteed simply because CPI comes in lower. Confirmation through price action, volume, and liquidity is necessary.
3️⃣ Mixed CPI — Volatility Before Direction
Headline CPI could come in higher while core CPI falls, or vice versa. In such a situation, the initial reaction could be misleading.
Often, the market quickly sells off after looking at the headline data, then changes direction after analyzing core inflation and Fed expectations.
For this reason, it is better to avoid impulsive trades during the first few minutes after the CPI release.
Bitcoin & Crypto Market Outlook
Bitcoin is now deeply connected to macro liquidity and institutional risk appetite.
If CPI comes in hot and yields rise, downside pressure could develop in $BTC and altcoins. In particular, altcoins that have already experienced significant rallies could face more intense profit-taking.
On the other hand, cool CPI + falling yields + strong BTC volume would increase the possibility of a bullish reversal.
I prefer to avoid aggressive leverage ahead of the CPI release. Whether price can hold support levels and whether the retest after a breakout is successful will be the key confirmations.
Gold$XAU : Why I’m Staying Defensive
Amid the current macro uncertainty, gold is a defensive allocation in my view.
If inflation and geopolitical uncertainty increase, demand for gold as a safe haven could rise. However, higher real yields and a stronger dollar could put pressure on gold.
In other words, there is no guarantee that gold will rise simply because CPI comes in hot.
In my view, holding some gold for portfolio diversification and avoiding putting all capital into high-risk assets at once is more important.
What I’m Watching Next
🔎 US CPI headline and core inflation
🔎 Fed rate-hike expectations
🔎 US 2-year Treasury yield
🔎 BTC support, volume, and Open Interest
🔎 Gold and Dollar reaction
🔎 Relative strength of tech stocks
Final Thoughts
CPI is not just an economic report—it is an important signal for the Fed’s next policy direction and global liquidity.
My bias remains slightly bearish until the trend in inflation and yields shifts in favor of risk assets.
However, if CPI comes in cooler than expected, market sentiment could turn bullish very quickly.
I am currently holding some gold, remaining cautious on tech stocks, and waiting for confirmation in crypto.
Trade the data, not the emotion. Protect your capital before chasing the next rally.
DYOR. This is not financial advice.
#CPIWatch #CryptoDawar #bitcoin #CPIWatch #GOLD
1
859
·
--

Article
🚨 Bab el-Mandeb Is Becoming a New Oil Flashpoint — Are $CL & $BZ Facing a Bigger Move?The global energy market is once again facing a major geopolitical risk.
Iran-backed Houthi forces in Yemen are rapidly advancing along the Red Sea coast, and their reported control of the strategically important Mocha area brings them closer to the Bab el-Mandeb Strait.
This is no longer just a regional conflict story.
It has become a potential risk for global shipping, crude oil transportation, supply chains, and energy prices.
And the market is already reacting.
Brent crude has moved above $105 per barrel, while WTI has climbed above $100, as concerns over potential supply disruptions around both the Red Sea and Strait of Hormuz intensify.
That brings two important oil-market instruments directly into focus:
CL — WTI Crude Oil
BZ — Brent Crude Oil
The bigger question now is not simply:
“How high can oil go?”
The more important question is:
If Bab el-Mandeb remains a high-risk shipping zone, is the oil market entering a new era of geopolitical risk premium?
🌍 Why Is Bab el-Mandeb So Important?
On a map, Bab el-Mandeb may look like a relatively small chokepoint.
For global energy trade, however, its importance is enormous.
The narrow maritime passage connects the Red Sea with the Gulf of Aden and the Indian Ocean, making it a critical shipping corridor between the Middle East, Europe and global markets.
Its strategic importance has increased even further because disruptions around the Strait of Hormuz have already changed regional oil-flow dynamics.
According to U.S. Energy Information Administration data, crude oil and petroleum liquids flowing through Bab el-Mandeb averaged around 8.1 million barrels per day in the second quarter of 2026, compared with approximately 5.4 million barrels per day in the fourth quarter of 2025.
That highlights an important structural point:
The greater the pressure on Hormuz, the more strategically important Bab el-Mandeb becomes.
If both chokepoints face serious disruption risks at the same time, the global oil market could face a much larger supply-security problem.
🔥 Why Does the Mocha Development Matter?
Recent reports indicate that Houthi forces have moved into or established control around the strategic Red Sea port area of Mocha, strengthening their position closer to Bab el-Mandeb.
This matters because geography matters enormously in maritime conflicts.
A stronger Houthi presence near the chokepoint could increase the perceived risk for commercial vessels travelling through the region.
If shipping companies begin avoiding the route because of security concerns, several things can happen:
Longer routes → Higher freight costs → Higher insurance premiums → Greater supply uncertainty
And oil markets often price potential disruption before an actual physical shortage occurs.
That is why crude oil can rally sharply simply because the probability of disruption increases.
🛢️ $BZ — Why Brent Could Be the Key Beneficiary
Brent crude is one of the most important international oil benchmarks.
Because Brent is closely connected to global seaborne crude trade, geopolitical risks involving the Middle East, Red Sea and international shipping can have a particularly strong influence on its price.
That makes BZ especially important in the current environment.
Brent has already moved above the $100 psychological level, with prices recently trading above $105 per barrel amid intensifying geopolitical concerns.
The market mechanism is relatively straightforward:
Geopolitical Risk
↓
Shipping Risk
↓
Insurance & Freight Costs
↓
Supply Uncertainty
↓
Higher Oil Risk Premium
If tanker operators are forced to reroute vessels and journeys become longer and more expensive, the cost of moving crude can increase significantly.
If physical oil markets also tighten, Brent could attract an additional geopolitical premium.
🇺🇸 $CL — Can WTI Benefit From the Same Shock?
CL, representing WTI crude oil futures, is another major instrument to watch.
WTI is primarily associated with the U.S. crude market, so its price is influenced by domestic production, inventories, refinery demand and U.S. exports.
However, WTI does not operate in isolation from the global oil market.
A major geopolitical supply shock can push both Brent and WTI higher, although the magnitude of the move can differ.
This creates an important distinction:
BZ = More direct exposure to global seaborne and geopolitical oil risk
CL = Global oil shock + U.S. supply/demand dynamics
Both can benefit from a prolonged supply shock, but investors should not assume that they will always move identically.
📊 Is Oil Rising Only Because of War?
This is where sophisticated market analysis becomes important.
It is easy to say:
“War = Oil Up.”
But that is not enough.
We need to look at three separate layers:
1️⃣ Physical Supply
How many barrels are actually reaching the market?
2️⃣ Transportation Risk
Can tankers safely move through Hormuz, Bab el-Mandeb and the Red Sea?
3️⃣ Risk Premium
How much are traders willing to pay today to protect against future disruption?
Right now, all three factors matter.
EIA data shows that oil flows through Hormuz dropped dramatically in the second quarter of 2026, while flows through Bab el-Mandeb increased significantly.
That makes the Red Sea corridor even more strategically important.
🚀 The Most Bullish Scenario for CL & BZ
Consider a scenario where:
Houthi forces expand their control along the Red Sea coast
Attacks or threats against commercial shipping increase
Tankers begin rerouting
Saudi crude exports face additional logistical constraints
Hormuz disruptions remain prolonged
Diplomatic de-escalation fails to arrive quickly
In that environment, supply fears could intensify.
The market could begin pricing a significantly larger geopolitical premium.
Under a sustained escalation scenario, traders could start watching areas such as:
BZ → $110 → $115 → $120+
and
CL → $105 → $110 → $115+
These are scenario-based levels, not guaranteed targets.
They depend heavily on whether the geopolitical disruption actually persists.
🧨 But Don't Make This Mistake
Just because oil has moved above $100 does not mean that buying at any price is safe.
Geopolitical markets are extremely volatile.
A ceasefire announcement, diplomatic breakthrough, reopening of shipping routes, or signs of military de-escalation could quickly remove part of the geopolitical premium.
That means traders chasing a $100+ breakout could suddenly face a sharp correction.
In today's oil market, headline risk can be just as important as technical analysis.
📈 My Market Framework for BZ
I would divide the Brent outlook into three broad scenarios.
🟢 Bullish Continuation
If Brent remains firmly above $100 and geopolitical risks continue escalating, buyers could maintain control.
Sustained trading above $105 could bring the $110 psychological level into focus.
A further escalation could potentially push the market toward even higher levels.
🟡 Consolidation
If the geopolitical situation stabilizes without being fully resolved, Brent could enter a high-volatility consolidation phase around the $100–$110 region.
This environment can produce both breakouts and fakeouts.
🔴 Bearish Reversal
If geopolitical tensions ease significantly and a credible diplomatic solution emerges, the current risk premium could unwind.
In that scenario, the $100 level could become an important psychological support.
📈 My Market Framework for CL
WTI's $100 level is equally important from a psychological perspective.
If WTI can maintain sustained price action above $100, bullish sentiment could remain strong.
The market could then focus on areas around:
$105 → $110
However, a decisive rejection below $100 could indicate that part of the geopolitical premium is disappearing.
For WTI, traders should also monitor:
U.S. crude inventories + production + refinery demand + exports + geopolitical developments
because these factors can determine whether the rally is sustainable.
🧠 What Would Smart Money Watch?
I would not simply watch the headline:
“Oil is going up.”
Instead, I would monitor several important indicators.
1. Brent-WTI Spread
If Brent begins outperforming WTI significantly, it could signal stronger international seaborne supply risk.
2. Futures Curve
A deeper backwardation can indicate tighter physical market conditions.
3. Tanker Rates
A sharp increase in shipping costs would suggest that Red Sea disruptions are having a more meaningful economic impact.
4. War-Risk Insurance
Higher insurance premiums increase the cost of transporting crude through dangerous maritime corridors.
5. Inventory Data
U.S. crude inventories and broader stock movements can help determine whether an oil rally is supported by actual physical tightening.
🌍 Why Could an Oil Rally Also Affect Crypto?
This is one of the most important parts for crypto investors.
If oil remains above $100 for an extended period, inflationary pressure could increase again.
That could make interest-rate cuts more difficult for central banks.
And because Bitcoin and the broader crypto market are sensitive to liquidity conditions, tighter monetary expectations can create pressure on risk assets.
The potential transmission mechanism is:
Oil ↑ → Inflation Pressure ↑ → Rate-Cut Expectations ↓ → Liquidity Tightens → Risk Assets Face Pressure
However, the relationship is not always one-way.
If geopolitical escalation becomes severe enough to create major concerns about global economic growth, markets could eventually begin pricing future monetary easing.
So the impact of oil on crypto depends on both inflation and growth expectations.
💰 Are CL & BZ Investment Opportunities Now?
I would not describe them as “easy money” trades.
Instead, the current environment creates a high-risk, high-volatility tactical opportunity for traders who understand the oil market and can manage futures risk.
But blindly using leverage to chase the rally can be extremely dangerous.
Oil markets can move several dollars in a very short period when geopolitical headlines change.
Therefore:
❌ Don't go all-in.
❌ Don't use excessive leverage.
❌ Don't trade without a stop-loss.
❌ Don't enter purely because of a social-media headline.
❌ Don't chase $100+ oil out of FOMO.
Instead:
✅ Keep position sizes controlled.
✅ Watch key support and resistance levels.
✅ Take partial profits when appropriate.
✅ Use disciplined risk management.
✅ Monitor the Brent-WTI spread.
✅ Follow shipping and geopolitical developments closely.
🚨 Final Outlook: Bab el-Mandeb Is Now an Oil Market Wild Card
If Houthi forces continue expanding their presence along Yemen's Red Sea coast and gain greater leverage around Bab el-Mandeb, this could evolve beyond a regional military conflict.
It could become a global energy-supply story.
The situation becomes even more significant because the Strait of Hormuz is already under pressure.
EIA data showing substantial oil flows through Bab el-Mandeb highlights why this chokepoint matters to the global energy system.
And the recent move of Brent above $105 and WTI above $100 shows that the market is already pricing a meaningful geopolitical risk premium.
Therefore, my focus remains clear:
🛢️ BZ — Global geopolitical oil benchmark
🛢️ $CL — U.S. crude benchmark
If disruptions around both Bab el-Mandeb and Hormuz remain prolonged, the current oil rally could have further room to develop.
But if diplomatic de-escalation begins, the same geopolitical premium could unwind rapidly.
The real oil trade right now isn't simply “oil will go up.”
The real question is:
How long can the geopolitical risk premium survive?
And the answer to that question could determine the next major move in CL and BZ.
DYOR. Manage risk. Never chase a geopolitical pump.
{future}(CLUSDT)
{future}(BZUSDT)
#CL #BZ #oil #war #cryptouniverseofficial
🚨 Bab el-Mandeb Is Becoming a New Oil Flashpoint — Are $CL & $BZ Facing a Bigger Move?
The global energy market is once again facing a major geopolitical risk.
Iran-backed Houthi forces in Yemen are rapidly advancing along the Red Sea coast, and their reported control of the strategically important Mocha area brings them closer to the Bab el-Mandeb Strait.
This is no longer just a regional conflict story.
It has become a potential risk for global shipping, crude oil transportation, supply chains, and energy prices.
And the market is already reacting.
Brent crude has moved above $105 per barrel, while WTI has climbed above $100, as concerns over potential supply disruptions around both the Red Sea and Strait of Hormuz intensify.
That brings two important oil-market instruments directly into focus:
CL — WTI Crude Oil
BZ — Brent Crude Oil
The bigger question now is not simply:
“How high can oil go?”
The more important question is:
If Bab el-Mandeb remains a high-risk shipping zone, is the oil market entering a new era of geopolitical risk premium?
🌍 Why Is Bab el-Mandeb So Important?
On a map, Bab el-Mandeb may look like a relatively small chokepoint.
For global energy trade, however, its importance is enormous.
The narrow maritime passage connects the Red Sea with the Gulf of Aden and the Indian Ocean, making it a critical shipping corridor between the Middle East, Europe and global markets.
Its strategic importance has increased even further because disruptions around the Strait of Hormuz have already changed regional oil-flow dynamics.
According to U.S. Energy Information Administration data, crude oil and petroleum liquids flowing through Bab el-Mandeb averaged around 8.1 million barrels per day in the second quarter of 2026, compared with approximately 5.4 million barrels per day in the fourth quarter of 2025.
That highlights an important structural point:
The greater the pressure on Hormuz, the more strategically important Bab el-Mandeb becomes.
If both chokepoints face serious disruption risks at the same time, the global oil market could face a much larger supply-security problem.
🔥 Why Does the Mocha Development Matter?
Recent reports indicate that Houthi forces have moved into or established control around the strategic Red Sea port area of Mocha, strengthening their position closer to Bab el-Mandeb.
This matters because geography matters enormously in maritime conflicts.
A stronger Houthi presence near the chokepoint could increase the perceived risk for commercial vessels travelling through the region.
If shipping companies begin avoiding the route because of security concerns, several things can happen:
Longer routes → Higher freight costs → Higher insurance premiums → Greater supply uncertainty
And oil markets often price potential disruption before an actual physical shortage occurs.
That is why crude oil can rally sharply simply because the probability of disruption increases.
🛢️ $BZ — Why Brent Could Be the Key Beneficiary
Brent crude is one of the most important international oil benchmarks.
Because Brent is closely connected to global seaborne crude trade, geopolitical risks involving the Middle East, Red Sea and international shipping can have a particularly strong influence on its price.
That makes BZ especially important in the current environment.
Brent has already moved above the $100 psychological level, with prices recently trading above $105 per barrel amid intensifying geopolitical concerns.
The market mechanism is relatively straightforward:
Geopolitical Risk
↓
Shipping Risk
↓
Insurance & Freight Costs
↓
Supply Uncertainty
↓
Higher Oil Risk Premium
If tanker operators are forced to reroute vessels and journeys become longer and more expensive, the cost of moving crude can increase significantly.
If physical oil markets also tighten, Brent could attract an additional geopolitical premium.
🇺🇸 $CL — Can WTI Benefit From the Same Shock?
CL, representing WTI crude oil futures, is another major instrument to watch.
WTI is primarily associated with the U.S. crude market, so its price is influenced by domestic production, inventories, refinery demand and U.S. exports.
However, WTI does not operate in isolation from the global oil market.
A major geopolitical supply shock can push both Brent and WTI higher, although the magnitude of the move can differ.
This creates an important distinction:
BZ = More direct exposure to global seaborne and geopolitical oil risk
CL = Global oil shock + U.S. supply/demand dynamics
Both can benefit from a prolonged supply shock, but investors should not assume that they will always move identically.
📊 Is Oil Rising Only Because of War?
This is where sophisticated market analysis becomes important.
It is easy to say:
“War = Oil Up.”
But that is not enough.
We need to look at three separate layers:
1️⃣ Physical Supply
How many barrels are actually reaching the market?
2️⃣ Transportation Risk
Can tankers safely move through Hormuz, Bab el-Mandeb and the Red Sea?
3️⃣ Risk Premium
How much are traders willing to pay today to protect against future disruption?
Right now, all three factors matter.
EIA data shows that oil flows through Hormuz dropped dramatically in the second quarter of 2026, while flows through Bab el-Mandeb increased significantly.
That makes the Red Sea corridor even more strategically important.
🚀 The Most Bullish Scenario for CL & BZ
Consider a scenario where:
Houthi forces expand their control along the Red Sea coast
Attacks or threats against commercial shipping increase
Tankers begin rerouting
Saudi crude exports face additional logistical constraints
Hormuz disruptions remain prolonged
Diplomatic de-escalation fails to arrive quickly
In that environment, supply fears could intensify.
The market could begin pricing a significantly larger geopolitical premium.
Under a sustained escalation scenario, traders could start watching areas such as:
BZ → $110 → $115 → $120+
and
CL → $105 → $110 → $115+
These are scenario-based levels, not guaranteed targets.
They depend heavily on whether the geopolitical disruption actually persists.
🧨 But Don't Make This Mistake
Just because oil has moved above $100 does not mean that buying at any price is safe.
Geopolitical markets are extremely volatile.
A ceasefire announcement, diplomatic breakthrough, reopening of shipping routes, or signs of military de-escalation could quickly remove part of the geopolitical premium.
That means traders chasing a $100+ breakout could suddenly face a sharp correction.
In today's oil market, headline risk can be just as important as technical analysis.
📈 My Market Framework for BZ
I would divide the Brent outlook into three broad scenarios.
🟢 Bullish Continuation
If Brent remains firmly above $100 and geopolitical risks continue escalating, buyers could maintain control.
Sustained trading above $105 could bring the $110 psychological level into focus.
A further escalation could potentially push the market toward even higher levels.
🟡 Consolidation
If the geopolitical situation stabilizes without being fully resolved, Brent could enter a high-volatility consolidation phase around the $100–$110 region.
This environment can produce both breakouts and fakeouts.
🔴 Bearish Reversal
If geopolitical tensions ease significantly and a credible diplomatic solution emerges, the current risk premium could unwind.
In that scenario, the $100 level could become an important psychological support.
📈 My Market Framework for CL
WTI's $100 level is equally important from a psychological perspective.
If WTI can maintain sustained price action above $100, bullish sentiment could remain strong.
The market could then focus on areas around:
$105 → $110
However, a decisive rejection below $100 could indicate that part of the geopolitical premium is disappearing.
For WTI, traders should also monitor:
U.S. crude inventories + production + refinery demand + exports + geopolitical developments
because these factors can determine whether the rally is sustainable.
🧠 What Would Smart Money Watch?
I would not simply watch the headline:
“Oil is going up.”
Instead, I would monitor several important indicators.
1. Brent-WTI Spread
If Brent begins outperforming WTI significantly, it could signal stronger international seaborne supply risk.
2. Futures Curve
A deeper backwardation can indicate tighter physical market conditions.
3. Tanker Rates
A sharp increase in shipping costs would suggest that Red Sea disruptions are having a more meaningful economic impact.
4. War-Risk Insurance
Higher insurance premiums increase the cost of transporting crude through dangerous maritime corridors.
5. Inventory Data
U.S. crude inventories and broader stock movements can help determine whether an oil rally is supported by actual physical tightening.
🌍 Why Could an Oil Rally Also Affect Crypto?
This is one of the most important parts for crypto investors.
If oil remains above $100 for an extended period, inflationary pressure could increase again.
That could make interest-rate cuts more difficult for central banks.
And because Bitcoin and the broader crypto market are sensitive to liquidity conditions, tighter monetary expectations can create pressure on risk assets.
The potential transmission mechanism is:
Oil ↑ → Inflation Pressure ↑ → Rate-Cut Expectations ↓ → Liquidity Tightens → Risk Assets Face Pressure
However, the relationship is not always one-way.
If geopolitical escalation becomes severe enough to create major concerns about global economic growth, markets could eventually begin pricing future monetary easing.
So the impact of oil on crypto depends on both inflation and growth expectations.
💰 Are CL & BZ Investment Opportunities Now?
I would not describe them as “easy money” trades.
Instead, the current environment creates a high-risk, high-volatility tactical opportunity for traders who understand the oil market and can manage futures risk.
But blindly using leverage to chase the rally can be extremely dangerous.
Oil markets can move several dollars in a very short period when geopolitical headlines change.
Therefore:
❌ Don't go all-in.
❌ Don't use excessive leverage.
❌ Don't trade without a stop-loss.
❌ Don't enter purely because of a social-media headline.
❌ Don't chase $100+ oil out of FOMO.
Instead:
✅ Keep position sizes controlled.
✅ Watch key support and resistance levels.
✅ Take partial profits when appropriate.
✅ Use disciplined risk management.
✅ Monitor the Brent-WTI spread.
✅ Follow shipping and geopolitical developments closely.
🚨 Final Outlook: Bab el-Mandeb Is Now an Oil Market Wild Card
If Houthi forces continue expanding their presence along Yemen's Red Sea coast and gain greater leverage around Bab el-Mandeb, this could evolve beyond a regional military conflict.
It could become a global energy-supply story.
The situation becomes even more significant because the Strait of Hormuz is already under pressure.
EIA data showing substantial oil flows through Bab el-Mandeb highlights why this chokepoint matters to the global energy system.
And the recent move of Brent above $105 and WTI above $100 shows that the market is already pricing a meaningful geopolitical risk premium.
Therefore, my focus remains clear:
🛢️ BZ — Global geopolitical oil benchmark
🛢️ $CL — U.S. crude benchmark
If disruptions around both Bab el-Mandeb and Hormuz remain prolonged, the current oil rally could have further room to develop.
But if diplomatic de-escalation begins, the same geopolitical premium could unwind rapidly.
The real oil trade right now isn't simply “oil will go up.”
The real question is:
How long can the geopolitical risk premium survive?
And the answer to that question could determine the next major move in CL and BZ.
DYOR. Manage risk. Never chase a geopolitical pump.
#CL #BZ #oil #war #cryptouniverseofficial
Iran-backed Houthi forces in Yemen are rapidly advancing along the Red Sea coast, and their reported control of the strategically important Mocha area brings them closer to the Bab el-Mandeb Strait.
This is no longer just a regional conflict story.
It has become a potential risk for global shipping, crude oil transportation, supply chains, and energy prices.
And the market is already reacting.
Brent crude has moved above $105 per barrel, while WTI has climbed above $100, as concerns over potential supply disruptions around both the Red Sea and Strait of Hormuz intensify.
That brings two important oil-market instruments directly into focus:
CL — WTI Crude Oil
BZ — Brent Crude Oil
The bigger question now is not simply:
“How high can oil go?”
The more important question is:
If Bab el-Mandeb remains a high-risk shipping zone, is the oil market entering a new era of geopolitical risk premium?
🌍 Why Is Bab el-Mandeb So Important?
On a map, Bab el-Mandeb may look like a relatively small chokepoint.
For global energy trade, however, its importance is enormous.
The narrow maritime passage connects the Red Sea with the Gulf of Aden and the Indian Ocean, making it a critical shipping corridor between the Middle East, Europe and global markets.
Its strategic importance has increased even further because disruptions around the Strait of Hormuz have already changed regional oil-flow dynamics.
According to U.S. Energy Information Administration data, crude oil and petroleum liquids flowing through Bab el-Mandeb averaged around 8.1 million barrels per day in the second quarter of 2026, compared with approximately 5.4 million barrels per day in the fourth quarter of 2025.
That highlights an important structural point:
The greater the pressure on Hormuz, the more strategically important Bab el-Mandeb becomes.
If both chokepoints face serious disruption risks at the same time, the global oil market could face a much larger supply-security problem.
🔥 Why Does the Mocha Development Matter?
Recent reports indicate that Houthi forces have moved into or established control around the strategic Red Sea port area of Mocha, strengthening their position closer to Bab el-Mandeb.
This matters because geography matters enormously in maritime conflicts.
A stronger Houthi presence near the chokepoint could increase the perceived risk for commercial vessels travelling through the region.
If shipping companies begin avoiding the route because of security concerns, several things can happen:
Longer routes → Higher freight costs → Higher insurance premiums → Greater supply uncertainty
And oil markets often price potential disruption before an actual physical shortage occurs.
That is why crude oil can rally sharply simply because the probability of disruption increases.
🛢️ $BZ — Why Brent Could Be the Key Beneficiary
Brent crude is one of the most important international oil benchmarks.
Because Brent is closely connected to global seaborne crude trade, geopolitical risks involving the Middle East, Red Sea and international shipping can have a particularly strong influence on its price.
That makes BZ especially important in the current environment.
Brent has already moved above the $100 psychological level, with prices recently trading above $105 per barrel amid intensifying geopolitical concerns.
The market mechanism is relatively straightforward:
Geopolitical Risk
↓
Shipping Risk
↓
Insurance & Freight Costs
↓
Supply Uncertainty
↓
Higher Oil Risk Premium
If tanker operators are forced to reroute vessels and journeys become longer and more expensive, the cost of moving crude can increase significantly.
If physical oil markets also tighten, Brent could attract an additional geopolitical premium.
🇺🇸 $CL — Can WTI Benefit From the Same Shock?
CL, representing WTI crude oil futures, is another major instrument to watch.
WTI is primarily associated with the U.S. crude market, so its price is influenced by domestic production, inventories, refinery demand and U.S. exports.
However, WTI does not operate in isolation from the global oil market.
A major geopolitical supply shock can push both Brent and WTI higher, although the magnitude of the move can differ.
This creates an important distinction:
BZ = More direct exposure to global seaborne and geopolitical oil risk
CL = Global oil shock + U.S. supply/demand dynamics
Both can benefit from a prolonged supply shock, but investors should not assume that they will always move identically.
📊 Is Oil Rising Only Because of War?
This is where sophisticated market analysis becomes important.
It is easy to say:
“War = Oil Up.”
But that is not enough.
We need to look at three separate layers:
1️⃣ Physical Supply
How many barrels are actually reaching the market?
2️⃣ Transportation Risk
Can tankers safely move through Hormuz, Bab el-Mandeb and the Red Sea?
3️⃣ Risk Premium
How much are traders willing to pay today to protect against future disruption?
Right now, all three factors matter.
EIA data shows that oil flows through Hormuz dropped dramatically in the second quarter of 2026, while flows through Bab el-Mandeb increased significantly.
That makes the Red Sea corridor even more strategically important.
🚀 The Most Bullish Scenario for CL & BZ
Consider a scenario where:
Houthi forces expand their control along the Red Sea coast
Attacks or threats against commercial shipping increase
Tankers begin rerouting
Saudi crude exports face additional logistical constraints
Hormuz disruptions remain prolonged
Diplomatic de-escalation fails to arrive quickly
In that environment, supply fears could intensify.
The market could begin pricing a significantly larger geopolitical premium.
Under a sustained escalation scenario, traders could start watching areas such as:
BZ → $110 → $115 → $120+
and
CL → $105 → $110 → $115+
These are scenario-based levels, not guaranteed targets.
They depend heavily on whether the geopolitical disruption actually persists.
🧨 But Don't Make This Mistake
Just because oil has moved above $100 does not mean that buying at any price is safe.
Geopolitical markets are extremely volatile.
A ceasefire announcement, diplomatic breakthrough, reopening of shipping routes, or signs of military de-escalation could quickly remove part of the geopolitical premium.
That means traders chasing a $100+ breakout could suddenly face a sharp correction.
In today's oil market, headline risk can be just as important as technical analysis.
📈 My Market Framework for BZ
I would divide the Brent outlook into three broad scenarios.
🟢 Bullish Continuation
If Brent remains firmly above $100 and geopolitical risks continue escalating, buyers could maintain control.
Sustained trading above $105 could bring the $110 psychological level into focus.
A further escalation could potentially push the market toward even higher levels.
🟡 Consolidation
If the geopolitical situation stabilizes without being fully resolved, Brent could enter a high-volatility consolidation phase around the $100–$110 region.
This environment can produce both breakouts and fakeouts.
🔴 Bearish Reversal
If geopolitical tensions ease significantly and a credible diplomatic solution emerges, the current risk premium could unwind.
In that scenario, the $100 level could become an important psychological support.
📈 My Market Framework for CL
WTI's $100 level is equally important from a psychological perspective.
If WTI can maintain sustained price action above $100, bullish sentiment could remain strong.
The market could then focus on areas around:
$105 → $110
However, a decisive rejection below $100 could indicate that part of the geopolitical premium is disappearing.
For WTI, traders should also monitor:
U.S. crude inventories + production + refinery demand + exports + geopolitical developments
because these factors can determine whether the rally is sustainable.
🧠 What Would Smart Money Watch?
I would not simply watch the headline:
“Oil is going up.”
Instead, I would monitor several important indicators.
1. Brent-WTI Spread
If Brent begins outperforming WTI significantly, it could signal stronger international seaborne supply risk.
2. Futures Curve
A deeper backwardation can indicate tighter physical market conditions.
3. Tanker Rates
A sharp increase in shipping costs would suggest that Red Sea disruptions are having a more meaningful economic impact.
4. War-Risk Insurance
Higher insurance premiums increase the cost of transporting crude through dangerous maritime corridors.
5. Inventory Data
U.S. crude inventories and broader stock movements can help determine whether an oil rally is supported by actual physical tightening.
🌍 Why Could an Oil Rally Also Affect Crypto?
This is one of the most important parts for crypto investors.
If oil remains above $100 for an extended period, inflationary pressure could increase again.
That could make interest-rate cuts more difficult for central banks.
And because Bitcoin and the broader crypto market are sensitive to liquidity conditions, tighter monetary expectations can create pressure on risk assets.
The potential transmission mechanism is:
Oil ↑ → Inflation Pressure ↑ → Rate-Cut Expectations ↓ → Liquidity Tightens → Risk Assets Face Pressure
However, the relationship is not always one-way.
If geopolitical escalation becomes severe enough to create major concerns about global economic growth, markets could eventually begin pricing future monetary easing.
So the impact of oil on crypto depends on both inflation and growth expectations.
💰 Are CL & BZ Investment Opportunities Now?
I would not describe them as “easy money” trades.
Instead, the current environment creates a high-risk, high-volatility tactical opportunity for traders who understand the oil market and can manage futures risk.
But blindly using leverage to chase the rally can be extremely dangerous.
Oil markets can move several dollars in a very short period when geopolitical headlines change.
Therefore:
❌ Don't go all-in.
❌ Don't use excessive leverage.
❌ Don't trade without a stop-loss.
❌ Don't enter purely because of a social-media headline.
❌ Don't chase $100+ oil out of FOMO.
Instead:
✅ Keep position sizes controlled.
✅ Watch key support and resistance levels.
✅ Take partial profits when appropriate.
✅ Use disciplined risk management.
✅ Monitor the Brent-WTI spread.
✅ Follow shipping and geopolitical developments closely.
🚨 Final Outlook: Bab el-Mandeb Is Now an Oil Market Wild Card
If Houthi forces continue expanding their presence along Yemen's Red Sea coast and gain greater leverage around Bab el-Mandeb, this could evolve beyond a regional military conflict.
It could become a global energy-supply story.
The situation becomes even more significant because the Strait of Hormuz is already under pressure.
EIA data showing substantial oil flows through Bab el-Mandeb highlights why this chokepoint matters to the global energy system.
And the recent move of Brent above $105 and WTI above $100 shows that the market is already pricing a meaningful geopolitical risk premium.
Therefore, my focus remains clear:
🛢️ BZ — Global geopolitical oil benchmark
🛢️ $CL — U.S. crude benchmark
If disruptions around both Bab el-Mandeb and Hormuz remain prolonged, the current oil rally could have further room to develop.
But if diplomatic de-escalation begins, the same geopolitical premium could unwind rapidly.
The real oil trade right now isn't simply “oil will go up.”
The real question is:
How long can the geopolitical risk premium survive?
And the answer to that question could determine the next major move in CL and BZ.
DYOR. Manage risk. Never chase a geopolitical pump.
#CL #BZ #oil #war #cryptouniverseofficial
1
503
·
--
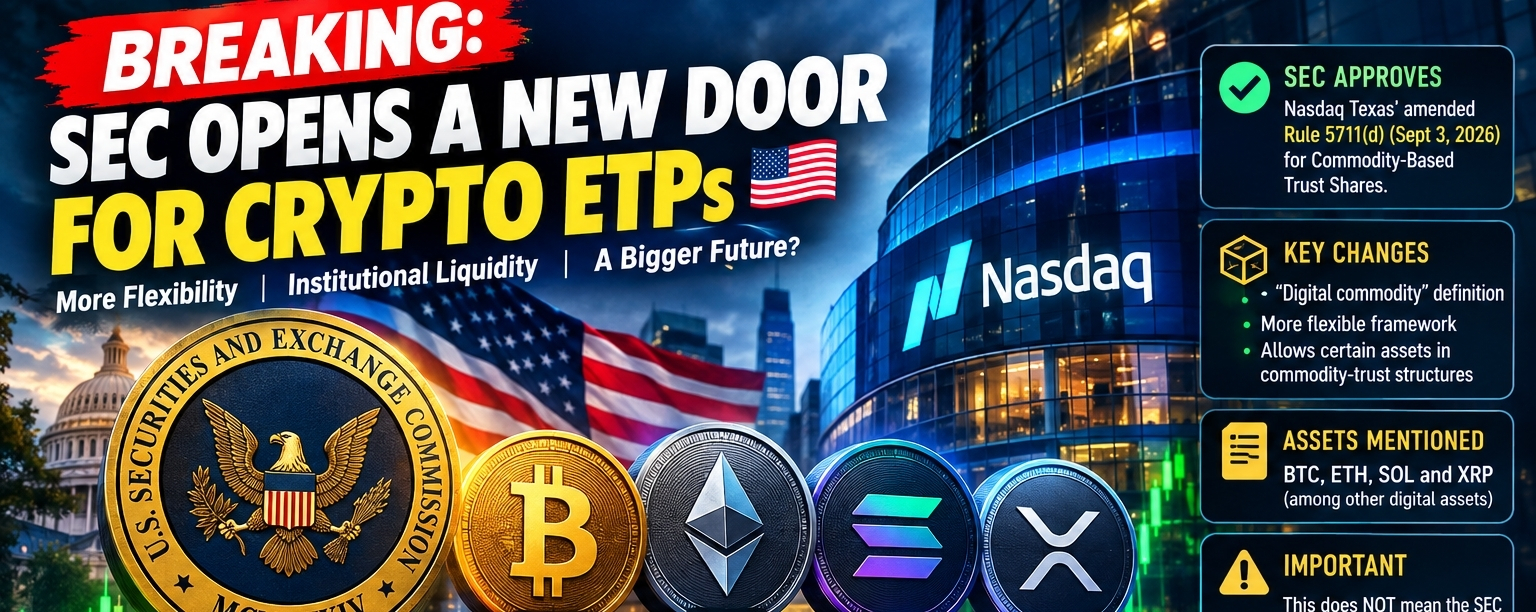
Article
🚨 SEC Opens a New Door for Crypto ETPs — Is the Next Institutional Wave Coming?The U.S. crypto market may have just received another important regulatory signal.
On September 3, 2026, the U.S. Securities and Exchange Commission approved Nasdaq Texas’s amended Rule 5711(d), introducing a more flexible framework for Commodity-Based Trust Shares. Among the changes, the framework adds a definition for “digital commodity” and creates additional flexibility around how eligible assets can be included within commodity-trust structures.
At first glance, this may look like another technical regulatory update.
But for crypto investors, the bigger story could be what this framework potentially means for the next generation of exchange-traded crypto products.
🔥 Why This Matters for Crypto
The biggest opportunity here is not that the SEC suddenly approved another Bitcoin or $XRP ETF.
It didn't.
Instead, the significance is that the regulatory framework around commodity-based crypto investment products is becoming more clearly defined.
The SEC's current digital-commodity explanation explicitly lists assets including Bitcoin, Ether, Solana and XRP, alongside several other crypto assets.
That distinction is extremely important.
It means investors should not interpret this development as:
“SEC just approved BTC, ETH, $SOL and XRP ETFs.”
That would be an overstatement.
The more accurate interpretation is:
The regulatory infrastructure for certain crypto ETP structures is becoming more flexible and potentially more scalable.
And that could matter enormously if asset managers continue bringing new crypto products to traditional markets.
🏦 From Crypto Exchanges to Wall Street Products
One of the biggest barriers to institutional crypto adoption has never simply been demand.
There is already enormous demand for digital assets.
The bigger challenge has been structure, regulation, custody, liquidity, market surveillance and product eligibility.
Traditional investors often don't want to manage private keys, interact with crypto exchanges or deal with blockchain infrastructure directly.
They prefer regulated investment vehicles.
That's where ETPs and trust structures become important.
If more digital assets can fit into clearly defined commodity-based structures, asset managers may have a wider regulatory framework through which they can potentially design new products.
That doesn't guarantee a flood of new ETFs.
But it can make the path more practical.
And that is exactly why this development deserves attention.
🟠 BTC: Institutional Liquidity Still Matters
Bitcoin remains the clearest beneficiary of the broader institutionalization trend.
The market has already demonstrated what can happen when traditional capital gains easier access to BTC through regulated exchange-traded products.
If the regulatory framework continues becoming more flexible, the long-term story could shift from:
“Will institutions enter crypto?”
to:
“How many different ways can institutions gain exposure to crypto?”
That is a much bigger market question.
For BTC traders, however, regulatory headlines alone should not be treated as an automatic buy signal.
The confirmation I would watch is:
Price breakout + volume expansion + spot demand + Open Interest structure.
If price breaks resistance while volume expands and leverage remains healthy, the move becomes much more interesting.
If price pumps only because of a headline while Open Interest explodes and funding becomes excessively positive, caution becomes necessary.
⚡ $ETH : The ETP Narrative Could Expand
Ethereum is another major asset to watch.
ETH already sits at the intersection of institutional investment, smart contracts, tokenization and on-chain financial infrastructure.
A broader regulatory framework for commodity-based trust structures could strengthen the long-term narrative around regulated ETH exposure.
But again, investors should separate regulatory progress from immediate price expectations.
A favorable SEC framework does not guarantee that ETH will rally tomorrow.
The market still needs liquidity.
It still needs buyers.
And technical confirmation still matters.
🟣 SOL & XRP: This Is Where the Story Gets Interesting
The potential impact becomes even more interesting when we look beyond BTC and ETH.
SOL and XRP are specifically among the digital assets referenced in the SEC's digital-commodity examples.
That does not mean a SOL or XRP ETF has automatically been approved.
But it does strengthen the argument that these assets are becoming increasingly relevant to the conversation around regulated digital-asset investment products.
For SOL, the market will likely continue watching:
Institutional demand
ETP/ETF developments
Network activity
Liquidity
Derivatives positioning
For XRP, the institutional narrative remains particularly interesting because its market thesis extends beyond speculation into payments, settlement and financial infrastructure.
The combination of regulatory clarity + institutional access + increasing product availability could become an important long-term catalyst.
📊 What Traders Should Watch Now
For short-term traders, I wouldn't blindly buy every crypto-related regulatory headline.
Instead, watch the market reaction.
1️⃣ Volume Expansion
A genuine breakout should ideally come with meaningful volume.
Price moving higher on thin liquidity can easily turn into a fake breakout.
2️⃣ Open Interest
If OI rises together with price, the market is attracting new leveraged positions.
That's not automatically bullish.
If OI becomes excessive while funding becomes heavily positive, liquidation risk increases.
3️⃣ Funding Rates
Healthy funding can support a trend.
Extreme funding can become a warning sign.
Sometimes the market doesn't need another bullish headline.
It needs leverage to cool down.
4️⃣ Breakout + Retest
For me, a clean breakout followed by a successful retest is much more attractive than chasing a vertical candle.
Breakout → Retest → Hold → Continuation
is generally a healthier structure than:
Headline → FOMO → Vertical Pump → Liquidations.
🚨 And What About $VTHO, $ORDER & $ZEST?
This is where investors need to be careful.
When a major regulatory headline hits the market, smaller-cap tokens can experience exaggerated moves simply because traders rotate into higher-beta assets.
That doesn't necessarily mean the underlying project has received a fundamental catalyst.
For $VTHO, $ORDER and $ZEST, I would therefore separate the broader market narrative from the individual token thesis.
A bullish BTC/ETH/SOL/XRP regulatory environment can improve overall crypto liquidity and risk appetite.
But that does not automatically make every altcoin a good investment.
Before entering smaller-cap assets, investors should examine:
Market capitalization
Circulating supply
Token unlock schedule
Liquidity
Exchange depth
Volume quality
Funding rates
Open Interest
Holder concentration
Recent price appreciation
A token that has already moved 50–100% on a headline can have a completely different risk profile from one that has not yet attracted speculative leverage.
🧠 The Bigger Picture
Perhaps the most important part of this SEC development is not today's price reaction.
It's the direction of travel.
Crypto is gradually moving from an asset class traded primarily through crypto-native platforms toward an ecosystem that can increasingly be accessed through traditional financial-market infrastructure.
That's a major structural change.
More regulatory clarity can encourage asset managers to explore new products.
More products can increase accessibility.
More accessibility can potentially bring additional liquidity.
And additional liquidity can improve institutional participation.
This doesn't mean every token will benefit equally.
Capital will likely continue concentrating around assets with:
Liquidity + strong infrastructure + institutional demand + regulatory clarity + real market utility.
🚀 Could This Become a Major Crypto Catalyst?
Potentially, yes—but I would call it a structural catalyst, not an instant pump catalyst.
The SEC's approval of Nasdaq Texas's amended Rule 5711(d) allows more flexibility in the commodity-based trust framework, including the addition of a digital-commodity definition and actively managed strategies.
That could make future product innovation easier.
And if asset managers begin using this flexibility to introduce additional crypto investment products, the market could eventually see another wave of institutional attention.
The real question is not:
“Will BTC pump because of this headline?”
The bigger question is:
“Does this create a more efficient bridge between traditional capital and digital assets?”
If the answer continues to be yes, the long-term implications could be much larger than a one-day price move.
📈 My Market Watchlist
For now, the assets I would keep closest on the radar are:
BTC → ETH → SOL → XRP
But I would not chase green candles simply because the SEC headline is bullish.
I would wait for:
**Volume expansion
Breakout
Successful retest
Healthy OI
Controlled funding
Strong spot demand**
That combination would give the market narrative much stronger confirmation.
⚠️ Final Take
This is not a blanket SEC declaration that BTC, ETH, SOL or XRP are universally commodities, nor is it an approval of a specific new ETF.
It is better understood as another step toward a more clearly defined and potentially more flexible regulatory framework for crypto-related exchange-traded products.
And that's why I think the market should pay attention.
The next major crypto liquidity wave may not come only from retail traders.
It could increasingly come from traditional capital entering through regulated financial products.
For investors, the opportunity may be significant—but so is the risk of chasing the first pump.
Don't trade the headline. Trade the confirmation.
DYOR. Manage risk. Protect your capital.
Not financial advice.
{spot}(BTCUSDT)
{spot}(XRPUSDT)
{spot}(SOLUSDT)
#SECApprovesNasdaqTexasCommodityTrustRule #ETH #XRPRealityCheck #sol #BTC
🚨 SEC Opens a New Door for Crypto ETPs — Is the Next Institutional Wave Coming?
The U.S. crypto market may have just received another important regulatory signal.
On September 3, 2026, the U.S. Securities and Exchange Commission approved Nasdaq Texas’s amended Rule 5711(d), introducing a more flexible framework for Commodity-Based Trust Shares. Among the changes, the framework adds a definition for “digital commodity” and creates additional flexibility around how eligible assets can be included within commodity-trust structures.
At first glance, this may look like another technical regulatory update.
But for crypto investors, the bigger story could be what this framework potentially means for the next generation of exchange-traded crypto products.
🔥 Why This Matters for Crypto
The biggest opportunity here is not that the SEC suddenly approved another Bitcoin or $XRP ETF.
It didn't.
Instead, the significance is that the regulatory framework around commodity-based crypto investment products is becoming more clearly defined.
The SEC's current digital-commodity explanation explicitly lists assets including Bitcoin, Ether, Solana and XRP, alongside several other crypto assets.
That distinction is extremely important.
It means investors should not interpret this development as:
“SEC just approved BTC, ETH, $SOL and XRP ETFs.”
That would be an overstatement.
The more accurate interpretation is:
The regulatory infrastructure for certain crypto ETP structures is becoming more flexible and potentially more scalable.
And that could matter enormously if asset managers continue bringing new crypto products to traditional markets.
🏦 From Crypto Exchanges to Wall Street Products
One of the biggest barriers to institutional crypto adoption has never simply been demand.
There is already enormous demand for digital assets.
The bigger challenge has been structure, regulation, custody, liquidity, market surveillance and product eligibility.
Traditional investors often don't want to manage private keys, interact with crypto exchanges or deal with blockchain infrastructure directly.
They prefer regulated investment vehicles.
That's where ETPs and trust structures become important.
If more digital assets can fit into clearly defined commodity-based structures, asset managers may have a wider regulatory framework through which they can potentially design new products.
That doesn't guarantee a flood of new ETFs.
But it can make the path more practical.
And that is exactly why this development deserves attention.
🟠 BTC: Institutional Liquidity Still Matters
Bitcoin remains the clearest beneficiary of the broader institutionalization trend.
The market has already demonstrated what can happen when traditional capital gains easier access to BTC through regulated exchange-traded products.
If the regulatory framework continues becoming more flexible, the long-term story could shift from:
“Will institutions enter crypto?”
to:
“How many different ways can institutions gain exposure to crypto?”
That is a much bigger market question.
For BTC traders, however, regulatory headlines alone should not be treated as an automatic buy signal.
The confirmation I would watch is:
Price breakout + volume expansion + spot demand + Open Interest structure.
If price breaks resistance while volume expands and leverage remains healthy, the move becomes much more interesting.
If price pumps only because of a headline while Open Interest explodes and funding becomes excessively positive, caution becomes necessary.
⚡ $ETH : The ETP Narrative Could Expand
Ethereum is another major asset to watch.
ETH already sits at the intersection of institutional investment, smart contracts, tokenization and on-chain financial infrastructure.
A broader regulatory framework for commodity-based trust structures could strengthen the long-term narrative around regulated ETH exposure.
But again, investors should separate regulatory progress from immediate price expectations.
A favorable SEC framework does not guarantee that ETH will rally tomorrow.
The market still needs liquidity.
It still needs buyers.
And technical confirmation still matters.
🟣 SOL & XRP: This Is Where the Story Gets Interesting
The potential impact becomes even more interesting when we look beyond BTC and ETH.
SOL and XRP are specifically among the digital assets referenced in the SEC's digital-commodity examples.
That does not mean a SOL or XRP ETF has automatically been approved.
But it does strengthen the argument that these assets are becoming increasingly relevant to the conversation around regulated digital-asset investment products.
For SOL, the market will likely continue watching:
Institutional demand
ETP/ETF developments
Network activity
Liquidity
Derivatives positioning
For XRP, the institutional narrative remains particularly interesting because its market thesis extends beyond speculation into payments, settlement and financial infrastructure.
The combination of regulatory clarity + institutional access + increasing product availability could become an important long-term catalyst.
📊 What Traders Should Watch Now
For short-term traders, I wouldn't blindly buy every crypto-related regulatory headline.
Instead, watch the market reaction.
1️⃣ Volume Expansion
A genuine breakout should ideally come with meaningful volume.
Price moving higher on thin liquidity can easily turn into a fake breakout.
2️⃣ Open Interest
If OI rises together with price, the market is attracting new leveraged positions.
That's not automatically bullish.
If OI becomes excessive while funding becomes heavily positive, liquidation risk increases.
3️⃣ Funding Rates
Healthy funding can support a trend.
Extreme funding can become a warning sign.
Sometimes the market doesn't need another bullish headline.
It needs leverage to cool down.
4️⃣ Breakout + Retest
For me, a clean breakout followed by a successful retest is much more attractive than chasing a vertical candle.
Breakout → Retest → Hold → Continuation
is generally a healthier structure than:
Headline → FOMO → Vertical Pump → Liquidations.
🚨 And What About $VTHO, $ORDER & $ZEST?
This is where investors need to be careful.
When a major regulatory headline hits the market, smaller-cap tokens can experience exaggerated moves simply because traders rotate into higher-beta assets.
That doesn't necessarily mean the underlying project has received a fundamental catalyst.
For $VTHO, $ORDER and $ZEST, I would therefore separate the broader market narrative from the individual token thesis.
A bullish BTC/ETH/SOL/XRP regulatory environment can improve overall crypto liquidity and risk appetite.
But that does not automatically make every altcoin a good investment.
Before entering smaller-cap assets, investors should examine:
Market capitalization
Circulating supply
Token unlock schedule
Liquidity
Exchange depth
Volume quality
Funding rates
Open Interest
Holder concentration
Recent price appreciation
A token that has already moved 50–100% on a headline can have a completely different risk profile from one that has not yet attracted speculative leverage.
🧠 The Bigger Picture
Perhaps the most important part of this SEC development is not today's price reaction.
It's the direction of travel.
Crypto is gradually moving from an asset class traded primarily through crypto-native platforms toward an ecosystem that can increasingly be accessed through traditional financial-market infrastructure.
That's a major structural change.
More regulatory clarity can encourage asset managers to explore new products.
More products can increase accessibility.
More accessibility can potentially bring additional liquidity.
And additional liquidity can improve institutional participation.
This doesn't mean every token will benefit equally.
Capital will likely continue concentrating around assets with:
Liquidity + strong infrastructure + institutional demand + regulatory clarity + real market utility.
🚀 Could This Become a Major Crypto Catalyst?
Potentially, yes—but I would call it a structural catalyst, not an instant pump catalyst.
The SEC's approval of Nasdaq Texas's amended Rule 5711(d) allows more flexibility in the commodity-based trust framework, including the addition of a digital-commodity definition and actively managed strategies.
That could make future product innovation easier.
And if asset managers begin using this flexibility to introduce additional crypto investment products, the market could eventually see another wave of institutional attention.
The real question is not:
“Will BTC pump because of this headline?”
The bigger question is:
“Does this create a more efficient bridge between traditional capital and digital assets?”
If the answer continues to be yes, the long-term implications could be much larger than a one-day price move.
📈 My Market Watchlist
For now, the assets I would keep closest on the radar are:
BTC → ETH → SOL → XRP
But I would not chase green candles simply because the SEC headline is bullish.
I would wait for:
**Volume expansion
Breakout
Successful retest
Healthy OI
Controlled funding
Strong spot demand**
That combination would give the market narrative much stronger confirmation.
⚠️ Final Take
This is not a blanket SEC declaration that BTC, ETH, SOL or XRP are universally commodities, nor is it an approval of a specific new ETF.
It is better understood as another step toward a more clearly defined and potentially more flexible regulatory framework for crypto-related exchange-traded products.
And that's why I think the market should pay attention.
The next major crypto liquidity wave may not come only from retail traders.
It could increasingly come from traditional capital entering through regulated financial products.
For investors, the opportunity may be significant—but so is the risk of chasing the first pump.
Don't trade the headline. Trade the confirmation.
DYOR. Manage risk. Protect your capital.
Not financial advice.
#SECApprovesNasdaqTexasCommodityTrustRule #ETH #XRPRealityCheck #sol #BTC
On September 3, 2026, the U.S. Securities and Exchange Commission approved Nasdaq Texas’s amended Rule 5711(d), introducing a more flexible framework for Commodity-Based Trust Shares. Among the changes, the framework adds a definition for “digital commodity” and creates additional flexibility around how eligible assets can be included within commodity-trust structures.
At first glance, this may look like another technical regulatory update.
But for crypto investors, the bigger story could be what this framework potentially means for the next generation of exchange-traded crypto products.
🔥 Why This Matters for Crypto
The biggest opportunity here is not that the SEC suddenly approved another Bitcoin or $XRP ETF.
It didn't.
Instead, the significance is that the regulatory framework around commodity-based crypto investment products is becoming more clearly defined.
The SEC's current digital-commodity explanation explicitly lists assets including Bitcoin, Ether, Solana and XRP, alongside several other crypto assets.
That distinction is extremely important.
It means investors should not interpret this development as:
“SEC just approved BTC, ETH, $SOL and XRP ETFs.”
That would be an overstatement.
The more accurate interpretation is:
The regulatory infrastructure for certain crypto ETP structures is becoming more flexible and potentially more scalable.
And that could matter enormously if asset managers continue bringing new crypto products to traditional markets.
🏦 From Crypto Exchanges to Wall Street Products
One of the biggest barriers to institutional crypto adoption has never simply been demand.
There is already enormous demand for digital assets.
The bigger challenge has been structure, regulation, custody, liquidity, market surveillance and product eligibility.
Traditional investors often don't want to manage private keys, interact with crypto exchanges or deal with blockchain infrastructure directly.
They prefer regulated investment vehicles.
That's where ETPs and trust structures become important.
If more digital assets can fit into clearly defined commodity-based structures, asset managers may have a wider regulatory framework through which they can potentially design new products.
That doesn't guarantee a flood of new ETFs.
But it can make the path more practical.
And that is exactly why this development deserves attention.
🟠 BTC: Institutional Liquidity Still Matters
Bitcoin remains the clearest beneficiary of the broader institutionalization trend.
The market has already demonstrated what can happen when traditional capital gains easier access to BTC through regulated exchange-traded products.
If the regulatory framework continues becoming more flexible, the long-term story could shift from:
“Will institutions enter crypto?”
to:
“How many different ways can institutions gain exposure to crypto?”
That is a much bigger market question.
For BTC traders, however, regulatory headlines alone should not be treated as an automatic buy signal.
The confirmation I would watch is:
Price breakout + volume expansion + spot demand + Open Interest structure.
If price breaks resistance while volume expands and leverage remains healthy, the move becomes much more interesting.
If price pumps only because of a headline while Open Interest explodes and funding becomes excessively positive, caution becomes necessary.
⚡ $ETH : The ETP Narrative Could Expand
Ethereum is another major asset to watch.
ETH already sits at the intersection of institutional investment, smart contracts, tokenization and on-chain financial infrastructure.
A broader regulatory framework for commodity-based trust structures could strengthen the long-term narrative around regulated ETH exposure.
But again, investors should separate regulatory progress from immediate price expectations.
A favorable SEC framework does not guarantee that ETH will rally tomorrow.
The market still needs liquidity.
It still needs buyers.
And technical confirmation still matters.
🟣 SOL & XRP: This Is Where the Story Gets Interesting
The potential impact becomes even more interesting when we look beyond BTC and ETH.
SOL and XRP are specifically among the digital assets referenced in the SEC's digital-commodity examples.
That does not mean a SOL or XRP ETF has automatically been approved.
But it does strengthen the argument that these assets are becoming increasingly relevant to the conversation around regulated digital-asset investment products.
For SOL, the market will likely continue watching:
Institutional demand
ETP/ETF developments
Network activity
Liquidity
Derivatives positioning
For XRP, the institutional narrative remains particularly interesting because its market thesis extends beyond speculation into payments, settlement and financial infrastructure.
The combination of regulatory clarity + institutional access + increasing product availability could become an important long-term catalyst.
📊 What Traders Should Watch Now
For short-term traders, I wouldn't blindly buy every crypto-related regulatory headline.
Instead, watch the market reaction.
1️⃣ Volume Expansion
A genuine breakout should ideally come with meaningful volume.
Price moving higher on thin liquidity can easily turn into a fake breakout.
2️⃣ Open Interest
If OI rises together with price, the market is attracting new leveraged positions.
That's not automatically bullish.
If OI becomes excessive while funding becomes heavily positive, liquidation risk increases.
3️⃣ Funding Rates
Healthy funding can support a trend.
Extreme funding can become a warning sign.
Sometimes the market doesn't need another bullish headline.
It needs leverage to cool down.
4️⃣ Breakout + Retest
For me, a clean breakout followed by a successful retest is much more attractive than chasing a vertical candle.
Breakout → Retest → Hold → Continuation
is generally a healthier structure than:
Headline → FOMO → Vertical Pump → Liquidations.
🚨 And What About $VTHO, $ORDER & $ZEST?
This is where investors need to be careful.
When a major regulatory headline hits the market, smaller-cap tokens can experience exaggerated moves simply because traders rotate into higher-beta assets.
That doesn't necessarily mean the underlying project has received a fundamental catalyst.
For $VTHO, $ORDER and $ZEST, I would therefore separate the broader market narrative from the individual token thesis.
A bullish BTC/ETH/SOL/XRP regulatory environment can improve overall crypto liquidity and risk appetite.
But that does not automatically make every altcoin a good investment.
Before entering smaller-cap assets, investors should examine:
Market capitalization
Circulating supply
Token unlock schedule
Liquidity
Exchange depth
Volume quality
Funding rates
Open Interest
Holder concentration
Recent price appreciation
A token that has already moved 50–100% on a headline can have a completely different risk profile from one that has not yet attracted speculative leverage.
🧠 The Bigger Picture
Perhaps the most important part of this SEC development is not today's price reaction.
It's the direction of travel.
Crypto is gradually moving from an asset class traded primarily through crypto-native platforms toward an ecosystem that can increasingly be accessed through traditional financial-market infrastructure.
That's a major structural change.
More regulatory clarity can encourage asset managers to explore new products.
More products can increase accessibility.
More accessibility can potentially bring additional liquidity.
And additional liquidity can improve institutional participation.
This doesn't mean every token will benefit equally.
Capital will likely continue concentrating around assets with:
Liquidity + strong infrastructure + institutional demand + regulatory clarity + real market utility.
🚀 Could This Become a Major Crypto Catalyst?
Potentially, yes—but I would call it a structural catalyst, not an instant pump catalyst.
The SEC's approval of Nasdaq Texas's amended Rule 5711(d) allows more flexibility in the commodity-based trust framework, including the addition of a digital-commodity definition and actively managed strategies.
That could make future product innovation easier.
And if asset managers begin using this flexibility to introduce additional crypto investment products, the market could eventually see another wave of institutional attention.
The real question is not:
“Will BTC pump because of this headline?”
The bigger question is:
“Does this create a more efficient bridge between traditional capital and digital assets?”
If the answer continues to be yes, the long-term implications could be much larger than a one-day price move.
📈 My Market Watchlist
For now, the assets I would keep closest on the radar are:
BTC → ETH → SOL → XRP
But I would not chase green candles simply because the SEC headline is bullish.
I would wait for:
**Volume expansion
Breakout
Successful retest
Healthy OI
Controlled funding
Strong spot demand**
That combination would give the market narrative much stronger confirmation.
⚠️ Final Take
This is not a blanket SEC declaration that BTC, ETH, SOL or XRP are universally commodities, nor is it an approval of a specific new ETF.
It is better understood as another step toward a more clearly defined and potentially more flexible regulatory framework for crypto-related exchange-traded products.
And that's why I think the market should pay attention.
The next major crypto liquidity wave may not come only from retail traders.
It could increasingly come from traditional capital entering through regulated financial products.
For investors, the opportunity may be significant—but so is the risk of chasing the first pump.
Don't trade the headline. Trade the confirmation.
DYOR. Manage risk. Protect your capital.
Not financial advice.
#SECApprovesNasdaqTexasCommodityTrustRule #ETH #XRPRealityCheck #sol #BTC
1
176
·
--
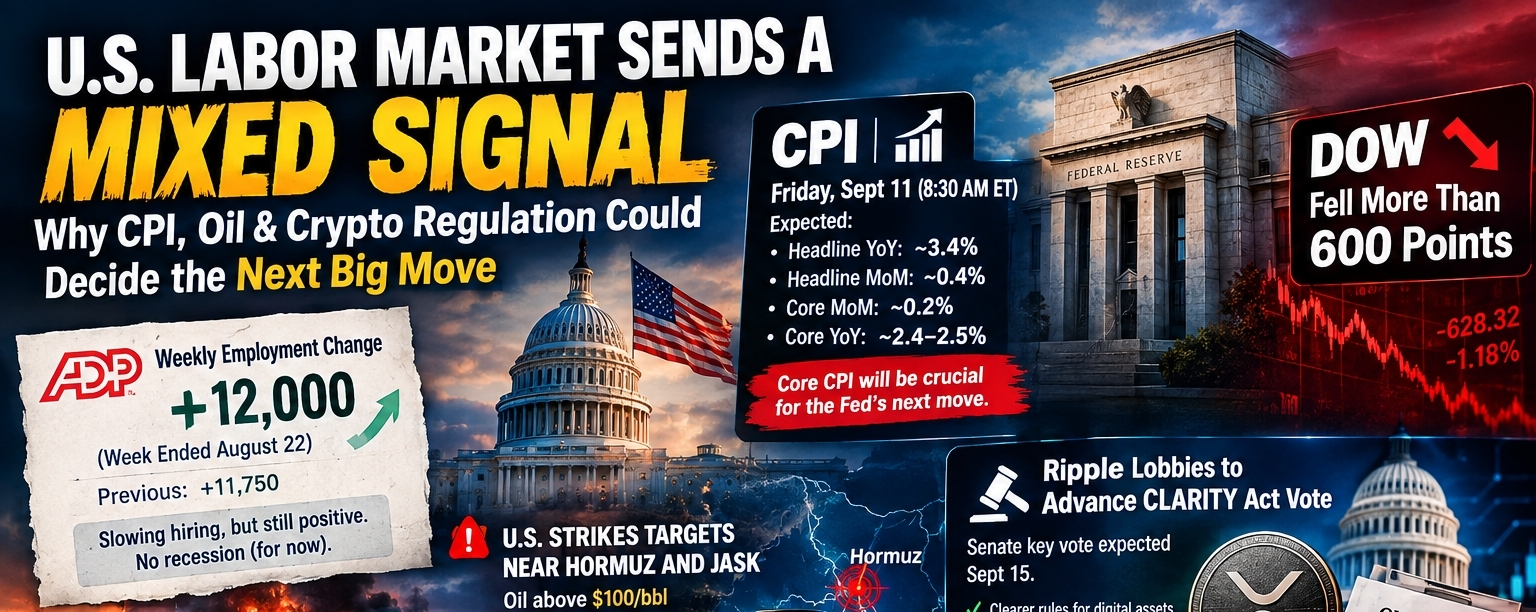
Article
U.S. Labor Market Sends a Mixed Signal — Why CPI, Oil & Crypto Regulation Could Decide the Next BigThe U.S. market is entering one of the most important macro windows of September.
At first glance, the latest employment data looks reassuring. But when we connect the dots between U.S. labor-market momentum, inflation, oil prices, Federal Reserve policy, geopolitical escalation around the Strait of Hormuz, and the upcoming CLARITY Act vote, the picture becomes much more complicated.
The latest ADP NER Pulse showed that U.S. private employers added an average of 12,000 jobs per week for the four weeks ending August 22, up from 11,750 previously. Hiring accelerated from the prior week's 10,000 reading, but the broader trend remains considerably weaker than it was earlier in the summer.
That is not a collapse.
But it is also not a labor market that gives investors unlimited confidence.
And this is exactly why the next few days could be extremely important for stocks, bonds, the dollar, gold, Bitcoin and the broader crypto market.
🇺🇸 ADP: The Labor Market Is Slowing — But Not Breaking
The headline number is simple:
U.S. weekly ADP employment change: +12,000
Previous: +11,750
The important part is the trend.
ADP's own data shows weekly employment growth was much stronger in June, with the four-week average reaching 30,750 for the week ending June 6.
Since then, the number has gradually declined:
30,750 → 24,250 → 19,750 → 16,250 → 14,500 → 11,750 → 12,000
That tells us something important.
The U.S. labor market is still generating jobs, but the pace of hiring has cooled dramatically compared with earlier in the year.
For investors, this creates a very unusual environment:
The economy is slowing, but it is not yet showing the kind of deterioration normally associated with a recession.
That distinction matters enormously for the Federal Reserve.
A weak labor market can increase expectations for monetary easing.
But a labor market that is merely cooling can allow the Fed to remain patient—especially if inflation is still above target.
📊 The Bigger Problem: Jobs vs Inflation
This is where the September macro story becomes interesting.
The market is not simply asking:
“Are Americans getting jobs?”
It is asking:
“Is the labor market weak enough for the Fed to ease policy without reigniting inflation?”
That is a much harder question.
Recent U.S. jobless claims have remained historically low. The latest available weekly claims reading was around 206,000, while the four-week average was approximately 207,250. That suggests layoffs remain relatively contained.
So we currently have a combination of:
Slowing hiring + low layoffs + persistent inflation risk.
That is not an obvious recession signal.
Instead, it looks more like an economy moving toward a lower-growth, higher-uncertainty environment.
And markets usually hate uncertainty more than they hate bad data.
🔥 Now Add Oil — And Everything Changes
The biggest wildcard right now may not actually be employment.
It is energy prices.
The U.S.-Iran conflict has escalated sharply around the Strait of Hormuz. U.S. forces have destroyed Iranian oil tankers, while Iran has retaliated against U.S. positions and shipping interests. At the same time, Iran-backed Houthis have attacked energy infrastructure in Saudi Arabia.
The market reaction has been immediate.
Brent crude moved above $100 per barrel, while fears surrounding shipping disruptions through Hormuz have increased.
This creates a dangerous macro feedback loop.
Higher oil prices can mean:
Higher transportation costs
→ Higher production costs
→ Higher consumer prices
→ Higher inflation expectations
→ Less room for Fed easing
→ Higher bond yields
→ Pressure on risk assets
That is why geopolitical developments are suddenly just as important as economic data.
📉 Why Did the Dow Fall More Than 600 Points?
The recent market sell-off illustrates exactly how investors are thinking.
On September 8, the Dow Jones fell 628 points, or roughly 1.18%, while the S&P 500 declined 0.58% and Nasdaq fell 0.32%.
The decline came as oil prices surged and Treasury yields moved higher.
This is a classic inflation-risk reaction.
Investors are effectively saying:
“If energy prices remain elevated, inflation may remain sticky—and that could make monetary policy less supportive.”
That is particularly important for high-valuation technology stocks and speculative assets.
And, of course, that includes crypto.
🟠 What Does This Mean for Bitcoin?
Bitcoin is increasingly trading like a macro asset.
When liquidity expectations improve, Bitcoin can benefit.
When real yields rise, the dollar strengthens and investors move toward defensive assets, Bitcoin can face pressure.
The current environment therefore creates two competing forces.
Bearish pressure:
Oil above $100
Geopolitical escalation
Higher inflation expectations
Elevated Treasury yields
Reduced expectations for aggressive monetary easing
Risk-off positioning
Bullish potential:
Slowing labor-market growth
Possibility of eventual monetary easing
Increasing institutional adoption
Regulatory clarity in the United States
Continued long-term demand for scarce digital assets
This is why I would not interpret one macro number in isolation.
Bitcoin's next major move could depend on the interaction between inflation and liquidity—not simply whether ADP beats or misses expectations.
🧠 Friday's CPI Could Be the Real Market Catalyst
The next major event is the U.S. CPI report scheduled for Friday, September 11 at 8:30 a.m. ET.
Current market expectations are around:
Headline CPI YoY: ~3.4%
Headline CPI MoM: ~0.4%
Core CPI MoM: ~0.2%
Core CPI YoY: ~2.4–2.5%
For me, Core CPI remains extremely important.
Why?
Because the Fed cannot simply ignore persistent underlying inflation.
If headline inflation rises because of energy prices while core inflation remains relatively contained, the Fed may look through some of the energy shock.
But if higher energy costs begin spreading into broader inflation categories, the situation becomes much more complicated.
That would potentially mean:
Higher inflation → higher yields → stronger dollar → weaker risk assets
On the other hand:
Soft CPI → lower yields → weaker dollar → stronger liquidity expectations → potential relief rally in risk assets
That is the setup investors should be watching.
⚠️ The Fed Is Now Stuck Between Two Risks
The September 15–16 Fed meeting is becoming increasingly data-dependent.
The central bank has to balance two competing risks:
Risk #1 — Cutting/Easing Too Early
If inflation remains sticky and the Fed becomes too accommodative, another inflation wave could develop.
Risk #2 — Staying Tight Too Long
If employment continues deteriorating, maintaining restrictive policy could unnecessarily weaken the economy.
The latest ADP reading does not solve this problem.
Instead, it makes the situation even more interesting.
12,000 weekly jobs means the labor market is still expanding—but at a much slower pace than earlier in the year.
That gives the Fed a reason to remain cautious rather than immediately pivot.
🚨 CLARITY Act: A Separate Bullish Catalyst for Crypto
While macro conditions are creating short-term uncertainty, there is another development that could become increasingly important for the crypto market:
U.S. crypto regulation.
The crypto industry and banking sector are currently lobbying heavily ahead of a pivotal Senate vote on the CLARITY Act.
Reuters reports that the Senate is expected to hold a key procedural vote on September 15, with the legislation designed to establish clearer rules around digital assets and regulatory responsibilities.
This is potentially a major long-term catalyst.
Why?
Because institutional capital does not like regulatory uncertainty.
If the U.S. creates clearer rules around:
Digital asset classification
SEC/CFTC jurisdiction
Exchange operations
Stablecoins
Institutional participation
Token issuance
then the cost of entering the crypto industry could decline significantly.
That could ultimately benefit the largest and most established crypto networks.
💎 Why $XRP Could Be Especially Interesting
This is where the regulatory story becomes relevant to XRP.
Regulatory clarity does not automatically mean XRP's price will rise.
But clearer U.S. rules could reduce one of the biggest structural risks facing large crypto assets: regulatory uncertainty.
The market has already demonstrated that legal and regulatory developments can dramatically change sentiment around XRP.
Therefore, if the CLARITY Act progresses meaningfully, investors may begin pricing in a more favorable regulatory environment for established digital assets.
But there is an important warning:
A bullish regulatory narrative does not guarantee an immediate price breakout.
Macro liquidity still matters.
If CPI surprises higher and yields explode, even strong crypto-specific news can struggle to generate sustained upside.
🪙 My Investment View: Don't Chase the First Green Candle
This is probably the most important part.
We are entering a market where headlines can move prices extremely quickly.
One headline can send Bitcoin higher.
The next headline can send it lower.
Oil can move 5%.
Treasury yields can jump.
Then CPI can completely change the narrative.
So I would rather focus on positioning than prediction.
For long-term investors, this environment can create opportunities—but only if risk is managed properly.
My preferred approach:
1. Avoid excessive leverage.
The current volatility environment can destroy overleveraged positions very quickly.
2. Focus on quality over hype.
BTC, ETH and established large-cap assets deserve more attention than random low-liquidity tokens during macro uncertainty.
3. Keep cash available.
A correction is not necessarily a disaster.
Sometimes the best opportunity appears after forced liquidations.
4. Watch CPI before chasing breakouts.
Let the market show direction after the data.
5. Monitor oil and Treasury yields together.
If oil rises while yields rise, risk assets may remain under pressure.
If oil stabilizes and yields fall, the environment could become much more constructive.
6. Treat regulatory catalysts as medium-to-long-term themes.
CLARITY Act progress could be important for crypto adoption, but it should not be used as an excuse to blindly buy every token.
📌 Three Scenarios I Am Watching
🟢 Bullish Scenario
CPI comes in softer than expected.
Core inflation remains controlled.
Oil prices stabilize.
Treasury yields decline.
Fed easing expectations improve.
At the same time, CLARITY Act progress strengthens crypto sentiment.
This could create a powerful risk-on environment for $BTC , $ETH and selected large-cap altcoins.
🟡 Neutral Scenario
CPI is close to expectations.
Oil remains elevated but does not accelerate significantly.
The Fed remains cautious.
Bitcoin trades within a wide range while investors wait for clearer signals.
In this environment, patience becomes a strategy.
🔴 Bearish Scenario
CPI surprises higher.
Oil remains above $100 or moves substantially higher.
Treasury yields continue climbing.
The Fed becomes more hawkish.
Geopolitical tensions intensify.
That combination could trigger another risk-off wave across stocks and crypto.
In that situation, protecting capital becomes more important than trying to catch every dip.
🔥 The Bigger Picture
The latest ADP number may look insignificant at first.
12,000 jobs is not a headline that normally changes the entire market.
But the context matters.
The U.S. labor market is clearly losing momentum compared with earlier in the year, while layoffs remain relatively low.
At the same time, geopolitical escalation is pushing oil back above $100, increasing inflation risks just as investors prepare for the September CPI report.
And in the background, the crypto industry is fighting for regulatory clarity through the CLARITY Act.
So we effectively have three major forces competing for control of the market:
**Labor slowdown
Inflation/energy shock
Crypto regulatory transformation**
That combination could produce some of the biggest opportunities—and some of the biggest traps—of the coming months.
🚀 Final Take
I don't think this is the time to panic.
But I also don't think this is the time to blindly chase pumps.
The market is entering a period where macro data will matter more than social-media narratives.
If CPI cools, oil stabilizes and yields retreat, risk assets could receive the liquidity relief they have been waiting for.
If inflation accelerates while oil remains above $100, the Fed may have less freedom to support the economy—and Bitcoin and speculative assets could face another period of volatility.
Meanwhile, progress on the CLARITY Act could become a powerful structural catalyst for the crypto industry if U.S. lawmakers move toward clearer digital-asset rules.
For me, the strategy remains simple:
Don't chase.
Don't overleverage.
Watch CPI.
Watch oil.
Watch Treasury yields.
Watch the Fed.
And most importantly, keep some capital ready for the opportunities that usually appear when everyone else is forced to sell.
The next big wealth transfer may not begin with a huge green candle.
It may begin with a period of fear, uncertainty and forced selling—followed by a much clearer opportunity for investors who were prepared.
{spot}(XRPUSDT)
{spot}(BTCUSDT)
{spot}(ETHUSDT)
#Xrp🔥🔥 #ETH🔥🔥🔥🔥🔥🔥 #BTC🔥🔥🔥🔥🔥 #USADPWeeklyEmploymentRises12000 #cryptouniverseofficial
U.S. Labor Market Sends a Mixed Signal — Why CPI, Oil & Crypto Regulation Could Decide the Next Big
The U.S. market is entering one of the most important macro windows of September.
At first glance, the latest employment data looks reassuring. But when we connect the dots between U.S. labor-market momentum, inflation, oil prices, Federal Reserve policy, geopolitical escalation around the Strait of Hormuz, and the upcoming CLARITY Act vote, the picture becomes much more complicated.
The latest ADP NER Pulse showed that U.S. private employers added an average of 12,000 jobs per week for the four weeks ending August 22, up from 11,750 previously. Hiring accelerated from the prior week's 10,000 reading, but the broader trend remains considerably weaker than it was earlier in the summer.
That is not a collapse.
But it is also not a labor market that gives investors unlimited confidence.
And this is exactly why the next few days could be extremely important for stocks, bonds, the dollar, gold, Bitcoin and the broader crypto market.
🇺🇸 ADP: The Labor Market Is Slowing — But Not Breaking
The headline number is simple:
U.S. weekly ADP employment change: +12,000
Previous: +11,750
The important part is the trend.
ADP's own data shows weekly employment growth was much stronger in June, with the four-week average reaching 30,750 for the week ending June 6.
Since then, the number has gradually declined:
30,750 → 24,250 → 19,750 → 16,250 → 14,500 → 11,750 → 12,000
That tells us something important.
The U.S. labor market is still generating jobs, but the pace of hiring has cooled dramatically compared with earlier in the year.
For investors, this creates a very unusual environment:
The economy is slowing, but it is not yet showing the kind of deterioration normally associated with a recession.
That distinction matters enormously for the Federal Reserve.
A weak labor market can increase expectations for monetary easing.
But a labor market that is merely cooling can allow the Fed to remain patient—especially if inflation is still above target.
📊 The Bigger Problem: Jobs vs Inflation
This is where the September macro story becomes interesting.
The market is not simply asking:
“Are Americans getting jobs?”
It is asking:
“Is the labor market weak enough for the Fed to ease policy without reigniting inflation?”
That is a much harder question.
Recent U.S. jobless claims have remained historically low. The latest available weekly claims reading was around 206,000, while the four-week average was approximately 207,250. That suggests layoffs remain relatively contained.
So we currently have a combination of:
Slowing hiring + low layoffs + persistent inflation risk.
That is not an obvious recession signal.
Instead, it looks more like an economy moving toward a lower-growth, higher-uncertainty environment.
And markets usually hate uncertainty more than they hate bad data.
🔥 Now Add Oil — And Everything Changes
The biggest wildcard right now may not actually be employment.
It is energy prices.
The U.S.-Iran conflict has escalated sharply around the Strait of Hormuz. U.S. forces have destroyed Iranian oil tankers, while Iran has retaliated against U.S. positions and shipping interests. At the same time, Iran-backed Houthis have attacked energy infrastructure in Saudi Arabia.
The market reaction has been immediate.
Brent crude moved above $100 per barrel, while fears surrounding shipping disruptions through Hormuz have increased.
This creates a dangerous macro feedback loop.
Higher oil prices can mean:
Higher transportation costs
→ Higher production costs
→ Higher consumer prices
→ Higher inflation expectations
→ Less room for Fed easing
→ Higher bond yields
→ Pressure on risk assets
That is why geopolitical developments are suddenly just as important as economic data.
📉 Why Did the Dow Fall More Than 600 Points?
The recent market sell-off illustrates exactly how investors are thinking.
On September 8, the Dow Jones fell 628 points, or roughly 1.18%, while the S&P 500 declined 0.58% and Nasdaq fell 0.32%.
The decline came as oil prices surged and Treasury yields moved higher.
This is a classic inflation-risk reaction.
Investors are effectively saying:
“If energy prices remain elevated, inflation may remain sticky—and that could make monetary policy less supportive.”
That is particularly important for high-valuation technology stocks and speculative assets.
And, of course, that includes crypto.
🟠 What Does This Mean for Bitcoin?
Bitcoin is increasingly trading like a macro asset.
When liquidity expectations improve, Bitcoin can benefit.
When real yields rise, the dollar strengthens and investors move toward defensive assets, Bitcoin can face pressure.
The current environment therefore creates two competing forces.
Bearish pressure:
Oil above $100
Geopolitical escalation
Higher inflation expectations
Elevated Treasury yields
Reduced expectations for aggressive monetary easing
Risk-off positioning
Bullish potential:
Slowing labor-market growth
Possibility of eventual monetary easing
Increasing institutional adoption
Regulatory clarity in the United States
Continued long-term demand for scarce digital assets
This is why I would not interpret one macro number in isolation.
Bitcoin's next major move could depend on the interaction between inflation and liquidity—not simply whether ADP beats or misses expectations.
🧠 Friday's CPI Could Be the Real Market Catalyst
The next major event is the U.S. CPI report scheduled for Friday, September 11 at 8:30 a.m. ET.
Current market expectations are around:
Headline CPI YoY: ~3.4%
Headline CPI MoM: ~0.4%
Core CPI MoM: ~0.2%
Core CPI YoY: ~2.4–2.5%
For me, Core CPI remains extremely important.
Why?
Because the Fed cannot simply ignore persistent underlying inflation.
If headline inflation rises because of energy prices while core inflation remains relatively contained, the Fed may look through some of the energy shock.
But if higher energy costs begin spreading into broader inflation categories, the situation becomes much more complicated.
That would potentially mean:
Higher inflation → higher yields → stronger dollar → weaker risk assets
On the other hand:
Soft CPI → lower yields → weaker dollar → stronger liquidity expectations → potential relief rally in risk assets
That is the setup investors should be watching.
⚠️ The Fed Is Now Stuck Between Two Risks
The September 15–16 Fed meeting is becoming increasingly data-dependent.
The central bank has to balance two competing risks:
Risk #1 — Cutting/Easing Too Early
If inflation remains sticky and the Fed becomes too accommodative, another inflation wave could develop.
Risk #2 — Staying Tight Too Long
If employment continues deteriorating, maintaining restrictive policy could unnecessarily weaken the economy.
The latest ADP reading does not solve this problem.
Instead, it makes the situation even more interesting.
12,000 weekly jobs means the labor market is still expanding—but at a much slower pace than earlier in the year.
That gives the Fed a reason to remain cautious rather than immediately pivot.
🚨 CLARITY Act: A Separate Bullish Catalyst for Crypto
While macro conditions are creating short-term uncertainty, there is another development that could become increasingly important for the crypto market:
U.S. crypto regulation.
The crypto industry and banking sector are currently lobbying heavily ahead of a pivotal Senate vote on the CLARITY Act.
Reuters reports that the Senate is expected to hold a key procedural vote on September 15, with the legislation designed to establish clearer rules around digital assets and regulatory responsibilities.
This is potentially a major long-term catalyst.
Why?
Because institutional capital does not like regulatory uncertainty.
If the U.S. creates clearer rules around:
Digital asset classification
SEC/CFTC jurisdiction
Exchange operations
Stablecoins
Institutional participation
Token issuance
then the cost of entering the crypto industry could decline significantly.
That could ultimately benefit the largest and most established crypto networks.
💎 Why $XRP Could Be Especially Interesting
This is where the regulatory story becomes relevant to XRP.
Regulatory clarity does not automatically mean XRP's price will rise.
But clearer U.S. rules could reduce one of the biggest structural risks facing large crypto assets: regulatory uncertainty.
The market has already demonstrated that legal and regulatory developments can dramatically change sentiment around XRP.
Therefore, if the CLARITY Act progresses meaningfully, investors may begin pricing in a more favorable regulatory environment for established digital assets.
But there is an important warning:
A bullish regulatory narrative does not guarantee an immediate price breakout.
Macro liquidity still matters.
If CPI surprises higher and yields explode, even strong crypto-specific news can struggle to generate sustained upside.
🪙 My Investment View: Don't Chase the First Green Candle
This is probably the most important part.
We are entering a market where headlines can move prices extremely quickly.
One headline can send Bitcoin higher.
The next headline can send it lower.
Oil can move 5%.
Treasury yields can jump.
Then CPI can completely change the narrative.
So I would rather focus on positioning than prediction.
For long-term investors, this environment can create opportunities—but only if risk is managed properly.
My preferred approach:
1. Avoid excessive leverage.
The current volatility environment can destroy overleveraged positions very quickly.
2. Focus on quality over hype.
BTC, ETH and established large-cap assets deserve more attention than random low-liquidity tokens during macro uncertainty.
3. Keep cash available.
A correction is not necessarily a disaster.
Sometimes the best opportunity appears after forced liquidations.
4. Watch CPI before chasing breakouts.
Let the market show direction after the data.
5. Monitor oil and Treasury yields together.
If oil rises while yields rise, risk assets may remain under pressure.
If oil stabilizes and yields fall, the environment could become much more constructive.
6. Treat regulatory catalysts as medium-to-long-term themes.
CLARITY Act progress could be important for crypto adoption, but it should not be used as an excuse to blindly buy every token.
📌 Three Scenarios I Am Watching
🟢 Bullish Scenario
CPI comes in softer than expected.
Core inflation remains controlled.
Oil prices stabilize.
Treasury yields decline.
Fed easing expectations improve.
At the same time, CLARITY Act progress strengthens crypto sentiment.
This could create a powerful risk-on environment for $BTC , $ETH and selected large-cap altcoins.
🟡 Neutral Scenario
CPI is close to expectations.
Oil remains elevated but does not accelerate significantly.
The Fed remains cautious.
Bitcoin trades within a wide range while investors wait for clearer signals.
In this environment, patience becomes a strategy.
🔴 Bearish Scenario
CPI surprises higher.
Oil remains above $100 or moves substantially higher.
Treasury yields continue climbing.
The Fed becomes more hawkish.
Geopolitical tensions intensify.
That combination could trigger another risk-off wave across stocks and crypto.
In that situation, protecting capital becomes more important than trying to catch every dip.
🔥 The Bigger Picture
The latest ADP number may look insignificant at first.
12,000 jobs is not a headline that normally changes the entire market.
But the context matters.
The U.S. labor market is clearly losing momentum compared with earlier in the year, while layoffs remain relatively low.
At the same time, geopolitical escalation is pushing oil back above $100, increasing inflation risks just as investors prepare for the September CPI report.
And in the background, the crypto industry is fighting for regulatory clarity through the CLARITY Act.
So we effectively have three major forces competing for control of the market:
**Labor slowdown
Inflation/energy shock
Crypto regulatory transformation**
That combination could produce some of the biggest opportunities—and some of the biggest traps—of the coming months.
🚀 Final Take
I don't think this is the time to panic.
But I also don't think this is the time to blindly chase pumps.
The market is entering a period where macro data will matter more than social-media narratives.
If CPI cools, oil stabilizes and yields retreat, risk assets could receive the liquidity relief they have been waiting for.
If inflation accelerates while oil remains above $100, the Fed may have less freedom to support the economy—and Bitcoin and speculative assets could face another period of volatility.
Meanwhile, progress on the CLARITY Act could become a powerful structural catalyst for the crypto industry if U.S. lawmakers move toward clearer digital-asset rules.
For me, the strategy remains simple:
Don't chase.
Don't overleverage.
Watch CPI.
Watch oil.
Watch Treasury yields.
Watch the Fed.
And most importantly, keep some capital ready for the opportunities that usually appear when everyone else is forced to sell.
The next big wealth transfer may not begin with a huge green candle.
It may begin with a period of fear, uncertainty and forced selling—followed by a much clearer opportunity for investors who were prepared.
#Xrp🔥🔥 #ETH🔥🔥🔥🔥🔥🔥 #BTC🔥🔥🔥🔥🔥 #USADPWeeklyEmploymentRises12000 #cryptouniverseofficial
At first glance, the latest employment data looks reassuring. But when we connect the dots between U.S. labor-market momentum, inflation, oil prices, Federal Reserve policy, geopolitical escalation around the Strait of Hormuz, and the upcoming CLARITY Act vote, the picture becomes much more complicated.
The latest ADP NER Pulse showed that U.S. private employers added an average of 12,000 jobs per week for the four weeks ending August 22, up from 11,750 previously. Hiring accelerated from the prior week's 10,000 reading, but the broader trend remains considerably weaker than it was earlier in the summer.
That is not a collapse.
But it is also not a labor market that gives investors unlimited confidence.
And this is exactly why the next few days could be extremely important for stocks, bonds, the dollar, gold, Bitcoin and the broader crypto market.
🇺🇸 ADP: The Labor Market Is Slowing — But Not Breaking
The headline number is simple:
U.S. weekly ADP employment change: +12,000
Previous: +11,750
The important part is the trend.
ADP's own data shows weekly employment growth was much stronger in June, with the four-week average reaching 30,750 for the week ending June 6.
Since then, the number has gradually declined:
30,750 → 24,250 → 19,750 → 16,250 → 14,500 → 11,750 → 12,000
That tells us something important.
The U.S. labor market is still generating jobs, but the pace of hiring has cooled dramatically compared with earlier in the year.
For investors, this creates a very unusual environment:
The economy is slowing, but it is not yet showing the kind of deterioration normally associated with a recession.
That distinction matters enormously for the Federal Reserve.
A weak labor market can increase expectations for monetary easing.
But a labor market that is merely cooling can allow the Fed to remain patient—especially if inflation is still above target.
📊 The Bigger Problem: Jobs vs Inflation
This is where the September macro story becomes interesting.
The market is not simply asking:
“Are Americans getting jobs?”
It is asking:
“Is the labor market weak enough for the Fed to ease policy without reigniting inflation?”
That is a much harder question.
Recent U.S. jobless claims have remained historically low. The latest available weekly claims reading was around 206,000, while the four-week average was approximately 207,250. That suggests layoffs remain relatively contained.
So we currently have a combination of:
Slowing hiring + low layoffs + persistent inflation risk.
That is not an obvious recession signal.
Instead, it looks more like an economy moving toward a lower-growth, higher-uncertainty environment.
And markets usually hate uncertainty more than they hate bad data.
🔥 Now Add Oil — And Everything Changes
The biggest wildcard right now may not actually be employment.
It is energy prices.
The U.S.-Iran conflict has escalated sharply around the Strait of Hormuz. U.S. forces have destroyed Iranian oil tankers, while Iran has retaliated against U.S. positions and shipping interests. At the same time, Iran-backed Houthis have attacked energy infrastructure in Saudi Arabia.
The market reaction has been immediate.
Brent crude moved above $100 per barrel, while fears surrounding shipping disruptions through Hormuz have increased.
This creates a dangerous macro feedback loop.
Higher oil prices can mean:
Higher transportation costs
→ Higher production costs
→ Higher consumer prices
→ Higher inflation expectations
→ Less room for Fed easing
→ Higher bond yields
→ Pressure on risk assets
That is why geopolitical developments are suddenly just as important as economic data.
📉 Why Did the Dow Fall More Than 600 Points?
The recent market sell-off illustrates exactly how investors are thinking.
On September 8, the Dow Jones fell 628 points, or roughly 1.18%, while the S&P 500 declined 0.58% and Nasdaq fell 0.32%.
The decline came as oil prices surged and Treasury yields moved higher.
This is a classic inflation-risk reaction.
Investors are effectively saying:
“If energy prices remain elevated, inflation may remain sticky—and that could make monetary policy less supportive.”
That is particularly important for high-valuation technology stocks and speculative assets.
And, of course, that includes crypto.
🟠 What Does This Mean for Bitcoin?
Bitcoin is increasingly trading like a macro asset.
When liquidity expectations improve, Bitcoin can benefit.
When real yields rise, the dollar strengthens and investors move toward defensive assets, Bitcoin can face pressure.
The current environment therefore creates two competing forces.
Bearish pressure:
Oil above $100
Geopolitical escalation
Higher inflation expectations
Elevated Treasury yields
Reduced expectations for aggressive monetary easing
Risk-off positioning
Bullish potential:
Slowing labor-market growth
Possibility of eventual monetary easing
Increasing institutional adoption
Regulatory clarity in the United States
Continued long-term demand for scarce digital assets
This is why I would not interpret one macro number in isolation.
Bitcoin's next major move could depend on the interaction between inflation and liquidity—not simply whether ADP beats or misses expectations.
🧠 Friday's CPI Could Be the Real Market Catalyst
The next major event is the U.S. CPI report scheduled for Friday, September 11 at 8:30 a.m. ET.
Current market expectations are around:
Headline CPI YoY: ~3.4%
Headline CPI MoM: ~0.4%
Core CPI MoM: ~0.2%
Core CPI YoY: ~2.4–2.5%
For me, Core CPI remains extremely important.
Why?
Because the Fed cannot simply ignore persistent underlying inflation.
If headline inflation rises because of energy prices while core inflation remains relatively contained, the Fed may look through some of the energy shock.
But if higher energy costs begin spreading into broader inflation categories, the situation becomes much more complicated.
That would potentially mean:
Higher inflation → higher yields → stronger dollar → weaker risk assets
On the other hand:
Soft CPI → lower yields → weaker dollar → stronger liquidity expectations → potential relief rally in risk assets
That is the setup investors should be watching.
⚠️ The Fed Is Now Stuck Between Two Risks
The September 15–16 Fed meeting is becoming increasingly data-dependent.
The central bank has to balance two competing risks:
Risk #1 — Cutting/Easing Too Early
If inflation remains sticky and the Fed becomes too accommodative, another inflation wave could develop.
Risk #2 — Staying Tight Too Long
If employment continues deteriorating, maintaining restrictive policy could unnecessarily weaken the economy.
The latest ADP reading does not solve this problem.
Instead, it makes the situation even more interesting.
12,000 weekly jobs means the labor market is still expanding—but at a much slower pace than earlier in the year.
That gives the Fed a reason to remain cautious rather than immediately pivot.
🚨 CLARITY Act: A Separate Bullish Catalyst for Crypto
While macro conditions are creating short-term uncertainty, there is another development that could become increasingly important for the crypto market:
U.S. crypto regulation.
The crypto industry and banking sector are currently lobbying heavily ahead of a pivotal Senate vote on the CLARITY Act.
Reuters reports that the Senate is expected to hold a key procedural vote on September 15, with the legislation designed to establish clearer rules around digital assets and regulatory responsibilities.
This is potentially a major long-term catalyst.
Why?
Because institutional capital does not like regulatory uncertainty.
If the U.S. creates clearer rules around:
Digital asset classification
SEC/CFTC jurisdiction
Exchange operations
Stablecoins
Institutional participation
Token issuance
then the cost of entering the crypto industry could decline significantly.
That could ultimately benefit the largest and most established crypto networks.
💎 Why $XRP Could Be Especially Interesting
This is where the regulatory story becomes relevant to XRP.
Regulatory clarity does not automatically mean XRP's price will rise.
But clearer U.S. rules could reduce one of the biggest structural risks facing large crypto assets: regulatory uncertainty.
The market has already demonstrated that legal and regulatory developments can dramatically change sentiment around XRP.
Therefore, if the CLARITY Act progresses meaningfully, investors may begin pricing in a more favorable regulatory environment for established digital assets.
But there is an important warning:
A bullish regulatory narrative does not guarantee an immediate price breakout.
Macro liquidity still matters.
If CPI surprises higher and yields explode, even strong crypto-specific news can struggle to generate sustained upside.
🪙 My Investment View: Don't Chase the First Green Candle
This is probably the most important part.
We are entering a market where headlines can move prices extremely quickly.
One headline can send Bitcoin higher.
The next headline can send it lower.
Oil can move 5%.
Treasury yields can jump.
Then CPI can completely change the narrative.
So I would rather focus on positioning than prediction.
For long-term investors, this environment can create opportunities—but only if risk is managed properly.
My preferred approach:
1. Avoid excessive leverage.
The current volatility environment can destroy overleveraged positions very quickly.
2. Focus on quality over hype.
BTC, ETH and established large-cap assets deserve more attention than random low-liquidity tokens during macro uncertainty.
3. Keep cash available.
A correction is not necessarily a disaster.
Sometimes the best opportunity appears after forced liquidations.
4. Watch CPI before chasing breakouts.
Let the market show direction after the data.
5. Monitor oil and Treasury yields together.
If oil rises while yields rise, risk assets may remain under pressure.
If oil stabilizes and yields fall, the environment could become much more constructive.
6. Treat regulatory catalysts as medium-to-long-term themes.
CLARITY Act progress could be important for crypto adoption, but it should not be used as an excuse to blindly buy every token.
📌 Three Scenarios I Am Watching
🟢 Bullish Scenario
CPI comes in softer than expected.
Core inflation remains controlled.
Oil prices stabilize.
Treasury yields decline.
Fed easing expectations improve.
At the same time, CLARITY Act progress strengthens crypto sentiment.
This could create a powerful risk-on environment for $BTC , $ETH and selected large-cap altcoins.
🟡 Neutral Scenario
CPI is close to expectations.
Oil remains elevated but does not accelerate significantly.
The Fed remains cautious.
Bitcoin trades within a wide range while investors wait for clearer signals.
In this environment, patience becomes a strategy.
🔴 Bearish Scenario
CPI surprises higher.
Oil remains above $100 or moves substantially higher.
Treasury yields continue climbing.
The Fed becomes more hawkish.
Geopolitical tensions intensify.
That combination could trigger another risk-off wave across stocks and crypto.
In that situation, protecting capital becomes more important than trying to catch every dip.
🔥 The Bigger Picture
The latest ADP number may look insignificant at first.
12,000 jobs is not a headline that normally changes the entire market.
But the context matters.
The U.S. labor market is clearly losing momentum compared with earlier in the year, while layoffs remain relatively low.
At the same time, geopolitical escalation is pushing oil back above $100, increasing inflation risks just as investors prepare for the September CPI report.
And in the background, the crypto industry is fighting for regulatory clarity through the CLARITY Act.
So we effectively have three major forces competing for control of the market:
**Labor slowdown
Inflation/energy shock
Crypto regulatory transformation**
That combination could produce some of the biggest opportunities—and some of the biggest traps—of the coming months.
🚀 Final Take
I don't think this is the time to panic.
But I also don't think this is the time to blindly chase pumps.
The market is entering a period where macro data will matter more than social-media narratives.
If CPI cools, oil stabilizes and yields retreat, risk assets could receive the liquidity relief they have been waiting for.
If inflation accelerates while oil remains above $100, the Fed may have less freedom to support the economy—and Bitcoin and speculative assets could face another period of volatility.
Meanwhile, progress on the CLARITY Act could become a powerful structural catalyst for the crypto industry if U.S. lawmakers move toward clearer digital-asset rules.
For me, the strategy remains simple:
Don't chase.
Don't overleverage.
Watch CPI.
Watch oil.
Watch Treasury yields.
Watch the Fed.
And most importantly, keep some capital ready for the opportunities that usually appear when everyone else is forced to sell.
The next big wealth transfer may not begin with a huge green candle.
It may begin with a period of fear, uncertainty and forced selling—followed by a much clearer opportunity for investors who were prepared.
#Xrp🔥🔥 #ETH🔥🔥🔥🔥🔥🔥 #BTC🔥🔥🔥🔥🔥 #USADPWeeklyEmploymentRises12000 #cryptouniverseofficial
1
136
·
--
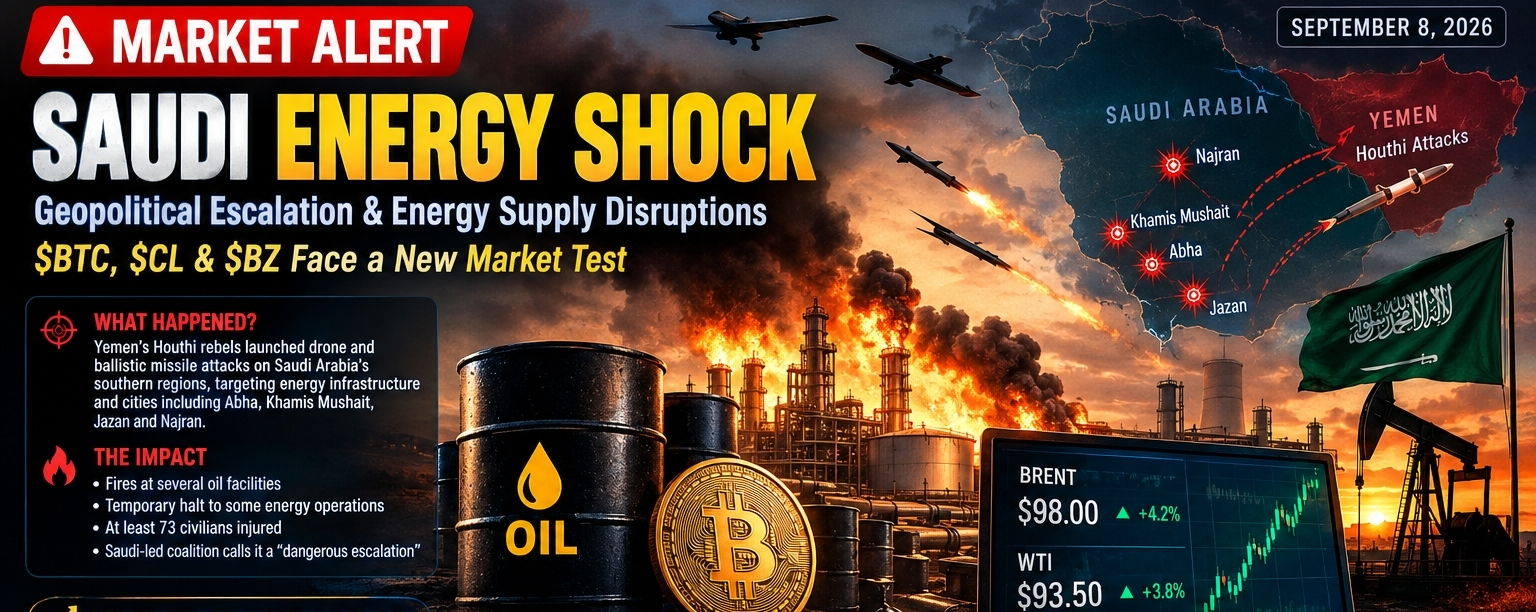
Article
🚨 Saudi Energy Shock: $BTC, $CL & $BZ Face a New Market TestA major geopolitical development is unfolding in the Middle East, and it could create significant volatility across oil, global equities, and crypto markets over the coming days.
On September 8, 2026, Yemen’s Houthi forces reportedly launched a major wave of drone and ballistic-missile attacks targeting southern Saudi Arabia, including Abha, Khamis Mushait, Jazan, and Najran.
Saudi authorities reported fires at several energy facilities and said some operations were temporarily halted. The Saudi-led coalition described the attacks as a dangerous escalation, while reports indicated that dozens of civilians were injured.
This is more than just another Middle East headline.
It could become an energy-supply shock—and that is where the real market story begins.
🛢️ Oil Is Becoming the Market’s Key Variable
Saudi Arabia remains one of the world’s most important oil-producing and exporting economies.
Whenever Saudi energy infrastructure comes under direct attack, traders immediately ask one question:
“How much supply could actually be disrupted, and for how long?”
That question is now becoming increasingly important.
Brent crude and WTI have moved sharply higher as markets price in additional geopolitical risk.
But there is an important distinction investors should understand:
Headline risk is not the same as sustained supply risk.
If Saudi facilities are restored quickly and no additional major attacks occur, the initial oil spike could eventually fade.
However, if:
more energy infrastructure is targeted,
Red Sea shipping disruptions intensify,
Saudi Arabia launches a broader retaliation,
or existing Middle East tensions create additional threats to global energy routes,
then the oil market could maintain a much larger geopolitical risk premium.
And if that happens, the impact will not remain limited to oil.
🔥 $CL — The Most Direct Geopolitical Trade
In the current environment, CL (WTI crude oil) is one of the most direct assets exposed to the developing geopolitical risk.
The fundamental relationship is straightforward:
Supply disruption risk → higher risk premium → higher crude volatility.
For CL, I see three broad scenarios.
🟢 Bullish Scenario
If Saudi energy operations remain disrupted for an extended period and the broader conflict escalates, crude could receive another wave of supply-risk premium.
🟡 Neutral Scenario
If damaged facilities are restored quickly and no additional attacks occur, the initial oil spike could gradually lose momentum.
🔴 Bearish Scenario
If the conflict remains contained and traders determine that the actual physical supply loss is much smaller than initially feared, oil could unwind part of its geopolitical premium.
That is why CL is no longer simply a commodity trade—it is a geopolitical-risk trade.
🛢️ $BZ — The Global Oil Risk Signal
BZ (Brent crude) deserves special attention because Brent pricing is closely connected to global maritime and Middle East supply risks.
If Brent decisively reclaims the $100 psychological level and maintains daily closes above it, markets could interpret that as evidence that the geopolitical risk premium is becoming more structural rather than temporary.
On the other hand, repeated rejection near $100 followed by a sharp move back into the $90s would suggest that traders still consider the physical supply disruption manageable.
So I would not use the simplistic logic of:
“Oil up = automatically bullish.”
Instead, investors should monitor:
Price + Volume + Supply Disruption + Duration
All four matter.
₿ Now Comes $BTC — The Real Investment Question
This is where things become much more complicated.
Whenever geopolitical tensions explode, some investors immediately assume Bitcoin will act as a safe-haven asset.
But the reality is not that simple.
Bitcoin can initially behave like a risk asset, particularly when geopolitical shocks create inflation fears, higher yields, and tighter financial conditions.
The potential chain reaction looks like this:
Geopolitical escalation → Oil ↑ → Inflation fears ↑ → Rate-cut expectations ↓ → Risk appetite ↓ → BTC volatility ↑
That means Bitcoin could experience an initial risk-off reaction even while oil rallies.
So I would not blindly assume that a Middle East escalation automatically means a Bitcoin pump.
📊 But Bitcoin Has a Second Story
There is another side to the equation.
If geopolitical tensions remain elevated and energy prices stay higher for an extended period, global inflation expectations could rise again.
That could complicate the monetary-policy outlook and create a completely different environment for alternative assets.
This creates two opposing forces for Bitcoin:
Short term: Risk-off pressure
Medium/long term: Monetary instability + liquidity expectations + alternative-asset demand
That is why my focus on BTC right now is reaction rather than prediction.
If Bitcoin absorbs the geopolitical shock, holds major support, and later begins outperforming traditional risk assets, that could become a significant bullish signal.
But if BTC loses key support while equities and other risk assets sell off together, reducing leverage and protecting capital becomes much more important.
⚠️ The Biggest Risk: Oil Shock → Inflation Shock
Investors should not forget one critical point:
Oil is not just another commodity.
Higher oil prices can affect transportation, manufacturing, logistics, production costs, and eventually consumer prices.
A prolonged oil spike can therefore increase inflation expectations.
And if inflation remains elevated, central banks may have less room for aggressive monetary easing.
For crypto, that matters because:
Cheap liquidity is fuel for risk assets.
Therefore, the current oil move is neither automatically bullish nor automatically bearish for Bitcoin.
The more important question is:
How long does the oil shock last?
🧠 My Investment View: Three Assets, Three Different Strategies
🛢️ CL — Tactical Opportunity
The current geopolitical environment provides a strong catalyst for crude oil.
However, chasing a large vertical move can be dangerous.
My preferred approach: wait for confirmation, manage position size, and maintain strict risk controls.
🛢️ BZ — Macro Confirmation Trade
Brent holding above $100 could become an important signal that markets are pricing in a more serious and persistent energy-supply risk.
But if $100 becomes nothing more than an intraday spike followed by a rapid rejection, the move could turn into a breakout trap.
BZ is increasingly acting like a geopolitical thermometer for the global market.
₿ BTC — Confirmation Before Aggression
For Bitcoin, I currently prefer a confirmation-based strategy rather than aggressive FOMO buying.
If volatility accelerates:
reduce leverage,
use disciplined stop-losses,
avoid chasing liquidation-driven moves,
and watch how BTC reacts around major support levels.
If Bitcoin experiences a panic sell-off but quickly recovers, that could demonstrate significant underlying strength.
But if BTC continues creating lower highs while oil remains elevated, a more defensive approach may be appropriate.
🚨 What I’m Watching Over the Next 24–72 Hours
I will be closely monitoring five major signals:
1️⃣ Whether Brent can sustain levels above $100
2️⃣ How quickly Saudi energy facilities return to normal operations
3️⃣ Whether additional Houthi attacks or Saudi retaliation occur
4️⃣ How US Treasury yields and Fed rate expectations respond
5️⃣ Whether Bitcoin can maintain its major technical support levels
The combination of these signals will likely tell us much more than any single headline.
💎 Bottom Line
The Saudi attacks should not be viewed simply as another Middle East military headline.
They have the potential to affect the entire financial chain:
Energy → Inflation → Monetary Policy → Equities → Crypto
The most direct beneficiaries of renewed supply-risk pricing are currently CL and BZ, because their fundamentals are directly connected to global energy markets.
For BTC, however, the picture is much more complicated.
If Bitcoin absorbs the initial risk-off shock and then demonstrates strength, that could become an important long-term bullish signal.
But assuming “war = Bitcoin pump” would be an extremely dangerous trading strategy.
Watch oil.
Watch BTC structure.
Watch liquidity.
And most importantly—trade confirmation, not headlines.
Because in geopolitical markets, the biggest opportunities can emerge quickly—but so can the biggest liquidations.
#SaudiHaltsSouthernEnergySitesAfterAttacks #BTC | #CL | #BZ #OilMarket
🚨 Saudi Energy Shock: $BTC, $CL & $BZ Face a New Market Test
A major geopolitical development is unfolding in the Middle East, and it could create significant volatility across oil, global equities, and crypto markets over the coming days.
On September 8, 2026, Yemen’s Houthi forces reportedly launched a major wave of drone and ballistic-missile attacks targeting southern Saudi Arabia, including Abha, Khamis Mushait, Jazan, and Najran.
Saudi authorities reported fires at several energy facilities and said some operations were temporarily halted. The Saudi-led coalition described the attacks as a dangerous escalation, while reports indicated that dozens of civilians were injured.
This is more than just another Middle East headline.
It could become an energy-supply shock—and that is where the real market story begins.
🛢️ Oil Is Becoming the Market’s Key Variable
Saudi Arabia remains one of the world’s most important oil-producing and exporting economies.
Whenever Saudi energy infrastructure comes under direct attack, traders immediately ask one question:
“How much supply could actually be disrupted, and for how long?”
That question is now becoming increasingly important.
Brent crude and WTI have moved sharply higher as markets price in additional geopolitical risk.
But there is an important distinction investors should understand:
Headline risk is not the same as sustained supply risk.
If Saudi facilities are restored quickly and no additional major attacks occur, the initial oil spike could eventually fade.
However, if:
more energy infrastructure is targeted,
Red Sea shipping disruptions intensify,
Saudi Arabia launches a broader retaliation,
or existing Middle East tensions create additional threats to global energy routes,
then the oil market could maintain a much larger geopolitical risk premium.
And if that happens, the impact will not remain limited to oil.
🔥 $CL — The Most Direct Geopolitical Trade
In the current environment, CL (WTI crude oil) is one of the most direct assets exposed to the developing geopolitical risk.
The fundamental relationship is straightforward:
Supply disruption risk → higher risk premium → higher crude volatility.
For CL, I see three broad scenarios.
🟢 Bullish Scenario
If Saudi energy operations remain disrupted for an extended period and the broader conflict escalates, crude could receive another wave of supply-risk premium.
🟡 Neutral Scenario
If damaged facilities are restored quickly and no additional attacks occur, the initial oil spike could gradually lose momentum.
🔴 Bearish Scenario
If the conflict remains contained and traders determine that the actual physical supply loss is much smaller than initially feared, oil could unwind part of its geopolitical premium.
That is why CL is no longer simply a commodity trade—it is a geopolitical-risk trade.
🛢️ $BZ — The Global Oil Risk Signal
BZ (Brent crude) deserves special attention because Brent pricing is closely connected to global maritime and Middle East supply risks.
If Brent decisively reclaims the $100 psychological level and maintains daily closes above it, markets could interpret that as evidence that the geopolitical risk premium is becoming more structural rather than temporary.
On the other hand, repeated rejection near $100 followed by a sharp move back into the $90s would suggest that traders still consider the physical supply disruption manageable.
So I would not use the simplistic logic of:
“Oil up = automatically bullish.”
Instead, investors should monitor:
Price + Volume + Supply Disruption + Duration
All four matter.
₿ Now Comes $BTC — The Real Investment Question
This is where things become much more complicated.
Whenever geopolitical tensions explode, some investors immediately assume Bitcoin will act as a safe-haven asset.
But the reality is not that simple.
Bitcoin can initially behave like a risk asset, particularly when geopolitical shocks create inflation fears, higher yields, and tighter financial conditions.
The potential chain reaction looks like this:
Geopolitical escalation → Oil ↑ → Inflation fears ↑ → Rate-cut expectations ↓ → Risk appetite ↓ → BTC volatility ↑
That means Bitcoin could experience an initial risk-off reaction even while oil rallies.
So I would not blindly assume that a Middle East escalation automatically means a Bitcoin pump.
📊 But Bitcoin Has a Second Story
There is another side to the equation.
If geopolitical tensions remain elevated and energy prices stay higher for an extended period, global inflation expectations could rise again.
That could complicate the monetary-policy outlook and create a completely different environment for alternative assets.
This creates two opposing forces for Bitcoin:
Short term: Risk-off pressure
Medium/long term: Monetary instability + liquidity expectations + alternative-asset demand
That is why my focus on BTC right now is reaction rather than prediction.
If Bitcoin absorbs the geopolitical shock, holds major support, and later begins outperforming traditional risk assets, that could become a significant bullish signal.
But if BTC loses key support while equities and other risk assets sell off together, reducing leverage and protecting capital becomes much more important.
⚠️ The Biggest Risk: Oil Shock → Inflation Shock
Investors should not forget one critical point:
Oil is not just another commodity.
Higher oil prices can affect transportation, manufacturing, logistics, production costs, and eventually consumer prices.
A prolonged oil spike can therefore increase inflation expectations.
And if inflation remains elevated, central banks may have less room for aggressive monetary easing.
For crypto, that matters because:
Cheap liquidity is fuel for risk assets.
Therefore, the current oil move is neither automatically bullish nor automatically bearish for Bitcoin.
The more important question is:
How long does the oil shock last?
🧠 My Investment View: Three Assets, Three Different Strategies
🛢️ CL — Tactical Opportunity
The current geopolitical environment provides a strong catalyst for crude oil.
However, chasing a large vertical move can be dangerous.
My preferred approach: wait for confirmation, manage position size, and maintain strict risk controls.
🛢️ BZ — Macro Confirmation Trade
Brent holding above $100 could become an important signal that markets are pricing in a more serious and persistent energy-supply risk.
But if $100 becomes nothing more than an intraday spike followed by a rapid rejection, the move could turn into a breakout trap.
BZ is increasingly acting like a geopolitical thermometer for the global market.
₿ BTC — Confirmation Before Aggression
For Bitcoin, I currently prefer a confirmation-based strategy rather than aggressive FOMO buying.
If volatility accelerates:
reduce leverage,
use disciplined stop-losses,
avoid chasing liquidation-driven moves,
and watch how BTC reacts around major support levels.
If Bitcoin experiences a panic sell-off but quickly recovers, that could demonstrate significant underlying strength.
But if BTC continues creating lower highs while oil remains elevated, a more defensive approach may be appropriate.
🚨 What I’m Watching Over the Next 24–72 Hours
I will be closely monitoring five major signals:
1️⃣ Whether Brent can sustain levels above $100
2️⃣ How quickly Saudi energy facilities return to normal operations
3️⃣ Whether additional Houthi attacks or Saudi retaliation occur
4️⃣ How US Treasury yields and Fed rate expectations respond
5️⃣ Whether Bitcoin can maintain its major technical support levels
The combination of these signals will likely tell us much more than any single headline.
💎 Bottom Line
The Saudi attacks should not be viewed simply as another Middle East military headline.
They have the potential to affect the entire financial chain:
Energy → Inflation → Monetary Policy → Equities → Crypto
The most direct beneficiaries of renewed supply-risk pricing are currently CL and BZ, because their fundamentals are directly connected to global energy markets.
For BTC, however, the picture is much more complicated.
If Bitcoin absorbs the initial risk-off shock and then demonstrates strength, that could become an important long-term bullish signal.
But assuming “war = Bitcoin pump” would be an extremely dangerous trading strategy.
Watch oil.
Watch BTC structure.
Watch liquidity.
And most importantly—trade confirmation, not headlines.
Because in geopolitical markets, the biggest opportunities can emerge quickly—but so can the biggest liquidations.
#SaudiHaltsSouthernEnergySitesAfterAttacks #BTC | #CL | #BZ #OilMarket
On September 8, 2026, Yemen’s Houthi forces reportedly launched a major wave of drone and ballistic-missile attacks targeting southern Saudi Arabia, including Abha, Khamis Mushait, Jazan, and Najran.
Saudi authorities reported fires at several energy facilities and said some operations were temporarily halted. The Saudi-led coalition described the attacks as a dangerous escalation, while reports indicated that dozens of civilians were injured.
This is more than just another Middle East headline.
It could become an energy-supply shock—and that is where the real market story begins.
🛢️ Oil Is Becoming the Market’s Key Variable
Saudi Arabia remains one of the world’s most important oil-producing and exporting economies.
Whenever Saudi energy infrastructure comes under direct attack, traders immediately ask one question:
“How much supply could actually be disrupted, and for how long?”
That question is now becoming increasingly important.
Brent crude and WTI have moved sharply higher as markets price in additional geopolitical risk.
But there is an important distinction investors should understand:
Headline risk is not the same as sustained supply risk.
If Saudi facilities are restored quickly and no additional major attacks occur, the initial oil spike could eventually fade.
However, if:
more energy infrastructure is targeted,
Red Sea shipping disruptions intensify,
Saudi Arabia launches a broader retaliation,
or existing Middle East tensions create additional threats to global energy routes,
then the oil market could maintain a much larger geopolitical risk premium.
And if that happens, the impact will not remain limited to oil.
🔥 $CL — The Most Direct Geopolitical Trade
In the current environment, CL (WTI crude oil) is one of the most direct assets exposed to the developing geopolitical risk.
The fundamental relationship is straightforward:
Supply disruption risk → higher risk premium → higher crude volatility.
For CL, I see three broad scenarios.
🟢 Bullish Scenario
If Saudi energy operations remain disrupted for an extended period and the broader conflict escalates, crude could receive another wave of supply-risk premium.
🟡 Neutral Scenario
If damaged facilities are restored quickly and no additional attacks occur, the initial oil spike could gradually lose momentum.
🔴 Bearish Scenario
If the conflict remains contained and traders determine that the actual physical supply loss is much smaller than initially feared, oil could unwind part of its geopolitical premium.
That is why CL is no longer simply a commodity trade—it is a geopolitical-risk trade.
🛢️ $BZ — The Global Oil Risk Signal
BZ (Brent crude) deserves special attention because Brent pricing is closely connected to global maritime and Middle East supply risks.
If Brent decisively reclaims the $100 psychological level and maintains daily closes above it, markets could interpret that as evidence that the geopolitical risk premium is becoming more structural rather than temporary.
On the other hand, repeated rejection near $100 followed by a sharp move back into the $90s would suggest that traders still consider the physical supply disruption manageable.
So I would not use the simplistic logic of:
“Oil up = automatically bullish.”
Instead, investors should monitor:
Price + Volume + Supply Disruption + Duration
All four matter.
₿ Now Comes $BTC — The Real Investment Question
This is where things become much more complicated.
Whenever geopolitical tensions explode, some investors immediately assume Bitcoin will act as a safe-haven asset.
But the reality is not that simple.
Bitcoin can initially behave like a risk asset, particularly when geopolitical shocks create inflation fears, higher yields, and tighter financial conditions.
The potential chain reaction looks like this:
Geopolitical escalation → Oil ↑ → Inflation fears ↑ → Rate-cut expectations ↓ → Risk appetite ↓ → BTC volatility ↑
That means Bitcoin could experience an initial risk-off reaction even while oil rallies.
So I would not blindly assume that a Middle East escalation automatically means a Bitcoin pump.
📊 But Bitcoin Has a Second Story
There is another side to the equation.
If geopolitical tensions remain elevated and energy prices stay higher for an extended period, global inflation expectations could rise again.
That could complicate the monetary-policy outlook and create a completely different environment for alternative assets.
This creates two opposing forces for Bitcoin:
Short term: Risk-off pressure
Medium/long term: Monetary instability + liquidity expectations + alternative-asset demand
That is why my focus on BTC right now is reaction rather than prediction.
If Bitcoin absorbs the geopolitical shock, holds major support, and later begins outperforming traditional risk assets, that could become a significant bullish signal.
But if BTC loses key support while equities and other risk assets sell off together, reducing leverage and protecting capital becomes much more important.
⚠️ The Biggest Risk: Oil Shock → Inflation Shock
Investors should not forget one critical point:
Oil is not just another commodity.
Higher oil prices can affect transportation, manufacturing, logistics, production costs, and eventually consumer prices.
A prolonged oil spike can therefore increase inflation expectations.
And if inflation remains elevated, central banks may have less room for aggressive monetary easing.
For crypto, that matters because:
Cheap liquidity is fuel for risk assets.
Therefore, the current oil move is neither automatically bullish nor automatically bearish for Bitcoin.
The more important question is:
How long does the oil shock last?
🧠 My Investment View: Three Assets, Three Different Strategies
🛢️ CL — Tactical Opportunity
The current geopolitical environment provides a strong catalyst for crude oil.
However, chasing a large vertical move can be dangerous.
My preferred approach: wait for confirmation, manage position size, and maintain strict risk controls.
🛢️ BZ — Macro Confirmation Trade
Brent holding above $100 could become an important signal that markets are pricing in a more serious and persistent energy-supply risk.
But if $100 becomes nothing more than an intraday spike followed by a rapid rejection, the move could turn into a breakout trap.
BZ is increasingly acting like a geopolitical thermometer for the global market.
₿ BTC — Confirmation Before Aggression
For Bitcoin, I currently prefer a confirmation-based strategy rather than aggressive FOMO buying.
If volatility accelerates:
reduce leverage,
use disciplined stop-losses,
avoid chasing liquidation-driven moves,
and watch how BTC reacts around major support levels.
If Bitcoin experiences a panic sell-off but quickly recovers, that could demonstrate significant underlying strength.
But if BTC continues creating lower highs while oil remains elevated, a more defensive approach may be appropriate.
🚨 What I’m Watching Over the Next 24–72 Hours
I will be closely monitoring five major signals:
1️⃣ Whether Brent can sustain levels above $100
2️⃣ How quickly Saudi energy facilities return to normal operations
3️⃣ Whether additional Houthi attacks or Saudi retaliation occur
4️⃣ How US Treasury yields and Fed rate expectations respond
5️⃣ Whether Bitcoin can maintain its major technical support levels
The combination of these signals will likely tell us much more than any single headline.
💎 Bottom Line
The Saudi attacks should not be viewed simply as another Middle East military headline.
They have the potential to affect the entire financial chain:
Energy → Inflation → Monetary Policy → Equities → Crypto
The most direct beneficiaries of renewed supply-risk pricing are currently CL and BZ, because their fundamentals are directly connected to global energy markets.
For BTC, however, the picture is much more complicated.
If Bitcoin absorbs the initial risk-off shock and then demonstrates strength, that could become an important long-term bullish signal.
But assuming “war = Bitcoin pump” would be an extremely dangerous trading strategy.
Watch oil.
Watch BTC structure.
Watch liquidity.
And most importantly—trade confirmation, not headlines.
Because in geopolitical markets, the biggest opportunities can emerge quickly—but so can the biggest liquidations.
#SaudiHaltsSouthernEnergySitesAfterAttacks #BTC | #CL | #BZ #OilMarket
1
415
·
--
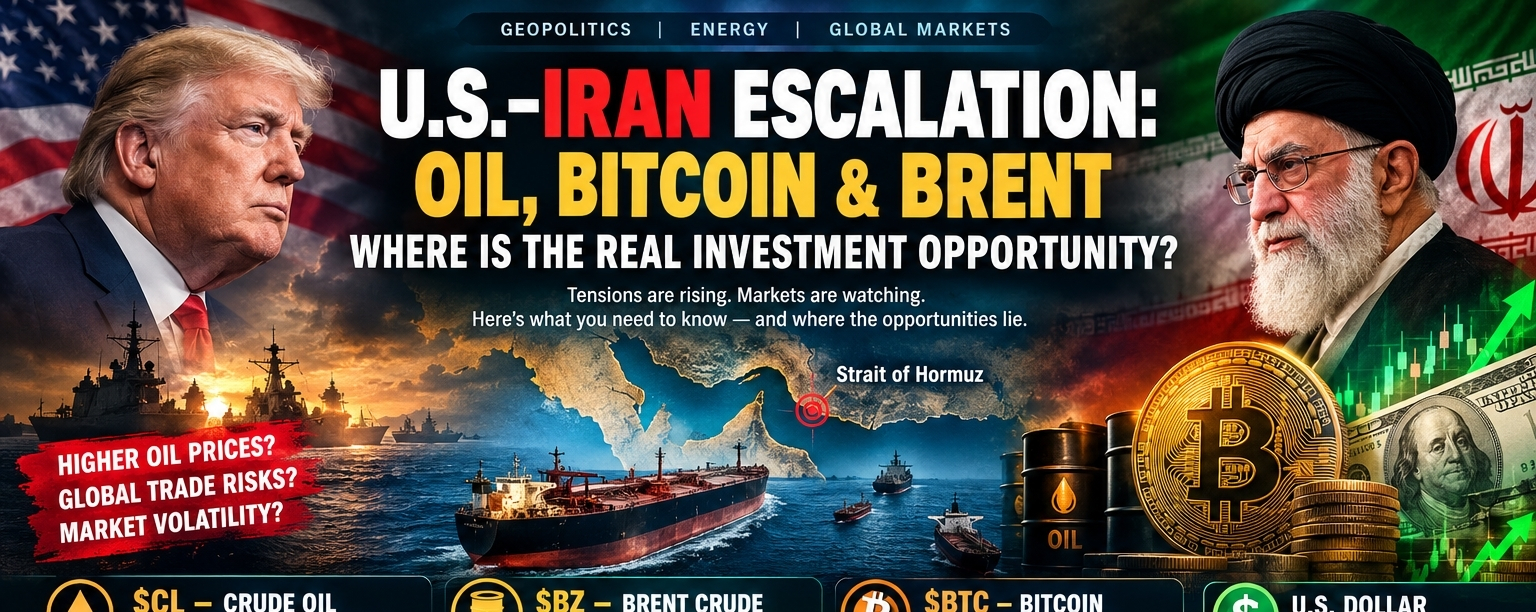
Article
🚨 U.S.–Iran Escalation: Oil, Bitcoin & Brent — Where Is the Real Investment Opportunity?Tensions between the United States and Iran are entering a more dangerous phase, and this is no longer just a military or political confrontation.
The growing risk around commercial shipping, oil tankers and the Strait of Hormuz is turning the conflict into a potential global economic shock.
And that is exactly why financial markets are watching every headline so closely.
The key question now is:
If the conflict escalates further, which assets could benefit — and which could come under the most pressure?
In my view, three markets deserve particular attention:
🛢️ CL — Crude Oil
₿ BTC — Bitcoin
🛢️ BZ — Brent Crude
🛢️ CL — Crude Oil: The Most Direct Geopolitical Trade
Oil is arguably the most immediate beneficiary of rising tensions.
The issue is not simply Iran's oil production.
The bigger concern is transportation infrastructure and shipping through the Strait of Hormuz.
Any significant disruption to tanker traffic can force markets to price in the possibility of tighter global supply.
The basic market equation is straightforward:
Conflict → Shipping Risk → Supply Fear → Higher Risk Premium → Higher Oil Prices
That is why crude can react aggressively even before an actual physical supply shortage appears.
However, there is an important warning here.
Oil has already experienced a sharp rally, meaning chasing a vertical move can create unfavorable risk-reward.
I would rather watch:
Whether WTI can sustain levels above $90
Whether Brent can establish itself above $100
Whether tanker traffic through Hormuz continues to decline
Whether additional attacks target energy infrastructure
How OPEC+ responds to a prolonged disruption
If geopolitical tensions suddenly ease, some of the risk premium could disappear just as quickly.
Investment view: 🟢 Bullish, but extremely volatile
Preferred approach: Look for pullbacks and confirmation rather than chasing the rally.
🛢️ BZ — Brent Crude: The Global Oil Risk Indicator
WTI gets a lot of attention, but in this particular situation I believe Brent crude deserves even more focus.
Brent is one of the world's key international oil benchmarks, making it particularly sensitive to developments affecting Middle Eastern supply and shipping.
The $100 level is now extremely important.
It is not just a psychological number.
It can become a market narrative trigger.
If Brent breaks above $100 and manages to sustain that level, investors may begin to interpret the situation as a prolonged supply-risk event rather than a temporary geopolitical shock.
That could put higher levels such as:
$105 → $110 → $120
back into the conversation.
But the bigger issue is what happens if oil remains above $100 for an extended period.
Higher oil prices can create another problem for the global economy:
Higher Oil → Higher Transportation Costs → Higher Production Costs → Higher Inflation
And if inflation accelerates again, central banks may have less room to pursue aggressive monetary easing.
That creates another chain reaction:
Oil Rally → Inflation Pressure → Higher-for-Longer Rates → Pressure on Risk Assets
This is where the relationship between BZ and BTC becomes particularly interesting.
₿ BTC — Bitcoin: Safe Haven or Risk Asset?
This is probably the most interesting part of the entire market story.
Bitcoin is often described as “digital gold,” especially during periods of geopolitical uncertainty.
But in the short term, Bitcoin is still highly connected to global liquidity and risk sentiment.
That means an escalation could produce two very different outcomes.
🔴 Scenario 1 — Risk-Off
If geopolitical fears accelerate rapidly:
Stocks ↓
Liquidity ↓
Dollar Demand ↑
BTC Volatility ↑
During the initial stages of a crisis, investors often prioritize liquidity and perceived safety.
Bitcoin could therefore experience sharp selling pressure.
🟢 Scenario 2 — Alternative Asset Narrative
If the conflict becomes prolonged and investors begin questioning traditional financial systems, currency stability or capital controls, Bitcoin's alternative-asset narrative could regain strength.
This distinction is extremely important.
Short term: Risk-off pressure
Medium/long term: Potential alternative monetary asset narrative
Looking at only one side of the equation could lead to the wrong conclusion.
Institutional demand also remains an important factor. Recent reports have highlighted continued Bitcoin accumulation by corporate treasury participants, showing that institutional interest has not simply disappeared because of geopolitical uncertainty.
So Bitcoin's long-term story may still remain intact even if the short-term market becomes extremely volatile.
📊 My BTC Market Map
From a technical perspective, I would focus on three broad zones.
🟢 Bullish Breakout
A sustained move above the $82K–$84K area could restore momentum and open the door toward higher resistance zones.
🟡 Neutral / Accumulation
The $78K–$82K region could become a consolidation zone while traders wait for a new macro catalyst.
🔴 Bearish Breakdown
A sustained break below $78K could increase the probability of a deeper correction, particularly if geopolitical pressure and macroeconomic tightening occur simultaneously.
For that reason, I would not blindly chase either a long or a short position here.
Confirmation-based trading makes more sense to me.
💵 What About the U.S. Dollar?
The U.S. dollar is another important piece of this puzzle.
When geopolitical uncertainty rises, investors often move toward highly liquid assets and traditional defensive instruments.
That can increase demand for the dollar.
But there is an interesting paradox.
If oil remains above $100 and inflation expectations rise again, monetary-policy expectations could also change.
The chain could look like this:
War Risk → Oil ↑ → Inflation ↑ → Rate-Cut Expectations ↓ → Dollar ↑
And a stronger dollar can create additional headwinds for Bitcoin and other risk assets.
This is why I would not analyze BTC by looking at war headlines alone.
The bigger picture is:
Oil + Dollar + Treasury Yields + Fed Expectations + Global Liquidity
These factors need to be monitored together.
🚨 The Biggest Risk Isn't One Strike — It's an Escalation Spiral
The most important issue right now is not necessarily one individual attack.
It is the possibility of a cycle:
Attack → Retaliation → Counter-Retaliation → Shipping Disruption → Energy Shock → Broader Regional Escalation
The longer this cycle continues, the longer geopolitical risk premiums can remain embedded in financial markets.
And that could affect far more than oil.
It could influence:
Global shipping
Insurance costs
Energy prices
Inflation expectations
Interest-rate expectations
The U.S. dollar
Equity markets
Bitcoin and the broader crypto market
This is why traders should focus not only on what happened today, but on whether the situation is becoming structurally worse.
🔥 My Investment Take
I am not looking at these three assets in exactly the same way.
🛢️ $CL — Crude Oil
Bullish bias
The most direct beneficiary of geopolitical supply risk.
However, after a rapid rally, chasing the price aggressively can be dangerous. Pullbacks and confirmation would offer a better risk-reward setup.
🛢️ $BZ — Brent Crude
Strong bullish bias, but watch $100 closely
A sustained breakout above $100 could signal that markets are pricing in a much larger and longer-lasting supply risk.
However, any meaningful diplomatic breakthrough could trigger a sharp reversal.
₿ $BTC — Bitcoin
Neutral-to-bullish medium term, highly volatile short term
An immediate escalation could trigger risk-off selling.
But if geopolitical uncertainty persists and the alternative-asset narrative strengthens, Bitcoin could eventually attract renewed attention.
🎯 My Strategy
Rather than trading every geopolitical headline, I would focus on the market's reaction to the headlines.
If we see:
Brent → $100+ breakout
WTI → $95+ sustained
Hormuz traffic → Further decline
Dollar → Strengthening
BTC → Break below $78K
then the short-term risk-off scenario becomes considerably stronger.
On the other hand:
Diplomatic progress + Recovery in tanker traffic + Oil rejection from $100 + BTC reclaiming $82K–$84K
could signal that markets are shifting back toward risk-on conditions.
🧠 Bottom Line
This is no longer simply a U.S. vs. Iran story.
It is becoming a much broader market equation:
Geopolitics → Oil → Inflation → Interest Rates → Dollar → Bitcoin
A change in any one part of this chain can quickly change the entire market narrative.
From my perspective, CL and BZ have the most direct upside exposure to prolonged geopolitical risk, while BTC offers a potentially more asymmetric long-term opportunity — but with significantly higher short-term volatility.
The biggest mistake right now would be to panic-sell into fear or blindly chase a geopolitical pump.
Patience, position sizing and confirmation matter more than ever.
So what do you think?
🛢️ Will Oil break above $100 and move toward $110–$120?
₿ Will BTC fall toward $75K if geopolitical fear intensifies, or reclaim $84K and resume its upside?
💵 Could the U.S. dollar become the biggest winner from this crisis?
The next headline may move the market for a few hours.
But the next market reaction could determine the bigger trend.
#bitcoin #Geopolitics #oil #MarketAnalysis #USIranTradeTankerStrikesEscalate
{future}(CLUSDT)
{future}(BZUSDT)
{spot}(BTCUSDT)
🚨 U.S.–Iran Escalation: Oil, Bitcoin & Brent — Where Is the Real Investment Opportunity?
Tensions between the United States and Iran are entering a more dangerous phase, and this is no longer just a military or political confrontation.
The growing risk around commercial shipping, oil tankers and the Strait of Hormuz is turning the conflict into a potential global economic shock.
And that is exactly why financial markets are watching every headline so closely.
The key question now is:
If the conflict escalates further, which assets could benefit — and which could come under the most pressure?
In my view, three markets deserve particular attention:
🛢️ CL — Crude Oil
₿ BTC — Bitcoin
🛢️ BZ — Brent Crude
🛢️ CL — Crude Oil: The Most Direct Geopolitical Trade
Oil is arguably the most immediate beneficiary of rising tensions.
The issue is not simply Iran's oil production.
The bigger concern is transportation infrastructure and shipping through the Strait of Hormuz.
Any significant disruption to tanker traffic can force markets to price in the possibility of tighter global supply.
The basic market equation is straightforward:
Conflict → Shipping Risk → Supply Fear → Higher Risk Premium → Higher Oil Prices
That is why crude can react aggressively even before an actual physical supply shortage appears.
However, there is an important warning here.
Oil has already experienced a sharp rally, meaning chasing a vertical move can create unfavorable risk-reward.
I would rather watch:
Whether WTI can sustain levels above $90
Whether Brent can establish itself above $100
Whether tanker traffic through Hormuz continues to decline
Whether additional attacks target energy infrastructure
How OPEC+ responds to a prolonged disruption
If geopolitical tensions suddenly ease, some of the risk premium could disappear just as quickly.
Investment view: 🟢 Bullish, but extremely volatile
Preferred approach: Look for pullbacks and confirmation rather than chasing the rally.
🛢️ BZ — Brent Crude: The Global Oil Risk Indicator
WTI gets a lot of attention, but in this particular situation I believe Brent crude deserves even more focus.
Brent is one of the world's key international oil benchmarks, making it particularly sensitive to developments affecting Middle Eastern supply and shipping.
The $100 level is now extremely important.
It is not just a psychological number.
It can become a market narrative trigger.
If Brent breaks above $100 and manages to sustain that level, investors may begin to interpret the situation as a prolonged supply-risk event rather than a temporary geopolitical shock.
That could put higher levels such as:
$105 → $110 → $120
back into the conversation.
But the bigger issue is what happens if oil remains above $100 for an extended period.
Higher oil prices can create another problem for the global economy:
Higher Oil → Higher Transportation Costs → Higher Production Costs → Higher Inflation
And if inflation accelerates again, central banks may have less room to pursue aggressive monetary easing.
That creates another chain reaction:
Oil Rally → Inflation Pressure → Higher-for-Longer Rates → Pressure on Risk Assets
This is where the relationship between BZ and BTC becomes particularly interesting.
₿ BTC — Bitcoin: Safe Haven or Risk Asset?
This is probably the most interesting part of the entire market story.
Bitcoin is often described as “digital gold,” especially during periods of geopolitical uncertainty.
But in the short term, Bitcoin is still highly connected to global liquidity and risk sentiment.
That means an escalation could produce two very different outcomes.
🔴 Scenario 1 — Risk-Off
If geopolitical fears accelerate rapidly:
Stocks ↓
Liquidity ↓
Dollar Demand ↑
BTC Volatility ↑
During the initial stages of a crisis, investors often prioritize liquidity and perceived safety.
Bitcoin could therefore experience sharp selling pressure.
🟢 Scenario 2 — Alternative Asset Narrative
If the conflict becomes prolonged and investors begin questioning traditional financial systems, currency stability or capital controls, Bitcoin's alternative-asset narrative could regain strength.
This distinction is extremely important.
Short term: Risk-off pressure
Medium/long term: Potential alternative monetary asset narrative
Looking at only one side of the equation could lead to the wrong conclusion.
Institutional demand also remains an important factor. Recent reports have highlighted continued Bitcoin accumulation by corporate treasury participants, showing that institutional interest has not simply disappeared because of geopolitical uncertainty.
So Bitcoin's long-term story may still remain intact even if the short-term market becomes extremely volatile.
📊 My BTC Market Map
From a technical perspective, I would focus on three broad zones.
🟢 Bullish Breakout
A sustained move above the $82K–$84K area could restore momentum and open the door toward higher resistance zones.
🟡 Neutral / Accumulation
The $78K–$82K region could become a consolidation zone while traders wait for a new macro catalyst.
🔴 Bearish Breakdown
A sustained break below $78K could increase the probability of a deeper correction, particularly if geopolitical pressure and macroeconomic tightening occur simultaneously.
For that reason, I would not blindly chase either a long or a short position here.
Confirmation-based trading makes more sense to me.
💵 What About the U.S. Dollar?
The U.S. dollar is another important piece of this puzzle.
When geopolitical uncertainty rises, investors often move toward highly liquid assets and traditional defensive instruments.
That can increase demand for the dollar.
But there is an interesting paradox.
If oil remains above $100 and inflation expectations rise again, monetary-policy expectations could also change.
The chain could look like this:
War Risk → Oil ↑ → Inflation ↑ → Rate-Cut Expectations ↓ → Dollar ↑
And a stronger dollar can create additional headwinds for Bitcoin and other risk assets.
This is why I would not analyze BTC by looking at war headlines alone.
The bigger picture is:
Oil + Dollar + Treasury Yields + Fed Expectations + Global Liquidity
These factors need to be monitored together.
🚨 The Biggest Risk Isn't One Strike — It's an Escalation Spiral
The most important issue right now is not necessarily one individual attack.
It is the possibility of a cycle:
Attack → Retaliation → Counter-Retaliation → Shipping Disruption → Energy Shock → Broader Regional Escalation
The longer this cycle continues, the longer geopolitical risk premiums can remain embedded in financial markets.
And that could affect far more than oil.
It could influence:
Global shipping
Insurance costs
Energy prices
Inflation expectations
Interest-rate expectations
The U.S. dollar
Equity markets
Bitcoin and the broader crypto market
This is why traders should focus not only on what happened today, but on whether the situation is becoming structurally worse.
🔥 My Investment Take
I am not looking at these three assets in exactly the same way.
🛢️ $CL — Crude Oil
Bullish bias
The most direct beneficiary of geopolitical supply risk.
However, after a rapid rally, chasing the price aggressively can be dangerous. Pullbacks and confirmation would offer a better risk-reward setup.
🛢️ $BZ — Brent Crude
Strong bullish bias, but watch $100 closely
A sustained breakout above $100 could signal that markets are pricing in a much larger and longer-lasting supply risk.
However, any meaningful diplomatic breakthrough could trigger a sharp reversal.
₿ $BTC — Bitcoin
Neutral-to-bullish medium term, highly volatile short term
An immediate escalation could trigger risk-off selling.
But if geopolitical uncertainty persists and the alternative-asset narrative strengthens, Bitcoin could eventually attract renewed attention.
🎯 My Strategy
Rather than trading every geopolitical headline, I would focus on the market's reaction to the headlines.
If we see:
Brent → $100+ breakout
WTI → $95+ sustained
Hormuz traffic → Further decline
Dollar → Strengthening
BTC → Break below $78K
then the short-term risk-off scenario becomes considerably stronger.
On the other hand:
Diplomatic progress + Recovery in tanker traffic + Oil rejection from $100 + BTC reclaiming $82K–$84K
could signal that markets are shifting back toward risk-on conditions.
🧠 Bottom Line
This is no longer simply a U.S. vs. Iran story.
It is becoming a much broader market equation:
Geopolitics → Oil → Inflation → Interest Rates → Dollar → Bitcoin
A change in any one part of this chain can quickly change the entire market narrative.
From my perspective, CL and BZ have the most direct upside exposure to prolonged geopolitical risk, while BTC offers a potentially more asymmetric long-term opportunity — but with significantly higher short-term volatility.
The biggest mistake right now would be to panic-sell into fear or blindly chase a geopolitical pump.
Patience, position sizing and confirmation matter more than ever.
So what do you think?
🛢️ Will Oil break above $100 and move toward $110–$120?
₿ Will BTC fall toward $75K if geopolitical fear intensifies, or reclaim $84K and resume its upside?
💵 Could the U.S. dollar become the biggest winner from this crisis?
The next headline may move the market for a few hours.
But the next market reaction could determine the bigger trend.
#bitcoin #Geopolitics #oil #MarketAnalysis #USIranTradeTankerStrikesEscalate
The growing risk around commercial shipping, oil tankers and the Strait of Hormuz is turning the conflict into a potential global economic shock.
And that is exactly why financial markets are watching every headline so closely.
The key question now is:
If the conflict escalates further, which assets could benefit — and which could come under the most pressure?
In my view, three markets deserve particular attention:
🛢️ CL — Crude Oil
₿ BTC — Bitcoin
🛢️ BZ — Brent Crude
🛢️ CL — Crude Oil: The Most Direct Geopolitical Trade
Oil is arguably the most immediate beneficiary of rising tensions.
The issue is not simply Iran's oil production.
The bigger concern is transportation infrastructure and shipping through the Strait of Hormuz.
Any significant disruption to tanker traffic can force markets to price in the possibility of tighter global supply.
The basic market equation is straightforward:
Conflict → Shipping Risk → Supply Fear → Higher Risk Premium → Higher Oil Prices
That is why crude can react aggressively even before an actual physical supply shortage appears.
However, there is an important warning here.
Oil has already experienced a sharp rally, meaning chasing a vertical move can create unfavorable risk-reward.
I would rather watch:
Whether WTI can sustain levels above $90
Whether Brent can establish itself above $100
Whether tanker traffic through Hormuz continues to decline
Whether additional attacks target energy infrastructure
How OPEC+ responds to a prolonged disruption
If geopolitical tensions suddenly ease, some of the risk premium could disappear just as quickly.
Investment view: 🟢 Bullish, but extremely volatile
Preferred approach: Look for pullbacks and confirmation rather than chasing the rally.
🛢️ BZ — Brent Crude: The Global Oil Risk Indicator
WTI gets a lot of attention, but in this particular situation I believe Brent crude deserves even more focus.
Brent is one of the world's key international oil benchmarks, making it particularly sensitive to developments affecting Middle Eastern supply and shipping.
The $100 level is now extremely important.
It is not just a psychological number.
It can become a market narrative trigger.
If Brent breaks above $100 and manages to sustain that level, investors may begin to interpret the situation as a prolonged supply-risk event rather than a temporary geopolitical shock.
That could put higher levels such as:
$105 → $110 → $120
back into the conversation.
But the bigger issue is what happens if oil remains above $100 for an extended period.
Higher oil prices can create another problem for the global economy:
Higher Oil → Higher Transportation Costs → Higher Production Costs → Higher Inflation
And if inflation accelerates again, central banks may have less room to pursue aggressive monetary easing.
That creates another chain reaction:
Oil Rally → Inflation Pressure → Higher-for-Longer Rates → Pressure on Risk Assets
This is where the relationship between BZ and BTC becomes particularly interesting.
₿ BTC — Bitcoin: Safe Haven or Risk Asset?
This is probably the most interesting part of the entire market story.
Bitcoin is often described as “digital gold,” especially during periods of geopolitical uncertainty.
But in the short term, Bitcoin is still highly connected to global liquidity and risk sentiment.
That means an escalation could produce two very different outcomes.
🔴 Scenario 1 — Risk-Off
If geopolitical fears accelerate rapidly:
Stocks ↓
Liquidity ↓
Dollar Demand ↑
BTC Volatility ↑
During the initial stages of a crisis, investors often prioritize liquidity and perceived safety.
Bitcoin could therefore experience sharp selling pressure.
🟢 Scenario 2 — Alternative Asset Narrative
If the conflict becomes prolonged and investors begin questioning traditional financial systems, currency stability or capital controls, Bitcoin's alternative-asset narrative could regain strength.
This distinction is extremely important.
Short term: Risk-off pressure
Medium/long term: Potential alternative monetary asset narrative
Looking at only one side of the equation could lead to the wrong conclusion.
Institutional demand also remains an important factor. Recent reports have highlighted continued Bitcoin accumulation by corporate treasury participants, showing that institutional interest has not simply disappeared because of geopolitical uncertainty.
So Bitcoin's long-term story may still remain intact even if the short-term market becomes extremely volatile.
📊 My BTC Market Map
From a technical perspective, I would focus on three broad zones.
🟢 Bullish Breakout
A sustained move above the $82K–$84K area could restore momentum and open the door toward higher resistance zones.
🟡 Neutral / Accumulation
The $78K–$82K region could become a consolidation zone while traders wait for a new macro catalyst.
🔴 Bearish Breakdown
A sustained break below $78K could increase the probability of a deeper correction, particularly if geopolitical pressure and macroeconomic tightening occur simultaneously.
For that reason, I would not blindly chase either a long or a short position here.
Confirmation-based trading makes more sense to me.
💵 What About the U.S. Dollar?
The U.S. dollar is another important piece of this puzzle.
When geopolitical uncertainty rises, investors often move toward highly liquid assets and traditional defensive instruments.
That can increase demand for the dollar.
But there is an interesting paradox.
If oil remains above $100 and inflation expectations rise again, monetary-policy expectations could also change.
The chain could look like this:
War Risk → Oil ↑ → Inflation ↑ → Rate-Cut Expectations ↓ → Dollar ↑
And a stronger dollar can create additional headwinds for Bitcoin and other risk assets.
This is why I would not analyze BTC by looking at war headlines alone.
The bigger picture is:
Oil + Dollar + Treasury Yields + Fed Expectations + Global Liquidity
These factors need to be monitored together.
🚨 The Biggest Risk Isn't One Strike — It's an Escalation Spiral
The most important issue right now is not necessarily one individual attack.
It is the possibility of a cycle:
Attack → Retaliation → Counter-Retaliation → Shipping Disruption → Energy Shock → Broader Regional Escalation
The longer this cycle continues, the longer geopolitical risk premiums can remain embedded in financial markets.
And that could affect far more than oil.
It could influence:
Global shipping
Insurance costs
Energy prices
Inflation expectations
Interest-rate expectations
The U.S. dollar
Equity markets
Bitcoin and the broader crypto market
This is why traders should focus not only on what happened today, but on whether the situation is becoming structurally worse.
🔥 My Investment Take
I am not looking at these three assets in exactly the same way.
🛢️ $CL — Crude Oil
Bullish bias
The most direct beneficiary of geopolitical supply risk.
However, after a rapid rally, chasing the price aggressively can be dangerous. Pullbacks and confirmation would offer a better risk-reward setup.
🛢️ $BZ — Brent Crude
Strong bullish bias, but watch $100 closely
A sustained breakout above $100 could signal that markets are pricing in a much larger and longer-lasting supply risk.
However, any meaningful diplomatic breakthrough could trigger a sharp reversal.
₿ $BTC — Bitcoin
Neutral-to-bullish medium term, highly volatile short term
An immediate escalation could trigger risk-off selling.
But if geopolitical uncertainty persists and the alternative-asset narrative strengthens, Bitcoin could eventually attract renewed attention.
🎯 My Strategy
Rather than trading every geopolitical headline, I would focus on the market's reaction to the headlines.
If we see:
Brent → $100+ breakout
WTI → $95+ sustained
Hormuz traffic → Further decline
Dollar → Strengthening
BTC → Break below $78K
then the short-term risk-off scenario becomes considerably stronger.
On the other hand:
Diplomatic progress + Recovery in tanker traffic + Oil rejection from $100 + BTC reclaiming $82K–$84K
could signal that markets are shifting back toward risk-on conditions.
🧠 Bottom Line
This is no longer simply a U.S. vs. Iran story.
It is becoming a much broader market equation:
Geopolitics → Oil → Inflation → Interest Rates → Dollar → Bitcoin
A change in any one part of this chain can quickly change the entire market narrative.
From my perspective, CL and BZ have the most direct upside exposure to prolonged geopolitical risk, while BTC offers a potentially more asymmetric long-term opportunity — but with significantly higher short-term volatility.
The biggest mistake right now would be to panic-sell into fear or blindly chase a geopolitical pump.
Patience, position sizing and confirmation matter more than ever.
So what do you think?
🛢️ Will Oil break above $100 and move toward $110–$120?
₿ Will BTC fall toward $75K if geopolitical fear intensifies, or reclaim $84K and resume its upside?
💵 Could the U.S. dollar become the biggest winner from this crisis?
The next headline may move the market for a few hours.
But the next market reaction could determine the bigger trend.
#bitcoin #Geopolitics #oil #MarketAnalysis #USIranTradeTankerStrikesEscalate
1
578
·
--
Article
🚨 BULLA: The Rally Is Getting Dangerous — Is the Next Move a Correction?$BULLA has suddenly become one of those tokens where price momentum can change the entire market narrative within hours.
After trading around the $0.016 area at the end of August, BULLA accelerated sharply during the first week of September. Historical data shows the token moved from roughly $0.0175 on September 1 to above $0.083 on September 5 — an extraordinary move in just a few sessions.
That kind of rally is exciting.
But it is also exactly where risk management becomes more important than chasing the next green candle.
The question is no longer simply:
“How high can BULLA go?”
The more important question is:
“Who is buying here, and who will become the exit liquidity if momentum reverses?”
📈 A Massive Rally Changes the Risk/Reward
BULLA's recent price action has been extremely aggressive.
CoinLore's historical data shows a move from approximately $0.0165 on August 31 to a high around $0.0891 on September 5. That's more than a 400% move from the late-August closing level to the recent intraday high.
At the same time, trading activity expanded significantly.
On September 5 alone, the reported volume was around $8.8 million, while the token reached a high near $0.0891.
This is the type of environment where traders often make the same mistake:
They see a token moving hundreds of percent and assume the only possible direction is higher.
But parabolic moves don't work that way.
The higher the price travels without meaningful consolidation, the more vulnerable the market becomes to:
Profit-taking
Long liquidations
Momentum exhaustion
Liquidity gaps
Sharp retracements
Failed breakouts
And with a relatively small market capitalization, BULLA can experience much larger percentage swings than established large-cap assets.
⚠️ The Short Thesis
I am not saying BULLA must crash.
That's not how I approach these setups.
Instead, I'm watching for a confirmation that the aggressive buying phase is losing control.
The strongest short opportunity would come after price rejects a major resistance area and then confirms a lower-timeframe bearish structure.
That's much safer than blindly shorting a token simply because it has already pumped.
The original setup highlighted a potential short around:
Entry Zone: $0.07850 – $0.08100
Stop Loss: $0.08650
Potential Targets:
🎯 TP1: $0.07000
🎯 TP2: $0.06250
🎯 TP3: $0.05200
However, because BULLA has already shown extremely violent price expansion, I would treat these levels as a conditional trading framework rather than a guaranteed signal.
A move above the recent ~$0.089 area would materially weaken this bearish setup and could trigger another momentum extension.
📊 What the Technical Structure Is Telling Us
One of the first things I would watch is the 1H MA7/EMA7 structure.
During a strong momentum rally, price normally stays above short-term moving averages and repeatedly uses them as dynamic support.
But when the trend begins to weaken, you often see:
Price → breaks short-term MA/EMA → retests → fails → lower high → continuation lower.
That sequence is far more meaningful than a single red candle.
The MACD is another confirmation tool.
If the shorter-term MACD structure rolls over and produces a bearish crossover while price simultaneously loses its short-term moving-average structure, the probability of a deeper retracement increases.
But again—
confirmation first, position second.
🐋 The Real Danger: Late Liquidity
This is the part many traders underestimate.
When a low-cap token suddenly moves several hundred percent, early holders are sitting on enormous unrealized gains.
New buyers, meanwhile, are often entering because they see the chart exploding.
That creates a dangerous dynamic:
Early money wants liquidity.
Late money provides liquidity.
It doesn't mean every rally is manipulated.
It means traders should understand the mechanics of a low-cap momentum market.
If the buying pressure slows down while holders start taking profits, the chart can move much faster to the downside than people expect.
That's why chasing an extended candle is usually a poor risk/reward decision.
🔥 But There Is a Bullish Scenario Too
A premium analysis should always consider the opposite side.
BULLA's recent move demonstrates that buyers currently have the ability to generate enormous momentum.
If price successfully consolidates above the breakout region instead of immediately collapsing, the bearish thesis could fail.
In that case, the market may be building a new higher-timeframe base rather than forming a top.
The key confirmation would be:
Higher high + higher low + sustained volume + successful retest.
If that structure develops, short sellers could become trapped.
And that's exactly why I would never use excessive leverage on a setup like this.
🎯 My Trading Approach
For me, the smartest strategy here isn't:
“Short because BULLA pumped.”
It's:
“Wait for exhaustion → wait for confirmation → enter with controlled risk.”
If BULLA rejects the upper resistance region and loses its short-term structure, the $0.070 area becomes the first important downside zone.
If that level fails decisively, the next areas around $0.0625 and $0.052 become increasingly relevant.
But if price breaks above the recent ~$0.089 high and establishes acceptance above it, I would step aside and reassess rather than stubbornly fight the trend.
That's the difference between having a trading plan and simply having a prediction.
💰 Investment Perspective
For long-term investors, BULLA should be approached very differently from BTC or other highly liquid large-cap assets.
A token capable of moving from around $0.016 to above $0.08 within days can potentially deliver huge returns—but the same volatility can destroy capital just as quickly.
So I would classify BULLA as a high-risk speculative asset, not a traditional “buy and forget” investment.
If someone wants exposure, position sizing matters more than predicting the exact top.
Don't risk your portfolio trying to catch another 100% candle.
And if you're trading futures, leverage should be kept extremely conservative because a low-cap token can move through liquidation levels before you have time to react.
🚨 Final Take
$BULLA has already delivered an explosive move.
Now the game changes.
The easy part was buying before the crowd arrived.
The difficult part is managing risk when everyone suddenly believes the chart can go straight up.
I'm watching the $0.0785–$0.0810 region as a potential rejection/short zone, but I want confirmation rather than blindly entering.
Bearish confirmation:
Loss of short-term MA/EMA structure + bearish MACD + lower high.
Potential downside:
$0.070 → $0.0625 → $0.052
Invalidation:
Strong acceptance above the recent ~$0.089 high.
The biggest lesson here is simple:
Don't confuse momentum with safety.
A token can be extremely bullish and still be a terrible place to chase.
Trade the structure.
Respect the volatility.
Protect your capital.
NFA — manage your own risk.
{future}(BULLAUSDT)
#BULLA #BULLATrade #cryptouniverseofficial #Binance #TrendingTopic
🚨 BULLA: The Rally Is Getting Dangerous — Is the Next Move a Correction?
$BULLA has suddenly become one of those tokens where price momentum can change the entire market narrative within hours.
After trading around the $0.016 area at the end of August, BULLA accelerated sharply during the first week of September. Historical data shows the token moved from roughly $0.0175 on September 1 to above $0.083 on September 5 — an extraordinary move in just a few sessions.
That kind of rally is exciting.
But it is also exactly where risk management becomes more important than chasing the next green candle.
The question is no longer simply:
“How high can BULLA go?”
The more important question is:
“Who is buying here, and who will become the exit liquidity if momentum reverses?”
📈 A Massive Rally Changes the Risk/Reward
BULLA's recent price action has been extremely aggressive.
CoinLore's historical data shows a move from approximately $0.0165 on August 31 to a high around $0.0891 on September 5. That's more than a 400% move from the late-August closing level to the recent intraday high.
At the same time, trading activity expanded significantly.
On September 5 alone, the reported volume was around $8.8 million, while the token reached a high near $0.0891.
This is the type of environment where traders often make the same mistake:
They see a token moving hundreds of percent and assume the only possible direction is higher.
But parabolic moves don't work that way.
The higher the price travels without meaningful consolidation, the more vulnerable the market becomes to:
Profit-taking
Long liquidations
Momentum exhaustion
Liquidity gaps
Sharp retracements
Failed breakouts
And with a relatively small market capitalization, BULLA can experience much larger percentage swings than established large-cap assets.
⚠️ The Short Thesis
I am not saying BULLA must crash.
That's not how I approach these setups.
Instead, I'm watching for a confirmation that the aggressive buying phase is losing control.
The strongest short opportunity would come after price rejects a major resistance area and then confirms a lower-timeframe bearish structure.
That's much safer than blindly shorting a token simply because it has already pumped.
The original setup highlighted a potential short around:
Entry Zone: $0.07850 – $0.08100
Stop Loss: $0.08650
Potential Targets:
🎯 TP1: $0.07000
🎯 TP2: $0.06250
🎯 TP3: $0.05200
However, because BULLA has already shown extremely violent price expansion, I would treat these levels as a conditional trading framework rather than a guaranteed signal.
A move above the recent ~$0.089 area would materially weaken this bearish setup and could trigger another momentum extension.
📊 What the Technical Structure Is Telling Us
One of the first things I would watch is the 1H MA7/EMA7 structure.
During a strong momentum rally, price normally stays above short-term moving averages and repeatedly uses them as dynamic support.
But when the trend begins to weaken, you often see:
Price → breaks short-term MA/EMA → retests → fails → lower high → continuation lower.
That sequence is far more meaningful than a single red candle.
The MACD is another confirmation tool.
If the shorter-term MACD structure rolls over and produces a bearish crossover while price simultaneously loses its short-term moving-average structure, the probability of a deeper retracement increases.
But again—
confirmation first, position second.
🐋 The Real Danger: Late Liquidity
This is the part many traders underestimate.
When a low-cap token suddenly moves several hundred percent, early holders are sitting on enormous unrealized gains.
New buyers, meanwhile, are often entering because they see the chart exploding.
That creates a dangerous dynamic:
Early money wants liquidity.
Late money provides liquidity.
It doesn't mean every rally is manipulated.
It means traders should understand the mechanics of a low-cap momentum market.
If the buying pressure slows down while holders start taking profits, the chart can move much faster to the downside than people expect.
That's why chasing an extended candle is usually a poor risk/reward decision.
🔥 But There Is a Bullish Scenario Too
A premium analysis should always consider the opposite side.
BULLA's recent move demonstrates that buyers currently have the ability to generate enormous momentum.
If price successfully consolidates above the breakout region instead of immediately collapsing, the bearish thesis could fail.
In that case, the market may be building a new higher-timeframe base rather than forming a top.
The key confirmation would be:
Higher high + higher low + sustained volume + successful retest.
If that structure develops, short sellers could become trapped.
And that's exactly why I would never use excessive leverage on a setup like this.
🎯 My Trading Approach
For me, the smartest strategy here isn't:
“Short because BULLA pumped.”
It's:
“Wait for exhaustion → wait for confirmation → enter with controlled risk.”
If BULLA rejects the upper resistance region and loses its short-term structure, the $0.070 area becomes the first important downside zone.
If that level fails decisively, the next areas around $0.0625 and $0.052 become increasingly relevant.
But if price breaks above the recent ~$0.089 high and establishes acceptance above it, I would step aside and reassess rather than stubbornly fight the trend.
That's the difference between having a trading plan and simply having a prediction.
💰 Investment Perspective
For long-term investors, BULLA should be approached very differently from BTC or other highly liquid large-cap assets.
A token capable of moving from around $0.016 to above $0.08 within days can potentially deliver huge returns—but the same volatility can destroy capital just as quickly.
So I would classify BULLA as a high-risk speculative asset, not a traditional “buy and forget” investment.
If someone wants exposure, position sizing matters more than predicting the exact top.
Don't risk your portfolio trying to catch another 100% candle.
And if you're trading futures, leverage should be kept extremely conservative because a low-cap token can move through liquidation levels before you have time to react.
🚨 Final Take
$BULLA has already delivered an explosive move.
Now the game changes.
The easy part was buying before the crowd arrived.
The difficult part is managing risk when everyone suddenly believes the chart can go straight up.
I'm watching the $0.0785–$0.0810 region as a potential rejection/short zone, but I want confirmation rather than blindly entering.
Bearish confirmation:
Loss of short-term MA/EMA structure + bearish MACD + lower high.
Potential downside:
$0.070 → $0.0625 → $0.052
Invalidation:
Strong acceptance above the recent ~$0.089 high.
The biggest lesson here is simple:
Don't confuse momentum with safety.
A token can be extremely bullish and still be a terrible place to chase.
Trade the structure.
Respect the volatility.
Protect your capital.
NFA — manage your own risk.
#BULLA #BULLATrade #cryptouniverseofficial #Binance #TrendingTopic
After trading around the $0.016 area at the end of August, BULLA accelerated sharply during the first week of September. Historical data shows the token moved from roughly $0.0175 on September 1 to above $0.083 on September 5 — an extraordinary move in just a few sessions.
That kind of rally is exciting.
But it is also exactly where risk management becomes more important than chasing the next green candle.
The question is no longer simply:
“How high can BULLA go?”
The more important question is:
“Who is buying here, and who will become the exit liquidity if momentum reverses?”
📈 A Massive Rally Changes the Risk/Reward
BULLA's recent price action has been extremely aggressive.
CoinLore's historical data shows a move from approximately $0.0165 on August 31 to a high around $0.0891 on September 5. That's more than a 400% move from the late-August closing level to the recent intraday high.
At the same time, trading activity expanded significantly.
On September 5 alone, the reported volume was around $8.8 million, while the token reached a high near $0.0891.
This is the type of environment where traders often make the same mistake:
They see a token moving hundreds of percent and assume the only possible direction is higher.
But parabolic moves don't work that way.
The higher the price travels without meaningful consolidation, the more vulnerable the market becomes to:
Profit-taking
Long liquidations
Momentum exhaustion
Liquidity gaps
Sharp retracements
Failed breakouts
And with a relatively small market capitalization, BULLA can experience much larger percentage swings than established large-cap assets.
⚠️ The Short Thesis
I am not saying BULLA must crash.
That's not how I approach these setups.
Instead, I'm watching for a confirmation that the aggressive buying phase is losing control.
The strongest short opportunity would come after price rejects a major resistance area and then confirms a lower-timeframe bearish structure.
That's much safer than blindly shorting a token simply because it has already pumped.
The original setup highlighted a potential short around:
Entry Zone: $0.07850 – $0.08100
Stop Loss: $0.08650
Potential Targets:
🎯 TP1: $0.07000
🎯 TP2: $0.06250
🎯 TP3: $0.05200
However, because BULLA has already shown extremely violent price expansion, I would treat these levels as a conditional trading framework rather than a guaranteed signal.
A move above the recent ~$0.089 area would materially weaken this bearish setup and could trigger another momentum extension.
📊 What the Technical Structure Is Telling Us
One of the first things I would watch is the 1H MA7/EMA7 structure.
During a strong momentum rally, price normally stays above short-term moving averages and repeatedly uses them as dynamic support.
But when the trend begins to weaken, you often see:
Price → breaks short-term MA/EMA → retests → fails → lower high → continuation lower.
That sequence is far more meaningful than a single red candle.
The MACD is another confirmation tool.
If the shorter-term MACD structure rolls over and produces a bearish crossover while price simultaneously loses its short-term moving-average structure, the probability of a deeper retracement increases.
But again—
confirmation first, position second.
🐋 The Real Danger: Late Liquidity
This is the part many traders underestimate.
When a low-cap token suddenly moves several hundred percent, early holders are sitting on enormous unrealized gains.
New buyers, meanwhile, are often entering because they see the chart exploding.
That creates a dangerous dynamic:
Early money wants liquidity.
Late money provides liquidity.
It doesn't mean every rally is manipulated.
It means traders should understand the mechanics of a low-cap momentum market.
If the buying pressure slows down while holders start taking profits, the chart can move much faster to the downside than people expect.
That's why chasing an extended candle is usually a poor risk/reward decision.
🔥 But There Is a Bullish Scenario Too
A premium analysis should always consider the opposite side.
BULLA's recent move demonstrates that buyers currently have the ability to generate enormous momentum.
If price successfully consolidates above the breakout region instead of immediately collapsing, the bearish thesis could fail.
In that case, the market may be building a new higher-timeframe base rather than forming a top.
The key confirmation would be:
Higher high + higher low + sustained volume + successful retest.
If that structure develops, short sellers could become trapped.
And that's exactly why I would never use excessive leverage on a setup like this.
🎯 My Trading Approach
For me, the smartest strategy here isn't:
“Short because BULLA pumped.”
It's:
“Wait for exhaustion → wait for confirmation → enter with controlled risk.”
If BULLA rejects the upper resistance region and loses its short-term structure, the $0.070 area becomes the first important downside zone.
If that level fails decisively, the next areas around $0.0625 and $0.052 become increasingly relevant.
But if price breaks above the recent ~$0.089 high and establishes acceptance above it, I would step aside and reassess rather than stubbornly fight the trend.
That's the difference between having a trading plan and simply having a prediction.
💰 Investment Perspective
For long-term investors, BULLA should be approached very differently from BTC or other highly liquid large-cap assets.
A token capable of moving from around $0.016 to above $0.08 within days can potentially deliver huge returns—but the same volatility can destroy capital just as quickly.
So I would classify BULLA as a high-risk speculative asset, not a traditional “buy and forget” investment.
If someone wants exposure, position sizing matters more than predicting the exact top.
Don't risk your portfolio trying to catch another 100% candle.
And if you're trading futures, leverage should be kept extremely conservative because a low-cap token can move through liquidation levels before you have time to react.
🚨 Final Take
$BULLA has already delivered an explosive move.
Now the game changes.
The easy part was buying before the crowd arrived.
The difficult part is managing risk when everyone suddenly believes the chart can go straight up.
I'm watching the $0.0785–$0.0810 region as a potential rejection/short zone, but I want confirmation rather than blindly entering.
Bearish confirmation:
Loss of short-term MA/EMA structure + bearish MACD + lower high.
Potential downside:
$0.070 → $0.0625 → $0.052
Invalidation:
Strong acceptance above the recent ~$0.089 high.
The biggest lesson here is simple:
Don't confuse momentum with safety.
A token can be extremely bullish and still be a terrible place to chase.
Trade the structure.
Respect the volatility.
Protect your capital.
NFA — manage your own risk.
#BULLA #BULLATrade #cryptouniverseofficial #Binance #TrendingTopic
1
204
·
--
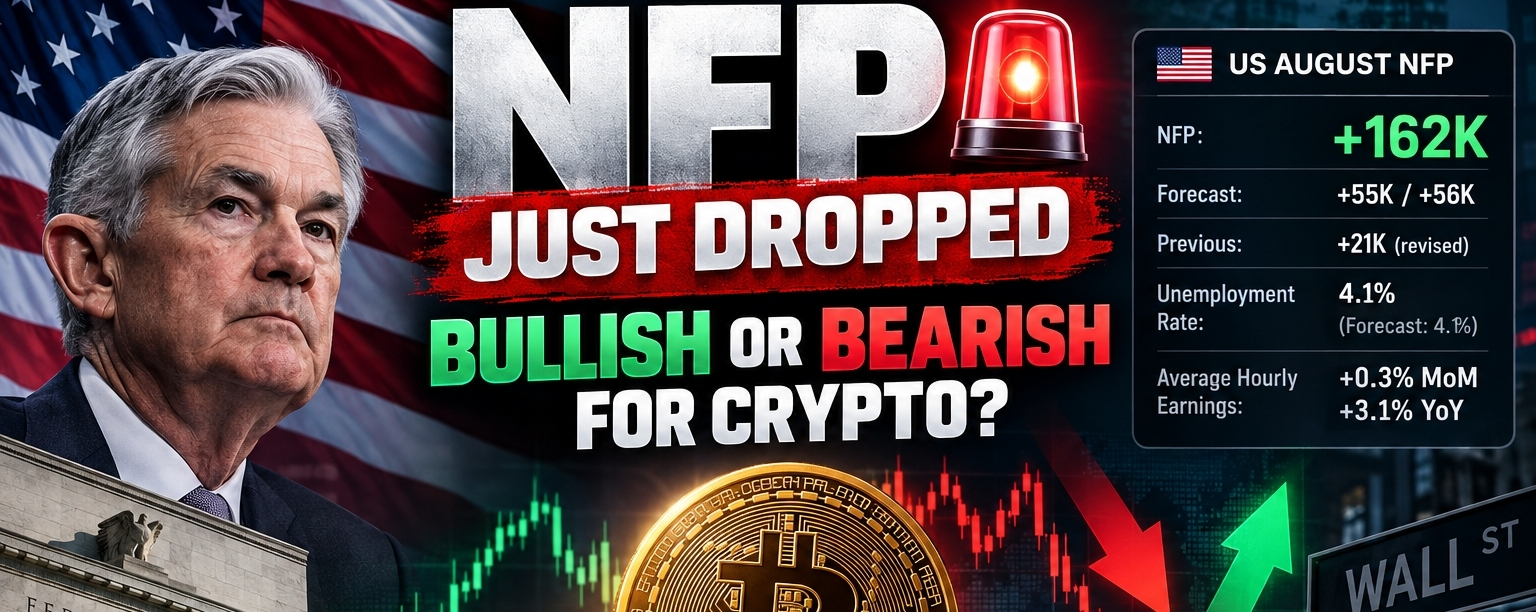
Article
🚨 NFP SURPRISE: BULLISH OR BEARISH FOR CRYPTO?US August NFP just delivered a major surprise — and Bitcoin traders need to pay attention.
🇺🇸 NFP: +162K
📊 Forecast: ~55K–56K
📈 Previous: +21K revised
👷 Unemployment Rate: 4.1%
💵 Average Hourly Earnings: +0.3% MoM / +3.1% YoY
The headline number is the real shock.
The US economy added 162,000 jobs in August, almost three times the market expectation. The previous July figure was also revised upward to +21,000. At the same time, unemployment remained at 4.1%.
At first glance, this looks like a very strong report.
But for crypto investors, the question isn't simply:
“Is strong NFP good or bad?”
The real question is:
What does this data mean for Fed policy, liquidity and Bitcoin?
🔥 STRONG JOBS = GOOD ECONOMY, BUT NOT NECESSARILY GOOD FOR BTC
A strong labor market is normally positive for the US economy.
More employment means stronger household income, stronger consumption and less immediate recession risk.
But financial markets work differently.
If the economy remains surprisingly strong, the Federal Reserve has less urgency to cut interest rates.
And that matters enormously for Bitcoin.
Crypto has historically benefited when financial conditions become easier—especially when investors expect lower rates, increased liquidity and declining yields.
A stronger-than-expected NFP can therefore create the opposite reaction in the short term:
Strong jobs → fewer rate-cut expectations → higher yields → stronger dollar → pressure on risk assets → $BTC volatility.
Indeed, the initial market reaction saw Bitcoin and gold fall while Treasury yields moved higher after the jobs surprise.
📉 BUT HERE IS THE IMPORTANT PART: WAGES ARE NOT EXPLODING
This is where the report becomes much more interesting.
Average hourly earnings increased 0.3% month-over-month and 3.1% year-over-year.
That is relatively moderate wage growth compared with the strength of the headline payroll number. The 3.1% annual increase is also notably softer than earlier periods.
So we have an unusual combination:
Employment = very strong
Unemployment = stable
Wage growth = relatively controlled
This means the report is not an entirely one-sided hawkish signal.
The Fed still has to consider inflation.
If employment is strong but wage pressures remain contained, policymakers may not necessarily need to respond with aggressive tightening.
That distinction could become extremely important for Bitcoin over the next few weeks.
🏦 THE FED IS NOW THE BIGGEST VARIABLE
The market was positioned for only around 55K–56K jobs.
Instead, we received 162K.
That's an enormous upside surprise.
Naturally, traders are now reassessing the probability of a more hawkish Federal Reserve.
Recent market pricing showed increased attention on the possibility of a September rate hike, although expectations remained volatile after the report. Reuters reported that rate-hike odds actually moved lower from earlier levels after the initial reaction.
This tells us something important:
One NFP number does not determine the Fed's decision.
The Fed will also be watching:
Inflation
Core inflation
PCE data
Wage growth
Labor-force participation
Unemployment
Treasury yields
Broader economic activity
So I would not immediately conclude:
“NFP beat = Fed hike = Bitcoin crash.”
Markets are much more complicated than that.
₿ WHAT DOES THIS MEAN FOR BITCOIN?
For me, the immediate setup is short-term bearish/volatile, but medium-term neutral until BTC confirms direction.
That's an important distinction.
The NFP number itself creates a potential headwind because stronger employment can keep monetary policy tighter for longer.
But Bitcoin's next major move will depend heavily on how the market digests:
NFP → Fed expectations → Treasury yields → DXY → liquidity → BTC
This is the chain I would watch.
If Treasury yields continue moving higher and the dollar strengthens, Bitcoin could remain under pressure.
But if yields reverse lower and traders conclude that the strong jobs report does not materially change the Fed's policy path, the initial BTC sell-off could become another liquidity-driven shakeout.
⚠️ DON'T CHASE THE FIRST NFP CANDLE
This is probably the most important message for traders.
NFP releases frequently create extreme volatility.
The first move can be misleading.
Bitcoin can dump aggressively in the first few minutes, recover, and then reverse again once bond and FX markets fully digest the data.
That's why I would avoid making a major position simply because:
“NFP is bullish”
or
“NFP is bearish.”
Instead, wait for confirmation.
👀 What I'm watching now:
1️⃣ BTC price structure
Does Bitcoin hold its key support zones after the initial volatility?
2️⃣ Treasury yields
If yields continue climbing, risk assets could remain under pressure.
3️⃣ DXY
A sustained dollar rally would generally create another headwind for crypto.
4️⃣ Fed expectations
Are traders pricing fewer cuts—or even a higher probability of a hike?
5️⃣ BTC volume
A breakdown with strong volume is much more meaningful than a temporary NFP wick.
💰 MY INVESTMENT VIEW
I don't see this NFP report as a reason to panic-sell Bitcoin.
But I also don't think this is the environment where I would blindly chase a green candle.
The strongest strategy, in my view, is patience + confirmation + risk management.
If BTC absorbs the NFP shock and starts reclaiming important resistance while yields stabilize, that could be a very constructive signal.
On the other hand, if Bitcoin loses major support while Treasury yields and the dollar continue higher, I would expect additional downside volatility before the market finds equilibrium.
That creates two possible scenarios:
🟢 BULLISH SCENARIO
Strong employment → economy remains resilient → inflation gradually cools → Fed avoids aggressive tightening → yields stabilize → liquidity improves → BTC regains momentum.
🔴 BEARISH SCENARIO
Strong employment → Fed becomes more hawkish → rate expectations rise → yields and DXY strengthen → liquidity tightens → BTC and high-beta altcoins face selling pressure.
And there is also a third possibility:
🟡 THE FAKEOUT SCENARIO
BTC initially dumps on the NFP headline, weak hands panic-sell, leverage gets liquidated—and then Bitcoin reverses once traders realize wage growth and other inflation indicators aren't strong enough to fundamentally change the Fed's trajectory.
This is why I don't trade the headline alone.
🔎 THE BIGGER PICTURE
The most interesting part of today's report isn't simply the 162K jobs.
It's the contradiction inside the data.
The labor market has suddenly shown significant resilience, but wage growth remains relatively moderate and unemployment is still only 4.1%.
That creates a much more complicated policy picture for the Federal Reserve.
And for Bitcoin investors, that's exactly why the next few sessions matter.
The $NFP number has already been released.
Now the market has to decide what it means.
That's where the real trade begins.
🚨 MY TAKE
Short term: ⚠️ Bearish / highly volatile
Medium term: 🟡 Neutral until BTC confirms
Long term: 🟢 Depends more on liquidity, Fed policy and institutional demand than one monthly jobs report.
I'm watching $BTC + DXY + Treasury yields + Fed expectations rather than reacting emotionally to the headline.
Because in this market, the biggest opportunities often appear after the volatility—not during it.
Don't chase the first move.
Let the market show its hand. 👀
#BTC #bitcoin #NFP #USAugustJobGrowthNearlyTriplesForecast #USAugustAvgHourlyEarningsRise3.1%
{spot}(BTCUSDT)
🚨 NFP SURPRISE: BULLISH OR BEARISH FOR CRYPTO?
US August NFP just delivered a major surprise — and Bitcoin traders need to pay attention.
🇺🇸 NFP: +162K
📊 Forecast: ~55K–56K
📈 Previous: +21K revised
👷 Unemployment Rate: 4.1%
💵 Average Hourly Earnings: +0.3% MoM / +3.1% YoY
The headline number is the real shock.
The US economy added 162,000 jobs in August, almost three times the market expectation. The previous July figure was also revised upward to +21,000. At the same time, unemployment remained at 4.1%.
At first glance, this looks like a very strong report.
But for crypto investors, the question isn't simply:
“Is strong NFP good or bad?”
The real question is:
What does this data mean for Fed policy, liquidity and Bitcoin?
🔥 STRONG JOBS = GOOD ECONOMY, BUT NOT NECESSARILY GOOD FOR BTC
A strong labor market is normally positive for the US economy.
More employment means stronger household income, stronger consumption and less immediate recession risk.
But financial markets work differently.
If the economy remains surprisingly strong, the Federal Reserve has less urgency to cut interest rates.
And that matters enormously for Bitcoin.
Crypto has historically benefited when financial conditions become easier—especially when investors expect lower rates, increased liquidity and declining yields.
A stronger-than-expected NFP can therefore create the opposite reaction in the short term:
Strong jobs → fewer rate-cut expectations → higher yields → stronger dollar → pressure on risk assets → $BTC volatility.
Indeed, the initial market reaction saw Bitcoin and gold fall while Treasury yields moved higher after the jobs surprise.
📉 BUT HERE IS THE IMPORTANT PART: WAGES ARE NOT EXPLODING
This is where the report becomes much more interesting.
Average hourly earnings increased 0.3% month-over-month and 3.1% year-over-year.
That is relatively moderate wage growth compared with the strength of the headline payroll number. The 3.1% annual increase is also notably softer than earlier periods.
So we have an unusual combination:
Employment = very strong
Unemployment = stable
Wage growth = relatively controlled
This means the report is not an entirely one-sided hawkish signal.
The Fed still has to consider inflation.
If employment is strong but wage pressures remain contained, policymakers may not necessarily need to respond with aggressive tightening.
That distinction could become extremely important for Bitcoin over the next few weeks.
🏦 THE FED IS NOW THE BIGGEST VARIABLE
The market was positioned for only around 55K–56K jobs.
Instead, we received 162K.
That's an enormous upside surprise.
Naturally, traders are now reassessing the probability of a more hawkish Federal Reserve.
Recent market pricing showed increased attention on the possibility of a September rate hike, although expectations remained volatile after the report. Reuters reported that rate-hike odds actually moved lower from earlier levels after the initial reaction.
This tells us something important:
One NFP number does not determine the Fed's decision.
The Fed will also be watching:
Inflation
Core inflation
PCE data
Wage growth
Labor-force participation
Unemployment
Treasury yields
Broader economic activity
So I would not immediately conclude:
“NFP beat = Fed hike = Bitcoin crash.”
Markets are much more complicated than that.
₿ WHAT DOES THIS MEAN FOR BITCOIN?
For me, the immediate setup is short-term bearish/volatile, but medium-term neutral until BTC confirms direction.
That's an important distinction.
The NFP number itself creates a potential headwind because stronger employment can keep monetary policy tighter for longer.
But Bitcoin's next major move will depend heavily on how the market digests:
NFP → Fed expectations → Treasury yields → DXY → liquidity → BTC
This is the chain I would watch.
If Treasury yields continue moving higher and the dollar strengthens, Bitcoin could remain under pressure.
But if yields reverse lower and traders conclude that the strong jobs report does not materially change the Fed's policy path, the initial BTC sell-off could become another liquidity-driven shakeout.
⚠️ DON'T CHASE THE FIRST NFP CANDLE
This is probably the most important message for traders.
NFP releases frequently create extreme volatility.
The first move can be misleading.
Bitcoin can dump aggressively in the first few minutes, recover, and then reverse again once bond and FX markets fully digest the data.
That's why I would avoid making a major position simply because:
“NFP is bullish”
or
“NFP is bearish.”
Instead, wait for confirmation.
👀 What I'm watching now:
1️⃣ BTC price structure
Does Bitcoin hold its key support zones after the initial volatility?
2️⃣ Treasury yields
If yields continue climbing, risk assets could remain under pressure.
3️⃣ DXY
A sustained dollar rally would generally create another headwind for crypto.
4️⃣ Fed expectations
Are traders pricing fewer cuts—or even a higher probability of a hike?
5️⃣ BTC volume
A breakdown with strong volume is much more meaningful than a temporary NFP wick.
💰 MY INVESTMENT VIEW
I don't see this NFP report as a reason to panic-sell Bitcoin.
But I also don't think this is the environment where I would blindly chase a green candle.
The strongest strategy, in my view, is patience + confirmation + risk management.
If BTC absorbs the NFP shock and starts reclaiming important resistance while yields stabilize, that could be a very constructive signal.
On the other hand, if Bitcoin loses major support while Treasury yields and the dollar continue higher, I would expect additional downside volatility before the market finds equilibrium.
That creates two possible scenarios:
🟢 BULLISH SCENARIO
Strong employment → economy remains resilient → inflation gradually cools → Fed avoids aggressive tightening → yields stabilize → liquidity improves → BTC regains momentum.
🔴 BEARISH SCENARIO
Strong employment → Fed becomes more hawkish → rate expectations rise → yields and DXY strengthen → liquidity tightens → BTC and high-beta altcoins face selling pressure.
And there is also a third possibility:
🟡 THE FAKEOUT SCENARIO
BTC initially dumps on the NFP headline, weak hands panic-sell, leverage gets liquidated—and then Bitcoin reverses once traders realize wage growth and other inflation indicators aren't strong enough to fundamentally change the Fed's trajectory.
This is why I don't trade the headline alone.
🔎 THE BIGGER PICTURE
The most interesting part of today's report isn't simply the 162K jobs.
It's the contradiction inside the data.
The labor market has suddenly shown significant resilience, but wage growth remains relatively moderate and unemployment is still only 4.1%.
That creates a much more complicated policy picture for the Federal Reserve.
And for Bitcoin investors, that's exactly why the next few sessions matter.
The $NFP number has already been released.
Now the market has to decide what it means.
That's where the real trade begins.
🚨 MY TAKE
Short term: ⚠️ Bearish / highly volatile
Medium term: 🟡 Neutral until BTC confirms
Long term: 🟢 Depends more on liquidity, Fed policy and institutional demand than one monthly jobs report.
I'm watching $BTC + DXY + Treasury yields + Fed expectations rather than reacting emotionally to the headline.
Because in this market, the biggest opportunities often appear after the volatility—not during it.
Don't chase the first move.
Let the market show its hand. 👀
#BTC #bitcoin #NFP #USAugustJobGrowthNearlyTriplesForecast #USAugustAvgHourlyEarningsRise3.1%
🇺🇸 NFP: +162K
📊 Forecast: ~55K–56K
📈 Previous: +21K revised
👷 Unemployment Rate: 4.1%
💵 Average Hourly Earnings: +0.3% MoM / +3.1% YoY
The headline number is the real shock.
The US economy added 162,000 jobs in August, almost three times the market expectation. The previous July figure was also revised upward to +21,000. At the same time, unemployment remained at 4.1%.
At first glance, this looks like a very strong report.
But for crypto investors, the question isn't simply:
“Is strong NFP good or bad?”
The real question is:
What does this data mean for Fed policy, liquidity and Bitcoin?
🔥 STRONG JOBS = GOOD ECONOMY, BUT NOT NECESSARILY GOOD FOR BTC
A strong labor market is normally positive for the US economy.
More employment means stronger household income, stronger consumption and less immediate recession risk.
But financial markets work differently.
If the economy remains surprisingly strong, the Federal Reserve has less urgency to cut interest rates.
And that matters enormously for Bitcoin.
Crypto has historically benefited when financial conditions become easier—especially when investors expect lower rates, increased liquidity and declining yields.
A stronger-than-expected NFP can therefore create the opposite reaction in the short term:
Strong jobs → fewer rate-cut expectations → higher yields → stronger dollar → pressure on risk assets → $BTC volatility.
Indeed, the initial market reaction saw Bitcoin and gold fall while Treasury yields moved higher after the jobs surprise.
📉 BUT HERE IS THE IMPORTANT PART: WAGES ARE NOT EXPLODING
This is where the report becomes much more interesting.
Average hourly earnings increased 0.3% month-over-month and 3.1% year-over-year.
That is relatively moderate wage growth compared with the strength of the headline payroll number. The 3.1% annual increase is also notably softer than earlier periods.
So we have an unusual combination:
Employment = very strong
Unemployment = stable
Wage growth = relatively controlled
This means the report is not an entirely one-sided hawkish signal.
The Fed still has to consider inflation.
If employment is strong but wage pressures remain contained, policymakers may not necessarily need to respond with aggressive tightening.
That distinction could become extremely important for Bitcoin over the next few weeks.
🏦 THE FED IS NOW THE BIGGEST VARIABLE
The market was positioned for only around 55K–56K jobs.
Instead, we received 162K.
That's an enormous upside surprise.
Naturally, traders are now reassessing the probability of a more hawkish Federal Reserve.
Recent market pricing showed increased attention on the possibility of a September rate hike, although expectations remained volatile after the report. Reuters reported that rate-hike odds actually moved lower from earlier levels after the initial reaction.
This tells us something important:
One NFP number does not determine the Fed's decision.
The Fed will also be watching:
Inflation
Core inflation
PCE data
Wage growth
Labor-force participation
Unemployment
Treasury yields
Broader economic activity
So I would not immediately conclude:
“NFP beat = Fed hike = Bitcoin crash.”
Markets are much more complicated than that.
₿ WHAT DOES THIS MEAN FOR BITCOIN?
For me, the immediate setup is short-term bearish/volatile, but medium-term neutral until BTC confirms direction.
That's an important distinction.
The NFP number itself creates a potential headwind because stronger employment can keep monetary policy tighter for longer.
But Bitcoin's next major move will depend heavily on how the market digests:
NFP → Fed expectations → Treasury yields → DXY → liquidity → BTC
This is the chain I would watch.
If Treasury yields continue moving higher and the dollar strengthens, Bitcoin could remain under pressure.
But if yields reverse lower and traders conclude that the strong jobs report does not materially change the Fed's policy path, the initial BTC sell-off could become another liquidity-driven shakeout.
⚠️ DON'T CHASE THE FIRST NFP CANDLE
This is probably the most important message for traders.
NFP releases frequently create extreme volatility.
The first move can be misleading.
Bitcoin can dump aggressively in the first few minutes, recover, and then reverse again once bond and FX markets fully digest the data.
That's why I would avoid making a major position simply because:
“NFP is bullish”
or
“NFP is bearish.”
Instead, wait for confirmation.
👀 What I'm watching now:
1️⃣ BTC price structure
Does Bitcoin hold its key support zones after the initial volatility?
2️⃣ Treasury yields
If yields continue climbing, risk assets could remain under pressure.
3️⃣ DXY
A sustained dollar rally would generally create another headwind for crypto.
4️⃣ Fed expectations
Are traders pricing fewer cuts—or even a higher probability of a hike?
5️⃣ BTC volume
A breakdown with strong volume is much more meaningful than a temporary NFP wick.
💰 MY INVESTMENT VIEW
I don't see this NFP report as a reason to panic-sell Bitcoin.
But I also don't think this is the environment where I would blindly chase a green candle.
The strongest strategy, in my view, is patience + confirmation + risk management.
If BTC absorbs the NFP shock and starts reclaiming important resistance while yields stabilize, that could be a very constructive signal.
On the other hand, if Bitcoin loses major support while Treasury yields and the dollar continue higher, I would expect additional downside volatility before the market finds equilibrium.
That creates two possible scenarios:
🟢 BULLISH SCENARIO
Strong employment → economy remains resilient → inflation gradually cools → Fed avoids aggressive tightening → yields stabilize → liquidity improves → BTC regains momentum.
🔴 BEARISH SCENARIO
Strong employment → Fed becomes more hawkish → rate expectations rise → yields and DXY strengthen → liquidity tightens → BTC and high-beta altcoins face selling pressure.
And there is also a third possibility:
🟡 THE FAKEOUT SCENARIO
BTC initially dumps on the NFP headline, weak hands panic-sell, leverage gets liquidated—and then Bitcoin reverses once traders realize wage growth and other inflation indicators aren't strong enough to fundamentally change the Fed's trajectory.
This is why I don't trade the headline alone.
🔎 THE BIGGER PICTURE
The most interesting part of today's report isn't simply the 162K jobs.
It's the contradiction inside the data.
The labor market has suddenly shown significant resilience, but wage growth remains relatively moderate and unemployment is still only 4.1%.
That creates a much more complicated policy picture for the Federal Reserve.
And for Bitcoin investors, that's exactly why the next few sessions matter.
The $NFP number has already been released.
Now the market has to decide what it means.
That's where the real trade begins.
🚨 MY TAKE
Short term: ⚠️ Bearish / highly volatile
Medium term: 🟡 Neutral until BTC confirms
Long term: 🟢 Depends more on liquidity, Fed policy and institutional demand than one monthly jobs report.
I'm watching $BTC + DXY + Treasury yields + Fed expectations rather than reacting emotionally to the headline.
Because in this market, the biggest opportunities often appear after the volatility—not during it.
Don't chase the first move.
Let the market show its hand. 👀
#BTC #bitcoin #NFP #USAugustJobGrowthNearlyTriplesForecast #USAugustAvgHourlyEarningsRise3.1%
1
2
221
·
--
Article
Solana Holds the Line: Why $100 Could Decide the Next Move for $SOL, $TUT & $BILLThe crypto market is entering another important decision zone.
After a strong August rally, Solana ($SOL ) has pulled back more than 3%, bringing one of the most closely watched levels back into focus: $100.
For me, this is not simply another red candle.
The $100 area represents a psychological level, a technical support zone, and potentially a place where buyers could begin rebuilding positions if market conditions stabilize.
SOL recently pushed toward the $110 resistance region, but failed to maintain that momentum. The resulting pullback has cooled short-term momentum and brought the price back toward the area where bulls need to defend the structure.
The key question now is simple:
Will $100 become the floor for the next move higher—or will it become the starting point for another leg lower?
And this is where I believe traders should look beyond SOL itself.
Because when Solana's ecosystem begins attracting liquidity again, smaller and higher-beta tokens such as $TUT and $BILL.US can become interesting speculative opportunities—but also carry significantly greater risk.
SOL: The $100 Battle Is the Main Story
The first level I am watching is the $100–$103 zone.
This region previously attracted buyers and acted as an important accumulation area. If SOL can stabilize around this zone and produce convincing daily closes above $100, the short-term structure could remain constructive.
A recovery above $103 would be the first sign that buyers are regaining control.
Then comes the bigger test:
$105 → $110
A successful reclaim of $110 would improve the technical picture considerably and could open the door toward higher resistance levels.
But traders should not ignore the opposite scenario.
If SOL repeatedly tests $100 and buyers fail to defend it, the market could begin searching for liquidity lower.
The first downside area I would watch is around the mid-$90s, followed by deeper support zones if broader market weakness accelerates.
So I am not looking at $100 as a guaranteed bottom.
I am looking at it as a decision zone.
Volume Is Sending an Important Message
One interesting part of this pullback is the increase in trading activity.
When price declines while volume expands, it tells us that market participants are actively responding to the move rather than simply ignoring it.
That does not automatically mean bearish continuation.
Sometimes increased volume during a correction represents distribution.
Sometimes it represents buyers absorbing panic selling.
The next few sessions should therefore be watched carefully.
If SOL holds the $100 area while selling volume begins to weaken, that would be a healthier signal.
If price breaks $100 with expanding volume and fails to reclaim it, the bearish case becomes much stronger.
Price + volume + daily closes are more important to me than one isolated candle.
But Here Is Where It Gets Interesting: TUT & BILL
While SOL remains the major asset to watch, smaller ecosystem tokens can behave very differently during a recovery.
This is where TUT and BILL enter the picture.
These are not the same risk category as SOL.
That distinction is extremely important.
A large-cap asset such as SOL generally has deeper liquidity and broader market participation. Smaller tokens can experience much larger percentage moves in both directions.
That means:
More potential upside ≠ lower risk.
In fact, the opposite can often be true.
If SOL successfully establishes a bottom around $100 and capital begins rotating back into the Solana ecosystem, higher-beta tokens could attract traders looking for stronger percentage moves.
That is the narrative I would monitor.
TUT: Watch the Liquidity Rotation
For TUT, I would focus less on chasing a green candle and more on whether liquidity is actually returning.
A common mistake in crypto is seeing a token move 10–20% and immediately assuming the next move will be another 50%.
That is not how sustainable trends are built.
For TUT, I would want to see:
Increasing trading volume
Higher lows on the chart
Stronger liquidity
Reduced selling pressure
SOL stabilizing at the same time
A broader altcoin recovery
If these factors begin appearing together, the setup becomes much more interesting.
But if TUT pumps while overall liquidity remains thin, I would treat the move with caution.
Liquidity first. Narrative second. Price target last.
BILL: High Beta, High Attention, Higher Risk
BILL belongs to the same broader speculative conversation, but I would approach it even more carefully.
Smaller-cap assets can outperform dramatically when market sentiment shifts from fear to risk-on.
However, the same characteristic works in reverse.
If SOL loses $100 and the broader market turns defensive, speculative tokens can fall significantly faster than large-cap assets.
That means BILL should not be treated like a replacement for SOL.
Instead, it can be viewed as a higher-risk satellite position for investors who understand volatility and liquidity risk.
The ideal environment for such a setup would be:
BTC stable → SOL stabilizes → Solana ecosystem liquidity returns → smaller-cap tokens begin outperforming.
That sequence is much healthier than randomly buying small caps simply because they are down.
The Bigger Picture: SOL Could Be the Liquidity Signal
This is the part I find most interesting.
SOL doesn't necessarily need to explode higher immediately.
It simply needs to stop making lower lows and establish a reliable base.
If SOL holds $100 and gradually begins reclaiming $103, $105 and eventually $110, market confidence could improve.
And when confidence returns, traders often move further out on the risk curve.
Capital can rotate from:
BTC → ETH → SOL → ecosystem tokens → smaller-cap/high-beta assets.
That does not happen every time, and it is never guaranteed.
But historically, crypto liquidity often behaves this way during risk-on phases.
Therefore, SOL's reaction around $100 may be useful not only for SOL traders, but also for anyone watching smaller ecosystem opportunities such as TUT and BILL.
Macro Could Decide Everything
Technical analysis does not exist in isolation.
The next major catalyst could come from macroeconomic data, especially upcoming U.S. employment figures and Federal Reserve expectations.
If economic data reduces fears of further monetary tightening, risk assets could receive support.
Crypto—and particularly high-beta assets like SOL—can respond strongly when liquidity expectations improve.
On the other hand, stronger-than-expected economic data combined with renewed inflation concerns could keep pressure on risk assets.
Geopolitical developments also remain important.
In a risk-off environment, traders usually become less willing to hold speculative assets.
So even if the chart looks attractive, the macro environment can invalidate a bullish setup very quickly.
My Investment Framework
I am not interested in blindly buying every dip.
Instead, I would divide these three assets into different risk categories.
🟢 SOL — Core Watch
The strongest setup of the three from a market-structure perspective.
Key zone: $100–$103
Bullish confirmation: reclaim $105–$110
Risk signal: sustained break below $100
Potential downside area: mid-$90s
SOL remains the asset I would watch first because its performance can provide a broader signal for the Solana ecosystem.
🟡 TUT — Growth / Speculative Watch
Higher potential volatility than SOL.
I would prioritize confirmation of volume, liquidity and higher lows instead of chasing sudden pumps.
🔴 BILL — High-Risk Speculation
Potentially attractive during strong ecosystem-wide risk-on conditions, but substantially more sensitive to liquidity and market sentiment.
Position sizing matters more here than price prediction.
What Would Make Me Bullish?
For me, the ideal sequence would look something like this:
1. SOL holds $100
2. Selling volume begins to decline
3. SOL reclaims $103
4. $105–$110 resistance gets challenged
5. Broader crypto market stabilizes
6. Liquidity starts rotating into Solana ecosystem tokens
7. TUT and BILL begin showing stronger relative volume
That would be much more convincing than simply seeing one large green candle.
And What Would Make Me Bearish?
The opposite sequence would be concerning:
SOL loses $100 on strong volume → fails to reclaim it → BTC/ETH weaken → risk appetite disappears → ecosystem liquidity dries up.
In that environment, I would rather preserve capital than try to catch a falling knife.
Especially with smaller tokens.
Because the biggest mistake in crypto is not missing a pump.
The biggest mistake is refusing to respect risk after the market structure has already changed.
Final Take
The current Solana pullback is worth watching closely.
$100 is the line in the sand.
If SOL can defend this region and gradually reclaim $103, $105 and eventually $110, the short-term structure could turn constructive again.
And if that recovery develops alongside improving market liquidity, tokens such as TUT and BILL could attract additional speculative interest as traders search for higher-beta opportunities within the Solana ecosystem.
But I would keep the hierarchy clear:
SOL = ecosystem leader
TUT = higher-beta opportunity
BILL = higher-risk speculation
I would rather wait for confirmation than buy purely because a token has fallen.
Because in crypto, the best opportunities are not always the coins that are down the most.
Sometimes, the real opportunity appears when support holds, liquidity returns, and momentum starts changing direction.
For now, my eyes remain firmly on $100 SOL.
If bulls defend it, this pullback could eventually become another accumulation phase.
If they lose it decisively, the market may need to find a lower floor first.
Stay patient. Watch liquidity. Respect risk. Let the chart confirm the story.
{spot}(SOLUSDT)
{spot}(TUTUSDT)
{stock_us}(BILL.US)
#solana #TUT #BILL #SolanaFallsOver3% #SolanaStrong
Solana Holds the Line: Why $100 Could Decide the Next Move for $SOL, $TUT & $BILL
The crypto market is entering another important decision zone.
After a strong August rally, Solana ($SOL ) has pulled back more than 3%, bringing one of the most closely watched levels back into focus: $100.
For me, this is not simply another red candle.
The $100 area represents a psychological level, a technical support zone, and potentially a place where buyers could begin rebuilding positions if market conditions stabilize.
SOL recently pushed toward the $110 resistance region, but failed to maintain that momentum. The resulting pullback has cooled short-term momentum and brought the price back toward the area where bulls need to defend the structure.
The key question now is simple:
Will $100 become the floor for the next move higher—or will it become the starting point for another leg lower?
And this is where I believe traders should look beyond SOL itself.
Because when Solana's ecosystem begins attracting liquidity again, smaller and higher-beta tokens such as $TUT and $BILL.US can become interesting speculative opportunities—but also carry significantly greater risk.
SOL: The $100 Battle Is the Main Story
The first level I am watching is the $100–$103 zone.
This region previously attracted buyers and acted as an important accumulation area. If SOL can stabilize around this zone and produce convincing daily closes above $100, the short-term structure could remain constructive.
A recovery above $103 would be the first sign that buyers are regaining control.
Then comes the bigger test:
$105 → $110
A successful reclaim of $110 would improve the technical picture considerably and could open the door toward higher resistance levels.
But traders should not ignore the opposite scenario.
If SOL repeatedly tests $100 and buyers fail to defend it, the market could begin searching for liquidity lower.
The first downside area I would watch is around the mid-$90s, followed by deeper support zones if broader market weakness accelerates.
So I am not looking at $100 as a guaranteed bottom.
I am looking at it as a decision zone.
Volume Is Sending an Important Message
One interesting part of this pullback is the increase in trading activity.
When price declines while volume expands, it tells us that market participants are actively responding to the move rather than simply ignoring it.
That does not automatically mean bearish continuation.
Sometimes increased volume during a correction represents distribution.
Sometimes it represents buyers absorbing panic selling.
The next few sessions should therefore be watched carefully.
If SOL holds the $100 area while selling volume begins to weaken, that would be a healthier signal.
If price breaks $100 with expanding volume and fails to reclaim it, the bearish case becomes much stronger.
Price + volume + daily closes are more important to me than one isolated candle.
But Here Is Where It Gets Interesting: TUT & BILL
While SOL remains the major asset to watch, smaller ecosystem tokens can behave very differently during a recovery.
This is where TUT and BILL enter the picture.
These are not the same risk category as SOL.
That distinction is extremely important.
A large-cap asset such as SOL generally has deeper liquidity and broader market participation. Smaller tokens can experience much larger percentage moves in both directions.
That means:
More potential upside ≠ lower risk.
In fact, the opposite can often be true.
If SOL successfully establishes a bottom around $100 and capital begins rotating back into the Solana ecosystem, higher-beta tokens could attract traders looking for stronger percentage moves.
That is the narrative I would monitor.
TUT: Watch the Liquidity Rotation
For TUT, I would focus less on chasing a green candle and more on whether liquidity is actually returning.
A common mistake in crypto is seeing a token move 10–20% and immediately assuming the next move will be another 50%.
That is not how sustainable trends are built.
For TUT, I would want to see:
Increasing trading volume
Higher lows on the chart
Stronger liquidity
Reduced selling pressure
SOL stabilizing at the same time
A broader altcoin recovery
If these factors begin appearing together, the setup becomes much more interesting.
But if TUT pumps while overall liquidity remains thin, I would treat the move with caution.
Liquidity first. Narrative second. Price target last.
BILL: High Beta, High Attention, Higher Risk
BILL belongs to the same broader speculative conversation, but I would approach it even more carefully.
Smaller-cap assets can outperform dramatically when market sentiment shifts from fear to risk-on.
However, the same characteristic works in reverse.
If SOL loses $100 and the broader market turns defensive, speculative tokens can fall significantly faster than large-cap assets.
That means BILL should not be treated like a replacement for SOL.
Instead, it can be viewed as a higher-risk satellite position for investors who understand volatility and liquidity risk.
The ideal environment for such a setup would be:
BTC stable → SOL stabilizes → Solana ecosystem liquidity returns → smaller-cap tokens begin outperforming.
That sequence is much healthier than randomly buying small caps simply because they are down.
The Bigger Picture: SOL Could Be the Liquidity Signal
This is the part I find most interesting.
SOL doesn't necessarily need to explode higher immediately.
It simply needs to stop making lower lows and establish a reliable base.
If SOL holds $100 and gradually begins reclaiming $103, $105 and eventually $110, market confidence could improve.
And when confidence returns, traders often move further out on the risk curve.
Capital can rotate from:
BTC → ETH → SOL → ecosystem tokens → smaller-cap/high-beta assets.
That does not happen every time, and it is never guaranteed.
But historically, crypto liquidity often behaves this way during risk-on phases.
Therefore, SOL's reaction around $100 may be useful not only for SOL traders, but also for anyone watching smaller ecosystem opportunities such as TUT and BILL.
Macro Could Decide Everything
Technical analysis does not exist in isolation.
The next major catalyst could come from macroeconomic data, especially upcoming U.S. employment figures and Federal Reserve expectations.
If economic data reduces fears of further monetary tightening, risk assets could receive support.
Crypto—and particularly high-beta assets like SOL—can respond strongly when liquidity expectations improve.
On the other hand, stronger-than-expected economic data combined with renewed inflation concerns could keep pressure on risk assets.
Geopolitical developments also remain important.
In a risk-off environment, traders usually become less willing to hold speculative assets.
So even if the chart looks attractive, the macro environment can invalidate a bullish setup very quickly.
My Investment Framework
I am not interested in blindly buying every dip.
Instead, I would divide these three assets into different risk categories.
🟢 SOL — Core Watch
The strongest setup of the three from a market-structure perspective.
Key zone: $100–$103
Bullish confirmation: reclaim $105–$110
Risk signal: sustained break below $100
Potential downside area: mid-$90s
SOL remains the asset I would watch first because its performance can provide a broader signal for the Solana ecosystem.
🟡 TUT — Growth / Speculative Watch
Higher potential volatility than SOL.
I would prioritize confirmation of volume, liquidity and higher lows instead of chasing sudden pumps.
🔴 BILL — High-Risk Speculation
Potentially attractive during strong ecosystem-wide risk-on conditions, but substantially more sensitive to liquidity and market sentiment.
Position sizing matters more here than price prediction.
What Would Make Me Bullish?
For me, the ideal sequence would look something like this:
1. SOL holds $100
2. Selling volume begins to decline
3. SOL reclaims $103
4. $105–$110 resistance gets challenged
5. Broader crypto market stabilizes
6. Liquidity starts rotating into Solana ecosystem tokens
7. TUT and BILL begin showing stronger relative volume
That would be much more convincing than simply seeing one large green candle.
And What Would Make Me Bearish?
The opposite sequence would be concerning:
SOL loses $100 on strong volume → fails to reclaim it → BTC/ETH weaken → risk appetite disappears → ecosystem liquidity dries up.
In that environment, I would rather preserve capital than try to catch a falling knife.
Especially with smaller tokens.
Because the biggest mistake in crypto is not missing a pump.
The biggest mistake is refusing to respect risk after the market structure has already changed.
Final Take
The current Solana pullback is worth watching closely.
$100 is the line in the sand.
If SOL can defend this region and gradually reclaim $103, $105 and eventually $110, the short-term structure could turn constructive again.
And if that recovery develops alongside improving market liquidity, tokens such as TUT and BILL could attract additional speculative interest as traders search for higher-beta opportunities within the Solana ecosystem.
But I would keep the hierarchy clear:
SOL = ecosystem leader
TUT = higher-beta opportunity
BILL = higher-risk speculation
I would rather wait for confirmation than buy purely because a token has fallen.
Because in crypto, the best opportunities are not always the coins that are down the most.
Sometimes, the real opportunity appears when support holds, liquidity returns, and momentum starts changing direction.
For now, my eyes remain firmly on $100 SOL.
If bulls defend it, this pullback could eventually become another accumulation phase.
If they lose it decisively, the market may need to find a lower floor first.
Stay patient. Watch liquidity. Respect risk. Let the chart confirm the story.
#solana #TUT #BILL #SolanaFallsOver3% #SolanaStrong
After a strong August rally, Solana ($SOL ) has pulled back more than 3%, bringing one of the most closely watched levels back into focus: $100.
For me, this is not simply another red candle.
The $100 area represents a psychological level, a technical support zone, and potentially a place where buyers could begin rebuilding positions if market conditions stabilize.
SOL recently pushed toward the $110 resistance region, but failed to maintain that momentum. The resulting pullback has cooled short-term momentum and brought the price back toward the area where bulls need to defend the structure.
The key question now is simple:
Will $100 become the floor for the next move higher—or will it become the starting point for another leg lower?
And this is where I believe traders should look beyond SOL itself.
Because when Solana's ecosystem begins attracting liquidity again, smaller and higher-beta tokens such as $TUT and $BILL.US can become interesting speculative opportunities—but also carry significantly greater risk.
SOL: The $100 Battle Is the Main Story
The first level I am watching is the $100–$103 zone.
This region previously attracted buyers and acted as an important accumulation area. If SOL can stabilize around this zone and produce convincing daily closes above $100, the short-term structure could remain constructive.
A recovery above $103 would be the first sign that buyers are regaining control.
Then comes the bigger test:
$105 → $110
A successful reclaim of $110 would improve the technical picture considerably and could open the door toward higher resistance levels.
But traders should not ignore the opposite scenario.
If SOL repeatedly tests $100 and buyers fail to defend it, the market could begin searching for liquidity lower.
The first downside area I would watch is around the mid-$90s, followed by deeper support zones if broader market weakness accelerates.
So I am not looking at $100 as a guaranteed bottom.
I am looking at it as a decision zone.
Volume Is Sending an Important Message
One interesting part of this pullback is the increase in trading activity.
When price declines while volume expands, it tells us that market participants are actively responding to the move rather than simply ignoring it.
That does not automatically mean bearish continuation.
Sometimes increased volume during a correction represents distribution.
Sometimes it represents buyers absorbing panic selling.
The next few sessions should therefore be watched carefully.
If SOL holds the $100 area while selling volume begins to weaken, that would be a healthier signal.
If price breaks $100 with expanding volume and fails to reclaim it, the bearish case becomes much stronger.
Price + volume + daily closes are more important to me than one isolated candle.
But Here Is Where It Gets Interesting: TUT & BILL
While SOL remains the major asset to watch, smaller ecosystem tokens can behave very differently during a recovery.
This is where TUT and BILL enter the picture.
These are not the same risk category as SOL.
That distinction is extremely important.
A large-cap asset such as SOL generally has deeper liquidity and broader market participation. Smaller tokens can experience much larger percentage moves in both directions.
That means:
More potential upside ≠ lower risk.
In fact, the opposite can often be true.
If SOL successfully establishes a bottom around $100 and capital begins rotating back into the Solana ecosystem, higher-beta tokens could attract traders looking for stronger percentage moves.
That is the narrative I would monitor.
TUT: Watch the Liquidity Rotation
For TUT, I would focus less on chasing a green candle and more on whether liquidity is actually returning.
A common mistake in crypto is seeing a token move 10–20% and immediately assuming the next move will be another 50%.
That is not how sustainable trends are built.
For TUT, I would want to see:
Increasing trading volume
Higher lows on the chart
Stronger liquidity
Reduced selling pressure
SOL stabilizing at the same time
A broader altcoin recovery
If these factors begin appearing together, the setup becomes much more interesting.
But if TUT pumps while overall liquidity remains thin, I would treat the move with caution.
Liquidity first. Narrative second. Price target last.
BILL: High Beta, High Attention, Higher Risk
BILL belongs to the same broader speculative conversation, but I would approach it even more carefully.
Smaller-cap assets can outperform dramatically when market sentiment shifts from fear to risk-on.
However, the same characteristic works in reverse.
If SOL loses $100 and the broader market turns defensive, speculative tokens can fall significantly faster than large-cap assets.
That means BILL should not be treated like a replacement for SOL.
Instead, it can be viewed as a higher-risk satellite position for investors who understand volatility and liquidity risk.
The ideal environment for such a setup would be:
BTC stable → SOL stabilizes → Solana ecosystem liquidity returns → smaller-cap tokens begin outperforming.
That sequence is much healthier than randomly buying small caps simply because they are down.
The Bigger Picture: SOL Could Be the Liquidity Signal
This is the part I find most interesting.
SOL doesn't necessarily need to explode higher immediately.
It simply needs to stop making lower lows and establish a reliable base.
If SOL holds $100 and gradually begins reclaiming $103, $105 and eventually $110, market confidence could improve.
And when confidence returns, traders often move further out on the risk curve.
Capital can rotate from:
BTC → ETH → SOL → ecosystem tokens → smaller-cap/high-beta assets.
That does not happen every time, and it is never guaranteed.
But historically, crypto liquidity often behaves this way during risk-on phases.
Therefore, SOL's reaction around $100 may be useful not only for SOL traders, but also for anyone watching smaller ecosystem opportunities such as TUT and BILL.
Macro Could Decide Everything
Technical analysis does not exist in isolation.
The next major catalyst could come from macroeconomic data, especially upcoming U.S. employment figures and Federal Reserve expectations.
If economic data reduces fears of further monetary tightening, risk assets could receive support.
Crypto—and particularly high-beta assets like SOL—can respond strongly when liquidity expectations improve.
On the other hand, stronger-than-expected economic data combined with renewed inflation concerns could keep pressure on risk assets.
Geopolitical developments also remain important.
In a risk-off environment, traders usually become less willing to hold speculative assets.
So even if the chart looks attractive, the macro environment can invalidate a bullish setup very quickly.
My Investment Framework
I am not interested in blindly buying every dip.
Instead, I would divide these three assets into different risk categories.
🟢 SOL — Core Watch
The strongest setup of the three from a market-structure perspective.
Key zone: $100–$103
Bullish confirmation: reclaim $105–$110
Risk signal: sustained break below $100
Potential downside area: mid-$90s
SOL remains the asset I would watch first because its performance can provide a broader signal for the Solana ecosystem.
🟡 TUT — Growth / Speculative Watch
Higher potential volatility than SOL.
I would prioritize confirmation of volume, liquidity and higher lows instead of chasing sudden pumps.
🔴 BILL — High-Risk Speculation
Potentially attractive during strong ecosystem-wide risk-on conditions, but substantially more sensitive to liquidity and market sentiment.
Position sizing matters more here than price prediction.
What Would Make Me Bullish?
For me, the ideal sequence would look something like this:
1. SOL holds $100
2. Selling volume begins to decline
3. SOL reclaims $103
4. $105–$110 resistance gets challenged
5. Broader crypto market stabilizes
6. Liquidity starts rotating into Solana ecosystem tokens
7. TUT and BILL begin showing stronger relative volume
That would be much more convincing than simply seeing one large green candle.
And What Would Make Me Bearish?
The opposite sequence would be concerning:
SOL loses $100 on strong volume → fails to reclaim it → BTC/ETH weaken → risk appetite disappears → ecosystem liquidity dries up.
In that environment, I would rather preserve capital than try to catch a falling knife.
Especially with smaller tokens.
Because the biggest mistake in crypto is not missing a pump.
The biggest mistake is refusing to respect risk after the market structure has already changed.
Final Take
The current Solana pullback is worth watching closely.
$100 is the line in the sand.
If SOL can defend this region and gradually reclaim $103, $105 and eventually $110, the short-term structure could turn constructive again.
And if that recovery develops alongside improving market liquidity, tokens such as TUT and BILL could attract additional speculative interest as traders search for higher-beta opportunities within the Solana ecosystem.
But I would keep the hierarchy clear:
SOL = ecosystem leader
TUT = higher-beta opportunity
BILL = higher-risk speculation
I would rather wait for confirmation than buy purely because a token has fallen.
Because in crypto, the best opportunities are not always the coins that are down the most.
Sometimes, the real opportunity appears when support holds, liquidity returns, and momentum starts changing direction.
For now, my eyes remain firmly on $100 SOL.
If bulls defend it, this pullback could eventually become another accumulation phase.
If they lose it decisively, the market may need to find a lower floor first.
Stay patient. Watch liquidity. Respect risk. Let the chart confirm the story.
#solana #TUT #BILL #SolanaFallsOver3% #SolanaStrong
1
280
·
--
Article
XRP: A Wealth Transfer So Massive, It Could Make 2017 Look Like a Test Run 👀Some of you are about to witness a wealth transfer so massive, it’ll make 2017 look like a test run.
And in my view, this is not just another crypto hype statement.
Because the $XRP narrative in 2026 is starting to look very different from previous bull markets.
Back in 2017, most people bought XRP for one primary reason:
Speculation.
Today, the conversation is slowly changing.
Now we are talking about:
Institutional capital
Spot XRP ETFs
Real-world asset tokenization
Stablecoin liquidity
Cross-border settlement
Regulated digital finance
The expanding financial infrastructure around the XRP Ledger
So the real question is no longer:
“Will XRP pump?”
The bigger question is:
If traditional finance continues moving toward blockchain-based infrastructure, could XRP become one of the important assets within that new financial ecosystem?
In my opinion, this is where the real story begins.
2017 Was the Year of Speculation. This Time Could Be About Infrastructure.
The 2017 crypto bull market was largely driven by retail speculation.
People were buying almost anything with a ticker.
ICOs were exploding.
New tokens were launching every day.
Many projects had limited real-world utility, yet prices were rising at extraordinary speeds.
XRP was also part of that speculative mania.
But today's landscape is very different.
Wall Street is now actively exploring blockchain technology.
Tokenized Treasuries are growing.
Stablecoin regulation is becoming increasingly important.
Traditional financial institutions are beginning to experiment with tokenized assets, digital settlement, and 24/7 markets.
This is where the XRP story becomes particularly interesting.
Because the $XRP Ledger was built with financial use cases in mind from the beginning.
Payments.
Settlement.
Liquidity.
Cross-border value transfer.
And increasingly, tokenization.
Institutional Money Is Slowly Entering the XRP Conversation
One of the biggest changes in the XRP landscape is institutional accessibility.
For years, regulatory uncertainty kept many institutional investors on the sidelines.
But as the regulatory environment evolved, XRP became increasingly accessible through regulated investment products.
This matters.
Because there is a major difference between retail traders buying XRP because they expect a quick pump and institutional investors gaining exposure through structured investment vehicles.
Institutions typically evaluate:
Liquidity
Regulation
Custody
Market infrastructure
Portfolio diversification
Long-term investment potential
If institutional demand continues to grow over time, XRP's supply-demand dynamics could begin to change.
And that is something long-term investors should not ignore.
But ETFs May Not Be the Biggest Story
In my opinion, ETFs are not necessarily the biggest part of the XRP thesis.
They are simply the gateway.
The bigger question is:
How large could blockchain-based financial infrastructure eventually become?
The world is gradually moving toward tokenization.
Assets that are beginning to move on-chain include:
U.S. Treasuries
Money market funds
Private credit
Real estate
Bonds
Equities
Collateral
Other real-world assets
This new financial system will require several things:
Faster settlement
24/7 liquidity
Regulated stablecoins
Tokenized assets
Interoperable networks
Efficient cross-border value transfer
And this is where the XRP Ledger is attempting to position itself.
The future financial system may not look like the one we have today.
Settlement could become faster.
Markets could become more global.
Assets could become programmable.
And blockchain infrastructure could eventually become a hidden layer beneath traditional finance.
If the XRP Ledger captures even a meaningful portion of this growing ecosystem, the valuation narrative around XRP could look very different from previous market cycles.
RLUSD Could Be an Important Part of the Bigger Ecosystem
Many XRP holders misunderstand one thing.
They assume that the growth of stablecoins like RLUSD automatically reduces the need for XRP.
I don't see it that simply.
Stablecoins and XRP can serve different purposes.
A stablecoin is primarily designed to maintain a stable value.
XRP, on the other hand, is a native digital asset designed for liquidity and value transfer across the XRP Ledger ecosystem.
In a larger institutional ecosystem, different assets can serve different functions.
Stablecoins can provide stable settlement liquidity.
Tokenized assets can represent real-world value.
And native digital assets can potentially facilitate liquidity movement across networks.
The important point is this:
The future financial ecosystem is unlikely to be built around just one type of digital asset.
It will likely consist of multiple layers.
And XRP is trying to become part of that infrastructure.
What Happens If Tokenization Becomes a Trillion-Dollar Industry?
Now let's look at the bigger picture.
Traditional financial markets still face several major problems:
Slow settlement
Multiple intermediaries
Limited trading hours
Fragmented liquidity
High operational costs
Tokenization is attempting to solve some of these problems.
Imagine a future where assets can move instantly.
Where settlement takes seconds instead of days.
Where markets operate 24/7.
Where investors can access tokenized versions of traditional assets globally.
This is the direction financial technology appears to be moving toward.
And if blockchain infrastructure becomes deeply integrated into global finance, the networks facilitating those transactions could become increasingly valuable.
That does not automatically mean XRP will dominate.
But it does mean the opportunity is much larger than simply hoping for another speculative altcoin rally.
XRP's Biggest Strength: It Isn't a New Experiment
The crypto market launches new blockchains every year.
New narratives.
New promises.
New tokens.
But one advantage XRP and the XRP Ledger have is longevity.
The XRP Ledger has been operating for years.
Its ecosystem has focused heavily on financial use cases.
That matters.
Especially when talking about institutional adoption.
Large financial institutions do not typically want to build critical infrastructure on something that launched yesterday and could disappear tomorrow.
They look for:
Reliability.
Liquidity.
Regulatory compatibility.
Operational history.
This is where XRP's long history could become an important advantage.
The market often becomes obsessed with the newest project.
But institutions often care more about infrastructure that has survived multiple market cycles.
Market Analysis: Why XRP Could Still Have Explosive Potential
Crypto prices do not move purely because of utility.
Markets usually move because of three major forces:
1. Liquidity
2. Narrative
3. Supply and Demand Imbalance
XRP has potential exposure to all three.
1. Institutional Liquidity
ETFs and regulated investment products can introduce an entirely new category of buyers.
These buyers are different from short-term retail traders.
Institutional investors can create longer-term allocation strategies.
If capital continues flowing into XRP-related investment products, that could gradually create structural demand.
And structural demand is very different from temporary social media hype.
2. The Narrative Is Expanding
At one point, XRP was simply known as the:
“Bank Coin.”
But the narrative is becoming much broader.
Now the XRP ecosystem is increasingly connected to discussions around:
Tokenization
Stablecoins
Institutional DeFi
Digital capital markets
Cross-border liquidity
Regulated blockchain finance
The bigger the narrative becomes, the larger the potential investor base can become.
And in crypto, narrative expansion often attracts capital long before the fundamentals are fully understood by the broader market.
3. Supply Dynamics
One of the most interesting things in crypto happens when long-term holders refuse to sell while new capital continues entering the market.
Available liquidity can become increasingly limited.
When strong demand meets limited liquid supply, price movements can become extremely aggressive.
This is not guaranteed.
But history has shown us many times:
Strong demand + limited liquid supply = violent repricing.
And if institutional demand continues growing while long-term holders remain committed, XRP could eventually experience periods of significant price volatility.
Could XRP Really Create a Massive Wealth Transfer?
Possibly.
But I don't view it as a guaranteed outcome.
I view it as an asymmetric possibility.
There are risks.
There is competition.
There is regulatory uncertainty in different regions.
There are broader market risks.
But if XRP becomes a meaningful component of the emerging blockchain-based financial system, today's skepticism could eventually look very different in hindsight.
Because major wealth transfers often happen before the majority understands what is changing.
By the time the narrative becomes obvious to everyone, early positioning opportunities may already be gone.
In 2017, many people bought XRP for a crypto rally.
In the next major financial cycle, some investors may be buying XRP because they believe in the future of digital financial infrastructure.
And that is a very different thesis.
But XRP Holders Need to Understand One Hard Truth
I like bullish narratives.
But I do not believe in blind bullishness.
XRP still faces major challenges.
⚠️ Competition
Ethereum, Solana, private banking blockchains, stablecoin networks, and other institutional platforms are all competing for a share of the tokenized financial economy.
⚠️ Adoption Does Not Automatically Equal Price Appreciation
This is extremely important.
Even if XRP Ledger adoption grows, that does not mathematically guarantee that XRP's price will increase proportionally.
Investors should understand the difference between network adoption and token value capture.
⚠️ Macro Risk
If Bitcoin experiences a major correction, XRP will not be completely immune from market-wide selling pressure.
⚠️ Expectations Can Become Overpriced
If the market becomes excessively bullish, even positive news can result in a “sell the news” reaction.
That is why risk management remains essential.
Narratives alone are not enough.
My Personal Market Perspective
I no longer look at XRP as just another altcoin.
I see it as a potential high-conviction infrastructure bet — but one that still carries substantial risk.
The metrics I will continue watching include:
📌 XRP ETF inflows
📌 Institutional holdings
📌 XRP Ledger tokenization growth
📌 RLUSD adoption
📌 Cross-border payment expansion
📌 Regulatory developments
📌 On-chain liquidity
📌 Overall crypto market direction
If these metrics continue improving over the coming months and years, XRP could experience a significant structural re-rating.
And that re-rating could potentially be much larger than many people currently expect.
Final Thoughts
The biggest wealth is often created when you see a transformation before the majority fully understands it.
In 2017, we witnessed the explosion of retail speculation.
Today, we are watching something different.
Institutions entering crypto
ETFs expanding market access
Stablecoins becoming part of mainstream finance
Real-world assets moving on-chain
Traditional exchanges exploring tokenization
Digital capital markets beginning to develop
The biggest question is not whether blockchain will continue evolving.
It already is.
The real question is:
Where will XRP stand if blockchain-based financial infrastructure becomes a major part of the global economy?
I don't know exactly where XRP will trade tomorrow.
Nobody does.
But I do know this:
If blockchain-based finance eventually becomes deeply integrated into the global financial system, many people may look back and realize that the transformation was happening right in front of them.
And perhaps, when that moment comes, 2017 really will look like nothing more than a test run.
$XRP holders, stay ready. 👀
Because the next major wealth transfer may not begin with a chart.
Sometimes...
It begins with a transformation in infrastructure.
{spot}(XRPUSDT)
#XRPRises40%InTwoWeeksAsOpenInterestFalls #xrp #Xrp🔥🔥 #Binance #BinanceSquareTalks
XRP: A Wealth Transfer So Massive, It Could Make 2017 Look Like a Test Run 👀
Some of you are about to witness a wealth transfer so massive, it’ll make 2017 look like a test run.
And in my view, this is not just another crypto hype statement.
Because the $XRP narrative in 2026 is starting to look very different from previous bull markets.
Back in 2017, most people bought XRP for one primary reason:
Speculation.
Today, the conversation is slowly changing.
Now we are talking about:
Institutional capital
Spot XRP ETFs
Real-world asset tokenization
Stablecoin liquidity
Cross-border settlement
Regulated digital finance
The expanding financial infrastructure around the XRP Ledger
So the real question is no longer:
“Will XRP pump?”
The bigger question is:
If traditional finance continues moving toward blockchain-based infrastructure, could XRP become one of the important assets within that new financial ecosystem?
In my opinion, this is where the real story begins.
2017 Was the Year of Speculation. This Time Could Be About Infrastructure.
The 2017 crypto bull market was largely driven by retail speculation.
People were buying almost anything with a ticker.
ICOs were exploding.
New tokens were launching every day.
Many projects had limited real-world utility, yet prices were rising at extraordinary speeds.
XRP was also part of that speculative mania.
But today's landscape is very different.
Wall Street is now actively exploring blockchain technology.
Tokenized Treasuries are growing.
Stablecoin regulation is becoming increasingly important.
Traditional financial institutions are beginning to experiment with tokenized assets, digital settlement, and 24/7 markets.
This is where the XRP story becomes particularly interesting.
Because the $XRP Ledger was built with financial use cases in mind from the beginning.
Payments.
Settlement.
Liquidity.
Cross-border value transfer.
And increasingly, tokenization.
Institutional Money Is Slowly Entering the XRP Conversation
One of the biggest changes in the XRP landscape is institutional accessibility.
For years, regulatory uncertainty kept many institutional investors on the sidelines.
But as the regulatory environment evolved, XRP became increasingly accessible through regulated investment products.
This matters.
Because there is a major difference between retail traders buying XRP because they expect a quick pump and institutional investors gaining exposure through structured investment vehicles.
Institutions typically evaluate:
Liquidity
Regulation
Custody
Market infrastructure
Portfolio diversification
Long-term investment potential
If institutional demand continues to grow over time, XRP's supply-demand dynamics could begin to change.
And that is something long-term investors should not ignore.
But ETFs May Not Be the Biggest Story
In my opinion, ETFs are not necessarily the biggest part of the XRP thesis.
They are simply the gateway.
The bigger question is:
How large could blockchain-based financial infrastructure eventually become?
The world is gradually moving toward tokenization.
Assets that are beginning to move on-chain include:
U.S. Treasuries
Money market funds
Private credit
Real estate
Bonds
Equities
Collateral
Other real-world assets
This new financial system will require several things:
Faster settlement
24/7 liquidity
Regulated stablecoins
Tokenized assets
Interoperable networks
Efficient cross-border value transfer
And this is where the XRP Ledger is attempting to position itself.
The future financial system may not look like the one we have today.
Settlement could become faster.
Markets could become more global.
Assets could become programmable.
And blockchain infrastructure could eventually become a hidden layer beneath traditional finance.
If the XRP Ledger captures even a meaningful portion of this growing ecosystem, the valuation narrative around XRP could look very different from previous market cycles.
RLUSD Could Be an Important Part of the Bigger Ecosystem
Many XRP holders misunderstand one thing.
They assume that the growth of stablecoins like RLUSD automatically reduces the need for XRP.
I don't see it that simply.
Stablecoins and XRP can serve different purposes.
A stablecoin is primarily designed to maintain a stable value.
XRP, on the other hand, is a native digital asset designed for liquidity and value transfer across the XRP Ledger ecosystem.
In a larger institutional ecosystem, different assets can serve different functions.
Stablecoins can provide stable settlement liquidity.
Tokenized assets can represent real-world value.
And native digital assets can potentially facilitate liquidity movement across networks.
The important point is this:
The future financial ecosystem is unlikely to be built around just one type of digital asset.
It will likely consist of multiple layers.
And XRP is trying to become part of that infrastructure.
What Happens If Tokenization Becomes a Trillion-Dollar Industry?
Now let's look at the bigger picture.
Traditional financial markets still face several major problems:
Slow settlement
Multiple intermediaries
Limited trading hours
Fragmented liquidity
High operational costs
Tokenization is attempting to solve some of these problems.
Imagine a future where assets can move instantly.
Where settlement takes seconds instead of days.
Where markets operate 24/7.
Where investors can access tokenized versions of traditional assets globally.
This is the direction financial technology appears to be moving toward.
And if blockchain infrastructure becomes deeply integrated into global finance, the networks facilitating those transactions could become increasingly valuable.
That does not automatically mean XRP will dominate.
But it does mean the opportunity is much larger than simply hoping for another speculative altcoin rally.
XRP's Biggest Strength: It Isn't a New Experiment
The crypto market launches new blockchains every year.
New narratives.
New promises.
New tokens.
But one advantage XRP and the XRP Ledger have is longevity.
The XRP Ledger has been operating for years.
Its ecosystem has focused heavily on financial use cases.
That matters.
Especially when talking about institutional adoption.
Large financial institutions do not typically want to build critical infrastructure on something that launched yesterday and could disappear tomorrow.
They look for:
Reliability.
Liquidity.
Regulatory compatibility.
Operational history.
This is where XRP's long history could become an important advantage.
The market often becomes obsessed with the newest project.
But institutions often care more about infrastructure that has survived multiple market cycles.
Market Analysis: Why XRP Could Still Have Explosive Potential
Crypto prices do not move purely because of utility.
Markets usually move because of three major forces:
1. Liquidity
2. Narrative
3. Supply and Demand Imbalance
XRP has potential exposure to all three.
1. Institutional Liquidity
ETFs and regulated investment products can introduce an entirely new category of buyers.
These buyers are different from short-term retail traders.
Institutional investors can create longer-term allocation strategies.
If capital continues flowing into XRP-related investment products, that could gradually create structural demand.
And structural demand is very different from temporary social media hype.
2. The Narrative Is Expanding
At one point, XRP was simply known as the:
“Bank Coin.”
But the narrative is becoming much broader.
Now the XRP ecosystem is increasingly connected to discussions around:
Tokenization
Stablecoins
Institutional DeFi
Digital capital markets
Cross-border liquidity
Regulated blockchain finance
The bigger the narrative becomes, the larger the potential investor base can become.
And in crypto, narrative expansion often attracts capital long before the fundamentals are fully understood by the broader market.
3. Supply Dynamics
One of the most interesting things in crypto happens when long-term holders refuse to sell while new capital continues entering the market.
Available liquidity can become increasingly limited.
When strong demand meets limited liquid supply, price movements can become extremely aggressive.
This is not guaranteed.
But history has shown us many times:
Strong demand + limited liquid supply = violent repricing.
And if institutional demand continues growing while long-term holders remain committed, XRP could eventually experience periods of significant price volatility.
Could XRP Really Create a Massive Wealth Transfer?
Possibly.
But I don't view it as a guaranteed outcome.
I view it as an asymmetric possibility.
There are risks.
There is competition.
There is regulatory uncertainty in different regions.
There are broader market risks.
But if XRP becomes a meaningful component of the emerging blockchain-based financial system, today's skepticism could eventually look very different in hindsight.
Because major wealth transfers often happen before the majority understands what is changing.
By the time the narrative becomes obvious to everyone, early positioning opportunities may already be gone.
In 2017, many people bought XRP for a crypto rally.
In the next major financial cycle, some investors may be buying XRP because they believe in the future of digital financial infrastructure.
And that is a very different thesis.
But XRP Holders Need to Understand One Hard Truth
I like bullish narratives.
But I do not believe in blind bullishness.
XRP still faces major challenges.
⚠️ Competition
Ethereum, Solana, private banking blockchains, stablecoin networks, and other institutional platforms are all competing for a share of the tokenized financial economy.
⚠️ Adoption Does Not Automatically Equal Price Appreciation
This is extremely important.
Even if XRP Ledger adoption grows, that does not mathematically guarantee that XRP's price will increase proportionally.
Investors should understand the difference between network adoption and token value capture.
⚠️ Macro Risk
If Bitcoin experiences a major correction, XRP will not be completely immune from market-wide selling pressure.
⚠️ Expectations Can Become Overpriced
If the market becomes excessively bullish, even positive news can result in a “sell the news” reaction.
That is why risk management remains essential.
Narratives alone are not enough.
My Personal Market Perspective
I no longer look at XRP as just another altcoin.
I see it as a potential high-conviction infrastructure bet — but one that still carries substantial risk.
The metrics I will continue watching include:
📌 XRP ETF inflows
📌 Institutional holdings
📌 XRP Ledger tokenization growth
📌 RLUSD adoption
📌 Cross-border payment expansion
📌 Regulatory developments
📌 On-chain liquidity
📌 Overall crypto market direction
If these metrics continue improving over the coming months and years, XRP could experience a significant structural re-rating.
And that re-rating could potentially be much larger than many people currently expect.
Final Thoughts
The biggest wealth is often created when you see a transformation before the majority fully understands it.
In 2017, we witnessed the explosion of retail speculation.
Today, we are watching something different.
Institutions entering crypto
ETFs expanding market access
Stablecoins becoming part of mainstream finance
Real-world assets moving on-chain
Traditional exchanges exploring tokenization
Digital capital markets beginning to develop
The biggest question is not whether blockchain will continue evolving.
It already is.
The real question is:
Where will XRP stand if blockchain-based financial infrastructure becomes a major part of the global economy?
I don't know exactly where XRP will trade tomorrow.
Nobody does.
But I do know this:
If blockchain-based finance eventually becomes deeply integrated into the global financial system, many people may look back and realize that the transformation was happening right in front of them.
And perhaps, when that moment comes, 2017 really will look like nothing more than a test run.
$XRP holders, stay ready. 👀
Because the next major wealth transfer may not begin with a chart.
Sometimes...
It begins with a transformation in infrastructure.
#XRPRises40%InTwoWeeksAsOpenInterestFalls #xrp #Xrp🔥🔥 #Binance #BinanceSquareTalks
And in my view, this is not just another crypto hype statement.
Because the $XRP narrative in 2026 is starting to look very different from previous bull markets.
Back in 2017, most people bought XRP for one primary reason:
Speculation.
Today, the conversation is slowly changing.
Now we are talking about:
Institutional capital
Spot XRP ETFs
Real-world asset tokenization
Stablecoin liquidity
Cross-border settlement
Regulated digital finance
The expanding financial infrastructure around the XRP Ledger
So the real question is no longer:
“Will XRP pump?”
The bigger question is:
If traditional finance continues moving toward blockchain-based infrastructure, could XRP become one of the important assets within that new financial ecosystem?
In my opinion, this is where the real story begins.
2017 Was the Year of Speculation. This Time Could Be About Infrastructure.
The 2017 crypto bull market was largely driven by retail speculation.
People were buying almost anything with a ticker.
ICOs were exploding.
New tokens were launching every day.
Many projects had limited real-world utility, yet prices were rising at extraordinary speeds.
XRP was also part of that speculative mania.
But today's landscape is very different.
Wall Street is now actively exploring blockchain technology.
Tokenized Treasuries are growing.
Stablecoin regulation is becoming increasingly important.
Traditional financial institutions are beginning to experiment with tokenized assets, digital settlement, and 24/7 markets.
This is where the XRP story becomes particularly interesting.
Because the $XRP Ledger was built with financial use cases in mind from the beginning.
Payments.
Settlement.
Liquidity.
Cross-border value transfer.
And increasingly, tokenization.
Institutional Money Is Slowly Entering the XRP Conversation
One of the biggest changes in the XRP landscape is institutional accessibility.
For years, regulatory uncertainty kept many institutional investors on the sidelines.
But as the regulatory environment evolved, XRP became increasingly accessible through regulated investment products.
This matters.
Because there is a major difference between retail traders buying XRP because they expect a quick pump and institutional investors gaining exposure through structured investment vehicles.
Institutions typically evaluate:
Liquidity
Regulation
Custody
Market infrastructure
Portfolio diversification
Long-term investment potential
If institutional demand continues to grow over time, XRP's supply-demand dynamics could begin to change.
And that is something long-term investors should not ignore.
But ETFs May Not Be the Biggest Story
In my opinion, ETFs are not necessarily the biggest part of the XRP thesis.
They are simply the gateway.
The bigger question is:
How large could blockchain-based financial infrastructure eventually become?
The world is gradually moving toward tokenization.
Assets that are beginning to move on-chain include:
U.S. Treasuries
Money market funds
Private credit
Real estate
Bonds
Equities
Collateral
Other real-world assets
This new financial system will require several things:
Faster settlement
24/7 liquidity
Regulated stablecoins
Tokenized assets
Interoperable networks
Efficient cross-border value transfer
And this is where the XRP Ledger is attempting to position itself.
The future financial system may not look like the one we have today.
Settlement could become faster.
Markets could become more global.
Assets could become programmable.
And blockchain infrastructure could eventually become a hidden layer beneath traditional finance.
If the XRP Ledger captures even a meaningful portion of this growing ecosystem, the valuation narrative around XRP could look very different from previous market cycles.
RLUSD Could Be an Important Part of the Bigger Ecosystem
Many XRP holders misunderstand one thing.
They assume that the growth of stablecoins like RLUSD automatically reduces the need for XRP.
I don't see it that simply.
Stablecoins and XRP can serve different purposes.
A stablecoin is primarily designed to maintain a stable value.
XRP, on the other hand, is a native digital asset designed for liquidity and value transfer across the XRP Ledger ecosystem.
In a larger institutional ecosystem, different assets can serve different functions.
Stablecoins can provide stable settlement liquidity.
Tokenized assets can represent real-world value.
And native digital assets can potentially facilitate liquidity movement across networks.
The important point is this:
The future financial ecosystem is unlikely to be built around just one type of digital asset.
It will likely consist of multiple layers.
And XRP is trying to become part of that infrastructure.
What Happens If Tokenization Becomes a Trillion-Dollar Industry?
Now let's look at the bigger picture.
Traditional financial markets still face several major problems:
Slow settlement
Multiple intermediaries
Limited trading hours
Fragmented liquidity
High operational costs
Tokenization is attempting to solve some of these problems.
Imagine a future where assets can move instantly.
Where settlement takes seconds instead of days.
Where markets operate 24/7.
Where investors can access tokenized versions of traditional assets globally.
This is the direction financial technology appears to be moving toward.
And if blockchain infrastructure becomes deeply integrated into global finance, the networks facilitating those transactions could become increasingly valuable.
That does not automatically mean XRP will dominate.
But it does mean the opportunity is much larger than simply hoping for another speculative altcoin rally.
XRP's Biggest Strength: It Isn't a New Experiment
The crypto market launches new blockchains every year.
New narratives.
New promises.
New tokens.
But one advantage XRP and the XRP Ledger have is longevity.
The XRP Ledger has been operating for years.
Its ecosystem has focused heavily on financial use cases.
That matters.
Especially when talking about institutional adoption.
Large financial institutions do not typically want to build critical infrastructure on something that launched yesterday and could disappear tomorrow.
They look for:
Reliability.
Liquidity.
Regulatory compatibility.
Operational history.
This is where XRP's long history could become an important advantage.
The market often becomes obsessed with the newest project.
But institutions often care more about infrastructure that has survived multiple market cycles.
Market Analysis: Why XRP Could Still Have Explosive Potential
Crypto prices do not move purely because of utility.
Markets usually move because of three major forces:
1. Liquidity
2. Narrative
3. Supply and Demand Imbalance
XRP has potential exposure to all three.
1. Institutional Liquidity
ETFs and regulated investment products can introduce an entirely new category of buyers.
These buyers are different from short-term retail traders.
Institutional investors can create longer-term allocation strategies.
If capital continues flowing into XRP-related investment products, that could gradually create structural demand.
And structural demand is very different from temporary social media hype.
2. The Narrative Is Expanding
At one point, XRP was simply known as the:
“Bank Coin.”
But the narrative is becoming much broader.
Now the XRP ecosystem is increasingly connected to discussions around:
Tokenization
Stablecoins
Institutional DeFi
Digital capital markets
Cross-border liquidity
Regulated blockchain finance
The bigger the narrative becomes, the larger the potential investor base can become.
And in crypto, narrative expansion often attracts capital long before the fundamentals are fully understood by the broader market.
3. Supply Dynamics
One of the most interesting things in crypto happens when long-term holders refuse to sell while new capital continues entering the market.
Available liquidity can become increasingly limited.
When strong demand meets limited liquid supply, price movements can become extremely aggressive.
This is not guaranteed.
But history has shown us many times:
Strong demand + limited liquid supply = violent repricing.
And if institutional demand continues growing while long-term holders remain committed, XRP could eventually experience periods of significant price volatility.
Could XRP Really Create a Massive Wealth Transfer?
Possibly.
But I don't view it as a guaranteed outcome.
I view it as an asymmetric possibility.
There are risks.
There is competition.
There is regulatory uncertainty in different regions.
There are broader market risks.
But if XRP becomes a meaningful component of the emerging blockchain-based financial system, today's skepticism could eventually look very different in hindsight.
Because major wealth transfers often happen before the majority understands what is changing.
By the time the narrative becomes obvious to everyone, early positioning opportunities may already be gone.
In 2017, many people bought XRP for a crypto rally.
In the next major financial cycle, some investors may be buying XRP because they believe in the future of digital financial infrastructure.
And that is a very different thesis.
But XRP Holders Need to Understand One Hard Truth
I like bullish narratives.
But I do not believe in blind bullishness.
XRP still faces major challenges.
⚠️ Competition
Ethereum, Solana, private banking blockchains, stablecoin networks, and other institutional platforms are all competing for a share of the tokenized financial economy.
⚠️ Adoption Does Not Automatically Equal Price Appreciation
This is extremely important.
Even if XRP Ledger adoption grows, that does not mathematically guarantee that XRP's price will increase proportionally.
Investors should understand the difference between network adoption and token value capture.
⚠️ Macro Risk
If Bitcoin experiences a major correction, XRP will not be completely immune from market-wide selling pressure.
⚠️ Expectations Can Become Overpriced
If the market becomes excessively bullish, even positive news can result in a “sell the news” reaction.
That is why risk management remains essential.
Narratives alone are not enough.
My Personal Market Perspective
I no longer look at XRP as just another altcoin.
I see it as a potential high-conviction infrastructure bet — but one that still carries substantial risk.
The metrics I will continue watching include:
📌 XRP ETF inflows
📌 Institutional holdings
📌 XRP Ledger tokenization growth
📌 RLUSD adoption
📌 Cross-border payment expansion
📌 Regulatory developments
📌 On-chain liquidity
📌 Overall crypto market direction
If these metrics continue improving over the coming months and years, XRP could experience a significant structural re-rating.
And that re-rating could potentially be much larger than many people currently expect.
Final Thoughts
The biggest wealth is often created when you see a transformation before the majority fully understands it.
In 2017, we witnessed the explosion of retail speculation.
Today, we are watching something different.
Institutions entering crypto
ETFs expanding market access
Stablecoins becoming part of mainstream finance
Real-world assets moving on-chain
Traditional exchanges exploring tokenization
Digital capital markets beginning to develop
The biggest question is not whether blockchain will continue evolving.
It already is.
The real question is:
Where will XRP stand if blockchain-based financial infrastructure becomes a major part of the global economy?
I don't know exactly where XRP will trade tomorrow.
Nobody does.
But I do know this:
If blockchain-based finance eventually becomes deeply integrated into the global financial system, many people may look back and realize that the transformation was happening right in front of them.
And perhaps, when that moment comes, 2017 really will look like nothing more than a test run.
$XRP holders, stay ready. 👀
Because the next major wealth transfer may not begin with a chart.
Sometimes...
It begins with a transformation in infrastructure.
#XRPRises40%InTwoWeeksAsOpenInterestFalls #xrp #Xrp🔥🔥 #Binance #BinanceSquareTalks
1
103
·
--
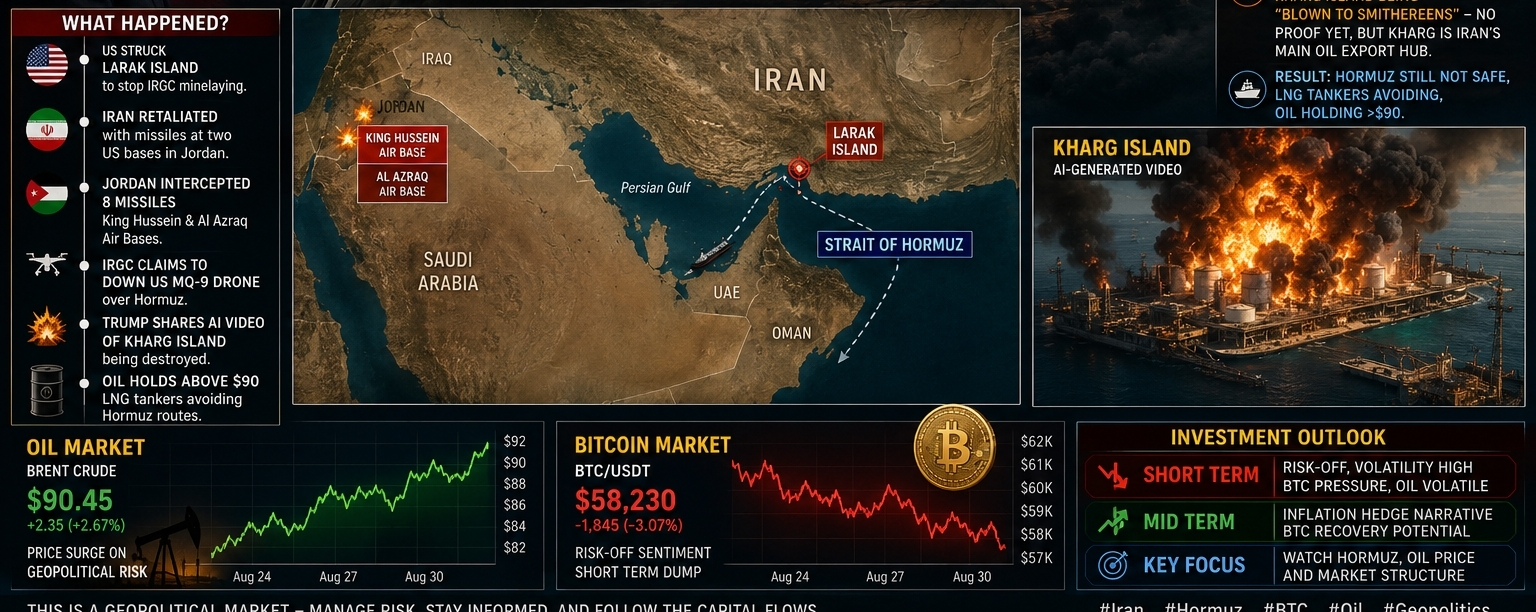
Article
🚨 BREAKING: Iran Strikes US Bases in Jordan — Hormuz Crisis Returns, Oil Above $90 and Bitcoin FaceThe geopolitical situation in the Middle East is heating up rapidly once again.
After a relatively calmer period, tensions between the United States and Iran have entered a new phase of direct military escalation. Following a reported US strike on Iran's strategically important Larak Island, Iran retaliated by claiming missile attacks on US military installations in Jordan.
Now, the entire market is watching one place:
The Strait of Hormuz.
Because this is no longer just a military conflict zone.
It is one of the most important energy chokepoints in the world.
And whenever Hormuz comes under serious threat, the impact spreads directly across:
🛢️ The Oil Market
🌍 Global Inflation
📉 Stock Markets
₿ Bitcoin and Crypto
🏦 Central Bank Policy
📊 The Entire Risk-Asset Market
For me, the most important thing about the current situation is this:
This is no longer just an Iran vs US geopolitical headline. It is becoming a global macro trade.
🇺🇸 What Happened on Larak Island?
According to recent reports, US forces struck Iranian military launch positions on Larak Island, located near the Strait of Hormuz.
The United States reportedly claimed that these positions were connected to activities that could threaten international shipping routes through Hormuz, particularly amid concerns about potential naval mine deployment.
This is important because Larak Island sits in an extremely strategic location.
Any military activity near Hormuz can directly affect international shipping and global energy security.
Following the US strike, Iran's Islamic Revolutionary Guard Corps, or IRGC, quickly announced retaliatory action.
🚀 Iran's Retaliation: US Bases in Jordan Targeted
The situation escalated rapidly afterward.
Iran claimed that it targeted two US military facilities in Jordan:
King Hussein Air Base
Al Azraq Air Base
The IRGC described the operation as:
"Punishment of the Aggressor."
Iran stated that the attacks were retaliation for the Larak Island strike.
Jordanian military sources reported that their air-defense systems intercepted eight missiles entering or threatening Jordanian airspace.
The most important point here is that Iran is sending a broader military and political message.
US military assets and regional partners may no longer be outside the immediate escalation zone.
However, reports regarding the exact damage and battlefield impact remain subject to conflicting claims and independent verification.
🛩️ Iran Claims to Down a US MQ-9 Drone
The situation became even more complicated after the IRGC claimed that it had shot down a US MQ-9 drone over the Strait of Hormuz.
The claim originated from Iranian sources, and full independent verification remains limited.
But from a market perspective, one thing matters:
If both the airspace and sea routes around Hormuz become active zones of military confrontation, the risk to global shipping could increase dramatically.
And that is currently one of the biggest concerns in the energy market.
🔥 Trump and Kharg Island: Real Attack or AI Video?
The situation became even more dramatic after Donald Trump reportedly shared an AI-generated video showing Iran's strategically important Kharg Island being destroyed in massive explosions.
The video suggested that Kharg Island was being "blown to smithereens."
However, one critical point remains:
There has been no independently verified evidence confirming an actual attack on Kharg Island.
This distinction is extremely important for the market.
Kharg Island is not just another island.
It is one of Iran's most important oil export hubs.
If Iranian energy infrastructure at Kharg were ever directly targeted in a confirmed military strike, the conflict could enter an entirely new economic dimension.
At that point, the market would not simply be pricing a possible disruption in Hormuz.
It would begin pricing:
Direct destruction of Iranian oil-export infrastructure.
And that could significantly increase global energy supply risk.
🛢️ OIL MARKET: Why Is Brent Holding Above $90?
The most immediate winner of the current geopolitical escalation has been Oil.
Brent crude has pushed back above the $90 per barrel region as markets price in the possibility of renewed supply disruption.
The market is currently following a simple equation:
Hormuz Risk ↑ = Oil Supply Risk ↑
The Strait of Hormuz is one of the world's most important energy shipping corridors.
If tanker traffic declines, insurance costs rise, or shipping companies begin avoiding the area due to security concerns, the market can quickly add a significant geopolitical risk premium to crude prices.
And this can happen even before a major physical supply disruption actually occurs.
That is exactly what makes the current situation so important.
📈 Investment Analysis: Is Oil Still Bullish?
In my view, there are two major scenarios for Oil from here.
Scenario 1: The Conflict De-escalates Quickly
If the United States and Iran avoid further major military escalation and shipping activity through Hormuz gradually normalizes, part of the current geopolitical premium could disappear.
That could create the following pattern:
Oil Spike → De-escalation → Price Correction
In this scenario, sustaining prices significantly above $90 could become difficult.
Scenario 2: Hormuz Disruption Continues
This is the more bullish scenario for Oil.
If we see:
Additional tanker incidents
Increased mine threats
More military confrontation near Hormuz
Prolonged reductions in shipping activity
Direct attacks on Iranian energy infrastructure
Then Oil may not simply experience a temporary geopolitical spike.
Instead, the market could enter an entirely new supply-risk environment.
For investors, one of the most important questions is now:
Can Brent establish a sustained price floor above $90?
Because there is a major difference between a temporary geopolitical spike and a structural supply shock.
₿ BITCOIN: Dump First, Opportunity Later?
Now let's move to the most interesting part of this entire situation:
Bitcoin.
The first market reaction to sudden geopolitical escalation is usually predictable.
Investors reduce risk.
They often:
Close leveraged positions
Sell altcoins
Reduce futures exposure
Move toward cash and traditional safe-haven assets
That means a short-term reaction of:
📉 BTC volatility or a sharp pullback
would not be surprising.
Especially if Oil continues moving higher and global equity markets begin facing pressure.
Because rising Oil prices create another major macro problem:
Inflation.
And higher inflation can make it more difficult for central banks to ease monetary policy.
The chain reaction looks like this:
Oil ↑
↓
Inflation Risk ↑
↓
Rate Cut Expectations ↓
↓
Pressure on Risk Assets ↑
This can be negative for Bitcoin in the short term.
But Bitcoin's Story May Not End There
From a medium-term perspective, the Bitcoin narrative could become very different.
Large geopolitical crises often create uncertainty around the global monetary system.
If the conflict continues and leads to:
Higher energy prices
Persistent inflation
Increased government spending
Larger fiscal deficits
Concerns about currency purchasing power
Investors may begin looking for alternative stores of value.
That is where assets such as:
🥇 Gold
₿ Bitcoin
🛢️ Commodities
can become increasingly important.
However, there is one major difference.
Gold often receives the immediate safe-haven reaction.
Bitcoin, on the other hand, can initially behave like a risk asset.
It may sell off first.
But if global liquidity conditions and the macro narrative begin changing, Bitcoin can later recover strongly and develop a powerful monetary hedge narrative.
That is why my current thesis is:
Short-Term: Risk-Off → $BTC Weakness Possible 📉
But:
Medium-Term: Monetary Uncertainty + Inflation Hedge Narrative → BTC Bullish Potential 📈
Both scenarios can happen.
And investors need to understand that these two views are not contradictory.
🧠 My Investment Strategy: Don't Panic, Watch the Data
The biggest mistake investors can make right now is trading emotionally based on headlines.
If someone sees:
"Iran attacked US bases"
and immediately opens an aggressive Bitcoin short position, they may be entering late.
At the same time, if someone sees:
"Oil is above $90"
and blindly buys at the top, that also carries significant risk.
This market is extremely headline-driven.
One new military attack could push prices higher.
One ceasefire statement could trigger a sharp reversal.
One diplomatic announcement could completely change market sentiment.
That is why I believe investors should focus on three major indicators.
🔍 1. Strait of Hormuz Shipping Activity
This is currently the most important indicator.
Do not simply watch war headlines.
Watch the actual market data:
Is tanker traffic increasing or decreasing?
Are shipping insurance costs rising?
Are commercial vessels changing routes?
Are there new mine-related incidents?
If shipping disruption continues for an extended period:
Bullish pressure on Oil could remain strong.
🔍 2. Can Brent Sustain Above $90?
For Oil, simply touching $90 is not the key question.
The bigger question is:
Can the market build a new price floor above $90?
If it can, inflation expectations could begin changing again.
And that could create significant macro pressure on equities and cryptocurrencies.
🔍 3. Can Bitcoin Hold Its Market Structure During Fear?
For Bitcoin, I am not just watching headlines.
I am watching market structure.
If BTC experiences a geopolitical panic sell-off but manages to hold key support levels, that could actually become a signal of underlying strength.
Because it would show:
Bad news arrived, but sellers still failed to take full control of the market.
This type of structure can sometimes become the foundation for a major recovery.
🏦 Gold vs Oil vs Bitcoin — Which Narrative Wins?
The current geopolitical situation creates an interesting relationship between three major assets.
🥇 GOLD
The most traditional safe-haven asset.
If geopolitical uncertainty continues increasing:
Gold could receive immediate defensive demand.
🛢️ OIL
The most direct beneficiary of the current crisis.
Hormuz disruption directly creates supply risk.
That makes Oil one of the strongest short-term geopolitical trades.
₿ BITCOIN
The most interesting—and the most volatile—asset in this situation.
Short-Term:
Risk Asset
Medium-Term:
Alternative Monetary Hedge
And that is where Bitcoin's opportunity could emerge.
📊 My Current Market View
This is how I see the situation right now.
SHORT TERM
🛢️ Oil$BZ → Bullish Volatility
📉 Bitcoin → Risk-Off Pressure Possible
📉 Altcoins → Highest Volatility Risk
🥇 Gold → Potential Safe-Haven Demand
MEDIUM TERM
If the conflict continues:
🛢️ Oil$CL → Higher Geopolitical Premium
🔥 Inflation → Returns as a Major Concern
🏦 Central Banks → More Difficult Policy Environment
📉 Traditional Equities → Increased Pressure
₿ Bitcoin → Potential Recovery as an Inflation and Monetary Hedge
⚠️ What Is the Biggest Risk?
In my view, the biggest risk is not simply another military headline.
The biggest risk is:
Uncontrolled Escalation Around the Strait of Hormuz.
Because one major mistake...
One tanker incident...
One serious disruption...
Or one verified attack on a major energy hub such as Kharg Island...
Could completely change how global markets price energy risk.
At that point, $90 Oil would no longer be just another headline.
The market could begin pricing a much larger supply shock.
🧨 Final Thoughts
Today's situation reminds us of something extremely important:
The Crypto market is no longer isolated from the global economy.
Bitcoin cannot be analyzed by looking only at charts anymore.
Today's BTC investor also needs to watch:
Middle East conflict
Oil prices
Inflation expectations
Bond yields
Central bank policy
Global liquidity
The latest escalation between Iran and the United States has once again placed the Strait of Hormuz at the center of global markets.
Oil has already reacted strongly above the $90 region.
And Bitcoin is now facing another major market test.
The first reaction could be fear.
The second reaction could be opportunity.
My personal market view remains clear:
This is not the time to panic over headlines.
This is the time to closely monitor Oil and the Strait of Hormuz.
And if Bitcoin weakens significantly because of geopolitical fear while holding important structural support zones, that weakness could eventually become a potential accumulation opportunity rather than a reason for blind panic.
History has repeatedly shown us something important:
During periods of uncertainty, everyone looks for safety.
But some of the biggest investment opportunities are often created when the majority of the market is focused only on fear.
Don't just follow the war headlines. Follow the capital flows.
Watch Oil. Watch Hormuz. Watch Bitcoin.
Because over the coming days, these three markets may tell the same story.
#Iran #Hormuz #BTC #oil #IranStrikesUSBasesInJordan
{spot}(BTCUSDT)
{future}(CLUSDT)
{future}(BZUSDT)
🚨 BREAKING: Iran Strikes US Bases in Jordan — Hormuz Crisis Returns, Oil Above $90 and Bitcoin Face
The geopolitical situation in the Middle East is heating up rapidly once again.
After a relatively calmer period, tensions between the United States and Iran have entered a new phase of direct military escalation. Following a reported US strike on Iran's strategically important Larak Island, Iran retaliated by claiming missile attacks on US military installations in Jordan.
Now, the entire market is watching one place:
The Strait of Hormuz.
Because this is no longer just a military conflict zone.
It is one of the most important energy chokepoints in the world.
And whenever Hormuz comes under serious threat, the impact spreads directly across:
🛢️ The Oil Market
🌍 Global Inflation
📉 Stock Markets
₿ Bitcoin and Crypto
🏦 Central Bank Policy
📊 The Entire Risk-Asset Market
For me, the most important thing about the current situation is this:
This is no longer just an Iran vs US geopolitical headline. It is becoming a global macro trade.
🇺🇸 What Happened on Larak Island?
According to recent reports, US forces struck Iranian military launch positions on Larak Island, located near the Strait of Hormuz.
The United States reportedly claimed that these positions were connected to activities that could threaten international shipping routes through Hormuz, particularly amid concerns about potential naval mine deployment.
This is important because Larak Island sits in an extremely strategic location.
Any military activity near Hormuz can directly affect international shipping and global energy security.
Following the US strike, Iran's Islamic Revolutionary Guard Corps, or IRGC, quickly announced retaliatory action.
🚀 Iran's Retaliation: US Bases in Jordan Targeted
The situation escalated rapidly afterward.
Iran claimed that it targeted two US military facilities in Jordan:
King Hussein Air Base
Al Azraq Air Base
The IRGC described the operation as:
"Punishment of the Aggressor."
Iran stated that the attacks were retaliation for the Larak Island strike.
Jordanian military sources reported that their air-defense systems intercepted eight missiles entering or threatening Jordanian airspace.
The most important point here is that Iran is sending a broader military and political message.
US military assets and regional partners may no longer be outside the immediate escalation zone.
However, reports regarding the exact damage and battlefield impact remain subject to conflicting claims and independent verification.
🛩️ Iran Claims to Down a US MQ-9 Drone
The situation became even more complicated after the IRGC claimed that it had shot down a US MQ-9 drone over the Strait of Hormuz.
The claim originated from Iranian sources, and full independent verification remains limited.
But from a market perspective, one thing matters:
If both the airspace and sea routes around Hormuz become active zones of military confrontation, the risk to global shipping could increase dramatically.
And that is currently one of the biggest concerns in the energy market.
🔥 Trump and Kharg Island: Real Attack or AI Video?
The situation became even more dramatic after Donald Trump reportedly shared an AI-generated video showing Iran's strategically important Kharg Island being destroyed in massive explosions.
The video suggested that Kharg Island was being "blown to smithereens."
However, one critical point remains:
There has been no independently verified evidence confirming an actual attack on Kharg Island.
This distinction is extremely important for the market.
Kharg Island is not just another island.
It is one of Iran's most important oil export hubs.
If Iranian energy infrastructure at Kharg were ever directly targeted in a confirmed military strike, the conflict could enter an entirely new economic dimension.
At that point, the market would not simply be pricing a possible disruption in Hormuz.
It would begin pricing:
Direct destruction of Iranian oil-export infrastructure.
And that could significantly increase global energy supply risk.
🛢️ OIL MARKET: Why Is Brent Holding Above $90?
The most immediate winner of the current geopolitical escalation has been Oil.
Brent crude has pushed back above the $90 per barrel region as markets price in the possibility of renewed supply disruption.
The market is currently following a simple equation:
Hormuz Risk ↑ = Oil Supply Risk ↑
The Strait of Hormuz is one of the world's most important energy shipping corridors.
If tanker traffic declines, insurance costs rise, or shipping companies begin avoiding the area due to security concerns, the market can quickly add a significant geopolitical risk premium to crude prices.
And this can happen even before a major physical supply disruption actually occurs.
That is exactly what makes the current situation so important.
📈 Investment Analysis: Is Oil Still Bullish?
In my view, there are two major scenarios for Oil from here.
Scenario 1: The Conflict De-escalates Quickly
If the United States and Iran avoid further major military escalation and shipping activity through Hormuz gradually normalizes, part of the current geopolitical premium could disappear.
That could create the following pattern:
Oil Spike → De-escalation → Price Correction
In this scenario, sustaining prices significantly above $90 could become difficult.
Scenario 2: Hormuz Disruption Continues
This is the more bullish scenario for Oil.
If we see:
Additional tanker incidents
Increased mine threats
More military confrontation near Hormuz
Prolonged reductions in shipping activity
Direct attacks on Iranian energy infrastructure
Then Oil may not simply experience a temporary geopolitical spike.
Instead, the market could enter an entirely new supply-risk environment.
For investors, one of the most important questions is now:
Can Brent establish a sustained price floor above $90?
Because there is a major difference between a temporary geopolitical spike and a structural supply shock.
₿ BITCOIN: Dump First, Opportunity Later?
Now let's move to the most interesting part of this entire situation:
Bitcoin.
The first market reaction to sudden geopolitical escalation is usually predictable.
Investors reduce risk.
They often:
Close leveraged positions
Sell altcoins
Reduce futures exposure
Move toward cash and traditional safe-haven assets
That means a short-term reaction of:
📉 BTC volatility or a sharp pullback
would not be surprising.
Especially if Oil continues moving higher and global equity markets begin facing pressure.
Because rising Oil prices create another major macro problem:
Inflation.
And higher inflation can make it more difficult for central banks to ease monetary policy.
The chain reaction looks like this:
Oil ↑
↓
Inflation Risk ↑
↓
Rate Cut Expectations ↓
↓
Pressure on Risk Assets ↑
This can be negative for Bitcoin in the short term.
But Bitcoin's Story May Not End There
From a medium-term perspective, the Bitcoin narrative could become very different.
Large geopolitical crises often create uncertainty around the global monetary system.
If the conflict continues and leads to:
Higher energy prices
Persistent inflation
Increased government spending
Larger fiscal deficits
Concerns about currency purchasing power
Investors may begin looking for alternative stores of value.
That is where assets such as:
🥇 Gold
₿ Bitcoin
🛢️ Commodities
can become increasingly important.
However, there is one major difference.
Gold often receives the immediate safe-haven reaction.
Bitcoin, on the other hand, can initially behave like a risk asset.
It may sell off first.
But if global liquidity conditions and the macro narrative begin changing, Bitcoin can later recover strongly and develop a powerful monetary hedge narrative.
That is why my current thesis is:
Short-Term: Risk-Off → $BTC Weakness Possible 📉
But:
Medium-Term: Monetary Uncertainty + Inflation Hedge Narrative → BTC Bullish Potential 📈
Both scenarios can happen.
And investors need to understand that these two views are not contradictory.
🧠 My Investment Strategy: Don't Panic, Watch the Data
The biggest mistake investors can make right now is trading emotionally based on headlines.
If someone sees:
"Iran attacked US bases"
and immediately opens an aggressive Bitcoin short position, they may be entering late.
At the same time, if someone sees:
"Oil is above $90"
and blindly buys at the top, that also carries significant risk.
This market is extremely headline-driven.
One new military attack could push prices higher.
One ceasefire statement could trigger a sharp reversal.
One diplomatic announcement could completely change market sentiment.
That is why I believe investors should focus on three major indicators.
🔍 1. Strait of Hormuz Shipping Activity
This is currently the most important indicator.
Do not simply watch war headlines.
Watch the actual market data:
Is tanker traffic increasing or decreasing?
Are shipping insurance costs rising?
Are commercial vessels changing routes?
Are there new mine-related incidents?
If shipping disruption continues for an extended period:
Bullish pressure on Oil could remain strong.
🔍 2. Can Brent Sustain Above $90?
For Oil, simply touching $90 is not the key question.
The bigger question is:
Can the market build a new price floor above $90?
If it can, inflation expectations could begin changing again.
And that could create significant macro pressure on equities and cryptocurrencies.
🔍 3. Can Bitcoin Hold Its Market Structure During Fear?
For Bitcoin, I am not just watching headlines.
I am watching market structure.
If BTC experiences a geopolitical panic sell-off but manages to hold key support levels, that could actually become a signal of underlying strength.
Because it would show:
Bad news arrived, but sellers still failed to take full control of the market.
This type of structure can sometimes become the foundation for a major recovery.
🏦 Gold vs Oil vs Bitcoin — Which Narrative Wins?
The current geopolitical situation creates an interesting relationship between three major assets.
🥇 GOLD
The most traditional safe-haven asset.
If geopolitical uncertainty continues increasing:
Gold could receive immediate defensive demand.
🛢️ OIL
The most direct beneficiary of the current crisis.
Hormuz disruption directly creates supply risk.
That makes Oil one of the strongest short-term geopolitical trades.
₿ BITCOIN
The most interesting—and the most volatile—asset in this situation.
Short-Term:
Risk Asset
Medium-Term:
Alternative Monetary Hedge
And that is where Bitcoin's opportunity could emerge.
📊 My Current Market View
This is how I see the situation right now.
SHORT TERM
🛢️ Oil$BZ → Bullish Volatility
📉 Bitcoin → Risk-Off Pressure Possible
📉 Altcoins → Highest Volatility Risk
🥇 Gold → Potential Safe-Haven Demand
MEDIUM TERM
If the conflict continues:
🛢️ Oil$CL → Higher Geopolitical Premium
🔥 Inflation → Returns as a Major Concern
🏦 Central Banks → More Difficult Policy Environment
📉 Traditional Equities → Increased Pressure
₿ Bitcoin → Potential Recovery as an Inflation and Monetary Hedge
⚠️ What Is the Biggest Risk?
In my view, the biggest risk is not simply another military headline.
The biggest risk is:
Uncontrolled Escalation Around the Strait of Hormuz.
Because one major mistake...
One tanker incident...
One serious disruption...
Or one verified attack on a major energy hub such as Kharg Island...
Could completely change how global markets price energy risk.
At that point, $90 Oil would no longer be just another headline.
The market could begin pricing a much larger supply shock.
🧨 Final Thoughts
Today's situation reminds us of something extremely important:
The Crypto market is no longer isolated from the global economy.
Bitcoin cannot be analyzed by looking only at charts anymore.
Today's BTC investor also needs to watch:
Middle East conflict
Oil prices
Inflation expectations
Bond yields
Central bank policy
Global liquidity
The latest escalation between Iran and the United States has once again placed the Strait of Hormuz at the center of global markets.
Oil has already reacted strongly above the $90 region.
And Bitcoin is now facing another major market test.
The first reaction could be fear.
The second reaction could be opportunity.
My personal market view remains clear:
This is not the time to panic over headlines.
This is the time to closely monitor Oil and the Strait of Hormuz.
And if Bitcoin weakens significantly because of geopolitical fear while holding important structural support zones, that weakness could eventually become a potential accumulation opportunity rather than a reason for blind panic.
History has repeatedly shown us something important:
During periods of uncertainty, everyone looks for safety.
But some of the biggest investment opportunities are often created when the majority of the market is focused only on fear.
Don't just follow the war headlines. Follow the capital flows.
Watch Oil. Watch Hormuz. Watch Bitcoin.
Because over the coming days, these three markets may tell the same story.
#Iran #Hormuz #BTC #oil #IranStrikesUSBasesInJordan
After a relatively calmer period, tensions between the United States and Iran have entered a new phase of direct military escalation. Following a reported US strike on Iran's strategically important Larak Island, Iran retaliated by claiming missile attacks on US military installations in Jordan.
Now, the entire market is watching one place:
The Strait of Hormuz.
Because this is no longer just a military conflict zone.
It is one of the most important energy chokepoints in the world.
And whenever Hormuz comes under serious threat, the impact spreads directly across:
🛢️ The Oil Market
🌍 Global Inflation
📉 Stock Markets
₿ Bitcoin and Crypto
🏦 Central Bank Policy
📊 The Entire Risk-Asset Market
For me, the most important thing about the current situation is this:
This is no longer just an Iran vs US geopolitical headline. It is becoming a global macro trade.
🇺🇸 What Happened on Larak Island?
According to recent reports, US forces struck Iranian military launch positions on Larak Island, located near the Strait of Hormuz.
The United States reportedly claimed that these positions were connected to activities that could threaten international shipping routes through Hormuz, particularly amid concerns about potential naval mine deployment.
This is important because Larak Island sits in an extremely strategic location.
Any military activity near Hormuz can directly affect international shipping and global energy security.
Following the US strike, Iran's Islamic Revolutionary Guard Corps, or IRGC, quickly announced retaliatory action.
🚀 Iran's Retaliation: US Bases in Jordan Targeted
The situation escalated rapidly afterward.
Iran claimed that it targeted two US military facilities in Jordan:
King Hussein Air Base
Al Azraq Air Base
The IRGC described the operation as:
"Punishment of the Aggressor."
Iran stated that the attacks were retaliation for the Larak Island strike.
Jordanian military sources reported that their air-defense systems intercepted eight missiles entering or threatening Jordanian airspace.
The most important point here is that Iran is sending a broader military and political message.
US military assets and regional partners may no longer be outside the immediate escalation zone.
However, reports regarding the exact damage and battlefield impact remain subject to conflicting claims and independent verification.
🛩️ Iran Claims to Down a US MQ-9 Drone
The situation became even more complicated after the IRGC claimed that it had shot down a US MQ-9 drone over the Strait of Hormuz.
The claim originated from Iranian sources, and full independent verification remains limited.
But from a market perspective, one thing matters:
If both the airspace and sea routes around Hormuz become active zones of military confrontation, the risk to global shipping could increase dramatically.
And that is currently one of the biggest concerns in the energy market.
🔥 Trump and Kharg Island: Real Attack or AI Video?
The situation became even more dramatic after Donald Trump reportedly shared an AI-generated video showing Iran's strategically important Kharg Island being destroyed in massive explosions.
The video suggested that Kharg Island was being "blown to smithereens."
However, one critical point remains:
There has been no independently verified evidence confirming an actual attack on Kharg Island.
This distinction is extremely important for the market.
Kharg Island is not just another island.
It is one of Iran's most important oil export hubs.
If Iranian energy infrastructure at Kharg were ever directly targeted in a confirmed military strike, the conflict could enter an entirely new economic dimension.
At that point, the market would not simply be pricing a possible disruption in Hormuz.
It would begin pricing:
Direct destruction of Iranian oil-export infrastructure.
And that could significantly increase global energy supply risk.
🛢️ OIL MARKET: Why Is Brent Holding Above $90?
The most immediate winner of the current geopolitical escalation has been Oil.
Brent crude has pushed back above the $90 per barrel region as markets price in the possibility of renewed supply disruption.
The market is currently following a simple equation:
Hormuz Risk ↑ = Oil Supply Risk ↑
The Strait of Hormuz is one of the world's most important energy shipping corridors.
If tanker traffic declines, insurance costs rise, or shipping companies begin avoiding the area due to security concerns, the market can quickly add a significant geopolitical risk premium to crude prices.
And this can happen even before a major physical supply disruption actually occurs.
That is exactly what makes the current situation so important.
📈 Investment Analysis: Is Oil Still Bullish?
In my view, there are two major scenarios for Oil from here.
Scenario 1: The Conflict De-escalates Quickly
If the United States and Iran avoid further major military escalation and shipping activity through Hormuz gradually normalizes, part of the current geopolitical premium could disappear.
That could create the following pattern:
Oil Spike → De-escalation → Price Correction
In this scenario, sustaining prices significantly above $90 could become difficult.
Scenario 2: Hormuz Disruption Continues
This is the more bullish scenario for Oil.
If we see:
Additional tanker incidents
Increased mine threats
More military confrontation near Hormuz
Prolonged reductions in shipping activity
Direct attacks on Iranian energy infrastructure
Then Oil may not simply experience a temporary geopolitical spike.
Instead, the market could enter an entirely new supply-risk environment.
For investors, one of the most important questions is now:
Can Brent establish a sustained price floor above $90?
Because there is a major difference between a temporary geopolitical spike and a structural supply shock.
₿ BITCOIN: Dump First, Opportunity Later?
Now let's move to the most interesting part of this entire situation:
Bitcoin.
The first market reaction to sudden geopolitical escalation is usually predictable.
Investors reduce risk.
They often:
Close leveraged positions
Sell altcoins
Reduce futures exposure
Move toward cash and traditional safe-haven assets
That means a short-term reaction of:
📉 BTC volatility or a sharp pullback
would not be surprising.
Especially if Oil continues moving higher and global equity markets begin facing pressure.
Because rising Oil prices create another major macro problem:
Inflation.
And higher inflation can make it more difficult for central banks to ease monetary policy.
The chain reaction looks like this:
Oil ↑
↓
Inflation Risk ↑
↓
Rate Cut Expectations ↓
↓
Pressure on Risk Assets ↑
This can be negative for Bitcoin in the short term.
But Bitcoin's Story May Not End There
From a medium-term perspective, the Bitcoin narrative could become very different.
Large geopolitical crises often create uncertainty around the global monetary system.
If the conflict continues and leads to:
Higher energy prices
Persistent inflation
Increased government spending
Larger fiscal deficits
Concerns about currency purchasing power
Investors may begin looking for alternative stores of value.
That is where assets such as:
🥇 Gold
₿ Bitcoin
🛢️ Commodities
can become increasingly important.
However, there is one major difference.
Gold often receives the immediate safe-haven reaction.
Bitcoin, on the other hand, can initially behave like a risk asset.
It may sell off first.
But if global liquidity conditions and the macro narrative begin changing, Bitcoin can later recover strongly and develop a powerful monetary hedge narrative.
That is why my current thesis is:
Short-Term: Risk-Off → $BTC Weakness Possible 📉
But:
Medium-Term: Monetary Uncertainty + Inflation Hedge Narrative → BTC Bullish Potential 📈
Both scenarios can happen.
And investors need to understand that these two views are not contradictory.
🧠 My Investment Strategy: Don't Panic, Watch the Data
The biggest mistake investors can make right now is trading emotionally based on headlines.
If someone sees:
"Iran attacked US bases"
and immediately opens an aggressive Bitcoin short position, they may be entering late.
At the same time, if someone sees:
"Oil is above $90"
and blindly buys at the top, that also carries significant risk.
This market is extremely headline-driven.
One new military attack could push prices higher.
One ceasefire statement could trigger a sharp reversal.
One diplomatic announcement could completely change market sentiment.
That is why I believe investors should focus on three major indicators.
🔍 1. Strait of Hormuz Shipping Activity
This is currently the most important indicator.
Do not simply watch war headlines.
Watch the actual market data:
Is tanker traffic increasing or decreasing?
Are shipping insurance costs rising?
Are commercial vessels changing routes?
Are there new mine-related incidents?
If shipping disruption continues for an extended period:
Bullish pressure on Oil could remain strong.
🔍 2. Can Brent Sustain Above $90?
For Oil, simply touching $90 is not the key question.
The bigger question is:
Can the market build a new price floor above $90?
If it can, inflation expectations could begin changing again.
And that could create significant macro pressure on equities and cryptocurrencies.
🔍 3. Can Bitcoin Hold Its Market Structure During Fear?
For Bitcoin, I am not just watching headlines.
I am watching market structure.
If BTC experiences a geopolitical panic sell-off but manages to hold key support levels, that could actually become a signal of underlying strength.
Because it would show:
Bad news arrived, but sellers still failed to take full control of the market.
This type of structure can sometimes become the foundation for a major recovery.
🏦 Gold vs Oil vs Bitcoin — Which Narrative Wins?
The current geopolitical situation creates an interesting relationship between three major assets.
🥇 GOLD
The most traditional safe-haven asset.
If geopolitical uncertainty continues increasing:
Gold could receive immediate defensive demand.
🛢️ OIL
The most direct beneficiary of the current crisis.
Hormuz disruption directly creates supply risk.
That makes Oil one of the strongest short-term geopolitical trades.
₿ BITCOIN
The most interesting—and the most volatile—asset in this situation.
Short-Term:
Risk Asset
Medium-Term:
Alternative Monetary Hedge
And that is where Bitcoin's opportunity could emerge.
📊 My Current Market View
This is how I see the situation right now.
SHORT TERM
🛢️ Oil$BZ → Bullish Volatility
📉 Bitcoin → Risk-Off Pressure Possible
📉 Altcoins → Highest Volatility Risk
🥇 Gold → Potential Safe-Haven Demand
MEDIUM TERM
If the conflict continues:
🛢️ Oil$CL → Higher Geopolitical Premium
🔥 Inflation → Returns as a Major Concern
🏦 Central Banks → More Difficult Policy Environment
📉 Traditional Equities → Increased Pressure
₿ Bitcoin → Potential Recovery as an Inflation and Monetary Hedge
⚠️ What Is the Biggest Risk?
In my view, the biggest risk is not simply another military headline.
The biggest risk is:
Uncontrolled Escalation Around the Strait of Hormuz.
Because one major mistake...
One tanker incident...
One serious disruption...
Or one verified attack on a major energy hub such as Kharg Island...
Could completely change how global markets price energy risk.
At that point, $90 Oil would no longer be just another headline.
The market could begin pricing a much larger supply shock.
🧨 Final Thoughts
Today's situation reminds us of something extremely important:
The Crypto market is no longer isolated from the global economy.
Bitcoin cannot be analyzed by looking only at charts anymore.
Today's BTC investor also needs to watch:
Middle East conflict
Oil prices
Inflation expectations
Bond yields
Central bank policy
Global liquidity
The latest escalation between Iran and the United States has once again placed the Strait of Hormuz at the center of global markets.
Oil has already reacted strongly above the $90 region.
And Bitcoin is now facing another major market test.
The first reaction could be fear.
The second reaction could be opportunity.
My personal market view remains clear:
This is not the time to panic over headlines.
This is the time to closely monitor Oil and the Strait of Hormuz.
And if Bitcoin weakens significantly because of geopolitical fear while holding important structural support zones, that weakness could eventually become a potential accumulation opportunity rather than a reason for blind panic.
History has repeatedly shown us something important:
During periods of uncertainty, everyone looks for safety.
But some of the biggest investment opportunities are often created when the majority of the market is focused only on fear.
Don't just follow the war headlines. Follow the capital flows.
Watch Oil. Watch Hormuz. Watch Bitcoin.
Because over the coming days, these three markets may tell the same story.
#Iran #Hormuz #BTC #oil #IranStrikesUSBasesInJordan
1
179
·
--
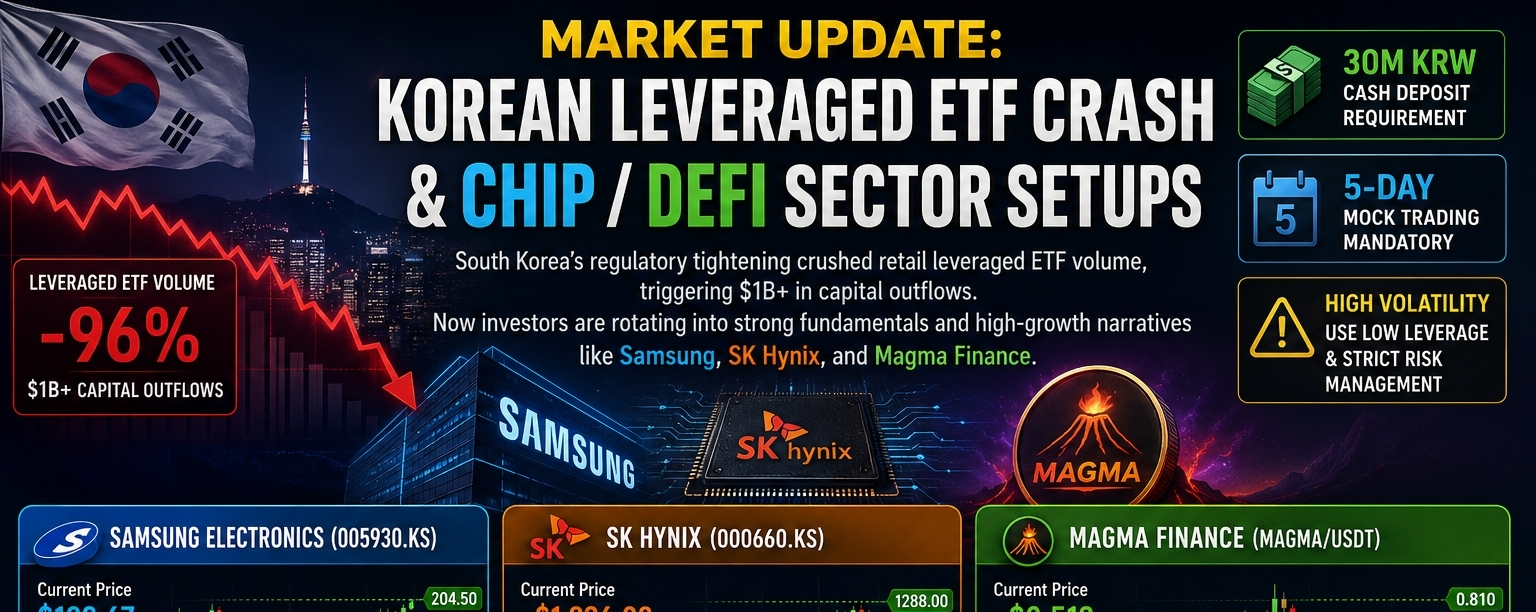
Article
MARKET UPDATE: Korean Leveraged ETF Crash — Why Capital Could Rotate Into Chip Giants and DeFi LiquiSouth Korea’s financial markets are going through an important transition, and the impact could extend beyond the country’s retail trading community.
A new wave of regulatory tightening around leveraged trading has significantly changed investor behavior. Measures such as a reported 30 million KRW cash deposit requirement and a mandatory five-day mock trading period have made it more difficult for retail investors to access highly leveraged single-stock products.
The result has been a sharp decline in speculative activity.
Leveraged ETF trading volume has reportedly collapsed, while significant capital has moved away from structured leverage products. This raises a much more interesting question for investors:
When leverage leaves the market, where does the capital go next?
In many cases, capital does not simply disappear.
It rotates.
And right now, that rotation could increasingly favor three areas:
High-quality semiconductor companies
AI and technology infrastructure
High-risk, high-growth DeFi liquidity protocols
That is why I am currently watching Samsung Electronics, SK Hynix, and Magma Finance (MAGMA).
These three opportunities represent very different parts of the market.
Samsung offers large-cap technology exposure.
SK Hynix represents the AI memory and semiconductor growth narrative.
$MAGMA represents the more speculative side of the market, where DeFi infrastructure and liquidity narratives could attract aggressive capital.
Let’s break down the setups.
🇰🇷 Korea’s Leveraged Trading Slowdown Could Change Capital Flows
For years, South Korean retail investors have been among the most active speculative participants in global financial markets.
High-beta stocks, leveraged ETFs, crypto assets, and momentum trades have historically attracted significant attention.
But leverage works in both directions.
When the market moves in your favor, returns can accelerate rapidly.
When volatility turns against you, losses can become equally destructive.
That is exactly why regulators often become more aggressive when speculative activity reaches extreme levels.
The latest tightening in Korea appears to be pushing investors away from aggressive leveraged products and toward more direct exposure.
This could mean a shift toward:
Spot equities
Large-cap technology companies
Semiconductor leaders
AI infrastructure
Selective digital assets
DeFi projects with strong liquidity narratives
For investors, this potential capital rotation is more important than the leveraged ETF crash itself.
Because the real opportunity may not be in the products losing volume.
The opportunity may be in the sectors receiving the next wave of capital.
🔥 Samsung Electronics — A Key Level for the Next Move
Samsung Electronics remains one of the most important technology companies in Asia.
The company is not simply a smartphone manufacturer.
Its broader exposure includes:
Semiconductor production
Memory chips
AI hardware
Consumer electronics
Advanced computing infrastructure
As global investment in artificial intelligence and data centers continues, semiconductor companies remain central to the technology growth story.
From a market perspective, Samsung is now approaching several important technical levels.
📊 Samsung Technical Levels
Current Reference Price: Around $188.67
🟢 Key Support Zones
$182.50 — Immediate support
$175.00 — Major demand zone
The $182.50 region is particularly important for short-term market structure.
If buyers continue defending this area, it could suggest that demand remains active despite recent volatility.
However, if selling pressure increases and price loses this support decisively, the deeper $175 zone could become the next important area to watch.
For longer-term investors, deep pullbacks in fundamentally strong companies can sometimes create better risk-adjusted entry opportunities.
Of course, this depends heavily on broader market conditions.
🔴 Key Resistance Levels
$195.00
$204.50
A sustained move above $195 could improve short-term momentum.
If buyers manage to push price toward and above $204.50 with strong volume, the market could begin pricing in another upside expansion.
My View on $SAMSUNG
Personally, I would rather watch for pullbacks than chase a strong vertical move.
Samsung is a large-cap technology name, and quality companies often provide better entries when the market gives investors patience rather than excitement.
If capital continues rotating away from leveraged speculation and toward established technology leaders, Samsung could remain one of the major companies benefiting from that trend.
⚡ SK Hynix — The AI Memory Narrative Is Still One of the Most Important Stories
Artificial intelligence requires more than just powerful processors.
Modern AI infrastructure depends heavily on advanced memory technology.
Data centers, AI servers, high-performance computing, and next-generation applications all require massive memory capacity.
That makes companies operating in the memory semiconductor sector extremely important.
SK Hynix remains one of the major names investors watch when evaluating the broader AI hardware cycle.
But even the strongest fundamental narrative does not eliminate market volatility.
That is why technical levels matter.
📊 Important Market Zones
The current market environment remains volatile, so investors should focus on price structure rather than blindly reacting to individual price movements.
🟢 Important Support and Reversal Areas
Around $1,250 — Consolidation support zone
$1,330.50 — Critical reversal or reclaim level
The key idea here is confirmation.
If price is trading below a major structural level, that level can act as resistance.
If buyers successfully reclaim it, market sentiment can change quickly.
That is why confirmation-based entries are generally safer than trying to predict every bottom.
🔴 Potential Trading Levels
$1,244
$1,288
These areas should be watched together with volume, momentum, and broader semiconductor market conditions.
My Market Perspective
For me, the biggest question is not simply what SK Hynix does tomorrow.
The bigger question is:
Will AI-related memory demand remain strong over the next several quarters?
If the answer remains yes, major market corrections could potentially create accumulation opportunities for long-term investors.
However, semiconductor stocks are cyclical.
Even during a powerful long-term growth trend, sharp corrections are completely normal.
That is why investors should separate the long-term AI narrative from short-term market volatility.
🌋 MAGMA Finance — Could DeFi Liquidity Become the Next High-Risk Opportunity?
Now we move into a completely different type of market opportunity.
Magma Finance (MAGMA).
Unlike Samsung and SK Hynix, MAGMA is a speculative crypto opportunity.
That means the potential upside may be significantly larger.
But so is the downside risk.
The broader crypto market is evolving.
Investors are increasingly looking beyond simple meme coin speculation and exploring infrastructure-focused narratives.
Some of the areas receiving attention include:
Decentralized liquidity
Yield infrastructure
On-chain financial protocols
Blockchain settlement layers
DeFi capital efficiency
MAGMA fits into the higher-risk end of this narrative.
If liquidity and adoption continue growing, the project could attract speculative interest.
But investors must remember:
A strong narrative does not guarantee a strong investment.
Liquidity, adoption, token economics, and market conditions all matter.
📊 MAGMA Technical Analysis
Current Reference Price: Around $0.512
🟢 Key Support Zones
$0.415 — Immediate low/support area
$0.350 — Major base support
The $0.415 area is an important short-term level.
If MAGMA pulls back into this region and buyers defend it strongly, the market could potentially form a recovery setup.
However, a decisive loss of support could open the possibility of a deeper move toward the $0.350 base.
This is why traders should avoid emotional entries.
Waiting for price confirmation can often provide a better risk-to-reward setup.
🔴 Key Resistance Levels
$0.560 — Immediate resistance
$0.810 — Major upside target / ATH-focused zone
The first major challenge is $0.560.
A strong breakout above this level could improve short-term momentum.
However, reaching an aggressive target such as $0.810 would likely require more than technical momentum.
The market would probably need:
Strong volume
Increased investor attention
Positive DeFi sector sentiment
Broader crypto market strength
Without those factors, resistance zones can remain difficult to break.
🎯 MAGMA Trade Setup
Based on the current technical structure, here is a potential framework.
🟢 Potential Long Setup
Buy Zone: $0.45 – $0.48
The idea is simple.
Instead of chasing price higher, wait for a pullback toward structural support.
If buyers step in and defend the area, traders may get a more controlled entry.
Potential Target: $0.57
Stop-Loss: $0.41
The advantage of this approach is risk management.
Buying closer to support generally provides a clearer invalidation level.
But remember: support is not guaranteed.
A stop-loss exists for a reason.
🔴 Potential Sell / Profit-Taking Zone
Supply Zone: $0.58 – $0.61
This area could become a zone where traders consider:
Taking partial profits
Reducing leverage
Watching for rejection
Considering short-term scalp opportunities
Potential downside target: $0.50
Risk invalidation / Stop-Loss: $0.64
However, I would personally be cautious about aggressively shorting a strong momentum asset.
Low-cap crypto assets can move 10%–20% extremely quickly.
A technically correct short setup can still fail if the market receives sudden volume or news-driven momentum.
💡 Where Could Smart Capital Move Next?
The Korean leveraged ETF slowdown highlights something important about modern markets.
Capital is constantly searching for the best combination of:
Growth + Liquidity + Risk-Adjusted Returns
When highly leveraged speculation becomes less attractive, investors often begin looking elsewhere.
In my opinion, capital could increasingly separate into three categories.
1️⃣ Quality
Large companies with strong market positions, deep liquidity, and established businesses.
Samsung Electronics fits this category.
2️⃣ Growth
Companies positioned inside long-term structural trends.
AI infrastructure and advanced semiconductors remain one of the strongest global growth narratives.
SK Hynix fits this category.
3️⃣ High-Risk Innovation
Smaller projects with asymmetric upside potential.
This includes DeFi protocols, blockchain infrastructure, and emerging liquidity platforms.
MAGMA fits into this category.
But these three opportunities should never be treated with the same risk profile.
Samsung and MAGMA may both move higher.
That does not mean they carry the same investment risk.
Their volatility, liquidity, fundamentals, and downside potential are completely different.
📈 How I Would Approach This Market
If I were structuring exposure around this type of market environment, I would not put all capital into one trade.
I would think about risk allocation.
Conservative Exposure
Focus on established companies and highly liquid assets.
Moderate Risk Exposure
Focus on growth sectors such as AI infrastructure and semiconductors.
High-Risk Exposure
Allocate only a small percentage toward speculative DeFi and crypto opportunities.
The biggest mistake investors can make is treating every asset as if it has the same probability of success.
It does not.
A blue-chip semiconductor company and a low-cap DeFi token should never receive identical position sizing.
⚠️ The Biggest Lesson: Reduce Leverage
The Korean leveraged ETF situation is another reminder of something every trader eventually learns.
Leverage can accelerate profits.
But it can also accelerate mistakes.
In a volatile market environment, excessive leverage creates unnecessary pressure.
Right now, markets are dealing with:
Regulatory uncertainty
Semiconductor volatility
Rapid capital rotation
Crypto market fluctuations
High-risk low-cap token speculation
That is not an environment where investors should become careless.
I strongly believe that position sizing matters more than most traders realize.
You can have a great entry.
You can have excellent analysis.
You can even be right about the market direction.
But if your leverage is too high, a temporary move against your position can still destroy the trade.
A good idea without risk management can quickly become a bad investment.
🔮 Final Market Outlook
In my opinion, the slowdown in Korea's leveraged ETF market could be more than just a temporary regulatory story.
It may represent a broader shift in investor behavior.
When speculative leverage becomes more difficult, capital often becomes more selective.
And selective capital usually looks for three things:
Quality.
Growth.
Asymmetric opportunity.
That is exactly why these three assets are interesting to watch:
🇰🇷 Samsung Electronics — Large-cap technology and semiconductor exposure.
⚡ $SKHY Hynix — AI memory and data-center infrastructure growth.
🌋 Magma Finance (MAGMA) — A high-risk DeFi liquidity opportunity.
My approach would remain simple.
I would not chase vertical price moves.
I would wait for important support zones.
I would scale positions carefully.
I would keep leverage low.
And most importantly, I would always know where my trade idea becomes invalid.
Because missing a trade is not dangerous.
But losing capital due to poor risk management can take much longer to recover from.
The next few weeks could be particularly interesting.
Semiconductor companies remain at the center of the global AI narrative.
At the same time, selective DeFi projects may begin attracting speculative capital if liquidity returns to the crypto market.
The key is patience.
Don't chase volatility. Let the market come to your level.
Wait for confirmation.
Respect support and resistance.
Use proper position sizing.
And remember—
The best investors are not the ones who trade every opportunity.
They are the ones who survive long enough to capture the biggest ones.
{future}(MAGMAUSDT)
{future}(SAMSUNGUSDT)
{spot}(SKHYBUSDT)
#KoreaSingleStockLeveragedETFTradingFalls #Samsung #MAGMA #cryptouniverseofficial #Binance
MARKET UPDATE: Korean Leveraged ETF Crash — Why Capital Could Rotate Into Chip Giants and DeFi Liqui
South Korea’s financial markets are going through an important transition, and the impact could extend beyond the country’s retail trading community.
A new wave of regulatory tightening around leveraged trading has significantly changed investor behavior. Measures such as a reported 30 million KRW cash deposit requirement and a mandatory five-day mock trading period have made it more difficult for retail investors to access highly leveraged single-stock products.
The result has been a sharp decline in speculative activity.
Leveraged ETF trading volume has reportedly collapsed, while significant capital has moved away from structured leverage products. This raises a much more interesting question for investors:
When leverage leaves the market, where does the capital go next?
In many cases, capital does not simply disappear.
It rotates.
And right now, that rotation could increasingly favor three areas:
High-quality semiconductor companies
AI and technology infrastructure
High-risk, high-growth DeFi liquidity protocols
That is why I am currently watching Samsung Electronics, SK Hynix, and Magma Finance (MAGMA).
These three opportunities represent very different parts of the market.
Samsung offers large-cap technology exposure.
SK Hynix represents the AI memory and semiconductor growth narrative.
$MAGMA represents the more speculative side of the market, where DeFi infrastructure and liquidity narratives could attract aggressive capital.
Let’s break down the setups.
🇰🇷 Korea’s Leveraged Trading Slowdown Could Change Capital Flows
For years, South Korean retail investors have been among the most active speculative participants in global financial markets.
High-beta stocks, leveraged ETFs, crypto assets, and momentum trades have historically attracted significant attention.
But leverage works in both directions.
When the market moves in your favor, returns can accelerate rapidly.
When volatility turns against you, losses can become equally destructive.
That is exactly why regulators often become more aggressive when speculative activity reaches extreme levels.
The latest tightening in Korea appears to be pushing investors away from aggressive leveraged products and toward more direct exposure.
This could mean a shift toward:
Spot equities
Large-cap technology companies
Semiconductor leaders
AI infrastructure
Selective digital assets
DeFi projects with strong liquidity narratives
For investors, this potential capital rotation is more important than the leveraged ETF crash itself.
Because the real opportunity may not be in the products losing volume.
The opportunity may be in the sectors receiving the next wave of capital.
🔥 Samsung Electronics — A Key Level for the Next Move
Samsung Electronics remains one of the most important technology companies in Asia.
The company is not simply a smartphone manufacturer.
Its broader exposure includes:
Semiconductor production
Memory chips
AI hardware
Consumer electronics
Advanced computing infrastructure
As global investment in artificial intelligence and data centers continues, semiconductor companies remain central to the technology growth story.
From a market perspective, Samsung is now approaching several important technical levels.
📊 Samsung Technical Levels
Current Reference Price: Around $188.67
🟢 Key Support Zones
$182.50 — Immediate support
$175.00 — Major demand zone
The $182.50 region is particularly important for short-term market structure.
If buyers continue defending this area, it could suggest that demand remains active despite recent volatility.
However, if selling pressure increases and price loses this support decisively, the deeper $175 zone could become the next important area to watch.
For longer-term investors, deep pullbacks in fundamentally strong companies can sometimes create better risk-adjusted entry opportunities.
Of course, this depends heavily on broader market conditions.
🔴 Key Resistance Levels
$195.00
$204.50
A sustained move above $195 could improve short-term momentum.
If buyers manage to push price toward and above $204.50 with strong volume, the market could begin pricing in another upside expansion.
My View on $SAMSUNG
Personally, I would rather watch for pullbacks than chase a strong vertical move.
Samsung is a large-cap technology name, and quality companies often provide better entries when the market gives investors patience rather than excitement.
If capital continues rotating away from leveraged speculation and toward established technology leaders, Samsung could remain one of the major companies benefiting from that trend.
⚡ SK Hynix — The AI Memory Narrative Is Still One of the Most Important Stories
Artificial intelligence requires more than just powerful processors.
Modern AI infrastructure depends heavily on advanced memory technology.
Data centers, AI servers, high-performance computing, and next-generation applications all require massive memory capacity.
That makes companies operating in the memory semiconductor sector extremely important.
SK Hynix remains one of the major names investors watch when evaluating the broader AI hardware cycle.
But even the strongest fundamental narrative does not eliminate market volatility.
That is why technical levels matter.
📊 Important Market Zones
The current market environment remains volatile, so investors should focus on price structure rather than blindly reacting to individual price movements.
🟢 Important Support and Reversal Areas
Around $1,250 — Consolidation support zone
$1,330.50 — Critical reversal or reclaim level
The key idea here is confirmation.
If price is trading below a major structural level, that level can act as resistance.
If buyers successfully reclaim it, market sentiment can change quickly.
That is why confirmation-based entries are generally safer than trying to predict every bottom.
🔴 Potential Trading Levels
$1,244
$1,288
These areas should be watched together with volume, momentum, and broader semiconductor market conditions.
My Market Perspective
For me, the biggest question is not simply what SK Hynix does tomorrow.
The bigger question is:
Will AI-related memory demand remain strong over the next several quarters?
If the answer remains yes, major market corrections could potentially create accumulation opportunities for long-term investors.
However, semiconductor stocks are cyclical.
Even during a powerful long-term growth trend, sharp corrections are completely normal.
That is why investors should separate the long-term AI narrative from short-term market volatility.
🌋 MAGMA Finance — Could DeFi Liquidity Become the Next High-Risk Opportunity?
Now we move into a completely different type of market opportunity.
Magma Finance (MAGMA).
Unlike Samsung and SK Hynix, MAGMA is a speculative crypto opportunity.
That means the potential upside may be significantly larger.
But so is the downside risk.
The broader crypto market is evolving.
Investors are increasingly looking beyond simple meme coin speculation and exploring infrastructure-focused narratives.
Some of the areas receiving attention include:
Decentralized liquidity
Yield infrastructure
On-chain financial protocols
Blockchain settlement layers
DeFi capital efficiency
MAGMA fits into the higher-risk end of this narrative.
If liquidity and adoption continue growing, the project could attract speculative interest.
But investors must remember:
A strong narrative does not guarantee a strong investment.
Liquidity, adoption, token economics, and market conditions all matter.
📊 MAGMA Technical Analysis
Current Reference Price: Around $0.512
🟢 Key Support Zones
$0.415 — Immediate low/support area
$0.350 — Major base support
The $0.415 area is an important short-term level.
If MAGMA pulls back into this region and buyers defend it strongly, the market could potentially form a recovery setup.
However, a decisive loss of support could open the possibility of a deeper move toward the $0.350 base.
This is why traders should avoid emotional entries.
Waiting for price confirmation can often provide a better risk-to-reward setup.
🔴 Key Resistance Levels
$0.560 — Immediate resistance
$0.810 — Major upside target / ATH-focused zone
The first major challenge is $0.560.
A strong breakout above this level could improve short-term momentum.
However, reaching an aggressive target such as $0.810 would likely require more than technical momentum.
The market would probably need:
Strong volume
Increased investor attention
Positive DeFi sector sentiment
Broader crypto market strength
Without those factors, resistance zones can remain difficult to break.
🎯 MAGMA Trade Setup
Based on the current technical structure, here is a potential framework.
🟢 Potential Long Setup
Buy Zone: $0.45 – $0.48
The idea is simple.
Instead of chasing price higher, wait for a pullback toward structural support.
If buyers step in and defend the area, traders may get a more controlled entry.
Potential Target: $0.57
Stop-Loss: $0.41
The advantage of this approach is risk management.
Buying closer to support generally provides a clearer invalidation level.
But remember: support is not guaranteed.
A stop-loss exists for a reason.
🔴 Potential Sell / Profit-Taking Zone
Supply Zone: $0.58 – $0.61
This area could become a zone where traders consider:
Taking partial profits
Reducing leverage
Watching for rejection
Considering short-term scalp opportunities
Potential downside target: $0.50
Risk invalidation / Stop-Loss: $0.64
However, I would personally be cautious about aggressively shorting a strong momentum asset.
Low-cap crypto assets can move 10%–20% extremely quickly.
A technically correct short setup can still fail if the market receives sudden volume or news-driven momentum.
💡 Where Could Smart Capital Move Next?
The Korean leveraged ETF slowdown highlights something important about modern markets.
Capital is constantly searching for the best combination of:
Growth + Liquidity + Risk-Adjusted Returns
When highly leveraged speculation becomes less attractive, investors often begin looking elsewhere.
In my opinion, capital could increasingly separate into three categories.
1️⃣ Quality
Large companies with strong market positions, deep liquidity, and established businesses.
Samsung Electronics fits this category.
2️⃣ Growth
Companies positioned inside long-term structural trends.
AI infrastructure and advanced semiconductors remain one of the strongest global growth narratives.
SK Hynix fits this category.
3️⃣ High-Risk Innovation
Smaller projects with asymmetric upside potential.
This includes DeFi protocols, blockchain infrastructure, and emerging liquidity platforms.
MAGMA fits into this category.
But these three opportunities should never be treated with the same risk profile.
Samsung and MAGMA may both move higher.
That does not mean they carry the same investment risk.
Their volatility, liquidity, fundamentals, and downside potential are completely different.
📈 How I Would Approach This Market
If I were structuring exposure around this type of market environment, I would not put all capital into one trade.
I would think about risk allocation.
Conservative Exposure
Focus on established companies and highly liquid assets.
Moderate Risk Exposure
Focus on growth sectors such as AI infrastructure and semiconductors.
High-Risk Exposure
Allocate only a small percentage toward speculative DeFi and crypto opportunities.
The biggest mistake investors can make is treating every asset as if it has the same probability of success.
It does not.
A blue-chip semiconductor company and a low-cap DeFi token should never receive identical position sizing.
⚠️ The Biggest Lesson: Reduce Leverage
The Korean leveraged ETF situation is another reminder of something every trader eventually learns.
Leverage can accelerate profits.
But it can also accelerate mistakes.
In a volatile market environment, excessive leverage creates unnecessary pressure.
Right now, markets are dealing with:
Regulatory uncertainty
Semiconductor volatility
Rapid capital rotation
Crypto market fluctuations
High-risk low-cap token speculation
That is not an environment where investors should become careless.
I strongly believe that position sizing matters more than most traders realize.
You can have a great entry.
You can have excellent analysis.
You can even be right about the market direction.
But if your leverage is too high, a temporary move against your position can still destroy the trade.
A good idea without risk management can quickly become a bad investment.
🔮 Final Market Outlook
In my opinion, the slowdown in Korea's leveraged ETF market could be more than just a temporary regulatory story.
It may represent a broader shift in investor behavior.
When speculative leverage becomes more difficult, capital often becomes more selective.
And selective capital usually looks for three things:
Quality.
Growth.
Asymmetric opportunity.
That is exactly why these three assets are interesting to watch:
🇰🇷 Samsung Electronics — Large-cap technology and semiconductor exposure.
⚡ $SKHY Hynix — AI memory and data-center infrastructure growth.
🌋 Magma Finance (MAGMA) — A high-risk DeFi liquidity opportunity.
My approach would remain simple.
I would not chase vertical price moves.
I would wait for important support zones.
I would scale positions carefully.
I would keep leverage low.
And most importantly, I would always know where my trade idea becomes invalid.
Because missing a trade is not dangerous.
But losing capital due to poor risk management can take much longer to recover from.
The next few weeks could be particularly interesting.
Semiconductor companies remain at the center of the global AI narrative.
At the same time, selective DeFi projects may begin attracting speculative capital if liquidity returns to the crypto market.
The key is patience.
Don't chase volatility. Let the market come to your level.
Wait for confirmation.
Respect support and resistance.
Use proper position sizing.
And remember—
The best investors are not the ones who trade every opportunity.
They are the ones who survive long enough to capture the biggest ones.
#KoreaSingleStockLeveragedETFTradingFalls #Samsung #MAGMA #cryptouniverseofficial #Binance
A new wave of regulatory tightening around leveraged trading has significantly changed investor behavior. Measures such as a reported 30 million KRW cash deposit requirement and a mandatory five-day mock trading period have made it more difficult for retail investors to access highly leveraged single-stock products.
The result has been a sharp decline in speculative activity.
Leveraged ETF trading volume has reportedly collapsed, while significant capital has moved away from structured leverage products. This raises a much more interesting question for investors:
When leverage leaves the market, where does the capital go next?
In many cases, capital does not simply disappear.
It rotates.
And right now, that rotation could increasingly favor three areas:
High-quality semiconductor companies
AI and technology infrastructure
High-risk, high-growth DeFi liquidity protocols
That is why I am currently watching Samsung Electronics, SK Hynix, and Magma Finance (MAGMA).
These three opportunities represent very different parts of the market.
Samsung offers large-cap technology exposure.
SK Hynix represents the AI memory and semiconductor growth narrative.
$MAGMA represents the more speculative side of the market, where DeFi infrastructure and liquidity narratives could attract aggressive capital.
Let’s break down the setups.
🇰🇷 Korea’s Leveraged Trading Slowdown Could Change Capital Flows
For years, South Korean retail investors have been among the most active speculative participants in global financial markets.
High-beta stocks, leveraged ETFs, crypto assets, and momentum trades have historically attracted significant attention.
But leverage works in both directions.
When the market moves in your favor, returns can accelerate rapidly.
When volatility turns against you, losses can become equally destructive.
That is exactly why regulators often become more aggressive when speculative activity reaches extreme levels.
The latest tightening in Korea appears to be pushing investors away from aggressive leveraged products and toward more direct exposure.
This could mean a shift toward:
Spot equities
Large-cap technology companies
Semiconductor leaders
AI infrastructure
Selective digital assets
DeFi projects with strong liquidity narratives
For investors, this potential capital rotation is more important than the leveraged ETF crash itself.
Because the real opportunity may not be in the products losing volume.
The opportunity may be in the sectors receiving the next wave of capital.
🔥 Samsung Electronics — A Key Level for the Next Move
Samsung Electronics remains one of the most important technology companies in Asia.
The company is not simply a smartphone manufacturer.
Its broader exposure includes:
Semiconductor production
Memory chips
AI hardware
Consumer electronics
Advanced computing infrastructure
As global investment in artificial intelligence and data centers continues, semiconductor companies remain central to the technology growth story.
From a market perspective, Samsung is now approaching several important technical levels.
📊 Samsung Technical Levels
Current Reference Price: Around $188.67
🟢 Key Support Zones
$182.50 — Immediate support
$175.00 — Major demand zone
The $182.50 region is particularly important for short-term market structure.
If buyers continue defending this area, it could suggest that demand remains active despite recent volatility.
However, if selling pressure increases and price loses this support decisively, the deeper $175 zone could become the next important area to watch.
For longer-term investors, deep pullbacks in fundamentally strong companies can sometimes create better risk-adjusted entry opportunities.
Of course, this depends heavily on broader market conditions.
🔴 Key Resistance Levels
$195.00
$204.50
A sustained move above $195 could improve short-term momentum.
If buyers manage to push price toward and above $204.50 with strong volume, the market could begin pricing in another upside expansion.
My View on $SAMSUNG
Personally, I would rather watch for pullbacks than chase a strong vertical move.
Samsung is a large-cap technology name, and quality companies often provide better entries when the market gives investors patience rather than excitement.
If capital continues rotating away from leveraged speculation and toward established technology leaders, Samsung could remain one of the major companies benefiting from that trend.
⚡ SK Hynix — The AI Memory Narrative Is Still One of the Most Important Stories
Artificial intelligence requires more than just powerful processors.
Modern AI infrastructure depends heavily on advanced memory technology.
Data centers, AI servers, high-performance computing, and next-generation applications all require massive memory capacity.
That makes companies operating in the memory semiconductor sector extremely important.
SK Hynix remains one of the major names investors watch when evaluating the broader AI hardware cycle.
But even the strongest fundamental narrative does not eliminate market volatility.
That is why technical levels matter.
📊 Important Market Zones
The current market environment remains volatile, so investors should focus on price structure rather than blindly reacting to individual price movements.
🟢 Important Support and Reversal Areas
Around $1,250 — Consolidation support zone
$1,330.50 — Critical reversal or reclaim level
The key idea here is confirmation.
If price is trading below a major structural level, that level can act as resistance.
If buyers successfully reclaim it, market sentiment can change quickly.
That is why confirmation-based entries are generally safer than trying to predict every bottom.
🔴 Potential Trading Levels
$1,244
$1,288
These areas should be watched together with volume, momentum, and broader semiconductor market conditions.
My Market Perspective
For me, the biggest question is not simply what SK Hynix does tomorrow.
The bigger question is:
Will AI-related memory demand remain strong over the next several quarters?
If the answer remains yes, major market corrections could potentially create accumulation opportunities for long-term investors.
However, semiconductor stocks are cyclical.
Even during a powerful long-term growth trend, sharp corrections are completely normal.
That is why investors should separate the long-term AI narrative from short-term market volatility.
🌋 MAGMA Finance — Could DeFi Liquidity Become the Next High-Risk Opportunity?
Now we move into a completely different type of market opportunity.
Magma Finance (MAGMA).
Unlike Samsung and SK Hynix, MAGMA is a speculative crypto opportunity.
That means the potential upside may be significantly larger.
But so is the downside risk.
The broader crypto market is evolving.
Investors are increasingly looking beyond simple meme coin speculation and exploring infrastructure-focused narratives.
Some of the areas receiving attention include:
Decentralized liquidity
Yield infrastructure
On-chain financial protocols
Blockchain settlement layers
DeFi capital efficiency
MAGMA fits into the higher-risk end of this narrative.
If liquidity and adoption continue growing, the project could attract speculative interest.
But investors must remember:
A strong narrative does not guarantee a strong investment.
Liquidity, adoption, token economics, and market conditions all matter.
📊 MAGMA Technical Analysis
Current Reference Price: Around $0.512
🟢 Key Support Zones
$0.415 — Immediate low/support area
$0.350 — Major base support
The $0.415 area is an important short-term level.
If MAGMA pulls back into this region and buyers defend it strongly, the market could potentially form a recovery setup.
However, a decisive loss of support could open the possibility of a deeper move toward the $0.350 base.
This is why traders should avoid emotional entries.
Waiting for price confirmation can often provide a better risk-to-reward setup.
🔴 Key Resistance Levels
$0.560 — Immediate resistance
$0.810 — Major upside target / ATH-focused zone
The first major challenge is $0.560.
A strong breakout above this level could improve short-term momentum.
However, reaching an aggressive target such as $0.810 would likely require more than technical momentum.
The market would probably need:
Strong volume
Increased investor attention
Positive DeFi sector sentiment
Broader crypto market strength
Without those factors, resistance zones can remain difficult to break.
🎯 MAGMA Trade Setup
Based on the current technical structure, here is a potential framework.
🟢 Potential Long Setup
Buy Zone: $0.45 – $0.48
The idea is simple.
Instead of chasing price higher, wait for a pullback toward structural support.
If buyers step in and defend the area, traders may get a more controlled entry.
Potential Target: $0.57
Stop-Loss: $0.41
The advantage of this approach is risk management.
Buying closer to support generally provides a clearer invalidation level.
But remember: support is not guaranteed.
A stop-loss exists for a reason.
🔴 Potential Sell / Profit-Taking Zone
Supply Zone: $0.58 – $0.61
This area could become a zone where traders consider:
Taking partial profits
Reducing leverage
Watching for rejection
Considering short-term scalp opportunities
Potential downside target: $0.50
Risk invalidation / Stop-Loss: $0.64
However, I would personally be cautious about aggressively shorting a strong momentum asset.
Low-cap crypto assets can move 10%–20% extremely quickly.
A technically correct short setup can still fail if the market receives sudden volume or news-driven momentum.
💡 Where Could Smart Capital Move Next?
The Korean leveraged ETF slowdown highlights something important about modern markets.
Capital is constantly searching for the best combination of:
Growth + Liquidity + Risk-Adjusted Returns
When highly leveraged speculation becomes less attractive, investors often begin looking elsewhere.
In my opinion, capital could increasingly separate into three categories.
1️⃣ Quality
Large companies with strong market positions, deep liquidity, and established businesses.
Samsung Electronics fits this category.
2️⃣ Growth
Companies positioned inside long-term structural trends.
AI infrastructure and advanced semiconductors remain one of the strongest global growth narratives.
SK Hynix fits this category.
3️⃣ High-Risk Innovation
Smaller projects with asymmetric upside potential.
This includes DeFi protocols, blockchain infrastructure, and emerging liquidity platforms.
MAGMA fits into this category.
But these three opportunities should never be treated with the same risk profile.
Samsung and MAGMA may both move higher.
That does not mean they carry the same investment risk.
Their volatility, liquidity, fundamentals, and downside potential are completely different.
📈 How I Would Approach This Market
If I were structuring exposure around this type of market environment, I would not put all capital into one trade.
I would think about risk allocation.
Conservative Exposure
Focus on established companies and highly liquid assets.
Moderate Risk Exposure
Focus on growth sectors such as AI infrastructure and semiconductors.
High-Risk Exposure
Allocate only a small percentage toward speculative DeFi and crypto opportunities.
The biggest mistake investors can make is treating every asset as if it has the same probability of success.
It does not.
A blue-chip semiconductor company and a low-cap DeFi token should never receive identical position sizing.
⚠️ The Biggest Lesson: Reduce Leverage
The Korean leveraged ETF situation is another reminder of something every trader eventually learns.
Leverage can accelerate profits.
But it can also accelerate mistakes.
In a volatile market environment, excessive leverage creates unnecessary pressure.
Right now, markets are dealing with:
Regulatory uncertainty
Semiconductor volatility
Rapid capital rotation
Crypto market fluctuations
High-risk low-cap token speculation
That is not an environment where investors should become careless.
I strongly believe that position sizing matters more than most traders realize.
You can have a great entry.
You can have excellent analysis.
You can even be right about the market direction.
But if your leverage is too high, a temporary move against your position can still destroy the trade.
A good idea without risk management can quickly become a bad investment.
🔮 Final Market Outlook
In my opinion, the slowdown in Korea's leveraged ETF market could be more than just a temporary regulatory story.
It may represent a broader shift in investor behavior.
When speculative leverage becomes more difficult, capital often becomes more selective.
And selective capital usually looks for three things:
Quality.
Growth.
Asymmetric opportunity.
That is exactly why these three assets are interesting to watch:
🇰🇷 Samsung Electronics — Large-cap technology and semiconductor exposure.
⚡ $SKHY Hynix — AI memory and data-center infrastructure growth.
🌋 Magma Finance (MAGMA) — A high-risk DeFi liquidity opportunity.
My approach would remain simple.
I would not chase vertical price moves.
I would wait for important support zones.
I would scale positions carefully.
I would keep leverage low.
And most importantly, I would always know where my trade idea becomes invalid.
Because missing a trade is not dangerous.
But losing capital due to poor risk management can take much longer to recover from.
The next few weeks could be particularly interesting.
Semiconductor companies remain at the center of the global AI narrative.
At the same time, selective DeFi projects may begin attracting speculative capital if liquidity returns to the crypto market.
The key is patience.
Don't chase volatility. Let the market come to your level.
Wait for confirmation.
Respect support and resistance.
Use proper position sizing.
And remember—
The best investors are not the ones who trade every opportunity.
They are the ones who survive long enough to capture the biggest ones.
#KoreaSingleStockLeveragedETFTradingFalls #Samsung #MAGMA #cryptouniverseofficial #Binance
1
275
Log in to explore more content
Join global crypto users on Binance Square
⚡️ Get latest and useful information about crypto.
💬 Trusted by the world’s largest crypto exchange.
👍 Discover real insights from verified creators.
Email / Phone number
Trending Topics
BTCBreaks80K
118,828 views
1,869 Discussing
$BTC
What price is BTC going to hit in 2026?
Spot is sitting at $80,748. 104 days to go
↑ $90k - 58%
↑ $100k - 24%
↓ $70k dip first - 48%
The bull case floating around the floor:
>August had a proper run from $62,275 up to $81,479 — up 31% bottom to top
>The CLARITY Act flopped its Senate cloture vote 49-50 on 15 Sept. BTC was already sliding well before the vote, touched $74,968 in that hour, and won it all back inside three days
>The Fed hiked rates on 16 Sept — first time since July 2023. Spot is currently floating 7.4% above that day's low
>The altcoins are proper outrunning it. 30-day view: SOL up 38%, XRP up 35%, ETH up 32% versus BTC up 23%
>The timeline is still packed with reasons why this ought to break down — and that’s precisely the wall of worry bull markets tend to climb
>The midterms land on 3 Nov, right smack in the middle of this market window
So, what would you put down for a punt at +24% in 104 days?
$ETH
$SOL
#BTCBreaks80K #solonapumping #ETH🔥🔥🔥🔥🔥🔥 #BullMarket📈
Wealthy bloke
·5 Likes
·5.1k views
SOLJumpsAbout10%
0 views
0 Discussing
EthereumReclaims$2600
45 views
22 Discussing