

Top Hatter 09
180 Posts

Top Hatter 09
Report
Block User
Daily crypto news & updates | Bitcoin, Altcoins & trends Fast, simple & reliable info No hype, only real news | Stay ahead in crypto
Open Trade
Occasional Trader
2.5 Years
13 Following
42 Followers
65 Liked
Posts
Portfolio
PINNED
$ZEC $BTC $ETH
My Name Is Sandeel Khalid, I'm 21 years old from Islamabad, Pakistan.
Money doesn't come from hard work — it comes from smart work.
A lot of traders were waiting on the CLARITY Act, then the FOMC meeting hit and BTC wicked hard before pulling back — but most traders still didn't buy the dip.
Trading comes down to four things:
📊 Market analysis
📈 Technical analysis
📰 Fundamental analysis
🧠 Market sentiment
But here's the real truth — that's only 20% of the game. The other 80% is your emotions and your psychology. If you can't control yourself, you can't be consistent. And if you can't be consistent, you can't be successful.
#Copytrading #TradingPsychology
{future}(ZECUSDT)
{future}(BTCUSDT)
{future}(ETHUSDT)
$ZEC $BTC $ETH
My Name Is Sandeel Khalid, I'm 21 years old from Islamabad, Pakistan.
Money doesn't come from hard work — it comes from smart work.
A lot of traders were waiting on the CLARITY Act, then the FOMC meeting hit and BTC wicked hard before pulling back — but most traders still didn't buy the dip.
Trading comes down to four things:
📊 Market analysis
📈 Technical analysis
📰 Fundamental analysis
🧠 Market sentiment
But here's the real truth — that's only 20% of the game. The other 80% is your emotions and your psychology. If you can't control yourself, you can't be consistent. And if you can't be consistent, you can't be successful.
#Copytrading #TradingPsychology
My Name Is Sandeel Khalid, I'm 21 years old from Islamabad, Pakistan.
Money doesn't come from hard work — it comes from smart work.
A lot of traders were waiting on the CLARITY Act, then the FOMC meeting hit and BTC wicked hard before pulling back — but most traders still didn't buy the dip.
Trading comes down to four things:
📊 Market analysis
📈 Technical analysis
📰 Fundamental analysis
🧠 Market sentiment
But here's the real truth — that's only 20% of the game. The other 80% is your emotions and your psychology. If you can't control yourself, you can't be consistent. And if you can't be consistent, you can't be successful.
#Copytrading #TradingPsychology

1
1
244
🚨 $BTC CROSSES $84,000 AGAIN
Bitcoin just pushed back above $84K, with the 1H chart showing strong buying momentum.
From the chart:
Current: ~$85,374
24H high: $85,650
Support: $84,000–$84,100
Next resistance: $85,650–$86,000
BTC is now testing the area where sellers previously stepped in. A clean hold above $84K keeps the short-term structure interesting, while losing that level could bring the recent $82.9K area back into focus.
$84K is the level to watch. 👀
$BTC #Bitcoin #BTC #Crypto #BinanceSquare #Earningseason
{future}(BTCUSDT)
🚨 $BTC CROSSES $84,000 AGAIN
Bitcoin just pushed back above $84K, with the 1H chart showing strong buying momentum.
From the chart:
Current: ~$85,374
24H high: $85,650
Support: $84,000–$84,100
Next resistance: $85,650–$86,000
BTC is now testing the area where sellers previously stepped in. A clean hold above $84K keeps the short-term structure interesting, while losing that level could bring the recent $82.9K area back into focus.
$84K is the level to watch. 👀
$BTC #Bitcoin #BTC #Crypto #BinanceSquare #Earningseason
Bitcoin just pushed back above $84K, with the 1H chart showing strong buying momentum.
From the chart:
Current: ~$85,374
24H high: $85,650
Support: $84,000–$84,100
Next resistance: $85,650–$86,000
BTC is now testing the area where sellers previously stepped in. A clean hold above $84K keeps the short-term structure interesting, while losing that level could bring the recent $82.9K area back into focus.
$84K is the level to watch. 👀
$BTC #Bitcoin #BTC #Crypto #BinanceSquare #Earningseason
1
$MU EARNINGS IN FOCUS 👀
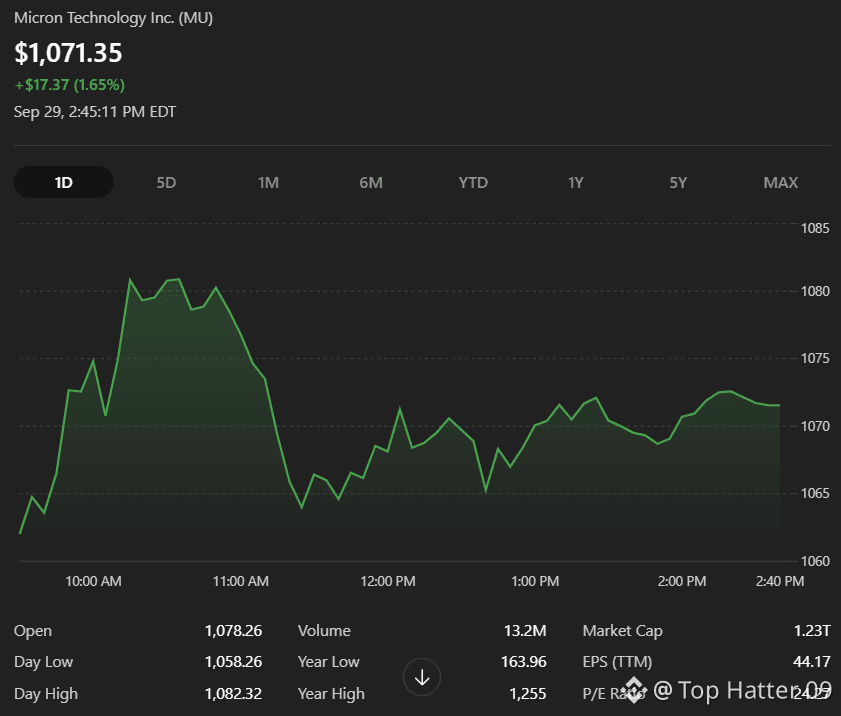
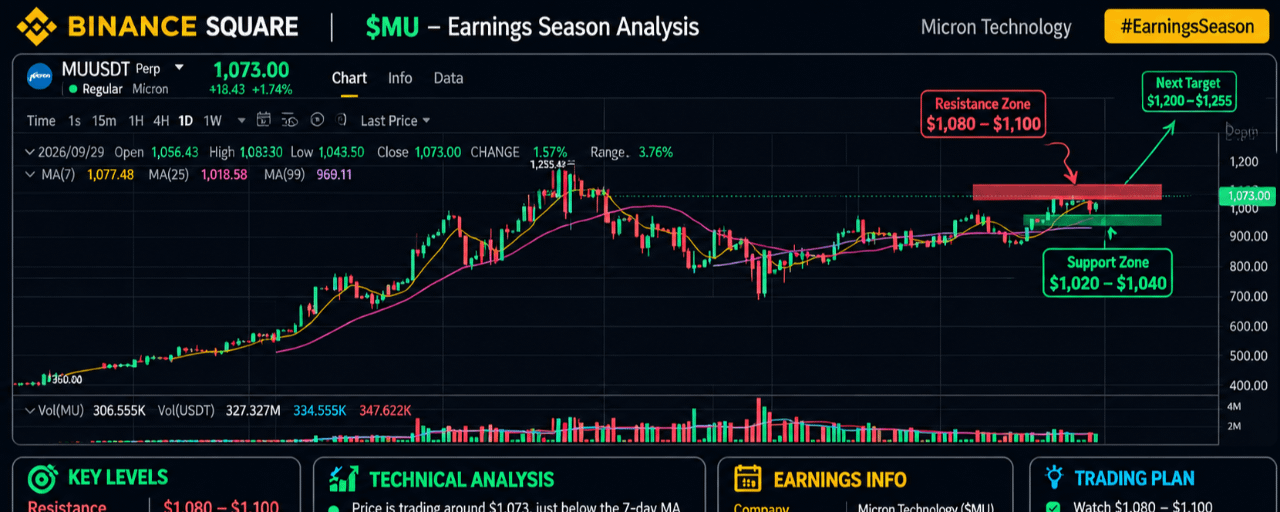
$MU is sitting around $1,073 ahead of tomorrow’s earnings, with the chart still holding well above the 25D MA at $1,018.58.
The level I’m watching is $1,080–$1,100. A clean break above that zone could bring the previous $1,200–$1,255 area back into focus.
But earnings are the real test. Micron is guiding for roughly $50B revenue, ~86% gross margin and $31 non-GAAP EPS for Q4.
For me, the key question isn't just whether MU
{future}(MUUSDT)
beats. What matters is the FY2027 guidance and the outlook for memory/HBM demand.
I’m watching $1,100 above and $1,020–$1,040 below.
$MU #EarningsSeason #Micron #Semiconductors #BinanceSquare
$MU EARNINGS IN FOCUS 👀
$MU is sitting around $1,073 ahead of tomorrow’s earnings, with the chart still holding well above the 25D MA at $1,018.58.
The level I’m watching is $1,080–$1,100. A clean break above that zone could bring the previous $1,200–$1,255 area back into focus.
But earnings are the real test. Micron is guiding for roughly $50B revenue, ~86% gross margin and $31 non-GAAP EPS for Q4.
For me, the key question isn't just whether MU
beats. What matters is the FY2027 guidance and the outlook for memory/HBM demand.
I’m watching $1,100 above and $1,020–$1,040 below.
$MU #EarningsSeason #Micron #Semiconductors #BinanceSquare
$MU is sitting around $1,073 ahead of tomorrow’s earnings, with the chart still holding well above the 25D MA at $1,018.58.
The level I’m watching is $1,080–$1,100. A clean break above that zone could bring the previous $1,200–$1,255 area back into focus.
But earnings are the real test. Micron is guiding for roughly $50B revenue, ~86% gross margin and $31 non-GAAP EPS for Q4.
For me, the key question isn't just whether MU
beats. What matters is the FY2027 guidance and the outlook for memory/HBM demand.
I’m watching $1,100 above and $1,020–$1,040 below.
$MU #EarningsSeason #Micron #Semiconductors #BinanceSquare
101
Article
$MU EARNINGS NEXT: THE CHART IS STRONG — BUT THE BAR IS HIGH$MU #EarningsSeason
{future}(MUUSDT)
Micron ($MU) reports FY2026 Q4 earnings tomorrow, September 30, after the U.S. market close, so this is one of those setups where the chart and the numbers both matter.
Looking at the 1D chart, $MU is trading around $1,073.
The bigger trend is still strong. Price is well above the 25-day MA at $1,018.58 and 99-day MA at $969.11. But short term, price is sitting just below the 7-day MA at $1,077.48, after recently pushing into the $1,080–$1,100 area.
That's the part I'm watching.
The levels on my chart
Resistance: $1,080–$1,100
Major upside zone: $1,200–$1,255
First support: $1,020–$1,040
Major support: ~$970
If $MU can reclaim and hold above $1,100 after earnings, I'd watch how price reacts around the previous major high near $1,255.
On the other hand, a sharp rejection followed by a move back below $1,020 would change the short-term structure and put the lower support area back in focus.
But here's the real earnings test
Micron's own Q4 guidance calls for approximately:
Revenue: $50B ± $1B
Gross margin: ~86%
Non-GAAP EPS: $31 ± $1
And that's why simply beating the headline numbers may not be enough.
The market will also be listening closely to FY2027 guidance, memory pricing, DRAM/NAND demand and HBM demand.
Recent previews put expectations around $50.6B revenue and $31.52 EPS, slightly above Micron's own midpoint guidance. That means the market has already set a high bar.
So for me, the interesting question isn't just:
“Will Micron beat earnings?”
It's:
“Will the guidance be strong enough to justify the expectations already built into $MU?”
That's where the real volatility could come from.
I'm not chasing the move before the report. I'd rather see how price reacts to the actual numbers and guidance.
$1,100 is the level I'm watching on the upside.
$1,020–$1,040 is the area I'm watching underneath.
Let's see what Micron delivers. 👀
#EarningsSeason #MU #Micron #BinanceSquare
FOLLOW FOR MORE UPDATES
$MU EARNINGS NEXT: THE CHART IS STRONG — BUT THE BAR IS HIGH
$MU #EarningsSeason
Micron ($MU ) reports FY2026 Q4 earnings tomorrow, September 30, after the U.S. market close, so this is one of those setups where the chart and the numbers both matter.
Looking at the 1D chart, $MU is trading around $1,073.
The bigger trend is still strong. Price is well above the 25-day MA at $1,018.58 and 99-day MA at $969.11. But short term, price is sitting just below the 7-day MA at $1,077.48, after recently pushing into the $1,080–$1,100 area.
That's the part I'm watching.
The levels on my chart
Resistance: $1,080–$1,100
Major upside zone: $1,200–$1,255
First support: $1,020–$1,040
Major support: ~$970
If $MU can reclaim and hold above $1,100 after earnings, I'd watch how price reacts around the previous major high near $1,255.
On the other hand, a sharp rejection followed by a move back below $1,020 would change the short-term structure and put the lower support area back in focus.
But here's the real earnings test
Micron's own Q4 guidance calls for approximately:
Revenue: $50B ± $1B
Gross margin: ~86%
Non-GAAP EPS: $31 ± $1
And that's why simply beating the headline numbers may not be enough.
The market will also be listening closely to FY2027 guidance, memory pricing, DRAM/NAND demand and HBM demand.
Recent previews put expectations around $50.6B revenue and $31.52 EPS, slightly above Micron's own midpoint guidance. That means the market has already set a high bar.
So for me, the interesting question isn't just:
“Will Micron beat earnings?”
It's:
“Will the guidance be strong enough to justify the expectations already built into $MU ?”
That's where the real volatility could come from.
I'm not chasing the move before the report. I'd rather see how price reacts to the actual numbers and guidance.
$1,100 is the level I'm watching on the upside.
$1,020–$1,040 is the area I'm watching underneath.
Let's see what Micron delivers. 👀
#EarningsSeason #MU #Micron #BinanceSquare
FOLLOW FOR MORE UPDATES
Micron ($MU ) reports FY2026 Q4 earnings tomorrow, September 30, after the U.S. market close, so this is one of those setups where the chart and the numbers both matter.
Looking at the 1D chart, $MU is trading around $1,073.
The bigger trend is still strong. Price is well above the 25-day MA at $1,018.58 and 99-day MA at $969.11. But short term, price is sitting just below the 7-day MA at $1,077.48, after recently pushing into the $1,080–$1,100 area.
That's the part I'm watching.
The levels on my chart
Resistance: $1,080–$1,100
Major upside zone: $1,200–$1,255
First support: $1,020–$1,040
Major support: ~$970
If $MU can reclaim and hold above $1,100 after earnings, I'd watch how price reacts around the previous major high near $1,255.
On the other hand, a sharp rejection followed by a move back below $1,020 would change the short-term structure and put the lower support area back in focus.
But here's the real earnings test
Micron's own Q4 guidance calls for approximately:
Revenue: $50B ± $1B
Gross margin: ~86%
Non-GAAP EPS: $31 ± $1
And that's why simply beating the headline numbers may not be enough.
The market will also be listening closely to FY2027 guidance, memory pricing, DRAM/NAND demand and HBM demand.
Recent previews put expectations around $50.6B revenue and $31.52 EPS, slightly above Micron's own midpoint guidance. That means the market has already set a high bar.
So for me, the interesting question isn't just:
“Will Micron beat earnings?”
It's:
“Will the guidance be strong enough to justify the expectations already built into $MU ?”
That's where the real volatility could come from.
I'm not chasing the move before the report. I'd rather see how price reacts to the actual numbers and guidance.
$1,100 is the level I'm watching on the upside.
$1,020–$1,040 is the area I'm watching underneath.
Let's see what Micron delivers. 👀
#EarningsSeason #MU #Micron #BinanceSquare
FOLLOW FOR MORE UPDATES
79
$CL $BZ
{future}(CLUSDT)
{future}(BZUSDT)
🚨 Trump Says Iran Is “Seriously Collapsing” — Oil Could Fall Sharply
U.S. President Donald Trump said Iran is “seriously collapsing” and that the conflict could end soon. He also expects oil prices to move sharply lower once the situation comes to an end. For the oil market, the key factor remains the situation around the Strait of Hormuz and how quickly regional supply and shipping conditions normalize. Oil prices were already lower on September 29, with Brent around $103 and WTI around $91, although both remained elevated on a monthly basis. If tensions ease and supply flows recover, that could put further pressure on crude prices. But for now, traders are still watching the actual developments in the region rather than relying only on political statements.
#CrudeOil #Iran #Trump #MarketUpdate #BinanceSquare
$CL $BZ
🚨 Trump Says Iran Is “Seriously Collapsing” — Oil Could Fall Sharply
U.S. President Donald Trump said Iran is “seriously collapsing” and that the conflict could end soon. He also expects oil prices to move sharply lower once the situation comes to an end. For the oil market, the key factor remains the situation around the Strait of Hormuz and how quickly regional supply and shipping conditions normalize. Oil prices were already lower on September 29, with Brent around $103 and WTI around $91, although both remained elevated on a monthly basis. If tensions ease and supply flows recover, that could put further pressure on crude prices. But for now, traders are still watching the actual developments in the region rather than relying only on political statements.
#CrudeOil #Iran #Trump #MarketUpdate #BinanceSquare
🚨 Trump Says Iran Is “Seriously Collapsing” — Oil Could Fall Sharply
U.S. President Donald Trump said Iran is “seriously collapsing” and that the conflict could end soon. He also expects oil prices to move sharply lower once the situation comes to an end. For the oil market, the key factor remains the situation around the Strait of Hormuz and how quickly regional supply and shipping conditions normalize. Oil prices were already lower on September 29, with Brent around $103 and WTI around $91, although both remained elevated on a monthly basis. If tensions ease and supply flows recover, that could put further pressure on crude prices. But for now, traders are still watching the actual developments in the region rather than relying only on political statements.
#CrudeOil #Iran #Trump #MarketUpdate #BinanceSquare
45
Verified

Article
3 COINS TRADERS ARE WATCHING RIGHT NOW: $NEAR, $PEPE & $ICPThe Binance “Most Searched (6H)” list is giving us an interesting mix right now.
$NEAR , $PEPE and $ICP are all attracting attention, but for completely different reasons. NEAR is dealing with fresh institutional access and ecosystem expansion, PEPE is sitting in a tighter technical structure, while ICP has been one of the stronger movers recently.
Here’s how I’m looking at all three.
NEAR — The News Catalyst Is Getting Bigger
Your screenshot shows NEAR around $4.773, down 6.69%, but the recent pullback doesn't tell the whole story.
The bigger development is on the institutional side.
Bitwise's NEAR ETF has cleared its NYSE Arca listing and SEC registration hurdles, opening a route for traditional brokerage investors to get exposure to NEAR. The proposed fund is designed to hold NEAR directly and stake its holdings, subject to the fund's structure.
There's also been a meaningful development on the trading side: NEAR spot trading went live on Hyperliquid, giving traders direct NEAR/USDC spot access alongside the existing perpetual market.
And the ecosystem isn't standing still. NEAR recently added support for Ondo's tokenized U.S. stocks and ETFs through NEAR Intents, allowing eligible users to request tokenized assets using stablecoins or other supported crypto assets across multiple networks.
What I'm watching on the chart
From the levels in your screenshot:
Current: ~$4.773Support: $4.30–$4.50Resistance: $5.20–$5.40
NEAR had a strong run before pulling back, so I wouldn't chase a green candle just because search volume is high.
The important question is whether buyers can keep defending the $4.30–$4.50 area. A recovery back toward $5 would put the $5.20–$5.40 zone back into focus.
The recent price data also shows how volatile this move has been: NEAR's September 28 session closed around $474.18 INR after reaching about ₹531.50 intraday, following several large daily moves earlier in the month.
My takeaway: NEAR has a lot more going on than just search activity. ETF access, new spot-market availability and ecosystem developments are the headlines I'd keep tracking.
{future}(NEARUSDT)
PEPE — Quiet Chart, But Traders Are Paying Attention
PEPE is the completely different setup.
Your screenshot shows:
Price: $0.000004276H change: +2.15%Status: Rapid Riser
Unlike NEAR, I wouldn't build the PEPE case around a major fundamental announcement right now. The interesting part is the price structure and renewed attention.
The chart setup is much tighter than the move we saw earlier. That matters because when volatility contracts into a narrow range, the next expansion can become much larger — although the direction still needs confirmation.
Levels I'm watching
Resistance: $0.00000450–$0.00000500Support: ~$0.00000380–$0.00000350Current: ~$0.00000427
If PEPE pushes through $0.00000450 with convincing volume, traders could start watching the $0.00000500 area.
On the other hand, losing the $0.00000380 region would weaken the current setup and bring the lower support zone back into focus.
That's why I wouldn't treat PEPE's +2.15% screenshot reading as confirmation of a breakout. Search activity tells us people are looking; price and volume have to show whether they're actually buying.
And that's especially important with a meme coin, where attention can change very quickly.
{spot}(PEPEUSDT)
ICP — Momentum Is Already Showing Up in Price
ICP is probably the most interesting momentum setup in the screenshot.
Your snapshot has ICP at approximately $3.341, up 12.08%, with the Rapid Riser tag.
That move isn't happening in isolation.
Recent market data showed ICP gaining 7.44% in roughly four hours to $3.32, taking its 24-hour gain to about 8.21% at that point on September 29. Another recent report put ICP's monthly gain at roughly 35% as the token moved above $3.30.
So unlike PEPE, where the main thing I'm watching is compression, ICP already has momentum behind it.
Key levels
From the setup:
Current: ~$3.34Support: $3.00–$3.15Near-term level: ~$3.20Resistance: $3.60–$3.80
The $3.60–$3.80 zone is the big area I'd watch after this move.
If ICP keeps holding above the $3.20 area while volume remains healthy, buyers have a clearer structure to work with.
But after a double-digit move, chasing becomes a different game. A pullback toward support isn't automatically bearish — sometimes it's simply the market cooling down after a fast move.
The Interesting Part: They're Three Different Setups
That's actually why I like looking at these three together.
$NEAR → news + institutional catalyst + ecosystem growth
$PEPE → search interest + tight technical structure
$ICP → strong momentum + breakout attempt
The common factor is attention, but attention alone isn't enough.
For NEAR, I'm watching whether the ETF and ecosystem headlines translate into sustained demand.
For PEPE, I'm watching whether the current compression actually resolves with volume.
For ICP, I'm watching whether the recent momentum can hold after the sharp move.
So rather than asking “which one will pump?”, I'd be watching price + volume + key levels on all three.
NEAR: $4.30–$4.50 support / $5.20–$5.40 resistance
PEPE: $0.00000380–$0.00000350 support / $0.00000450–$0.00000500 resistance
ICP: $3.00–$3.15 support / $3.60–$3.80 resistance
These are levels to monitor, not guaranteed targets.
Which one are you watching most closely right now — NEAR, PEPE or ICP?
#NEAR #PEPE #ICP #Crypto #BinanceSquare
FOLLOW FOR MORE UPDATES
3 COINS TRADERS ARE WATCHING RIGHT NOW: $NEAR, $PEPE & $ICP
The Binance “Most Searched (6H)” list is giving us an interesting mix right now.
$NEAR , $PEPE and $ICP are all attracting attention, but for completely different reasons. NEAR is dealing with fresh institutional access and ecosystem expansion, PEPE is sitting in a tighter technical structure, while ICP has been one of the stronger movers recently.
Here’s how I’m looking at all three.
NEAR — The News Catalyst Is Getting Bigger
Your screenshot shows NEAR around $4.773, down 6.69%, but the recent pullback doesn't tell the whole story.
The bigger development is on the institutional side.
Bitwise's NEAR ETF has cleared its NYSE Arca listing and SEC registration hurdles, opening a route for traditional brokerage investors to get exposure to NEAR. The proposed fund is designed to hold NEAR directly and stake its holdings, subject to the fund's structure.
There's also been a meaningful development on the trading side: NEAR spot trading went live on Hyperliquid, giving traders direct NEAR/USDC spot access alongside the existing perpetual market.
And the ecosystem isn't standing still. NEAR recently added support for Ondo's tokenized U.S. stocks and ETFs through NEAR Intents, allowing eligible users to request tokenized assets using stablecoins or other supported crypto assets across multiple networks.
What I'm watching on the chart
From the levels in your screenshot:
Current: ~$4.773Support: $4.30–$4.50Resistance: $5.20–$5.40
NEAR had a strong run before pulling back, so I wouldn't chase a green candle just because search volume is high.
The important question is whether buyers can keep defending the $4.30–$4.50 area. A recovery back toward $5 would put the $5.20–$5.40 zone back into focus.
The recent price data also shows how volatile this move has been: NEAR's September 28 session closed around $474.18 INR after reaching about ₹531.50 intraday, following several large daily moves earlier in the month.
My takeaway: NEAR has a lot more going on than just search activity. ETF access, new spot-market availability and ecosystem developments are the headlines I'd keep tracking.
PEPE — Quiet Chart, But Traders Are Paying Attention
PEPE is the completely different setup.
Your screenshot shows:
Price: $0.000004276H change: +2.15%Status: Rapid Riser
Unlike NEAR, I wouldn't build the PEPE case around a major fundamental announcement right now. The interesting part is the price structure and renewed attention.
The chart setup is much tighter than the move we saw earlier. That matters because when volatility contracts into a narrow range, the next expansion can become much larger — although the direction still needs confirmation.
Levels I'm watching
Resistance: $0.00000450–$0.00000500Support: ~$0.00000380–$0.00000350Current: ~$0.00000427
If PEPE pushes through $0.00000450 with convincing volume, traders could start watching the $0.00000500 area.
On the other hand, losing the $0.00000380 region would weaken the current setup and bring the lower support zone back into focus.
That's why I wouldn't treat PEPE's +2.15% screenshot reading as confirmation of a breakout. Search activity tells us people are looking; price and volume have to show whether they're actually buying.
And that's especially important with a meme coin, where attention can change very quickly.
ICP — Momentum Is Already Showing Up in Price
ICP is probably the most interesting momentum setup in the screenshot.
Your snapshot has ICP at approximately $3.341, up 12.08%, with the Rapid Riser tag.
That move isn't happening in isolation.
Recent market data showed ICP gaining 7.44% in roughly four hours to $3.32, taking its 24-hour gain to about 8.21% at that point on September 29. Another recent report put ICP's monthly gain at roughly 35% as the token moved above $3.30.
So unlike PEPE, where the main thing I'm watching is compression, ICP already has momentum behind it.
Key levels
From the setup:
Current: ~$3.34Support: $3.00–$3.15Near-term level: ~$3.20Resistance: $3.60–$3.80
The $3.60–$3.80 zone is the big area I'd watch after this move.
If ICP keeps holding above the $3.20 area while volume remains healthy, buyers have a clearer structure to work with.
But after a double-digit move, chasing becomes a different game. A pullback toward support isn't automatically bearish — sometimes it's simply the market cooling down after a fast move.
The Interesting Part: They're Three Different Setups
That's actually why I like looking at these three together.
$NEAR → news + institutional catalyst + ecosystem growth
$PEPE → search interest + tight technical structure
$ICP → strong momentum + breakout attempt
The common factor is attention, but attention alone isn't enough.
For NEAR, I'm watching whether the ETF and ecosystem headlines translate into sustained demand.
For PEPE, I'm watching whether the current compression actually resolves with volume.
For ICP, I'm watching whether the recent momentum can hold after the sharp move.
So rather than asking “which one will pump?”, I'd be watching price + volume + key levels on all three.
NEAR: $4.30–$4.50 support / $5.20–$5.40 resistance
PEPE: $0.00000380–$0.00000350 support / $0.00000450–$0.00000500 resistance
ICP: $3.00–$3.15 support / $3.60–$3.80 resistance
These are levels to monitor, not guaranteed targets.
Which one are you watching most closely right now — NEAR, PEPE or ICP?
#NEAR #PEPE #ICP #Crypto #BinanceSquare
FOLLOW FOR MORE UPDATES
$NEAR , $PEPE and $ICP are all attracting attention, but for completely different reasons. NEAR is dealing with fresh institutional access and ecosystem expansion, PEPE is sitting in a tighter technical structure, while ICP has been one of the stronger movers recently.
Here’s how I’m looking at all three.
NEAR — The News Catalyst Is Getting Bigger
Your screenshot shows NEAR around $4.773, down 6.69%, but the recent pullback doesn't tell the whole story.
The bigger development is on the institutional side.
Bitwise's NEAR ETF has cleared its NYSE Arca listing and SEC registration hurdles, opening a route for traditional brokerage investors to get exposure to NEAR. The proposed fund is designed to hold NEAR directly and stake its holdings, subject to the fund's structure.
There's also been a meaningful development on the trading side: NEAR spot trading went live on Hyperliquid, giving traders direct NEAR/USDC spot access alongside the existing perpetual market.
And the ecosystem isn't standing still. NEAR recently added support for Ondo's tokenized U.S. stocks and ETFs through NEAR Intents, allowing eligible users to request tokenized assets using stablecoins or other supported crypto assets across multiple networks.
What I'm watching on the chart
From the levels in your screenshot:
Current: ~$4.773Support: $4.30–$4.50Resistance: $5.20–$5.40
NEAR had a strong run before pulling back, so I wouldn't chase a green candle just because search volume is high.
The important question is whether buyers can keep defending the $4.30–$4.50 area. A recovery back toward $5 would put the $5.20–$5.40 zone back into focus.
The recent price data also shows how volatile this move has been: NEAR's September 28 session closed around $474.18 INR after reaching about ₹531.50 intraday, following several large daily moves earlier in the month.
My takeaway: NEAR has a lot more going on than just search activity. ETF access, new spot-market availability and ecosystem developments are the headlines I'd keep tracking.
PEPE — Quiet Chart, But Traders Are Paying Attention
PEPE is the completely different setup.
Your screenshot shows:
Price: $0.000004276H change: +2.15%Status: Rapid Riser
Unlike NEAR, I wouldn't build the PEPE case around a major fundamental announcement right now. The interesting part is the price structure and renewed attention.
The chart setup is much tighter than the move we saw earlier. That matters because when volatility contracts into a narrow range, the next expansion can become much larger — although the direction still needs confirmation.
Levels I'm watching
Resistance: $0.00000450–$0.00000500Support: ~$0.00000380–$0.00000350Current: ~$0.00000427
If PEPE pushes through $0.00000450 with convincing volume, traders could start watching the $0.00000500 area.
On the other hand, losing the $0.00000380 region would weaken the current setup and bring the lower support zone back into focus.
That's why I wouldn't treat PEPE's +2.15% screenshot reading as confirmation of a breakout. Search activity tells us people are looking; price and volume have to show whether they're actually buying.
And that's especially important with a meme coin, where attention can change very quickly.
ICP — Momentum Is Already Showing Up in Price
ICP is probably the most interesting momentum setup in the screenshot.
Your snapshot has ICP at approximately $3.341, up 12.08%, with the Rapid Riser tag.
That move isn't happening in isolation.
Recent market data showed ICP gaining 7.44% in roughly four hours to $3.32, taking its 24-hour gain to about 8.21% at that point on September 29. Another recent report put ICP's monthly gain at roughly 35% as the token moved above $3.30.
So unlike PEPE, where the main thing I'm watching is compression, ICP already has momentum behind it.
Key levels
From the setup:
Current: ~$3.34Support: $3.00–$3.15Near-term level: ~$3.20Resistance: $3.60–$3.80
The $3.60–$3.80 zone is the big area I'd watch after this move.
If ICP keeps holding above the $3.20 area while volume remains healthy, buyers have a clearer structure to work with.
But after a double-digit move, chasing becomes a different game. A pullback toward support isn't automatically bearish — sometimes it's simply the market cooling down after a fast move.
The Interesting Part: They're Three Different Setups
That's actually why I like looking at these three together.
$NEAR → news + institutional catalyst + ecosystem growth
$PEPE → search interest + tight technical structure
$ICP → strong momentum + breakout attempt
The common factor is attention, but attention alone isn't enough.
For NEAR, I'm watching whether the ETF and ecosystem headlines translate into sustained demand.
For PEPE, I'm watching whether the current compression actually resolves with volume.
For ICP, I'm watching whether the recent momentum can hold after the sharp move.
So rather than asking “which one will pump?”, I'd be watching price + volume + key levels on all three.
NEAR: $4.30–$4.50 support / $5.20–$5.40 resistance
PEPE: $0.00000380–$0.00000350 support / $0.00000450–$0.00000500 resistance
ICP: $3.00–$3.15 support / $3.60–$3.80 resistance
These are levels to monitor, not guaranteed targets.
Which one are you watching most closely right now — NEAR, PEPE or ICP?
#NEAR #PEPE #ICP #Crypto #BinanceSquare
FOLLOW FOR MORE UPDATES
1
376
·
--
Bullish
$NVDA $TAO $NEAR
{future}(NEARUSDT)
{future}(TAOUSDT)
{future}(NVDAUSDT)
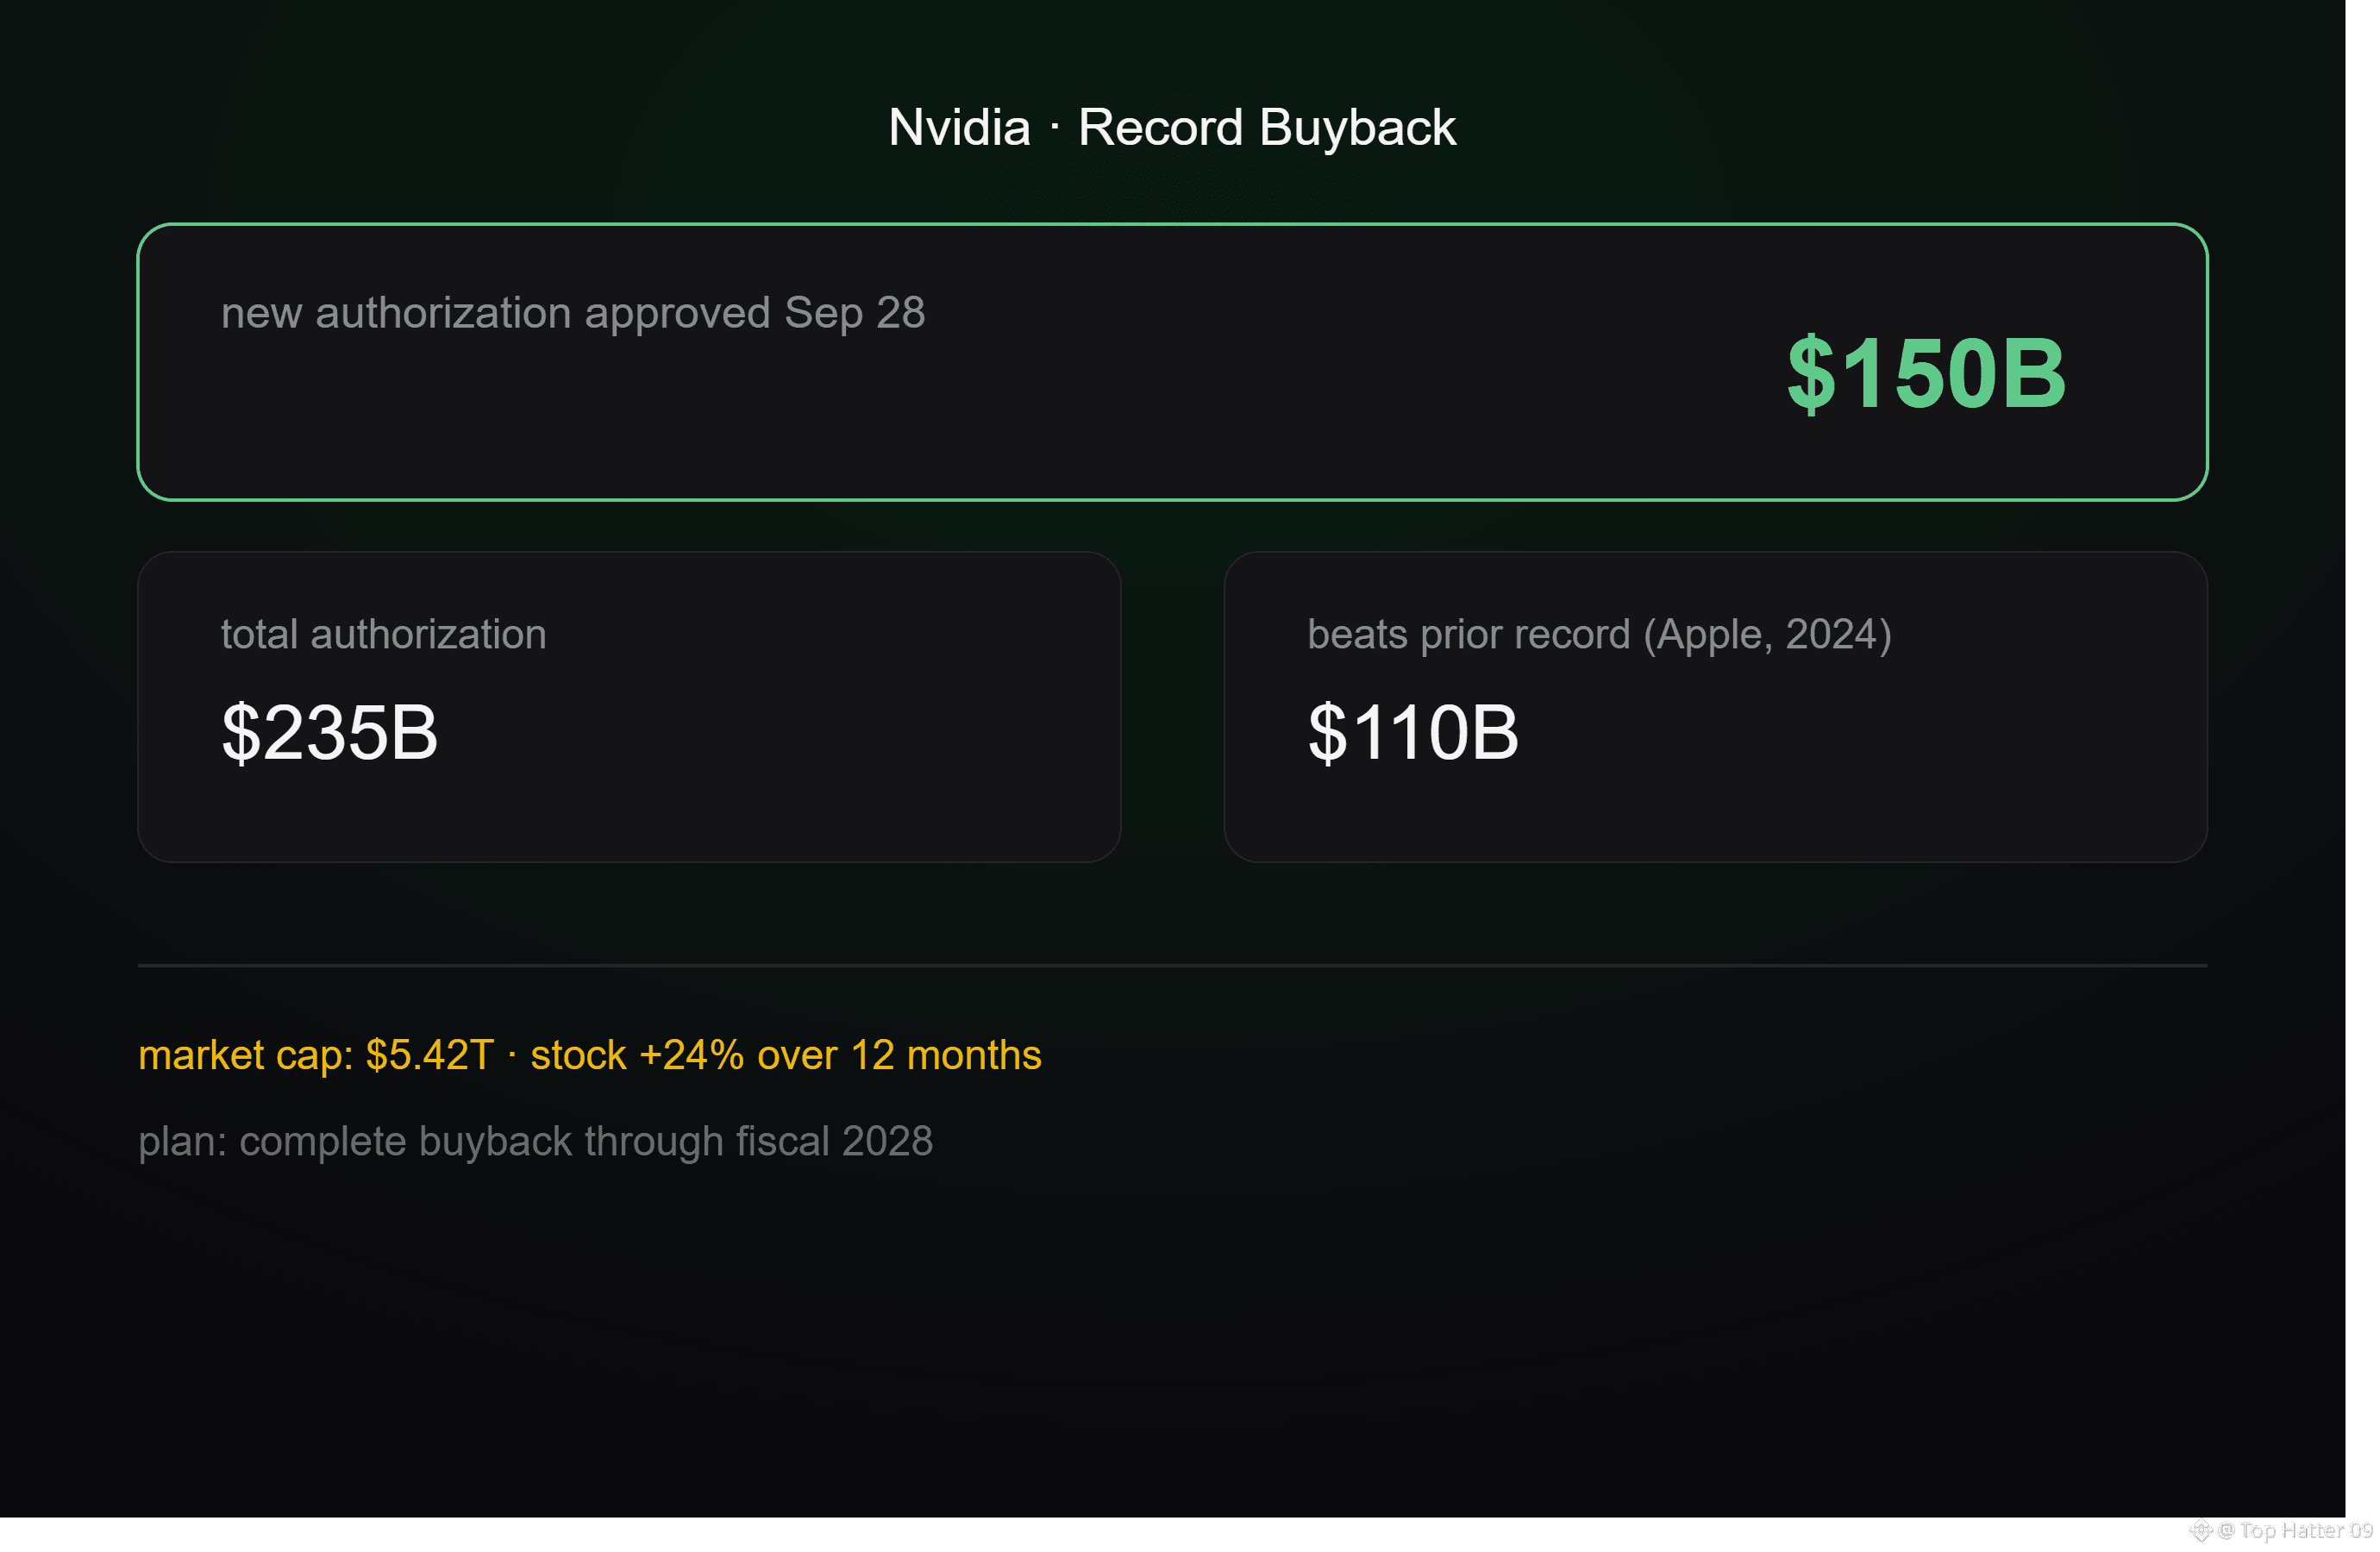
Nvidia just approved the largest single stock buyback authorization in US corporate history. On September 28, the board signed off on an additional $150 billion, bringing the company's total buyback capacity to $235 billion. That beats the previous record of $110 billion set by Apple back in 2024.
CEO Jensen Huang tied it directly to what he called a once-in-a-generation shift to AI and accelerated computing, saying the company's cash generation now lets them invest in growth while still returning capital to shareholders. In practical terms, a buyback like this means Nvidia purchases its own shares off the market, which reduces the total share count and effectively increases the ownership stake of everyone who holds on.
The plan is to complete the buyback by fiscal 2028. The market reacted well, shares rose more than 2% and are trading around $229, with the stock already up 24% over the past 12 months. That puts Nvidia's market cap at $5.42 trillion.
This isn't a crypto story directly, but it ties into the same AI infrastructure spending theme we've been tracking with tokens like $TAO, $FET, and $NEAR, since AI capex news like this tends to ripple through that whole sector.
#NVDA #AIStocks #Nvidia
$NVDA $TAO $NEAR
Nvidia just approved the largest single stock buyback authorization in US corporate history. On September 28, the board signed off on an additional $150 billion, bringing the company's total buyback capacity to $235 billion. That beats the previous record of $110 billion set by Apple back in 2024.
CEO Jensen Huang tied it directly to what he called a once-in-a-generation shift to AI and accelerated computing, saying the company's cash generation now lets them invest in growth while still returning capital to shareholders. In practical terms, a buyback like this means Nvidia purchases its own shares off the market, which reduces the total share count and effectively increases the ownership stake of everyone who holds on.
The plan is to complete the buyback by fiscal 2028. The market reacted well, shares rose more than 2% and are trading around $229, with the stock already up 24% over the past 12 months. That puts Nvidia's market cap at $5.42 trillion.
This isn't a crypto story directly, but it ties into the same AI infrastructure spending theme we've been tracking with tokens like $TAO , $FET, and $NEAR , since AI capex news like this tends to ripple through that whole sector.
#NVDA #AIStocks #Nvidia
Nvidia just approved the largest single stock buyback authorization in US corporate history. On September 28, the board signed off on an additional $150 billion, bringing the company's total buyback capacity to $235 billion. That beats the previous record of $110 billion set by Apple back in 2024.
CEO Jensen Huang tied it directly to what he called a once-in-a-generation shift to AI and accelerated computing, saying the company's cash generation now lets them invest in growth while still returning capital to shareholders. In practical terms, a buyback like this means Nvidia purchases its own shares off the market, which reduces the total share count and effectively increases the ownership stake of everyone who holds on.
The plan is to complete the buyback by fiscal 2028. The market reacted well, shares rose more than 2% and are trading around $229, with the stock already up 24% over the past 12 months. That puts Nvidia's market cap at $5.42 trillion.
This isn't a crypto story directly, but it ties into the same AI infrastructure spending theme we've been tracking with tokens like $TAO , $FET, and $NEAR , since AI capex news like this tends to ripple through that whole sector.
#NVDA #AIStocks #Nvidia
354
$BTC #StrategyAdds1666BTCHoldingsReach847666
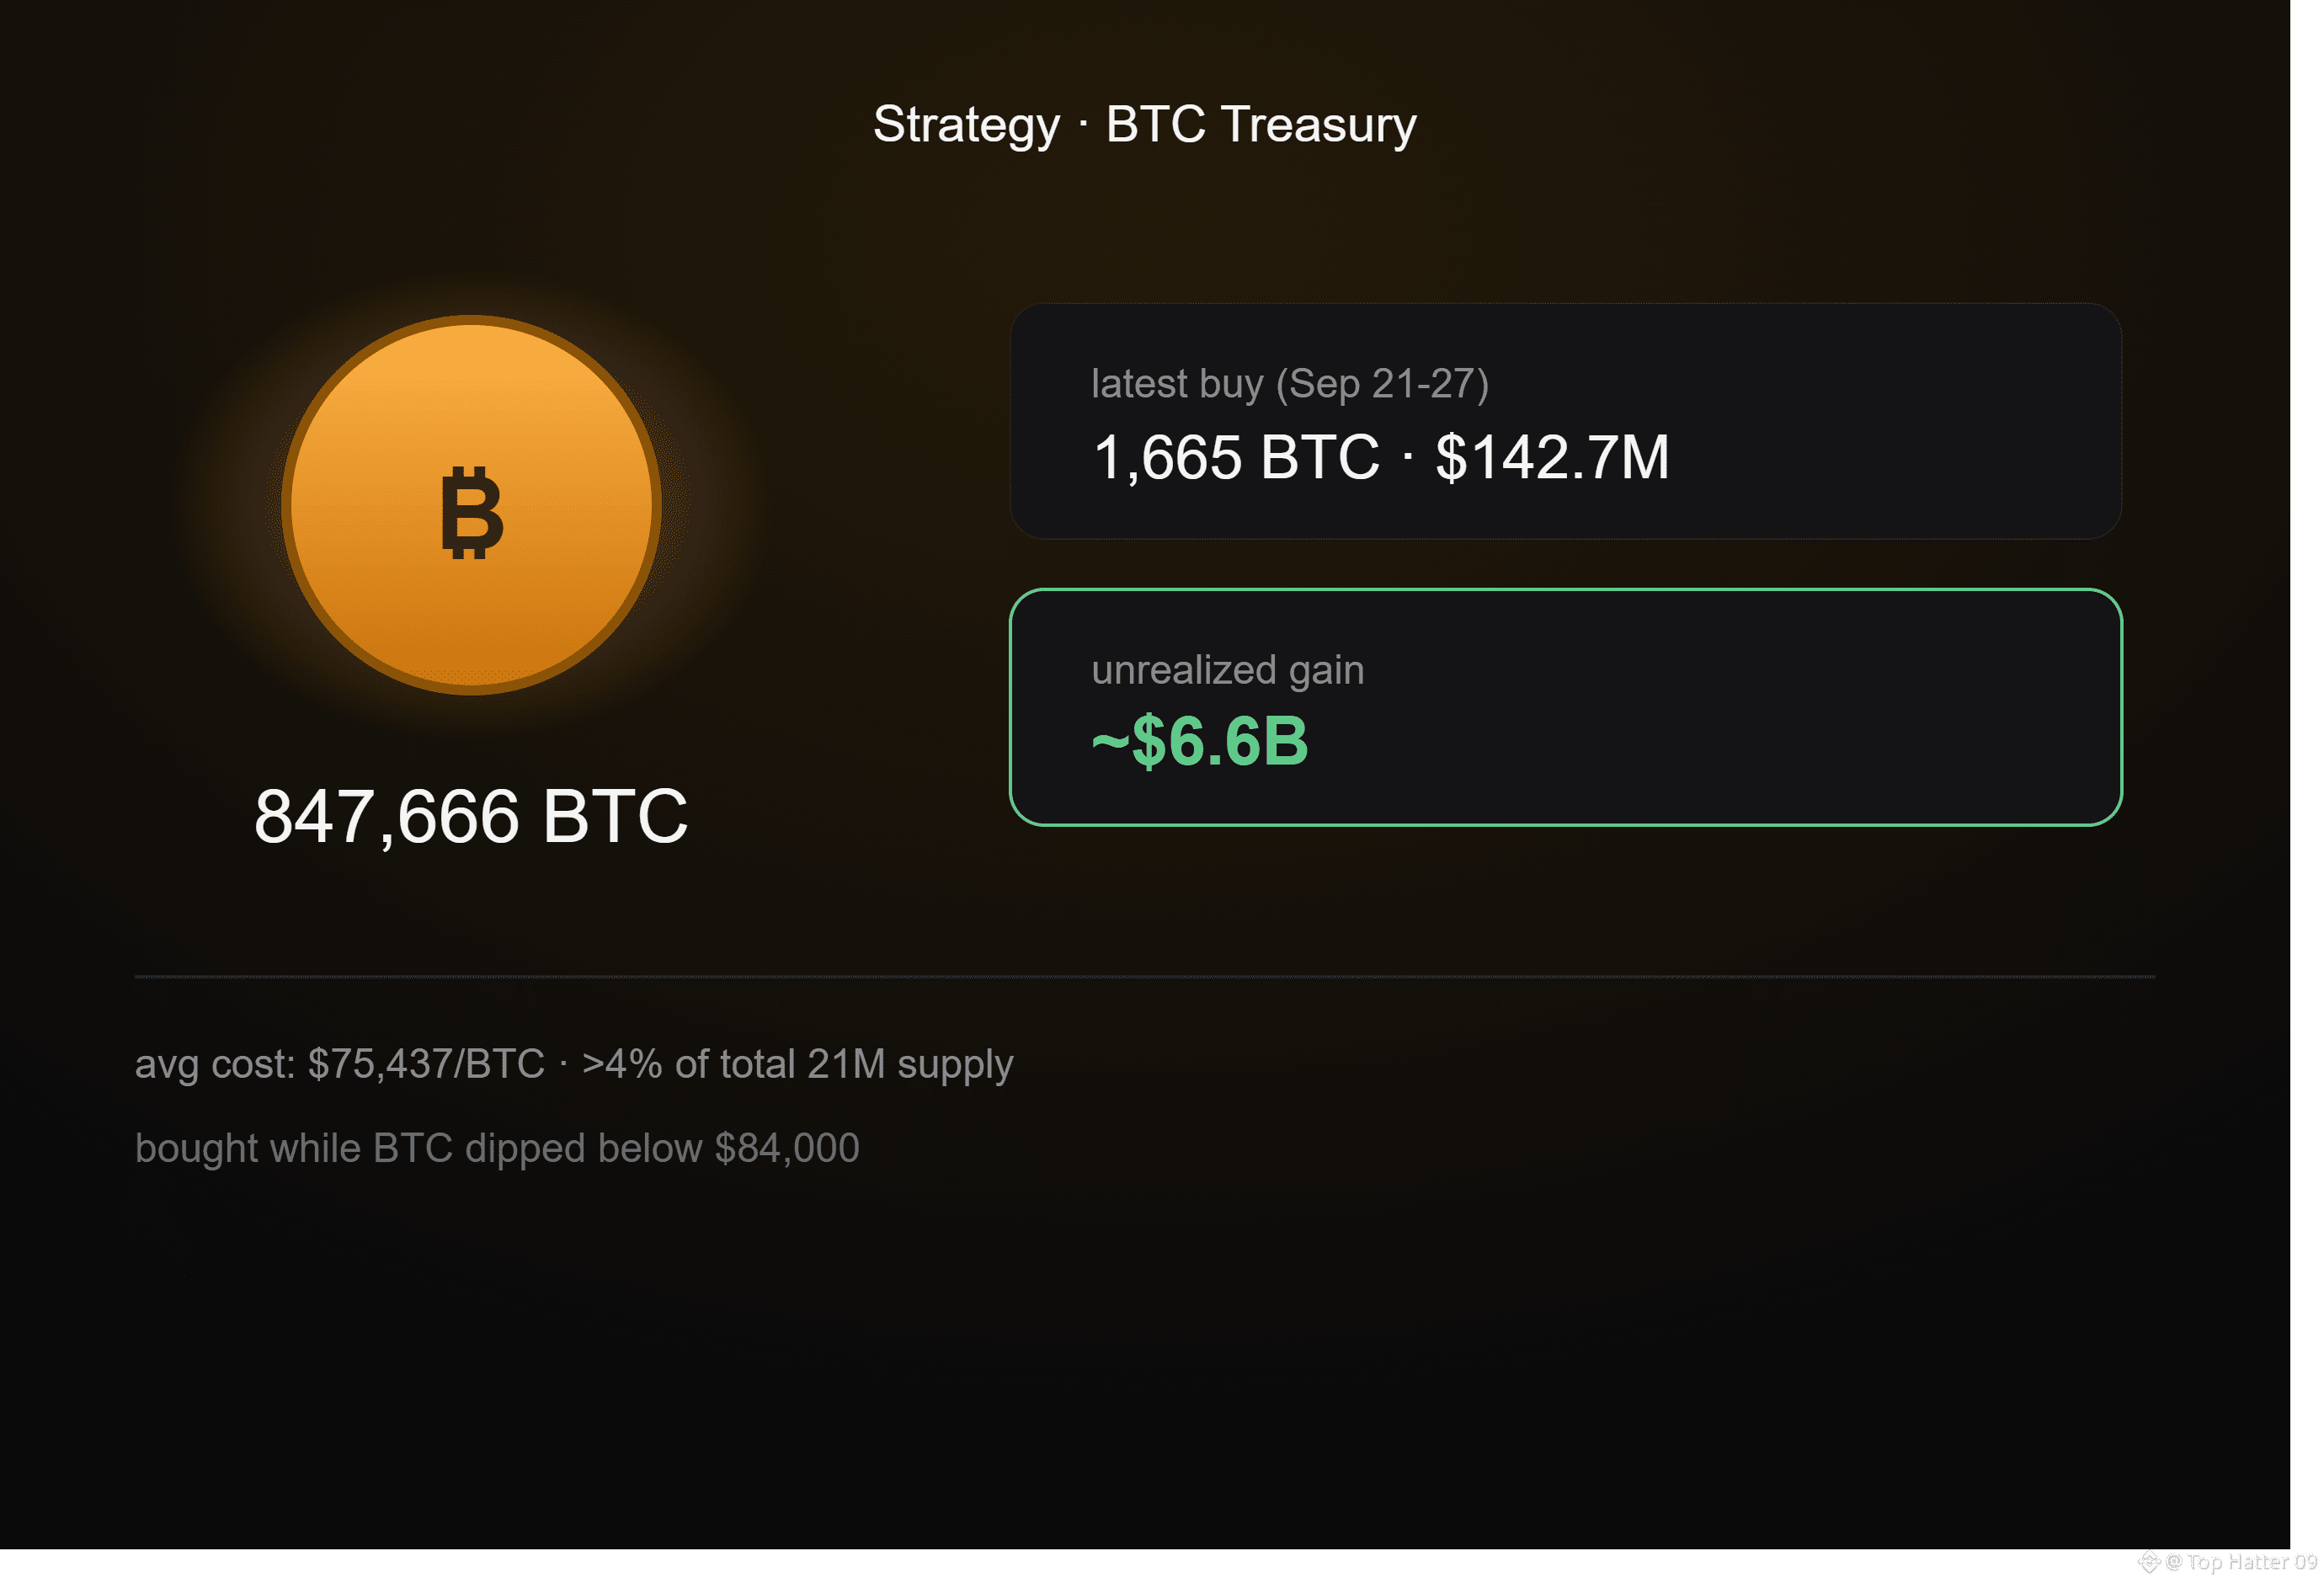
Michael Saylor's Strategy bought more Bitcoin again. Between September 21 and 27 the company picked up 1,665 BTC for $142.7 million, at an average price of $85,681 per coin. That brings its total holdings to 847,666 BTC, more than 4% of Bitcoin's entire 21 million supply cap.
The timing stands out because BTC itself had dropped below $84,000 the same week this was announced. Saylor gave his usual heads up too, posting a chart on Sunday with the caption "Even more orange," which has historically come a day before a new purchase gets confirmed.
Looking at the pattern, Strategy went quiet for two weeks earlier this year, restarted with 4,603 BTC at the end of August, skipped a week, bought 950 BTC, and now this 1,665 BTC purchase, so the buying pace has been gradually picking up. Alongside this, the company also repurchased $151.7 million of its STRC preferred shares and proposed switching dividend payments to a daily schedule instead of monthly.
Strategy's overall average cost across all its holdings is now $75,437 per Bitcoin, which puts them sitting on roughly $6.6 billion in unrealized gains at current prices. The approach hasn't changed either way, price down or up, they keep buying.
$BTC #Strategy #MicroStrategy
{future}(BTCUSDT)
$BTC #StrategyAdds1666BTCHoldingsReach847666
Michael Saylor's Strategy bought more Bitcoin again. Between September 21 and 27 the company picked up 1,665 BTC for $142.7 million, at an average price of $85,681 per coin. That brings its total holdings to 847,666 BTC, more than 4% of Bitcoin's entire 21 million supply cap.
The timing stands out because BTC itself had dropped below $84,000 the same week this was announced. Saylor gave his usual heads up too, posting a chart on Sunday with the caption "Even more orange," which has historically come a day before a new purchase gets confirmed.
Looking at the pattern, Strategy went quiet for two weeks earlier this year, restarted with 4,603 BTC at the end of August, skipped a week, bought 950 BTC, and now this 1,665 BTC purchase, so the buying pace has been gradually picking up. Alongside this, the company also repurchased $151.7 million of its STRC preferred shares and proposed switching dividend payments to a daily schedule instead of monthly.
Strategy's overall average cost across all its holdings is now $75,437 per Bitcoin, which puts them sitting on roughly $6.6 billion in unrealized gains at current prices. The approach hasn't changed either way, price down or up, they keep buying.
$BTC #Strategy #MicroStrategy
Michael Saylor's Strategy bought more Bitcoin again. Between September 21 and 27 the company picked up 1,665 BTC for $142.7 million, at an average price of $85,681 per coin. That brings its total holdings to 847,666 BTC, more than 4% of Bitcoin's entire 21 million supply cap.
The timing stands out because BTC itself had dropped below $84,000 the same week this was announced. Saylor gave his usual heads up too, posting a chart on Sunday with the caption "Even more orange," which has historically come a day before a new purchase gets confirmed.
Looking at the pattern, Strategy went quiet for two weeks earlier this year, restarted with 4,603 BTC at the end of August, skipped a week, bought 950 BTC, and now this 1,665 BTC purchase, so the buying pace has been gradually picking up. Alongside this, the company also repurchased $151.7 million of its STRC preferred shares and proposed switching dividend payments to a daily schedule instead of monthly.
Strategy's overall average cost across all its holdings is now $75,437 per Bitcoin, which puts them sitting on roughly $6.6 billion in unrealized gains at current prices. The approach hasn't changed either way, price down or up, they keep buying.
$BTC #Strategy #MicroStrategy
64
$ETH #BitMineETHHoldingsTop6Million
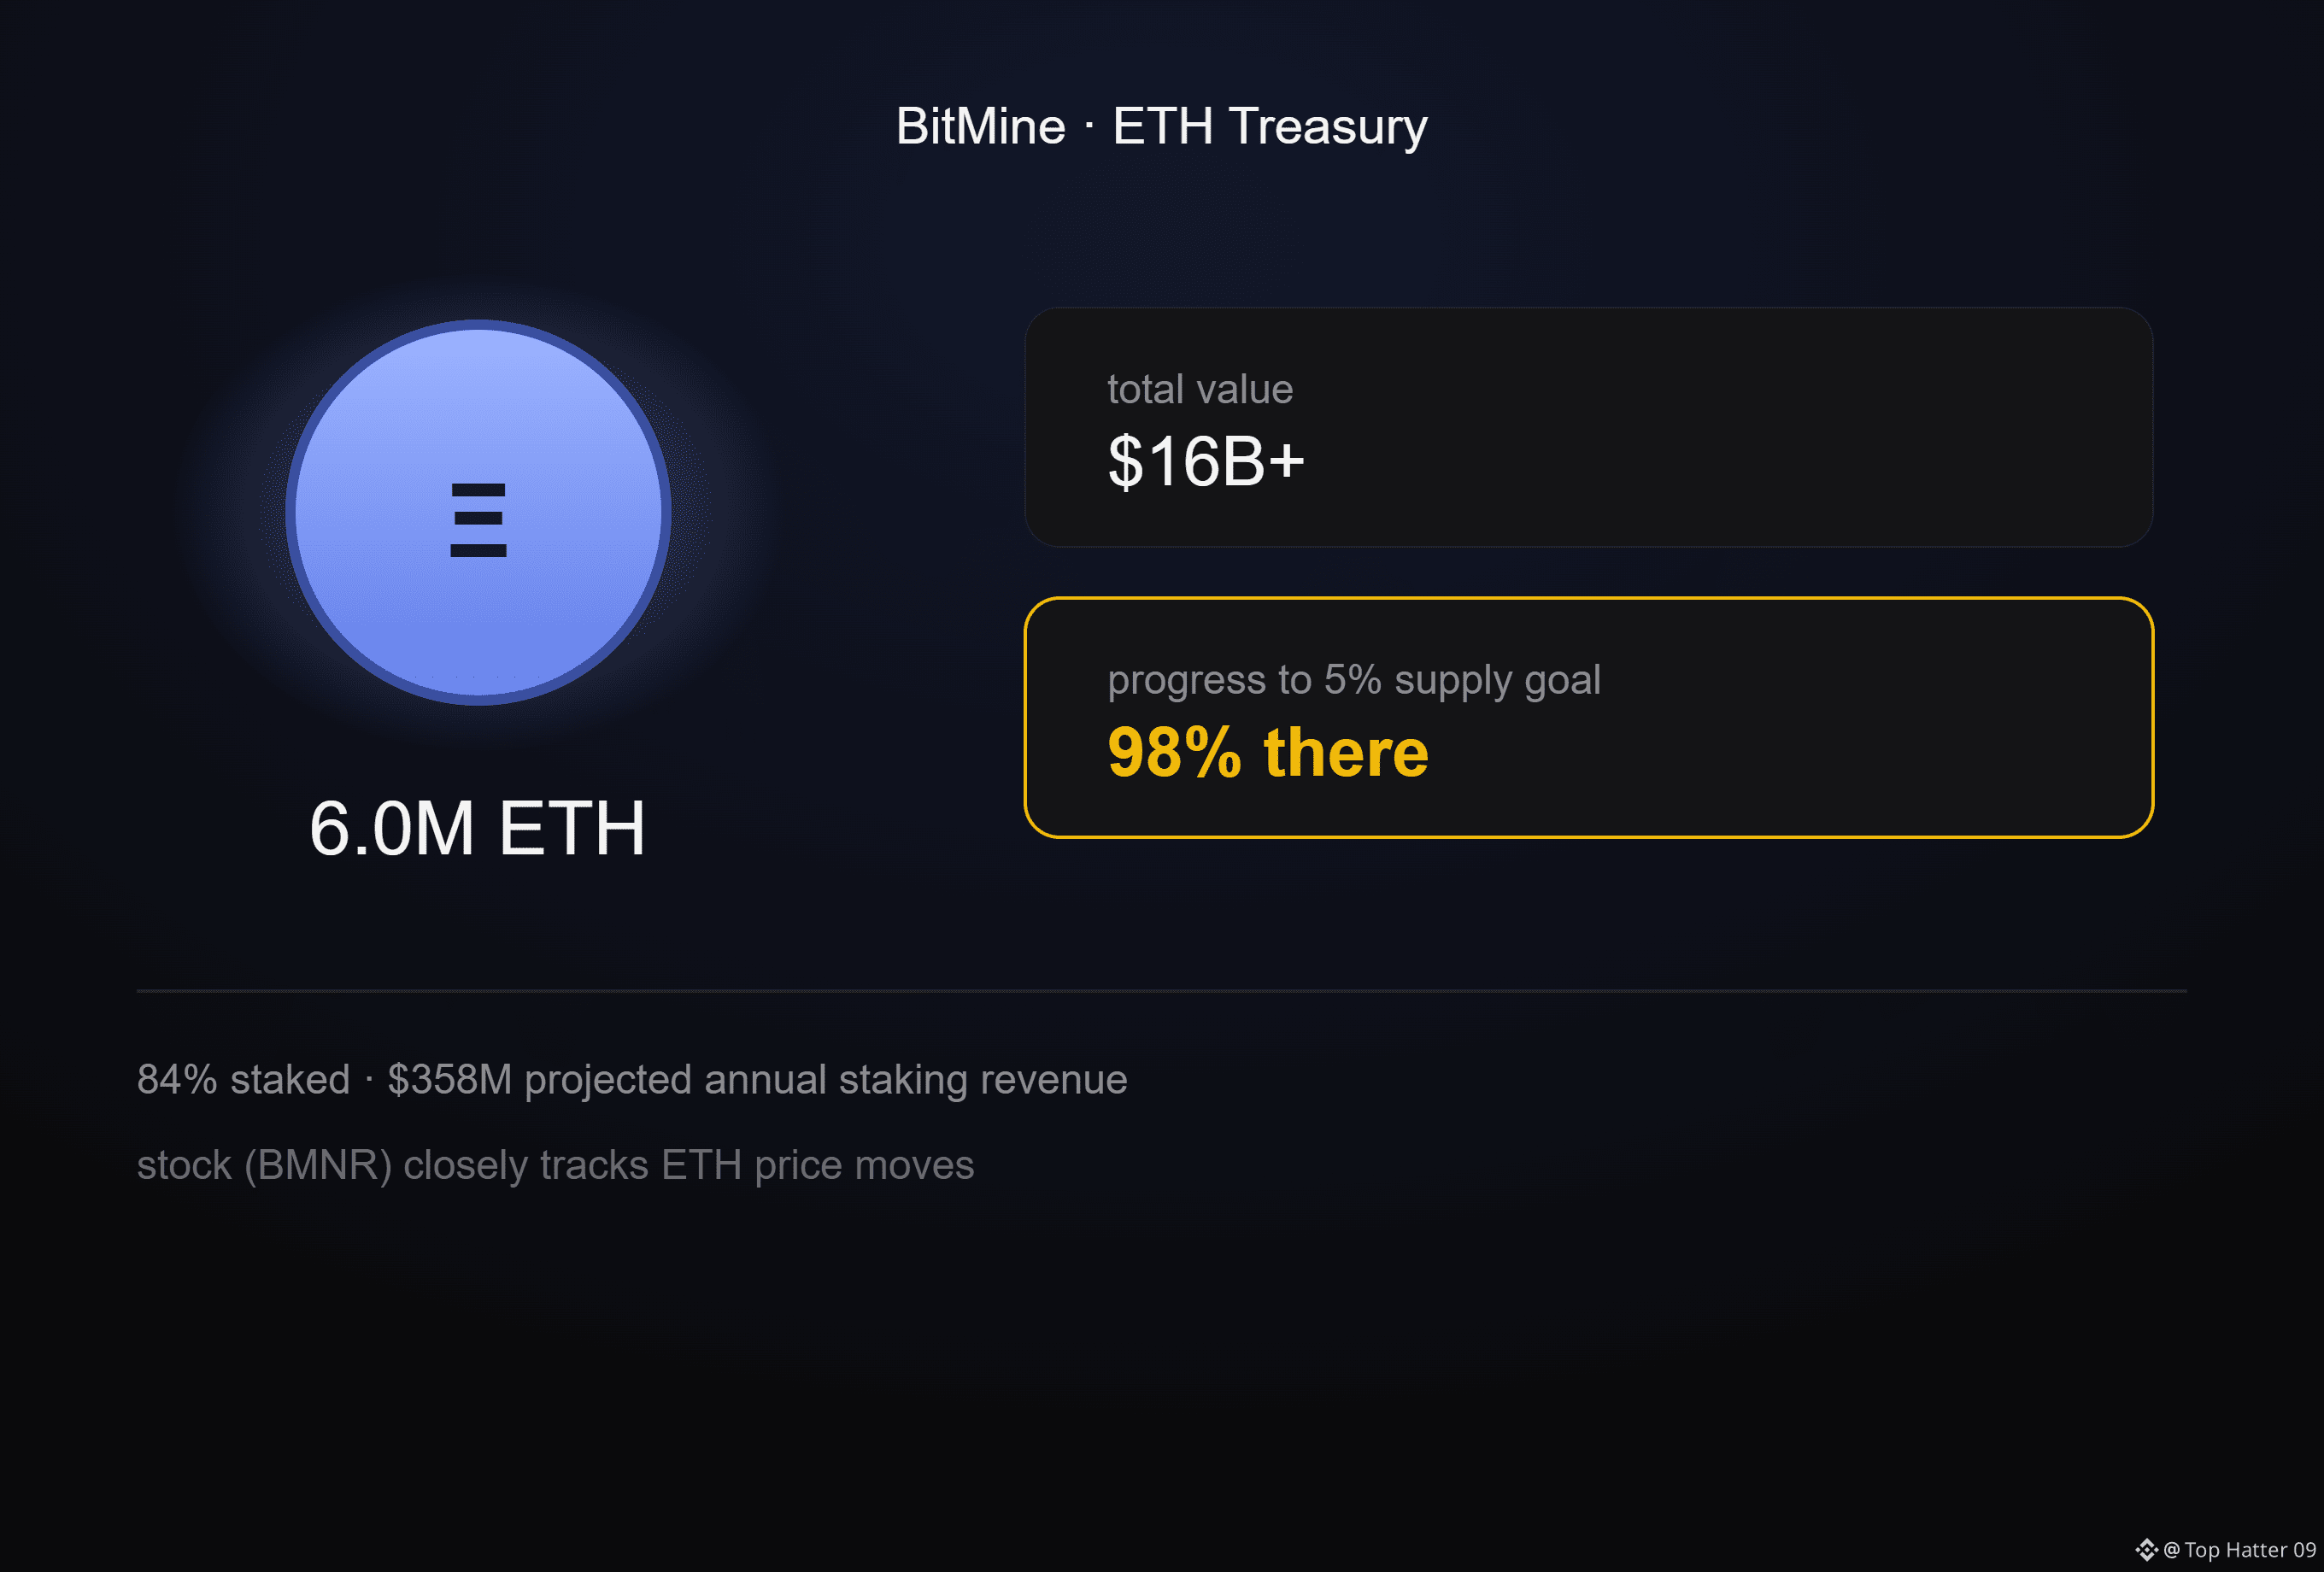
BitMine, the Ethereum treasury company chaired by Tom Lee, just crossed 6 million ETH in holdings as of September 27. It added 17,362 ETH last week, bringing the total to 6,001,302 ETH, about 4.9% of Ethereum's entire supply, worth over $16 billion.
What's interesting is BitMine's own stated goal is to hold 5% of all ETH, and this purchase puts them 98% of the way there. All of this happened in under 15 months since they started the strategy in June 2025, buying every single week without a pause.
Most of that stash isn't just sitting idle either. Over 84% of it, more than 5 million ETH, is staked through their own MAVAN platform, projected to bring in $358 million a year in staking income. And this milestone landed the same week ETH ETFs pulled in $689.8 million in inflows, so it's not just BitMine buying, institutional demand looks broad right now.
Worth keeping in mind though, BitMine's stock is closely tied to ETH's price. If ETH drops sharply, their balance sheet and stock take a direct hit too, so this isn't a risk-free bet.
$ETH #BitMine #EthereumTreasury
{future}(ETHUSDT)
$ETH #BitMineETHHoldingsTop6Million
BitMine, the Ethereum treasury company chaired by Tom Lee, just crossed 6 million ETH in holdings as of September 27. It added 17,362 ETH last week, bringing the total to 6,001,302 ETH, about 4.9% of Ethereum's entire supply, worth over $16 billion.
What's interesting is BitMine's own stated goal is to hold 5% of all ETH, and this purchase puts them 98% of the way there. All of this happened in under 15 months since they started the strategy in June 2025, buying every single week without a pause.
Most of that stash isn't just sitting idle either. Over 84% of it, more than 5 million ETH, is staked through their own MAVAN platform, projected to bring in $358 million a year in staking income. And this milestone landed the same week ETH ETFs pulled in $689.8 million in inflows, so it's not just BitMine buying, institutional demand looks broad right now.
Worth keeping in mind though, BitMine's stock is closely tied to ETH's price. If ETH drops sharply, their balance sheet and stock take a direct hit too, so this isn't a risk-free bet.
$ETH #BitMine #EthereumTreasury
BitMine, the Ethereum treasury company chaired by Tom Lee, just crossed 6 million ETH in holdings as of September 27. It added 17,362 ETH last week, bringing the total to 6,001,302 ETH, about 4.9% of Ethereum's entire supply, worth over $16 billion.
What's interesting is BitMine's own stated goal is to hold 5% of all ETH, and this purchase puts them 98% of the way there. All of this happened in under 15 months since they started the strategy in June 2025, buying every single week without a pause.
Most of that stash isn't just sitting idle either. Over 84% of it, more than 5 million ETH, is staked through their own MAVAN platform, projected to bring in $358 million a year in staking income. And this milestone landed the same week ETH ETFs pulled in $689.8 million in inflows, so it's not just BitMine buying, institutional demand looks broad right now.
Worth keeping in mind though, BitMine's stock is closely tied to ETH's price. If ETH drops sharply, their balance sheet and stock take a direct hit too, so this isn't a risk-free bet.
$ETH #BitMine #EthereumTreasury
78
·
--
Bearish
$XAU #GoldFallsTo$4144
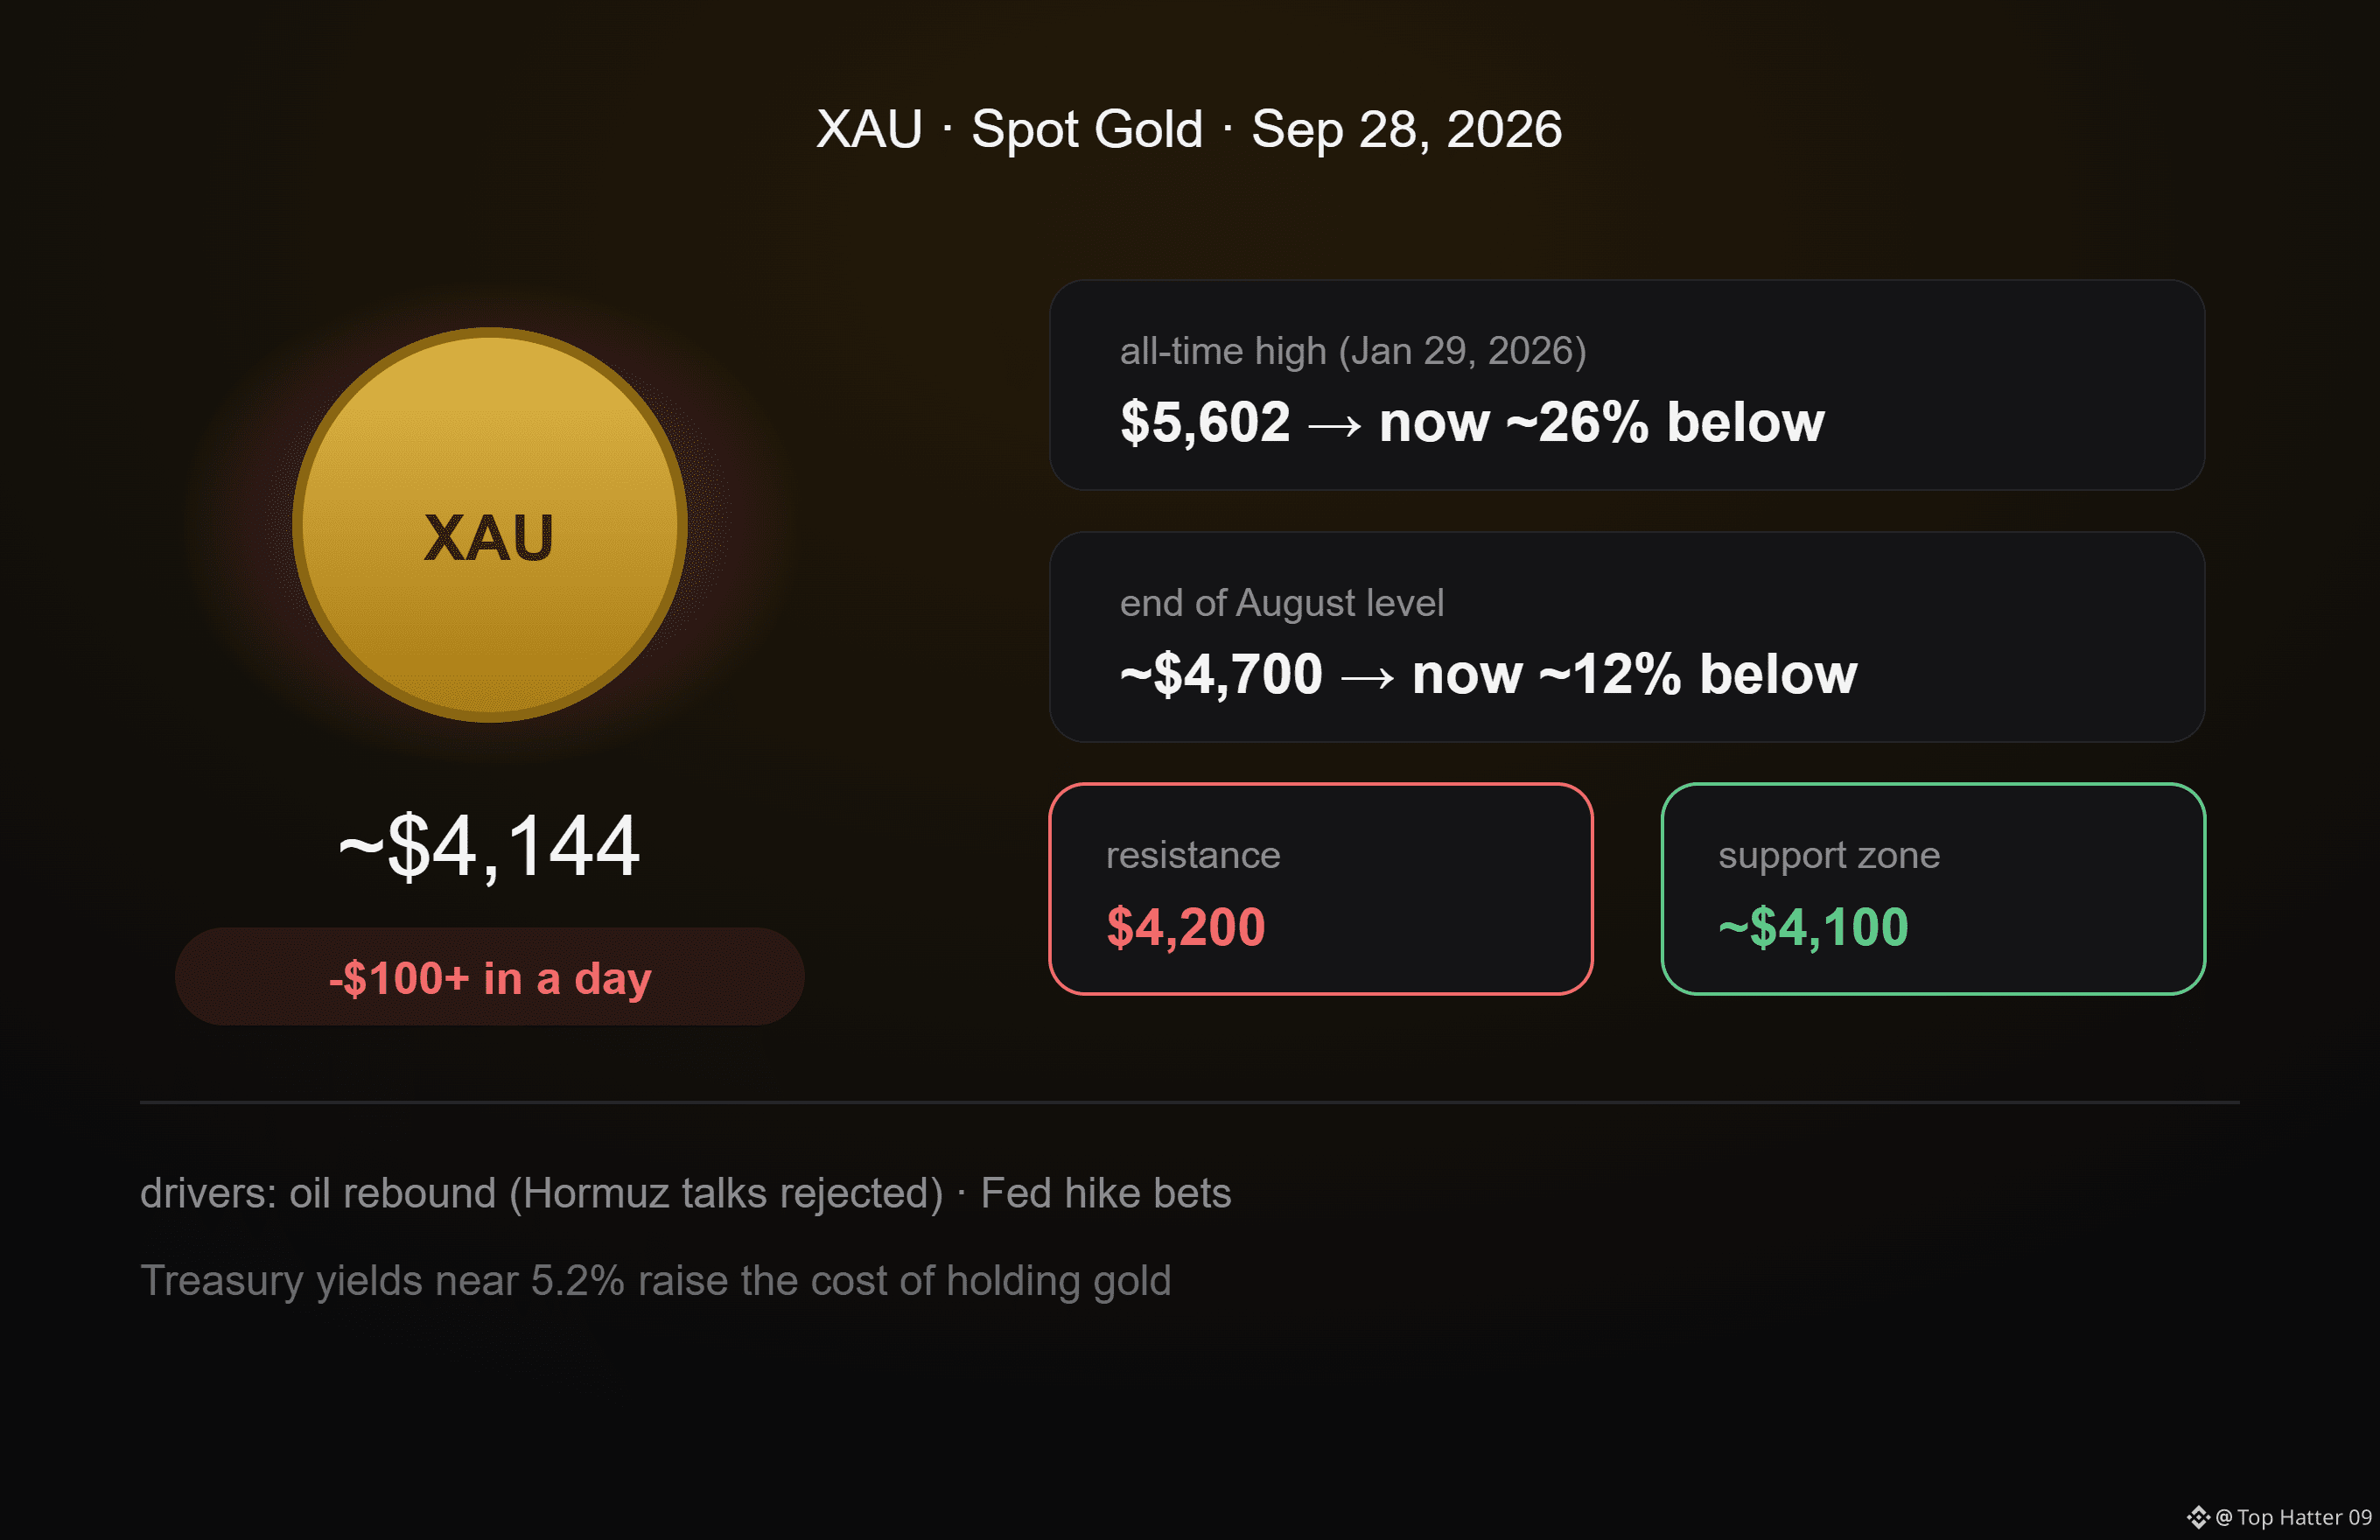
Gold had a rough session. Spot gold is trading around $4,144 now, after slipping under $4,200 during the Asian session and hitting a low of $4,179 at one point, a drop of more than $100 in a day.
Zooming out, gold hit its all-time high of $5,602 back on January 29, so it's now roughly 26% below that peak. It's also down about 12% from the ~$4,700 area it was trading at the end of August.
Two things are doing most of the damage. Oil bounced back after Trump rejected Iran's proposal to reopen the Strait of Hormuz, which keeps inflation worries alive. And the market is pricing in more Fed rate hikes, with Treasury yields near 5.2%. Gold pays no yield, so when yields rise, holding it gets more expensive compared to bonds.
On the chart, $4,200 has flipped from support into resistance. The next area buyers stepped in before sits around $4,100, which price is now testing.
Short-term the picture is weak. The thing to watch isn't the gold chart alone, it's the Fed and Treasury yields, because that's what's driving this move.
$XAU #Gold #FED
{future}(XAUTUSDT)
$XAU #GoldFallsTo$4144
Gold had a rough session. Spot gold is trading around $4,144 now, after slipping under $4,200 during the Asian session and hitting a low of $4,179 at one point, a drop of more than $100 in a day.
Zooming out, gold hit its all-time high of $5,602 back on January 29, so it's now roughly 26% below that peak. It's also down about 12% from the ~$4,700 area it was trading at the end of August.
Two things are doing most of the damage. Oil bounced back after Trump rejected Iran's proposal to reopen the Strait of Hormuz, which keeps inflation worries alive. And the market is pricing in more Fed rate hikes, with Treasury yields near 5.2%. Gold pays no yield, so when yields rise, holding it gets more expensive compared to bonds.
On the chart, $4,200 has flipped from support into resistance. The next area buyers stepped in before sits around $4,100, which price is now testing.
Short-term the picture is weak. The thing to watch isn't the gold chart alone, it's the Fed and Treasury yields, because that's what's driving this move.
$XAU #Gold #FED
Gold had a rough session. Spot gold is trading around $4,144 now, after slipping under $4,200 during the Asian session and hitting a low of $4,179 at one point, a drop of more than $100 in a day.
Zooming out, gold hit its all-time high of $5,602 back on January 29, so it's now roughly 26% below that peak. It's also down about 12% from the ~$4,700 area it was trading at the end of August.
Two things are doing most of the damage. Oil bounced back after Trump rejected Iran's proposal to reopen the Strait of Hormuz, which keeps inflation worries alive. And the market is pricing in more Fed rate hikes, with Treasury yields near 5.2%. Gold pays no yield, so when yields rise, holding it gets more expensive compared to bonds.
On the chart, $4,200 has flipped from support into resistance. The next area buyers stepped in before sits around $4,100, which price is now testing.
Short-term the picture is weak. The thing to watch isn't the gold chart alone, it's the Fed and Treasury yields, because that's what's driving this move.
$XAU #Gold #FED
149
·
--
Bullish
$LINK #ChainlinkLaunchesCCIP2WithEnterpriseVerification
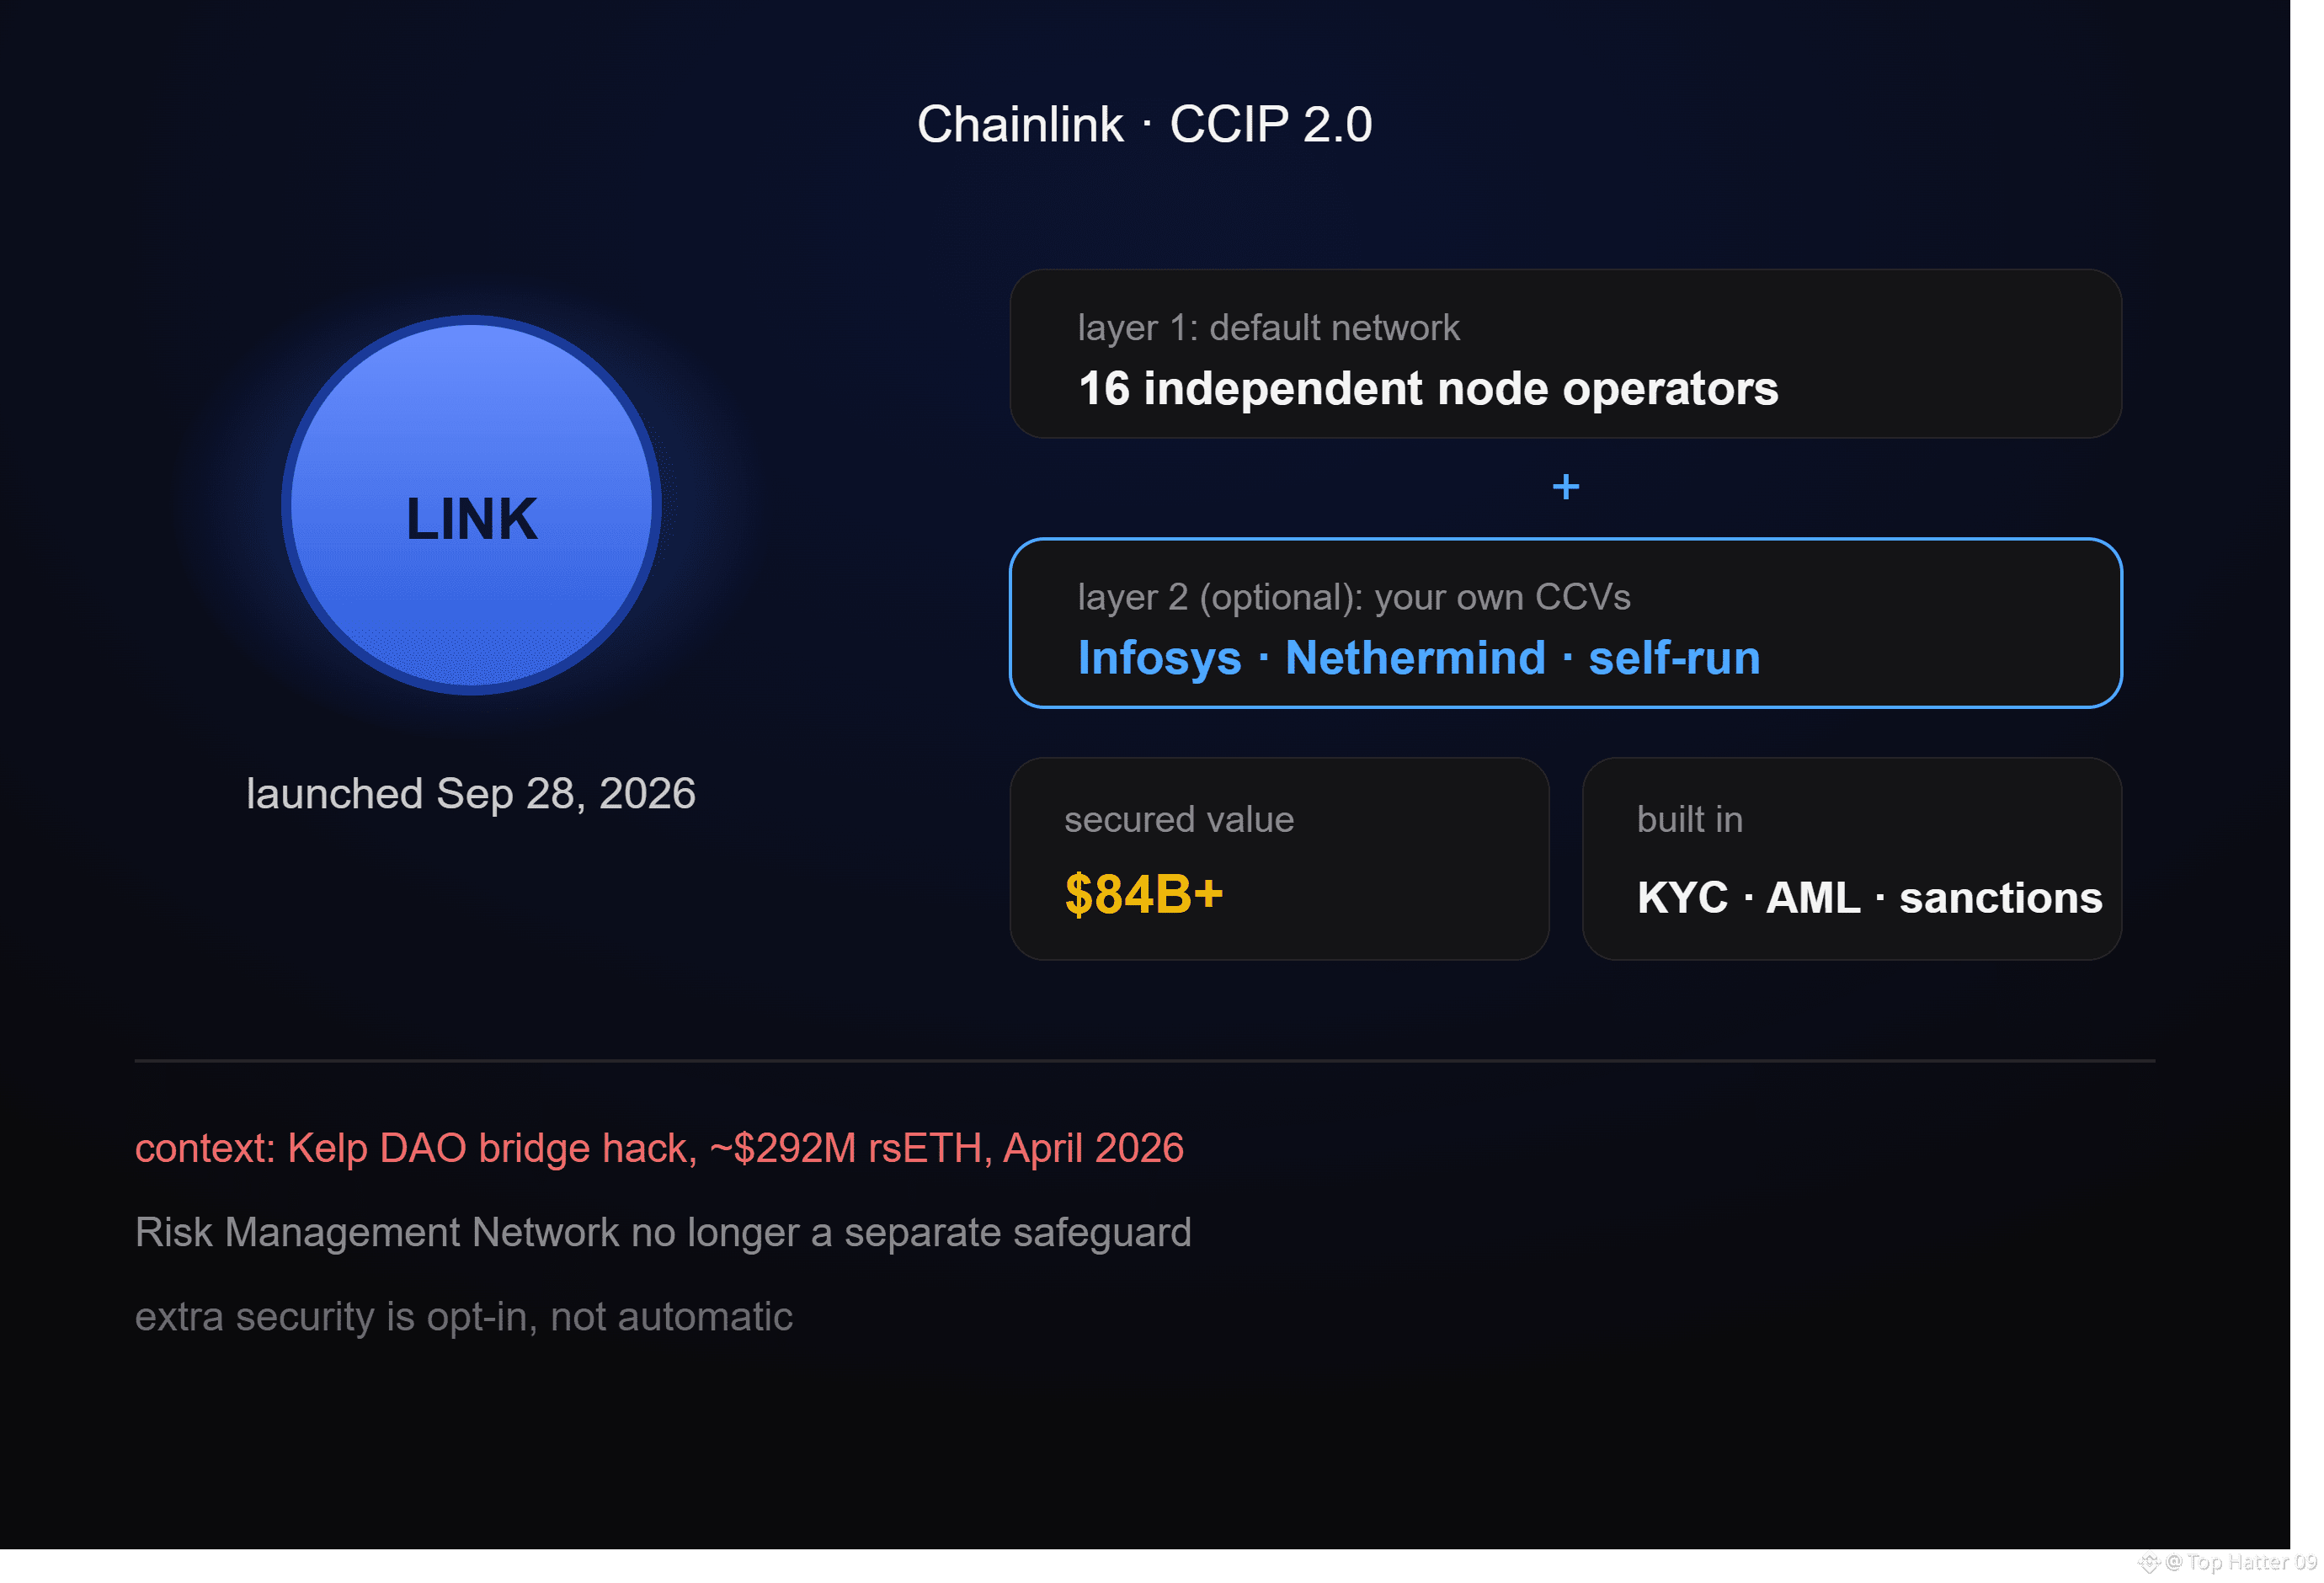
Chainlink launched CCIP 2.0 on September 28, and the main change is who controls the security.
CCIP is the protocol that moves tokens and messages between blockchains. Until now, every transfer was checked by Chainlink's default network of 16 independent node operators. With 2.0, companies can layer their own checks on top by running their own Cross-Chain Verifiers, or by hiring providers like Infosys and Nethermind. KYC, AML, and sanctions screening are built in too, which is what regulated institutions need. Chainlink says CCIP already secures over $84 billion in cross-chain token value, and existing integrations keep working without changes.
The timing matters. In April, the Kelp DAO bridge lost roughly $292 million in rsETH after attackers exploited a bridge that relied on a single verifier. Kelp later said it would move rsETH over to Chainlink.
One detail worth knowing: Chainlink's Risk Management Network no longer acts as a separate independent check. Anyone who doesn't add their own verifiers now relies on the default network alone, where before there were two layers. And as one analysis pointed out, adding verifiers doesn't automatically make a bridge safer. What counts is whether those verifiers are truly independent from each other.
So the upgrade gives serious users more control, but the extra security is something you have to choose to set up.
$LINK #Chainlink’s #CCIP
{future}(LINKUSDT)
$LINK #ChainlinkLaunchesCCIP2WithEnterpriseVerification
Chainlink launched CCIP 2.0 on September 28, and the main change is who controls the security.
CCIP is the protocol that moves tokens and messages between blockchains. Until now, every transfer was checked by Chainlink's default network of 16 independent node operators. With 2.0, companies can layer their own checks on top by running their own Cross-Chain Verifiers, or by hiring providers like Infosys and Nethermind. KYC, AML, and sanctions screening are built in too, which is what regulated institutions need. Chainlink says CCIP already secures over $84 billion in cross-chain token value, and existing integrations keep working without changes.
The timing matters. In April, the Kelp DAO bridge lost roughly $292 million in rsETH after attackers exploited a bridge that relied on a single verifier. Kelp later said it would move rsETH over to Chainlink.
One detail worth knowing: Chainlink's Risk Management Network no longer acts as a separate independent check. Anyone who doesn't add their own verifiers now relies on the default network alone, where before there were two layers. And as one analysis pointed out, adding verifiers doesn't automatically make a bridge safer. What counts is whether those verifiers are truly independent from each other.
So the upgrade gives serious users more control, but the extra security is something you have to choose to set up.
$LINK #Chainlink’s #CCIP
Chainlink launched CCIP 2.0 on September 28, and the main change is who controls the security.
CCIP is the protocol that moves tokens and messages between blockchains. Until now, every transfer was checked by Chainlink's default network of 16 independent node operators. With 2.0, companies can layer their own checks on top by running their own Cross-Chain Verifiers, or by hiring providers like Infosys and Nethermind. KYC, AML, and sanctions screening are built in too, which is what regulated institutions need. Chainlink says CCIP already secures over $84 billion in cross-chain token value, and existing integrations keep working without changes.
The timing matters. In April, the Kelp DAO bridge lost roughly $292 million in rsETH after attackers exploited a bridge that relied on a single verifier. Kelp later said it would move rsETH over to Chainlink.
One detail worth knowing: Chainlink's Risk Management Network no longer acts as a separate independent check. Anyone who doesn't add their own verifiers now relies on the default network alone, where before there were two layers. And as one analysis pointed out, adding verifiers doesn't automatically make a bridge safer. What counts is whether those verifiers are truly independent from each other.
So the upgrade gives serious users more control, but the extra security is something you have to choose to set up.
$LINK #Chainlink’s #CCIP
10
$BTC $CRCL $COINB #ukfcawinscourtordertorecover851400pounds
{future}(CRCLUSDT)
{future}(BTCUSDT)
{spot}(COINBUSDT)
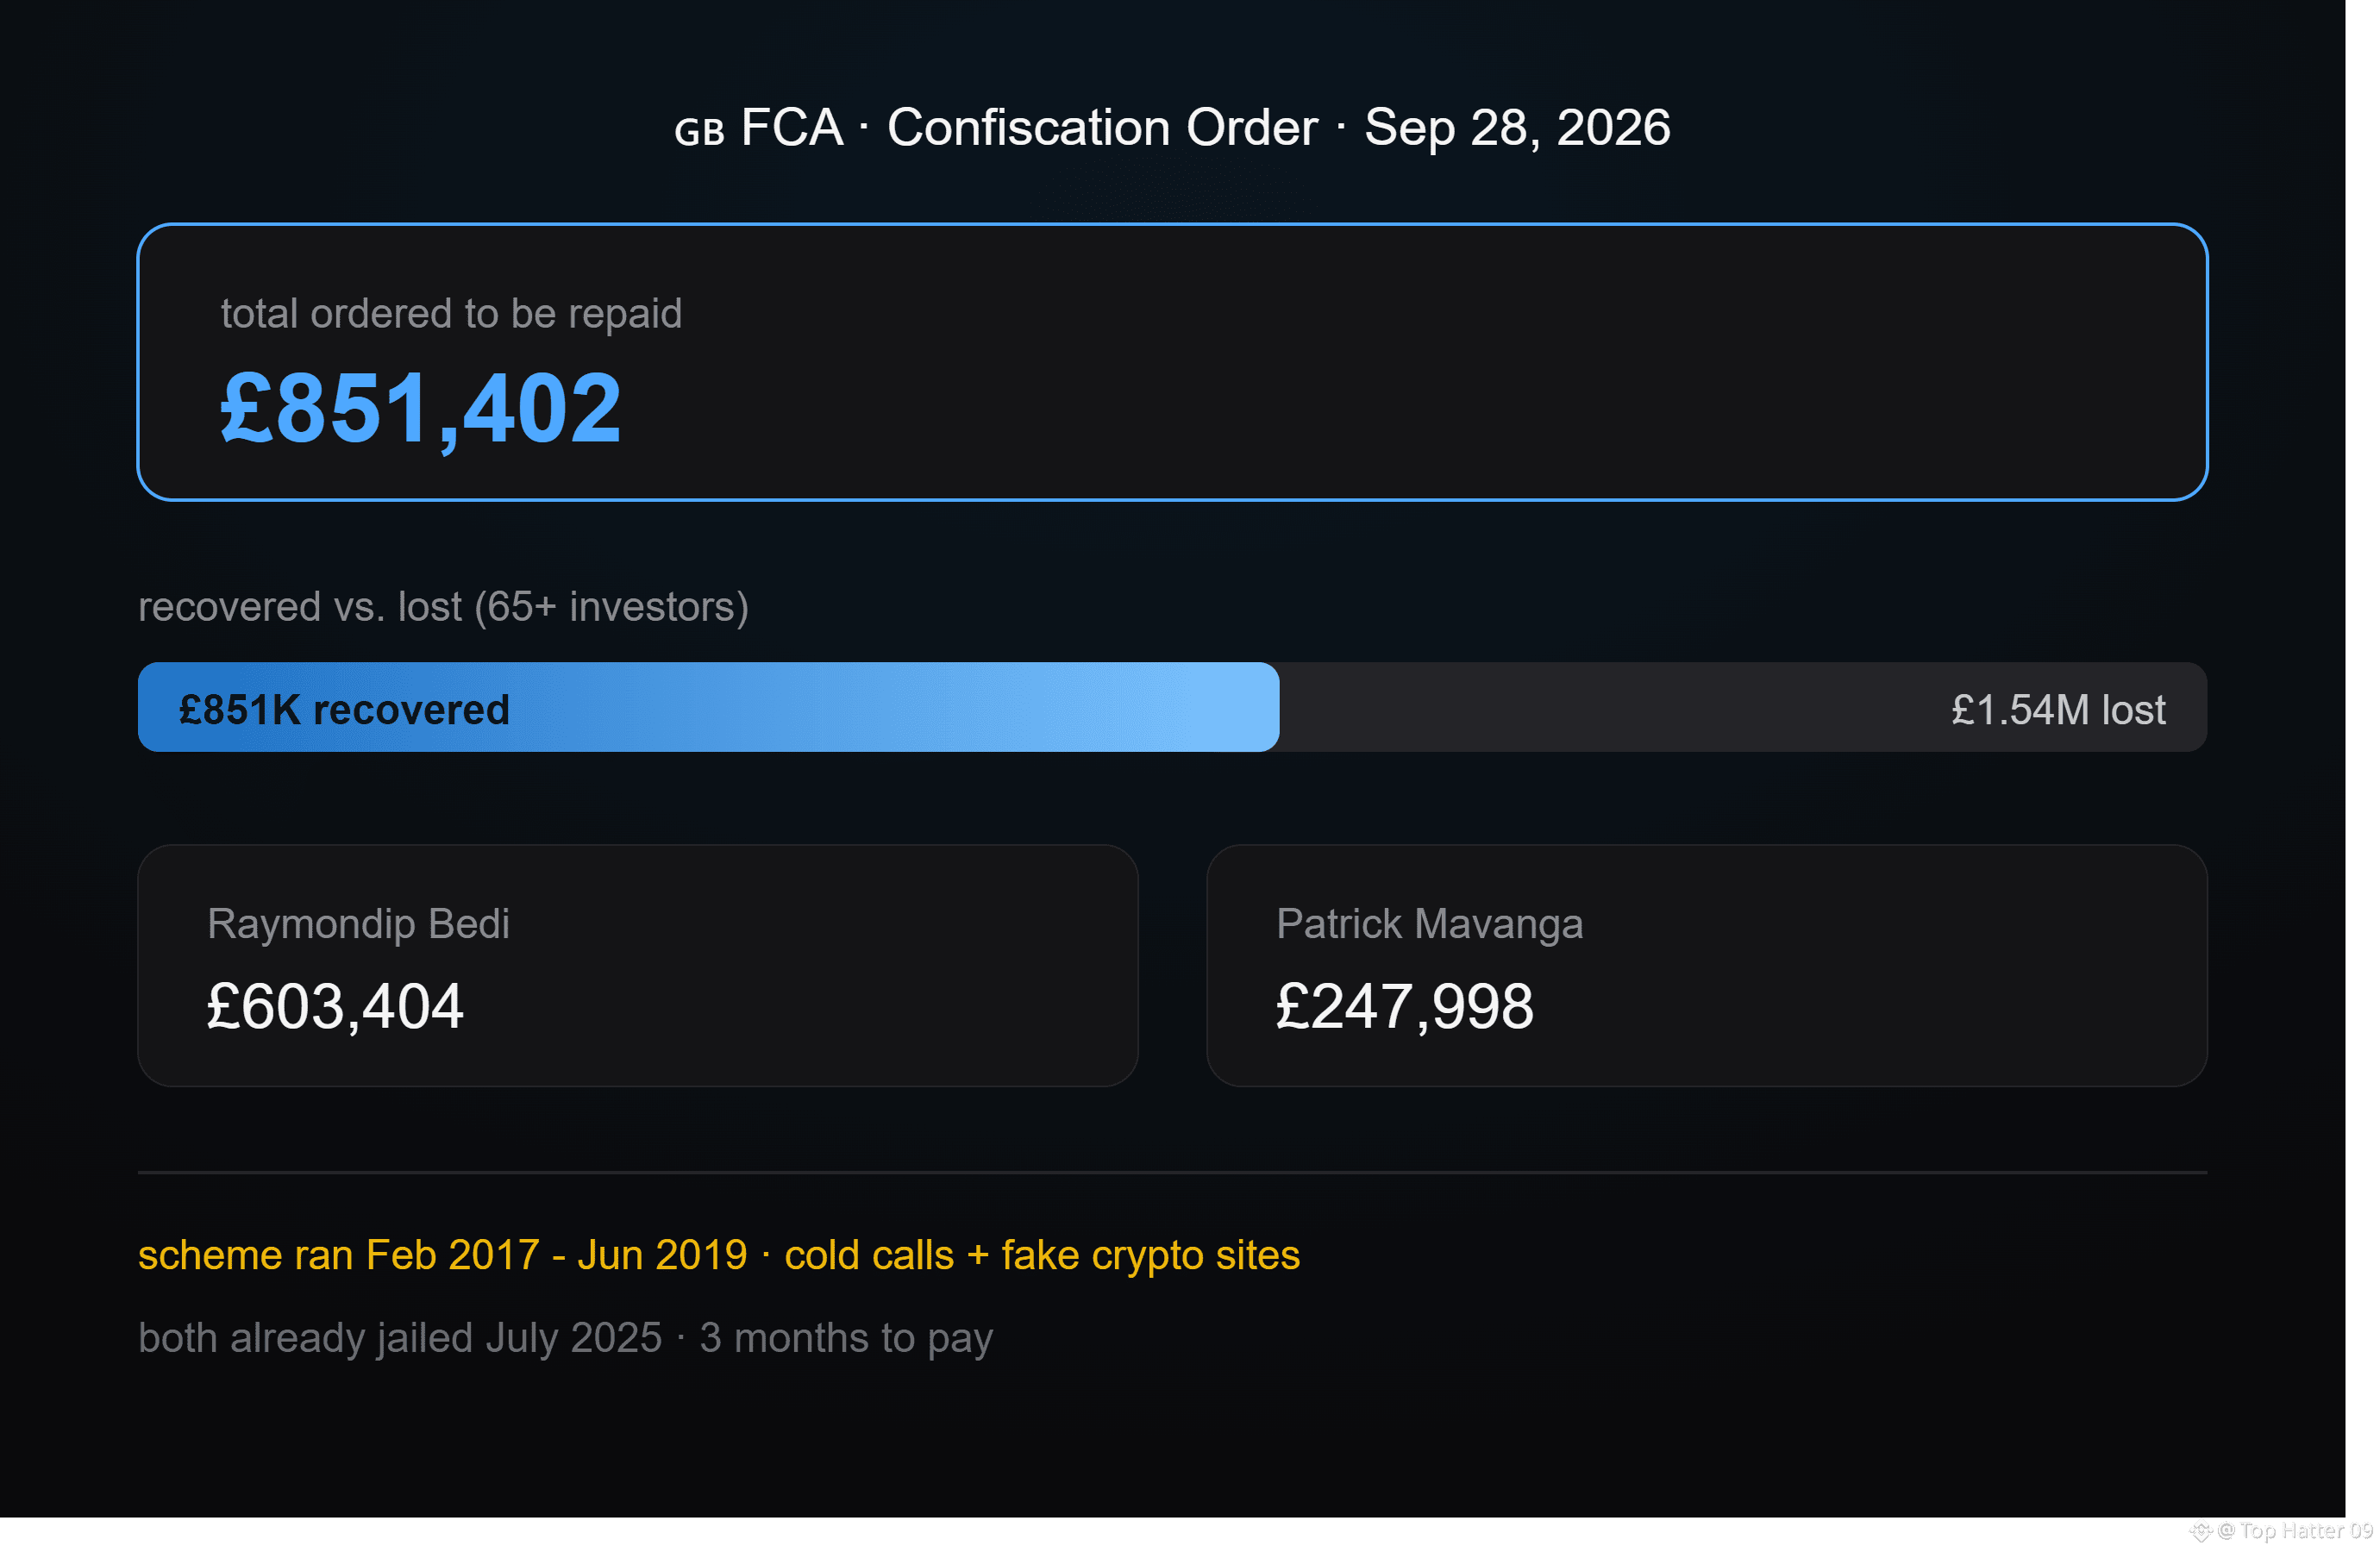
The UK's Financial Conduct Authority just won a court order to recover £851,402 for victims of a crypto investment scam, and the details are worth reading.
On September 28, 2026, Southwark Crown Court ordered Raymondip Bedi to pay £603,404 and Patrick Mavanga to pay £247,998. Between February 2017 and June 2019 the two ran a cold-calling operation, pointing people to a professional-looking website and selling fake crypto investments through names like CCX Capital and Astaria Group LLP, with promises of high returns. At least 65 investors lost a combined £1,541,799. Both men were already sentenced in July 2025 to 5 years 4 months and 6 years 6 months in prison.
So what comes back is roughly half of what was lost. The FCA says it has contacted the victims and will make sure the recovered money is returned to them. Both defendants have three months to pay.
Two takeaways. One, an unsolicited call or a slick website promising big guaranteed returns is a red flag every single time. Two, regulators keep going after the money long after the prison sentences are handed out, which is good news for anyone who has been burned.
#CryptoScams #FCA #InvestorProtectio
$BTC $CRCL $COINB #ukfcawinscourtordertorecover851400pounds
The UK's Financial Conduct Authority just won a court order to recover £851,402 for victims of a crypto investment scam, and the details are worth reading.
On September 28, 2026, Southwark Crown Court ordered Raymondip Bedi to pay £603,404 and Patrick Mavanga to pay £247,998. Between February 2017 and June 2019 the two ran a cold-calling operation, pointing people to a professional-looking website and selling fake crypto investments through names like CCX Capital and Astaria Group LLP, with promises of high returns. At least 65 investors lost a combined £1,541,799. Both men were already sentenced in July 2025 to 5 years 4 months and 6 years 6 months in prison.
So what comes back is roughly half of what was lost. The FCA says it has contacted the victims and will make sure the recovered money is returned to them. Both defendants have three months to pay.
Two takeaways. One, an unsolicited call or a slick website promising big guaranteed returns is a red flag every single time. Two, regulators keep going after the money long after the prison sentences are handed out, which is good news for anyone who has been burned.
#CryptoScams #FCA #InvestorProtectio
The UK's Financial Conduct Authority just won a court order to recover £851,402 for victims of a crypto investment scam, and the details are worth reading.
On September 28, 2026, Southwark Crown Court ordered Raymondip Bedi to pay £603,404 and Patrick Mavanga to pay £247,998. Between February 2017 and June 2019 the two ran a cold-calling operation, pointing people to a professional-looking website and selling fake crypto investments through names like CCX Capital and Astaria Group LLP, with promises of high returns. At least 65 investors lost a combined £1,541,799. Both men were already sentenced in July 2025 to 5 years 4 months and 6 years 6 months in prison.
So what comes back is roughly half of what was lost. The FCA says it has contacted the victims and will make sure the recovered money is returned to them. Both defendants have three months to pay.
Two takeaways. One, an unsolicited call or a slick website promising big guaranteed returns is a red flag every single time. Two, regulators keep going after the money long after the prison sentences are handed out, which is good news for anyone who has been burned.
#CryptoScams #FCA #InvestorProtectio
2
1
2
6.1k

Article
3 Coins Binance Traders Are Searching Right Now $QNT, $FIL & $ARBI checked the Binance “Most Searched” list for the last 6 hours, and three names caught my attention: QNT, FIL and ARB.
$QNT is the one that stands out immediately. It was showing around $230.44 and +29.92% on the search panel, while recent news around Quant’s selection for The Clearing House’s On-Chain Money Initiative has added another layer of attention to the token.
$FIL is a different setup. Search activity is high, but price was around $1.0511 and down 7.83% on the panel. FIL recently faced rejection around the $1.15–$1.16 area, with $1.11 and $1.07 becoming important levels to watch.
Then there is $ARB . It was around $0.20929, down 8.25%, so the attention is interesting because price is cooling after a strong move. The $0.208–$0.200 area is the zone I would keep an eye on, while $0.219 is an important level above.
{future}(ARBUSDT)
{future}(FILUSDT)
For me, the interesting part isn't simply that these coins are being searched a lot. QNT has momentum, while FIL and ARB are showing whether buyers can actually defend their current levels.
Which one are you watching right now — QNT, FIL or ARB?
#QNT #FIL #ARB #Crypto #BinanceSquare
{future}(QNTUSDT)
FOLLOW FOR MORE
3 Coins Binance Traders Are Searching Right Now $QNT, $FIL & $ARB
I checked the Binance “Most Searched” list for the last 6 hours, and three names caught my attention: QNT, FIL and ARB.
$QNT is the one that stands out immediately. It was showing around $230.44 and +29.92% on the search panel, while recent news around Quant’s selection for The Clearing House’s On-Chain Money Initiative has added another layer of attention to the token.
$FIL is a different setup. Search activity is high, but price was around $1.0511 and down 7.83% on the panel. FIL recently faced rejection around the $1.15–$1.16 area, with $1.11 and $1.07 becoming important levels to watch.
Then there is $ARB . It was around $0.20929, down 8.25%, so the attention is interesting because price is cooling after a strong move. The $0.208–$0.200 area is the zone I would keep an eye on, while $0.219 is an important level above.
For me, the interesting part isn't simply that these coins are being searched a lot. QNT has momentum, while FIL and ARB are showing whether buyers can actually defend their current levels.
Which one are you watching right now — QNT, FIL or ARB?
#QNT #FIL #ARB #Crypto #BinanceSquare
FOLLOW FOR MORE
$QNT is the one that stands out immediately. It was showing around $230.44 and +29.92% on the search panel, while recent news around Quant’s selection for The Clearing House’s On-Chain Money Initiative has added another layer of attention to the token.
$FIL is a different setup. Search activity is high, but price was around $1.0511 and down 7.83% on the panel. FIL recently faced rejection around the $1.15–$1.16 area, with $1.11 and $1.07 becoming important levels to watch.
Then there is $ARB . It was around $0.20929, down 8.25%, so the attention is interesting because price is cooling after a strong move. The $0.208–$0.200 area is the zone I would keep an eye on, while $0.219 is an important level above.
For me, the interesting part isn't simply that these coins are being searched a lot. QNT has momentum, while FIL and ARB are showing whether buyers can actually defend their current levels.
Which one are you watching right now — QNT, FIL or ARB?
#QNT #FIL #ARB #Crypto #BinanceSquare
FOLLOW FOR MORE
675
$USDC #fedproposespaymentstablecoinrules
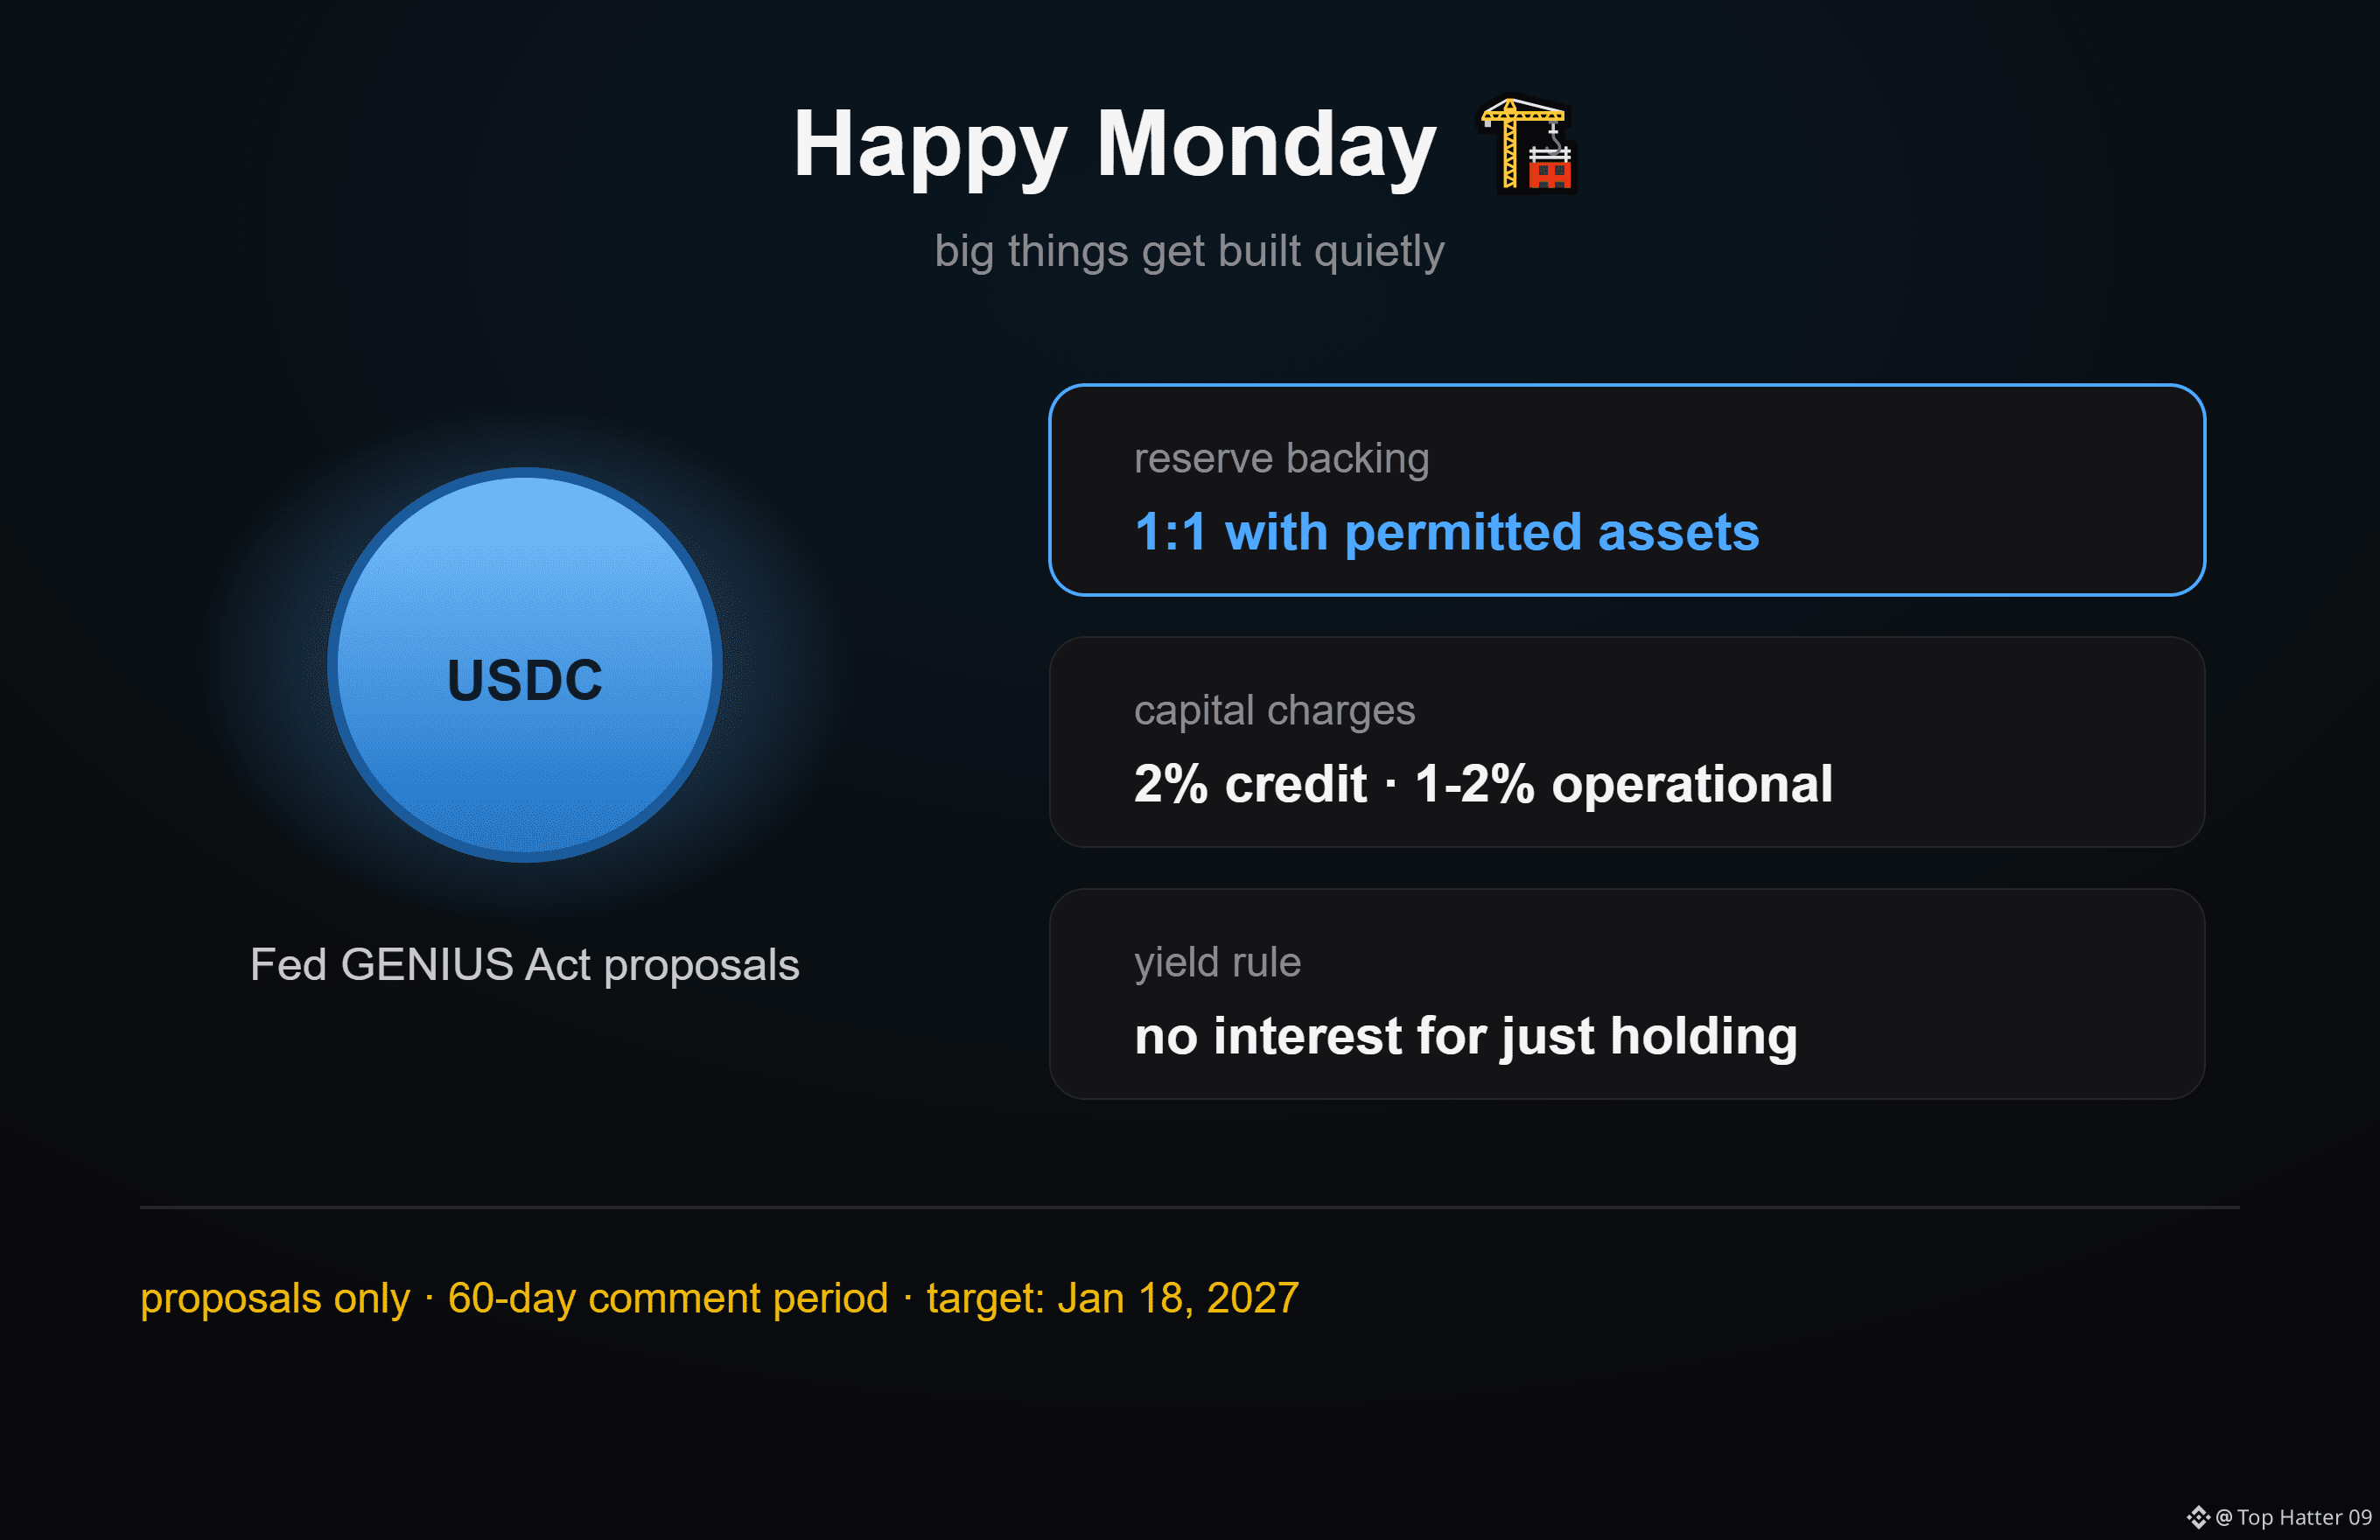
Here's one story a lot of people scroll past because there's no price drama in it. On September 24, the Federal Reserve put out two proposals for stablecoin issuers it supervises, under the GENIUS Act.
First: issuers would have to back their stablecoins one-to-one with permitted assets, things like US dollars, balances at the Fed, insured deposits, and short-term Treasury bills. Second: there are capital requirements too, a 2% charge for credit risk and 1% to 2% for operational risk depending on the issuer's size. Issuers also can't pay interest or yield just for holding a stablecoin, which was a big worry for the banking industry. And banks that want to launch their own stablecoin would follow a separate application process.
These aren't final rules yet. Public comments stay open for 60 days, with full enforcement targeted for January 18, 2027.
Monday thought: big things get built quietly. The foundation goes in slowly, and the people who are ready when it's finished are usually the ones who benefit most.
Have a strong week.
$USDC #Stablecoins #HappyMonday
{future}(USDCUSDT)
$USDC #fedproposespaymentstablecoinrules
Here's one story a lot of people scroll past because there's no price drama in it. On September 24, the Federal Reserve put out two proposals for stablecoin issuers it supervises, under the GENIUS Act.
First: issuers would have to back their stablecoins one-to-one with permitted assets, things like US dollars, balances at the Fed, insured deposits, and short-term Treasury bills. Second: there are capital requirements too, a 2% charge for credit risk and 1% to 2% for operational risk depending on the issuer's size. Issuers also can't pay interest or yield just for holding a stablecoin, which was a big worry for the banking industry. And banks that want to launch their own stablecoin would follow a separate application process.
These aren't final rules yet. Public comments stay open for 60 days, with full enforcement targeted for January 18, 2027.
Monday thought: big things get built quietly. The foundation goes in slowly, and the people who are ready when it's finished are usually the ones who benefit most.
Have a strong week.
$USDC #Stablecoins #HappyMonday
Here's one story a lot of people scroll past because there's no price drama in it. On September 24, the Federal Reserve put out two proposals for stablecoin issuers it supervises, under the GENIUS Act.
First: issuers would have to back their stablecoins one-to-one with permitted assets, things like US dollars, balances at the Fed, insured deposits, and short-term Treasury bills. Second: there are capital requirements too, a 2% charge for credit risk and 1% to 2% for operational risk depending on the issuer's size. Issuers also can't pay interest or yield just for holding a stablecoin, which was a big worry for the banking industry. And banks that want to launch their own stablecoin would follow a separate application process.
These aren't final rules yet. Public comments stay open for 60 days, with full enforcement targeted for January 18, 2027.
Monday thought: big things get built quietly. The foundation goes in slowly, and the people who are ready when it's finished are usually the ones who benefit most.
Have a strong week.
$USDC #Stablecoins #HappyMonday
1
2.4k
·
--
Bullish
$BTC #BitcoinSpotETFs$2.39BWeeklyNetInflow
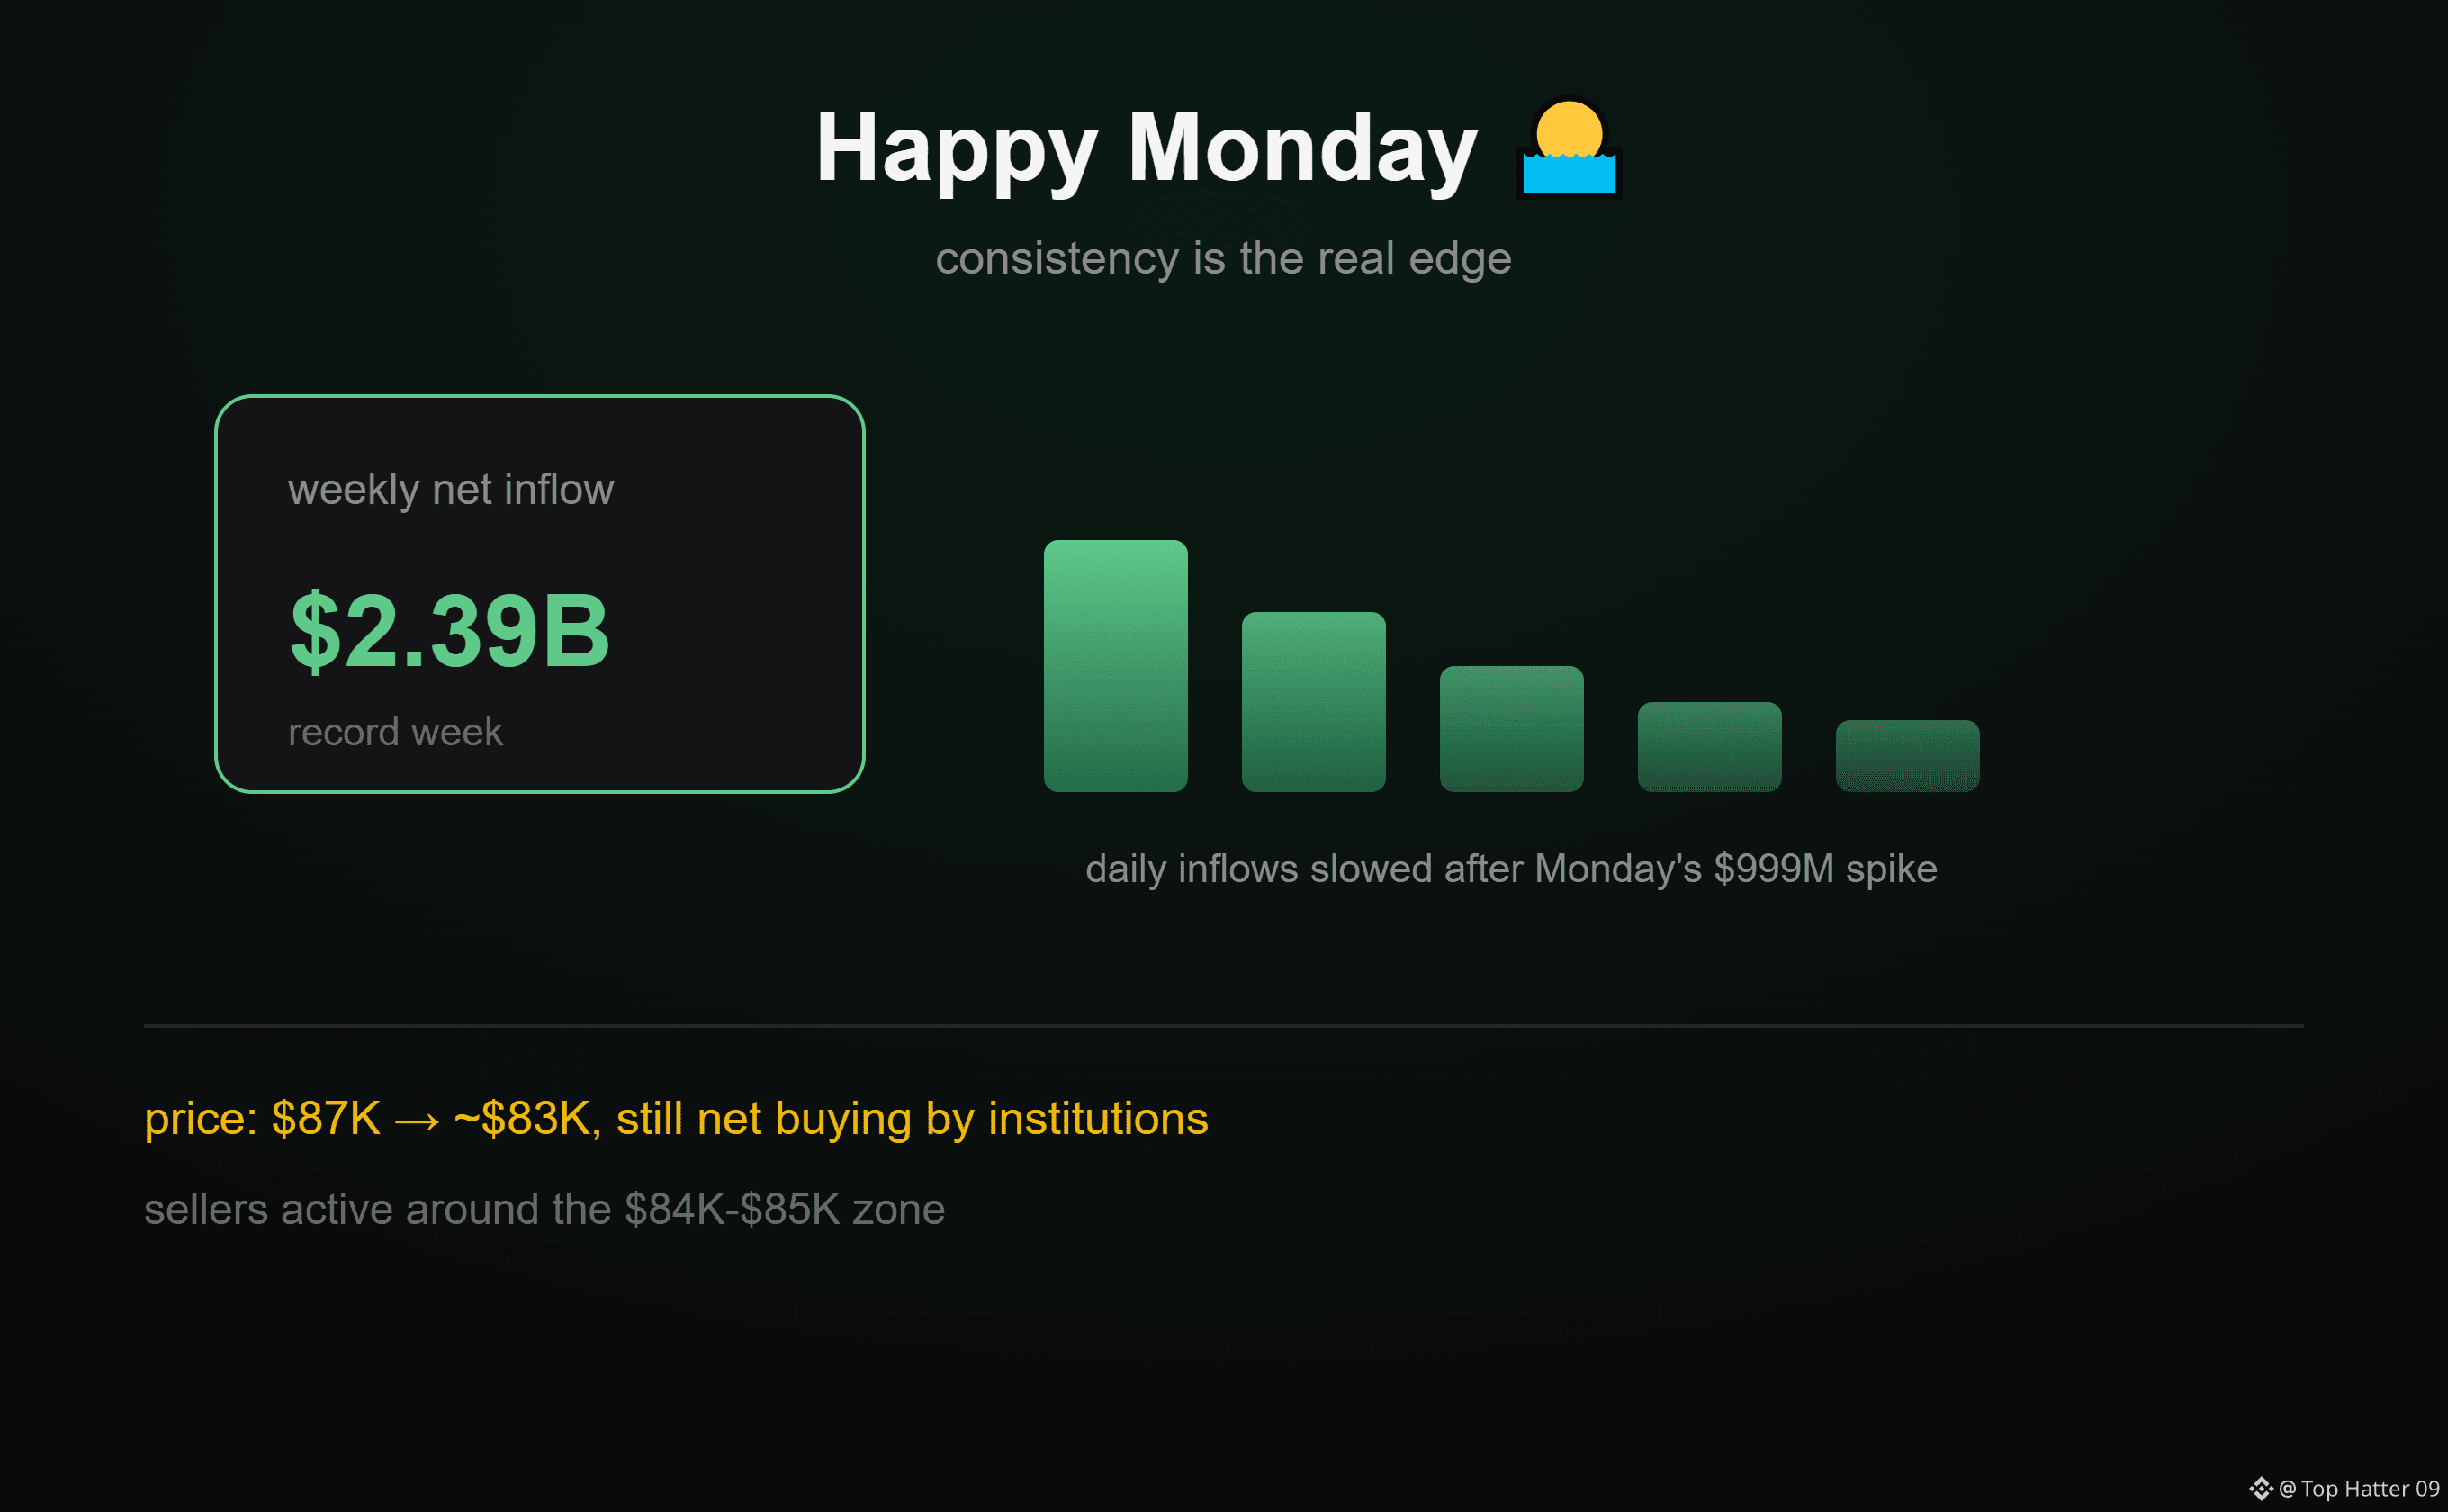
Last week was a record one for Bitcoin ETFs. US spot products pulled in $2.39 billion in net inflows, which is a huge number for these funds. What's worth noticing is that the price still slid from $87,000 back down to around $83,000, so there were plenty of sellers too, especially around the $84,000 to $85,000 zone.
But the bigger picture is this: institutions keep buying quietly. They don't react to every red candle, they follow a plan week after week. Daily numbers swing around, like Monday's $999 million that faded to smaller amounts each day after. The overall direction is still more buying than selling though.
Monday thought: consistency is the real edge. The same way those funds keep adding a bit at a time, you can keep learning and building a bit at a time. Small steps, long race.
Make it a good week.
$BTC #ETF #HappyMonday
{future}(BTCUSDT)
$BTC #BitcoinSpotETFs$2.39BWeeklyNetInflow
Last week was a record one for Bitcoin ETFs. US spot products pulled in $2.39 billion in net inflows, which is a huge number for these funds. What's worth noticing is that the price still slid from $87,000 back down to around $83,000, so there were plenty of sellers too, especially around the $84,000 to $85,000 zone.
But the bigger picture is this: institutions keep buying quietly. They don't react to every red candle, they follow a plan week after week. Daily numbers swing around, like Monday's $999 million that faded to smaller amounts each day after. The overall direction is still more buying than selling though.
Monday thought: consistency is the real edge. The same way those funds keep adding a bit at a time, you can keep learning and building a bit at a time. Small steps, long race.
Make it a good week.
$BTC #ETF #HappyMonday
Last week was a record one for Bitcoin ETFs. US spot products pulled in $2.39 billion in net inflows, which is a huge number for these funds. What's worth noticing is that the price still slid from $87,000 back down to around $83,000, so there were plenty of sellers too, especially around the $84,000 to $85,000 zone.
But the bigger picture is this: institutions keep buying quietly. They don't react to every red candle, they follow a plan week after week. Daily numbers swing around, like Monday's $999 million that faded to smaller amounts each day after. The overall direction is still more buying than selling though.
Monday thought: consistency is the real edge. The same way those funds keep adding a bit at a time, you can keep learning and building a bit at a time. Small steps, long race.
Make it a good week.
$BTC #ETF #HappyMonday
1
64
$BTC #BTCFallsBelow$83000
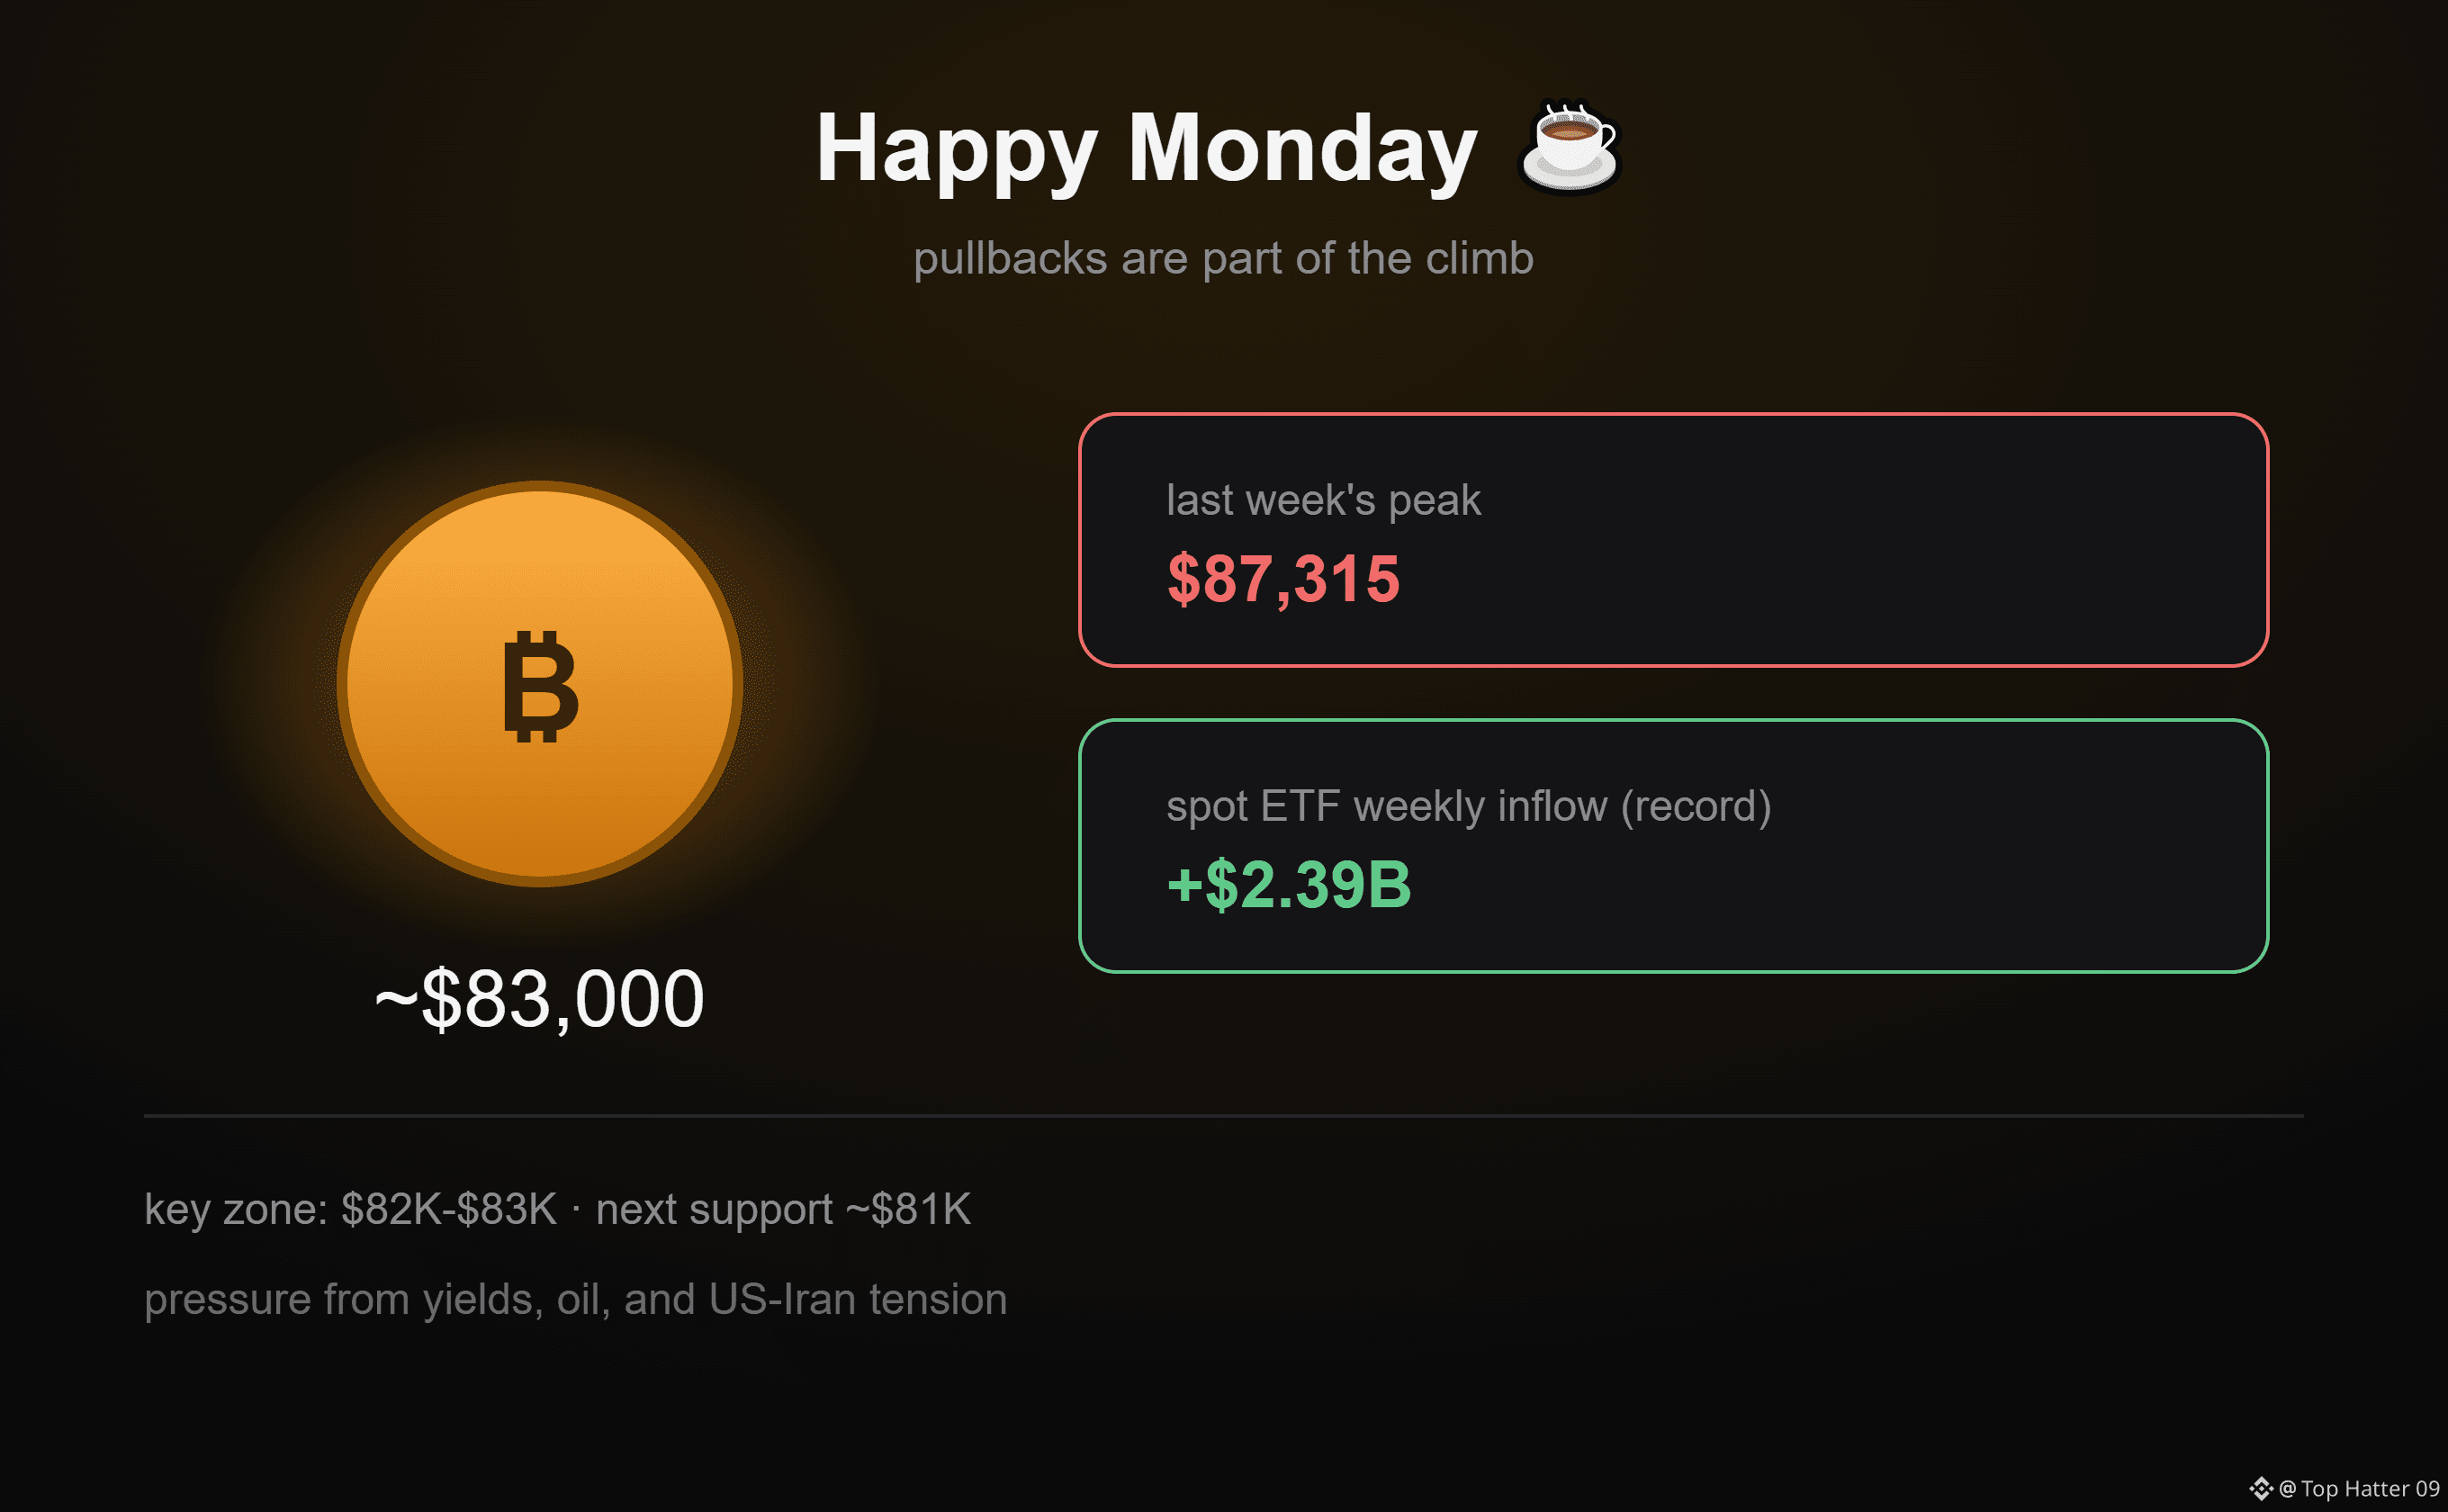
Bitcoin is starting the week a bit soft. It's sitting around $83,000, down from last week's peak of $87,315. What makes it interesting is that US spot Bitcoin ETFs just had a record week with $2.39 billion in inflows. So big money kept buying and the price still slipped. Looks like higher Treasury yields, pricey oil, and the US-Iran situation are weighing on risk assets more than the ETF demand can offset right now.
On the chart, the $82,000 to $83,000 zone is what matters today. A close below it points toward $81,000 next. If buyers step in, getting back above $84,000 would be the first sign of strength.
Here's the Monday thought: a pullback isn't the end of the story. BTC went from $80,000 to $87,000 in September and it's just catching its breath. The ones who stay patient are usually the ones still standing.
Have a good week.
$BTC #Bitcoin #HappyMonday
{future}(BTCUSDT)
$BTC #BTCFallsBelow$83000
Bitcoin is starting the week a bit soft. It's sitting around $83,000, down from last week's peak of $87,315. What makes it interesting is that US spot Bitcoin ETFs just had a record week with $2.39 billion in inflows. So big money kept buying and the price still slipped. Looks like higher Treasury yields, pricey oil, and the US-Iran situation are weighing on risk assets more than the ETF demand can offset right now.
On the chart, the $82,000 to $83,000 zone is what matters today. A close below it points toward $81,000 next. If buyers step in, getting back above $84,000 would be the first sign of strength.
Here's the Monday thought: a pullback isn't the end of the story. BTC went from $80,000 to $87,000 in September and it's just catching its breath. The ones who stay patient are usually the ones still standing.
Have a good week.
$BTC #Bitcoin #HappyMonday
Bitcoin is starting the week a bit soft. It's sitting around $83,000, down from last week's peak of $87,315. What makes it interesting is that US spot Bitcoin ETFs just had a record week with $2.39 billion in inflows. So big money kept buying and the price still slipped. Looks like higher Treasury yields, pricey oil, and the US-Iran situation are weighing on risk assets more than the ETF demand can offset right now.
On the chart, the $82,000 to $83,000 zone is what matters today. A close below it points toward $81,000 next. If buyers step in, getting back above $84,000 would be the first sign of strength.
Here's the Monday thought: a pullback isn't the end of the story. BTC went from $80,000 to $87,000 in September and it's just catching its breath. The ones who stay patient are usually the ones still standing.
Have a good week.
$BTC #Bitcoin #HappyMonday
85
Article
$SOL ETF INFLOWS HIT $188M$SOL is getting interesting here.
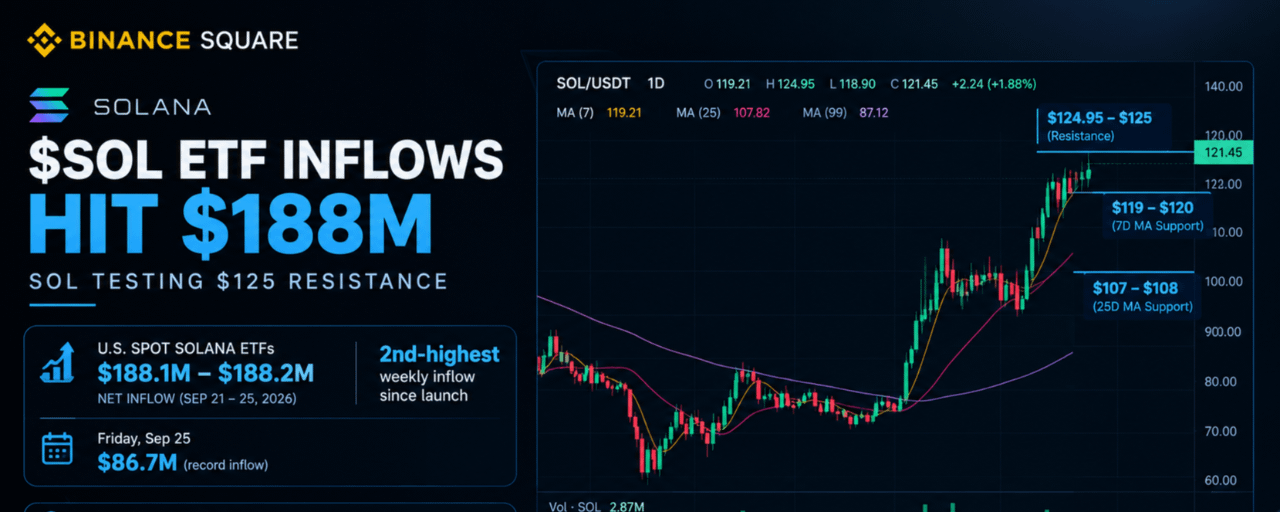
U.S. spot Solana ETFs pulled in $188.1M last week, the second-highest weekly inflow since launch. Even more notable: Friday alone brought $86.7M, a new daily record.
And the chart is showing the same strength.
SOL is sitting around $121.45, with the daily trend still clearly above the 7D MA at $119.21 and 25D MA at $107.82.
The level I'm watching now is $125. That's the recent high at $124.95.
If SOL breaks and holds above $125, the move could open room for another leg higher.
If $125 rejects, I'd watch $119–$120 first. Losing that zone would make the pullback more interesting.
For me, the ETF flows + the current chart structure are the two things worth watching right now.
Can $SOL break $125? 👀
#SOLSpotETFWeeklyInflow188M #SOL #Solana #Crypto #BinanceSquare
{future}(SOLUSDT)
$SOL ETF INFLOWS HIT $188M
$SOL is getting interesting here.
U.S. spot Solana ETFs pulled in $188.1M last week, the second-highest weekly inflow since launch. Even more notable: Friday alone brought $86.7M, a new daily record.
And the chart is showing the same strength.
SOL is sitting around $121.45, with the daily trend still clearly above the 7D MA at $119.21 and 25D MA at $107.82.
The level I'm watching now is $125. That's the recent high at $124.95.
If SOL breaks and holds above $125, the move could open room for another leg higher.
If $125 rejects, I'd watch $119–$120 first. Losing that zone would make the pullback more interesting.
For me, the ETF flows + the current chart structure are the two things worth watching right now.
Can $SOL break $125? 👀
#SOLSpotETFWeeklyInflow188M #SOL #Solana #Crypto #BinanceSquare
U.S. spot Solana ETFs pulled in $188.1M last week, the second-highest weekly inflow since launch. Even more notable: Friday alone brought $86.7M, a new daily record.
And the chart is showing the same strength.
SOL is sitting around $121.45, with the daily trend still clearly above the 7D MA at $119.21 and 25D MA at $107.82.
The level I'm watching now is $125. That's the recent high at $124.95.
If SOL breaks and holds above $125, the move could open room for another leg higher.
If $125 rejects, I'd watch $119–$120 first. Losing that zone would make the pullback more interesting.
For me, the ETF flows + the current chart structure are the two things worth watching right now.
Can $SOL break $125? 👀
#SOLSpotETFWeeklyInflow188M #SOL #Solana #Crypto #BinanceSquare
28
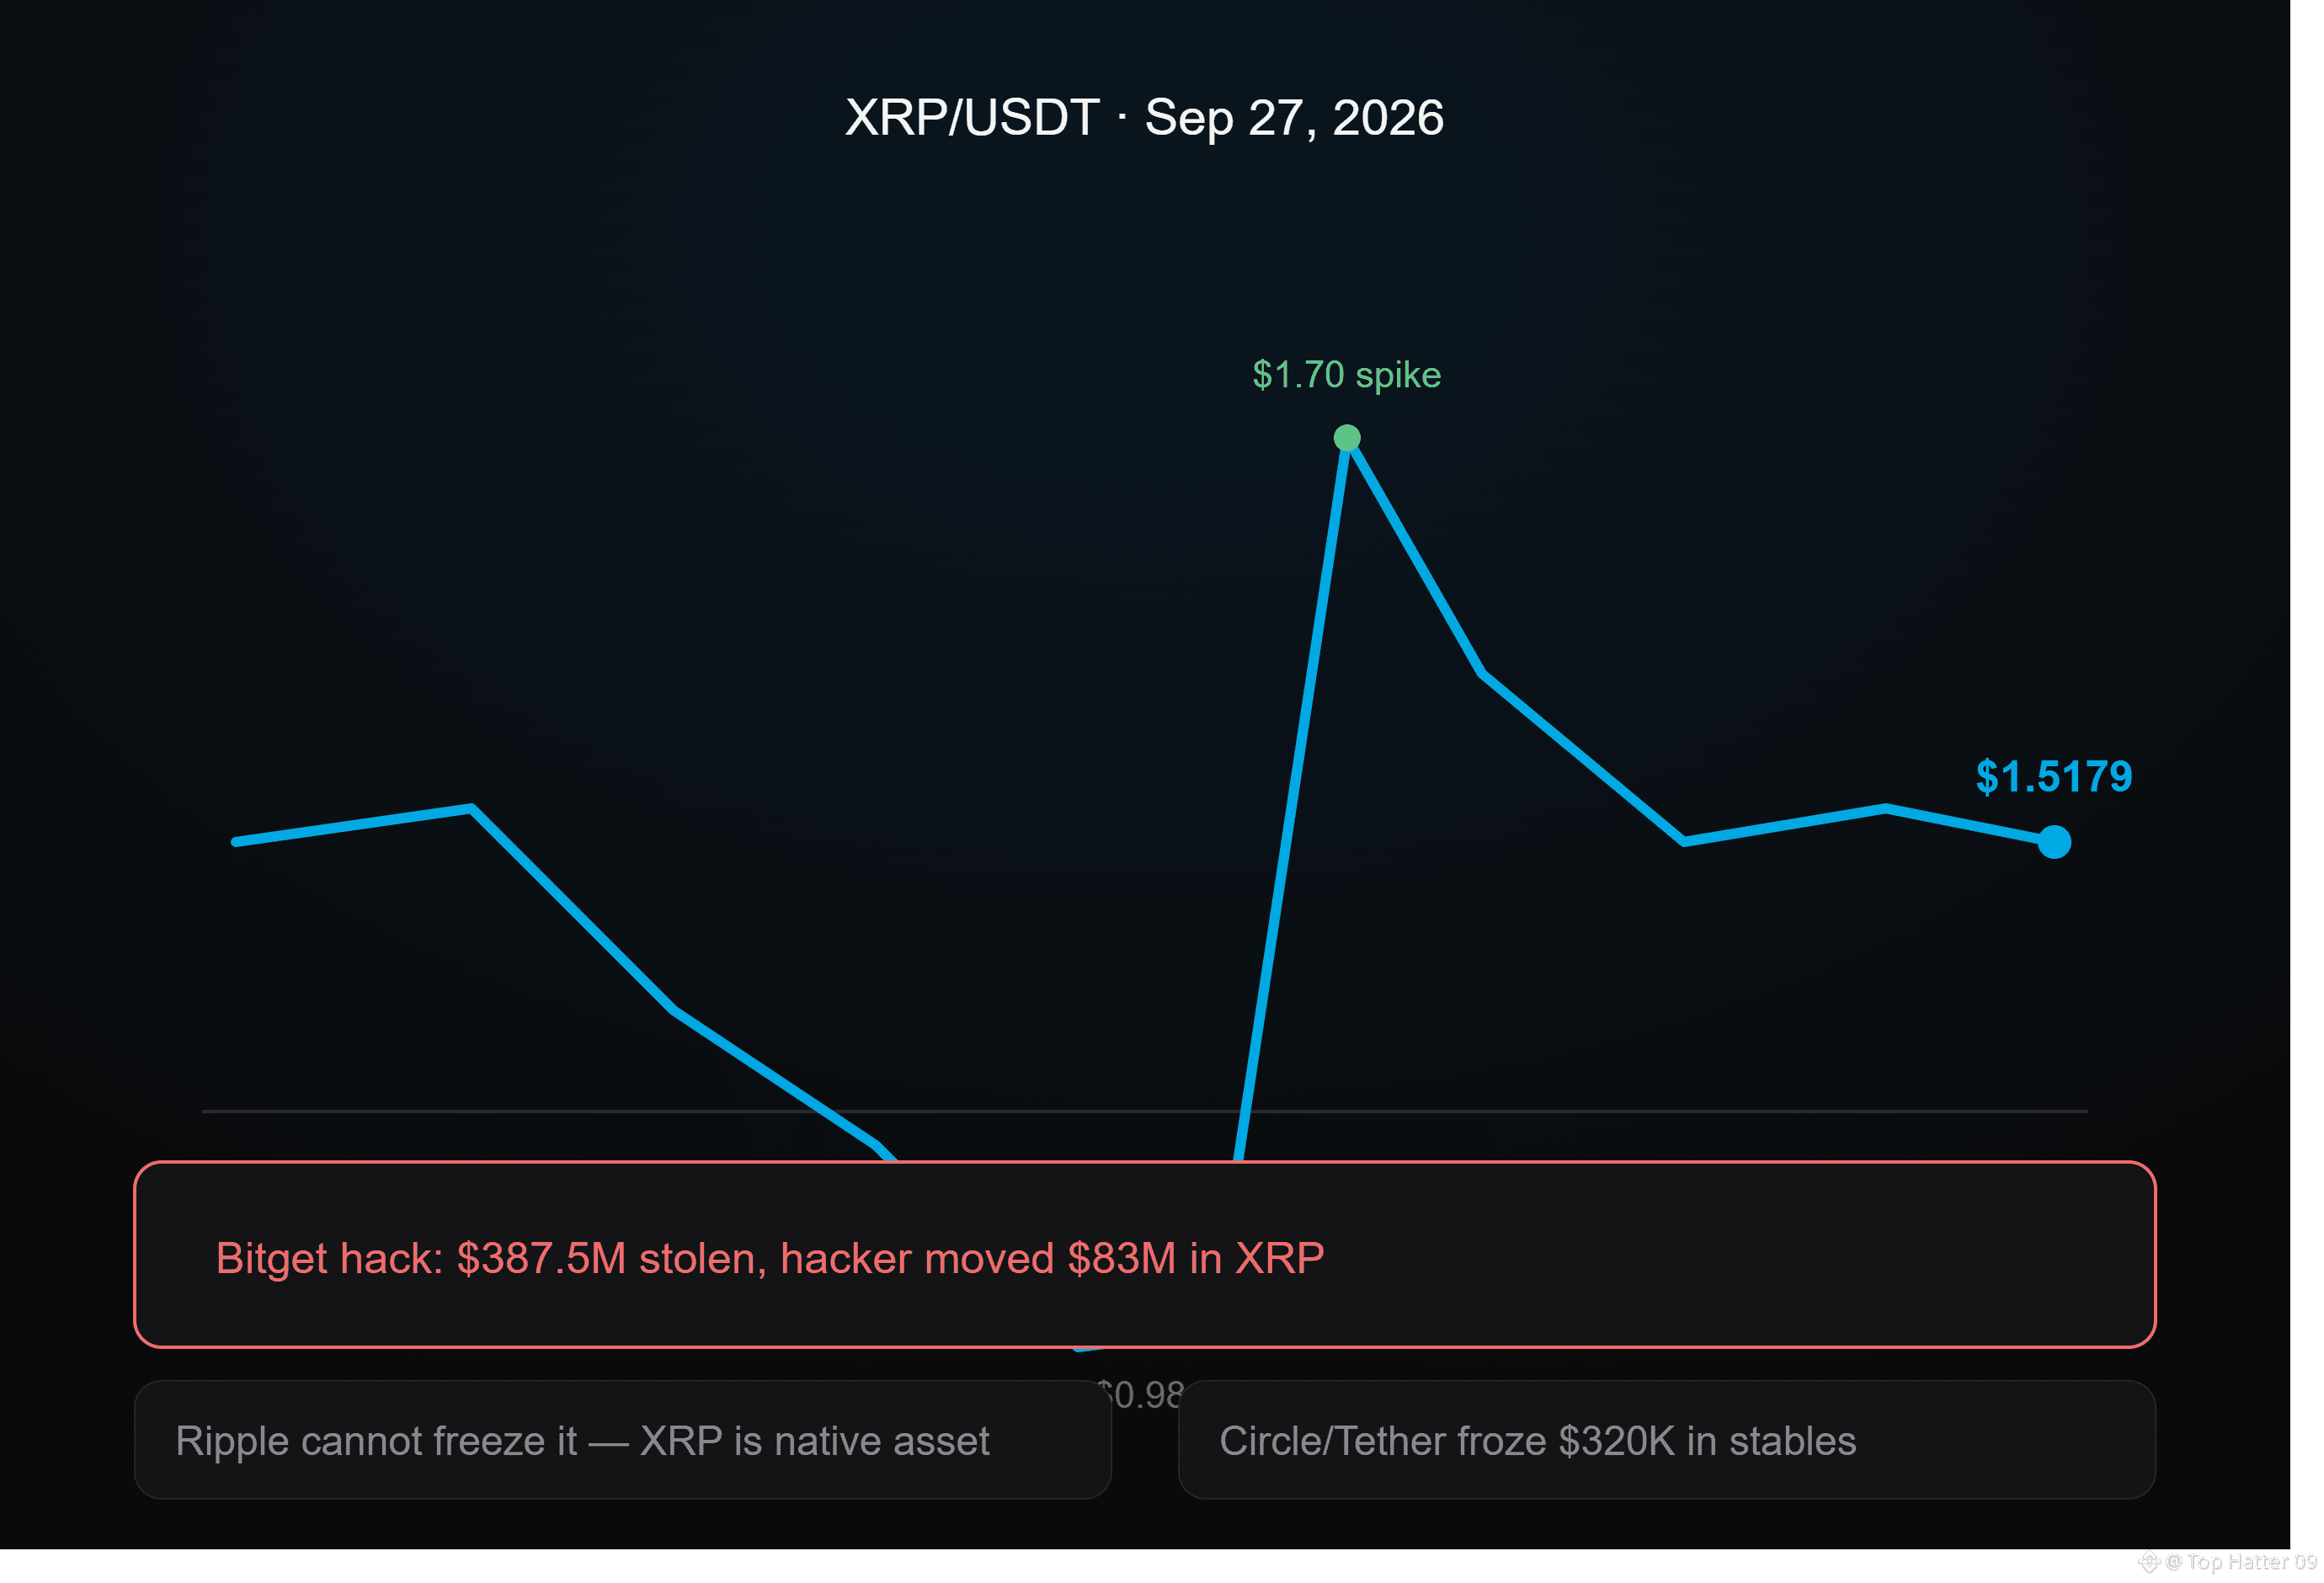
$XRP #BitgetHackerMoves$83MStolenXRP
Looking at the chart, XRP is cooling off a bit right now — trading at $1.5179, down 0.62% today, after a high of $1.5464 and low of $1.5060. Nothing dramatic, honestly looks like a healthy pause after a bigger move. It dropped to about $0.98 back in August, then spiked sharply to $1.70 in September, and now it's settling into the $1.50-1.55 zone.
The bigger story right now isn't the price though, it's security. Bitget exchange got hacked for roughly $387.5 million total, spread across XRP, ETH, USDT, and some Zcash and TRON assets. The hacker has already moved about $83 million worth of stolen XRP out of the original wallets. Here's the tricky part: Ripple has no way to freeze that XRP. Unlike Circle or Tether, who can blacklist stolen stablecoins (they already froze about $320,000 linked to this same hack), XRP is the network's own native asset, so there's simply no built-in freeze mechanism for it.
Bitget says its protection fund will cover the losses and customer balances aren't affected. Withdrawals are coming back in stages too, BTC on September 28, ETH on the 29th, USDT on the 30th.
Kind of a good reminder for traders that the decentralization crypto is built on can cut both ways. The same thing that keeps XRP censorship-resistant also means once it's stolen, almost nobody can stop it from moving.
$XRP #Ripple #CryptoSecurity
{future}(XRPUSDT)
$XRP #BitgetHackerMoves$83MStolenXRP
Looking at the chart, XRP is cooling off a bit right now — trading at $1.5179, down 0.62% today, after a high of $1.5464 and low of $1.5060. Nothing dramatic, honestly looks like a healthy pause after a bigger move. It dropped to about $0.98 back in August, then spiked sharply to $1.70 in September, and now it's settling into the $1.50-1.55 zone.
The bigger story right now isn't the price though, it's security. Bitget exchange got hacked for roughly $387.5 million total, spread across XRP, ETH, USDT, and some Zcash and TRON assets. The hacker has already moved about $83 million worth of stolen XRP out of the original wallets. Here's the tricky part: Ripple has no way to freeze that XRP. Unlike Circle or Tether, who can blacklist stolen stablecoins (they already froze about $320,000 linked to this same hack), XRP is the network's own native asset, so there's simply no built-in freeze mechanism for it.
Bitget says its protection fund will cover the losses and customer balances aren't affected. Withdrawals are coming back in stages too, BTC on September 28, ETH on the 29th, USDT on the 30th.
Kind of a good reminder for traders that the decentralization crypto is built on can cut both ways. The same thing that keeps XRP censorship-resistant also means once it's stolen, almost nobody can stop it from moving.
$XRP #Ripple #CryptoSecurity
Looking at the chart, XRP is cooling off a bit right now — trading at $1.5179, down 0.62% today, after a high of $1.5464 and low of $1.5060. Nothing dramatic, honestly looks like a healthy pause after a bigger move. It dropped to about $0.98 back in August, then spiked sharply to $1.70 in September, and now it's settling into the $1.50-1.55 zone.
The bigger story right now isn't the price though, it's security. Bitget exchange got hacked for roughly $387.5 million total, spread across XRP, ETH, USDT, and some Zcash and TRON assets. The hacker has already moved about $83 million worth of stolen XRP out of the original wallets. Here's the tricky part: Ripple has no way to freeze that XRP. Unlike Circle or Tether, who can blacklist stolen stablecoins (they already froze about $320,000 linked to this same hack), XRP is the network's own native asset, so there's simply no built-in freeze mechanism for it.
Bitget says its protection fund will cover the losses and customer balances aren't affected. Withdrawals are coming back in stages too, BTC on September 28, ETH on the 29th, USDT on the 30th.
Kind of a good reminder for traders that the decentralization crypto is built on can cut both ways. The same thing that keeps XRP censorship-resistant also means once it's stolen, almost nobody can stop it from moving.
$XRP #Ripple #CryptoSecurity
101
·
--
Bullish
$NEAR #bitwisefilesfinalnearspotetfprospectus
Just looked at this chart and it's hard to believe. NEAR is sitting at $5.22 right now, touched a high of $5.499 today, and the range for the day alone was almost 10%. If you weren't watching, you missed it moving from around $1.50-2 just a few weeks ago to nearly triple that now.
The reason is pretty clear. Bitwise filed the final prospectus for its spot NEAR ETF, and NYSE Arca approved it to list under the ticker "NRR." This fund will also stake the NEAR it holds, and pass most of those staking rewards (around 67%) back to investors.
Looking at the moving averages on the chart, the gap between them tells the story. The 7-day average is at $4.69, the 25-day is at $3.21, and the 99-day is way back at $2.18. That kind of spread usually means a coin isn't just having a random good day, it's breaking into a new range entirely.
One thing worth knowing: Bitwise's own research puts out a wide range of outcomes for NEAR by 2030, anywhere from $1.63 in a bad case to $562 in an extreme bull case, with $155 as their base estimate. That's a huge spread, which just shows how early and unproven this whole category still is for institutions.
For now, $5 holding as support is the level to watch. If it holds, there's room to keep going. If it doesn't, a pullback after this kind of move would be completely normal.
$NEAR #NEARProtocol #ETF #bitwisefilesfinalnearspotetfprospectus
{future}(NEARUSDT)
$NEAR #bitwisefilesfinalnearspotetfprospectus
Just looked at this chart and it's hard to believe. NEAR is sitting at $5.22 right now, touched a high of $5.499 today, and the range for the day alone was almost 10%. If you weren't watching, you missed it moving from around $1.50-2 just a few weeks ago to nearly triple that now.
The reason is pretty clear. Bitwise filed the final prospectus for its spot NEAR ETF, and NYSE Arca approved it to list under the ticker "NRR." This fund will also stake the NEAR it holds, and pass most of those staking rewards (around 67%) back to investors.
Looking at the moving averages on the chart, the gap between them tells the story. The 7-day average is at $4.69, the 25-day is at $3.21, and the 99-day is way back at $2.18. That kind of spread usually means a coin isn't just having a random good day, it's breaking into a new range entirely.
One thing worth knowing: Bitwise's own research puts out a wide range of outcomes for NEAR by 2030, anywhere from $1.63 in a bad case to $562 in an extreme bull case, with $155 as their base estimate. That's a huge spread, which just shows how early and unproven this whole category still is for institutions.
For now, $5 holding as support is the level to watch. If it holds, there's room to keep going. If it doesn't, a pullback after this kind of move would be completely normal.
$NEAR #NEARProtocol #ETF #bitwisefilesfinalnearspotetfprospectus
Just looked at this chart and it's hard to believe. NEAR is sitting at $5.22 right now, touched a high of $5.499 today, and the range for the day alone was almost 10%. If you weren't watching, you missed it moving from around $1.50-2 just a few weeks ago to nearly triple that now.
The reason is pretty clear. Bitwise filed the final prospectus for its spot NEAR ETF, and NYSE Arca approved it to list under the ticker "NRR." This fund will also stake the NEAR it holds, and pass most of those staking rewards (around 67%) back to investors.
Looking at the moving averages on the chart, the gap between them tells the story. The 7-day average is at $4.69, the 25-day is at $3.21, and the 99-day is way back at $2.18. That kind of spread usually means a coin isn't just having a random good day, it's breaking into a new range entirely.
One thing worth knowing: Bitwise's own research puts out a wide range of outcomes for NEAR by 2030, anywhere from $1.63 in a bad case to $562 in an extreme bull case, with $155 as their base estimate. That's a huge spread, which just shows how early and unproven this whole category still is for institutions.
For now, $5 holding as support is the level to watch. If it holds, there's room to keep going. If it doesn't, a pullback after this kind of move would be completely normal.
$NEAR #NEARProtocol #ETF #bitwisefilesfinalnearspotetfprospectus
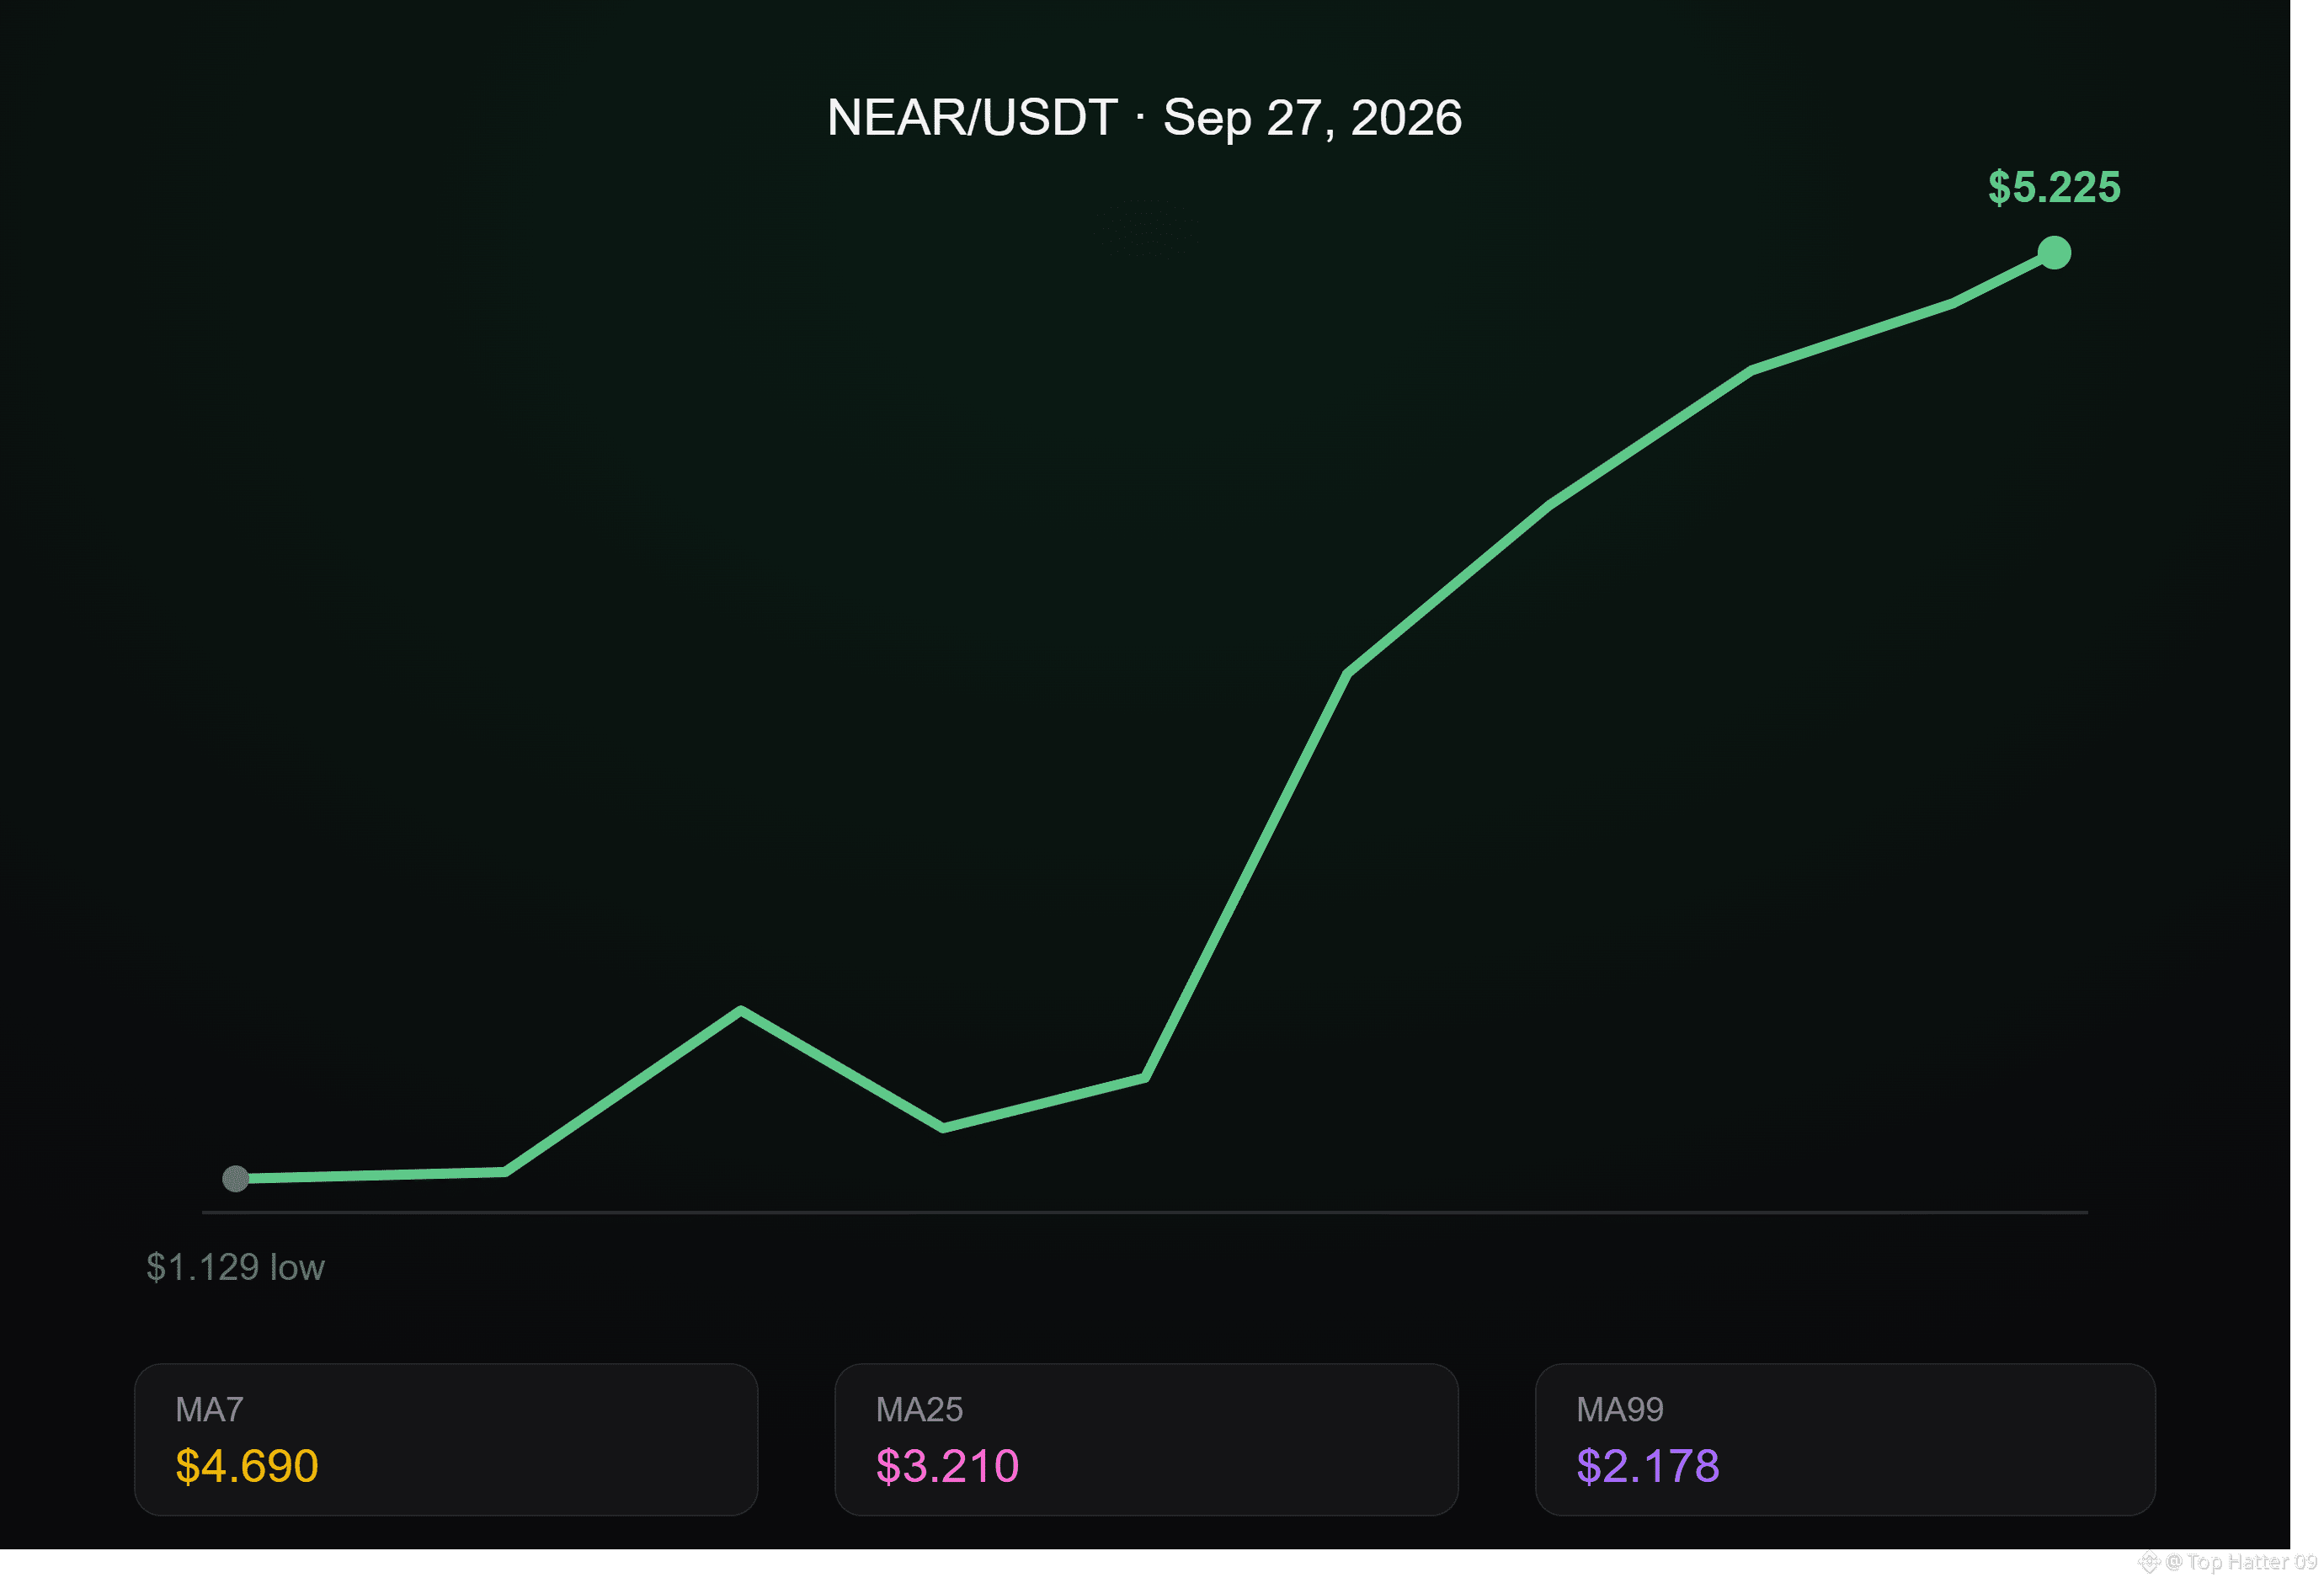
89
Log in to explore more content
Join global crypto users on Binance Square
⚡️ Get latest and useful information about crypto.
💬 Trusted by the world’s largest crypto exchange.
👍 Discover real insights from verified creators.
Email / Phone number
Trending Topics
AltcoinSeasonIndexHoldsAbove60For5Days
125 views
76 Discussing
The Altcoin Season Index has impressively held above the 60 mark for five consecutive days. This sustained level is historically a strong indicator that altcoins are outperforming Bitcoin, often heralding a period of significant growth for the broader altcoin market. Investors are closely watching this trend, as it suggests a potential shift in market dynamics favoring alternative cryptocurrencies over the market leader. This sustained bullish sentiment could pave the way for substantial gains across various altcoins, though caution remains paramount in the volatile crypto space.
Disclaimer: This is not investment advice. Always do your own research.
#AltcoinSeasonIndexHoldsAbove60For5Days $BTC
Luong Nguyen Ba
·0 Likes
·44 views
BitcoinSlipsBelow$84000
577 views
51 Discussing
KospiPostsWorstQuarterSince2020
83 views
48 Discussing