Binance Square
#sp500

sp500

694,851 views
2,222 Discussing
0xr1
ยท
--
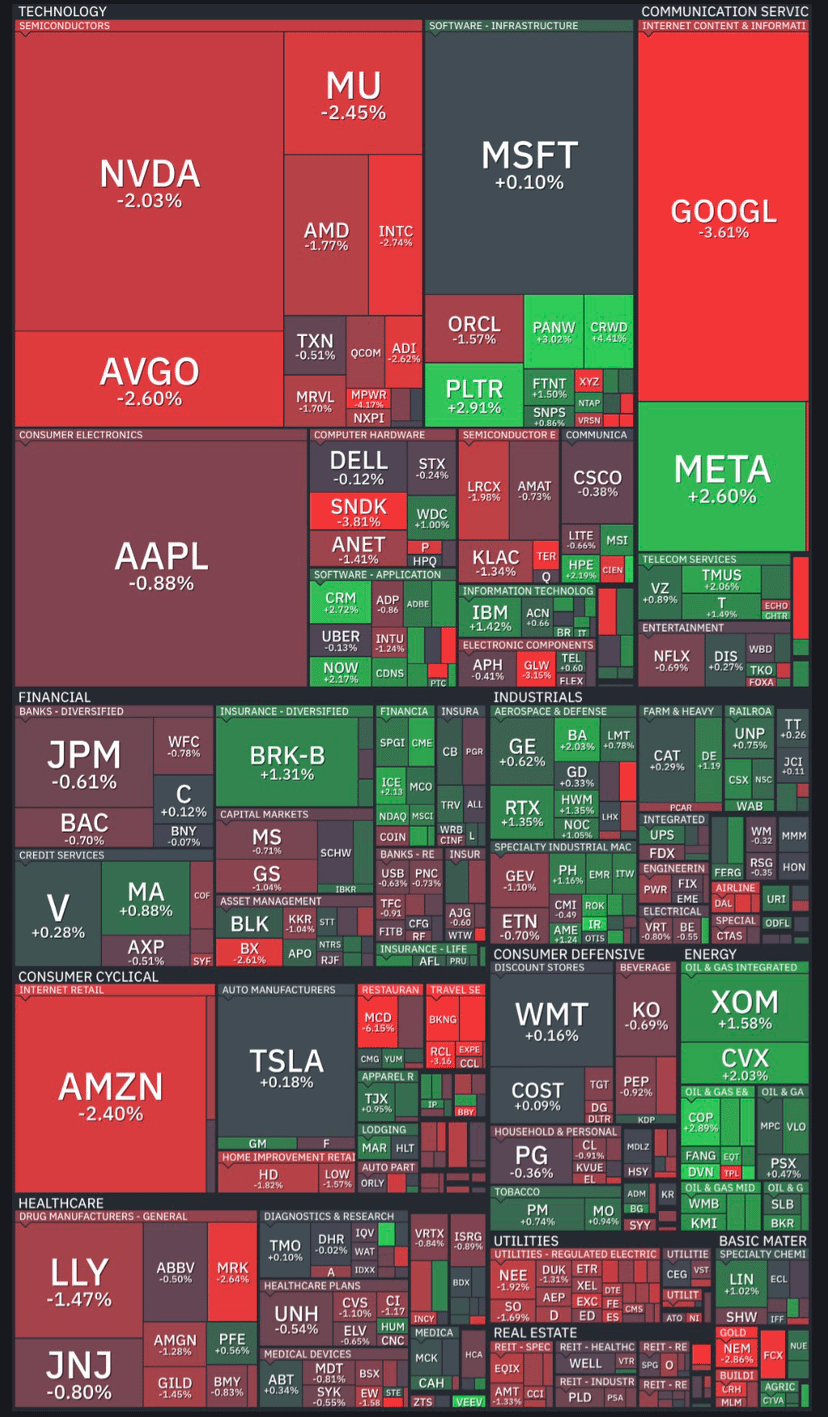
๐Ÿšจ ๐Œ๐š๐ซ๐ค๐ž๐ญ ๐”๐ฉ๐๐š๐ญ๐ž: ๐”๐’ ๐„๐ช๐ฎ๐ข๐ญ๐ข๐ž๐ฌ ๐‡๐จ๐ฅ๐ ๐๐ž๐š๐ซ ๐‘๐ž๐œ๐จ๐ซ๐ ๐‡๐ข๐ ๐ก๐ฌ ๐€๐ฆ๐ข๐ ๐“๐ž๐œ๐ก ๐‘๐š๐ฅ๐ฅ๐ฒ & ๐‚๐ซ๐ฎ๐๐ž ๐•๐จ๐ฅ๐š๐ญ๐ข๐ฅ๐ข๐ญ๐ฒ The US stock market is showing strong resilience, hovering near all-time highs despite macro headwinds and mixed economic signals. Here is a breakdown of key market drivers shaping current sentiment: ๐Ÿ’ป ๐“๐ž๐œ๐ก & ๐€๐ˆ ๐‹๐ž๐š๐ ๐ญ๐ก๐ž ๐Œ๐จ๐ฆ๐ž๐ง๐ญ๐ฎ๐ฆ: The Nasdaq Composite hit a new record close, propelled by ongoing strength in AI-related stocks and semiconductor giants like Micron Technology. Capital flows remain heavily concentrated in large-cap growth and AI infrastructure investments. ๐Ÿ›ข๏ธ ๐‚๐ซ๐ฎ๐๐ž ๐Ž๐ข๐ฅ & ๐˜๐ข๐ž๐ฅ๐๐ฌ ๐ข๐ง ๐…๐จ๐œ๐ฎ๐ฌ: WTI and Brent crude fluctuations are directly influencing market direction. Recent spikes toward $100/barrel pushed 10-Year US Treasury yields up to ~4.90%, keeping borrowing costs under scrutiny and applying brief pressure to broad indices. ๐Ÿ“Š ๐„๐š๐ซ๐ง๐ข๐ง๐ ๐ฌ ๐Ž๐ฎ๐ญ๐ฅ๐จ๐จ๐ค: Analysts forecast S&P 500 earnings growth to expand near double-digit territory year-over-year, providing fundamental support to current valuations even as September historical seasonality brings typical market choppy behavior. ๐ŸŽฏ ๐Š๐ž๐ฒ ๐‹๐ž๐ฏ๐ž๐ฅ๐ฌ & ๐ˆ๐ง๐๐ข๐œ๐š๐ญ๐จ๐ซ๐ฌ: โ€ข S&P 500: Trading right below its peak near 7,764 levels. โ€ข Nasdaq 100: Outperforming, driven by chipmakers and tech megacaps. โ€ข 10Y Treasury Yield: ~4.90%. What is your current bias on the marketโ€”bullish continuation or expecting a pullback? #USMarket #Stocks #SP500 #Nasdaq .
๐Ÿšจ ๐Œ๐š๐ซ๐ค๐ž๐ญ ๐”๐ฉ๐๐š๐ญ๐ž: ๐”๐’ ๐„๐ช๐ฎ๐ข๐ญ๐ข๐ž๐ฌ ๐‡๐จ๐ฅ๐ ๐๐ž๐š๐ซ ๐‘๐ž๐œ๐จ๐ซ๐ ๐‡๐ข๐ ๐ก๐ฌ ๐€๐ฆ๐ข๐ ๐“๐ž๐œ๐ก ๐‘๐š๐ฅ๐ฅ๐ฒ & ๐‚๐ซ๐ฎ๐๐ž ๐•๐จ๐ฅ๐š๐ญ๐ข๐ฅ๐ข๐ญ๐ฒ

The US stock market is showing strong resilience, hovering near all-time highs despite macro headwinds and mixed economic signals.
Here is a breakdown of key market drivers shaping current sentiment:

๐Ÿ’ป ๐“๐ž๐œ๐ก & ๐€๐ˆ ๐‹๐ž๐š๐ ๐ญ๐ก๐ž ๐Œ๐จ๐ฆ๐ž๐ง๐ญ๐ฎ๐ฆ: The Nasdaq Composite hit a new record close, propelled by ongoing strength in AI-related stocks and semiconductor giants like Micron Technology. Capital flows remain heavily concentrated in large-cap growth and AI infrastructure investments.

๐Ÿ›ข๏ธ ๐‚๐ซ๐ฎ๐๐ž ๐Ž๐ข๐ฅ & ๐˜๐ข๐ž๐ฅ๐๐ฌ ๐ข๐ง ๐…๐จ๐œ๐ฎ๐ฌ: WTI and Brent crude fluctuations are directly influencing market direction. Recent spikes toward $100/barrel pushed 10-Year US Treasury yields up to ~4.90%, keeping borrowing costs under scrutiny and applying brief pressure to broad indices.

๐Ÿ“Š ๐„๐š๐ซ๐ง๐ข๐ง๐ ๐ฌ ๐Ž๐ฎ๐ญ๐ฅ๐จ๐จ๐ค: Analysts forecast S&P 500 earnings growth to expand near double-digit territory year-over-year, providing fundamental support to current valuations even as September historical seasonality brings typical market choppy behavior.

๐ŸŽฏ ๐Š๐ž๐ฒ ๐‹๐ž๐ฏ๐ž๐ฅ๐ฌ & ๐ˆ๐ง๐๐ข๐œ๐š๐ญ๐จ๐ซ๐ฌ:

โ€ข S&P 500: Trading right below its peak near 7,764 levels.
โ€ข Nasdaq 100: Outperforming, driven by chipmakers and tech megacaps.
โ€ข 10Y Treasury Yield: ~4.90%.

What is your current bias on the marketโ€”bullish continuation or expecting a pullback?

#USMarket #Stocks #SP500 #Nasdaq .
ยท
--
Bullish
๐Ÿ“Š S&P 500 โ€” My Outlook The S&P 500 is now only around 0.5% away from a new all-time high ๐Ÿ”ฅ My view: I wouldnโ€™t be surprised to see another push higher before we get a deeper correction. With the 2026 US midterm elections approaching in November, I think the Trump administration could continue pushing for new trade or economic deals or fake news with he's posts in the coming weeks. If markets interpret these developments positively, we could see another leg higher in equities ๐Ÿ“ˆ. ๐ŸŽฏ My target: S&P 500 โ†’ around 7,940 After another move higher, I think the market could eventually face a deeper correction later this year or into 2027 ๐Ÿ“‰. And if that correction happens, it could also have an impact on other major assets such as Gold ๐Ÿฅ‡ and Bitcoin โ‚ฟ, especially if liquidity and risk appetite deteriorate. #SP500 #stocks #Bitcoin #trading
๐Ÿ“Š S&P 500 โ€” My Outlook
The S&P 500 is now only around 0.5% away from a new all-time high ๐Ÿ”ฅ
My view: I wouldnโ€™t be surprised to see another push higher before we get a deeper correction.
With the 2026 US midterm elections approaching in November, I think the Trump administration could continue pushing for new trade or economic deals or fake news with he's posts in the coming weeks. If markets interpret these developments positively, we could see another leg higher in equities ๐Ÿ“ˆ.

๐ŸŽฏ My target:
S&P 500 โ†’ around 7,940

After another move higher, I think the market could eventually face a deeper correction later this year or into 2027 ๐Ÿ“‰.
And if that correction happens, it could also have an impact on other major assets such as Gold ๐Ÿฅ‡ and Bitcoin โ‚ฟ, especially if liquidity and risk appetite deteriorate.
#SP500 #stocks #Bitcoin #trading
ยท
--
Bearish
๐Ÿšจ Red Alert on Wall Street! Whatโ€™s happening with Stocks Today? ๐Ÿ“‰๐Ÿ”ฅ โ€‹Attention community! Today, the screens of the traditional stock market turned red. If you were trading calmly thinking that only crypto has wild days, you need to look at this: โ€‹โฌ‡๏ธ The giants are falling: The S&P 500, the Dow Jones, and the Nasdaq are all in full retreat after recently hitting record highs. ๐Ÿ“ˆ โ€œSafe moneyโ€ is performing better: Yields on U.S. Treasury 10-year bonds have just jumped above 5%. Levels that scare traditional investors and stall the markets! โš ๏ธ The specter of inflation: With oil rebounding strongly amid geopolitical tensions, fears that inflation will return are pressuring the whole board. โ€‹And why should you care about this if you trade on Binance Square? ๐Ÿค” โ€‹Very easy. The entire global financial ecosystem is connected. When government bond yields rise, money becomes โ€œmore expensive.โ€ This leads whales and large institutional funds to tend to pull liquidity from higher-risk assets (like tech stocks and cryptocurrencies). ๐Ÿ’ธ๐Ÿ”„ โ€‹However, for many veterans, this kind of turbulence in the traditional stock market is exactly why assets like Bitcoin, Ethereum, and the entire decentralized BNBChain ecosystem succeed. Is there a real alternativeโ€”without intermediariesโ€”to the problems of the traditional economy? Thatโ€™s the long-term vision! ๐Ÿ›ก๏ธ๐Ÿ’Ž โ€‹The market always tests us. The key is not to panic, stay informed, and always understand the broader macro picture. โ€‹What do you think about this drop in stocks today? Are you taking advantage to buy low, or do you prefer to stay liquid, waiting for the storm to pass? ๐Ÿ‘‡ Leave your strategy in the comments! โ€‹#WallStreet #ACCIONES #SP500 #TradingTips #Bitcoin $BTC {spot}(BTCUSDT) $SPYB {spot}(SPYBUSDT) $QQQB {spot}(QQQBUSDT)
๐Ÿšจ Red Alert on Wall Street!

Whatโ€™s happening with Stocks Today? ๐Ÿ“‰๐Ÿ”ฅ

โ€‹Attention community! Today, the screens of the traditional stock market turned red. If you were trading calmly thinking that only crypto has wild days, you need to look at this:

โ€‹โฌ‡๏ธ The giants are falling: The S&P 500, the Dow Jones, and the Nasdaq are all in full retreat after recently hitting record highs.

๐Ÿ“ˆ โ€œSafe moneyโ€ is performing better: Yields on U.S. Treasury 10-year bonds have just jumped above 5%. Levels that scare traditional investors and stall the markets!

โš ๏ธ The specter of inflation: With oil rebounding strongly amid geopolitical tensions, fears that inflation will return are pressuring the whole board.

โ€‹And why should you care about this if you trade on Binance Square? ๐Ÿค”

โ€‹Very easy. The entire global financial ecosystem is connected. When government bond yields rise, money becomes โ€œmore expensive.โ€ This leads whales and large institutional funds to tend to pull liquidity from higher-risk assets (like tech stocks and cryptocurrencies). ๐Ÿ’ธ๐Ÿ”„

โ€‹However, for many veterans, this kind of turbulence in the traditional stock market is exactly why assets like Bitcoin, Ethereum, and the entire decentralized BNBChain ecosystem succeed. Is there a real alternativeโ€”without intermediariesโ€”to the problems of the traditional economy? Thatโ€™s the long-term vision! ๐Ÿ›ก๏ธ๐Ÿ’Ž

โ€‹The market always tests us. The key is not to panic, stay informed, and always understand the broader macro picture.

โ€‹What do you think about this drop in stocks today?

Are you taking advantage to buy low, or do you prefer to stay liquid, waiting for the storm to pass?

๐Ÿ‘‡ Leave your strategy in the comments!

โ€‹#WallStreet #ACCIONES #SP500 #TradingTips #Bitcoin
$BTC
$SPYB
$QQQB
ยท
--
๐Ÿ“ˆ US stocks rise collectively The major US indexes rose during todayโ€™s trading: โ€ข Dow Jones: +0.30% โ€ข Nasdaq: +1.18% โ€ข S&P 500: +0.54% ๐Ÿ“Œ Cipher Vault: The rise in the indicesโ€”especially the Nasdaqโ€”reflects an improvement in risk appetite in the stock markets, which digital currency markets also watch. โš ๏ธ Not financial advice or a buy/sell recommendation. #Nasdaq #SP500 #DowJones #Crypto
๐Ÿ“ˆ US stocks rise collectively

The major US indexes rose during todayโ€™s trading:

โ€ข Dow Jones: +0.30%
โ€ข Nasdaq: +1.18%
โ€ข S&P 500: +0.54%

๐Ÿ“Œ Cipher Vault: The rise in the indicesโ€”especially the Nasdaqโ€”reflects an improvement in risk appetite in the stock markets, which digital currency markets also watch.

โš ๏ธ Not financial advice or a buy/sell recommendation.

#Nasdaq #SP500 #DowJones #Crypto
ยท
--
Bullish
Verified
Wall Street starts the week quietly U.S. stock index futures move in a limited range at the start of the weekโ€™s trading, after the Dow Jones posted losses for the third consecutive week. Dow Jones: +0.05% S&P 500: +0.09% Nasdaq 100: +0.05% The weak moves reflect a wait-and-see mood in the markets, especially with continued focus on U.S. interest rates, bond yields, and the performance of technology stocks. ๐Ÿ“Œ A quiet startโ€ฆ but the Wall Street session could set the direction of risk appetite across markets, including digital currencies. {future}(SPYUSDT) {future}(QQQUSDT) {etf_us}(DIA.ETF) #BTC #Nasdaq #SP500 #stockmarket
Wall Street starts the week quietly
U.S. stock index futures move in a limited range at the start of the weekโ€™s trading, after the Dow Jones posted losses for the third consecutive week.
Dow Jones: +0.05%
S&P 500: +0.09%
Nasdaq 100: +0.05%
The weak moves reflect a wait-and-see mood in the markets, especially with continued focus on U.S. interest rates, bond yields, and the performance of technology stocks.
๐Ÿ“Œ A quiet startโ€ฆ but the Wall Street session could set the direction of risk appetite across markets, including digital currencies.

#BTC #Nasdaq #SP500
#stockmarket
DIAETF-0.28%
QQQB+0.00%
SPYB-0.03%
ยท
--
๐Ÿšจ WHAT COULD HAPPEN WHEN US STOCKS OPEN MONDAY? Monday could be interesting. ๐Ÿ‘€ Wall Street ended Friday mixed: ๐Ÿ“ˆ $VOO.ETF : +0.2% ๐Ÿ“ˆ $QQQB : +0.4% ๐Ÿ“‰ Dow: -0.2% But there are still some big things to watch. ๐Ÿ’ต Treasury yields are near 5% ๐Ÿ›ข๏ธ Oil is still around $100+ ๐Ÿฆ The Fed just raised rates to 3.75%โ€“4.00% {etf_us}(VOO.ETF) So Monday could start with some volatility. If yields and oil cool down, buyers could return to stocks. If yields move higher again, tech and growth stocks could face pressure. I'm watching the Nasdaq and S&P 500 closely when the market opens. {future}(NVDAUSDT) $TSLAB Mon#Stocks #SP500 #Nasdaq #BinanceSquare
๐Ÿšจ WHAT COULD HAPPEN WHEN US STOCKS OPEN MONDAY?

Monday could be interesting. ๐Ÿ‘€

Wall Street ended Friday mixed:

๐Ÿ“ˆ $VOO.ETF : +0.2%
๐Ÿ“ˆ $QQQB : +0.4%
๐Ÿ“‰ Dow: -0.2%

But there are still some big things to watch.

๐Ÿ’ต Treasury yields are near 5%

๐Ÿ›ข๏ธ Oil is still around $100+

๐Ÿฆ The Fed just raised rates to 3.75%โ€“4.00%


So Monday could start with some volatility.

If yields and oil cool down,
buyers could return to stocks.

If yields move higher again,
tech and growth stocks could face pressure.

I'm watching the Nasdaq and S&P 500 closely when the market opens.

$TSLAB

Mon#Stocks #SP500 #Nasdaq #BinanceSquare
๐Ÿšจ FED RATE HIKE COULD ACTUALLY BOOST STOCKS? ๐Ÿ“ˆ๐Ÿ‡บ๐Ÿ‡ธ Fundstratโ€™s Tom Lee expects the Federal Reserve to raise rates by 25 basis points todayโ€”but says the move could trigger a strong equity rally instead of hurting markets. Lee argues the hike could be viewed as the final increase of the cycle, potentially easing pressure on future rate hikes and pushing Treasury yields lower. He also points to temporary inflation distortions that could fade naturally over the next six months. With heavy cash sitting on the sidelines and stocks already facing several down days, Lee sees potential fuel for a rebound. He remains bullish on corporate earnings and believes stronger housing investment could add $30โ€“$50 to S&P 500 earnings. ๐Ÿ“Š Fed decision: 2 PM ET ๐Ÿ”ฅ Markets are watching closely. #Fed #Stocks #SP500 #Crypto #Bitcoin
๐Ÿšจ FED RATE HIKE COULD ACTUALLY BOOST STOCKS? ๐Ÿ“ˆ๐Ÿ‡บ๐Ÿ‡ธ

Fundstratโ€™s Tom Lee expects the Federal Reserve to raise rates by 25 basis points todayโ€”but says the move could trigger a strong equity rally instead of hurting markets.

Lee argues the hike could be viewed as the final increase of the cycle, potentially easing pressure on future rate hikes and pushing Treasury yields lower.

He also points to temporary inflation distortions that could fade naturally over the next six months.

With heavy cash sitting on the sidelines and stocks already facing several down days, Lee sees potential fuel for a rebound.

He remains bullish on corporate earnings and believes stronger housing investment could add $30โ€“$50 to S&P 500 earnings.

๐Ÿ“Š Fed decision: 2 PM ET
๐Ÿ”ฅ Markets are watching closely.

#Fed #Stocks #SP500 #Crypto #Bitcoin
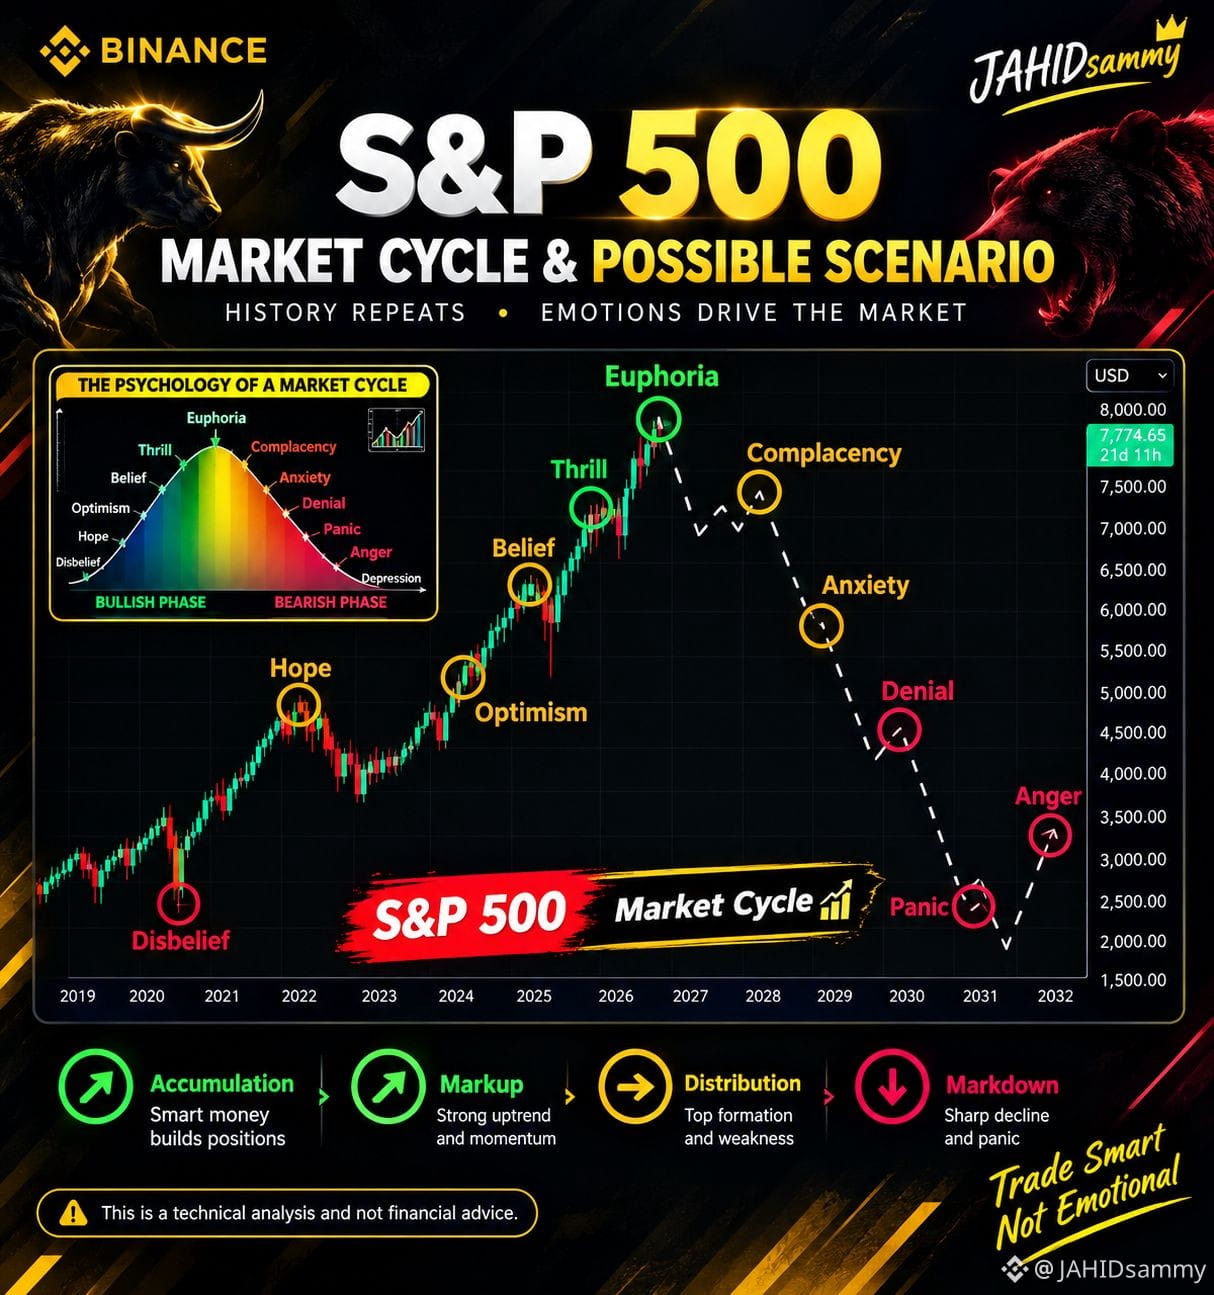
S&P 500 Market Cycle ๐Ÿ“Š Markets move in cycles โ€” Hope โ†’ Optimism โ†’ Euphoria โ†’ Anxiety โ†’ Panic. The big question is: Where are we in the cycle right now? ๐Ÿ‘€ Do you think the next move will be Bullish ๐Ÿ“ˆ or Bearish ๐Ÿ“‰? Share your prediction in the comments! โš ๏ธ This is technical analysis for educational purposes only, not financial advice. #SP500 #StockMarket #MarketCycle #Trading #TechnicalAnalysis #Investing $NVDAB $GOOGL.US
S&P 500 Market Cycle ๐Ÿ“Š
Markets move in cycles โ€” Hope โ†’ Optimism โ†’ Euphoria โ†’ Anxiety โ†’ Panic.
The big question is: Where are we in the cycle right now? ๐Ÿ‘€
Do you think the next move will be Bullish ๐Ÿ“ˆ or Bearish ๐Ÿ“‰?
Share your prediction in the comments!
โš ๏ธ This is technical analysis for educational purposes only, not financial advice.
#SP500 #StockMarket #MarketCycle #Trading #TechnicalAnalysis #Investing $NVDAB $GOOGL.US
NVDAB-0.75%
GOOGLUS+1.13%
ยท
--
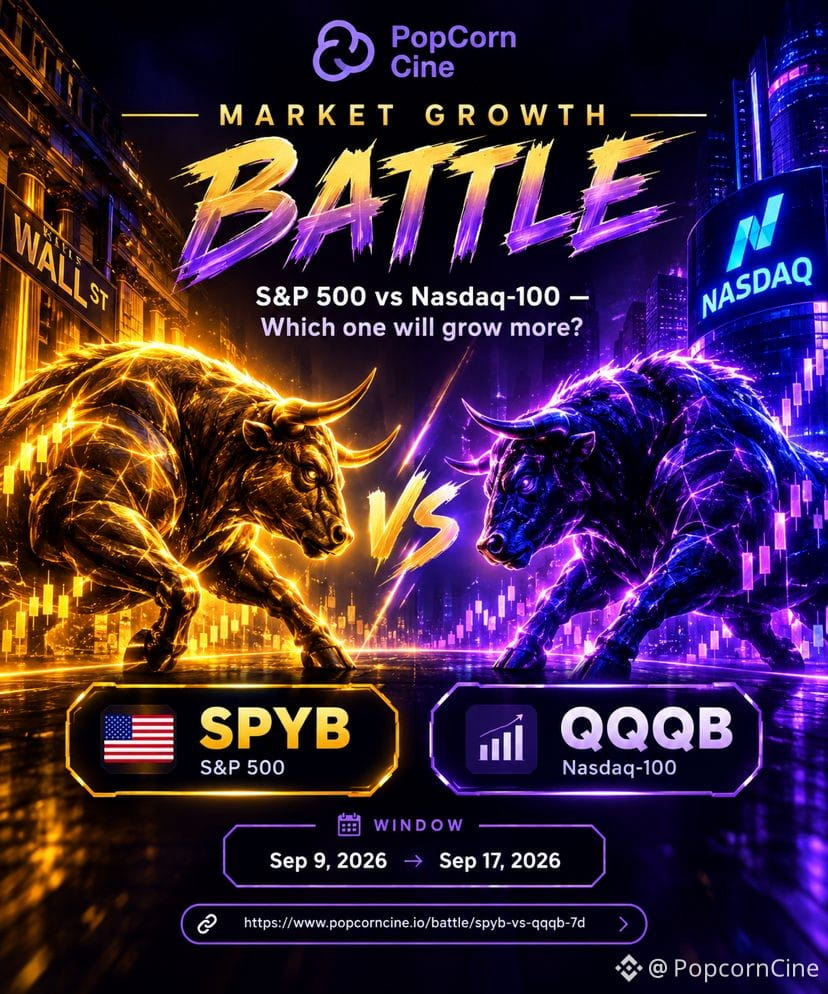
MARKET GROWTH BATTLE S&P 500 vs Nasdaq-100 Which one will grow more? ๐ŸฅŠ SPYB vs QQQB Sep 9 โ†’ Sep 17, 2026 Join here: https://www.popcorncine.io/battle/spyb-vs-qqqb-7d #Popcorncine #SP500 #NASDAQ #bStocks
MARKET GROWTH BATTLE

S&P 500 vs Nasdaq-100
Which one will grow more?

๐ŸฅŠ SPYB vs QQQB
Sep 9 โ†’ Sep 17, 2026

Join here: https://www.popcorncine.io/battle/spyb-vs-qqqb-7d

#Popcorncine #SP500 #NASDAQ #bStocks
ยท
--
Verified
Article
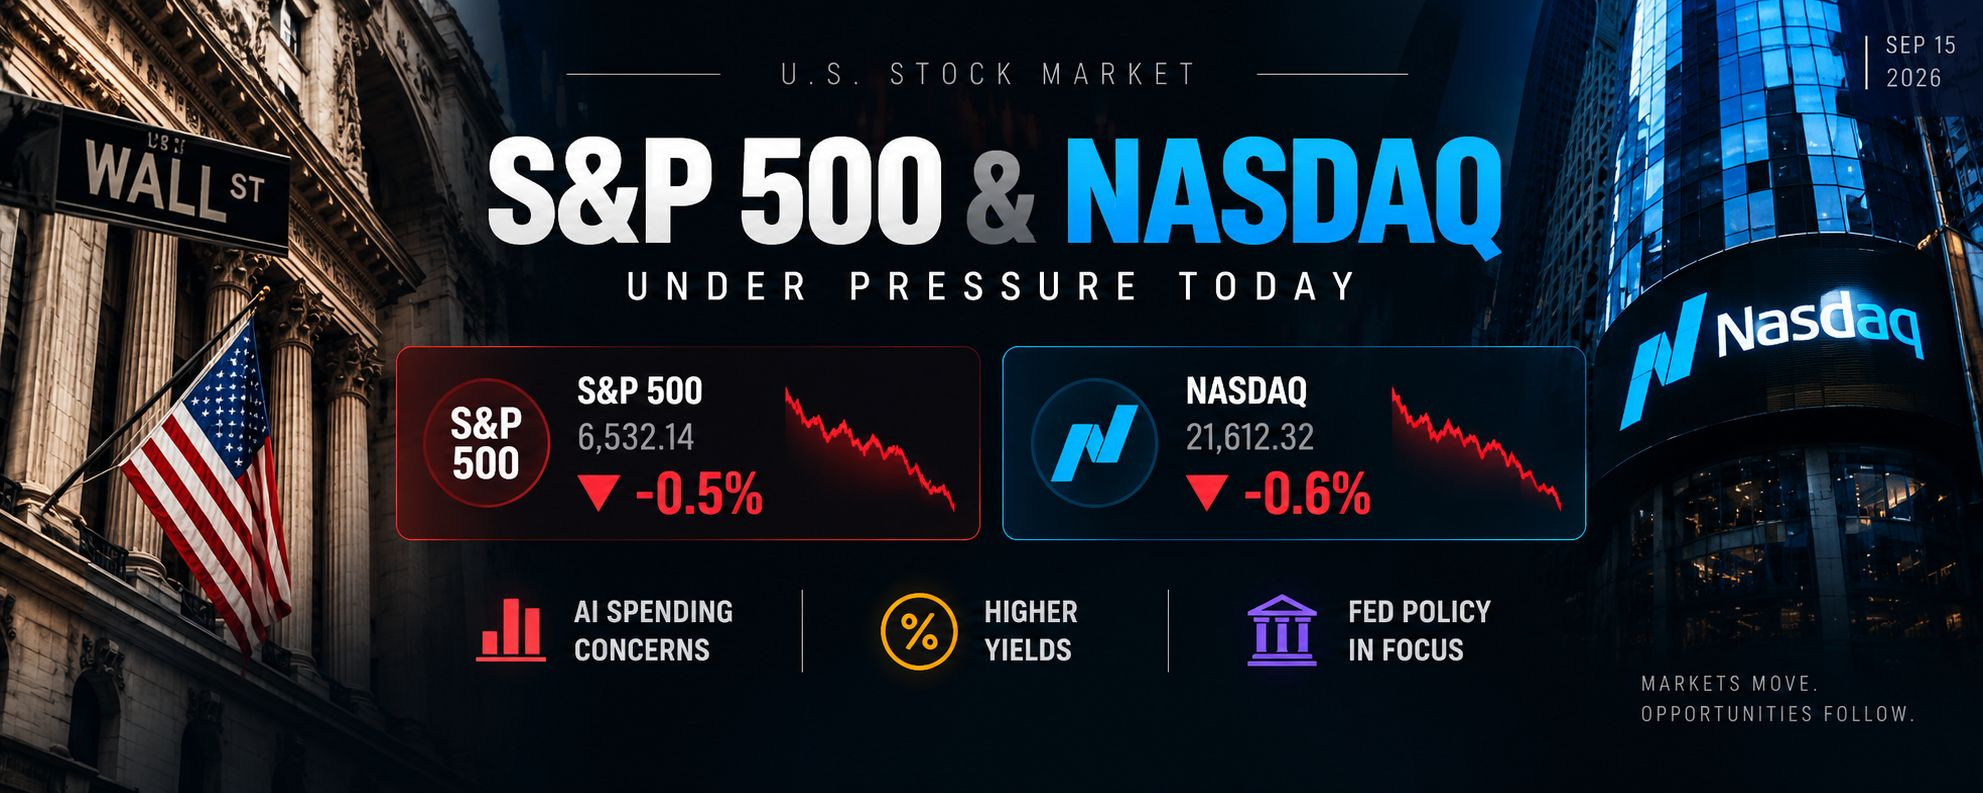
๐Ÿ“Š S&P 500 & NASDAQ: WHY ARE U.S. STOCKS UNDER PRESSURE?The S&P 500 and Nasdaq are facing renewed pressure as investors reassess two major risks: higher interest rates and the sustainability of the AI-driven rally. On Monday, the S&P 500 fell around 0.5%, while the Nasdaq Composite declined around 0.6%. Two developments are getting the most attention: ๐Ÿ“‰ AI concerns Investors are becoming more cautious about the massive spending on AI infrastructure after industry leaders called for a slower pace of AI development. ๐Ÿ’ต Higher yields The U.S. 10-year Treasury yield briefly moved above 5%, increasing pressure on equity valuations, particularly growth and technology stocks. The Federal Reserve is also beginning its September policy meeting, with markets expecting a potential rate hike as inflation remains a concern. For investors, the key question isn't simply whether stocks will rise or fall. It's whether earnings growth can continue to justify high valuations while borrowing costs and Treasury yields remain elevated. ๐Ÿ’ฌ Which market do you think is more vulnerable to higher interest rates: S&P 500 or Nasdaq? #SP500 #NASDAQ #stockmarket #TradFi

๐Ÿ“Š S&P 500 & NASDAQ: WHY ARE U.S. STOCKS UNDER PRESSURE?

The S&P 500 and Nasdaq are facing renewed pressure as investors reassess two major risks: higher interest rates and the sustainability of the AI-driven rally.
On Monday, the S&P 500 fell around 0.5%, while the Nasdaq Composite declined around 0.6%.
Two developments are getting the most attention:
๐Ÿ“‰ AI concerns Investors are becoming more cautious about the massive spending on AI infrastructure after industry leaders called for a slower pace of AI development.
๐Ÿ’ต Higher yields The U.S. 10-year Treasury yield briefly moved above 5%, increasing pressure on equity valuations, particularly growth and technology stocks.
The Federal Reserve is also beginning its September policy meeting, with markets expecting a potential rate hike as inflation remains a concern.
For investors, the key question isn't simply whether stocks will rise or fall.
It's whether earnings growth can continue to justify high valuations while borrowing costs and Treasury yields remain elevated.
๐Ÿ’ฌ Which market do you think is more vulnerable to higher interest rates: S&P 500 or Nasdaq?
#SP500 #NASDAQ #stockmarket #TradFi
ยท
--
Macro Risk Advisors (MRA) CEO Dean Curnutt recently issued a warning in the latest market outlook, saying that if the Federal Reserve were to restart a rate-hike cycle, the S&P 500 index could face a downside adjustment of 8% to 10%. The view quickly sparked discussion in the macro trading community. Behind this warning is mainly the recent sustained rise in energy costs and signs that inflation data may be picking up. As a result, the yield on US 10-year Treasury notes first broke above the 5% threshold since 2023, prompting the interest-rate futures market to begin re-pricing the likelihood of further Fed rate hikes. Curnutt noted that if rates continue to rise, corporate profit marginsโ€”especially for companies unable to pass costs through smoothlyโ€”would be seriously squeezed, and that the broader market is clearly not adequately prepared to hedge against potential volatility. From the perspective of traditional financial markets, the current macro environment is quite similar to the second half of 2018. Back then, after the S&P 500 peaked in September, it pulled back by about 10% from October to November, and then weakened further in December. If the Fed truly turns back to hiking rates, Treasury yields and the US dollar index could remain in a range-bound high-level consolidation, putting pressure on valuations of risk assets such as stocks. The market may well undergo another round of valuation re-pricing later this year. For the crypto market, a high-interest-rate environment usually means liquidity cannot loosen quickly. If US equitiesโ€”especially technology stocksโ€”see a pullback due to adjustments in rate expectations, crypto assets in the short term often experience knock-on effects through sentiment. As of now, the market remains in a period of mixed bullish and bearish signals, with funds seeking balance between risk-off positioning and betting on rebound opportunities. Going forward, close attention is still needed to the persistence of inflation data and the Fedโ€™s actual stance. #Fed #SP500 #InterestRates
Macro Risk Advisors (MRA) CEO Dean Curnutt recently issued a warning in the latest market outlook, saying that if the Federal Reserve were to restart a rate-hike cycle, the S&P 500 index could face a downside adjustment of 8% to 10%. The view quickly sparked discussion in the macro trading community.

Behind this warning is mainly the recent sustained rise in energy costs and signs that inflation data may be picking up. As a result, the yield on US 10-year Treasury notes first broke above the 5% threshold since 2023, prompting the interest-rate futures market to begin re-pricing the likelihood of further Fed rate hikes. Curnutt noted that if rates continue to rise, corporate profit marginsโ€”especially for companies unable to pass costs through smoothlyโ€”would be seriously squeezed, and that the broader market is clearly not adequately prepared to hedge against potential volatility.

From the perspective of traditional financial markets, the current macro environment is quite similar to the second half of 2018. Back then, after the S&P 500 peaked in September, it pulled back by about 10% from October to November, and then weakened further in December. If the Fed truly turns back to hiking rates, Treasury yields and the US dollar index could remain in a range-bound high-level consolidation, putting pressure on valuations of risk assets such as stocks. The market may well undergo another round of valuation re-pricing later this year.

For the crypto market, a high-interest-rate environment usually means liquidity cannot loosen quickly. If US equitiesโ€”especially technology stocksโ€”see a pullback due to adjustments in rate expectations, crypto assets in the short term often experience knock-on effects through sentiment. As of now, the market remains in a period of mixed bullish and bearish signals, with funds seeking balance between risk-off positioning and betting on rebound opportunities. Going forward, close attention is still needed to the persistence of inflation data and the Fedโ€™s actual stance.

#Fed #SP500 #InterestRates
ยท
--
MacroRisk Advisors (MRA) CEO Dean Curnutt has just issued a notable warning that the U.S. Federal Reserve (Fed) could return to a rate-hike cycle, pushing the S&P 500 into a correction risk of 8% to 10%. The assessment comes amid renewed pressure from hot inflation, driven by rising energy costs, causing the yield on 10-year U.S. government bonds to break above the 5% threshold for the first time since 2023. This move indicates that market sentiment is rapidly shifting from expectations of easing to worries that tightening will continue. Curnutt compares the current picture to the sharp downturn in late 2018, when rising costs of capital eroded corporate profit margins that could not be passed on, creating a major shock for a capital market that was valuing assets far too optimistically. In traditional financial markets, high bond yields anchored above 5% alongside a strong U.S. dollar will continue to draw liquidity away from risk channels. The S&P 500 faces clear sell-off pressure as capital flows back into safer-haven assets and fixed-income instruments, leading to a repricing lower for technology stock valuations. For the crypto market, especially $BTC, the scenario of the Fed maintaining a hawkish policy is always a major barrier to speculative capital flows. Tightening liquidity can trigger short-term, deeper correction rounds in line with the decline in U.S. equities, forcing investors to prepare for larger volatility swings in the later part of the year. #Fed #InterestRates #SP500
MacroRisk Advisors (MRA) CEO Dean Curnutt has just issued a notable warning that the U.S. Federal Reserve (Fed) could return to a rate-hike cycle, pushing the S&P 500 into a correction risk of 8% to 10%. The assessment comes amid renewed pressure from hot inflation, driven by rising energy costs, causing the yield on 10-year U.S. government bonds to break above the 5% threshold for the first time since 2023.

This move indicates that market sentiment is rapidly shifting from expectations of easing to worries that tightening will continue. Curnutt compares the current picture to the sharp downturn in late 2018, when rising costs of capital eroded corporate profit margins that could not be passed on, creating a major shock for a capital market that was valuing assets far too optimistically.

In traditional financial markets, high bond yields anchored above 5% alongside a strong U.S. dollar will continue to draw liquidity away from risk channels. The S&P 500 faces clear sell-off pressure as capital flows back into safer-haven assets and fixed-income instruments, leading to a repricing lower for technology stock valuations.

For the crypto market, especially $BTC , the scenario of the Fed maintaining a hawkish policy is always a major barrier to speculative capital flows. Tightening liquidity can trigger short-term, deeper correction rounds in line with the decline in U.S. equities, forcing investors to prepare for larger volatility swings in the later part of the year.

#Fed #InterestRates #SP500
ยท
--
๐Ÿšจ $36M WHALE SHORT POSITIONING SPOTTED IN $SP500 AND $XYZ100 BEFORE CPI! ๐Ÿฆˆ Entry: 29,015.81 โšก Target: 28,800 ๐ŸŽฏ Institutional accounts are aggressively building downside hedges ahead of critical macro catalysts. Over $36 million in concentrated short exposure was deployed across stock index derivatives following the PPI release, signaling sophisticated smart money positioning prior to CPI volatility. ๐Ÿฆˆ One smart money entity locked in $253K profits before rotating into a massive $22.3M short on $SP500 around 7,603.33, with orders ready to stack another $1.38M into order flow. ๐Ÿ” Meanwhile, fresh short building on $XYZ100 targets tight take-profit liquidity down at 28,800. ๐Ÿ“Š This heavy institutional footprint highlights high-conviction distribution before the market reprices upcoming economic data. ๐Ÿ’ฌ Are you tracking these institutional short rotations or holding through the CPI volatility? ๐Ÿ‘‡ โš ๏ธ Not financial advice. Always manage your risk. ๐Ÿ›ก๏ธ ๐Ÿท๏ธ #SP500 #XYZ100 #SmartMoney #Macro #Liquidity ๐Ÿฆˆ ๐ŸŽฏ
๐Ÿšจ $36M WHALE SHORT POSITIONING SPOTTED IN $SP500 AND $XYZ100 BEFORE CPI! ๐Ÿฆˆ

Entry: 29,015.81 โšก
Target: 28,800 ๐ŸŽฏ

Institutional accounts are aggressively building downside hedges ahead of critical macro catalysts. Over $36 million in concentrated short exposure was deployed across stock index derivatives following the PPI release, signaling sophisticated smart money positioning prior to CPI volatility. ๐Ÿฆˆ

One smart money entity locked in $253K profits before rotating into a massive $22.3M short on $SP500 around 7,603.33, with orders ready to stack another $1.38M into order flow. ๐Ÿ” Meanwhile, fresh short building on $XYZ100 targets tight take-profit liquidity down at 28,800. ๐Ÿ“Š

This heavy institutional footprint highlights high-conviction distribution before the market reprices upcoming economic data. ๐Ÿ’ฌ Are you tracking these institutional short rotations or holding through the CPI volatility? ๐Ÿ‘‡

โš ๏ธ Not financial advice. Always manage your risk. ๐Ÿ›ก๏ธ

๐Ÿท๏ธ #SP500 #XYZ100 #SmartMoney #Macro #Liquidity

๐Ÿฆˆ ๐ŸŽฏ
ยท
--
๐Ÿฆˆ INSIDER WHALES DUMP $36M INTO $SP500 SHORTS BEFORE CPI PRINTS! ๐Ÿ’ฅ Entry: 29,015.81 โšก Target: 28,800 ๐Ÿš€ Smart money is aggressively front-running macro volatility. ๐Ÿ” Heavyweight wallets just deployed over $36.8M into index short positions right between the PPI and CPI releases, signaling high-conviction institutional hedging. One whale banked $253k in profits before shifting $22.3M into $SP500 shorts, retaining power to add more size. ๐Ÿ“Š Meanwhile, a fresh address parked $14.5M into $XYZ100 short exposure with an automated trigger target sitting just 0.9% lower. ๐ŸŒŠ When top-tier liquidity sweeps like this hit the order book before economic data drops, market moves follow fast. ๐Ÿ’ฌ Are you tightening your stops here or betting on a volatility breakdown? ๐Ÿ‘‡ โš ๏ธ Not financial advice. Always manage your risk. ๐Ÿ›ก๏ธ ๐Ÿท๏ธ #SP500 #XYZ100 #WhaleAlert #Macro #MarketUpdate ๐Ÿฆˆ โšก
๐Ÿฆˆ INSIDER WHALES DUMP $36M INTO $SP500 SHORTS BEFORE CPI PRINTS! ๐Ÿ’ฅ

Entry: 29,015.81 โšก
Target: 28,800 ๐Ÿš€

Smart money is aggressively front-running macro volatility. ๐Ÿ” Heavyweight wallets just deployed over $36.8M into index short positions right between the PPI and CPI releases, signaling high-conviction institutional hedging.

One whale banked $253k in profits before shifting $22.3M into $SP500 shorts, retaining power to add more size. ๐Ÿ“Š Meanwhile, a fresh address parked $14.5M into $XYZ100 short exposure with an automated trigger target sitting just 0.9% lower. ๐ŸŒŠ

When top-tier liquidity sweeps like this hit the order book before economic data drops, market moves follow fast. ๐Ÿ’ฌ Are you tightening your stops here or betting on a volatility breakdown? ๐Ÿ‘‡

โš ๏ธ Not financial advice. Always manage your risk. ๐Ÿ›ก๏ธ

๐Ÿท๏ธ #SP500 #XYZ100 #WhaleAlert #Macro #MarketUpdate

๐Ÿฆˆ โšก
ยท
--
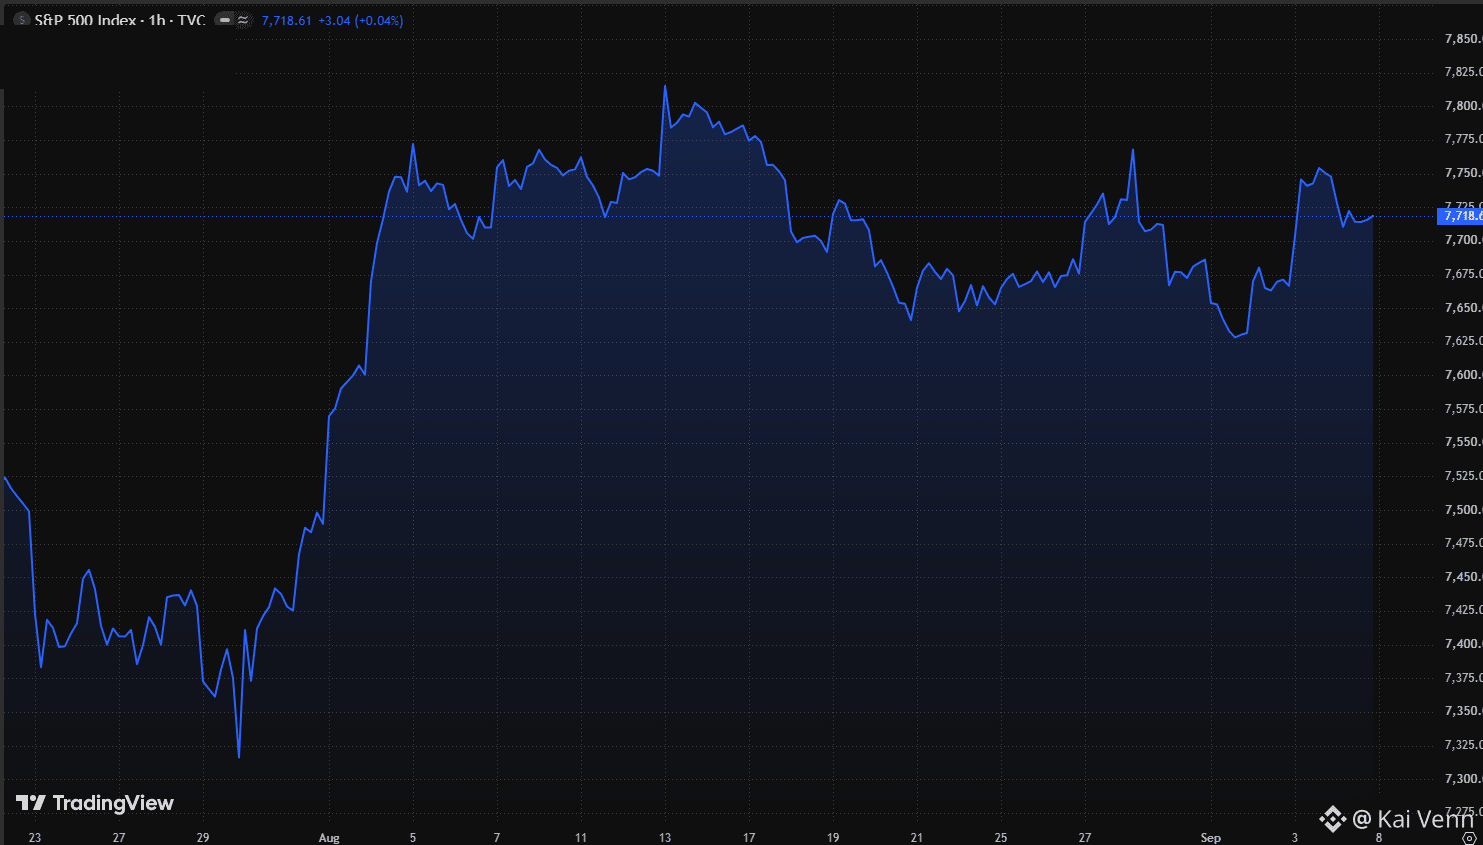
$SPX 1H: Clean bear trap at 7,630 into a solid 7,718 consolidation shelf. Tech breadth is expanding and the Fed rate-cutting window is right around the corner. The flush down to 7,630 looked like a breakdown on surface tape, but aggressive institutional bids stepped in immediately to turn it into a classic liquidity sweep. Price ripped straight back through 7,700 and hasn't looked back since. Right now, 1H volatility is compressing tightly between 7,690 and 7,730. When sell volume dries up like this right beneath resistance, it usually signals patient absorption rather than distribution ahead of FOMC. With front-end Treasury yields pinned below 4.40%, discount rates are easing, providing valuation tailwinds across equities and crypto majors ($BTC, $ETH). Key execution levels: โ€ข Breakout trigger: 7,740 โ€“ 7,760 opens clear airspace toward 7,815+ cycle highs โ€ข Support floor: 7,680 โ€“ 7,700 โ€ข Invalidation: Clean 1H close below 7,630 Structure remains firmly bullish as long as 7,680 holds. #SPX #SP500 #MarketAnalysis
$SPX 1H: Clean bear trap at 7,630 into a solid 7,718 consolidation shelf. Tech breadth is expanding and the Fed rate-cutting window is right around the corner.

The flush down to 7,630 looked like a breakdown on surface tape, but aggressive institutional bids stepped in immediately to turn it into a classic liquidity sweep. Price ripped straight back through 7,700 and hasn't looked back since.

Right now, 1H volatility is compressing tightly between 7,690 and 7,730. When sell volume dries up like this right beneath resistance, it usually signals patient absorption rather than distribution ahead of FOMC. With front-end Treasury yields pinned below 4.40%, discount rates are easing, providing valuation tailwinds across equities and crypto majors ($BTC, $ETH).

Key execution levels:
โ€ข Breakout trigger: 7,740 โ€“ 7,760 opens clear airspace toward 7,815+ cycle highs
โ€ข Support floor: 7,680 โ€“ 7,700
โ€ข Invalidation: Clean 1H close below 7,630

Structure remains firmly bullish as long as 7,680 holds.

#SPX #SP500 #MarketAnalysis
Verified
NFP TONIGHT: WALL STREET IS BRACING FOR A JOBS MISS The US Department of Labor will release its August Nonfarm Payrolls report this evening. The market currently expects only +56K jobs, while the unemployment rate is forecast to hold at 4.1%. A notable point is that Morgan Stanley has set fairly clear reaction zones for the S&P 500: >95K new jobs โ†’ the S&P 500 could fall by 0.5โ€“1.25%; meanwhile, just 5Kโ€“35K โ†’ the S&P 500 could rise by 0.25โ€“0.75%. In other words, the market is in a โ€œgood news is bad newsโ€ mode: overly strong jobs data could weaken expectations for Fed rate cuts, while overly weak data could raise concerns that the economy is losing momentum. Notably, after recent remarks from Barr and Waller, the Fed appears to be viewing the labor market as โ€œstable but not too strong.โ€ So tonightโ€™s NFP could become one of the most important data releases ahead of the September policy decision. 56K is the expectation. But what number is the market really betting on? #NFP #FederalReserve #SP500
NFP TONIGHT: WALL STREET IS BRACING FOR A JOBS MISS

The US Department of Labor will release its August Nonfarm Payrolls report this evening. The market currently expects only +56K jobs, while the unemployment rate is forecast to hold at 4.1%.

A notable point is that Morgan Stanley has set fairly clear reaction zones for the S&P 500: >95K new jobs โ†’ the S&P 500 could fall by 0.5โ€“1.25%; meanwhile, just 5Kโ€“35K โ†’ the S&P 500 could rise by 0.25โ€“0.75%.

In other words, the market is in a โ€œgood news is bad newsโ€ mode: overly strong jobs data could weaken expectations for Fed rate cuts, while overly weak data could raise concerns that the economy is losing momentum.

Notably, after recent remarks from Barr and Waller, the Fed appears to be viewing the labor market as โ€œstable but not too strong.โ€

So tonightโ€™s NFP could become one of the most important data releases ahead of the September policy decision.

56K is the expectation. But what number is the market really betting on?

#NFP #FederalReserve #SP500
Article
Bitcoin's Correlation With the S&P 500 Nears a Two-Year Low ๐Ÿ“‰๐Ÿ”— Bitcoin's Correlation With the S&P 500 Nears a Two-Year Low ๐Ÿ“‰๐Ÿ”— Something quietly important is happening in the market structure of Bitcoin โ€” and most traders staring at candlesticks are missing it. According to on-chain analytics firm **Glassnode**, Bitcoin's correlation with the S&P 500 is approaching its lowest level in nearly two years. In simple terms: the tight, almost synchronized relationship that has defined crypto's recent downtrend appears to be breaking apart. ๐Ÿงฉ For the past few years, Bitcoin has often traded like a leveraged tech stock. When the Nasdaq sneezed, BTC caught a cold. Every Fed announcement, every CPI print, every risk-off Tuesday on Wall Street โ€” Bitcoin moved in lockstep with equities, and traders treated it accordingly, hedging crypto exposure with SPX futures and vice versa. That dynamic is now visibly fading. ๐ŸŒซ๏ธ Why This Matters ๐Ÿง  A falling correlation coefficient isn't just an abstract statistic for quant desks โ€” it has real implications for how capital allocators think about Bitcoin: - **Portfolio diversification** ๐Ÿงบ โ€” When BTC moves independently of equities, it becomes a genuinely useful diversification tool again, rather than just "risk-on beta with extra steps." - **Institutional allocation models** ๐Ÿฆ โ€” Funds that size positions based on correlation matrices may need to revisit their BTC weightings if the asset is behaving less like tech stocks and more like an independent macro asset. - **Narrative shift** ๐Ÿ“ฐ โ€” A lower correlation reinforces the "digital gold" thesis that many long-term holders have argued for since Bitcoin's inception, positioning it as a hedge rather than a high-beta risk asset. The Bigger Picture ๐ŸŒ This isn't the first time analysts have flagged decoupling behavior. Over the past year, several data providers โ€” including Santiment and BlackRock's own ETF research desk โ€” have pointed to similar patterns: rolling 30-day correlation readings dipping toward levels last seen around the FTX collapse in late 2022. Historically, Bitcoin's long-run correlation with the S&P 500 hovers in the 0.25โ€“0.32 range; readings meaningfully below that suggest the two assets are, at least temporarily, telling different stories. ๐Ÿ“Š Some analysts attribute this to post-ETF deleveraging โ€” with less speculative leverage in the futures market, Bitcoin's price swings are less amplified by the same macro triggers that whip equities around. Others point to structural ETF inflows creating a buyer base that treats BTC as a standalone allocation rather than a risk-on trade tied to Wall Street sentiment. ๐Ÿ’ก A Word of Caution โš ๏ธ Decoupling narratives have appeared before, only to reverse sharply during periods of acute market stress. Correlations tend to spike back toward 1 during liquidity crunches, when "everything sells off together" regardless of underlying fundamentals. So while the current reading is notable, it's worth watching whether this divergence holds up through the next volatility event, rather than assuming a permanent regime shift. ๐Ÿ” Bottom Line ๐Ÿš€ Bitcoin quietly decoupling from the S&P 500 is one of the more underrated developments in the market right now. If this trend continues, it could reshape how both retail and institutional investors think about BTC's role in a diversified portfolio โ€” not as "risk-on tech stock #2," but as its own distinct asset class. Keep an eye on the correlation charts; they may be telling a more important story than the price action itself. ๐Ÿ“ˆ๐Ÿช™ --- *This article is for informational purposes only and does not constitute financial advice. Always do your own research (DYOR) before making investment decisions.* #Bitcoin #BTC #CryptoMarket #Glassnode. #SP500

Bitcoin's Correlation With the S&P 500 Nears a Two-Year Low ๐Ÿ“‰๐Ÿ”—

Bitcoin's Correlation With the S&P 500 Nears a Two-Year Low ๐Ÿ“‰๐Ÿ”—
Something quietly important is happening in the market structure of Bitcoin โ€” and most traders staring at candlesticks are missing it. According to on-chain analytics firm **Glassnode**, Bitcoin's correlation with the S&P 500 is approaching its lowest level in nearly two years. In simple terms: the tight, almost synchronized relationship that has defined crypto's recent downtrend appears to be breaking apart. ๐Ÿงฉ
For the past few years, Bitcoin has often traded like a leveraged tech stock. When the Nasdaq sneezed, BTC caught a cold. Every Fed announcement, every CPI print, every risk-off Tuesday on Wall Street โ€” Bitcoin moved in lockstep with equities, and traders treated it accordingly, hedging crypto exposure with SPX futures and vice versa. That dynamic is now visibly fading. ๐ŸŒซ๏ธ
Why This Matters ๐Ÿง 
A falling correlation coefficient isn't just an abstract statistic for quant desks โ€” it has real implications for how capital allocators think about Bitcoin:
- **Portfolio diversification** ๐Ÿงบ โ€” When BTC moves independently of equities, it becomes a genuinely useful diversification tool again, rather than just "risk-on beta with extra steps."
- **Institutional allocation models** ๐Ÿฆ โ€” Funds that size positions based on correlation matrices may need to revisit their BTC weightings if the asset is behaving less like tech stocks and more like an independent macro asset.
- **Narrative shift** ๐Ÿ“ฐ โ€” A lower correlation reinforces the "digital gold" thesis that many long-term holders have argued for since Bitcoin's inception, positioning it as a hedge rather than a high-beta risk asset.
The Bigger Picture ๐ŸŒ
This isn't the first time analysts have flagged decoupling behavior. Over the past year, several data providers โ€” including Santiment and BlackRock's own ETF research desk โ€” have pointed to similar patterns: rolling 30-day correlation readings dipping toward levels last seen around the FTX collapse in late 2022. Historically, Bitcoin's long-run correlation with the S&P 500 hovers in the 0.25โ€“0.32 range; readings meaningfully below that suggest the two assets are, at least temporarily, telling different stories. ๐Ÿ“Š
Some analysts attribute this to post-ETF deleveraging โ€” with less speculative leverage in the futures market, Bitcoin's price swings are less amplified by the same macro triggers that whip equities around. Others point to structural ETF inflows creating a buyer base that treats BTC as a standalone allocation rather than a risk-on trade tied to Wall Street sentiment. ๐Ÿ’ก
A Word of Caution โš ๏ธ
Decoupling narratives have appeared before, only to reverse sharply during periods of acute market stress. Correlations tend to spike back toward 1 during liquidity crunches, when "everything sells off together" regardless of underlying fundamentals. So while the current reading is notable, it's worth watching whether this divergence holds up through the next volatility event, rather than assuming a permanent regime shift. ๐Ÿ”
Bottom Line ๐Ÿš€
Bitcoin quietly decoupling from the S&P 500 is one of the more underrated developments in the market right now. If this trend continues, it could reshape how both retail and institutional investors think about BTC's role in a diversified portfolio โ€” not as "risk-on tech stock #2," but as its own distinct asset class. Keep an eye on the correlation charts; they may be telling a more important story than the price action itself. ๐Ÿ“ˆ๐Ÿช™
---
*This article is for informational purposes only and does not constitute financial advice. Always do your own research (DYOR) before making investment decisions.*
#Bitcoin #BTC #CryptoMarket #Glassnode. #SP500
ยท
--
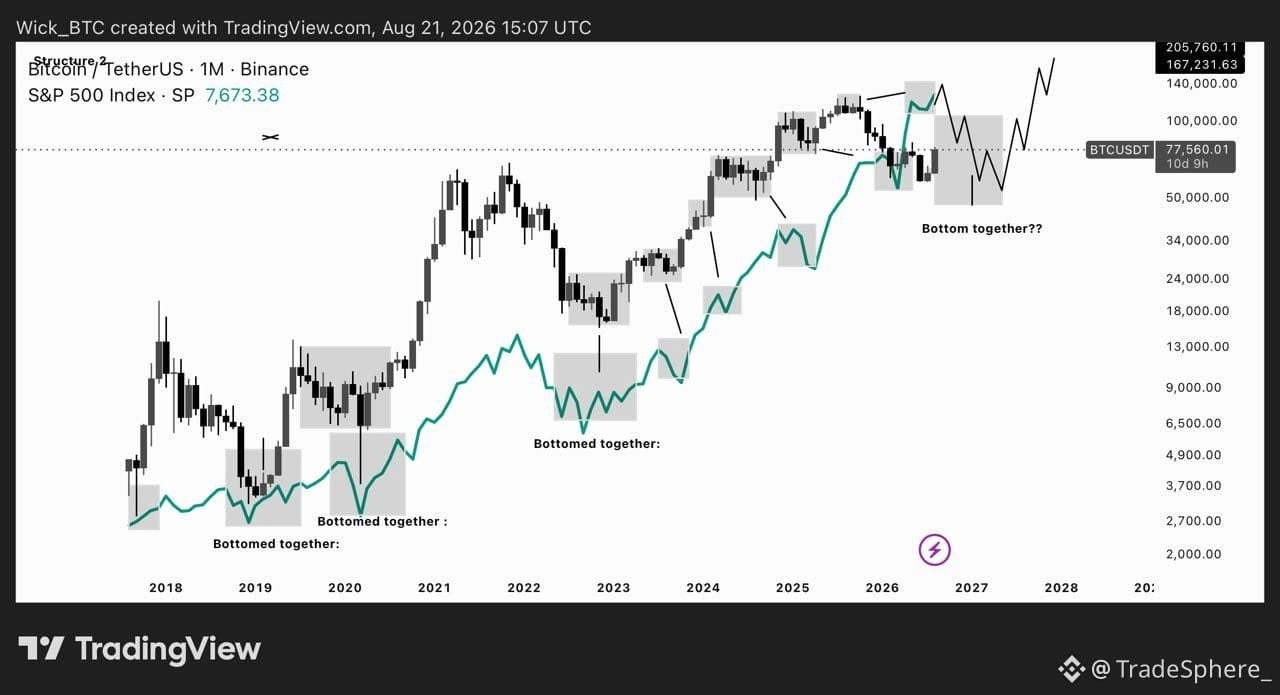
$BTC #SP500 I believe the current Bitcoin cycle is following the prolonged bearish structure of 2013โ€“2015, and this could explain why weโ€™re seeing a different rhythm between BTC and the S&P 500 this time. The S&P 500 has continued rising while Bitcoin has been going through its bearish phase, and I donโ€™t believe this divergence is random. In previous cycles, BTC and the S&P 500 repeatedly reached their major bottoms around the same periods. This time, Bitcoin appears to be ahead of the S&P 500 in its correction. If the current cycle continues to mirror the prolonged 2013โ€“2015 bearish phase, Bitcoin may need a few more months to reach its true bottom range at around $30k. During that time, the S&P 500 could eventually follow BTC and begin its own major correction. If that happens, both markets could once again converge, complete their larger corrections, and ultimately bottom around the same period. The current divergence may therefore be nothing more than a difference in timing within the larger cycle structure.
$BTC #SP500

I believe the current Bitcoin cycle is following the prolonged bearish structure of 2013โ€“2015, and this could explain why weโ€™re seeing a different rhythm between BTC and the S&P 500 this time.

The S&P 500 has continued rising while Bitcoin has been going through its bearish phase, and I donโ€™t believe this divergence is random.

In previous cycles, BTC and the S&P 500 repeatedly reached their major bottoms around the same periods. This time, Bitcoin appears to be ahead of the S&P 500 in its correction.

If the current cycle continues to mirror the prolonged 2013โ€“2015 bearish phase, Bitcoin may need a few more months to reach its true bottom range at around $30k. During that time, the S&P 500 could eventually follow BTC and begin its own major correction.

If that happens, both markets could once again converge, complete their larger corrections, and ultimately bottom around the same period.

The current divergence may therefore be nothing more than a difference in timing within the larger cycle structure.
Will BTC hit $70,000 or $90,000 first?

Will BTC hit $70,000 or $90,000 first?

41%$70k59%$90k
Volume $2,231.01
ยท
--
Bearish
S&P 500 Full Target Hit โ€” Now $7,672 Decides the Next Move As expected, the S&P 500 declined and successfully reached the full target at $7,634. Following the release of the ISM Manufacturing PMI, the index started to recover and move higher again. The focus now shifts to the important $7,672 trading level. If the S&P 500 can reclaim and hold above this level, the rebound could extend further. However, another rejection from $7,672 could bring sellers back into control and reopen the downside scenario. Can the S&P 500 break above $7,672, or will this level trigger another rejection? #SP500
S&P 500 Full Target Hit โ€” Now $7,672 Decides the Next Move

As expected, the S&P 500 declined and successfully reached the full target at $7,634.

Following the release of the ISM Manufacturing PMI, the index started to recover and move higher again.

The focus now shifts to the important $7,672 trading level.

If the S&P 500 can reclaim and hold above this level, the rebound could extend further. However, another rejection from $7,672 could bring sellers back into control and reopen the downside scenario.

Can the S&P 500 break above $7,672, or will this level trigger another rejection?

#SP500
Pejmanzwin
ยท
--
Bearish
S&P 500 Loses $7,720 โ€” Is $7,634 the Next Target?

The S&P 500 has moved back below the crucial $7,720 trading level after Warshโ€™s hawkish remarks pushed the U.S. Dollar Index and the U.S. 10-Year Treasury Yield higher.

The index is now trading below its Resistance Zone, while macro and geopolitical risks continue to build.

From an Elliott Wave perspective, the corrective structure inside the Rising Wedge Pattern appears to be complete, increasing the probability that the next bearish wave is beginning.

๐Ÿ’ก Educational Note: A Rising Wedge often reflects weakening bullish momentum. A confirmed breakdown can increase the probability of a deeper correction.

As long as the index remains below the $7,722โ€“$7,723 invalidation area, I expect further downside toward the Support Zone.

Trade Setup

First TP: $7,643

Second TP: $7,634

Stop Loss: $7,723

Key Levels: $7,670 | $7,722

Which level will the S&P 500 reach first?

๐Ÿ”ด $7,634

๐ŸŸข $7,723

#SP500
ยท
--
The S&P 500 closed August at 7,686.14, marking its highest monthly close on record. The index finished above every previous month end, despite pulling back from its August 13 daily record of 7,798.99. The new monthly record shows that US equities remained near historic highs through the end of August. It also highlights the difference between a daily record and a monthly closing record. #SP500 #USstock $TSLA
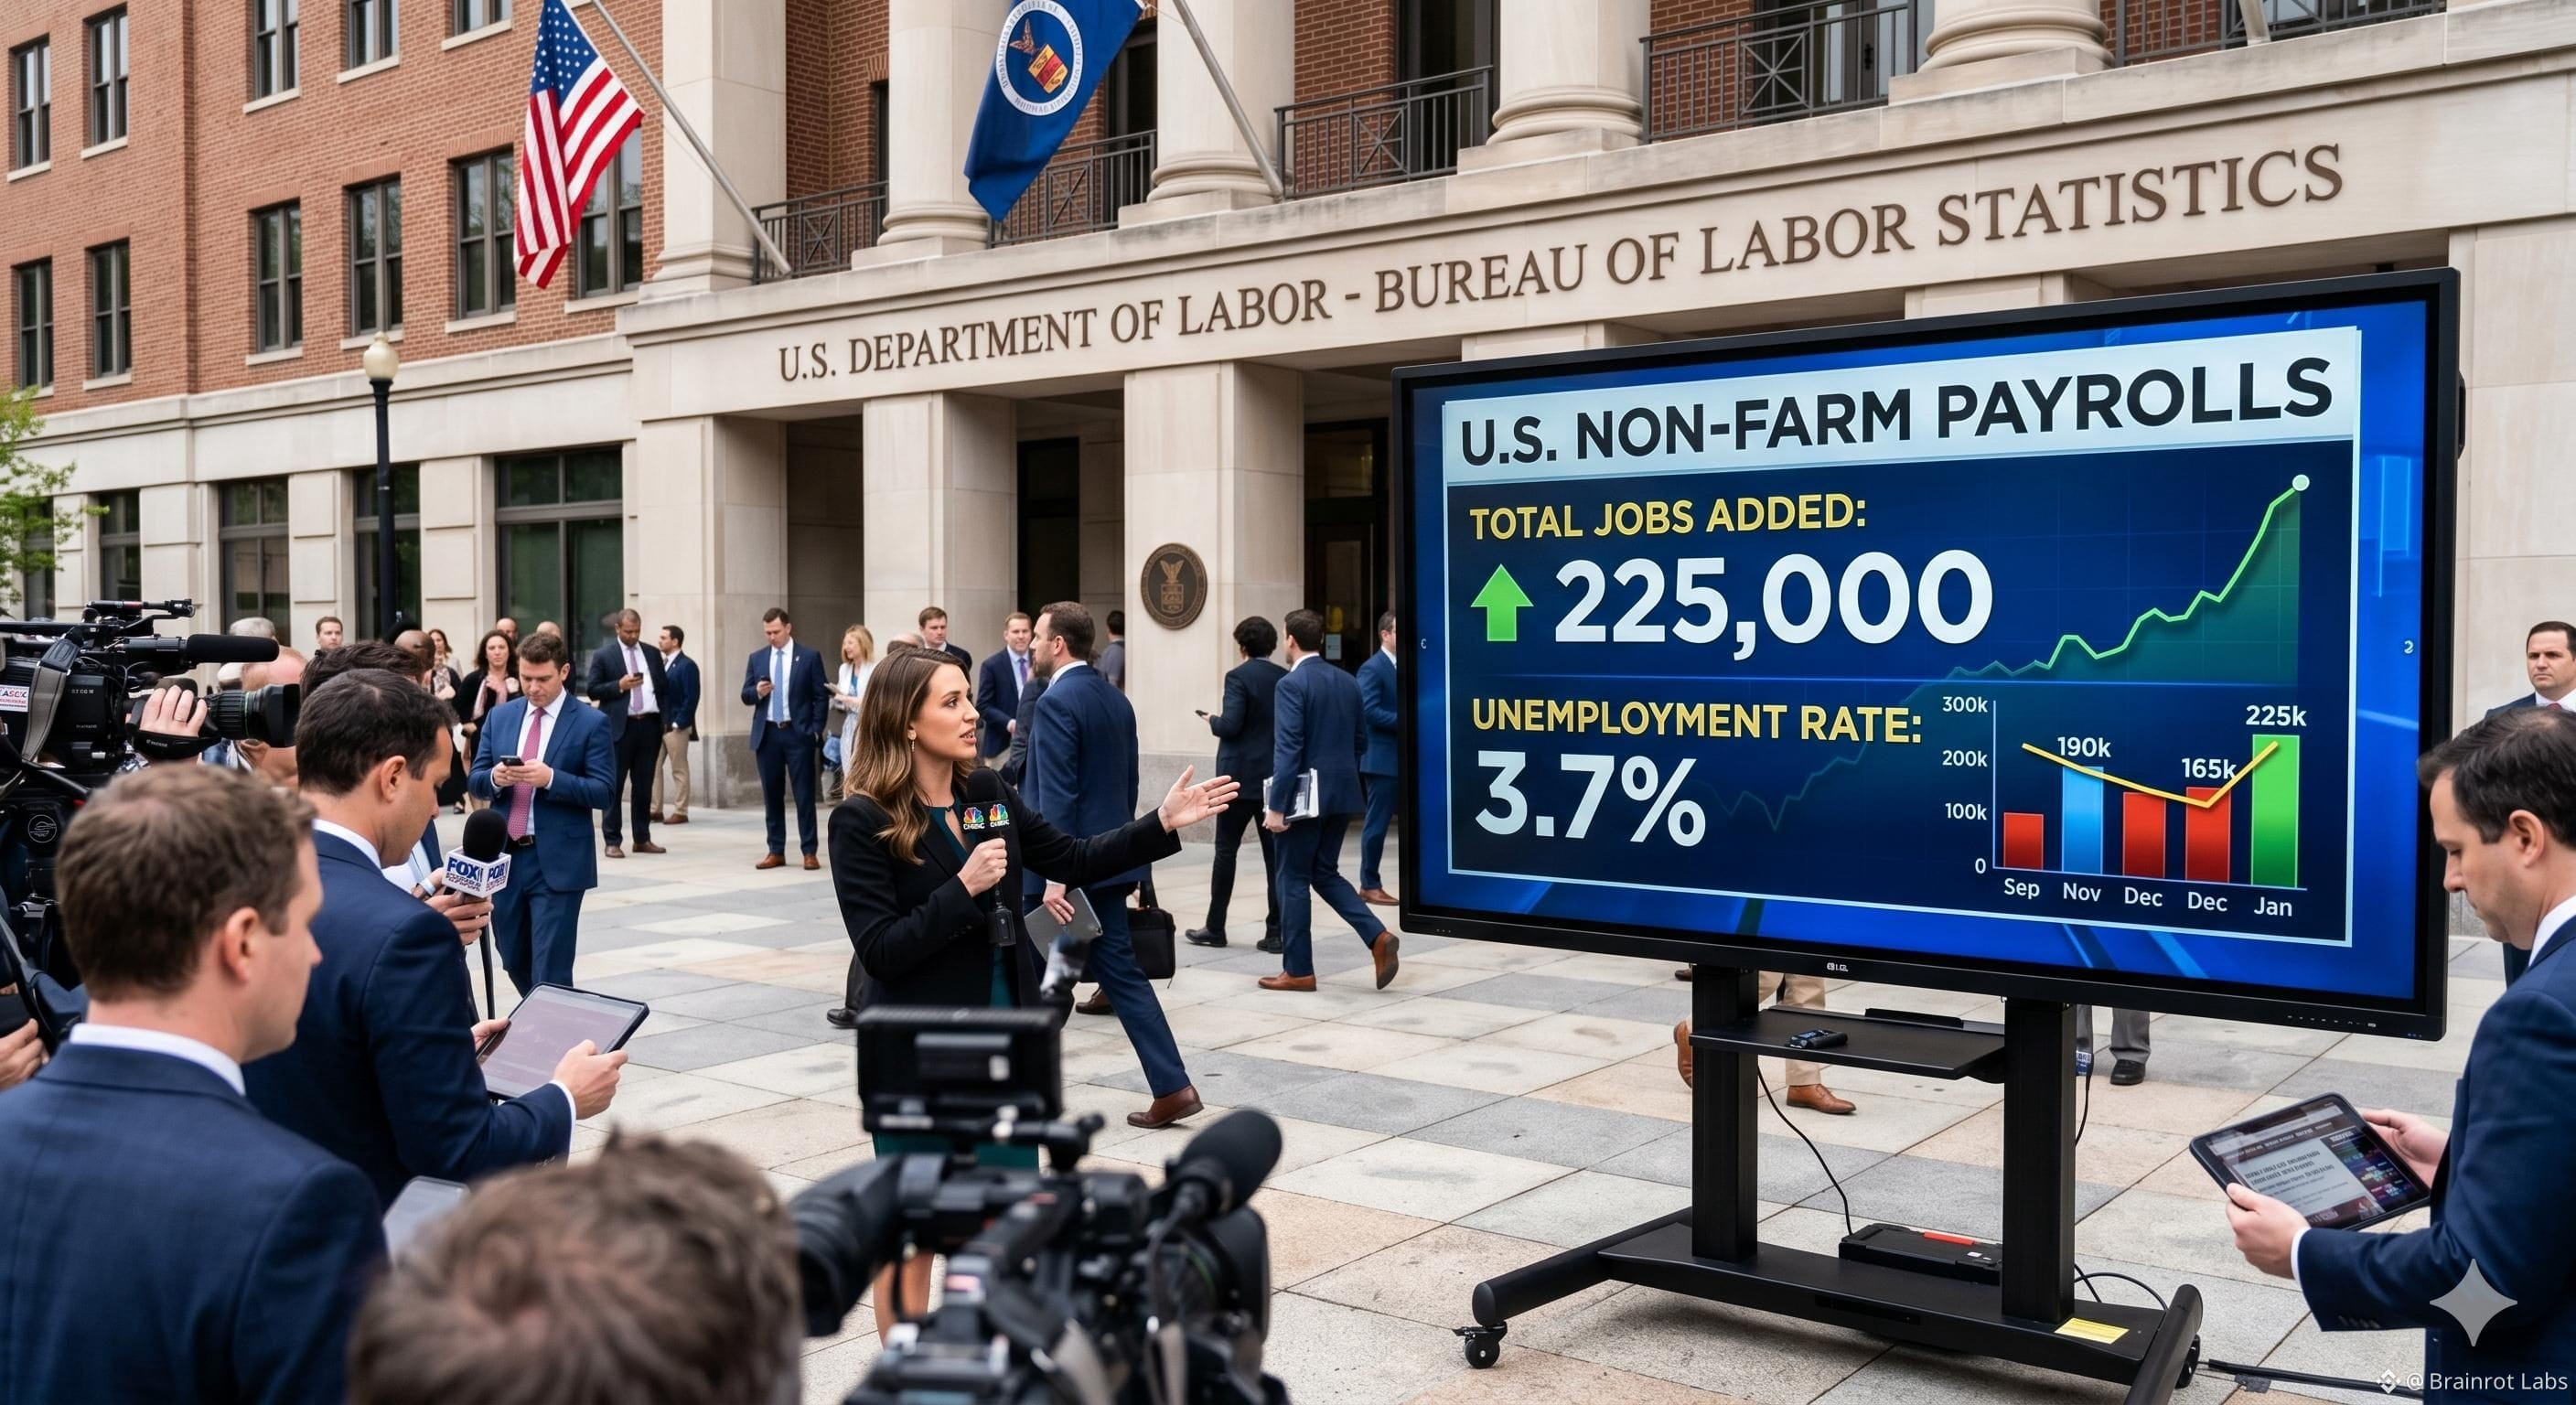
The S&P 500 closed August at 7,686.14, marking its highest monthly close on record. The index finished above every previous month end, despite pulling back from its August 13 daily record of 7,798.99.

The new monthly record shows that US equities remained near historic highs through the end of August. It also highlights the difference between a daily record and a monthly closing record.

#SP500 #USstock $TSLA

Log in to explore more content
Join global crypto users on Binance Square
โšก๏ธ Get latest and useful information about crypto.
๐Ÿ’ฌ Trusted by the worldโ€™s largest crypto exchange.
๐Ÿ‘ Discover real insights from verified creators.
Email / Phone number