
#sp500
sp500
714,847 views
2,379 Discussing
Hot
Latest

·
--
Bearish
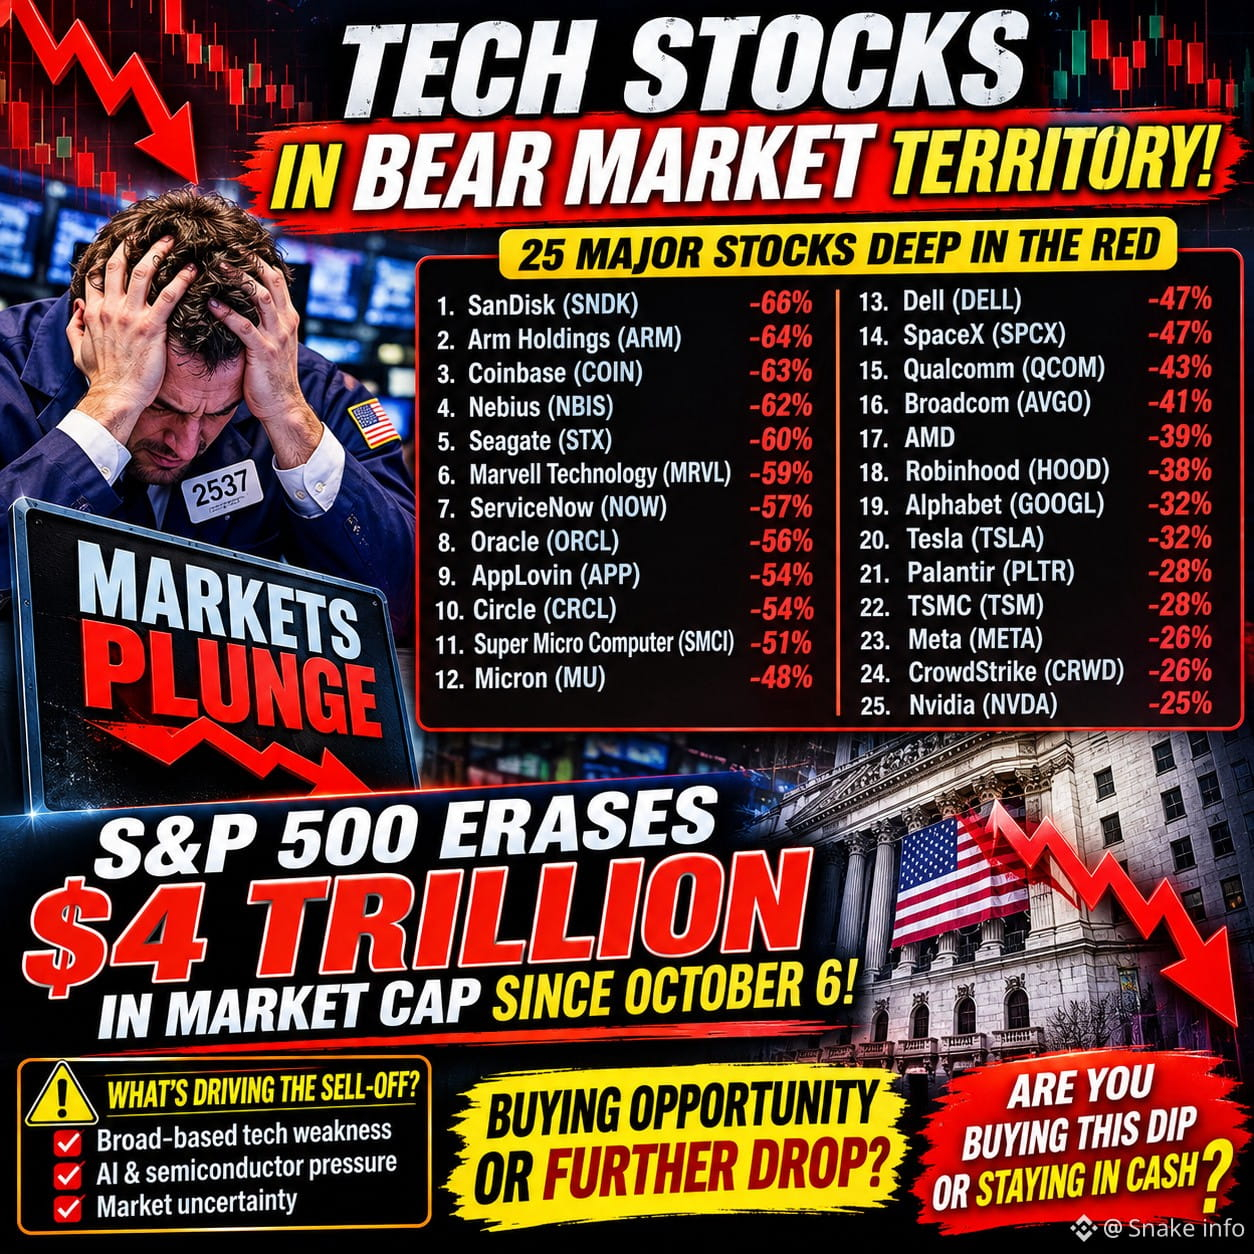
🚨 TECH STOCKS ARE GETTING DESTROYED! THE BEAR MARKET IS SPREADING. 📉
Wall Street is facing massive pressure, with major technology and crypto-related stocks suffering huge declines.
🔥 25 Major Stocks Deep in the Red:
🔻 SNDK (SanDisk): -66%
🔻 ARM (Arm Holdings): -64%
🔻 COIN (Coinbase): -63%
🔻 NBIS (Nebius): -62%
🔻 STX (Seagate): -60%
🔻 MRVL (Marvell): -59%
🔻 NOW (ServiceNow): -57%
🔻 ORCL (Oracle): -56%
🔻 APP (AppLovin): -54%
🔻 CRCL (Circle): -54%
🔻 SMCI (Super Micro): -51%
🔻 MU (Micron): -48%
🔻 DELL (Dell): -47%
🔻 SPCX (SpaceX): -47%
🔻 QCOM (Qualcomm): -43%
🔻 AVGO (Broadcom): -41%
🔻 AMD: -39%
🔻 HOOD (Robinhood): -38%
🔻 GOOGL (Alphabet): -32%
🔻 TSLA (Tesla): -32%
🔻 PLTR (Palantir): -28%
🔻 TSM (TSMC): -28%
🔻 META (Meta): -26%
🔻 CRWD (CrowdStrike): -26%
🔻 NVDA (Nvidia): -25%
💥 THE BIGGER PICTURE:
The S&P 500 has reportedly erased approximately $4 TRILLION in market capitalization since October 6.
⚠️ This is no longer just about one or two struggling companies. Selling pressure is spreading across semiconductors, AI, software, crypto-related stocks, and major technology companies.
📊 What Traders Should Watch:
Institutional buying and selling
Semiconductor sector recovery
Nasdaq and S&P 500 support levels
Bitcoin's reaction to US market weakness
🔥 BIG QUESTION:
Is this a major buying opportunity, or are we witnessing the beginning of a deeper tech market bear market?
Are you buying this dip or staying in cash? 👇
#StockMarket #TechStocks #NASDAQ #SP500
Not financial advice. DYOR.
CLICK TO BELOW TRADE👇
$TSLA $SPCX $GOOGL
{future}(GOOGLUSDT)
{future}(SPCXUSDT)
{future}(TSLAUSDT)
🚨 TECH STOCKS ARE GETTING DESTROYED! THE BEAR MARKET IS SPREADING. 📉
Wall Street is facing massive pressure, with major technology and crypto-related stocks suffering huge declines.
🔥 25 Major Stocks Deep in the Red:
🔻 SNDK (SanDisk): -66%
🔻 ARM (Arm Holdings): -64%
🔻 COIN (Coinbase): -63%
🔻 NBIS (Nebius): -62%
🔻 STX (Seagate): -60%
🔻 MRVL (Marvell): -59%
🔻 NOW (ServiceNow): -57%
🔻 ORCL (Oracle): -56%
🔻 APP (AppLovin): -54%
🔻 CRCL (Circle): -54%
🔻 SMCI (Super Micro): -51%
🔻 MU (Micron): -48%
🔻 DELL (Dell): -47%
🔻 SPCX (SpaceX): -47%
🔻 QCOM (Qualcomm): -43%
🔻 AVGO (Broadcom): -41%
🔻 AMD: -39%
🔻 HOOD (Robinhood): -38%
🔻 GOOGL (Alphabet): -32%
🔻 TSLA (Tesla): -32%
🔻 PLTR (Palantir): -28%
🔻 TSM (TSMC): -28%
🔻 META (Meta): -26%
🔻 CRWD (CrowdStrike): -26%
🔻 NVDA (Nvidia): -25%
💥 THE BIGGER PICTURE:
The S&P 500 has reportedly erased approximately $4 TRILLION in market capitalization since October 6.
⚠️ This is no longer just about one or two struggling companies. Selling pressure is spreading across semiconductors, AI, software, crypto-related stocks, and major technology companies.
📊 What Traders Should Watch:
Institutional buying and selling
Semiconductor sector recovery
Nasdaq and S&P 500 support levels
Bitcoin's reaction to US market weakness
🔥 BIG QUESTION:
Is this a major buying opportunity, or are we witnessing the beginning of a deeper tech market bear market?
Are you buying this dip or staying in cash? 👇
#StockMarket #TechStocks #NASDAQ #SP500
Not financial advice. DYOR.
CLICK TO BELOW TRADE👇
$TSLA $SPCX $GOOGL
Wall Street is facing massive pressure, with major technology and crypto-related stocks suffering huge declines.
🔥 25 Major Stocks Deep in the Red:
🔻 SNDK (SanDisk): -66%
🔻 ARM (Arm Holdings): -64%
🔻 COIN (Coinbase): -63%
🔻 NBIS (Nebius): -62%
🔻 STX (Seagate): -60%
🔻 MRVL (Marvell): -59%
🔻 NOW (ServiceNow): -57%
🔻 ORCL (Oracle): -56%
🔻 APP (AppLovin): -54%
🔻 CRCL (Circle): -54%
🔻 SMCI (Super Micro): -51%
🔻 MU (Micron): -48%
🔻 DELL (Dell): -47%
🔻 SPCX (SpaceX): -47%
🔻 QCOM (Qualcomm): -43%
🔻 AVGO (Broadcom): -41%
🔻 AMD: -39%
🔻 HOOD (Robinhood): -38%
🔻 GOOGL (Alphabet): -32%
🔻 TSLA (Tesla): -32%
🔻 PLTR (Palantir): -28%
🔻 TSM (TSMC): -28%
🔻 META (Meta): -26%
🔻 CRWD (CrowdStrike): -26%
🔻 NVDA (Nvidia): -25%
💥 THE BIGGER PICTURE:
The S&P 500 has reportedly erased approximately $4 TRILLION in market capitalization since October 6.
⚠️ This is no longer just about one or two struggling companies. Selling pressure is spreading across semiconductors, AI, software, crypto-related stocks, and major technology companies.
📊 What Traders Should Watch:
Institutional buying and selling
Semiconductor sector recovery
Nasdaq and S&P 500 support levels
Bitcoin's reaction to US market weakness
🔥 BIG QUESTION:
Is this a major buying opportunity, or are we witnessing the beginning of a deeper tech market bear market?
Are you buying this dip or staying in cash? 👇
#StockMarket #TechStocks #NASDAQ #SP500
Not financial advice. DYOR.
CLICK TO BELOW TRADE👇
$TSLA $SPCX $GOOGL
337
·
--
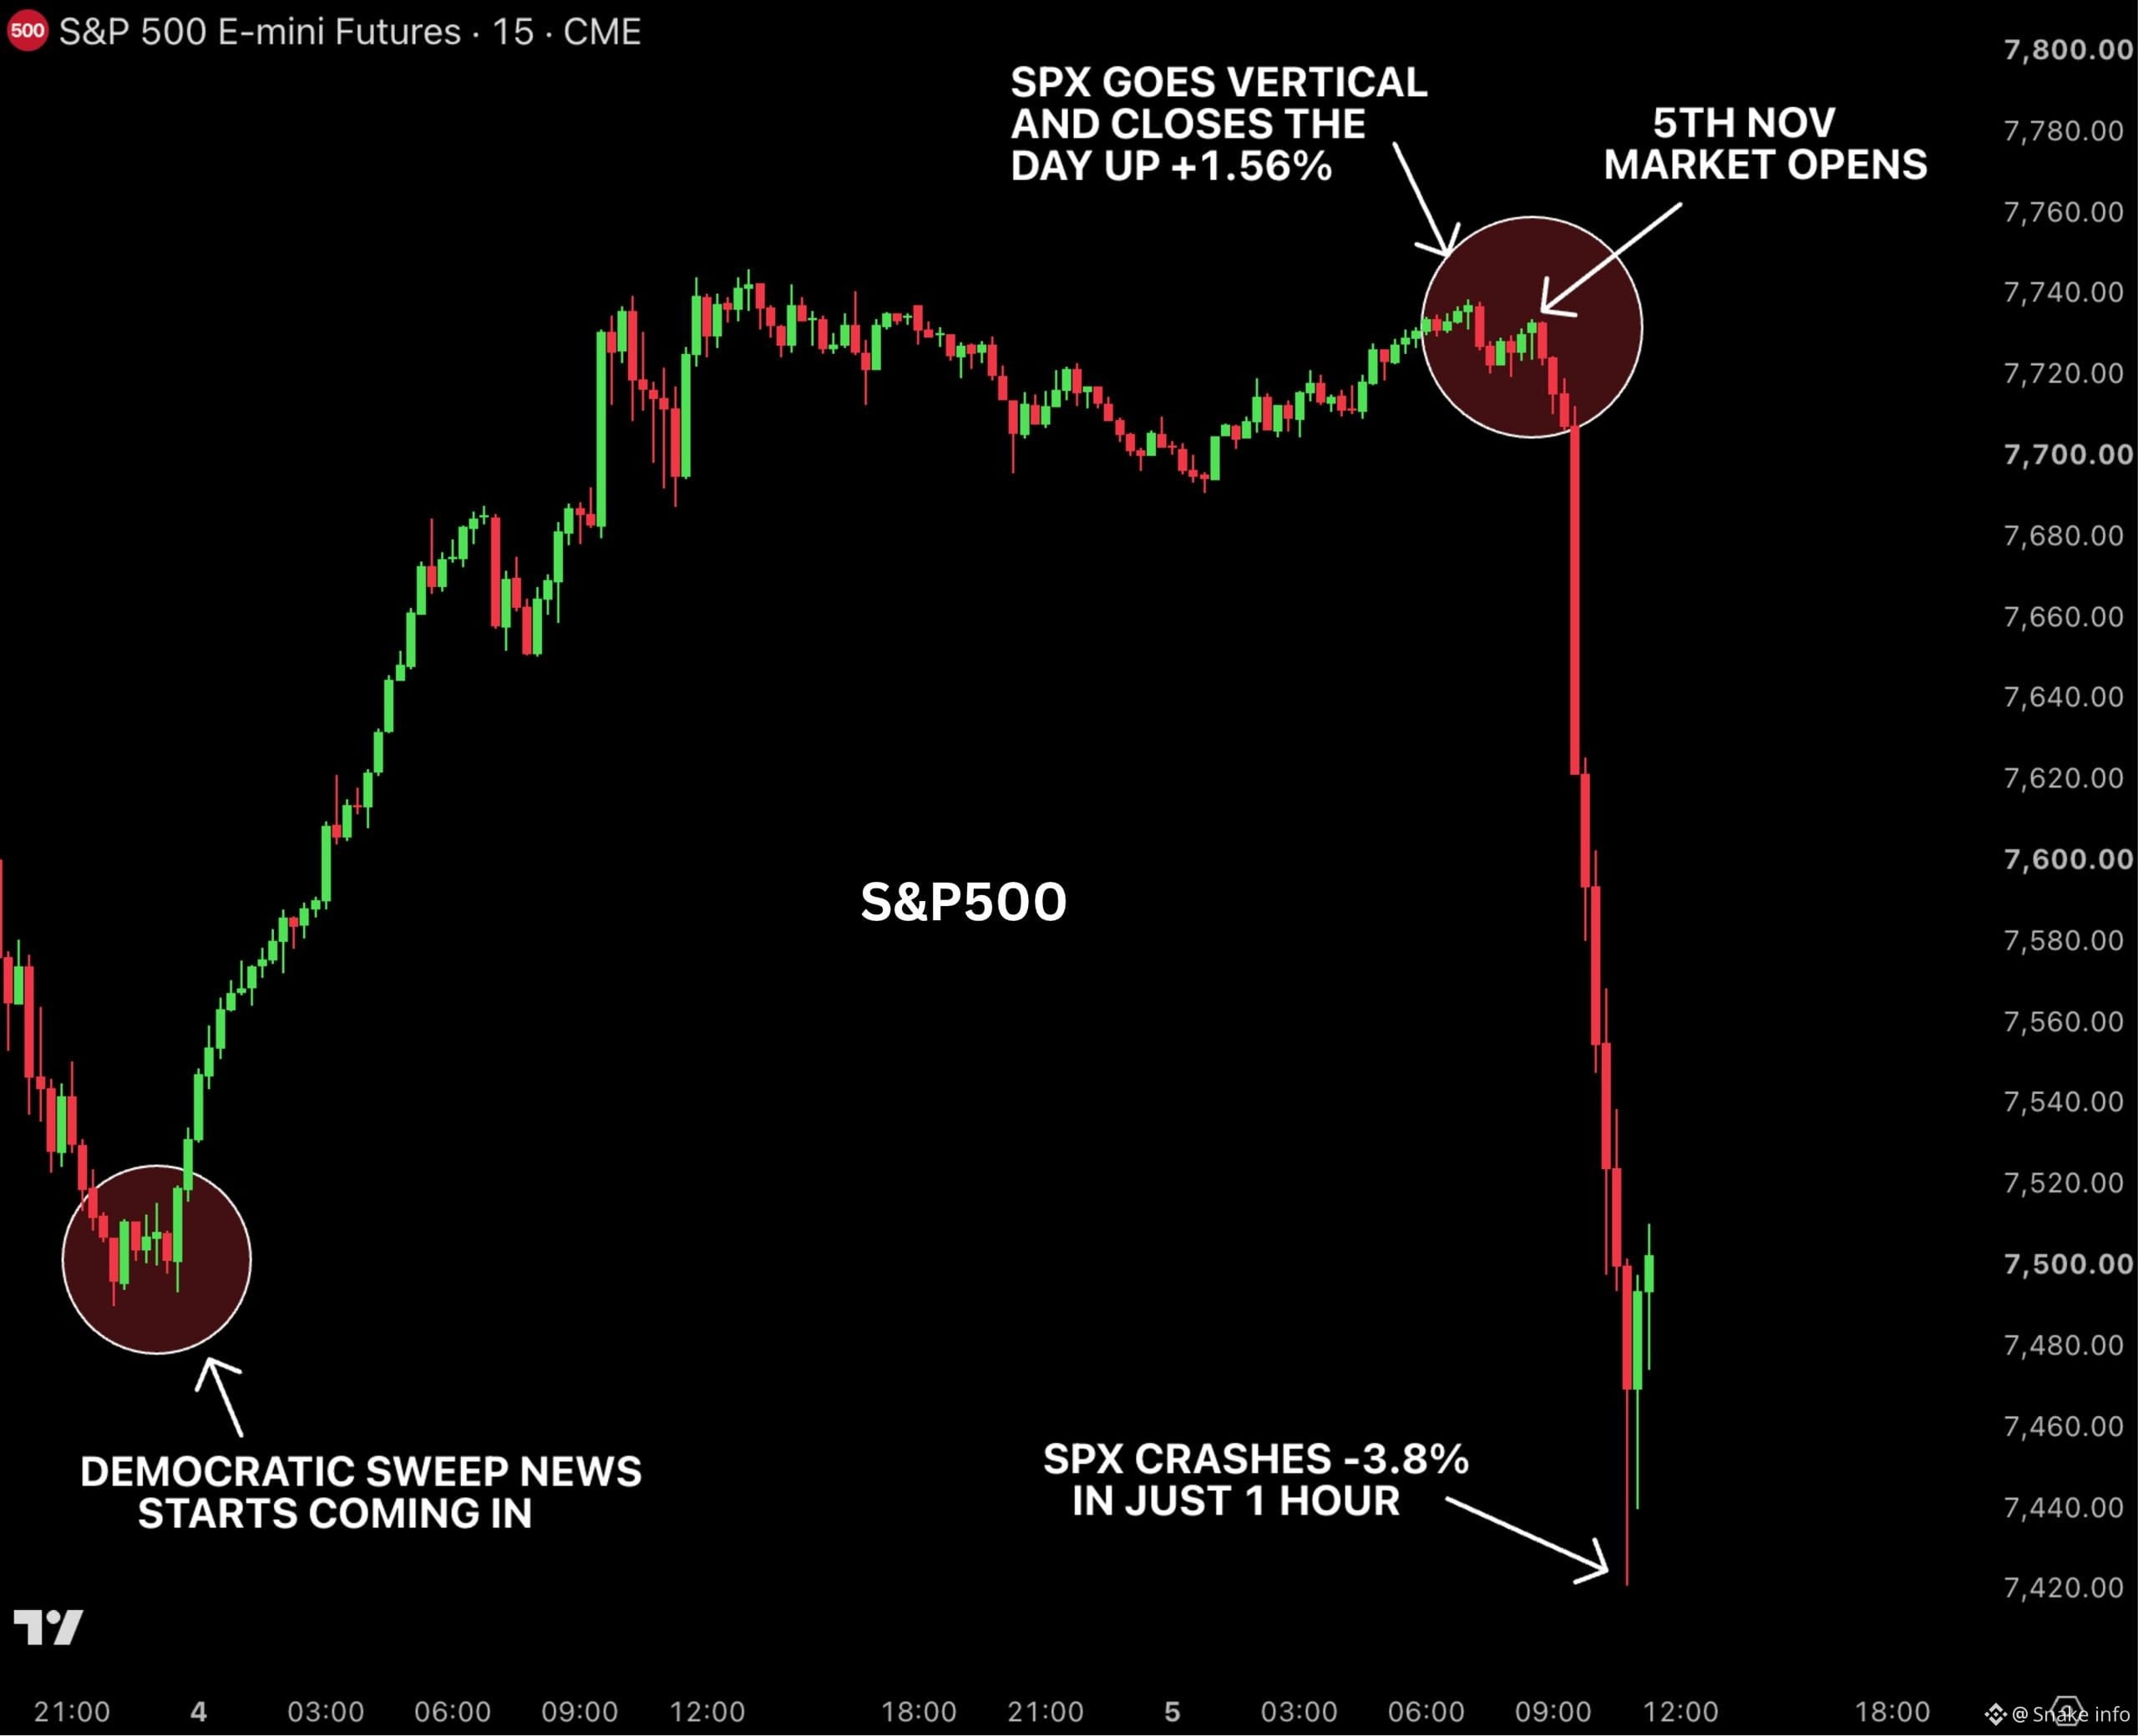
🚨 WAS YESTERDAY'S STOCK MARKET RALLY A PERFECT BULL TRAP?
Wall Street just delivered a shocking reversal. 📉
Here's what happened:
🇺🇸 Yesterday:
News broke that Democrats had won control of both the House and Senate.
Futures initially moved lower.
Then the S&P 500 suddenly surged.
The index closed up 1.56%, adding over $1 trillion in market value.
🔻 Today:
The S&P 500 plunged 3.84%.
Approximately $2.7 trillion in market value disappeared in just 90 minutes.
Yesterday's entire rally was wiped out.
⚠️ What Does This Mean?
The sudden reversal has raised questions about whether yesterday's rally attracted buyers just before a massive selloff.
Was it simply extreme market volatility, or did investors get caught in a classic bull trap?
🔥 One Thing Is Clear:
Markets can reverse direction faster than most traders expect.
📊 Watch liquidity, trading volume, institutional flows, and key support levels closely.
Did yesterday's rally create exit liquidity for bigger players? Or was this just a brutal market reversal?
What's your take? 👇
#StockMarket #SP500 #WallStreet #cryptomarket
Not financial advice. DYOR.
CLICK TO BELOW TRADE👇
$BTC $ETH $BNB
{future}(BNBUSDT)
{future}(ETHUSDT)
{future}(BTCUSDT)
🚨 WAS YESTERDAY'S STOCK MARKET RALLY A PERFECT BULL TRAP?
Wall Street just delivered a shocking reversal. 📉
Here's what happened:
🇺🇸 Yesterday:
News broke that Democrats had won control of both the House and Senate.
Futures initially moved lower.
Then the S&P 500 suddenly surged.
The index closed up 1.56%, adding over $1 trillion in market value.
🔻 Today:
The S&P 500 plunged 3.84%.
Approximately $2.7 trillion in market value disappeared in just 90 minutes.
Yesterday's entire rally was wiped out.
⚠️ What Does This Mean?
The sudden reversal has raised questions about whether yesterday's rally attracted buyers just before a massive selloff.
Was it simply extreme market volatility, or did investors get caught in a classic bull trap?
🔥 One Thing Is Clear:
Markets can reverse direction faster than most traders expect.
📊 Watch liquidity, trading volume, institutional flows, and key support levels closely.
Did yesterday's rally create exit liquidity for bigger players? Or was this just a brutal market reversal?
What's your take? 👇
#StockMarket #SP500 #WallStreet #cryptomarket
Not financial advice. DYOR.
CLICK TO BELOW TRADE👇
$BTC $ETH $BNB
Wall Street just delivered a shocking reversal. 📉
Here's what happened:
🇺🇸 Yesterday:
News broke that Democrats had won control of both the House and Senate.
Futures initially moved lower.
Then the S&P 500 suddenly surged.
The index closed up 1.56%, adding over $1 trillion in market value.
🔻 Today:
The S&P 500 plunged 3.84%.
Approximately $2.7 trillion in market value disappeared in just 90 minutes.
Yesterday's entire rally was wiped out.
⚠️ What Does This Mean?
The sudden reversal has raised questions about whether yesterday's rally attracted buyers just before a massive selloff.
Was it simply extreme market volatility, or did investors get caught in a classic bull trap?
🔥 One Thing Is Clear:
Markets can reverse direction faster than most traders expect.
📊 Watch liquidity, trading volume, institutional flows, and key support levels closely.
Did yesterday's rally create exit liquidity for bigger players? Or was this just a brutal market reversal?
What's your take? 👇
#StockMarket #SP500 #WallStreet #cryptomarket
Not financial advice. DYOR.
CLICK TO BELOW TRADE👇
$BTC $ETH $BNB
131

·
--
Bearish
S&P 500 Rebounds — But Is the Market Too Comfortable?
⠀
The S&P 500 initially moved higher after Democrats won control of Congress, while the sharp drop in oil helped improve market sentiment.
⠀
But I think the market may be getting comfortable too quickly.
⠀
Geopolitical risk around Iran is still alive, Trump still holds broad foreign-policy authority, and another weekend is approaching.
⠀
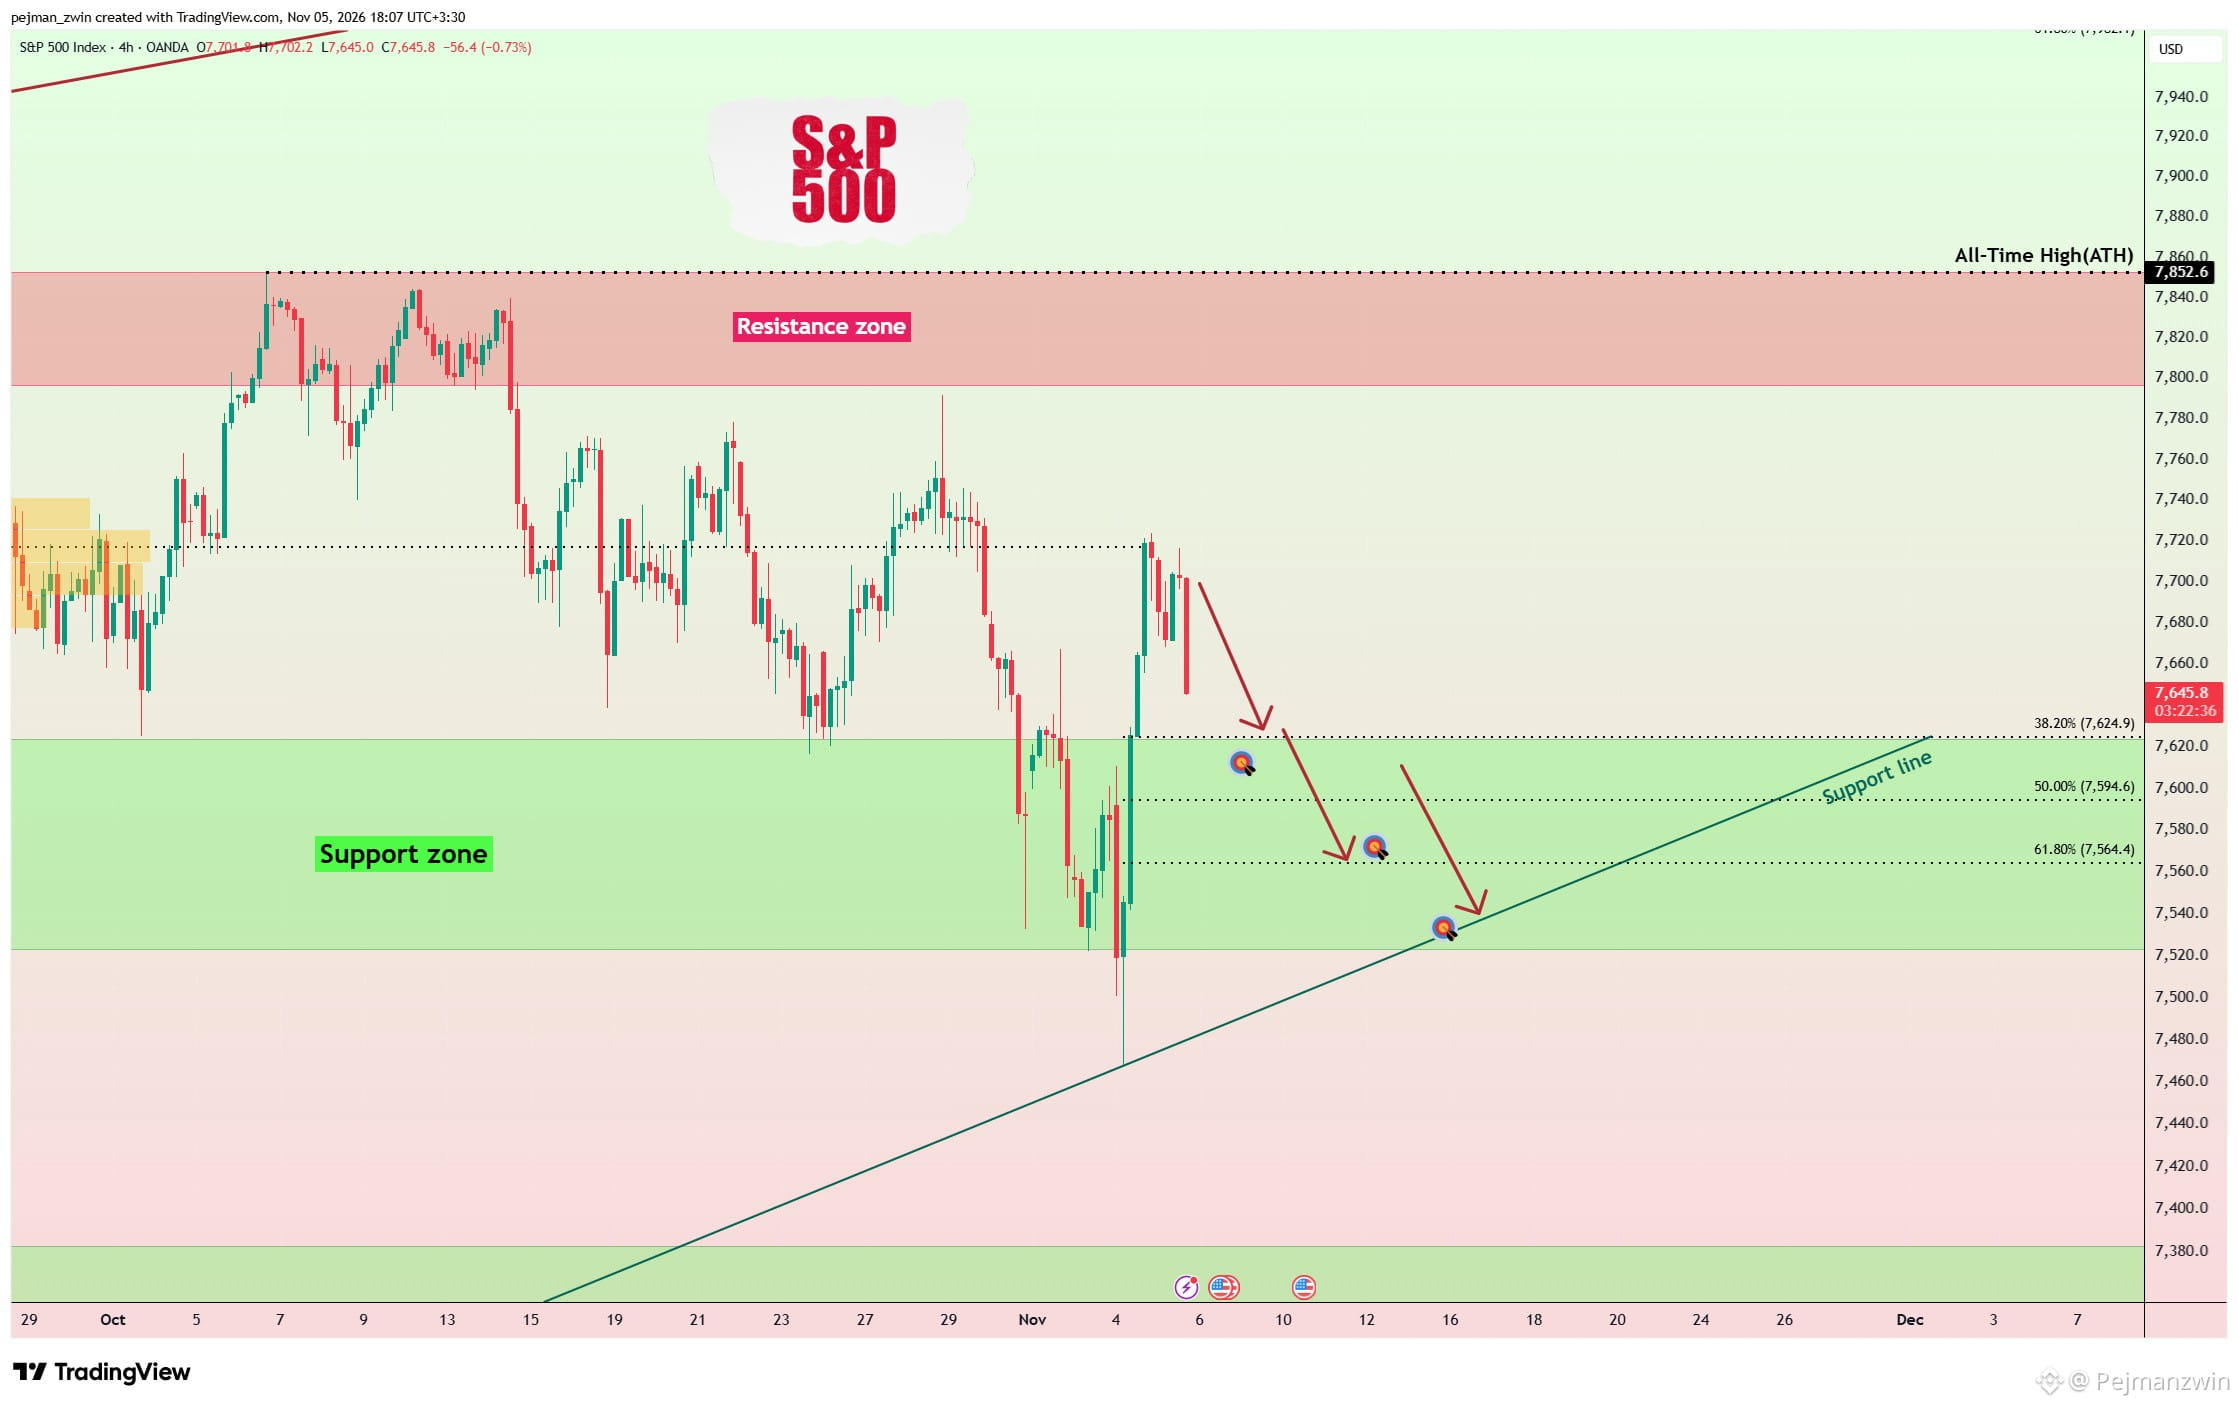
Technically, SPX is trading near the key 7,720 level.
⠀
If sellers return, I expect another move toward the Support Zone ($7,523-$7,624).
⠀
Trade Setup
⠀
TP: $7,553
SL: $7,732
Key Level: $7,720
⠀
For me, the next two days are more about risk management than chasing the recovery.
⠀
Do you think SPX holds above 7,720 — or does weekend risk send it back toward support?
⠀
#SP500
S&P 500 Rebounds — But Is the Market Too Comfortable?
⠀
The S&P 500 initially moved higher after Democrats won control of Congress, while the sharp drop in oil helped improve market sentiment.
⠀
But I think the market may be getting comfortable too quickly.
⠀
Geopolitical risk around Iran is still alive, Trump still holds broad foreign-policy authority, and another weekend is approaching.
⠀
Technically, SPX is trading near the key 7,720 level.
⠀
If sellers return, I expect another move toward the Support Zone ($7,523-$7,624).
⠀
Trade Setup
⠀
TP: $7,553
SL: $7,732
Key Level: $7,720
⠀
For me, the next two days are more about risk management than chasing the recovery.
⠀
Do you think SPX holds above 7,720 — or does weekend risk send it back toward support?
⠀
#SP500
⠀
The S&P 500 initially moved higher after Democrats won control of Congress, while the sharp drop in oil helped improve market sentiment.
⠀
But I think the market may be getting comfortable too quickly.
⠀
Geopolitical risk around Iran is still alive, Trump still holds broad foreign-policy authority, and another weekend is approaching.
⠀
Technically, SPX is trading near the key 7,720 level.
⠀
If sellers return, I expect another move toward the Support Zone ($7,523-$7,624).
⠀
Trade Setup
⠀
TP: $7,553
SL: $7,732
Key Level: $7,720
⠀
For me, the next two days are more about risk management than chasing the recovery.
⠀
Do you think SPX holds above 7,720 — or does weekend risk send it back toward support?
⠀
#SP500
1
459
·
--
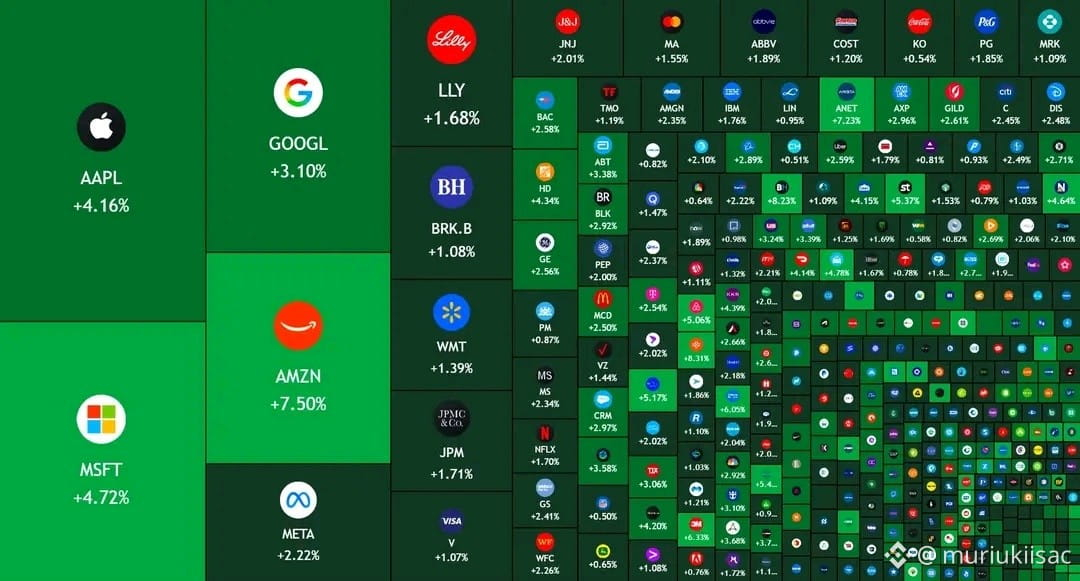
🚨 BREAKING: The S&P 500 hits 7,700, adding more than $1,100,000,000,000 in market capitalization today after Democrats take control of both the House and Senate.
#BTCRebounds80K
#SP500 #USMidterms-WhatAreMarketsExpecting? $SPCXB $AAPLB $MSFTB
🚨 BREAKING: The S&P 500 hits 7,700, adding more than $1,100,000,000,000 in market capitalization today after Democrats take control of both the House and Senate.
#BTCRebounds80K
#SP500 #USMidterms-WhatAreMarketsExpecting? $SPCXB $AAPLB $MSFTB
#BTCRebounds80K
#SP500 #USMidterms-WhatAreMarketsExpecting? $SPCXB $AAPLB $MSFTB
1
300

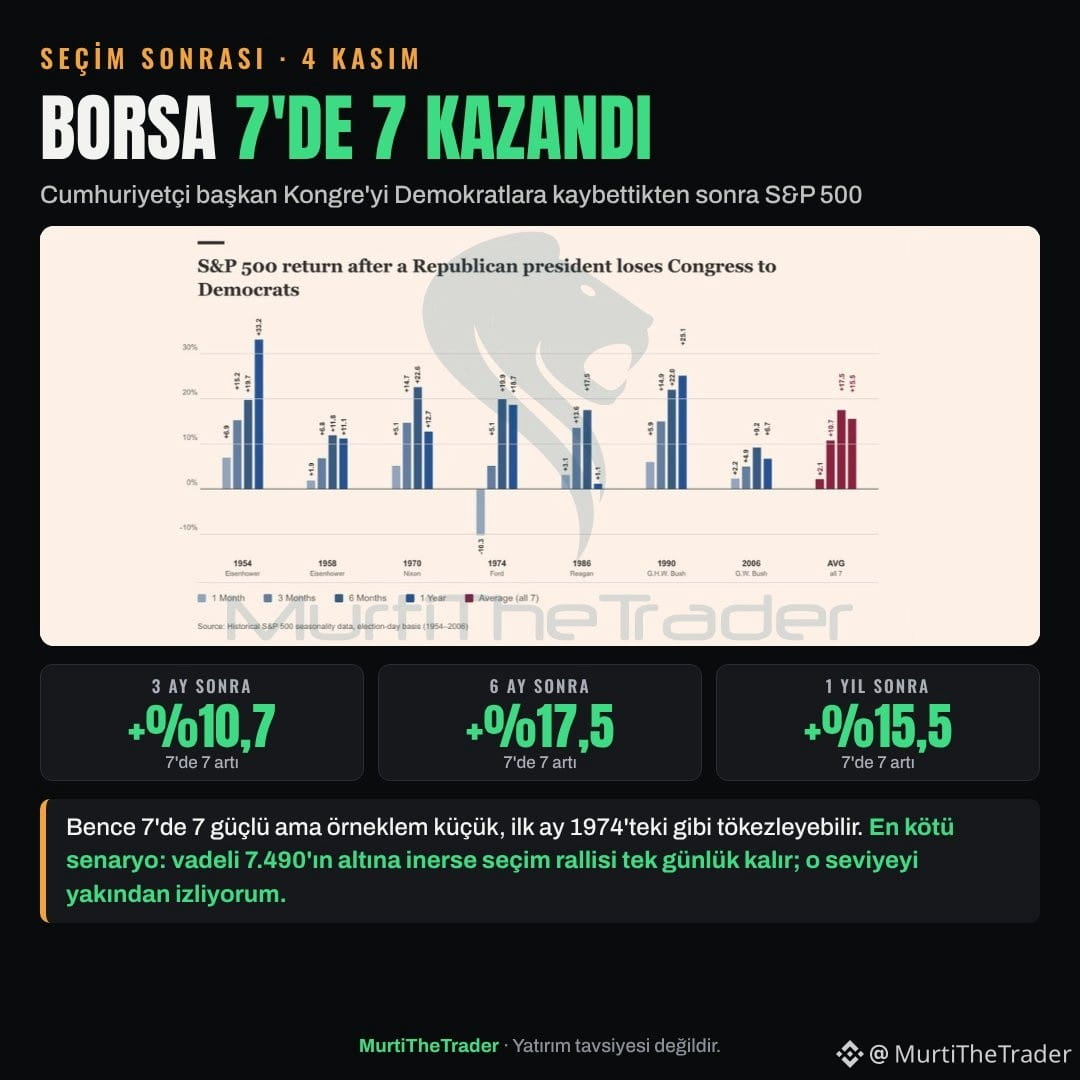
Post-election: Democrats took both chambers of Congress. In the previous 7 instances since 1954, the S&P 500 was higher one year later 7 out of 7 times.
→ Average: +10.7% in 3 months, +17.5% in 6 months, +15.5% in 1 year
→ First month positive in 6 of 7, with a double-digit drop in 1974
→ ES futures tagged 7,490 overnight, then flipped to +1.1%
My take: 7 for 7 is strong, but the sample is small, and the first month could stumble like 1974. Worst case: if futures drop below 7,490, the election rally lasts a single day. I'm watching that level closely.
#Investing #SP500
Post-election: Democrats took both chambers of Congress. In the previous 7 instances since 1954, the S&P 500 was higher one year later 7 out of 7 times.
→ Average: +10.7% in 3 months, +17.5% in 6 months, +15.5% in 1 year
→ First month positive in 6 of 7, with a double-digit drop in 1974
→ ES futures tagged 7,490 overnight, then flipped to +1.1%
My take: 7 for 7 is strong, but the sample is small, and the first month could stumble like 1974. Worst case: if futures drop below 7,490, the election rally lasts a single day. I'm watching that level closely.
#Investing #SP500
→ Average: +10.7% in 3 months, +17.5% in 6 months, +15.5% in 1 year
→ First month positive in 6 of 7, with a double-digit drop in 1974
→ ES futures tagged 7,490 overnight, then flipped to +1.1%
My take: 7 for 7 is strong, but the sample is small, and the first month could stumble like 1974. Worst case: if futures drop below 7,490, the election rally lasts a single day. I'm watching that level closely.
#Investing #SP500
1
127

·
--
Verified
🚨 TOTAL PANIC! WALL STREET IS CRASHING 😱
GLOBAL ALERT, folks! This is NOT a joke.
Yesterday, Wall Street saw a massacre. In just hours, $2.9 TRILLION disappeared. Trillion, folks!
📉 Nasdaq: -5.52%
📉 S&P 500: -4.36%
📉 Dow Jones: -3.44%
And AI stocks? WRECKED:
🔴 AMD -17%
🔴 Micron -17%
🔴 Sandisk -22%
🔴 Nvidia -9%
They say it was due to panic over AI and regulations... But what do you think?
Was this just exaggerated panic, or is this the START OF THE BIG CRASH? 👀
Comment below 👇
ARE YOU BUYING THE DIP OR WAITING?
#Crash #WallStreet #NASDAQ #SP500
🚨 TOTAL PANIC! WALL STREET IS CRASHING 😱
GLOBAL ALERT, folks! This is NOT a joke.
Yesterday, Wall Street saw a massacre. In just hours, $2.9 TRILLION disappeared. Trillion, folks!
📉 Nasdaq: -5.52%
📉 S&P 500: -4.36%
📉 Dow Jones: -3.44%
And AI stocks? WRECKED:
🔴 AMD -17%
🔴 Micron -17%
🔴 Sandisk -22%
🔴 Nvidia -9%
They say it was due to panic over AI and regulations... But what do you think?
Was this just exaggerated panic, or is this the START OF THE BIG CRASH? 👀
Comment below 👇
ARE YOU BUYING THE DIP OR WAITING?
#Crash #WallStreet #NASDAQ #SP500
GLOBAL ALERT, folks! This is NOT a joke.
Yesterday, Wall Street saw a massacre. In just hours, $2.9 TRILLION disappeared. Trillion, folks!
📉 Nasdaq: -5.52%
📉 S&P 500: -4.36%
📉 Dow Jones: -3.44%
And AI stocks? WRECKED:
🔴 AMD -17%
🔴 Micron -17%
🔴 Sandisk -22%
🔴 Nvidia -9%
They say it was due to panic over AI and regulations... But what do you think?
Was this just exaggerated panic, or is this the START OF THE BIG CRASH? 👀
Comment below 👇
ARE YOU BUYING THE DIP OR WAITING?
#Crash #WallStreet #NASDAQ #SP500

AudrelysR:
si todos siguen llevándose por noticias así nunca ahorraran en cripto 2 o 100 billones es nada para wall street métase eso en la cabeza hoy se pierde so mañana ganan el doble
4
1
12
12.5k
·
--
Bearish
S&P 500 Target Hit — Volatility Finally Respected the Levels
⠀
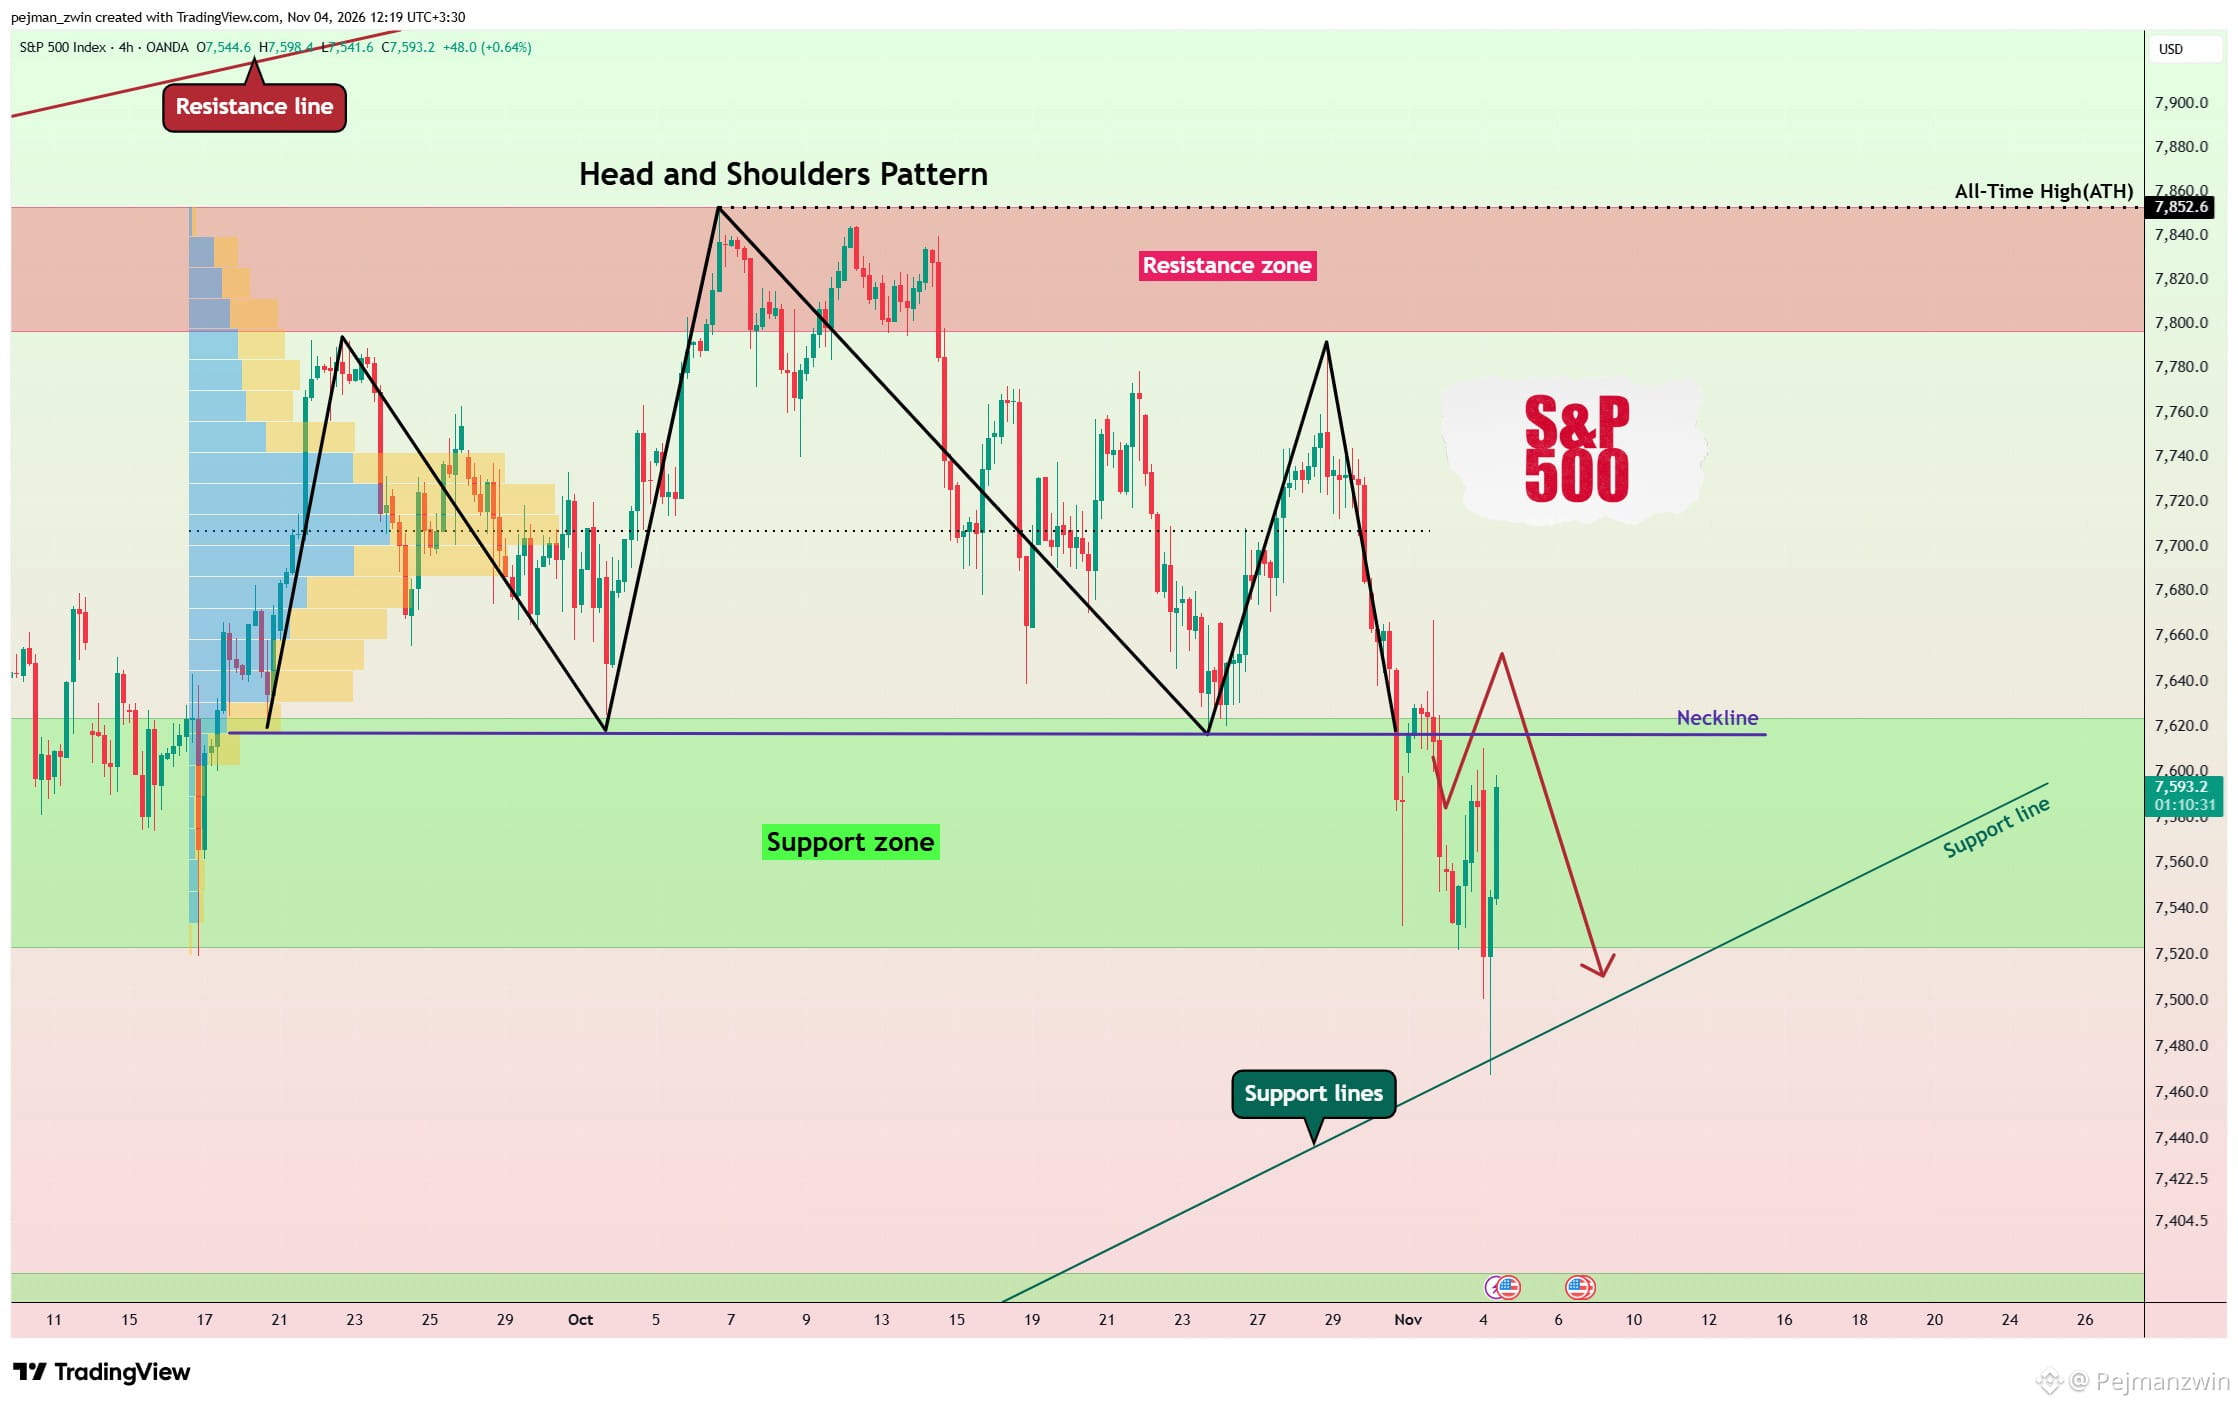
After several volatile sessions around the U.S. election, the S&P 500 finally reached my target.
⠀
SPX filled the lower gaps, reacted from the Support Line, and then started moving higher again.
⠀
This is exactly why I always combine market structure with major macro events.
⠀
Volatility can be aggressive, but the key technical areas still matter.
⠀
I hope this analysis helped you navigate the move and secure some profit.
⠀
What do you think comes next for the S&P 500 — continued recovery or another correction?
⠀
#SP500
S&P 500 Target Hit — Volatility Finally Respected the Levels
⠀
After several volatile sessions around the U.S. election, the S&P 500 finally reached my target.
⠀
SPX filled the lower gaps, reacted from the Support Line, and then started moving higher again.
⠀
This is exactly why I always combine market structure with major macro events.
⠀
Volatility can be aggressive, but the key technical areas still matter.
⠀
I hope this analysis helped you navigate the move and secure some profit.
⠀
What do you think comes next for the S&P 500 — continued recovery or another correction?
⠀
#SP500
⠀
After several volatile sessions around the U.S. election, the S&P 500 finally reached my target.
⠀
SPX filled the lower gaps, reacted from the Support Line, and then started moving higher again.
⠀
This is exactly why I always combine market structure with major macro events.
⠀
Volatility can be aggressive, but the key technical areas still matter.
⠀
I hope this analysis helped you navigate the move and secure some profit.
⠀
What do you think comes next for the S&P 500 — continued recovery or another correction?
⠀
#SP500
Pejmanzwin
·
--
S&P 500 at Major Support — Will the U.S. Midterms Trigger Another Sell-Off?
The S&P 500 came under strong pressure last week as technology stocks sold off sharply and investors became increasingly concerned about high valuations and the massive amount of capital being committed to AI.
⠀
Now another major catalyst is approaching.
⠀
The U.S. midterm elections take place tomorrow, November 3, and $SPX is entering the event while sitting directly on an important technical support structure.
⠀
For me, this makes the next 24-48 hours especially important.
⠀
Can buyers defend the current Support Zone, or is a move below $7,500 coming next?
⠀
Why the Market Came Under Pressure
⠀
The recent weakness was not simply about one bad economic report.
⠀
Technology and AI-related stocks became the main source of pressure as investors started questioning whether the enormous spending on data centers, chips, and AI infrastructure will generate sufficient returns.
⠀
The S&P 500 Technology sector fell 6.8% during October, while Friday alone brought another sharp 4.2% decline.
⠀
That selling pressure pushed the broader S&P 500 lower and left the market technically much more vulnerable heading into election week.
⠀
U.S. Midterm Elections — What Matters for the Market?
⠀
Election uncertainty is now being added to an already fragile market.
⠀
The latest polling favors Democrats nationally, and analysts currently see them as having a good chance of taking control of the House.
⠀
The Senate remains much more difficult to predict.
⠀
For markets, I do not think the story is simply “Democrats bearish, Republicans bullish.”
⠀
Each scenario has different implications.
⠀
A Democratic sweep could increase expectations for stronger congressional oversight of AI companies, data centers, crypto, and other industries.
⠀
That could create additional uncertainty for technology stocks at a time when the AI trade is already under pressure.
⠀
A Republican sweep could initially reduce concerns about aggressive new regulation and support expectations for tax or defense-policy continuity.
⠀
However, it could also revive concerns about larger fiscal deficits and Treasury yields.
⠀
A divided Congress may limit major policy changes, which markets have historically sometimes viewed positively because political gridlock can reduce the probability of large legislative surprises.
⠀
So for me, the biggest short-term risk is not simply which party wins.
⠀
It is whether the result surprises the market.
⠀
History After Midterm Elections
⠀
Historically, U.S. equities have often performed well after midterm elections.
⠀
Since 1938, the S&P 500 has posted gains during the following 12 months in approximately 95% of midterm cycles, with average returns around 14%.
⠀
One explanation is that election uncertainty begins to disappear once the result is known.
⠀
But history does not guarantee what happens tomorrow.
⠀
The current market is dealing with unusually high technology valuations, AI spending concerns, elevated Treasury yields, and geopolitical uncertainty.
⠀
That is why I am paying more attention to the chart than to historical averages.
⠀
Technical Analysis
⠀
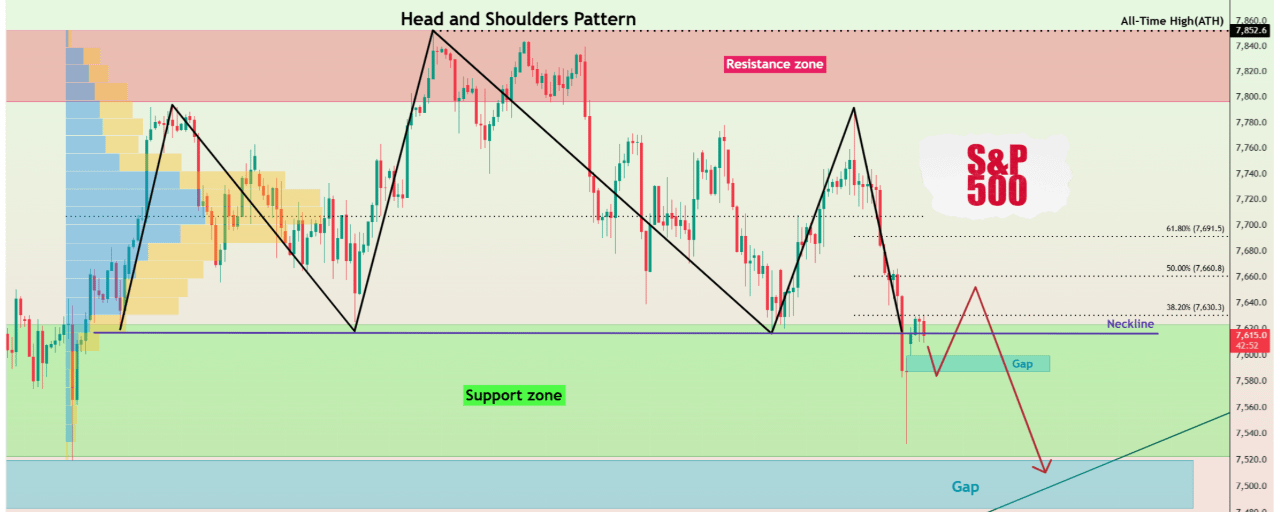
On the 4-hour timeframe, the S&P 500 is attempting to break below the important Support Zone ($7,523-$7,624).
⠀
A small bullish Gap also formed around ($7,587.7-$7,599.4), and I believe this gap could still be filled during a short-term reaction.
⠀
But the larger technical structure remains more concerning.
⠀
From a classical technical analysis perspective, the S&P 500 appears to have formed a clear Head and Shoulders Pattern.
⠀
The Right Shoulder developed with strong bearish momentum toward the Neckline, and price is now testing this critical structure.
⠀
For me, the Neckline is the key.
⠀
As long as buyers cannot recover strongly from this area, the bearish pattern remains active.
⠀
Bearish Scenario
⠀
My main scenario is that election volatility could create sharp moves in both directions before the market chooses its next trend.
⠀
However, a confirmed breakdown below the current Support Zone and Head and Shoulders Neckline would significantly strengthen the bearish setup.
⠀
The first downside target would be the larger Gap ($7,483.6-$7,519.7).
⠀
That area also brings the market close to the psychological $7,500 level and an important Support Line.
⠀
This combination makes approximately $7,500 one of the most important areas I am watching.
⠀
If $7,500 fails with strong bearish momentum, the correction could develop into something deeper rather than remaining a simple election-driven shakeout.
⠀
Bullish Scenario
⠀
There is also a bullish scenario that I do not want to ignore.
⠀
If buyers successfully defend the Support Zone ($7,523-$7,624), fill the smaller Gap, and reclaim the broken structure with strong momentum, the Head and Shoulders breakdown could fail.
⠀
That type of failed breakdown during a high-volatility event could force short sellers to cover and create a sharp relief rally.
⠀
For me, confirmation matters more than trying to predict the election result itself.
⠀
Trade Setup
⠀
Take Profit: $7,519
⠀
Stop Loss: $7,690
⠀
Key Trading Levels:
$7,500
$7,708
⠀
Support Zone:
($7,523-$7,624)
⠀
Small Gap:
($7,587.7-$7,599.4)
⠀
Main Downside Gap:
($7,483.6-$7,519.7)
⠀
Impact on $BTC and $ETH
⠀
This setup is also important for the crypto market.
⠀
Bitcoin and Ethereum remain sensitive to changes in broader risk sentiment, particularly when U.S. equities experience sharp moves.
⠀
If the S&P 500 breaks support and technology stocks come under another wave of selling, I would expect that Risk-Off environment to increase pressure on Bitcoin and Ethereum as well.
⠀
On the other hand, if election uncertainty fades and U.S. equities produce a strong relief rally, crypto could also receive some short-term support.
⠀
My S&P 500 Outlook
⠀
For me, the story is straightforward.
⠀
The market entered election week already weakened by the technology sell-off.
⠀
Now the S&P 500 is sitting on an important Support Zone while a potential Head and Shoulders Pattern is threatening to break its Neckline.
⠀
A short-term reaction is possible, especially around the election.
⠀
But unless buyers successfully reclaim the structure, I continue to see a meaningful risk of a move toward the ($7,483.6-$7,519.7) Gap and the psychological $7,500 area.
⠀
Election results could create False Breakouts and aggressive moves in both directions, so I would rather react to confirmation than predict the first candle.
⠀
Which level will the S&P 500 reach first?
⠀
🔴 $7,519
🟢 $7,690
⠀
#SP500
⠀
Now another major catalyst is approaching.
⠀
The U.S. midterm elections take place tomorrow, November 3, and $SPX is entering the event while sitting directly on an important technical support structure.
⠀
For me, this makes the next 24-48 hours especially important.
⠀
Can buyers defend the current Support Zone, or is a move below $7,500 coming next?
⠀
Why the Market Came Under Pressure
⠀
The recent weakness was not simply about one bad economic report.
⠀
Technology and AI-related stocks became the main source of pressure as investors started questioning whether the enormous spending on data centers, chips, and AI infrastructure will generate sufficient returns.
⠀
The S&P 500 Technology sector fell 6.8% during October, while Friday alone brought another sharp 4.2% decline.
⠀
That selling pressure pushed the broader S&P 500 lower and left the market technically much more vulnerable heading into election week.
⠀
U.S. Midterm Elections — What Matters for the Market?
⠀
Election uncertainty is now being added to an already fragile market.
⠀
The latest polling favors Democrats nationally, and analysts currently see them as having a good chance of taking control of the House.
⠀
The Senate remains much more difficult to predict.
⠀
For markets, I do not think the story is simply “Democrats bearish, Republicans bullish.”
⠀
Each scenario has different implications.
⠀
A Democratic sweep could increase expectations for stronger congressional oversight of AI companies, data centers, crypto, and other industries.
⠀
That could create additional uncertainty for technology stocks at a time when the AI trade is already under pressure.
⠀
A Republican sweep could initially reduce concerns about aggressive new regulation and support expectations for tax or defense-policy continuity.
⠀
However, it could also revive concerns about larger fiscal deficits and Treasury yields.
⠀
A divided Congress may limit major policy changes, which markets have historically sometimes viewed positively because political gridlock can reduce the probability of large legislative surprises.
⠀
So for me, the biggest short-term risk is not simply which party wins.
⠀
It is whether the result surprises the market.
⠀
History After Midterm Elections
⠀
Historically, U.S. equities have often performed well after midterm elections.
⠀
Since 1938, the S&P 500 has posted gains during the following 12 months in approximately 95% of midterm cycles, with average returns around 14%.
⠀
One explanation is that election uncertainty begins to disappear once the result is known.
⠀
But history does not guarantee what happens tomorrow.
⠀
The current market is dealing with unusually high technology valuations, AI spending concerns, elevated Treasury yields, and geopolitical uncertainty.
⠀
That is why I am paying more attention to the chart than to historical averages.
⠀
Technical Analysis
⠀
On the 4-hour timeframe, the S&P 500 is attempting to break below the important Support Zone ($7,523-$7,624).
⠀
A small bullish Gap also formed around ($7,587.7-$7,599.4), and I believe this gap could still be filled during a short-term reaction.
⠀
But the larger technical structure remains more concerning.
⠀
From a classical technical analysis perspective, the S&P 500 appears to have formed a clear Head and Shoulders Pattern.
⠀
The Right Shoulder developed with strong bearish momentum toward the Neckline, and price is now testing this critical structure.
⠀
For me, the Neckline is the key.
⠀
As long as buyers cannot recover strongly from this area, the bearish pattern remains active.
⠀
Bearish Scenario
⠀
My main scenario is that election volatility could create sharp moves in both directions before the market chooses its next trend.
⠀
However, a confirmed breakdown below the current Support Zone and Head and Shoulders Neckline would significantly strengthen the bearish setup.
⠀
The first downside target would be the larger Gap ($7,483.6-$7,519.7).
⠀
That area also brings the market close to the psychological $7,500 level and an important Support Line.
⠀
This combination makes approximately $7,500 one of the most important areas I am watching.
⠀
If $7,500 fails with strong bearish momentum, the correction could develop into something deeper rather than remaining a simple election-driven shakeout.
⠀
Bullish Scenario
⠀
There is also a bullish scenario that I do not want to ignore.
⠀
If buyers successfully defend the Support Zone ($7,523-$7,624), fill the smaller Gap, and reclaim the broken structure with strong momentum, the Head and Shoulders breakdown could fail.
⠀
That type of failed breakdown during a high-volatility event could force short sellers to cover and create a sharp relief rally.
⠀
For me, confirmation matters more than trying to predict the election result itself.
⠀
Trade Setup
⠀
Take Profit: $7,519
⠀
Stop Loss: $7,690
⠀
Key Trading Levels:
$7,500
$7,708
⠀
Support Zone:
($7,523-$7,624)
⠀
Small Gap:
($7,587.7-$7,599.4)
⠀
Main Downside Gap:
($7,483.6-$7,519.7)
⠀
Impact on $BTC and $ETH
⠀
This setup is also important for the crypto market.
⠀
Bitcoin and Ethereum remain sensitive to changes in broader risk sentiment, particularly when U.S. equities experience sharp moves.
⠀
If the S&P 500 breaks support and technology stocks come under another wave of selling, I would expect that Risk-Off environment to increase pressure on Bitcoin and Ethereum as well.
⠀
On the other hand, if election uncertainty fades and U.S. equities produce a strong relief rally, crypto could also receive some short-term support.
⠀
My S&P 500 Outlook
⠀
For me, the story is straightforward.
⠀
The market entered election week already weakened by the technology sell-off.
⠀
Now the S&P 500 is sitting on an important Support Zone while a potential Head and Shoulders Pattern is threatening to break its Neckline.
⠀
A short-term reaction is possible, especially around the election.
⠀
But unless buyers successfully reclaim the structure, I continue to see a meaningful risk of a move toward the ($7,483.6-$7,519.7) Gap and the psychological $7,500 area.
⠀
Election results could create False Breakouts and aggressive moves in both directions, so I would rather react to confirmation than predict the first candle.
⠀
Which level will the S&P 500 reach first?
⠀
🔴 $7,519
🟢 $7,690
⠀
#SP500
1
460

·
--
Article
WALL STREET AFTER THE SHOCK AND THE JOBS REPORT (NFP): ABSORPTION AT 7,350 OR REDISTRIBUTION?Thursday's selloff on Wall Street—the worst since April 2025, with the Dow Jones losing 1,833 points (-3.44%), the S&P 500 falling 4.36% to 7,353.73, the Nasdaq down 5.52%, chip stocks tumbling nearly 12%, all 11 sectors in the red, and Japan's Nikkei plunging 6% today—has just collided this Friday with a much stronger-than-expected jobs report.
1. What today's Friday October NFP report showed:
- Nonfarm payrolls: +165,000 jobs versus the consensus estimate of 65,000–70,000.
WALL STREET AFTER THE SHOCK AND THE JOBS REPORT (NFP): ABSORPTION AT 7,350 OR REDISTRIBUTION?
Thursday's selloff on Wall Street—the worst since April 2025, with the Dow Jones losing 1,833 points (-3.44%), the S&P 500 falling 4.36% to 7,353.73, the Nasdaq down 5.52%, chip stocks tumbling nearly 12%, all 11 sectors in the red, and Japan's Nikkei plunging 6% today—has just collided this Friday with a much stronger-than-expected jobs report.
1. What today's Friday October NFP report showed:
- Nonfarm payrolls: +165,000 jobs versus the consensus estimate of 65,000–70,000.
1. What today's Friday October NFP report showed:
- Nonfarm payrolls: +165,000 jobs versus the consensus estimate of 65,000–70,000.
215


·
--
Verified
Is this the end of the AI narrative?
The S&P 500 suffers a historic $2.9 trillion bleed after a massive wave of liquidations
Record market-cap loss
The #SP500 shed approximately $2.9 trillion in a single day, marking the largest intraday destruction of market value in history.
Declines not seen since the COVID panic:
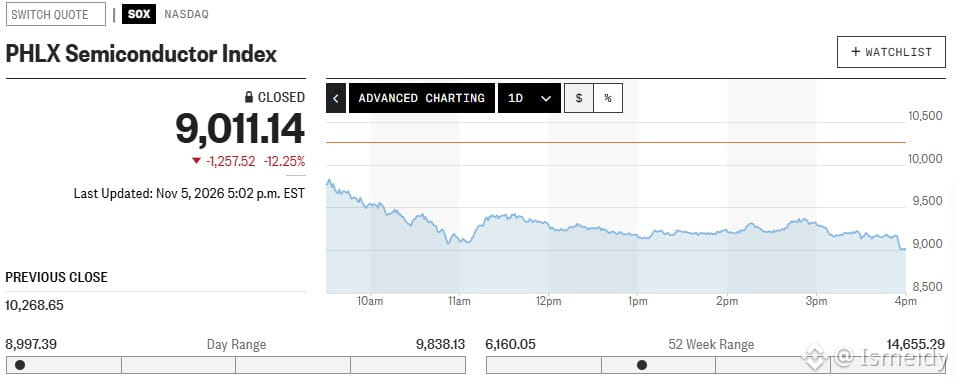
The PHLX Semiconductor Index (SOX) plunged 12.25% (-1,257.52 points), closing at 9,011.14—its worst day since March 2020.
The S&P 500 Technology Sector fell 7.3%, and the Nasdaq-100 (NDX) dropped 6.4%, breaking key support levels.
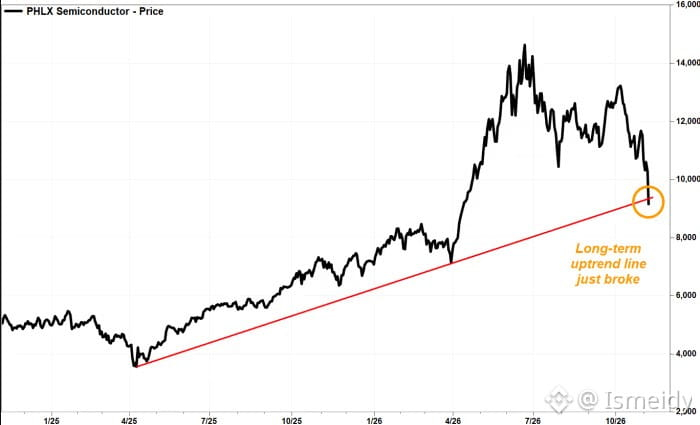
Trend breakdown and political factor: The Democrats’ landslide victory in the midterm elections raised alarm over possible harsh regulations or halts to the construction of AI data centers. On the charts, the SOX index broke below the long-term uptrend line that had supported the market since April 2025.
Cascade effect and forced liquidations (Margin Calls): The correction triggered massive deleveraging. Hedge funds and leveraged traders faced margin calls that forced them to sell positions en masse—not only in tech, but also in defensive sectors (healthcare and consumer staples) to cover losses.
VIX fear index explodes: The Cboe Volatility Index surged an impressive 69.7%, marking its biggest increase in two years and reflecting a clear phase of panic and capitulation across the broader market.
#IA #CryptoNews
$SPYB
{spot}(SPYBUSDT)
$QQQB
{spot}(QQQBUSDT)
$TSMB
{spot}(TSMBUSDT)
Is this the end of the AI narrative?
The S&P 500 suffers a historic $2.9 trillion bleed after a massive wave of liquidations
Record market-cap loss
The #SP500 shed approximately $2.9 trillion in a single day, marking the largest intraday destruction of market value in history.
Declines not seen since the COVID panic:
The PHLX Semiconductor Index (SOX) plunged 12.25% (-1,257.52 points), closing at 9,011.14—its worst day since March 2020.
The S&P 500 Technology Sector fell 7.3%, and the Nasdaq-100 (NDX) dropped 6.4%, breaking key support levels.
Trend breakdown and political factor: The Democrats’ landslide victory in the midterm elections raised alarm over possible harsh regulations or halts to the construction of AI data centers. On the charts, the SOX index broke below the long-term uptrend line that had supported the market since April 2025.
Cascade effect and forced liquidations (Margin Calls): The correction triggered massive deleveraging. Hedge funds and leveraged traders faced margin calls that forced them to sell positions en masse—not only in tech, but also in defensive sectors (healthcare and consumer staples) to cover losses.
VIX fear index explodes: The Cboe Volatility Index surged an impressive 69.7%, marking its biggest increase in two years and reflecting a clear phase of panic and capitulation across the broader market.
#IA #CryptoNews
$SPYB
$QQQB
$TSMB
The S&P 500 suffers a historic $2.9 trillion bleed after a massive wave of liquidations
Record market-cap loss
The #SP500 shed approximately $2.9 trillion in a single day, marking the largest intraday destruction of market value in history.
Declines not seen since the COVID panic:
The PHLX Semiconductor Index (SOX) plunged 12.25% (-1,257.52 points), closing at 9,011.14—its worst day since March 2020.
The S&P 500 Technology Sector fell 7.3%, and the Nasdaq-100 (NDX) dropped 6.4%, breaking key support levels.
Trend breakdown and political factor: The Democrats’ landslide victory in the midterm elections raised alarm over possible harsh regulations or halts to the construction of AI data centers. On the charts, the SOX index broke below the long-term uptrend line that had supported the market since April 2025.
Cascade effect and forced liquidations (Margin Calls): The correction triggered massive deleveraging. Hedge funds and leveraged traders faced margin calls that forced them to sell positions en masse—not only in tech, but also in defensive sectors (healthcare and consumer staples) to cover losses.
VIX fear index explodes: The Cboe Volatility Index surged an impressive 69.7%, marking its biggest increase in two years and reflecting a clear phase of panic and capitulation across the broader market.
#IA #CryptoNews
$SPYB
$QQQB
$TSMB
3
1.9k

·
--
Bearish
🇺🇸 WALL STREET: TECH SELLOFF WEIGHS ON NASDAQ AND S&P 500
U.S. markets closed mixed as renewed selling in major technology stocks wiped out earlier gains.
📉 Nasdaq: Fell over 1%
📉 S&P 500: Dropped approximately 0.5%
📈 Dow Jones: Gained around 0.4%
Investors shifted away from mega-cap technology stocks, raising concerns about stretched valuations, AI investment returns and broader market sentiment.
Market outlook: Will traditional blue-chip stocks continue outperforming technology shares, or is this just a temporary rotation?
#WallStreet #Nasdaq #SP500 #DowJones #TechStocks #GlobalMarkets #PositiveMindsGlobalResults [ ](https://www.binance.com/square/hashtag/PositiveMindsGlobalResults)#BinanceSquare
🌍 PositiveMindsGlobalResults | Binance Square
INVEST • LEARN • GROW • TOGETHER
🌍 Stay positive. Stay informed. Stay secure!
{spot}(BNBUSDT)
🇺🇸 WALL STREET: TECH SELLOFF WEIGHS ON NASDAQ AND S&P 500
U.S. markets closed mixed as renewed selling in major technology stocks wiped out earlier gains.
📉 Nasdaq: Fell over 1%
📉 S&P 500: Dropped approximately 0.5%
📈 Dow Jones: Gained around 0.4%
Investors shifted away from mega-cap technology stocks, raising concerns about stretched valuations, AI investment returns and broader market sentiment.
Market outlook: Will traditional blue-chip stocks continue outperforming technology shares, or is this just a temporary rotation?
#WallStreet #Nasdaq #SP500 #DowJones #TechStocks #GlobalMarkets #PositiveMindsGlobalResults #BinanceSquare
🌍 PositiveMindsGlobalResults | Binance Square
INVEST • LEARN • GROW • TOGETHER
🌍 Stay positive. Stay informed. Stay secure!
U.S. markets closed mixed as renewed selling in major technology stocks wiped out earlier gains.
📉 Nasdaq: Fell over 1%
📉 S&P 500: Dropped approximately 0.5%
📈 Dow Jones: Gained around 0.4%
Investors shifted away from mega-cap technology stocks, raising concerns about stretched valuations, AI investment returns and broader market sentiment.
Market outlook: Will traditional blue-chip stocks continue outperforming technology shares, or is this just a temporary rotation?
#WallStreet #Nasdaq #SP500 #DowJones #TechStocks #GlobalMarkets #PositiveMindsGlobalResults #BinanceSquare
🌍 PositiveMindsGlobalResults | Binance Square
INVEST • LEARN • GROW • TOGETHER
🌍 Stay positive. Stay informed. Stay secure!
34

·
--
🚀📈 STRONG REBOUND IN THE S&P 500 AND U.S. INDICES
📅 Wednesday, November 4, 2026
Wall Street stages a major upward turn following the U.S. midterm elections.
🔎 WHAT IS DRIVING THE GAINS?
🇺🇸 1. 🤝 TRUMP ACCEPTS THE RESULTS
The president has acknowledged the results, easing fears of a prolonged political confrontation. This has helped improve market sentiment.
🏦 2. FALLING BOND YIELDS
The pullback in U.S. yields is supporting stock valuations, especially in technology.
💻 3. TECH RECOVERY
AMD stands out with strong gains following its growth outlook, boosting optimism in semiconductors.
📊 A MAJOR TURNAROUND
S&P 500 futures fell nearly 1.4% overnight, but later recovered to post gains of more than 1%.
🎯 CONCLUSION
We are seeing a relief rally following the elections, accompanied by buying after the recent declines.
⚠️ The key will be whether the momentum holds during the Wall Street session.
#SP500
🚀📈 STRONG REBOUND IN THE S&P 500 AND U.S. INDICES
📅 Wednesday, November 4, 2026
Wall Street stages a major upward turn following the U.S. midterm elections.
🔎 WHAT IS DRIVING THE GAINS?
🇺🇸 1. 🤝 TRUMP ACCEPTS THE RESULTS
The president has acknowledged the results, easing fears of a prolonged political confrontation. This has helped improve market sentiment.
🏦 2. FALLING BOND YIELDS
The pullback in U.S. yields is supporting stock valuations, especially in technology.
💻 3. TECH RECOVERY
AMD stands out with strong gains following its growth outlook, boosting optimism in semiconductors.
📊 A MAJOR TURNAROUND
S&P 500 futures fell nearly 1.4% overnight, but later recovered to post gains of more than 1%.
🎯 CONCLUSION
We are seeing a relief rally following the elections, accompanied by buying after the recent declines.
⚠️ The key will be whether the momentum holds during the Wall Street session.
#SP500
📅 Wednesday, November 4, 2026
Wall Street stages a major upward turn following the U.S. midterm elections.
🔎 WHAT IS DRIVING THE GAINS?
🇺🇸 1. 🤝 TRUMP ACCEPTS THE RESULTS
The president has acknowledged the results, easing fears of a prolonged political confrontation. This has helped improve market sentiment.
🏦 2. FALLING BOND YIELDS
The pullback in U.S. yields is supporting stock valuations, especially in technology.
💻 3. TECH RECOVERY
AMD stands out with strong gains following its growth outlook, boosting optimism in semiconductors.
📊 A MAJOR TURNAROUND
S&P 500 futures fell nearly 1.4% overnight, but later recovered to post gains of more than 1%.
🎯 CONCLUSION
We are seeing a relief rally following the elections, accompanied by buying after the recent declines.
⚠️ The key will be whether the momentum holds during the Wall Street session.
#SP500
1
104

·
--

Article
🚨 US500 BEARISH — BUT IS A RECOVERY COMING?{future}(XAUUSDT)
🚨 US500 BEARISH — BUT IS A RECOVERY COMING?
The S&P 500 remains below its key EMAs, with RSI at 34.61 and MACD negative.
But there's a twist:
- NAS100: -0.69%
- US30: +0.69%
- VIX: -2.63%
AI spending concerns, US midterm elections and inflation pressure remain key market drivers.
MarketLens Take: Bearish pressure remains, but broad-market confirmation is mixed.
Key levels: Support 7,561 | Pivot 7,601 | Resistance 7,610–7,626.
Will sellers break support, or will buyers step back in?
— MARKETLENS | SEE BEYOND THE PRICE.
#MarketLens #US500 #SP500 #WallStreet #MarketAnalysis
{etf_us}(SQQQ.ETF)
🚨 US500 BEARISH — BUT IS A RECOVERY COMING?
🚨 US500 BEARISH — BUT IS A RECOVERY COMING?
The S&P 500 remains below its key EMAs, with RSI at 34.61 and MACD negative.
But there's a twist:
- NAS100: -0.69%
- US30: +0.69%
- VIX: -2.63%
AI spending concerns, US midterm elections and inflation pressure remain key market drivers.
MarketLens Take: Bearish pressure remains, but broad-market confirmation is mixed.
Key levels: Support 7,561 | Pivot 7,601 | Resistance 7,610–7,626.
Will sellers break support, or will buyers step back in?
— MARKETLENS | SEE BEYOND THE PRICE.
#MarketLens #US500 #SP500 #WallStreet #MarketAnalysis
The S&P 500 remains below its key EMAs, with RSI at 34.61 and MACD negative.
But there's a twist:
- NAS100: -0.69%
- US30: +0.69%
- VIX: -2.63%
AI spending concerns, US midterm elections and inflation pressure remain key market drivers.
MarketLens Take: Bearish pressure remains, but broad-market confirmation is mixed.
Key levels: Support 7,561 | Pivot 7,601 | Resistance 7,610–7,626.
Will sellers break support, or will buyers step back in?
— MARKETLENS | SEE BEYOND THE PRICE.
#MarketLens #US500 #SP500 #WallStreet #MarketAnalysis
XAU+0.05%
SQQQETF-4.76%
1
119
·
--
Verified
Article
S&P 500 at Major Support — Will the U.S. Midterms Trigger Another Sell-Off?The S&P 500 came under strong pressure last week as technology stocks sold off sharply and investors became increasingly concerned about high valuations and the massive amount of capital being committed to AI.
⠀
Now another major catalyst is approaching.
⠀
The U.S. midterm elections take place tomorrow, November 3, and $SPX is entering the event while sitting directly on an important technical support structure.
⠀
For me, this makes the next 24-48 hours especially important.
⠀
Can buyers defend the current Support Zone, or is a move below $7,500 coming next?
⠀
Why the Market Came Under Pressure
⠀
The recent weakness was not simply about one bad economic report.
⠀
Technology and AI-related stocks became the main source of pressure as investors started questioning whether the enormous spending on data centers, chips, and AI infrastructure will generate sufficient returns.
⠀
The S&P 500 Technology sector fell 6.8% during October, while Friday alone brought another sharp 4.2% decline.
⠀
That selling pressure pushed the broader S&P 500 lower and left the market technically much more vulnerable heading into election week.
⠀
U.S. Midterm Elections — What Matters for the Market?
⠀
Election uncertainty is now being added to an already fragile market.
⠀
The latest polling favors Democrats nationally, and analysts currently see them as having a good chance of taking control of the House.
⠀
The Senate remains much more difficult to predict.
⠀
For markets, I do not think the story is simply “Democrats bearish, Republicans bullish.”
⠀
Each scenario has different implications.
⠀
A Democratic sweep could increase expectations for stronger congressional oversight of AI companies, data centers, crypto, and other industries.
⠀
That could create additional uncertainty for technology stocks at a time when the AI trade is already under pressure.
⠀
A Republican sweep could initially reduce concerns about aggressive new regulation and support expectations for tax or defense-policy continuity.
⠀
However, it could also revive concerns about larger fiscal deficits and Treasury yields.
⠀
A divided Congress may limit major policy changes, which markets have historically sometimes viewed positively because political gridlock can reduce the probability of large legislative surprises.
⠀
So for me, the biggest short-term risk is not simply which party wins.
⠀
It is whether the result surprises the market.
⠀
History After Midterm Elections
⠀
Historically, U.S. equities have often performed well after midterm elections.
⠀
Since 1938, the S&P 500 has posted gains during the following 12 months in approximately 95% of midterm cycles, with average returns around 14%.
⠀
One explanation is that election uncertainty begins to disappear once the result is known.
⠀
But history does not guarantee what happens tomorrow.
⠀
The current market is dealing with unusually high technology valuations, AI spending concerns, elevated Treasury yields, and geopolitical uncertainty.
⠀
That is why I am paying more attention to the chart than to historical averages.
⠀
Technical Analysis
⠀
On the 4-hour timeframe, the S&P 500 is attempting to break below the important Support Zone ($7,523-$7,624).
⠀
A small bullish Gap also formed around ($7,587.7-$7,599.4), and I believe this gap could still be filled during a short-term reaction.
⠀
But the larger technical structure remains more concerning.
⠀
From a classical technical analysis perspective, the S&P 500 appears to have formed a clear Head and Shoulders Pattern.
⠀
The Right Shoulder developed with strong bearish momentum toward the Neckline, and price is now testing this critical structure.
⠀
For me, the Neckline is the key.
⠀
As long as buyers cannot recover strongly from this area, the bearish pattern remains active.
⠀
Bearish Scenario
⠀
My main scenario is that election volatility could create sharp moves in both directions before the market chooses its next trend.
⠀
However, a confirmed breakdown below the current Support Zone and Head and Shoulders Neckline would significantly strengthen the bearish setup.
⠀
The first downside target would be the larger Gap ($7,483.6-$7,519.7).
⠀
That area also brings the market close to the psychological $7,500 level and an important Support Line.
⠀
This combination makes approximately $7,500 one of the most important areas I am watching.
⠀
If $7,500 fails with strong bearish momentum, the correction could develop into something deeper rather than remaining a simple election-driven shakeout.
⠀
Bullish Scenario
⠀
There is also a bullish scenario that I do not want to ignore.
⠀
If buyers successfully defend the Support Zone ($7,523-$7,624), fill the smaller Gap, and reclaim the broken structure with strong momentum, the Head and Shoulders breakdown could fail.
⠀
That type of failed breakdown during a high-volatility event could force short sellers to cover and create a sharp relief rally.
⠀
For me, confirmation matters more than trying to predict the election result itself.
⠀
Trade Setup
⠀
Take Profit: $7,519
⠀
Stop Loss: $7,690
⠀
Key Trading Levels:
$7,500
$7,708
⠀
Support Zone:
($7,523-$7,624)
⠀
Small Gap:
($7,587.7-$7,599.4)
⠀
Main Downside Gap:
($7,483.6-$7,519.7)
⠀
Impact on $BTC and $ETH
⠀
This setup is also important for the crypto market.
⠀
Bitcoin and Ethereum remain sensitive to changes in broader risk sentiment, particularly when U.S. equities experience sharp moves.
⠀
If the S&P 500 breaks support and technology stocks come under another wave of selling, I would expect that Risk-Off environment to increase pressure on Bitcoin and Ethereum as well.
⠀
On the other hand, if election uncertainty fades and U.S. equities produce a strong relief rally, crypto could also receive some short-term support.
⠀
My S&P 500 Outlook
⠀
For me, the story is straightforward.
⠀
The market entered election week already weakened by the technology sell-off.
⠀
Now the S&P 500 is sitting on an important Support Zone while a potential Head and Shoulders Pattern is threatening to break its Neckline.
⠀
A short-term reaction is possible, especially around the election.
⠀
But unless buyers successfully reclaim the structure, I continue to see a meaningful risk of a move toward the ($7,483.6-$7,519.7) Gap and the psychological $7,500 area.
⠀
Election results could create False Breakouts and aggressive moves in both directions, so I would rather react to confirmation than predict the first candle.
⠀
Which level will the S&P 500 reach first?
⠀
🔴 $7,519
🟢 $7,690
⠀
#SP500
S&P 500 at Major Support — Will the U.S. Midterms Trigger Another Sell-Off?
The S&P 500 came under strong pressure last week as technology stocks sold off sharply and investors became increasingly concerned about high valuations and the massive amount of capital being committed to AI.
⠀
Now another major catalyst is approaching.
⠀
The U.S. midterm elections take place tomorrow, November 3, and $SPX is entering the event while sitting directly on an important technical support structure.
⠀
For me, this makes the next 24-48 hours especially important.
⠀
Can buyers defend the current Support Zone, or is a move below $7,500 coming next?
⠀
Why the Market Came Under Pressure
⠀
The recent weakness was not simply about one bad economic report.
⠀
Technology and AI-related stocks became the main source of pressure as investors started questioning whether the enormous spending on data centers, chips, and AI infrastructure will generate sufficient returns.
⠀
The S&P 500 Technology sector fell 6.8% during October, while Friday alone brought another sharp 4.2% decline.
⠀
That selling pressure pushed the broader S&P 500 lower and left the market technically much more vulnerable heading into election week.
⠀
U.S. Midterm Elections — What Matters for the Market?
⠀
Election uncertainty is now being added to an already fragile market.
⠀
The latest polling favors Democrats nationally, and analysts currently see them as having a good chance of taking control of the House.
⠀
The Senate remains much more difficult to predict.
⠀
For markets, I do not think the story is simply “Democrats bearish, Republicans bullish.”
⠀
Each scenario has different implications.
⠀
A Democratic sweep could increase expectations for stronger congressional oversight of AI companies, data centers, crypto, and other industries.
⠀
That could create additional uncertainty for technology stocks at a time when the AI trade is already under pressure.
⠀
A Republican sweep could initially reduce concerns about aggressive new regulation and support expectations for tax or defense-policy continuity.
⠀
However, it could also revive concerns about larger fiscal deficits and Treasury yields.
⠀
A divided Congress may limit major policy changes, which markets have historically sometimes viewed positively because political gridlock can reduce the probability of large legislative surprises.
⠀
So for me, the biggest short-term risk is not simply which party wins.
⠀
It is whether the result surprises the market.
⠀
History After Midterm Elections
⠀
Historically, U.S. equities have often performed well after midterm elections.
⠀
Since 1938, the S&P 500 has posted gains during the following 12 months in approximately 95% of midterm cycles, with average returns around 14%.
⠀
One explanation is that election uncertainty begins to disappear once the result is known.
⠀
But history does not guarantee what happens tomorrow.
⠀
The current market is dealing with unusually high technology valuations, AI spending concerns, elevated Treasury yields, and geopolitical uncertainty.
⠀
That is why I am paying more attention to the chart than to historical averages.
⠀
Technical Analysis
⠀
On the 4-hour timeframe, the S&P 500 is attempting to break below the important Support Zone ($7,523-$7,624).
⠀
A small bullish Gap also formed around ($7,587.7-$7,599.4), and I believe this gap could still be filled during a short-term reaction.
⠀
But the larger technical structure remains more concerning.
⠀
From a classical technical analysis perspective, the S&P 500 appears to have formed a clear Head and Shoulders Pattern.
⠀
The Right Shoulder developed with strong bearish momentum toward the Neckline, and price is now testing this critical structure.
⠀
For me, the Neckline is the key.
⠀
As long as buyers cannot recover strongly from this area, the bearish pattern remains active.
⠀
Bearish Scenario
⠀
My main scenario is that election volatility could create sharp moves in both directions before the market chooses its next trend.
⠀
However, a confirmed breakdown below the current Support Zone and Head and Shoulders Neckline would significantly strengthen the bearish setup.
⠀
The first downside target would be the larger Gap ($7,483.6-$7,519.7).
⠀
That area also brings the market close to the psychological $7,500 level and an important Support Line.
⠀
This combination makes approximately $7,500 one of the most important areas I am watching.
⠀
If $7,500 fails with strong bearish momentum, the correction could develop into something deeper rather than remaining a simple election-driven shakeout.
⠀
Bullish Scenario
⠀
There is also a bullish scenario that I do not want to ignore.
⠀
If buyers successfully defend the Support Zone ($7,523-$7,624), fill the smaller Gap, and reclaim the broken structure with strong momentum, the Head and Shoulders breakdown could fail.
⠀
That type of failed breakdown during a high-volatility event could force short sellers to cover and create a sharp relief rally.
⠀
For me, confirmation matters more than trying to predict the election result itself.
⠀
Trade Setup
⠀
Take Profit: $7,519
⠀
Stop Loss: $7,690
⠀
Key Trading Levels:
$7,500
$7,708
⠀
Support Zone:
($7,523-$7,624)
⠀
Small Gap:
($7,587.7-$7,599.4)
⠀
Main Downside Gap:
($7,483.6-$7,519.7)
⠀
Impact on $BTC and $ETH
⠀
This setup is also important for the crypto market.
⠀
Bitcoin and Ethereum remain sensitive to changes in broader risk sentiment, particularly when U.S. equities experience sharp moves.
⠀
If the S&P 500 breaks support and technology stocks come under another wave of selling, I would expect that Risk-Off environment to increase pressure on Bitcoin and Ethereum as well.
⠀
On the other hand, if election uncertainty fades and U.S. equities produce a strong relief rally, crypto could also receive some short-term support.
⠀
My S&P 500 Outlook
⠀
For me, the story is straightforward.
⠀
The market entered election week already weakened by the technology sell-off.
⠀
Now the S&P 500 is sitting on an important Support Zone while a potential Head and Shoulders Pattern is threatening to break its Neckline.
⠀
A short-term reaction is possible, especially around the election.
⠀
But unless buyers successfully reclaim the structure, I continue to see a meaningful risk of a move toward the ($7,483.6-$7,519.7) Gap and the psychological $7,500 area.
⠀
Election results could create False Breakouts and aggressive moves in both directions, so I would rather react to confirmation than predict the first candle.
⠀
Which level will the S&P 500 reach first?
⠀
🔴 $7,519
🟢 $7,690
⠀
#SP500
⠀
Now another major catalyst is approaching.
⠀
The U.S. midterm elections take place tomorrow, November 3, and $SPX is entering the event while sitting directly on an important technical support structure.
⠀
For me, this makes the next 24-48 hours especially important.
⠀
Can buyers defend the current Support Zone, or is a move below $7,500 coming next?
⠀
Why the Market Came Under Pressure
⠀
The recent weakness was not simply about one bad economic report.
⠀
Technology and AI-related stocks became the main source of pressure as investors started questioning whether the enormous spending on data centers, chips, and AI infrastructure will generate sufficient returns.
⠀
The S&P 500 Technology sector fell 6.8% during October, while Friday alone brought another sharp 4.2% decline.
⠀
That selling pressure pushed the broader S&P 500 lower and left the market technically much more vulnerable heading into election week.
⠀
U.S. Midterm Elections — What Matters for the Market?
⠀
Election uncertainty is now being added to an already fragile market.
⠀
The latest polling favors Democrats nationally, and analysts currently see them as having a good chance of taking control of the House.
⠀
The Senate remains much more difficult to predict.
⠀
For markets, I do not think the story is simply “Democrats bearish, Republicans bullish.”
⠀
Each scenario has different implications.
⠀
A Democratic sweep could increase expectations for stronger congressional oversight of AI companies, data centers, crypto, and other industries.
⠀
That could create additional uncertainty for technology stocks at a time when the AI trade is already under pressure.
⠀
A Republican sweep could initially reduce concerns about aggressive new regulation and support expectations for tax or defense-policy continuity.
⠀
However, it could also revive concerns about larger fiscal deficits and Treasury yields.
⠀
A divided Congress may limit major policy changes, which markets have historically sometimes viewed positively because political gridlock can reduce the probability of large legislative surprises.
⠀
So for me, the biggest short-term risk is not simply which party wins.
⠀
It is whether the result surprises the market.
⠀
History After Midterm Elections
⠀
Historically, U.S. equities have often performed well after midterm elections.
⠀
Since 1938, the S&P 500 has posted gains during the following 12 months in approximately 95% of midterm cycles, with average returns around 14%.
⠀
One explanation is that election uncertainty begins to disappear once the result is known.
⠀
But history does not guarantee what happens tomorrow.
⠀
The current market is dealing with unusually high technology valuations, AI spending concerns, elevated Treasury yields, and geopolitical uncertainty.
⠀
That is why I am paying more attention to the chart than to historical averages.
⠀
Technical Analysis
⠀
On the 4-hour timeframe, the S&P 500 is attempting to break below the important Support Zone ($7,523-$7,624).
⠀
A small bullish Gap also formed around ($7,587.7-$7,599.4), and I believe this gap could still be filled during a short-term reaction.
⠀
But the larger technical structure remains more concerning.
⠀
From a classical technical analysis perspective, the S&P 500 appears to have formed a clear Head and Shoulders Pattern.
⠀
The Right Shoulder developed with strong bearish momentum toward the Neckline, and price is now testing this critical structure.
⠀
For me, the Neckline is the key.
⠀
As long as buyers cannot recover strongly from this area, the bearish pattern remains active.
⠀
Bearish Scenario
⠀
My main scenario is that election volatility could create sharp moves in both directions before the market chooses its next trend.
⠀
However, a confirmed breakdown below the current Support Zone and Head and Shoulders Neckline would significantly strengthen the bearish setup.
⠀
The first downside target would be the larger Gap ($7,483.6-$7,519.7).
⠀
That area also brings the market close to the psychological $7,500 level and an important Support Line.
⠀
This combination makes approximately $7,500 one of the most important areas I am watching.
⠀
If $7,500 fails with strong bearish momentum, the correction could develop into something deeper rather than remaining a simple election-driven shakeout.
⠀
Bullish Scenario
⠀
There is also a bullish scenario that I do not want to ignore.
⠀
If buyers successfully defend the Support Zone ($7,523-$7,624), fill the smaller Gap, and reclaim the broken structure with strong momentum, the Head and Shoulders breakdown could fail.
⠀
That type of failed breakdown during a high-volatility event could force short sellers to cover and create a sharp relief rally.
⠀
For me, confirmation matters more than trying to predict the election result itself.
⠀
Trade Setup
⠀
Take Profit: $7,519
⠀
Stop Loss: $7,690
⠀
Key Trading Levels:
$7,500
$7,708
⠀
Support Zone:
($7,523-$7,624)
⠀
Small Gap:
($7,587.7-$7,599.4)
⠀
Main Downside Gap:
($7,483.6-$7,519.7)
⠀
Impact on $BTC and $ETH
⠀
This setup is also important for the crypto market.
⠀
Bitcoin and Ethereum remain sensitive to changes in broader risk sentiment, particularly when U.S. equities experience sharp moves.
⠀
If the S&P 500 breaks support and technology stocks come under another wave of selling, I would expect that Risk-Off environment to increase pressure on Bitcoin and Ethereum as well.
⠀
On the other hand, if election uncertainty fades and U.S. equities produce a strong relief rally, crypto could also receive some short-term support.
⠀
My S&P 500 Outlook
⠀
For me, the story is straightforward.
⠀
The market entered election week already weakened by the technology sell-off.
⠀
Now the S&P 500 is sitting on an important Support Zone while a potential Head and Shoulders Pattern is threatening to break its Neckline.
⠀
A short-term reaction is possible, especially around the election.
⠀
But unless buyers successfully reclaim the structure, I continue to see a meaningful risk of a move toward the ($7,483.6-$7,519.7) Gap and the psychological $7,500 area.
⠀
Election results could create False Breakouts and aggressive moves in both directions, so I would rather react to confirmation than predict the first candle.
⠀
Which level will the S&P 500 reach first?
⠀
🔴 $7,519
🟢 $7,690
⠀
#SP500
1
2
567

·
--
Bullish
🚨 S&P 500: Is a Major Correction Coming?
The weekly chart is showing some warning signs that investors shouldn't ignore.
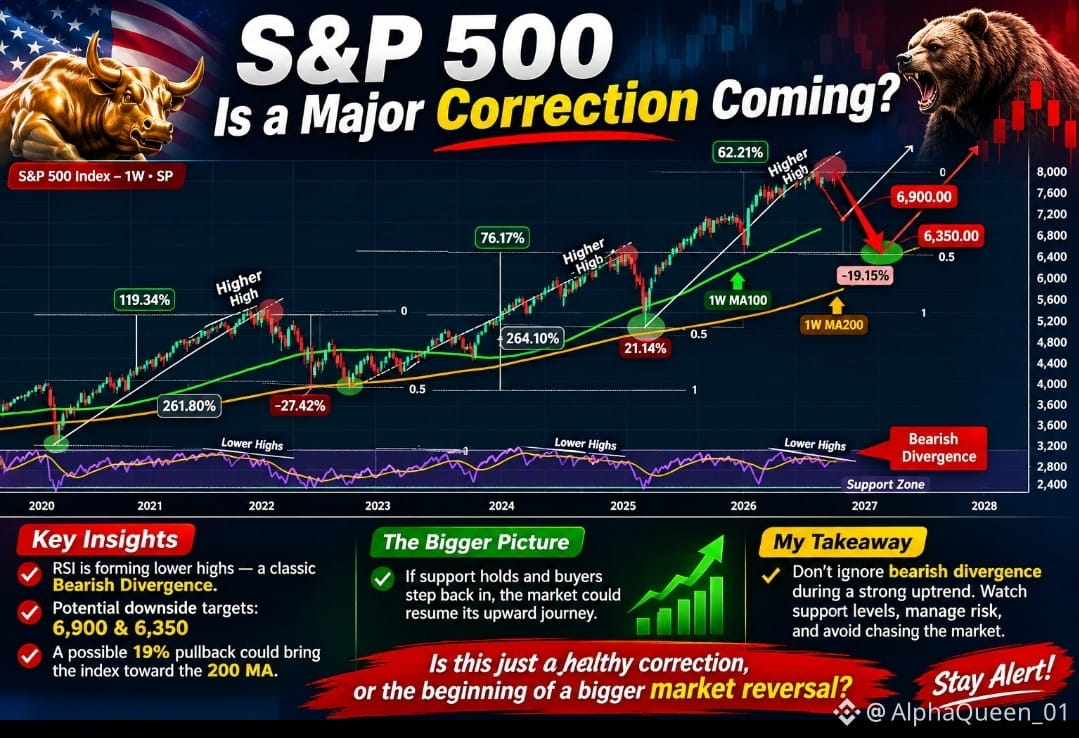
The S&P 500 continues to print higher highs, but the RSI is forming lower highs — a classic Bearish Divergence.
Here’s what the chart suggests:
📉 6,900 – First potential downside target.
📉 6,350 – Major support zone and a possible deeper correction.
📊 A potential 19% pullback could bring the index toward its long-term moving average support.
However, the bigger bullish trend isn't necessarily over. If support holds and buyers step back in, the market could resume its upward journey toward new highs.
My takeaway: Don't ignore bearish divergence during a strong uptrend. Watch support levels, manage risk, and avoid chasing the market at the top.
Is this just a healthy correction, or the beginning of a bigger market reversal?
#SP500 #StockMarket #Trading #MarketAnalysis #Investing
🚨 S&P 500: Is a Major Correction Coming?
The weekly chart is showing some warning signs that investors shouldn't ignore.
The S&P 500 continues to print higher highs, but the RSI is forming lower highs — a classic Bearish Divergence.
Here’s what the chart suggests:
📉 6,900 – First potential downside target.
📉 6,350 – Major support zone and a possible deeper correction.
📊 A potential 19% pullback could bring the index toward its long-term moving average support.
However, the bigger bullish trend isn't necessarily over. If support holds and buyers step back in, the market could resume its upward journey toward new highs.
My takeaway: Don't ignore bearish divergence during a strong uptrend. Watch support levels, manage risk, and avoid chasing the market at the top.
Is this just a healthy correction, or the beginning of a bigger market reversal?
#SP500 #StockMarket #Trading #MarketAnalysis #Investing
The weekly chart is showing some warning signs that investors shouldn't ignore.
The S&P 500 continues to print higher highs, but the RSI is forming lower highs — a classic Bearish Divergence.
Here’s what the chart suggests:
📉 6,900 – First potential downside target.
📉 6,350 – Major support zone and a possible deeper correction.
📊 A potential 19% pullback could bring the index toward its long-term moving average support.
However, the bigger bullish trend isn't necessarily over. If support holds and buyers step back in, the market could resume its upward journey toward new highs.
My takeaway: Don't ignore bearish divergence during a strong uptrend. Watch support levels, manage risk, and avoid chasing the market at the top.
Is this just a healthy correction, or the beginning of a bigger market reversal?
#SP500 #StockMarket #Trading #MarketAnalysis #Investing
2
173

·
--
Okta is joining the S&P 500. The identity authentication company has finally been “authenticated” as a large-cap stock 😂
Official announcement from S&P Dow Jones Indices on 10-30:
1️⃣ Okta (OKTA) is being promoted from the S&P MidCap 400, effective before the market opens on November 4
2️⃣ It will replace Kenvue (KVUE), as Kimberly-Clark is acquiring it
3️⃣ One out, one in: Consumer Staples out, Information Technology in
My take:
The S&P 500 is essentially an automatic stock-replacement machine. Companies that get acquired or fall behind leave; those that grow enter. You don’t have to pick stocks—the index handles the elimination round for you. That’s one reason I’ve never been bearish on the broader U.S. stock market.
Okta’s own story is also timely: the more AI agents there are, the more valuable it becomes to know “who is logging in and who has access.” The identity layer is the gatekeeper of the agent era. MarketWatch noted that its share price has more than doubled this year.
A reminder: Index inclusion leads to rebalancing by passive funds, but gains after an announcement are often priced in ahead of time. Volatility can be significant around the effective date, so don’t treat “joining the S&P” as a no-brainer buy signal.
For screening purposes only, not investment advice.
Sources: Official S&P Dow Jones Indices press release (2026-10-30), MarketWatch
#美股 #SP500 #Okta #AI
Okta is joining the S&P 500. The identity authentication company has finally been “authenticated” as a large-cap stock 😂
Official announcement from S&P Dow Jones Indices on 10-30:
1️⃣ Okta (OKTA) is being promoted from the S&P MidCap 400, effective before the market opens on November 4
2️⃣ It will replace Kenvue (KVUE), as Kimberly-Clark is acquiring it
3️⃣ One out, one in: Consumer Staples out, Information Technology in
My take:
The S&P 500 is essentially an automatic stock-replacement machine. Companies that get acquired or fall behind leave; those that grow enter. You don’t have to pick stocks—the index handles the elimination round for you. That’s one reason I’ve never been bearish on the broader U.S. stock market.
Okta’s own story is also timely: the more AI agents there are, the more valuable it becomes to know “who is logging in and who has access.” The identity layer is the gatekeeper of the agent era. MarketWatch noted that its share price has more than doubled this year.
A reminder: Index inclusion leads to rebalancing by passive funds, but gains after an announcement are often priced in ahead of time. Volatility can be significant around the effective date, so don’t treat “joining the S&P” as a no-brainer buy signal.
For screening purposes only, not investment advice.
Sources: Official S&P Dow Jones Indices press release (2026-10-30), MarketWatch
#美股 #SP500 #Okta #AI
Official announcement from S&P Dow Jones Indices on 10-30:
1️⃣ Okta (OKTA) is being promoted from the S&P MidCap 400, effective before the market opens on November 4
2️⃣ It will replace Kenvue (KVUE), as Kimberly-Clark is acquiring it
3️⃣ One out, one in: Consumer Staples out, Information Technology in
My take:
The S&P 500 is essentially an automatic stock-replacement machine. Companies that get acquired or fall behind leave; those that grow enter. You don’t have to pick stocks—the index handles the elimination round for you. That’s one reason I’ve never been bearish on the broader U.S. stock market.
Okta’s own story is also timely: the more AI agents there are, the more valuable it becomes to know “who is logging in and who has access.” The identity layer is the gatekeeper of the agent era. MarketWatch noted that its share price has more than doubled this year.
A reminder: Index inclusion leads to rebalancing by passive funds, but gains after an announcement are often priced in ahead of time. Volatility can be significant around the effective date, so don’t treat “joining the S&P” as a no-brainer buy signal.
For screening purposes only, not investment advice.
Sources: Official S&P Dow Jones Indices press release (2026-10-30), MarketWatch
#美股 #SP500 #Okta #AI
KVUEUS0.00%
OKTAUS-0.97%
66

·
--
Verified
The S&P 500 is becoming a market of winners and losers, and investors may need to rethink their strategy.
Societe Generale data shows around 40% of possible S&P 500 stock pairs are negatively correlated, with overall correlations below historical norms.
That could create more opportunities for stock pickers and diversification, but index gains may hide growing gaps between individual companies.
Is this a golden opportunity for selective investors, or a warning that market uncertainty is rising?
#SP500 #Stocks #Investing
$MAGMA
{future}(MAGMAUSDT)
$HYPE
{future}(HYPEUSDT)
$LSK
{future}(LSKUSDT)
The S&P 500 is becoming a market of winners and losers, and investors may need to rethink their strategy.
Societe Generale data shows around 40% of possible S&P 500 stock pairs are negatively correlated, with overall correlations below historical norms.
That could create more opportunities for stock pickers and diversification, but index gains may hide growing gaps between individual companies.
Is this a golden opportunity for selective investors, or a warning that market uncertainty is rising?
#SP500 #Stocks #Investing
$MAGMA
$HYPE
$LSK
Societe Generale data shows around 40% of possible S&P 500 stock pairs are negatively correlated, with overall correlations below historical norms.
That could create more opportunities for stock pickers and diversification, but index gains may hide growing gaps between individual companies.
Is this a golden opportunity for selective investors, or a warning that market uncertainty is rising?
#SP500 #Stocks #Investing
$MAGMA
$HYPE
$LSK
1
629

FOMC NOISE. US MARKET EXPANSION. 🚀
So many uncertainties, endless “ifs and buts” around the FOMC timeline.
But sometimes, the biggest opportunities emerge when everyone is busy overthinking the next move.
Forget the noise. Forget the distractions.
Not just Altcoins. Not just Crypto. Let's turn the entire US market bullish. 📈
🎯 S&P 500 E-mini Futures — 7,819.50
This is the upside level on my chart. Price is currently trading around 7,778, with 7,749.50 marked as a key level to watch.
Now, let's see whether the market can build enough momentum to push higher. Confirmation matters — no blind entries, no unnecessary FOMO.
Stay focused. Respect the levels. Let price action do the talking.
— Ali Trading
#SP500 #FOMC #USMarketss #PriceAction #TradingViewTips #AliTrading
FOMC NOISE. US MARKET EXPANSION. 🚀
So many uncertainties, endless “ifs and buts” around the FOMC timeline.
But sometimes, the biggest opportunities emerge when everyone is busy overthinking the next move.
Forget the noise. Forget the distractions.
Not just Altcoins. Not just Crypto. Let's turn the entire US market bullish. 📈
🎯 S&P 500 E-mini Futures — 7,819.50
This is the upside level on my chart. Price is currently trading around 7,778, with 7,749.50 marked as a key level to watch.
Now, let's see whether the market can build enough momentum to push higher. Confirmation matters — no blind entries, no unnecessary FOMO.
Stay focused. Respect the levels. Let price action do the talking.
— Ali Trading
#SP500 #FOMC #USMarketss #PriceAction #TradingViewTips #AliTrading
So many uncertainties, endless “ifs and buts” around the FOMC timeline.
But sometimes, the biggest opportunities emerge when everyone is busy overthinking the next move.
Forget the noise. Forget the distractions.
Not just Altcoins. Not just Crypto. Let's turn the entire US market bullish. 📈
🎯 S&P 500 E-mini Futures — 7,819.50
This is the upside level on my chart. Price is currently trading around 7,778, with 7,749.50 marked as a key level to watch.
Now, let's see whether the market can build enough momentum to push higher. Confirmation matters — no blind entries, no unnecessary FOMO.
Stay focused. Respect the levels. Let price action do the talking.
— Ali Trading
#SP500 #FOMC #USMarketss #PriceAction #TradingViewTips #AliTrading
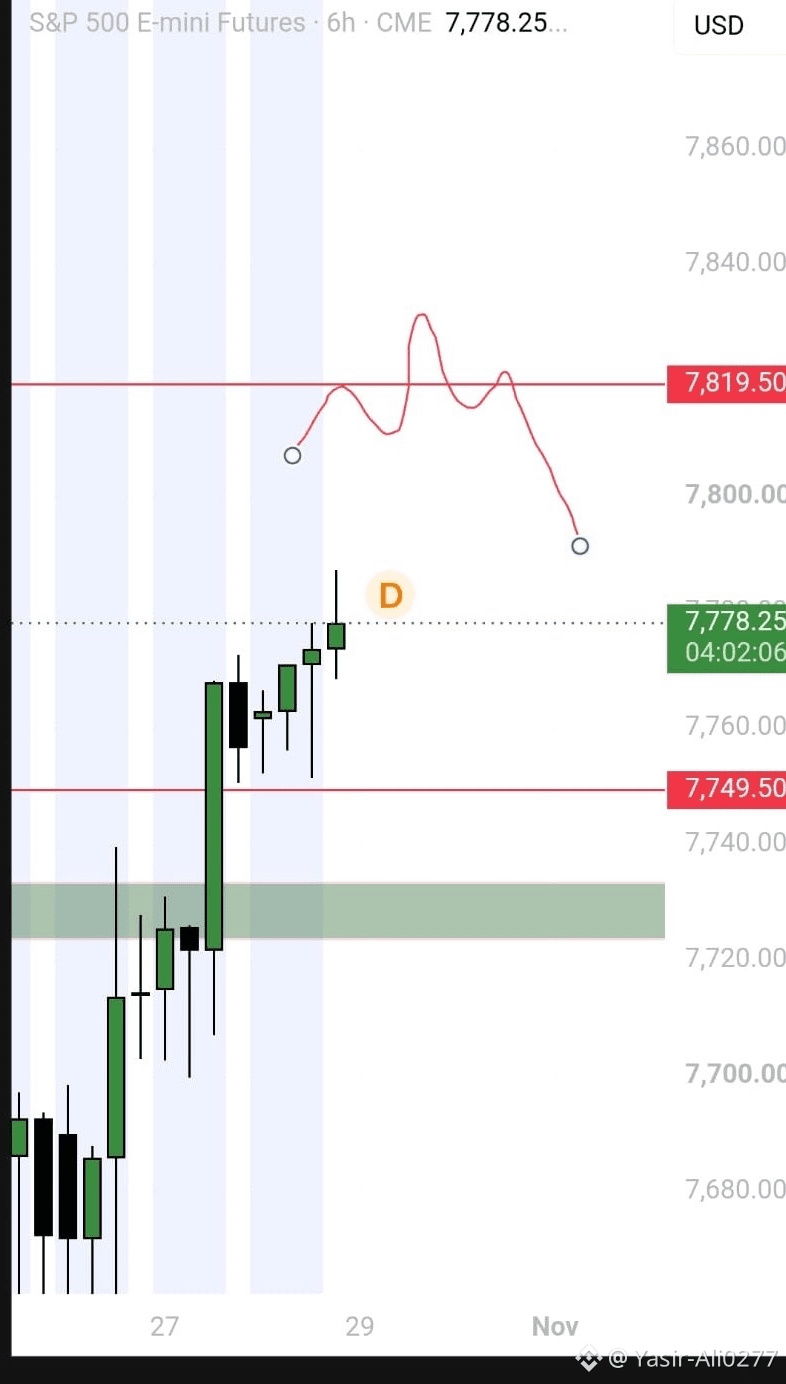
95

·
--
📊 U.S. stocks gain US$ 540 billion in just one hour! 🚀
The U.S. stock market recorded a significant jump, adding US$ 540 billion in market value in just one hour. The move came after the decision to suspend planned attacks on Iran, which triggered a strong recovery in major global indexes.
📈 Index Highlights:
* S&P 500: Rose 0.83%
* Nasdaq: Gained 1.38%
* Dow Jones: Rose 0.50%
Technology stocks led the relief rally, with major names surging:
* Tesla: +6.48%
* Broadcom: +3.09%
* Nvidia: +3.01%
💡 A thought for the crypto market: Easing geopolitical tensions and a boost in optimism across traditional markets often affect global risk appetite.
#MacroEconomics #BolsaDeValores #SP500
📊 U.S. stocks gain US$ 540 billion in just one hour! 🚀
The U.S. stock market recorded a significant jump, adding US$ 540 billion in market value in just one hour. The move came after the decision to suspend planned attacks on Iran, which triggered a strong recovery in major global indexes.
📈 Index Highlights:
* S&P 500: Rose 0.83%
* Nasdaq: Gained 1.38%
* Dow Jones: Rose 0.50%
Technology stocks led the relief rally, with major names surging:
* Tesla: +6.48%
* Broadcom: +3.09%
* Nvidia: +3.01%
💡 A thought for the crypto market: Easing geopolitical tensions and a boost in optimism across traditional markets often affect global risk appetite.
#MacroEconomics #BolsaDeValores #SP500
The U.S. stock market recorded a significant jump, adding US$ 540 billion in market value in just one hour. The move came after the decision to suspend planned attacks on Iran, which triggered a strong recovery in major global indexes.
📈 Index Highlights:
* S&P 500: Rose 0.83%
* Nasdaq: Gained 1.38%
* Dow Jones: Rose 0.50%
Technology stocks led the relief rally, with major names surging:
* Tesla: +6.48%
* Broadcom: +3.09%
* Nvidia: +3.01%
💡 A thought for the crypto market: Easing geopolitical tensions and a boost in optimism across traditional markets often affect global risk appetite.
#MacroEconomics #BolsaDeValores #SP500
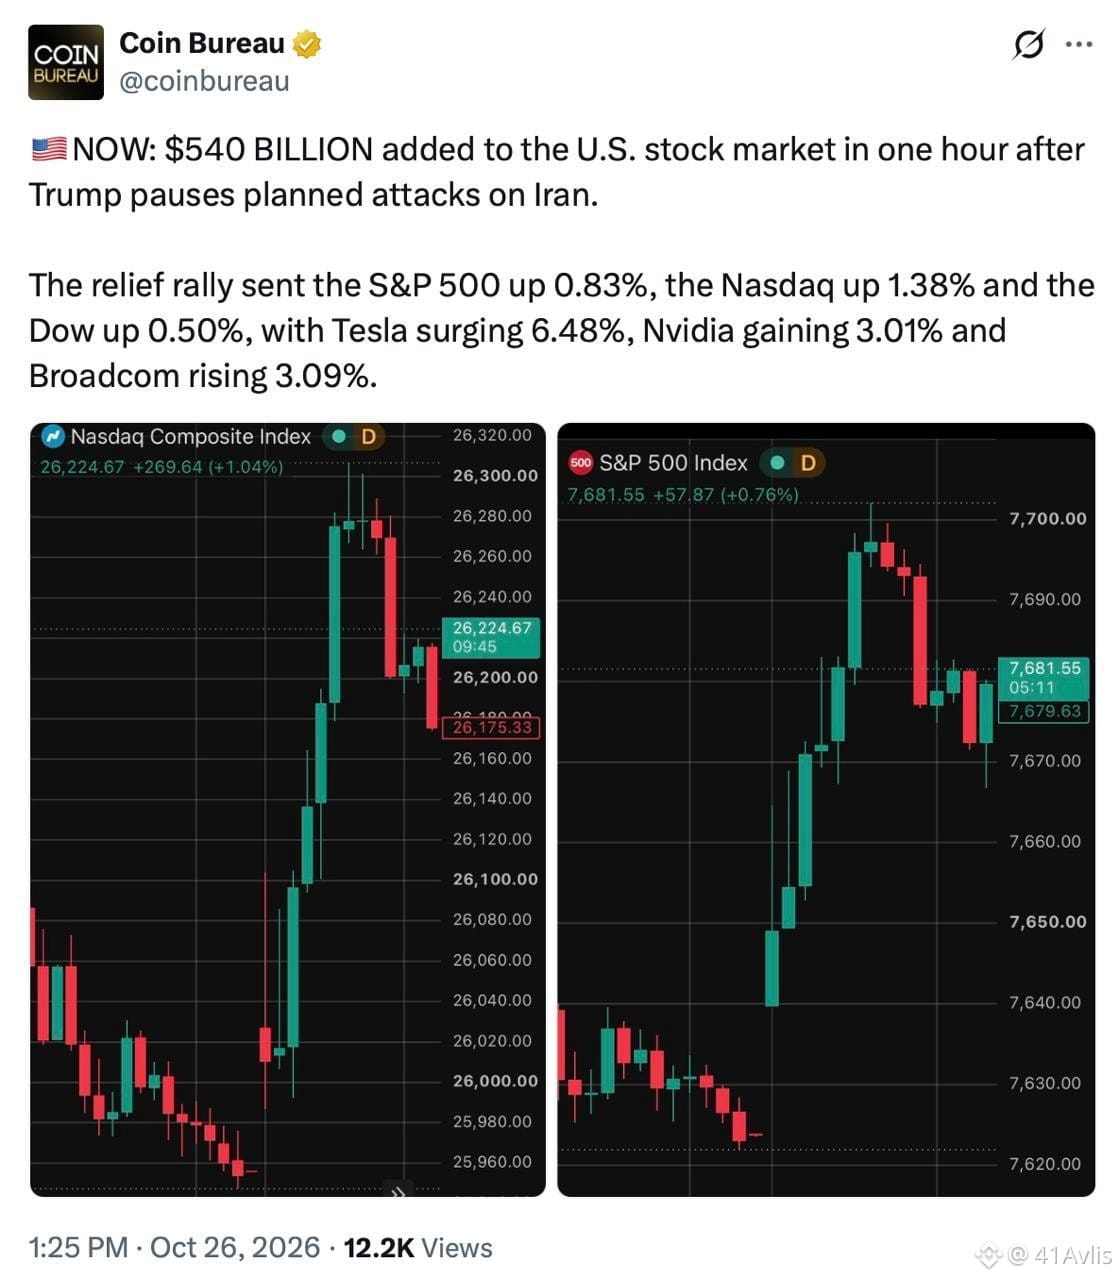
68
#binancepick 🌍 S&P 500 Braces for a Storm
Investor anxiety is rising ahead of major corporate earnings reports and the upcoming Federal Reserve meeting. Heavy reliance on a small group of mega-cap companies adds risk, making market direction sensitive to earnings surprises, Fed signals, and interest-rate expectations.
#SP500 #StockMarket #WallStreet #MarketVolatility #EarningsSeason #FederalReserve #FedMeeting #MegaCapStocks #GlobalMarkets #InvestorSentiment #EconomicOutlook #FinancialMarkets #PositiveMindsGlobalResults #BinanceSquare
🌍 PositiveMindsGlobalResults | Binance Square | October 26, 2026
{spot}(BNBUSDT)
#binancepick 🌍 S&P 500 Braces for a Storm
Investor anxiety is rising ahead of major corporate earnings reports and the upcoming Federal Reserve meeting. Heavy reliance on a small group of mega-cap companies adds risk, making market direction sensitive to earnings surprises, Fed signals, and interest-rate expectations.
#SP500 #StockMarket #WallStreet #MarketVolatility #EarningsSeason #FederalReserve #FedMeeting #MegaCapStocks #GlobalMarkets #InvestorSentiment #EconomicOutlook #FinancialMarkets #PositiveMindsGlobalResults #BinanceSquare
🌍 PositiveMindsGlobalResults | Binance Square | October 26, 2026
Investor anxiety is rising ahead of major corporate earnings reports and the upcoming Federal Reserve meeting. Heavy reliance on a small group of mega-cap companies adds risk, making market direction sensitive to earnings surprises, Fed signals, and interest-rate expectations.
#SP500 #StockMarket #WallStreet #MarketVolatility #EarningsSeason #FederalReserve #FedMeeting #MegaCapStocks #GlobalMarkets #InvestorSentiment #EconomicOutlook #FinancialMarkets #PositiveMindsGlobalResults #BinanceSquare
🌍 PositiveMindsGlobalResults | Binance Square | October 26, 2026
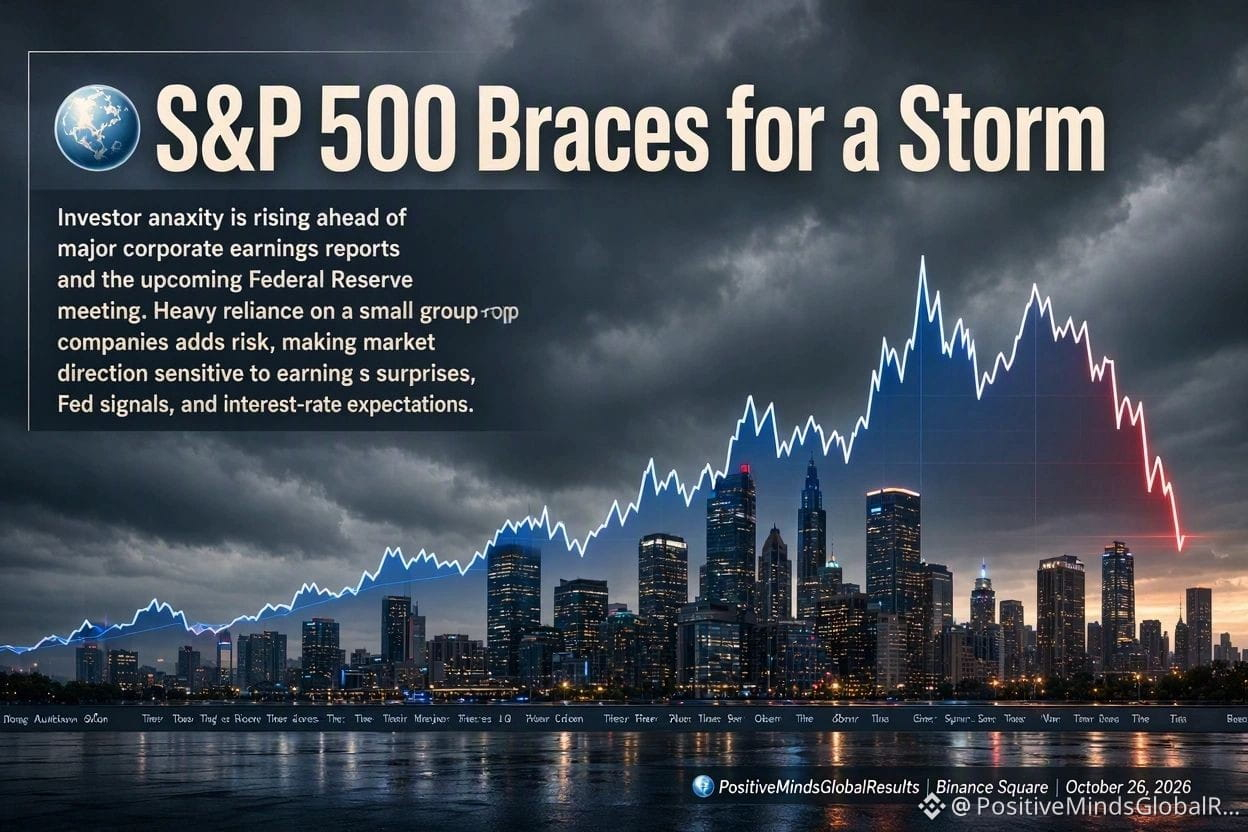
43
·
--
Bearish
Bulls tried 3 times. Market slapped them 3 times! 👋📉
S&P 500: 7,623.68 (-0.52%)
Look at this chart carefully:
1st Try: Price went up, rejected from 7,652 ❌
2nd Try: Tried again, rejected from 7,639 ❌
3rd Try: Last hope, rejected from 7,627 ❌
And that white line 7,635.11?
That was the bulls' last wall. It broke too.
Now the market is saying:
"The party has just started"
Only 2 options left:
A) 7,620 holds and market flies back up
B) 7,620 breaks and we see 7,600
Which team are you on? 👇
Comment: A or B
#SP500 #Trading #PriceAction #StockMarket #Bearish
Bulls tried 3 times. Market slapped them 3 times! 👋📉
S&P 500: 7,623.68 (-0.52%)
Look at this chart carefully:
1st Try: Price went up, rejected from 7,652 ❌
2nd Try: Tried again, rejected from 7,639 ❌
3rd Try: Last hope, rejected from 7,627 ❌
And that white line 7,635.11?
That was the bulls' last wall. It broke too.
Now the market is saying:
"The party has just started"
Only 2 options left:
A) 7,620 holds and market flies back up
B) 7,620 breaks and we see 7,600
Which team are you on? 👇
Comment: A or B
#SP500 #Trading #PriceAction #StockMarket #Bearish
S&P 500: 7,623.68 (-0.52%)
Look at this chart carefully:
1st Try: Price went up, rejected from 7,652 ❌
2nd Try: Tried again, rejected from 7,639 ❌
3rd Try: Last hope, rejected from 7,627 ❌
And that white line 7,635.11?
That was the bulls' last wall. It broke too.
Now the market is saying:
"The party has just started"
Only 2 options left:
A) 7,620 holds and market flies back up
B) 7,620 breaks and we see 7,600
Which team are you on? 👇
Comment: A or B
#SP500 #Trading #PriceAction #StockMarket #Bearish
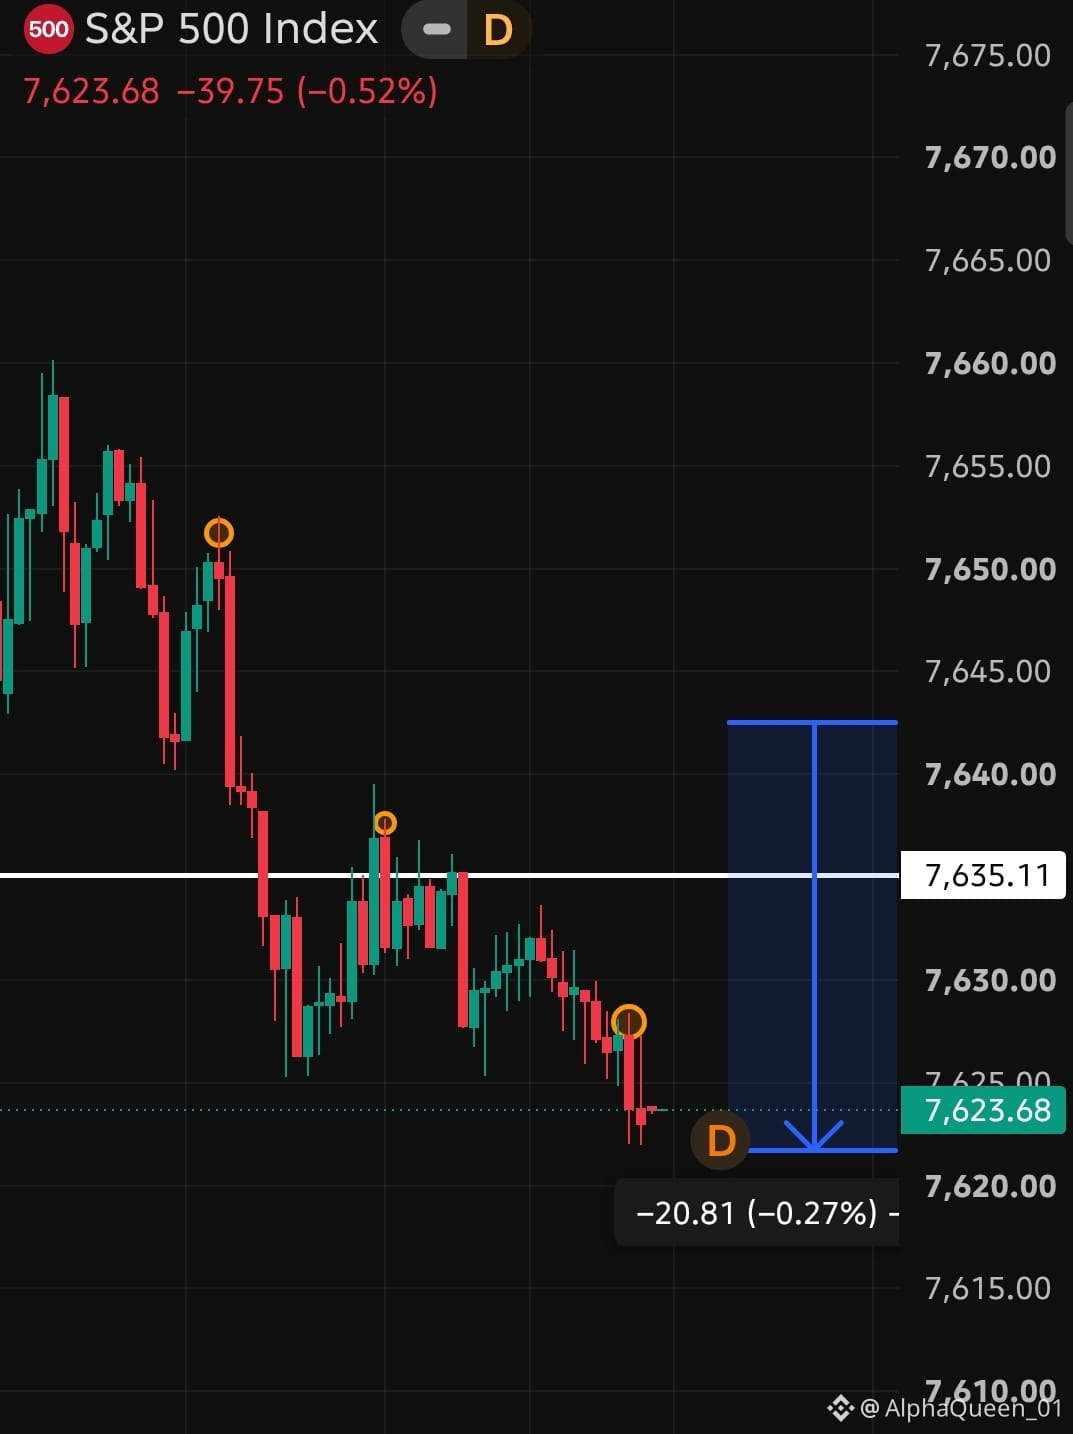
2
2
151
Log in to explore more content
Join global crypto users on Binance Square
⚡️ Get latest and useful information about crypto.
💬 Trusted by the world’s largest crypto exchange.
👍 Discover real insights from verified creators.
Email / Phone number
Trending Topics
1
#JobsReportRaisesHikeOdds
269,296 views
2,113 Discussing
2
#CPITestsDecemberRateOutlook
27,388 views
360 Discussing
3
#BitcoinRebounds$75KAsChipsLead
22,130 views
228 Discussing
4
#US Data Center Rules May Constrain AI Expansion
41,516 views
158 Discussing
5
#ARKPlans14ThematicETFsCoveringAIAndTokenizedMarkets
292 views
11 Discussing
6
#WillAnthropicListOnTime
66,731 views
844 Discussing
7
#WillUS-IranTensionsBoostSafe-HavenDemand?
15,215 views
140 Discussing
8
#BitcoinETFsSee$412MNetOutflows
4,132 views
46 Discussing
9
#HKSFCPlansToRestrictCryptoAndExchangeTerms
14,416 views
260 Discussing
10
#TradFiForBeginners
42,324 views
633 Discussing