

#onchainanalysis
onchainanalysis
859,527 views
2,388 Discussing
Hot
Latest

·
--
Exchange reserve depletion is one of the clearest on-chain signals of an impending supply squeeze — and right now it deserves serious attention.
When BTC balances on centralized exchanges trend lower over weeks or months, it tells you something important: holders are moving coins off-venue into cold storage. They are not selling. That persistent drawdown shrinks the immediately available float, meaning any surge in demand hits thinner order books and produces sharper price moves.
The same dynamic plays out across $ETH and $SOL, but with an added layer. ETH leaving exchanges often flows straight into staking or restaking protocols, permanently locking it from near-term sale. SOL outflows frequently land in validators or DeFi vaults. The supply constraint compounds.
What to watch for:
— Exchange reserves declining for 30+ consecutive days
— Outflows accelerating even during sideways price action
— Illiquid supply ratio rising alongside stablecoin inflows
When those three line up, the setup is not a prediction — it is a structural condition where even modest demand increments can produce outsized moves.
For $BTC, declining exchange reserves signal conviction: holders are staging for long-term positions, not exits.
Track reserves. Track stablecoin dry powder. The price move announces itself last.
$BTC $ETH $SOL
#CryptoInsights #OnChainAnalysis #Bitcoin #BinanceSquare #Crypto
Exchange reserve depletion is one of the clearest on-chain signals of an impending supply squeeze — and right now it deserves serious attention.
When BTC balances on centralized exchanges trend lower over weeks or months, it tells you something important: holders are moving coins off-venue into cold storage. They are not selling. That persistent drawdown shrinks the immediately available float, meaning any surge in demand hits thinner order books and produces sharper price moves.
The same dynamic plays out across $ETH and $SOL , but with an added layer. ETH leaving exchanges often flows straight into staking or restaking protocols, permanently locking it from near-term sale. SOL outflows frequently land in validators or DeFi vaults. The supply constraint compounds.
What to watch for:
— Exchange reserves declining for 30+ consecutive days
— Outflows accelerating even during sideways price action
— Illiquid supply ratio rising alongside stablecoin inflows
When those three line up, the setup is not a prediction — it is a structural condition where even modest demand increments can produce outsized moves.
For $BTC , declining exchange reserves signal conviction: holders are staging for long-term positions, not exits.
Track reserves. Track stablecoin dry powder. The price move announces itself last.
$BTC $ETH $SOL
#CryptoInsights #OnChainAnalysis #Bitcoin #BinanceSquare #Crypto
When BTC balances on centralized exchanges trend lower over weeks or months, it tells you something important: holders are moving coins off-venue into cold storage. They are not selling. That persistent drawdown shrinks the immediately available float, meaning any surge in demand hits thinner order books and produces sharper price moves.
The same dynamic plays out across $ETH and $SOL , but with an added layer. ETH leaving exchanges often flows straight into staking or restaking protocols, permanently locking it from near-term sale. SOL outflows frequently land in validators or DeFi vaults. The supply constraint compounds.
What to watch for:
— Exchange reserves declining for 30+ consecutive days
— Outflows accelerating even during sideways price action
— Illiquid supply ratio rising alongside stablecoin inflows
When those three line up, the setup is not a prediction — it is a structural condition where even modest demand increments can produce outsized moves.
For $BTC , declining exchange reserves signal conviction: holders are staging for long-term positions, not exits.
Track reserves. Track stablecoin dry powder. The price move announces itself last.
$BTC $ETH $SOL
#CryptoInsights #OnChainAnalysis #Bitcoin #BinanceSquare #Crypto
107
·
--
On-chain data has a quirk most traders overlook: whale accumulation often happens quietly during the sideways chop that frustrates retail the most.
When $BTC price compresses into a narrow range for weeks, many retail participants lose patience and exit. But on-chain cohort data tells a different story — addresses holding 100–10,000 BTC tend to increase their balance during these exact consolidation windows. The accumulation doesn't broadcast itself. It shows up as slow, steady exchange outflows and growing illiquid supply, not in the price.
The same dynamic appears in $ETH. Large-cohort staking inflows often spike during low-volatility periods, a signal that conviction holders are locking supply away at precisely the moment sentiment is most neutral.
For $BNB, on-chain staking participation rates serve a similar function — when staking ratios climb without a corresponding price rally, it often means sophisticated holders are positioning, not speculating.
The practical takeaway: before chasing a breakout, check whether the accumulation groundwork was laid. A breakout with pre-existing whale accumulation behind it carries a structurally different risk profile than one driven purely by momentum.
On-chain data isn't a crystal ball. But it is a window into what patient capital is actually doing — and that window is often more honest than price alone.
$BTC $ETH $BNB
#Bitcoin #OnChainAnalysis #CryptoInsights #WhaleTracking #BinanceSquare
On-chain data has a quirk most traders overlook: whale accumulation often happens quietly during the sideways chop that frustrates retail the most.
When $BTC price compresses into a narrow range for weeks, many retail participants lose patience and exit. But on-chain cohort data tells a different story — addresses holding 100–10,000 BTC tend to increase their balance during these exact consolidation windows. The accumulation doesn't broadcast itself. It shows up as slow, steady exchange outflows and growing illiquid supply, not in the price.
The same dynamic appears in $ETH . Large-cohort staking inflows often spike during low-volatility periods, a signal that conviction holders are locking supply away at precisely the moment sentiment is most neutral.
For $BNB , on-chain staking participation rates serve a similar function — when staking ratios climb without a corresponding price rally, it often means sophisticated holders are positioning, not speculating.
The practical takeaway: before chasing a breakout, check whether the accumulation groundwork was laid. A breakout with pre-existing whale accumulation behind it carries a structurally different risk profile than one driven purely by momentum.
On-chain data isn't a crystal ball. But it is a window into what patient capital is actually doing — and that window is often more honest than price alone.
$BTC $ETH $BNB
#Bitcoin #OnChainAnalysis #CryptoInsights #WhaleTracking #BinanceSquare
When $BTC price compresses into a narrow range for weeks, many retail participants lose patience and exit. But on-chain cohort data tells a different story — addresses holding 100–10,000 BTC tend to increase their balance during these exact consolidation windows. The accumulation doesn't broadcast itself. It shows up as slow, steady exchange outflows and growing illiquid supply, not in the price.
The same dynamic appears in $ETH . Large-cohort staking inflows often spike during low-volatility periods, a signal that conviction holders are locking supply away at precisely the moment sentiment is most neutral.
For $BNB , on-chain staking participation rates serve a similar function — when staking ratios climb without a corresponding price rally, it often means sophisticated holders are positioning, not speculating.
The practical takeaway: before chasing a breakout, check whether the accumulation groundwork was laid. A breakout with pre-existing whale accumulation behind it carries a structurally different risk profile than one driven purely by momentum.
On-chain data isn't a crystal ball. But it is a window into what patient capital is actually doing — and that window is often more honest than price alone.
$BTC $ETH $BNB
#Bitcoin #OnChainAnalysis #CryptoInsights #WhaleTracking #BinanceSquare
74
·
--
Long-term holder supply is one of the most underrated signals in crypto cycle analysis and right now it deserves close attention.
On-chain data separates wallets into two behavioral groups: short-term holders (STH), who moved coins within the last 155 days, and long-term holders (LTH), who have held beyond that threshold. Historically, LTH supply peaks at bear market bottoms as patient capital absorbs selling pressure from weaker hands, then begins compressing during bull phases as holders take profit.
The pattern is consistent: when LTH supply crosses above 70% of circulating $BTC supply, it has reliably marked either a bottom or a deep accumulation zone. Conversely, when LTH supply drops sharply, it confirms that a distribution phase is maturing.
What makes this signal powerful is that it reflects conviction, not price action. A wallet that holds through a 70% drawdown is not operating on short-term speculation. That behavior anchors price floors in ways order books cannot.
$ETH shows a similar dynamic through staking lock-up: staked supply is economically equivalent to LTH supply, illiquid, conviction-driven, and structurally price-supportive. $SOL validator staking ratios serve as a useful proxy for the same mechanic across newer L1s.
The takeaway: track LTH supply trends alongside price. Supply structure tells you what smart money is doing, not what it is saying.
#Bitcoin #OnChainAnalysis #CryptoInvesting #LongTermHolder #CycleAnalysis
Long-term holder supply is one of the most underrated signals in crypto cycle analysis and right now it deserves close attention.
On-chain data separates wallets into two behavioral groups: short-term holders (STH), who moved coins within the last 155 days, and long-term holders (LTH), who have held beyond that threshold. Historically, LTH supply peaks at bear market bottoms as patient capital absorbs selling pressure from weaker hands, then begins compressing during bull phases as holders take profit.
The pattern is consistent: when LTH supply crosses above 70% of circulating $BTC supply, it has reliably marked either a bottom or a deep accumulation zone. Conversely, when LTH supply drops sharply, it confirms that a distribution phase is maturing.
What makes this signal powerful is that it reflects conviction, not price action. A wallet that holds through a 70% drawdown is not operating on short-term speculation. That behavior anchors price floors in ways order books cannot.
$ETH shows a similar dynamic through staking lock-up: staked supply is economically equivalent to LTH supply, illiquid, conviction-driven, and structurally price-supportive. $SOL validator staking ratios serve as a useful proxy for the same mechanic across newer L1s.
The takeaway: track LTH supply trends alongside price. Supply structure tells you what smart money is doing, not what it is saying.
#Bitcoin #OnChainAnalysis #CryptoInvesting #LongTermHolder #CycleAnalysis
On-chain data separates wallets into two behavioral groups: short-term holders (STH), who moved coins within the last 155 days, and long-term holders (LTH), who have held beyond that threshold. Historically, LTH supply peaks at bear market bottoms as patient capital absorbs selling pressure from weaker hands, then begins compressing during bull phases as holders take profit.
The pattern is consistent: when LTH supply crosses above 70% of circulating $BTC supply, it has reliably marked either a bottom or a deep accumulation zone. Conversely, when LTH supply drops sharply, it confirms that a distribution phase is maturing.
What makes this signal powerful is that it reflects conviction, not price action. A wallet that holds through a 70% drawdown is not operating on short-term speculation. That behavior anchors price floors in ways order books cannot.
$ETH shows a similar dynamic through staking lock-up: staked supply is economically equivalent to LTH supply, illiquid, conviction-driven, and structurally price-supportive. $SOL validator staking ratios serve as a useful proxy for the same mechanic across newer L1s.
The takeaway: track LTH supply trends alongside price. Supply structure tells you what smart money is doing, not what it is saying.
#Bitcoin #OnChainAnalysis #CryptoInvesting #LongTermHolder #CycleAnalysis
30

·
--
#Ethereum
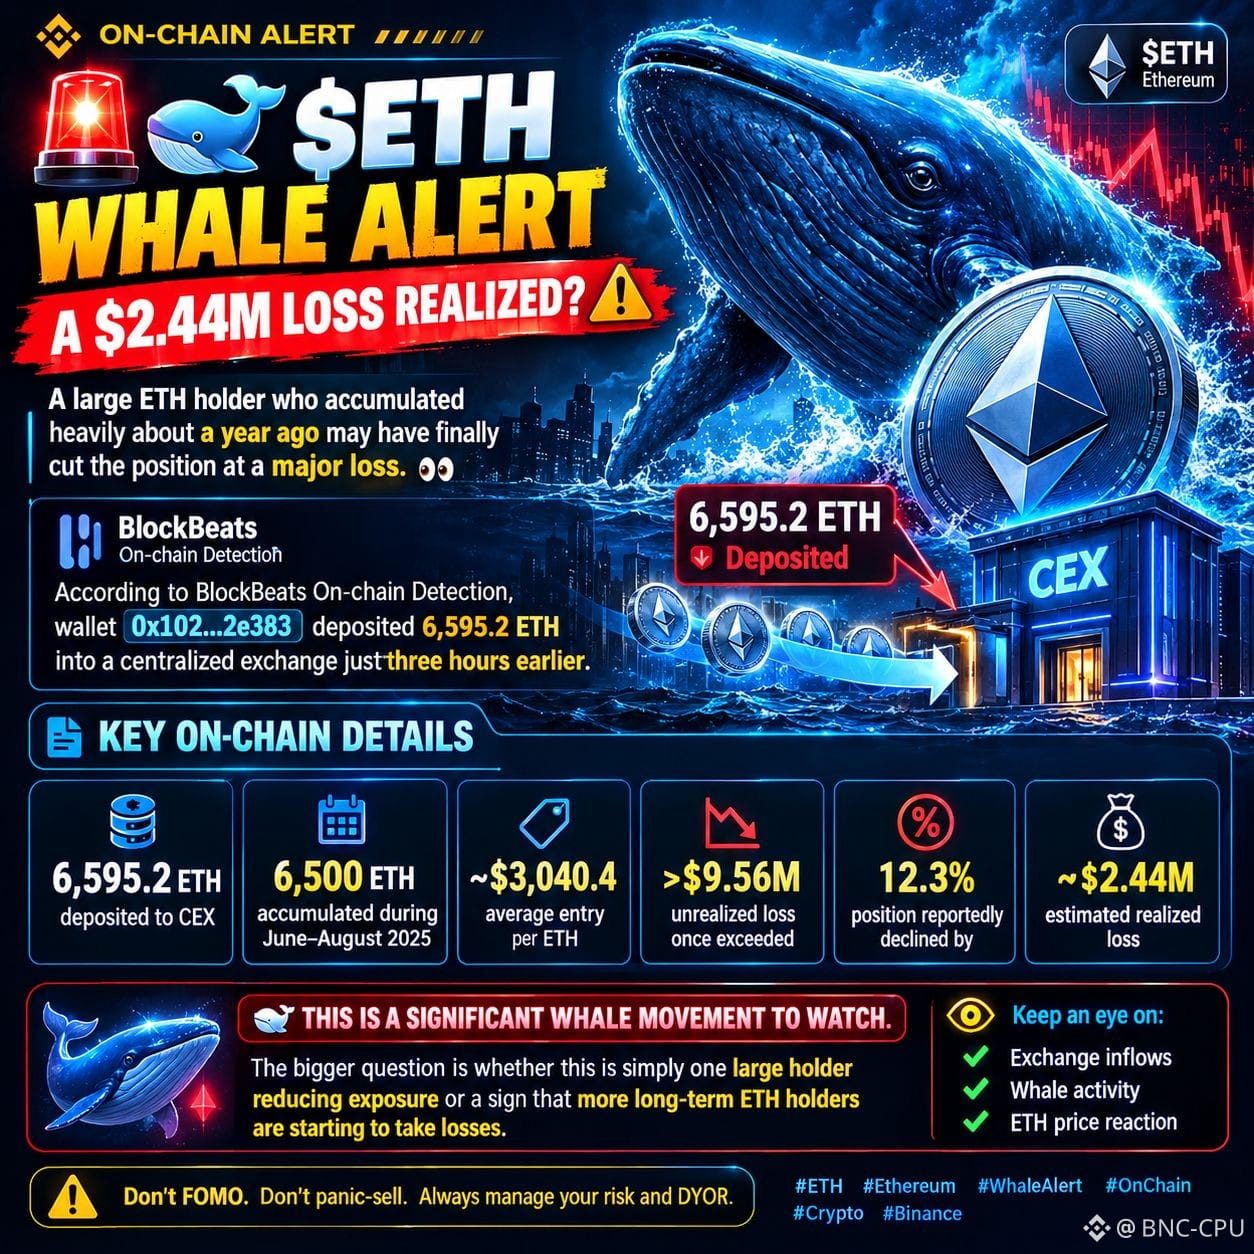
🚨🐋 $ETH WHALE ALERT — A $2.44M LOSS REALIZED?
A large ETH holder who accumulated heavily about a year ago may have finally cut the position at a major loss. 👀
According to BlockBeats On-chain Detection, wallet 0x102…2e383 deposited 6,595.2 ETH into a centralized exchange just three hours earlier.
Key On-Chain Details: • 6,595.2 ETH deposited to CEX
• 6,500 ETH accumulated during June–August 2025
• Average entry: ~$3,040.4 per ETH
• Unrealized loss once exceeded $9.56M
• Position reportedly declined by 12.3%
• Estimated realized loss: ~$2.44M
This is a significant whale movement to watch.
The bigger question is whether this is simply one large holder reducing exposure or a sign that more long-term ETH holders are starting to take losses.
👀 Keep an eye on exchange inflows, whale activity and ETH price reaction.
#WhaleAlert #ETH #OnChainAnalysis
#Ethereum
🚨🐋 $ETH WHALE ALERT — A $2.44M LOSS REALIZED?
A large ETH holder who accumulated heavily about a year ago may have finally cut the position at a major loss. 👀
According to BlockBeats On-chain Detection, wallet 0x102…2e383 deposited 6,595.2 ETH into a centralized exchange just three hours earlier.
Key On-Chain Details: • 6,595.2 ETH deposited to CEX
• 6,500 ETH accumulated during June–August 2025
• Average entry: ~$3,040.4 per ETH
• Unrealized loss once exceeded $9.56M
• Position reportedly declined by 12.3%
• Estimated realized loss: ~$2.44M
This is a significant whale movement to watch.
The bigger question is whether this is simply one large holder reducing exposure or a sign that more long-term ETH holders are starting to take losses.
👀 Keep an eye on exchange inflows, whale activity and ETH price reaction.
#WhaleAlert #ETH #OnChainAnalysis
🚨🐋 $ETH WHALE ALERT — A $2.44M LOSS REALIZED?
A large ETH holder who accumulated heavily about a year ago may have finally cut the position at a major loss. 👀
According to BlockBeats On-chain Detection, wallet 0x102…2e383 deposited 6,595.2 ETH into a centralized exchange just three hours earlier.
Key On-Chain Details: • 6,595.2 ETH deposited to CEX
• 6,500 ETH accumulated during June–August 2025
• Average entry: ~$3,040.4 per ETH
• Unrealized loss once exceeded $9.56M
• Position reportedly declined by 12.3%
• Estimated realized loss: ~$2.44M
This is a significant whale movement to watch.
The bigger question is whether this is simply one large holder reducing exposure or a sign that more long-term ETH holders are starting to take losses.
👀 Keep an eye on exchange inflows, whale activity and ETH price reaction.
#WhaleAlert #ETH #OnChainAnalysis
76
·
--
Whale wallets don't lie — on-chain accumulation patterns are one of the most reliable signals in crypto.
When large, dormant addresses start moving funds from exchanges to self-custody wallets, it typically signals conviction buying, not trading. The opposite — exchange inflows from whale addresses — often precedes sell pressure. This isn't insider information; it's publicly verifiable behavior on-chain.
The nuance most people miss: it's not just the size of the move, it's the pattern. A single whale moving $50M once is noise. The same wallet accumulating steadily over 4–6 weeks during sideways price action? That's signal.
$BTC historically shows this most cleanly — long-term holder supply has compressed during every major bear market bottom, even as retail sentiment was at its worst. $ETH shows it through staking inflows: validators don't unstake lightly. $ADA also has traceable foundation wallet movements that the patient observer can monitor.
Practical takeaway: bookmark a blockchain explorer. Watch a few known whale addresses. When they quietly accumulate over weeks, price often follows — months later.
On-chain is the only financial market where the big players' moves are fully transparent. Use it.
#OnChainAnalysis #CryptoInsights #WhaleWatching #BlockchainData #CryptoStrategy
Whale wallets don't lie — on-chain accumulation patterns are one of the most reliable signals in crypto.
When large, dormant addresses start moving funds from exchanges to self-custody wallets, it typically signals conviction buying, not trading. The opposite — exchange inflows from whale addresses — often precedes sell pressure. This isn't insider information; it's publicly verifiable behavior on-chain.
The nuance most people miss: it's not just the size of the move, it's the pattern. A single whale moving $50M once is noise. The same wallet accumulating steadily over 4–6 weeks during sideways price action? That's signal.
$BTC historically shows this most cleanly — long-term holder supply has compressed during every major bear market bottom, even as retail sentiment was at its worst. $ETH shows it through staking inflows: validators don't unstake lightly. $ADA also has traceable foundation wallet movements that the patient observer can monitor.
Practical takeaway: bookmark a blockchain explorer. Watch a few known whale addresses. When they quietly accumulate over weeks, price often follows — months later.
On-chain is the only financial market where the big players' moves are fully transparent. Use it.
#OnChainAnalysis #CryptoInsights #WhaleWatching #BlockchainData #CryptoStrategy
When large, dormant addresses start moving funds from exchanges to self-custody wallets, it typically signals conviction buying, not trading. The opposite — exchange inflows from whale addresses — often precedes sell pressure. This isn't insider information; it's publicly verifiable behavior on-chain.
The nuance most people miss: it's not just the size of the move, it's the pattern. A single whale moving $50M once is noise. The same wallet accumulating steadily over 4–6 weeks during sideways price action? That's signal.
$BTC historically shows this most cleanly — long-term holder supply has compressed during every major bear market bottom, even as retail sentiment was at its worst. $ETH shows it through staking inflows: validators don't unstake lightly. $ADA also has traceable foundation wallet movements that the patient observer can monitor.
Practical takeaway: bookmark a blockchain explorer. Watch a few known whale addresses. When they quietly accumulate over weeks, price often follows — months later.
On-chain is the only financial market where the big players' moves are fully transparent. Use it.
#OnChainAnalysis #CryptoInsights #WhaleWatching #BlockchainData #CryptoStrategy
152
·
--
Validator economics are a leading indicator most traders ignore.
When staking yields compress — not because of price, but because participation rates spike — it signals something important: long-term holders are locking capital away. They are not selling. They are committing to network security in exchange for modest yield. That is structurally bullish, not neutral.
On $ETH, staking participation above 25% of total supply means over a quarter of all ETH is earning yield rather than sitting idle or being traded. Each new validator added is a holder making a multi-month commitment. Watch the entry queue length: a long queue means demand to stake exceeds onboarding capacity — that is conviction showing up on-chain before it shows up in price.
$DOT and $ADA take this further with on-chain governance: staked tokens vote. A rising participation rate in governance proposals signals an engaged community — often a precursor to ecosystem activity surges.
The thesis: validator revenue health + staking queue depth + governance participation = three underused on-chain signals that map network conviction before the market prices it in.
Price action gets the headlines. Stake-rate trends get the edge.
Stake-rate trends deserve a place in your macro dashboard alongside price and volume.
#CryptoInsights #OnChainAnalysis #Staking #Web3 #BinanceSquare
Validator economics are a leading indicator most traders ignore.
When staking yields compress — not because of price, but because participation rates spike — it signals something important: long-term holders are locking capital away. They are not selling. They are committing to network security in exchange for modest yield. That is structurally bullish, not neutral.
On $ETH , staking participation above 25% of total supply means over a quarter of all ETH is earning yield rather than sitting idle or being traded. Each new validator added is a holder making a multi-month commitment. Watch the entry queue length: a long queue means demand to stake exceeds onboarding capacity — that is conviction showing up on-chain before it shows up in price.
$DOT and $ADA take this further with on-chain governance: staked tokens vote. A rising participation rate in governance proposals signals an engaged community — often a precursor to ecosystem activity surges.
The thesis: validator revenue health + staking queue depth + governance participation = three underused on-chain signals that map network conviction before the market prices it in.
Price action gets the headlines. Stake-rate trends get the edge.
Stake-rate trends deserve a place in your macro dashboard alongside price and volume.
#CryptoInsights #OnChainAnalysis #Staking #Web3 #BinanceSquare
When staking yields compress — not because of price, but because participation rates spike — it signals something important: long-term holders are locking capital away. They are not selling. They are committing to network security in exchange for modest yield. That is structurally bullish, not neutral.
On $ETH , staking participation above 25% of total supply means over a quarter of all ETH is earning yield rather than sitting idle or being traded. Each new validator added is a holder making a multi-month commitment. Watch the entry queue length: a long queue means demand to stake exceeds onboarding capacity — that is conviction showing up on-chain before it shows up in price.
$DOT and $ADA take this further with on-chain governance: staked tokens vote. A rising participation rate in governance proposals signals an engaged community — often a precursor to ecosystem activity surges.
The thesis: validator revenue health + staking queue depth + governance participation = three underused on-chain signals that map network conviction before the market prices it in.
Price action gets the headlines. Stake-rate trends get the edge.
Stake-rate trends deserve a place in your macro dashboard alongside price and volume.
#CryptoInsights #OnChainAnalysis #Staking #Web3 #BinanceSquare
132

·
--
Last week as $BTC began sliding, coins quietly started leaving the exchanges instead of piling in.
Most traders see that red chart and dump their bags out of fear, locking in losses while the real accumulation happens off-platform and they miss the eventual bounce.
From September 22 to 24 major exchanges including Binance recorded about $2.52 billion in net $BTC outflows. Price weakened at the same time available supply tightened, creating a clear divergence that often gets ignored in the heat of a dip.
This setup echoes the 2022 lows when similar outflows continued through falling prices and later fueled a multi-month recovery as coins moved into cold storage. Competing assets like $ETH and $SOL frequently show the opposite pattern with inflows during those windows as traders chase quicker plays.
The lesson is that a dropping price plus shrinking exchange supply usually means holders are positioning long-term rather than distributing, which can reduce sell pressure and set up a sharper move once buyers return.
Where do you think this $BTC divergence heads next?
#Bitcoin #BTC #OnChainAnalysis
Last week as $BTC began sliding, coins quietly started leaving the exchanges instead of piling in.
Most traders see that red chart and dump their bags out of fear, locking in losses while the real accumulation happens off-platform and they miss the eventual bounce.
From September 22 to 24 major exchanges including Binance recorded about $2.52 billion in net $BTC outflows. Price weakened at the same time available supply tightened, creating a clear divergence that often gets ignored in the heat of a dip.
This setup echoes the 2022 lows when similar outflows continued through falling prices and later fueled a multi-month recovery as coins moved into cold storage. Competing assets like $ETH and $SOL frequently show the opposite pattern with inflows during those windows as traders chase quicker plays.
The lesson is that a dropping price plus shrinking exchange supply usually means holders are positioning long-term rather than distributing, which can reduce sell pressure and set up a sharper move once buyers return.
Where do you think this $BTC divergence heads next?
#Bitcoin #BTC #OnChainAnalysis
Most traders see that red chart and dump their bags out of fear, locking in losses while the real accumulation happens off-platform and they miss the eventual bounce.
From September 22 to 24 major exchanges including Binance recorded about $2.52 billion in net $BTC outflows. Price weakened at the same time available supply tightened, creating a clear divergence that often gets ignored in the heat of a dip.
This setup echoes the 2022 lows when similar outflows continued through falling prices and later fueled a multi-month recovery as coins moved into cold storage. Competing assets like $ETH and $SOL frequently show the opposite pattern with inflows during those windows as traders chase quicker plays.
The lesson is that a dropping price plus shrinking exchange supply usually means holders are positioning long-term rather than distributing, which can reduce sell pressure and set up a sharper move once buyers return.
Where do you think this $BTC divergence heads next?
#Bitcoin #BTC #OnChainAnalysis
144

everyone thinks we're in the early innings of a massive altcoin bull run but actually there are some real caution flags that most people are sleeping on.
ngl watching your alts dump after fomo buying at local tops is brutal. you end up not knowing when to exit and just holding bags hoping for a bounce that never comes.
looking at the current market as a case study, altcoin exchange deposit transactions are at levels last seen around october 2025. although the dollar value remains below previous bull-cycle levels it still signals potential selling intent.
meanwhile altcoin open interest has barely grown which makes this look less like a leverage-driven blow-off in $ETH $SOL or other majors.
ser this doesn't scream euphoria to me. more like a trap for late buyers while $BTC holds it down.
anyone else seeing this and thinking we might be closer to a local top than we realize?
#altseason #onchainanalysis #crypto
everyone thinks we're in the early innings of a massive altcoin bull run but actually there are some real caution flags that most people are sleeping on.
ngl watching your alts dump after fomo buying at local tops is brutal. you end up not knowing when to exit and just holding bags hoping for a bounce that never comes.
looking at the current market as a case study, altcoin exchange deposit transactions are at levels last seen around october 2025. although the dollar value remains below previous bull-cycle levels it still signals potential selling intent.
meanwhile altcoin open interest has barely grown which makes this look less like a leverage-driven blow-off in $ETH $SOL or other majors.
ser this doesn't scream euphoria to me. more like a trap for late buyers while $BTC holds it down.
anyone else seeing this and thinking we might be closer to a local top than we realize?
#altseason #onchainanalysis #crypto
ngl watching your alts dump after fomo buying at local tops is brutal. you end up not knowing when to exit and just holding bags hoping for a bounce that never comes.
looking at the current market as a case study, altcoin exchange deposit transactions are at levels last seen around october 2025. although the dollar value remains below previous bull-cycle levels it still signals potential selling intent.
meanwhile altcoin open interest has barely grown which makes this look less like a leverage-driven blow-off in $ETH $SOL or other majors.
ser this doesn't scream euphoria to me. more like a trap for late buyers while $BTC holds it down.
anyone else seeing this and thinking we might be closer to a local top than we realize?
#altseason #onchainanalysis #crypto

43

·
--
Bitcoin's "Bull Score" just hit 90/100 — but there's a catch 📊
CryptoQuant's Bull Score reached 90 after BTC broke above its 365-day moving average. Looks as bullish as it gets.
But apparent demand (new coins mined vs. coins moved after a year+) has fallen ~170,000 BTC over 30 days. The market's absorbing fewer coins than being created.
Strong momentum signal, fading demand underneath — that's the tension right now.
Context: BTC's up 6.12% this month, on track for its best quarter since Q4 2024, with Fed hike odds for October below 50%.
Which do you trust more — the momentum score or the demand data?
$BTC
{spot}(BTCUSDT)
$ETH
{spot}(ETHUSDT)
#bitcoin #CryptoMarket #OnChainAnalysis
Bitcoin's "Bull Score" just hit 90/100 — but there's a catch 📊
CryptoQuant's Bull Score reached 90 after BTC broke above its 365-day moving average. Looks as bullish as it gets.
But apparent demand (new coins mined vs. coins moved after a year+) has fallen ~170,000 BTC over 30 days. The market's absorbing fewer coins than being created.
Strong momentum signal, fading demand underneath — that's the tension right now.
Context: BTC's up 6.12% this month, on track for its best quarter since Q4 2024, with Fed hike odds for October below 50%.
Which do you trust more — the momentum score or the demand data?
$BTC
$ETH
#bitcoin #CryptoMarket #OnChainAnalysis
CryptoQuant's Bull Score reached 90 after BTC broke above its 365-day moving average. Looks as bullish as it gets.
But apparent demand (new coins mined vs. coins moved after a year+) has fallen ~170,000 BTC over 30 days. The market's absorbing fewer coins than being created.
Strong momentum signal, fading demand underneath — that's the tension right now.
Context: BTC's up 6.12% this month, on track for its best quarter since Q4 2024, with Fed hike odds for October below 50%.
Which do you trust more — the momentum score or the demand data?
$BTC
$ETH
#bitcoin #CryptoMarket #OnChainAnalysis

84
·
--
Every coin carries a quiet piece of metadata: the date it last moved.
On-chain analysts call it coin age. Most traders ignore it. They shouldn't.
Coins that haven't moved in 12+ months belong, almost by definition, to hands that don't panic. They survived previous drawdowns without selling. That supply is inert — until it isn't. When old coins suddenly wake up and move to exchanges, it's rarely noise: long-term holders have historically been the most patient sellers, and their activity marks regime changes more reliably than any indicator.
This is what makes on-chain behavior unique among market data. Price tells you what people think. Coin age tells you what people actually did — and how long they've been willing to sit on a position.
The composition of supply is a slow-moving variable, but it's the one that determines whether a rally has fuel. Newer coins churn through fast hands and amplify volatility. Old coins are the ballast. Watch the ratio, not the hype.
One nuance: staking changes the picture. On PoS networks, locked tokens distort dormancy metrics — a coin can be 'old' simply because it's earning yield. Read the mechanism before reading the metric.
Blockchains don't forget. They log every holder's patience or panic, in real time. That's the most honest behavioral dataset in markets.
$BTC $ETH $ADA
#OnChainAnalysis #Bitcoin #CryptoInsights #Blockchain #Crypto
Every coin carries a quiet piece of metadata: the date it last moved.
On-chain analysts call it coin age. Most traders ignore it. They shouldn't.
Coins that haven't moved in 12+ months belong, almost by definition, to hands that don't panic. They survived previous drawdowns without selling. That supply is inert — until it isn't. When old coins suddenly wake up and move to exchanges, it's rarely noise: long-term holders have historically been the most patient sellers, and their activity marks regime changes more reliably than any indicator.
This is what makes on-chain behavior unique among market data. Price tells you what people think. Coin age tells you what people actually did — and how long they've been willing to sit on a position.
The composition of supply is a slow-moving variable, but it's the one that determines whether a rally has fuel. Newer coins churn through fast hands and amplify volatility. Old coins are the ballast. Watch the ratio, not the hype.
One nuance: staking changes the picture. On PoS networks, locked tokens distort dormancy metrics — a coin can be 'old' simply because it's earning yield. Read the mechanism before reading the metric.
Blockchains don't forget. They log every holder's patience or panic, in real time. That's the most honest behavioral dataset in markets.
$BTC $ETH $ADA
#OnChainAnalysis #Bitcoin #CryptoInsights #Blockchain #Crypto
On-chain analysts call it coin age. Most traders ignore it. They shouldn't.
Coins that haven't moved in 12+ months belong, almost by definition, to hands that don't panic. They survived previous drawdowns without selling. That supply is inert — until it isn't. When old coins suddenly wake up and move to exchanges, it's rarely noise: long-term holders have historically been the most patient sellers, and their activity marks regime changes more reliably than any indicator.
This is what makes on-chain behavior unique among market data. Price tells you what people think. Coin age tells you what people actually did — and how long they've been willing to sit on a position.
The composition of supply is a slow-moving variable, but it's the one that determines whether a rally has fuel. Newer coins churn through fast hands and amplify volatility. Old coins are the ballast. Watch the ratio, not the hype.
One nuance: staking changes the picture. On PoS networks, locked tokens distort dormancy metrics — a coin can be 'old' simply because it's earning yield. Read the mechanism before reading the metric.
Blockchains don't forget. They log every holder's patience or panic, in real time. That's the most honest behavioral dataset in markets.
$BTC $ETH $ADA
#OnChainAnalysis #Bitcoin #CryptoInsights #Blockchain #Crypto
139

·
--

Article
🔍 The “Secret Trick” Whales Use to Buy Before Anyone Else 🐋📊🔍 The “Secret Trick” Whales Use to Buy Before Anyone Else 🐋📊
Have you ever sold a cryptocurrency and right after the price exploded upward? Or did you buy while it was going up, and five minutes later the market crashed?
It’s not bad luck. What happens is that traditional candlestick charts show the past, while analyzing on-chain metrics (On-Chain Data) shows what institutions are doing in real time on the blockchain.
Today I’ll share 3 key indicators you should check before opening any trade.
🔍 The “Secret Trick” Whales Use to Buy Before Anyone Else 🐋📊
🔍 The “Secret Trick” Whales Use to Buy Before Anyone Else 🐋📊
Have you ever sold a cryptocurrency and right after the price exploded upward? Or did you buy while it was going up, and five minutes later the market crashed?
It’s not bad luck. What happens is that traditional candlestick charts show the past, while analyzing on-chain metrics (On-Chain Data) shows what institutions are doing in real time on the blockchain.
Today I’ll share 3 key indicators you should check before opening any trade.
Have you ever sold a cryptocurrency and right after the price exploded upward? Or did you buy while it was going up, and five minutes later the market crashed?
It’s not bad luck. What happens is that traditional candlestick charts show the past, while analyzing on-chain metrics (On-Chain Data) shows what institutions are doing in real time on the blockchain.
Today I’ll share 3 key indicators you should check before opening any trade.
Angie Gastelun eP45:
muy buen dato arriba !!!
1
3
18
6.9k

·
--
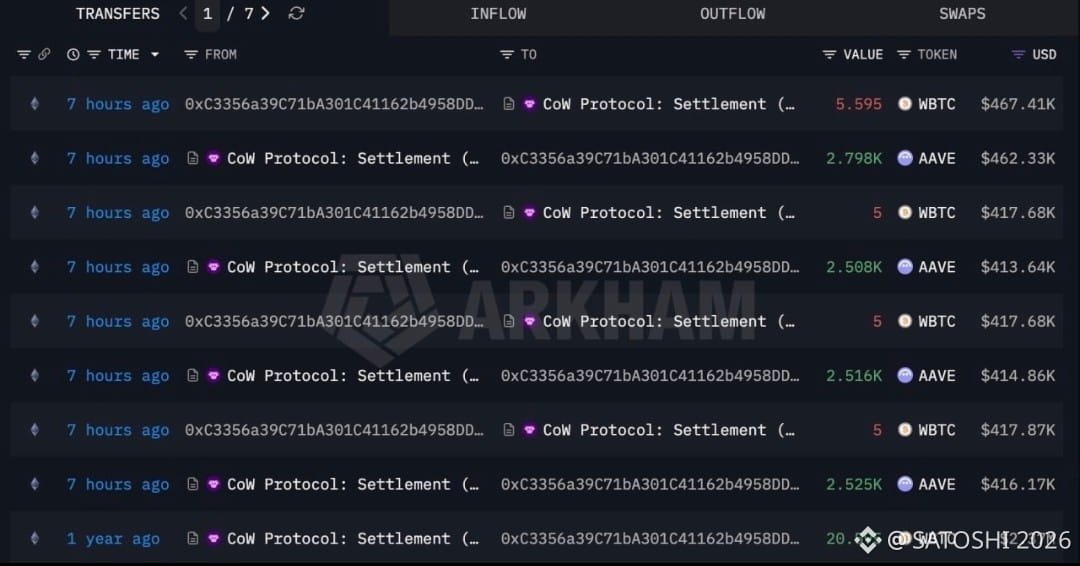
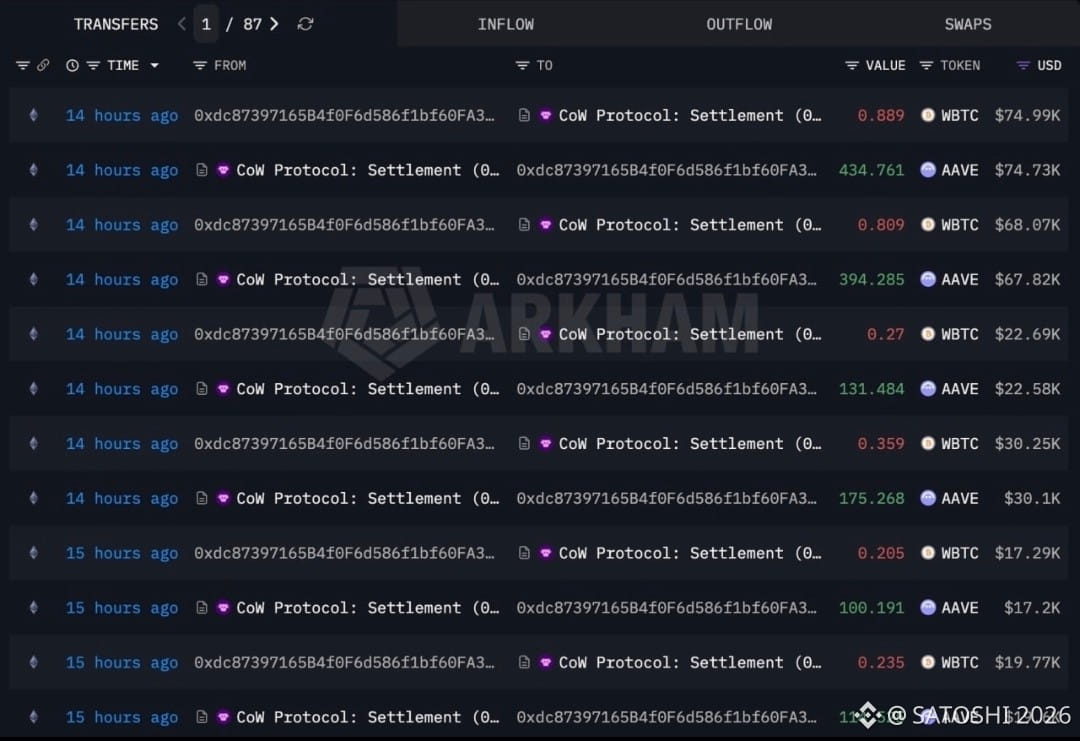
🚀 Escape in DeFi: Why did big whales swap WBTC for $4.26M worth of AAVE tokens?
Global on-chain monitoring recorded the launch of an institutional capital rotation. While retail traders hold Bitcoin, two hidden wallets executed a coordinated maneuver, converting wrapped assets into a leading DeFi instrument.
• Anatomy.
The logs show a synchronized liquidity exchange. Two large investors fully closed their positions by taking 50.95 $WBTC out of circulation, for a total financial value of over $4.26 million.
• Accumulation.
All the released funds were surgically directed to absorb the supply in the decentralized lending sector. The whales bought up from the order book 25 502 $AAVE with an average entry of $167 per token.
$AAVE
{future}(AAVEUSDT)
Subscribe to the channel—here we break down the moves of large capital without boring theory or market illusions! 🚀
#AAVE #WBTC #Arkham #WhaleAlert #DeFi #SmartMoney #OnchainAnalysis #BinanceSquare
🚀 Escape in DeFi: Why did big whales swap WBTC for $4.26M worth of AAVE tokens?
Global on-chain monitoring recorded the launch of an institutional capital rotation. While retail traders hold Bitcoin, two hidden wallets executed a coordinated maneuver, converting wrapped assets into a leading DeFi instrument.
• Anatomy.
The logs show a synchronized liquidity exchange. Two large investors fully closed their positions by taking 50.95 $WBTC out of circulation, for a total financial value of over $4.26 million.
• Accumulation.
All the released funds were surgically directed to absorb the supply in the decentralized lending sector. The whales bought up from the order book 25 502 $AAVE with an average entry of $167 per token.
$AAVE
Subscribe to the channel—here we break down the moves of large capital without boring theory or market illusions! 🚀
#AAVE #WBTC #Arkham #WhaleAlert #DeFi #SmartMoney #OnchainAnalysis #BinanceSquare
Global on-chain monitoring recorded the launch of an institutional capital rotation. While retail traders hold Bitcoin, two hidden wallets executed a coordinated maneuver, converting wrapped assets into a leading DeFi instrument.
• Anatomy.
The logs show a synchronized liquidity exchange. Two large investors fully closed their positions by taking 50.95 $WBTC out of circulation, for a total financial value of over $4.26 million.
• Accumulation.
All the released funds were surgically directed to absorb the supply in the decentralized lending sector. The whales bought up from the order book 25 502 $AAVE with an average entry of $167 per token.
$AAVE
Subscribe to the channel—here we break down the moves of large capital without boring theory or market illusions! 🚀
#AAVE #WBTC #Arkham #WhaleAlert #DeFi #SmartMoney #OnchainAnalysis #BinanceSquare

1
151
·
--
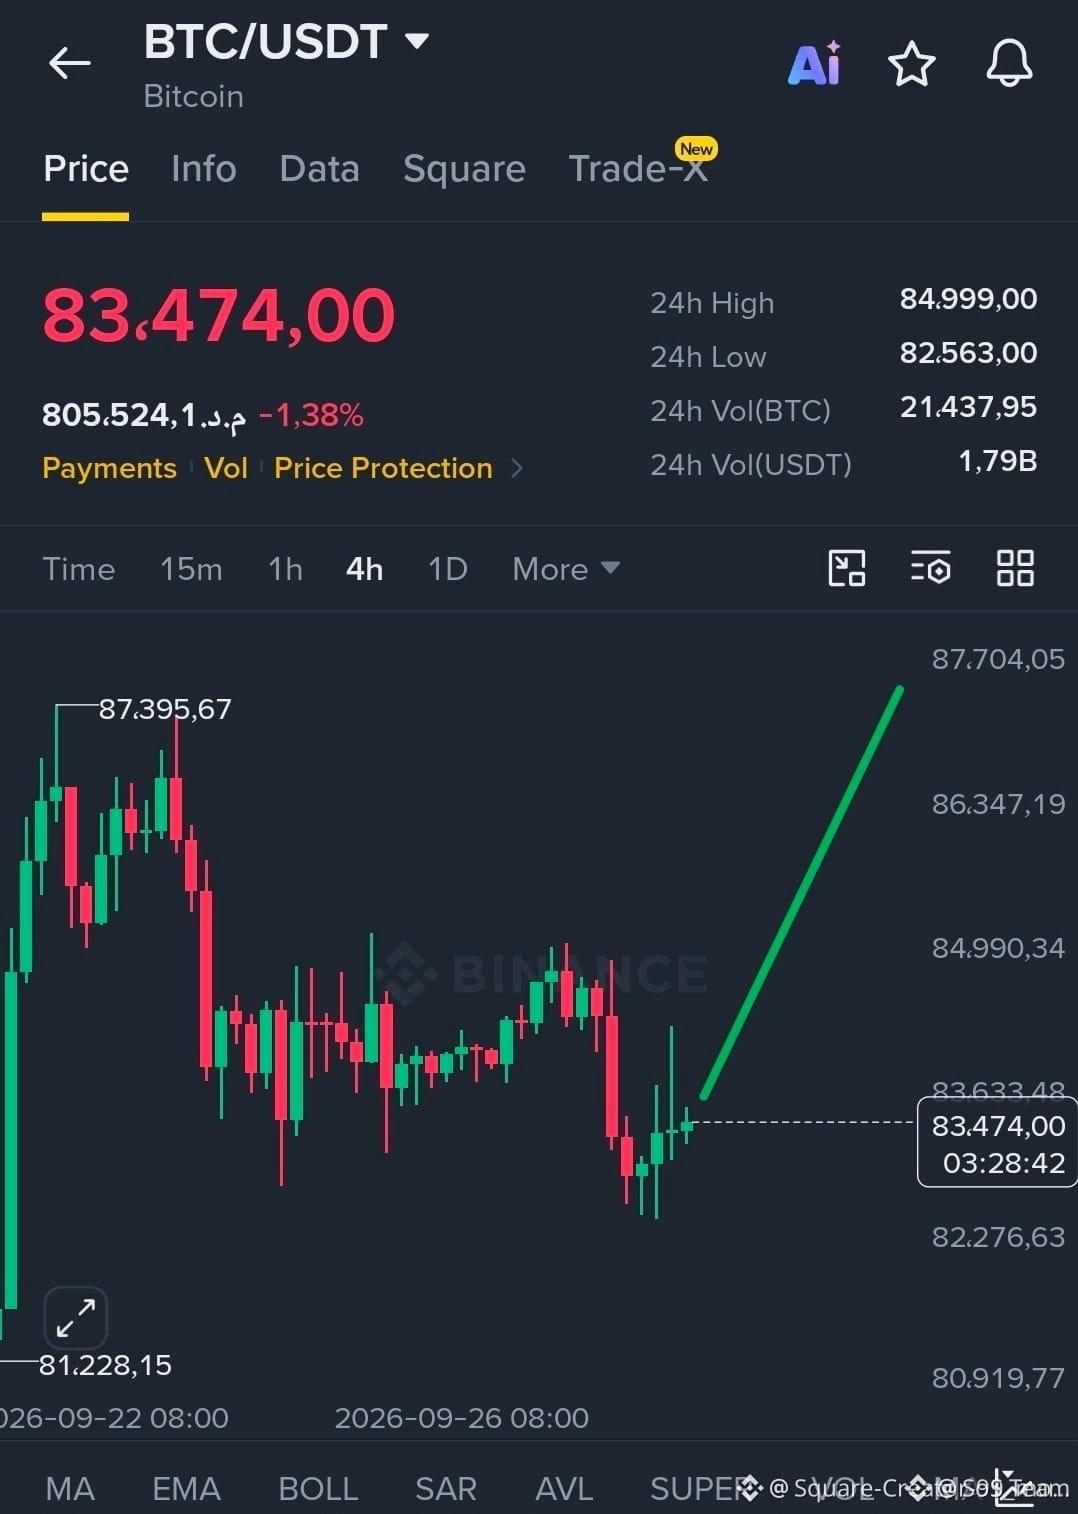
Whales are still buying the top while retail gets used as exit liquidity. Most people see huge institutional purchases and immediately FOMO in, thinking the price can only go higher, only to end up holding heavy bags the moment momentum shifts.
Take the latest on-chain moves from MicroStrategy as an example. They just deployed another $142.7M into $BTC last week, adding to their stash at an average entry of $85,681. On paper, it looks bullish because big balance sheets are buying. But remember, mega-funds operate on multi-year time horizons and can easily absorb 30% drawdowns without breaking a sweat, whereas retail leverage gets wiped in minutes.
Blindly copying whale entries without a clear invalidation plan usually ends in forced liquidations. When giants stack at high price levels, they often create local tops before volatility shakes out overleveraged late longs across both Bitcoin and majors like $ETH.
Are you treating these institutional buys as a green light to add spot, or is this looking more like late-cycle euphoria to you?
#Bitcoin #CryptoTrading #OnChainAnalysis
Whales are still buying the top while retail gets used as exit liquidity. Most people see huge institutional purchases and immediately FOMO in, thinking the price can only go higher, only to end up holding heavy bags the moment momentum shifts.
Take the latest on-chain moves from MicroStrategy as an example. They just deployed another $142.7M into $BTC last week, adding to their stash at an average entry of $85,681. On paper, it looks bullish because big balance sheets are buying. But remember, mega-funds operate on multi-year time horizons and can easily absorb 30% drawdowns without breaking a sweat, whereas retail leverage gets wiped in minutes.
Blindly copying whale entries without a clear invalidation plan usually ends in forced liquidations. When giants stack at high price levels, they often create local tops before volatility shakes out overleveraged late longs across both Bitcoin and majors like $ETH .
Are you treating these institutional buys as a green light to add spot, or is this looking more like late-cycle euphoria to you?
#Bitcoin #CryptoTrading #OnChainAnalysis
Take the latest on-chain moves from MicroStrategy as an example. They just deployed another $142.7M into $BTC last week, adding to their stash at an average entry of $85,681. On paper, it looks bullish because big balance sheets are buying. But remember, mega-funds operate on multi-year time horizons and can easily absorb 30% drawdowns without breaking a sweat, whereas retail leverage gets wiped in minutes.
Blindly copying whale entries without a clear invalidation plan usually ends in forced liquidations. When giants stack at high price levels, they often create local tops before volatility shakes out overleveraged late longs across both Bitcoin and majors like $ETH .
Are you treating these institutional buys as a green light to add spot, or is this looking more like late-cycle euphoria to you?
#Bitcoin #CryptoTrading #OnChainAnalysis
28
·
--
🚀 Whale at $2.4 billion: Why SharpLink the giant bought yet another batch of Ethereum?
A global on-chain audit of addresses of corporate holders recorded the launch of a new accumulation phase for the main altcoin.
SharpLink Corporation activated its treasury gateways, fully removing a massive spot liquidity batch from circulation.
• Anatomy.
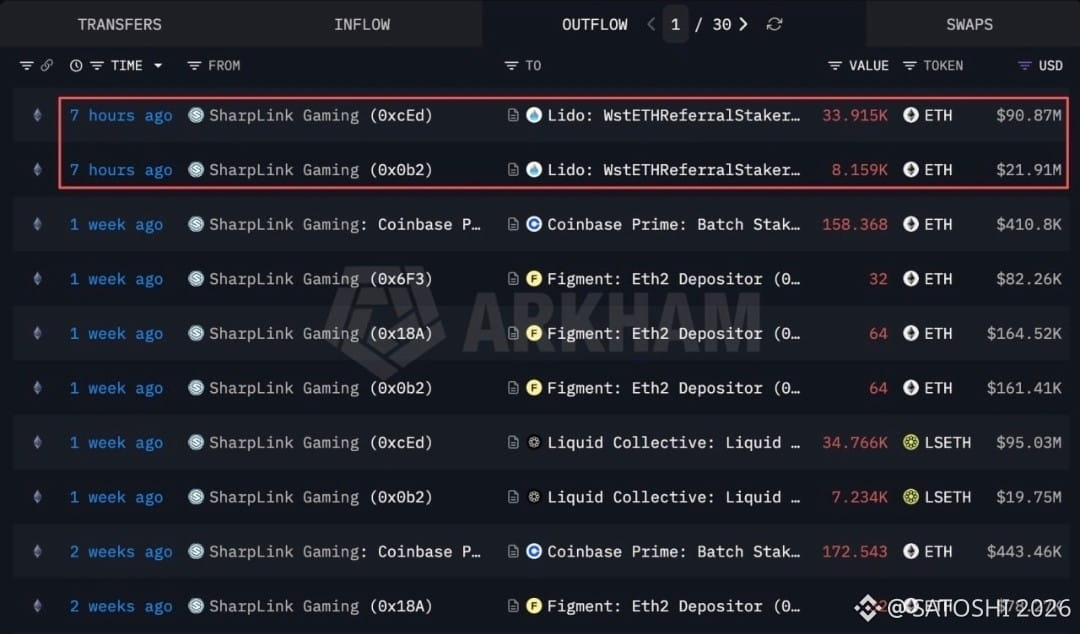
The Arkham blockchain dashboard captured a series of transactions from the SharpLink Gaming addresses. The company transferred to Lido staking pool deposit contracts 42 074 $ETH for a total value of over $112.78 million.
• Scale.
The new purchase increased the institution’s total balance to a record 892 127 $ETH worth about $2.4 billion. At the same time, holding through validator gateways has already generated profit of 27 945 $ETH totaling $75 million.
• Bottom line.
Consistent removal of coins from circulation by large funds creates a hard deficit in the order books. Locking ETH in smart contracts completely eliminates the possibility of seller pressure, turning institutional vacuum into powerful fuel for a trigger.
{future}(ETHUSDT)
Follow the channel—here we break down the maneuvers of big capital without boring theory and market illusions! 🚀
#Ethereum #ETH #SharpLink #Staking #Arkham #OnchainAnalysis #BinanceSquare
🚀 Whale at $2.4 billion: Why SharpLink the giant bought yet another batch of Ethereum?
A global on-chain audit of addresses of corporate holders recorded the launch of a new accumulation phase for the main altcoin.
SharpLink Corporation activated its treasury gateways, fully removing a massive spot liquidity batch from circulation.
• Anatomy.
The Arkham blockchain dashboard captured a series of transactions from the SharpLink Gaming addresses. The company transferred to Lido staking pool deposit contracts 42 074 $ETH for a total value of over $112.78 million.
• Scale.
The new purchase increased the institution’s total balance to a record 892 127 $ETH worth about $2.4 billion. At the same time, holding through validator gateways has already generated profit of 27 945 $ETH totaling $75 million.
• Bottom line.
Consistent removal of coins from circulation by large funds creates a hard deficit in the order books. Locking ETH in smart contracts completely eliminates the possibility of seller pressure, turning institutional vacuum into powerful fuel for a trigger.
Follow the channel—here we break down the maneuvers of big capital without boring theory and market illusions! 🚀
#Ethereum #ETH #SharpLink #Staking #Arkham #OnchainAnalysis #BinanceSquare
A global on-chain audit of addresses of corporate holders recorded the launch of a new accumulation phase for the main altcoin.
SharpLink Corporation activated its treasury gateways, fully removing a massive spot liquidity batch from circulation.
• Anatomy.
The Arkham blockchain dashboard captured a series of transactions from the SharpLink Gaming addresses. The company transferred to Lido staking pool deposit contracts 42 074 $ETH for a total value of over $112.78 million.
• Scale.
The new purchase increased the institution’s total balance to a record 892 127 $ETH worth about $2.4 billion. At the same time, holding through validator gateways has already generated profit of 27 945 $ETH totaling $75 million.
• Bottom line.
Consistent removal of coins from circulation by large funds creates a hard deficit in the order books. Locking ETH in smart contracts completely eliminates the possibility of seller pressure, turning institutional vacuum into powerful fuel for a trigger.
Follow the channel—here we break down the maneuvers of big capital without boring theory and market illusions! 🚀
#Ethereum #ETH #SharpLink #Staking #Arkham #OnchainAnalysis #BinanceSquare

283

Another day, another masterclass in onchain sleuthing. Analysts just exposed a massive $18.4M rug pull tied to the Robinhood Chain, orchestrated by creators who slyly exempted favored wallets from anti-sniping taxes to hoard supply. This is a stark reminder that meme coin mania remains a minefield of insider manipulation. Always check the contract logic before chasing hype, because hidden exemptions usually spell disaster for retail traders. #CryptoSecurity #RugPull #OnchainAnalysis
Another day, another masterclass in onchain sleuthing. Analysts just exposed a massive $18.4M rug pull tied to the Robinhood Chain, orchestrated by creators who slyly exempted favored wallets from anti-sniping taxes to hoard supply. This is a stark reminder that meme coin mania remains a minefield of insider manipulation. Always check the contract logic before chasing hype, because hidden exemptions usually spell disaster for retail traders. #CryptoSecurity #RugPull #OnchainAnalysis
11
·
--
🚀 Signal 1.15: Bitcoin’s main on-chain metric repeated a dangerous historical fractal
Global on-chain monitoring recorded a strong signal to cool the market.
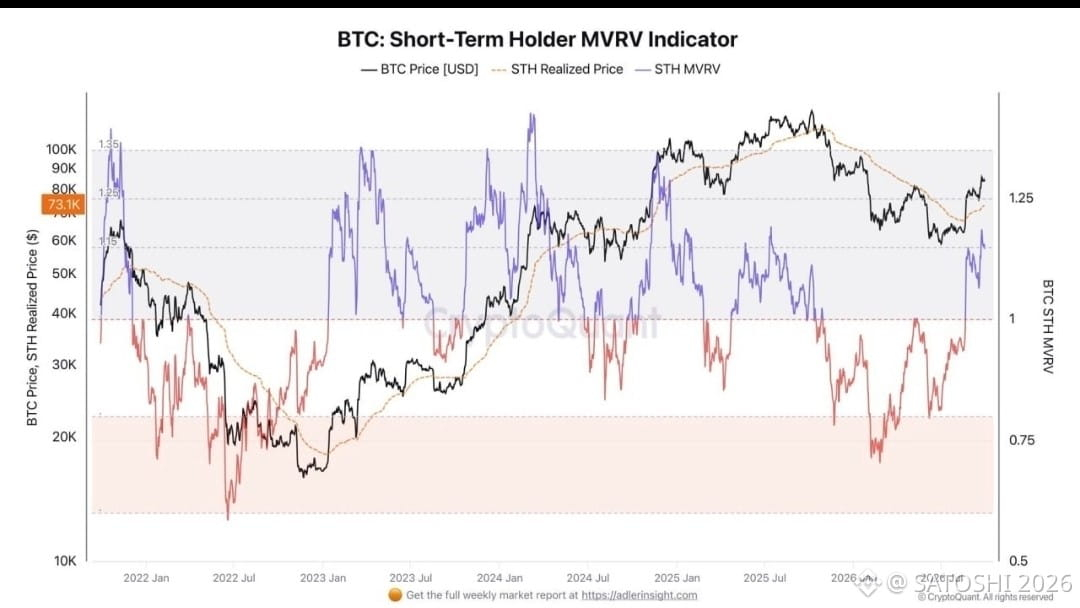
The profitability indicator for Bitcoin short-term holders updated its annual high, marking retail crowd entry into a risk zone for profit-taking.
Anatomy.
The jump of the MVRV metric to the 1.15 mark happened due to a price breakout above the speculators’ cost basis at $73,100. This group holds 15% net profit, and the sector’s market capitalization exceeded realized capitalization.
Threat.
The 1.15 level is a critical psychological threshold. Accumulated returns force small players to move coins en masse onto exchanges to cash out, creating a large spot sell order supply.
Conclusion.
Reaching the peak breaks the bullish narrative. Buying assets here risks hidden portfolio unwinding, turning euphoria into fuel for a margin flush.
$BTC
{future}(BTCUSDT)
Subscribe to the channel—here we break down the maneuvers of big capital without any market illusions! 🚀
#Bitcoin #BTC #CryptoQuant #MVRV #OnchainAnalysis #BinanceSquare
🚀 Signal 1.15: Bitcoin’s main on-chain metric repeated a dangerous historical fractal
Global on-chain monitoring recorded a strong signal to cool the market.
The profitability indicator for Bitcoin short-term holders updated its annual high, marking retail crowd entry into a risk zone for profit-taking.
Anatomy.
The jump of the MVRV metric to the 1.15 mark happened due to a price breakout above the speculators’ cost basis at $73,100. This group holds 15% net profit, and the sector’s market capitalization exceeded realized capitalization.
Threat.
The 1.15 level is a critical psychological threshold. Accumulated returns force small players to move coins en masse onto exchanges to cash out, creating a large spot sell order supply.
Conclusion.
Reaching the peak breaks the bullish narrative. Buying assets here risks hidden portfolio unwinding, turning euphoria into fuel for a margin flush.
$BTC
Subscribe to the channel—here we break down the maneuvers of big capital without any market illusions! 🚀
#Bitcoin #BTC #CryptoQuant #MVRV #OnchainAnalysis #BinanceSquare
Global on-chain monitoring recorded a strong signal to cool the market.
The profitability indicator for Bitcoin short-term holders updated its annual high, marking retail crowd entry into a risk zone for profit-taking.
Anatomy.
The jump of the MVRV metric to the 1.15 mark happened due to a price breakout above the speculators’ cost basis at $73,100. This group holds 15% net profit, and the sector’s market capitalization exceeded realized capitalization.
Threat.
The 1.15 level is a critical psychological threshold. Accumulated returns force small players to move coins en masse onto exchanges to cash out, creating a large spot sell order supply.
Conclusion.
Reaching the peak breaks the bullish narrative. Buying assets here risks hidden portfolio unwinding, turning euphoria into fuel for a margin flush.
$BTC
Subscribe to the channel—here we break down the maneuvers of big capital without any market illusions! 🚀
#Bitcoin #BTC #CryptoQuant #MVRV #OnchainAnalysis #BinanceSquare

1
144

·
--
🚨 $500M USDC JUST ENTERED SOLANA
Circle has minted 500 million USDC on Solana through two separate 250M transactions.
But traders, don't immediately see this and think:
“USDC mint = SOL pump.” ❌
There is more to understand.
What does a USDC mint actually mean?
USDC is a stablecoin designed to maintain a 1:1 value with the US dollar. When Circle mints USDC, new USDC is created and can enter circulation.
For traders, the important part is LIQUIDITY.
Fresh stablecoin liquidity can potentially provide more capital for:
• Spot trading
• Perpetual/futures trading
• DeFi
• DEX liquidity
• Lending
• Arbitrage
• Cross-chain settlement
However, a mint alone does NOT prove that $500M is immediately being used to buy SOL or other assets.
That's the mistake many traders make.
What should you watch next? 👀
Don't just watch the headline.
Watch the on-chain movement:
1️⃣ Where does the newly minted USDC go?
2️⃣ Does it move to exchanges?
3️⃣ Does it enter Solana DeFi protocols?
4️⃣ Does DEX volume increase?
5️⃣ Does SOL open interest increase?
6️⃣ Are stablecoin balances on exchanges rising?
7️⃣ Does price actually confirm the liquidity narrative?
The mint is the information.
The subsequent movement is the signal.
This is an important lesson in on-chain trading:
«Don't trade the headline. Trade the reaction to the headline.»
$500M of additional USDC liquidity is certainly worth monitoring, but traders should wait for confirmation before assuming a bullish or bearish outcome.
Do your own research. Manage your risk.
#Trading #DeFi #OnChainAnalysis $SOL
#CircleMints500MUSDCOnSolana
🚨 $500M USDC JUST ENTERED SOLANA
Circle has minted 500 million USDC on Solana through two separate 250M transactions.
But traders, don't immediately see this and think:
“USDC mint = SOL pump.” ❌
There is more to understand.
What does a USDC mint actually mean?
USDC is a stablecoin designed to maintain a 1:1 value with the US dollar. When Circle mints USDC, new USDC is created and can enter circulation.
For traders, the important part is LIQUIDITY.
Fresh stablecoin liquidity can potentially provide more capital for:
• Spot trading
• Perpetual/futures trading
• DeFi
• DEX liquidity
• Lending
• Arbitrage
• Cross-chain settlement
However, a mint alone does NOT prove that $500M is immediately being used to buy SOL or other assets.
That's the mistake many traders make.
What should you watch next? 👀
Don't just watch the headline.
Watch the on-chain movement:
1️⃣ Where does the newly minted USDC go?
2️⃣ Does it move to exchanges?
3️⃣ Does it enter Solana DeFi protocols?
4️⃣ Does DEX volume increase?
5️⃣ Does SOL open interest increase?
6️⃣ Are stablecoin balances on exchanges rising?
7️⃣ Does price actually confirm the liquidity narrative?
The mint is the information.
The subsequent movement is the signal.
This is an important lesson in on-chain trading:
«Don't trade the headline. Trade the reaction to the headline.»
$500M of additional USDC liquidity is certainly worth monitoring, but traders should wait for confirmation before assuming a bullish or bearish outcome.
Do your own research. Manage your risk.
#Trading #DeFi #OnChainAnalysis $SOL
#CircleMints500MUSDCOnSolana
Circle has minted 500 million USDC on Solana through two separate 250M transactions.
But traders, don't immediately see this and think:
“USDC mint = SOL pump.” ❌
There is more to understand.
What does a USDC mint actually mean?
USDC is a stablecoin designed to maintain a 1:1 value with the US dollar. When Circle mints USDC, new USDC is created and can enter circulation.
For traders, the important part is LIQUIDITY.
Fresh stablecoin liquidity can potentially provide more capital for:
• Spot trading
• Perpetual/futures trading
• DeFi
• DEX liquidity
• Lending
• Arbitrage
• Cross-chain settlement
However, a mint alone does NOT prove that $500M is immediately being used to buy SOL or other assets.
That's the mistake many traders make.
What should you watch next? 👀
Don't just watch the headline.
Watch the on-chain movement:
1️⃣ Where does the newly minted USDC go?
2️⃣ Does it move to exchanges?
3️⃣ Does it enter Solana DeFi protocols?
4️⃣ Does DEX volume increase?
5️⃣ Does SOL open interest increase?
6️⃣ Are stablecoin balances on exchanges rising?
7️⃣ Does price actually confirm the liquidity narrative?
The mint is the information.
The subsequent movement is the signal.
This is an important lesson in on-chain trading:
«Don't trade the headline. Trade the reaction to the headline.»
$500M of additional USDC liquidity is certainly worth monitoring, but traders should wait for confirmation before assuming a bullish or bearish outcome.
Do your own research. Manage your risk.
#Trading #DeFi #OnChainAnalysis $SOL
#CircleMints500MUSDCOnSolana
240

On-chain sleuthing: The “whales” are covering their tracks and you don’t notice 🕵️♂️
Watch the flow of $BTC a exchanges: up 15% in 48h, but sales volume *doesn’t* increase. Translation: the whales are moving cold positions to hot to protect capital against a possible correction, not to sell on the spot. It’s the classic “dance of death.” If you break technical supports, the real liquidity isn’t in the L2s—it’s in those sleeping wallets that wake up. The thesis: this is relocation noise, not capitulation. If the Lightning network remains latent, a rebound is imminent. Do you think they’re setting up the short or the long?
#OnChainAnalysis #WhaleWatching #AnalisisCripto
Not financial advice. Verify before investing.
On-chain sleuthing: The “whales” are covering their tracks and you don’t notice 🕵️♂️
Watch the flow of $BTC a exchanges: up 15% in 48h, but sales volume *doesn’t* increase. Translation: the whales are moving cold positions to hot to protect capital against a possible correction, not to sell on the spot. It’s the classic “dance of death.” If you break technical supports, the real liquidity isn’t in the L2s—it’s in those sleeping wallets that wake up. The thesis: this is relocation noise, not capitulation. If the Lightning network remains latent, a rebound is imminent. Do you think they’re setting up the short or the long?
#OnChainAnalysis #WhaleWatching #AnalisisCripto
Not financial advice. Verify before investing.
Watch the flow of $BTC a exchanges: up 15% in 48h, but sales volume *doesn’t* increase. Translation: the whales are moving cold positions to hot to protect capital against a possible correction, not to sell on the spot. It’s the classic “dance of death.” If you break technical supports, the real liquidity isn’t in the L2s—it’s in those sleeping wallets that wake up. The thesis: this is relocation noise, not capitulation. If the Lightning network remains latent, a rebound is imminent. Do you think they’re setting up the short or the long?
#OnChainAnalysis #WhaleWatching #AnalisisCripto
Not financial advice. Verify before investing.

167

·
--
Bullish
BTC by the Numbers: Things Most People Forget
• Only 21 million BTC will ever exist — issuance is currently capped, with the last coin not mined until around the year 2140
• Roughly 19.8+ million are already mined — meaning almost 94% of Bitcoin's total supply is already in circulation
• The network has processed blocks roughly every ~10 minutes, non-stop, for over 16 years — no downtime, no reset
• Bitcoin has now survived 4 halvings, each one cutting new supply issuance in half
• It's the only major asset with a fully transparent, auditable supply — anyone can verify it in real time on-chain
No promises, no hype cycle needed. Just math, time, and a network that keeps running.
Not financial advice — just the facts. 🧡
#BTC #bitcoin #OnChainAnalysis #BinanceSquareFamily
BTC by the Numbers: Things Most People Forget
• Only 21 million BTC will ever exist — issuance is currently capped, with the last coin not mined until around the year 2140
• Roughly 19.8+ million are already mined — meaning almost 94% of Bitcoin's total supply is already in circulation
• The network has processed blocks roughly every ~10 minutes, non-stop, for over 16 years — no downtime, no reset
• Bitcoin has now survived 4 halvings, each one cutting new supply issuance in half
• It's the only major asset with a fully transparent, auditable supply — anyone can verify it in real time on-chain
No promises, no hype cycle needed. Just math, time, and a network that keeps running.
Not financial advice — just the facts. 🧡
#BTC #bitcoin #OnChainAnalysis #BinanceSquareFamily
• Only 21 million BTC will ever exist — issuance is currently capped, with the last coin not mined until around the year 2140
• Roughly 19.8+ million are already mined — meaning almost 94% of Bitcoin's total supply is already in circulation
• The network has processed blocks roughly every ~10 minutes, non-stop, for over 16 years — no downtime, no reset
• Bitcoin has now survived 4 halvings, each one cutting new supply issuance in half
• It's the only major asset with a fully transparent, auditable supply — anyone can verify it in real time on-chain
No promises, no hype cycle needed. Just math, time, and a network that keeps running.
Not financial advice — just the facts. 🧡
#BTC #bitcoin #OnChainAnalysis #BinanceSquareFamily
53
Whales just scooped up 1.54 billion tokens in roughly 96 hours, yet price momentum stalled right after tapping $1.65.
Most retail traders see massive institutional volume and rush to market-buy, only to end up holding the bag when smart money uses that exact liquidity wave to distribute. It is the classic trap of mistaking large-scale accumulation for an immediate green candle, especially when you are trying to time an entry on a volatile breakout.
Looking closely at the on-chain data, while spot ETF inflows notched 10 consecutive green weeks alongside broader $BTC strength, $XRP quickly cooled off back to the $1.47 zone. When that much supply moves into private wallets over four days without pushing price to fresh highs, it usually means aggressive sell walls are absorbing the demand. If buy volume dries up even slightly, all that leveraged hype tends to unwind very quickly.
Are you treating this pullback as accumulation or an early exit warning?
#XRP #CryptoTrading #OnChainAnalysis
Whales just scooped up 1.54 billion tokens in roughly 96 hours, yet price momentum stalled right after tapping $1.65.
Most retail traders see massive institutional volume and rush to market-buy, only to end up holding the bag when smart money uses that exact liquidity wave to distribute. It is the classic trap of mistaking large-scale accumulation for an immediate green candle, especially when you are trying to time an entry on a volatile breakout.
Looking closely at the on-chain data, while spot ETF inflows notched 10 consecutive green weeks alongside broader $BTC strength, $XRP quickly cooled off back to the $1.47 zone. When that much supply moves into private wallets over four days without pushing price to fresh highs, it usually means aggressive sell walls are absorbing the demand. If buy volume dries up even slightly, all that leveraged hype tends to unwind very quickly.
Are you treating this pullback as accumulation or an early exit warning?
#XRP #CryptoTrading #OnChainAnalysis
Most retail traders see massive institutional volume and rush to market-buy, only to end up holding the bag when smart money uses that exact liquidity wave to distribute. It is the classic trap of mistaking large-scale accumulation for an immediate green candle, especially when you are trying to time an entry on a volatile breakout.
Looking closely at the on-chain data, while spot ETF inflows notched 10 consecutive green weeks alongside broader $BTC strength, $XRP quickly cooled off back to the $1.47 zone. When that much supply moves into private wallets over four days without pushing price to fresh highs, it usually means aggressive sell walls are absorbing the demand. If buy volume dries up even slightly, all that leveraged hype tends to unwind very quickly.
Are you treating this pullback as accumulation or an early exit warning?
#XRP #CryptoTrading #OnChainAnalysis
121
Log in to explore more content
Join global crypto users on Binance Square
⚡️ Get latest and useful information about crypto.
💬 Trusted by the world’s largest crypto exchange.
👍 Discover real insights from verified creators.
Email / Phone number
Trending Topics
1
#ZcashETFPostsFirstWeeklyOutflow$93.6M
34,352 views
99 Discussing
2
#GreekPoliceBustCryptoScamRingArrest17
71,991 views
682 Discussing
3
#BitcoinRejectedAt$87K
120,134 views
157 Discussing
4
#FedOctoberRateHikeOddsFallTo17%
97,239 views
971 Discussing
5
#NvidiaHitsRecordHighUp2.4%
65,907 views
706 Discussing
6
#CanaryFilesAmendedS1ForPEPEETF
18,749 views
499 Discussing
7
#USRussiaUkraineTalksReportedlyIncludeLukoilOilDeal
29,267 views
495 Discussing
8
#BitcoinParesGainsAfterRallyTo$86.5K
47,085 views
166 Discussing
9
#CerebrasSinksNearly20%OnReportNvidiaToPowerOpenAI
114,793 views
1,104 Discussing
10
#SECProposesCryptoCustodyRules
155,051 views
1,385 Discussing