
CRIPTO SIN HUMOS
527 Posts

CRIPTO SIN HUMOS
Report
Block User
Noticias y análisis cripto para Chile y LATAM Datos verificados, cero humo
🇨🇱 BTC · ETH · DeFi · Regulación CMF/SII
Nada de esto es consejo financiero
139 Following
38 Followers
58 Liked
Posts
All
Quotes
Videos
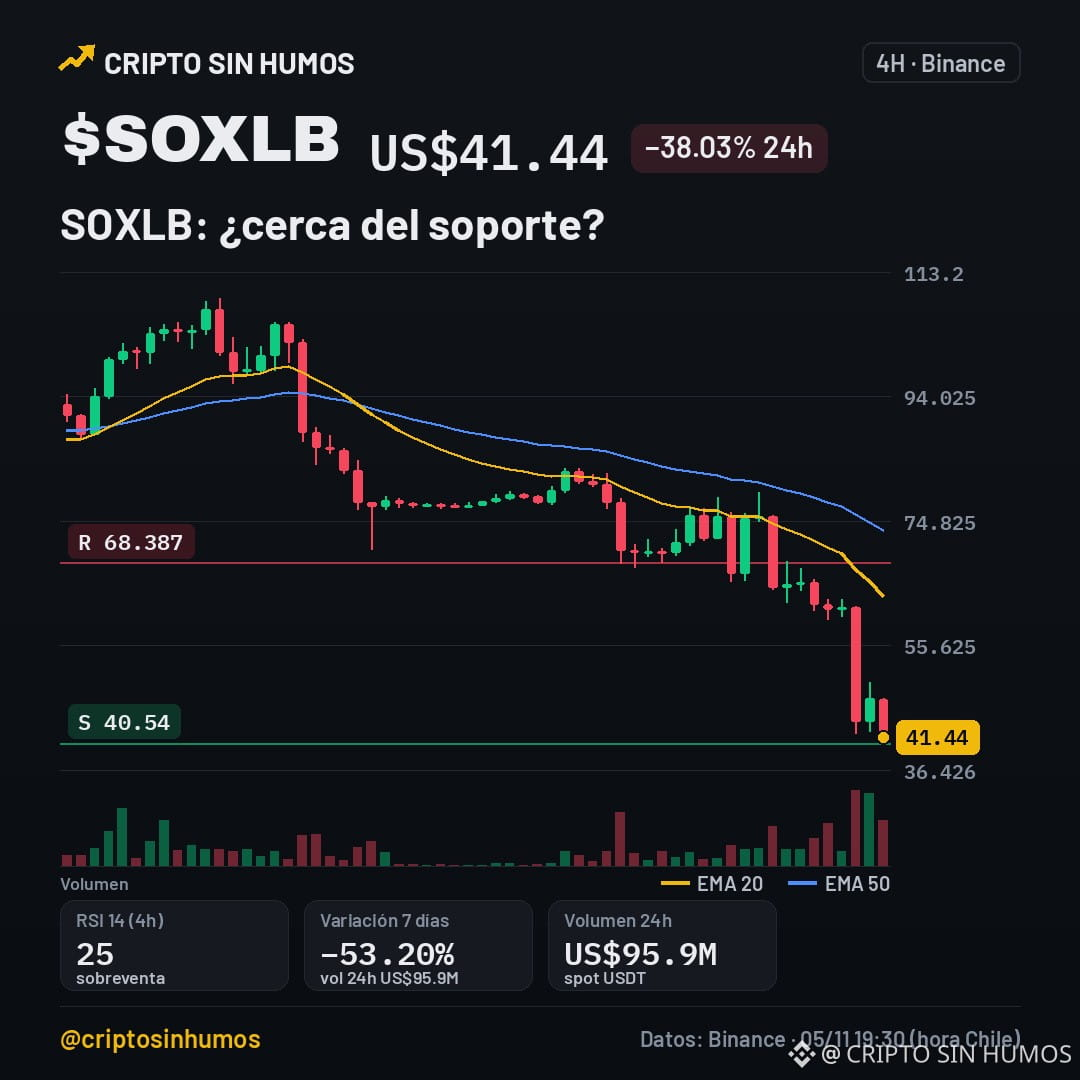
$SOXLB falls 38%: bounce at 40.54 or continue to 68.387?
$SOXLB is at US$41.44, down 38.03% in 24h and 53.20% in 7 days. The drop has pushed the 24h range to US$40.54‑67.20.
On the 4h chart, the EMA20 (63.227) and EMA50 (73.363) are well above the price, signaling a downtrend. The RSI at 25.0 indicates oversold conditions, but selling pressure remains strong.
If it breaks resistance at 68.387, the bullish scenario is triggered, with the next target being a return to the 73‑80 zone. That breakout would invalidate the bearish outlook. On the other hand, a drop below support at 40.54 would confirm the downtrend and pave the way for new lows, ruling out any bounce.
$SNDKB (-21.0%) and $UNI (-12.0%) are also moving in 24h, both with volumes above US$95 M.
Will $SOXLB break 68.387 or retest 40.54? 🟢/🔴
#SOXLB #trading
This is not financial advice. Do your own research before investing.
$SOXLB falls 38%: bounce at 40.54 or continue to 68.387?
$SOXLB is at US$41.44, down 38.03% in 24h and 53.20% in 7 days. The drop has pushed the 24h range to US$40.54‑67.20.
On the 4h chart, the EMA20 (63.227) and EMA50 (73.363) are well above the price, signaling a downtrend. The RSI at 25.0 indicates oversold conditions, but selling pressure remains strong.
If it breaks resistance at 68.387, the bullish scenario is triggered, with the next target being a return to the 73‑80 zone. That breakout would invalidate the bearish outlook. On the other hand, a drop below support at 40.54 would confirm the downtrend and pave the way for new lows, ruling out any bounce.
$SNDKB (-21.0%) and $UNI (-12.0%) are also moving in 24h, both with volumes above US$95 M.
Will $SOXLB break 68.387 or retest 40.54? 🟢/🔴
#SOXLB #trading
This is not financial advice. Do your own research before investing.
$SOXLB is at US$41.44, down 38.03% in 24h and 53.20% in 7 days. The drop has pushed the 24h range to US$40.54‑67.20.
On the 4h chart, the EMA20 (63.227) and EMA50 (73.363) are well above the price, signaling a downtrend. The RSI at 25.0 indicates oversold conditions, but selling pressure remains strong.
If it breaks resistance at 68.387, the bullish scenario is triggered, with the next target being a return to the 73‑80 zone. That breakout would invalidate the bearish outlook. On the other hand, a drop below support at 40.54 would confirm the downtrend and pave the way for new lows, ruling out any bounce.
$SNDKB (-21.0%) and $UNI (-12.0%) are also moving in 24h, both with volumes above US$95 M.
Will $SOXLB break 68.387 or retest 40.54? 🟢/🔴
#SOXLB #trading
This is not financial advice. Do your own research before investing.
65
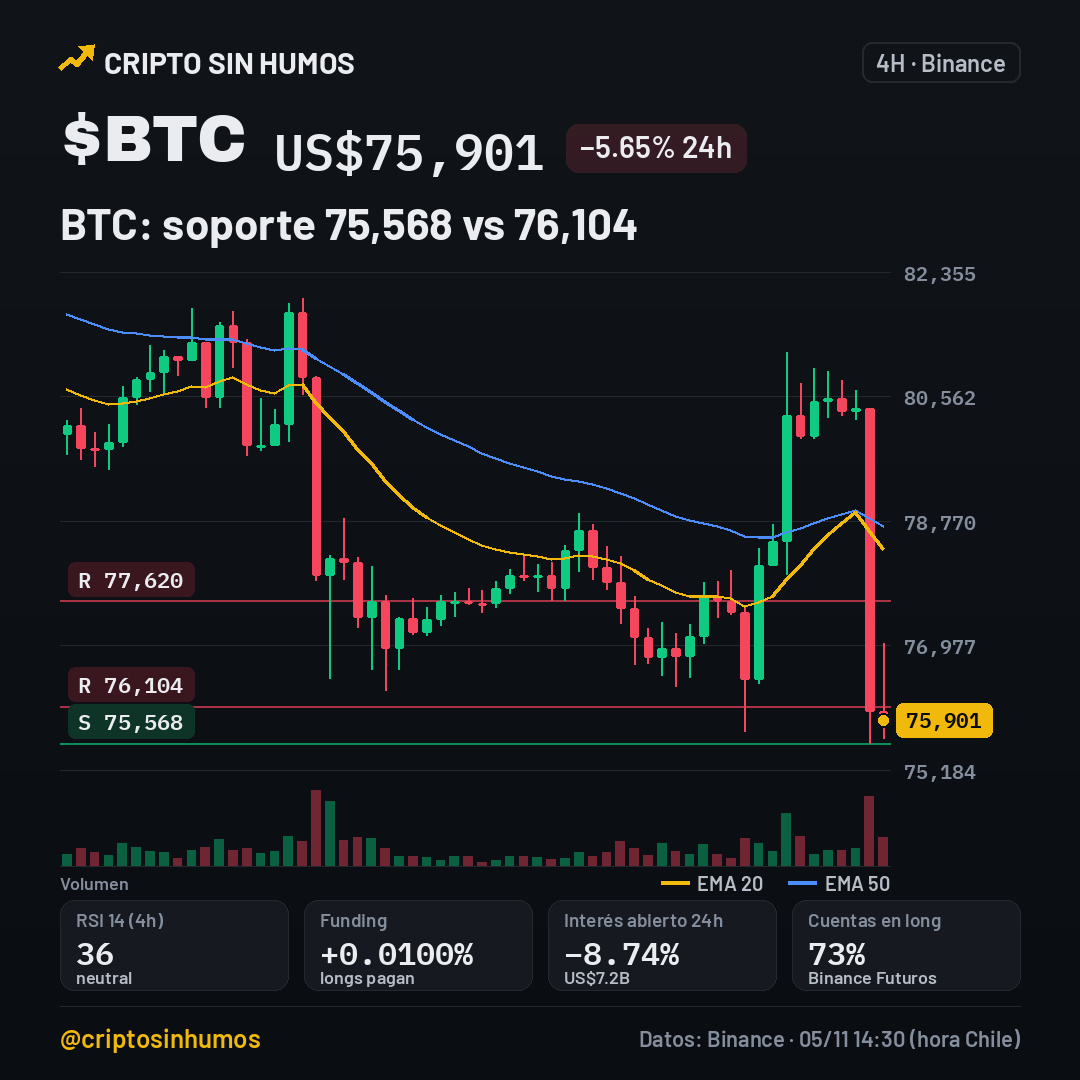
$BTC a US$75,901: support at 75,568 or a drop?
$BTC cae 5.65% to US$75,901. $SOXLB (-32.4%) and $SNDKB (-18.3%) are also moving.
My take: downward pressure is intensifying. The RSI is at 35.8, near oversold territory, but the EMA20 (78,361) and EMA50 (78,695) remain above the price, and the 4h trend is clearly bearish.
The key support is 75,568; if it holds there, the next upside target would be resistance at 76,104 and, if the price continues to rise, 77,620. On the other hand, a break below 75,568 would invalidate the rebound and open the door to a more aggressive downward phase.
In futures, funding is +0.0100% every 8h and open interest fell 8.7% in 24h, with 73% of accounts in longs, suggesting that long positions could be liquidated if the price continues to fall.
Will it break 76,104 or return to 75,568? 🟢/🔴
#BTC #Binance #Futures
This is not financial advice. Verify before investing.
$BTC a US$75,901: support at 75,568 or a drop?
$BTC cae 5.65% to US$75,901. $SOXLB (-32.4%) and $SNDKB (-18.3%) are also moving.
My take: downward pressure is intensifying. The RSI is at 35.8, near oversold territory, but the EMA20 (78,361) and EMA50 (78,695) remain above the price, and the 4h trend is clearly bearish.
The key support is 75,568; if it holds there, the next upside target would be resistance at 76,104 and, if the price continues to rise, 77,620. On the other hand, a break below 75,568 would invalidate the rebound and open the door to a more aggressive downward phase.
In futures, funding is +0.0100% every 8h and open interest fell 8.7% in 24h, with 73% of accounts in longs, suggesting that long positions could be liquidated if the price continues to fall.
Will it break 76,104 or return to 75,568? 🟢/🔴
#BTC #Binance #Futures
This is not financial advice. Verify before investing.
$BTC cae 5.65% to US$75,901. $SOXLB (-32.4%) and $SNDKB (-18.3%) are also moving.
My take: downward pressure is intensifying. The RSI is at 35.8, near oversold territory, but the EMA20 (78,361) and EMA50 (78,695) remain above the price, and the 4h trend is clearly bearish.
The key support is 75,568; if it holds there, the next upside target would be resistance at 76,104 and, if the price continues to rise, 77,620. On the other hand, a break below 75,568 would invalidate the rebound and open the door to a more aggressive downward phase.
In futures, funding is +0.0100% every 8h and open interest fell 8.7% in 24h, with 73% of accounts in longs, suggesting that long positions could be liquidated if the price continues to fall.
Will it break 76,104 or return to 75,568? 🟢/🔴
#BTC #Binance #Futures
This is not financial advice. Verify before investing.
112
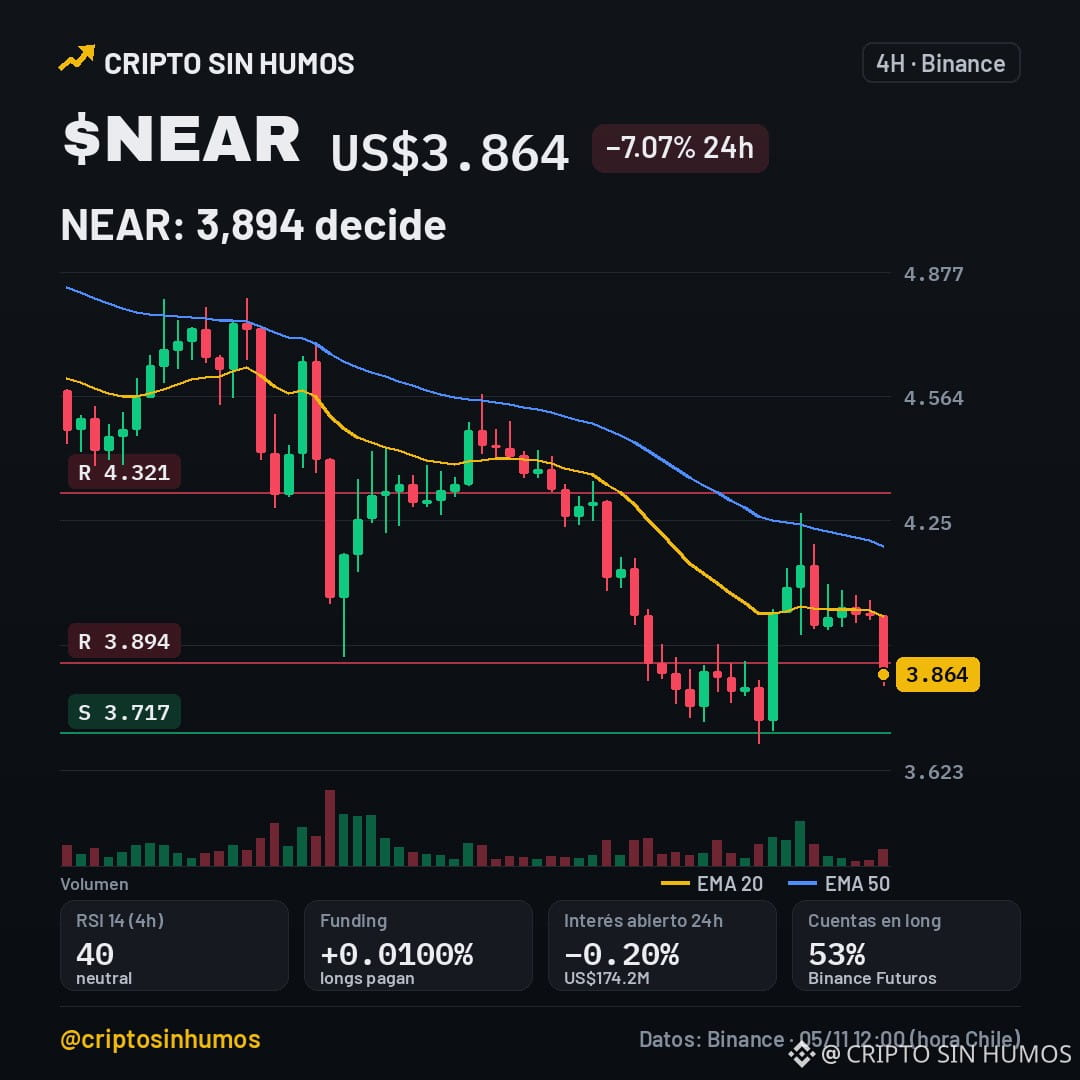
$NEAR down 7% and targets 3,894: test or breakout?
$NEAR has fallen 7.07% in 24h and is trading at US$3.864. The day's range is 3.836‑4.27, and volume is around 74 M.
EMA20 at 4.01 and EMA50 at 4.187 confirm the downtrend; RSI at 39.5 shows selling pressure. Support is at 3.717; resistance levels are 3.894 and 4.321. If it breaks above 3.894, the target is 4.321. A close below 3.717 would invalidate the bullish scenario.
Binance futures funding is +0.0100% every 8 h, and open interest fell 0.2% to 174 M. 53% of accounts are long, which could be a liability if the price stays low.
Trending now are $SNDKB (-18.0% 24h) and $UNI (-5.1% 24h), both with volumes of 66 M.
I wouldn't enter now; this smells like a trap until we see a clear breakout. Will it break 3.894 or fall back to 3.717? 🟢/🔴
#NEAR #DeFi #Layer2
This is not financial advice. Do your research before investing.
$NEAR down 7% and targets 3,894: test or breakout?
$NEAR has fallen 7.07% in 24h and is trading at US$3.864. The day's range is 3.836‑4.27, and volume is around 74 M.
EMA20 at 4.01 and EMA50 at 4.187 confirm the downtrend; RSI at 39.5 shows selling pressure. Support is at 3.717; resistance levels are 3.894 and 4.321. If it breaks above 3.894, the target is 4.321. A close below 3.717 would invalidate the bullish scenario.
Binance futures funding is +0.0100% every 8 h, and open interest fell 0.2% to 174 M. 53% of accounts are long, which could be a liability if the price stays low.
Trending now are $SNDKB (-18.0% 24h) and $UNI (-5.1% 24h), both with volumes of 66 M.
I wouldn't enter now; this smells like a trap until we see a clear breakout. Will it break 3.894 or fall back to 3.717? 🟢/🔴
#NEAR #DeFi #Layer2
This is not financial advice. Do your research before investing.
$NEAR has fallen 7.07% in 24h and is trading at US$3.864. The day's range is 3.836‑4.27, and volume is around 74 M.
EMA20 at 4.01 and EMA50 at 4.187 confirm the downtrend; RSI at 39.5 shows selling pressure. Support is at 3.717; resistance levels are 3.894 and 4.321. If it breaks above 3.894, the target is 4.321. A close below 3.717 would invalidate the bullish scenario.
Binance futures funding is +0.0100% every 8 h, and open interest fell 0.2% to 174 M. 53% of accounts are long, which could be a liability if the price stays low.
Trending now are $SNDKB (-18.0% 24h) and $UNI (-5.1% 24h), both with volumes of 66 M.
I wouldn't enter now; this smells like a trap until we see a clear breakout. Will it break 3.894 or fall back to 3.717? 🟢/🔴
#NEAR #DeFi #Layer2
This is not financial advice. Do your research before investing.
161
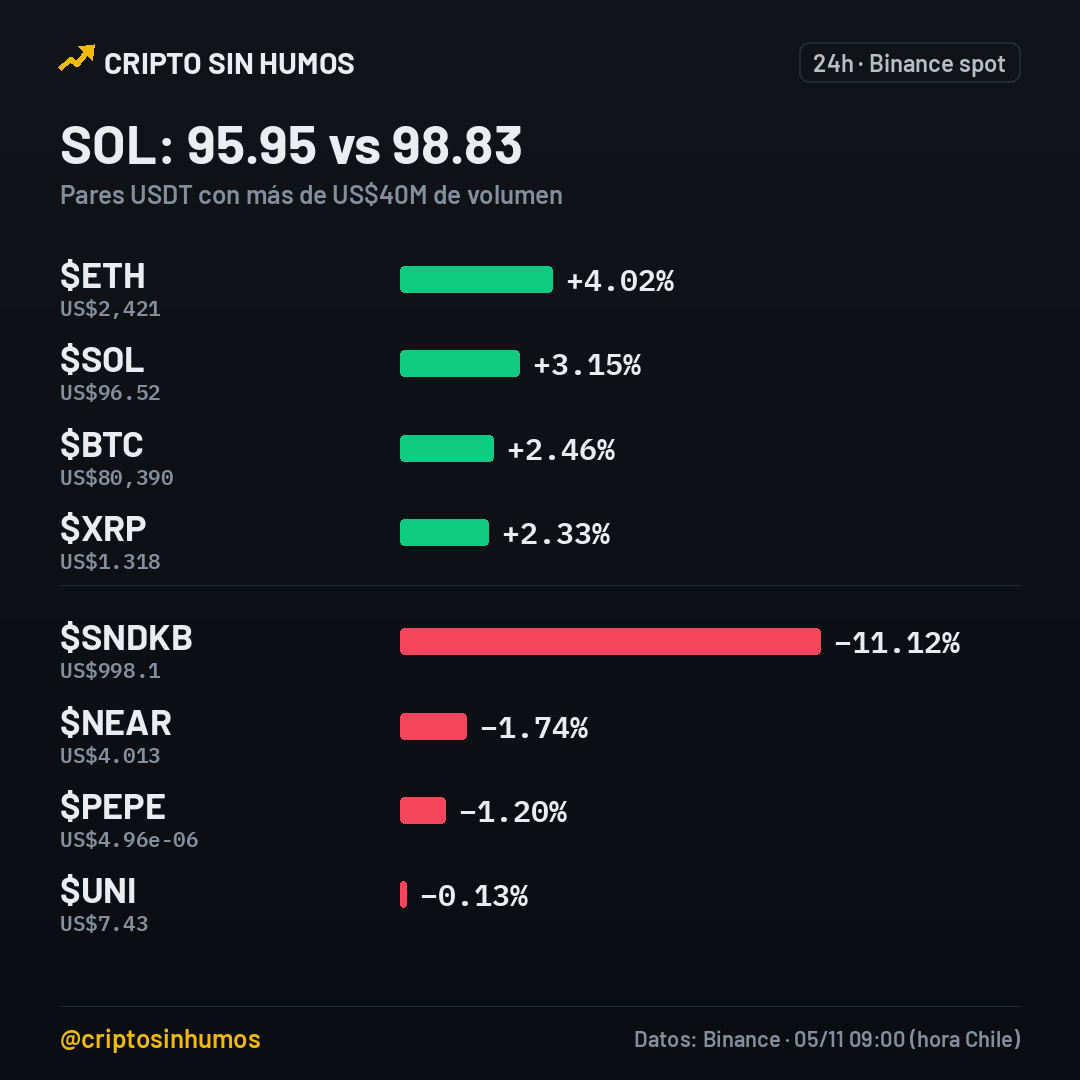
$SOL at $96.5, testing support at 95.95 or aiming for 98.83?
$SOL is trading at US$96.51, up 3.08% in 24h, within the $92.47‑$98.14 range.
On the 24h radar, $ETH leads with +4.02% while $SNDKB lags with -11.12%, and $SOL is up +3.15%. $SNDKB (-11.1%) and $ETH (+3.9%) are also on the move.
Key support levels are 95.95 and 93.108; immediate resistance is at 98.832, followed by 103.1. If it breaks above 98.832, the next target would be 103.1; if it falls below 95.95, the price could head toward 93.108.
Futures funding is at +0.0100%, and 73% of accounts are betting on long positions, although the RSI at 56.6 suggests momentum is not yet overheated.
Will it break 98.832 or return to 95.95? 🟢/🔴
#Solana #DeFi
This is not financial advice. Verify before investing.
$SOL at $96.5, testing support at 95.95 or aiming for 98.83?
$SOL is trading at US$96.51, up 3.08% in 24h, within the $92.47‑$98.14 range.
On the 24h radar, $ETH leads with +4.02% while $SNDKB lags with -11.12%, and $SOL is up +3.15%. $SNDKB (-11.1%) and $ETH (+3.9%) are also on the move.
Key support levels are 95.95 and 93.108; immediate resistance is at 98.832, followed by 103.1. If it breaks above 98.832, the next target would be 103.1; if it falls below 95.95, the price could head toward 93.108.
Futures funding is at +0.0100%, and 73% of accounts are betting on long positions, although the RSI at 56.6 suggests momentum is not yet overheated.
Will it break 98.832 or return to 95.95? 🟢/🔴
#Solana #DeFi
This is not financial advice. Verify before investing.
$SOL is trading at US$96.51, up 3.08% in 24h, within the $92.47‑$98.14 range.
On the 24h radar, $ETH leads with +4.02% while $SNDKB lags with -11.12%, and $SOL is up +3.15%. $SNDKB (-11.1%) and $ETH (+3.9%) are also on the move.
Key support levels are 95.95 and 93.108; immediate resistance is at 98.832, followed by 103.1. If it breaks above 98.832, the next target would be 103.1; if it falls below 95.95, the price could head toward 93.108.
Futures funding is at +0.0100%, and 73% of accounts are betting on long positions, although the RSI at 56.6 suggests momentum is not yet overheated.
Will it break 98.832 or return to 95.95? 🟢/🔴
#Solana #DeFi
This is not financial advice. Verify before investing.
122
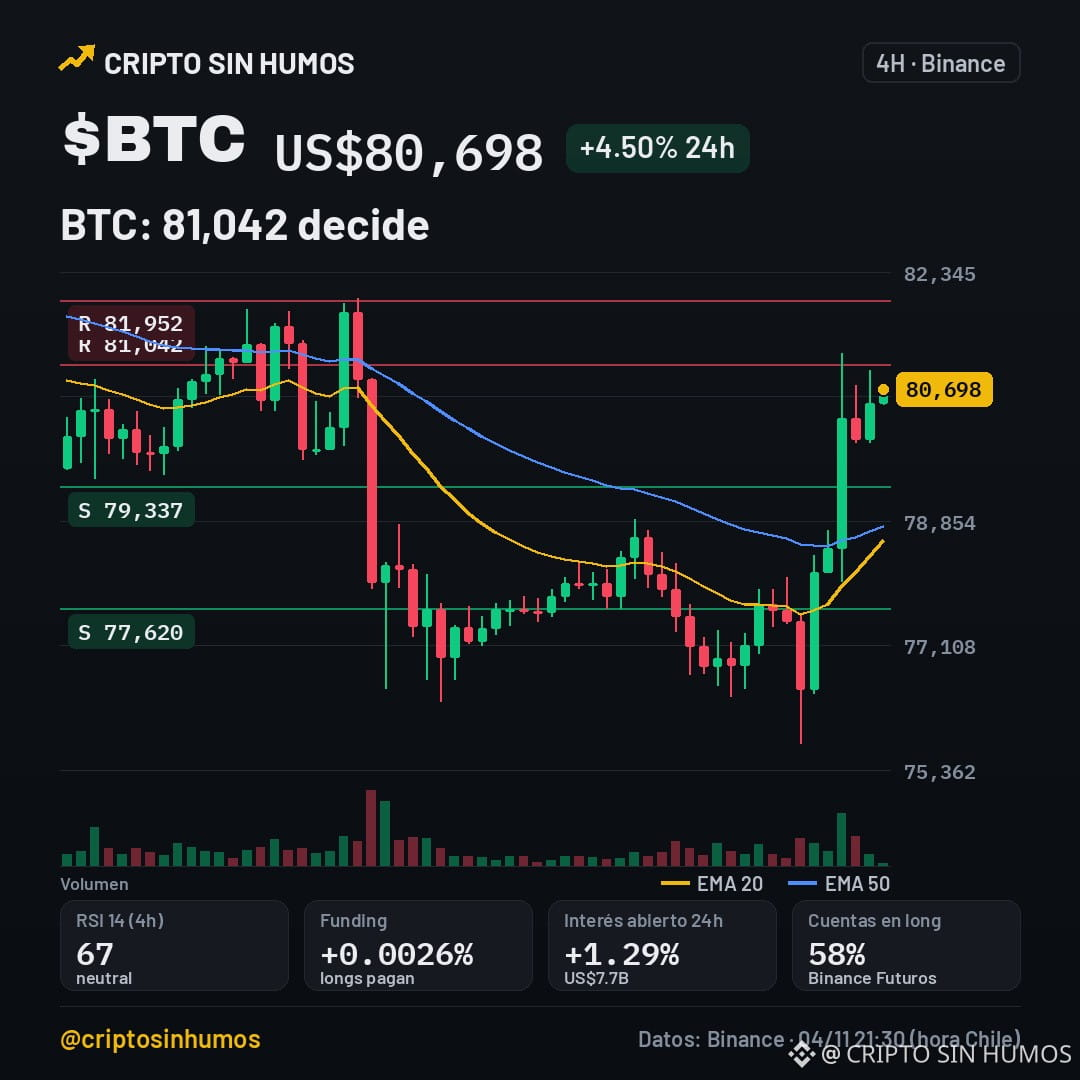
$BTC at 80,698: bullish pressure or pullback?
$BTC is under scrutiny following a report by CriptoNoticias: a Mercado Bitcoin hacker allegedly sold millions of dollars' worth of stolen crypto. The information has not yet been confirmed.
My take: if the selling pressure affects the markets, we could see bearish pressure on BTC, although long volume remains high (58%). I don't think it's a sign of a sustained decline, but keep an eye on the move.
On the 4h chart, $BTC is hovering around US$80,698. Key supports: 79,337 and 77,620. Resistances: 81,042 and 81,952.
Bullish scenario: if it breaks 81,042 and closes above, the next target is 81,952; any bounce below 79,337 would invalidate the trend and open a path to 77,620. Bearish scenario: a drop below 79,337 would trigger selling and target 77,620; a firm recovery above 81,042 would rule out the downside risk.
$SNDKB (-8.9%) and $ETH (+7.0%) are also on the move. Does it break 81,042 or fall back below 79,337? 🟢/🔴
#BTC #Blockchain
Not financial advice. Verify before investing.
$BTC at 80,698: bullish pressure or pullback?
$BTC is under scrutiny following a report by CriptoNoticias: a Mercado Bitcoin hacker allegedly sold millions of dollars' worth of stolen crypto. The information has not yet been confirmed.
My take: if the selling pressure affects the markets, we could see bearish pressure on BTC, although long volume remains high (58%). I don't think it's a sign of a sustained decline, but keep an eye on the move.
On the 4h chart, $BTC is hovering around US$80,698. Key supports: 79,337 and 77,620. Resistances: 81,042 and 81,952.
Bullish scenario: if it breaks 81,042 and closes above, the next target is 81,952; any bounce below 79,337 would invalidate the trend and open a path to 77,620. Bearish scenario: a drop below 79,337 would trigger selling and target 77,620; a firm recovery above 81,042 would rule out the downside risk.
$SNDKB (-8.9%) and $ETH (+7.0%) are also on the move. Does it break 81,042 or fall back below 79,337? 🟢/🔴
#BTC #Blockchain
Not financial advice. Verify before investing.
$BTC is under scrutiny following a report by CriptoNoticias: a Mercado Bitcoin hacker allegedly sold millions of dollars' worth of stolen crypto. The information has not yet been confirmed.
My take: if the selling pressure affects the markets, we could see bearish pressure on BTC, although long volume remains high (58%). I don't think it's a sign of a sustained decline, but keep an eye on the move.
On the 4h chart, $BTC is hovering around US$80,698. Key supports: 79,337 and 77,620. Resistances: 81,042 and 81,952.
Bullish scenario: if it breaks 81,042 and closes above, the next target is 81,952; any bounce below 79,337 would invalidate the trend and open a path to 77,620. Bearish scenario: a drop below 79,337 would trigger selling and target 77,620; a firm recovery above 81,042 would rule out the downside risk.
$SNDKB (-8.9%) and $ETH (+7.0%) are also on the move. Does it break 81,042 or fall back below 79,337? 🟢/🔴
#BTC #Blockchain
Not financial advice. Verify before investing.
141
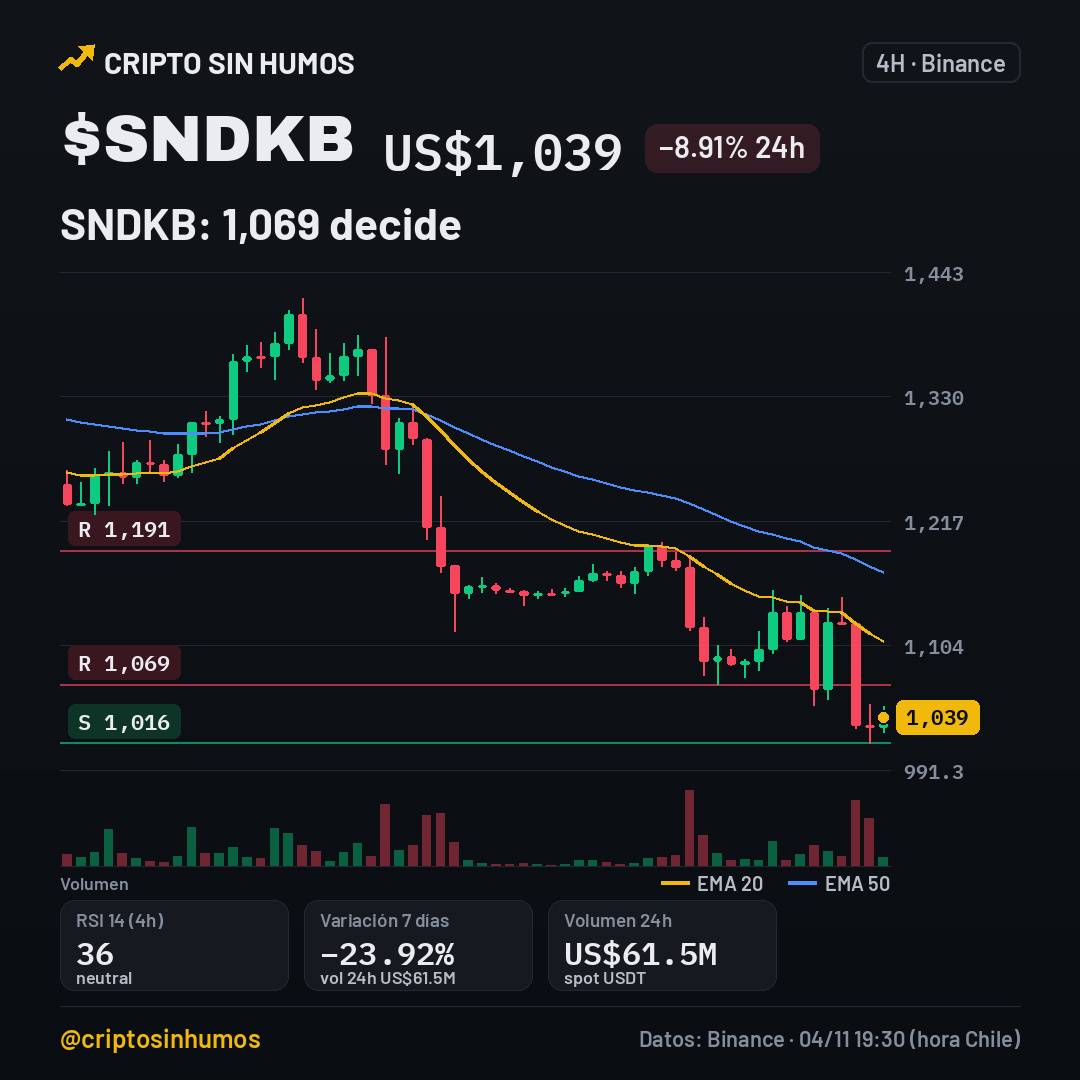
$SNDKB a 1,039: falling to 1,016 or bouncing at 1,069?
$SNDKB is trading at US$1,039, down 8.91% in 24h and 23.92% over 7 days. The range over the past day was between US$1,016 and US$1,149, with a volume of US$62 M.
On the 4h chart, the EMA20 (1,108) is below the EMA50 (1,171), confirming the bearish trend. The RSI at 36.1 suggests selling pressure, but it is not in extreme oversold territory.
The next key support is 1,016; if that level breaks, the bearish scenario points to the next resistance at 1,069 and, if that fails, 1,191. On the other hand, a strong bounce above 1,069 would invalidate the downtrend and pave the way to the next ceiling at 1,191.
$UNI (+7.7%) and $ZEC (+6.8%) are also moving, with volumes of US$65 M and US$263 M, respectively.
Will $SNDKB break 1,069 or test 1,016 again? 🟢/🔴
#SNDKB #DeFi
This is not financial advice. Do your own research before investing.
$SNDKB a 1,039: falling to 1,016 or bouncing at 1,069?
$SNDKB is trading at US$1,039, down 8.91% in 24h and 23.92% over 7 days. The range over the past day was between US$1,016 and US$1,149, with a volume of US$62 M.
On the 4h chart, the EMA20 (1,108) is below the EMA50 (1,171), confirming the bearish trend. The RSI at 36.1 suggests selling pressure, but it is not in extreme oversold territory.
The next key support is 1,016; if that level breaks, the bearish scenario points to the next resistance at 1,069 and, if that fails, 1,191. On the other hand, a strong bounce above 1,069 would invalidate the downtrend and pave the way to the next ceiling at 1,191.
$UNI (+7.7%) and $ZEC (+6.8%) are also moving, with volumes of US$65 M and US$263 M, respectively.
Will $SNDKB break 1,069 or test 1,016 again? 🟢/🔴
#SNDKB #DeFi
This is not financial advice. Do your own research before investing.
$SNDKB is trading at US$1,039, down 8.91% in 24h and 23.92% over 7 days. The range over the past day was between US$1,016 and US$1,149, with a volume of US$62 M.
On the 4h chart, the EMA20 (1,108) is below the EMA50 (1,171), confirming the bearish trend. The RSI at 36.1 suggests selling pressure, but it is not in extreme oversold territory.
The next key support is 1,016; if that level breaks, the bearish scenario points to the next resistance at 1,069 and, if that fails, 1,191. On the other hand, a strong bounce above 1,069 would invalidate the downtrend and pave the way to the next ceiling at 1,191.
$UNI (+7.7%) and $ZEC (+6.8%) are also moving, with volumes of US$65 M and US$263 M, respectively.
Will $SNDKB break 1,069 or test 1,016 again? 🟢/🔴
#SNDKB #DeFi
This is not financial advice. Do your own research before investing.
104
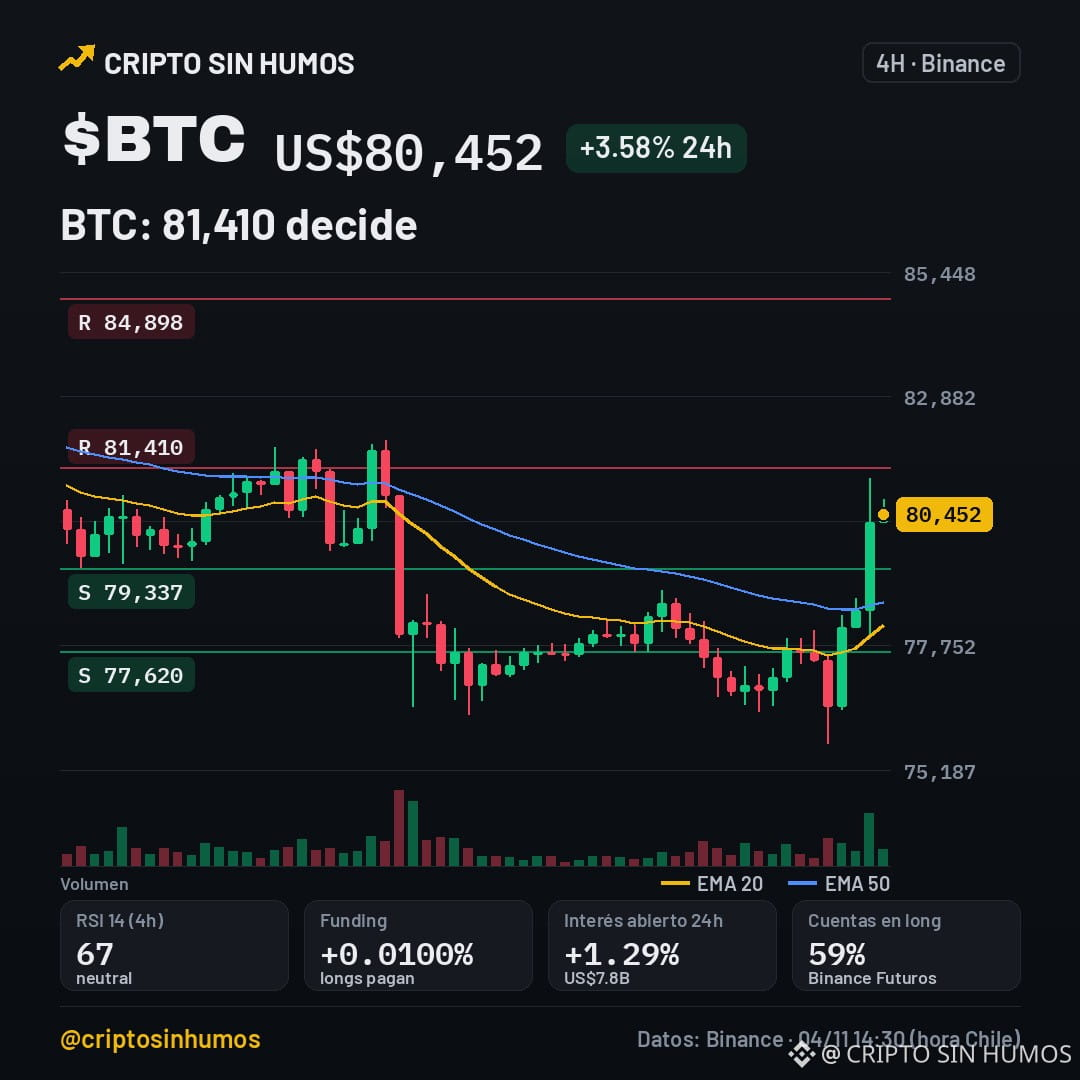
$BTC at $80,452: does it break 81,410 or fall to 79,337?
Coinbase says 99% of its customers’ assets are in cold storage after the $6.3 bn breach at Binance, according to The Block (0.5 h ago).
$BTC is at US$80,452, +3.58% in 24 h. The 24 h range is 75,736‑81,196 and volume is around US$1,598 M. $ZEC (+7.3%) and $NEAR (+7.1%) are also moving.
My take: if the funds outflow is confirmed, it could trigger fear and downward pressure on BTC; but the reaction may also be limited if investors trust custodians’ security.
Key support levels are 79,337 and 77,620; a drop below 79,337 would invalidate the bullish scenario and open the way for a correction toward 77,620. On the upside, immediate resistance is at 81,410; breaking it would validate a push toward 84,898.
Does it break 81,410 or test 79,337 again? 🟢/🔴
#BTC #ColdStorage #Binance
This is not financial advice. Do your own research before investing.
$BTC at $80,452: does it break 81,410 or fall to 79,337?
Coinbase says 99% of its customers’ assets are in cold storage after the $6.3 bn breach at Binance, according to The Block (0.5 h ago).
$BTC is at US$80,452, +3.58% in 24 h. The 24 h range is 75,736‑81,196 and volume is around US$1,598 M. $ZEC (+7.3%) and $NEAR (+7.1%) are also moving.
My take: if the funds outflow is confirmed, it could trigger fear and downward pressure on BTC; but the reaction may also be limited if investors trust custodians’ security.
Key support levels are 79,337 and 77,620; a drop below 79,337 would invalidate the bullish scenario and open the way for a correction toward 77,620. On the upside, immediate resistance is at 81,410; breaking it would validate a push toward 84,898.
Does it break 81,410 or test 79,337 again? 🟢/🔴
#BTC #ColdStorage #Binance
This is not financial advice. Do your own research before investing.
Coinbase says 99% of its customers’ assets are in cold storage after the $6.3 bn breach at Binance, according to The Block (0.5 h ago).
$BTC is at US$80,452, +3.58% in 24 h. The 24 h range is 75,736‑81,196 and volume is around US$1,598 M. $ZEC (+7.3%) and $NEAR (+7.1%) are also moving.
My take: if the funds outflow is confirmed, it could trigger fear and downward pressure on BTC; but the reaction may also be limited if investors trust custodians’ security.
Key support levels are 79,337 and 77,620; a drop below 79,337 would invalidate the bullish scenario and open the way for a correction toward 77,620. On the upside, immediate resistance is at 81,410; breaking it would validate a push toward 84,898.
Does it break 81,410 or test 79,337 again? 🟢/🔴
#BTC #ColdStorage #Binance
This is not financial advice. Do your own research before investing.
122
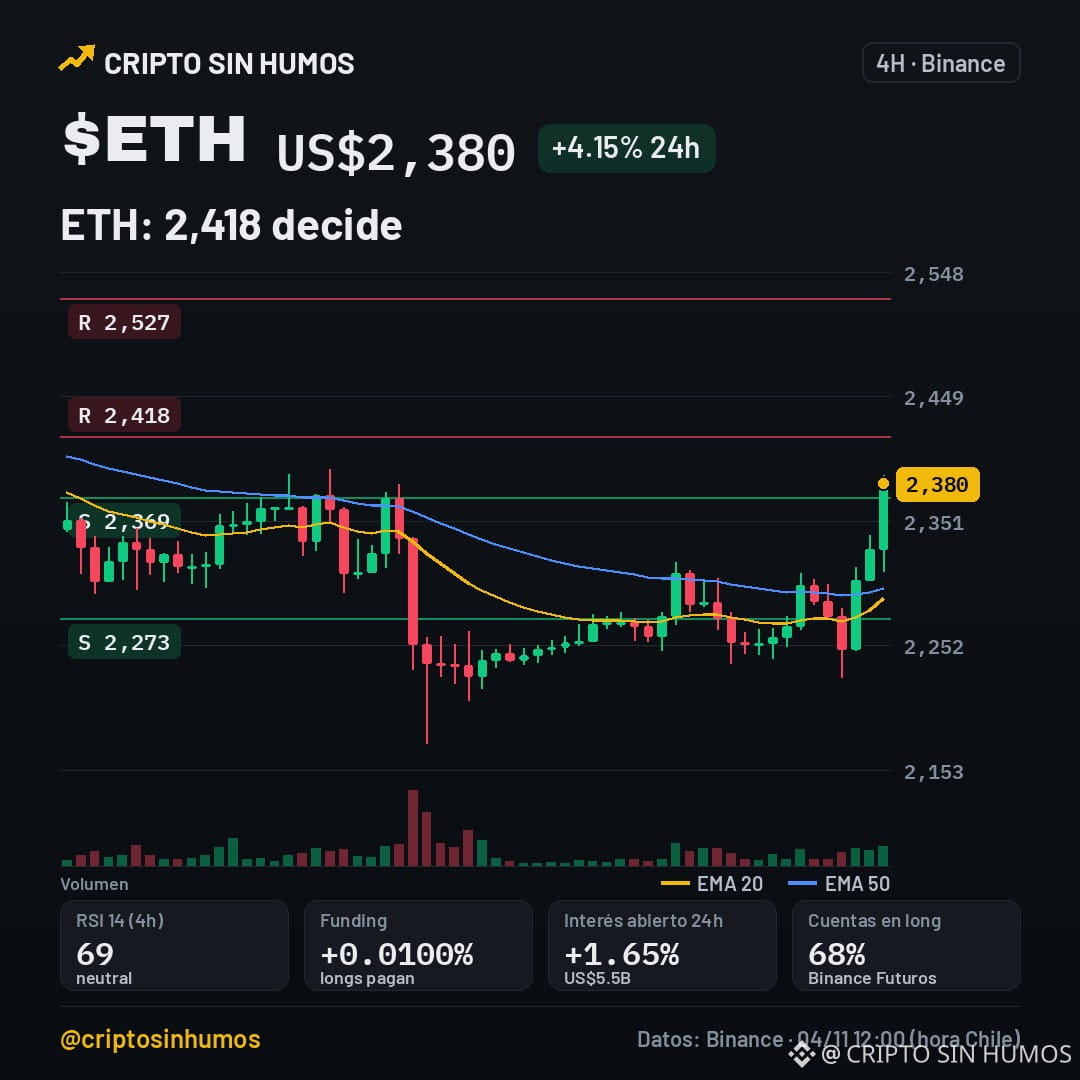
$ETH en 2,380: does it rise to 2,418 or fall to 2,273?
$ETH trades at US$2,380, up 4.15% in 24h. The day's range was between 2,226 and 2,387, and volume reached US$522 M. The EMA20 at 2,289 and EMA50 at 2,297 indicate a sideways trend; an RSI of 68.7 suggests there is still room to rise.
$ZEC (+11.1%) and $NEAR (+7.7%) are also moving.
Key support levels are 2,369 and 2,273, while resistance levels are at 2,418 and 2,527. In Binance futures, funding is +0.0100% every 8 h, and 68% of accounts are long, reinforcing upward pressure.
Bullish scenario: if it breaks through the 2,418 resistance, the next target would be 2,527; any close below 2,369 would invalidate the rally.
Bearish scenario: a drop below 2,273 would trigger a decline toward 2,226; staying above 2,418 would rule out the drop.
I wouldn't enter now without confirmation of a breakout; I'd rather wait for clarity. Will it break 2,418 or return to 2,369? 🟢🔴
#Ethereum #DeFi
This is not financial advice. Verify before investing.
$ETH en 2,380: does it rise to 2,418 or fall to 2,273?
$ETH trades at US$2,380, up 4.15% in 24h. The day's range was between 2,226 and 2,387, and volume reached US$522 M. The EMA20 at 2,289 and EMA50 at 2,297 indicate a sideways trend; an RSI of 68.7 suggests there is still room to rise.
$ZEC (+11.1%) and $NEAR (+7.7%) are also moving.
Key support levels are 2,369 and 2,273, while resistance levels are at 2,418 and 2,527. In Binance futures, funding is +0.0100% every 8 h, and 68% of accounts are long, reinforcing upward pressure.
Bullish scenario: if it breaks through the 2,418 resistance, the next target would be 2,527; any close below 2,369 would invalidate the rally.
Bearish scenario: a drop below 2,273 would trigger a decline toward 2,226; staying above 2,418 would rule out the drop.
I wouldn't enter now without confirmation of a breakout; I'd rather wait for clarity. Will it break 2,418 or return to 2,369? 🟢🔴
#Ethereum #DeFi
This is not financial advice. Verify before investing.
$ETH trades at US$2,380, up 4.15% in 24h. The day's range was between 2,226 and 2,387, and volume reached US$522 M. The EMA20 at 2,289 and EMA50 at 2,297 indicate a sideways trend; an RSI of 68.7 suggests there is still room to rise.
$ZEC (+11.1%) and $NEAR (+7.7%) are also moving.
Key support levels are 2,369 and 2,273, while resistance levels are at 2,418 and 2,527. In Binance futures, funding is +0.0100% every 8 h, and 68% of accounts are long, reinforcing upward pressure.
Bullish scenario: if it breaks through the 2,418 resistance, the next target would be 2,527; any close below 2,369 would invalidate the rally.
Bearish scenario: a drop below 2,273 would trigger a decline toward 2,226; staying above 2,418 would rule out the drop.
I wouldn't enter now without confirmation of a breakout; I'd rather wait for clarity. Will it break 2,418 or return to 2,369? 🟢🔴
#Ethereum #DeFi
This is not financial advice. Verify before investing.
65
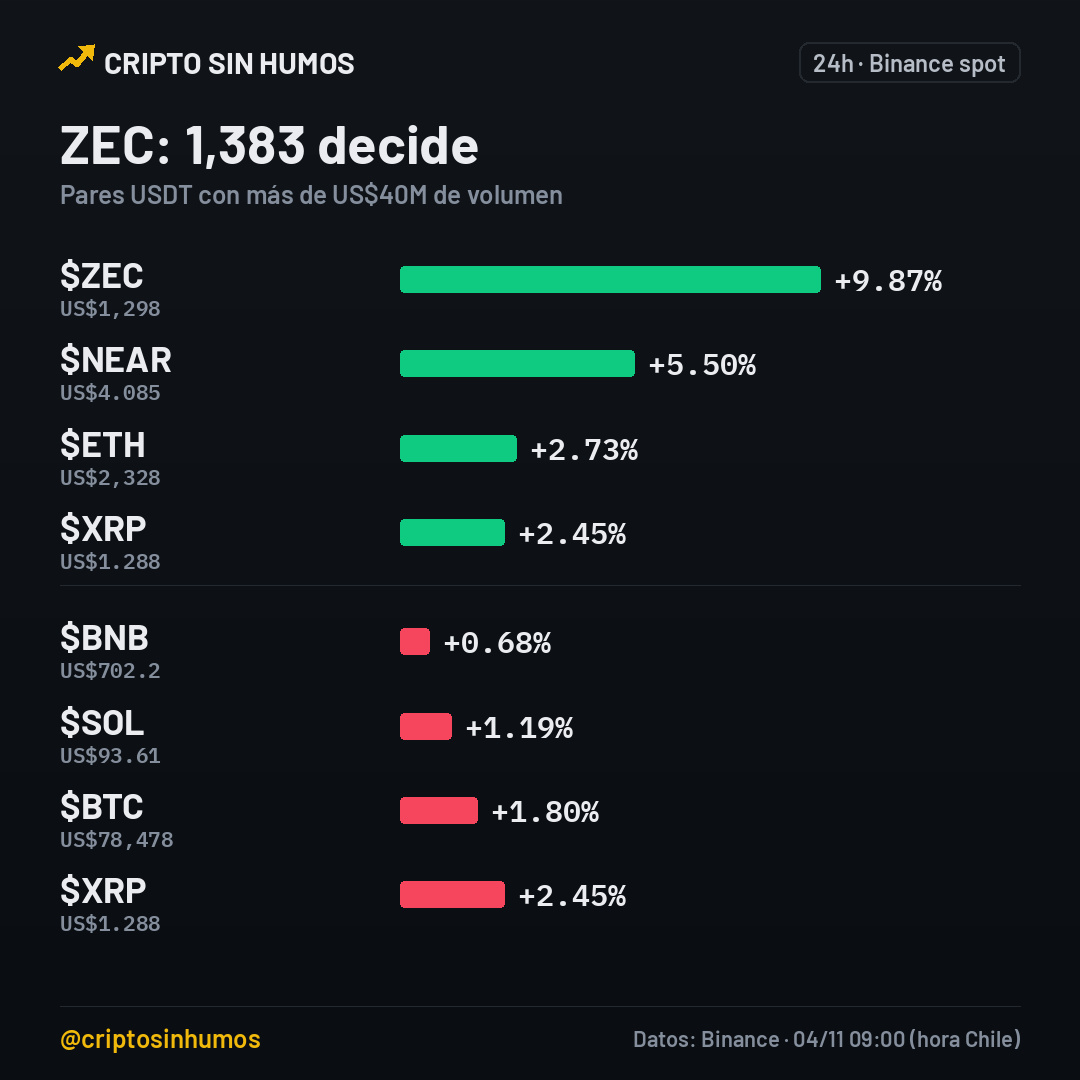
$ZEC a 1,299: Is the rally continuing or stalling?
$ZEC rose 10.03% in 24h and is trading at US$1,299. The RSI is at 60.8, while the EMA20 (1,232) and EMA50 (1,237) indicate a sideways range.
On the 24h radar, ZEC leads with +9.87%, followed by $NEAR (+5.6%) and $ETH (+2.8%). These pairs have over US$60 M in volume, giving them weight.
Key support levels are 1,231 and 1,119; the main resistance is at 1,383. If it breaks 1,383, the next target would be higher; if it falls below 1,231, the bearish scenario kicks in, with 1,119 in sight.
I wouldn’t enter without seeing a firm close above 1,383; positive funding and 37% longs suggest upward pressure, but the RSI isn’t in overbought territory.
Will it break 1,383 or return to 1,231? 🟢/🔴
#ZEC #DeFi #Futures
This is not financial advice. Do your own research before investing.
$ZEC a 1,299: Is the rally continuing or stalling?
$ZEC rose 10.03% in 24h and is trading at US$1,299. The RSI is at 60.8, while the EMA20 (1,232) and EMA50 (1,237) indicate a sideways range.
On the 24h radar, ZEC leads with +9.87%, followed by $NEAR (+5.6%) and $ETH (+2.8%). These pairs have over US$60 M in volume, giving them weight.
Key support levels are 1,231 and 1,119; the main resistance is at 1,383. If it breaks 1,383, the next target would be higher; if it falls below 1,231, the bearish scenario kicks in, with 1,119 in sight.
I wouldn’t enter without seeing a firm close above 1,383; positive funding and 37% longs suggest upward pressure, but the RSI isn’t in overbought territory.
Will it break 1,383 or return to 1,231? 🟢/🔴
#ZEC #DeFi #Futures
This is not financial advice. Do your own research before investing.
$ZEC rose 10.03% in 24h and is trading at US$1,299. The RSI is at 60.8, while the EMA20 (1,232) and EMA50 (1,237) indicate a sideways range.
On the 24h radar, ZEC leads with +9.87%, followed by $NEAR (+5.6%) and $ETH (+2.8%). These pairs have over US$60 M in volume, giving them weight.
Key support levels are 1,231 and 1,119; the main resistance is at 1,383. If it breaks 1,383, the next target would be higher; if it falls below 1,231, the bearish scenario kicks in, with 1,119 in sight.
I wouldn’t enter without seeing a firm close above 1,383; positive funding and 37% longs suggest upward pressure, but the RSI isn’t in overbought territory.
Will it break 1,383 or return to 1,231? 🟢/🔴
#ZEC #DeFi #Futures
This is not financial advice. Do your own research before investing.
155
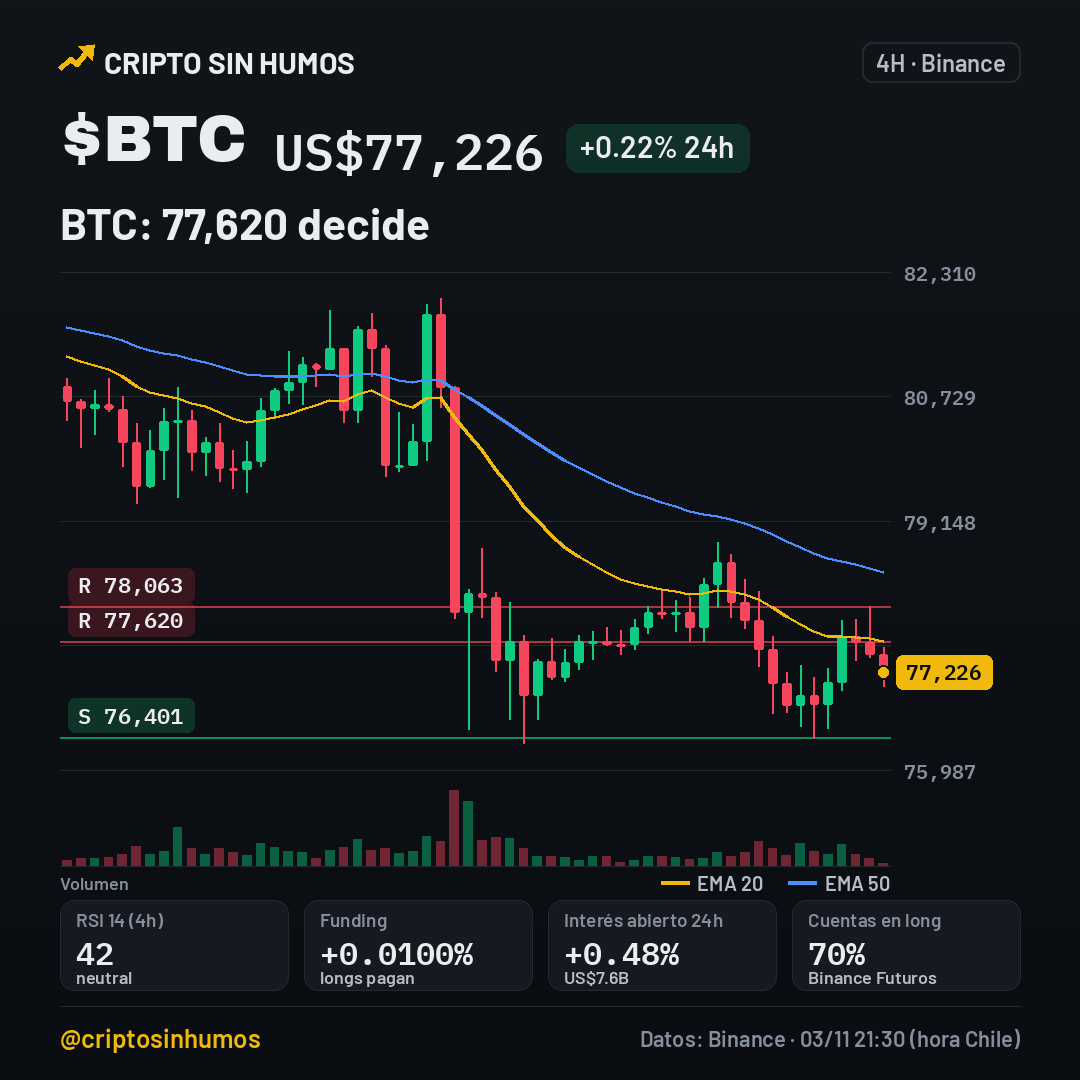
$BTC at $77,620: breakout or drop to support?
$BTC trades at US$77,226, while $ZEC rises +4.9% and $NEAR drops -1.9% in 24h.
According to Decrypt, Tether claims it holds 150,000 BTC, around 50,000 more than its reserves report indicates. (Source: Decrypt).
My take: if the figure is real, it could strengthen confidence in the stablecoin’s liquidity and boost bullish sentiment around BTC; but the lack of verification smells like a trap to me and could trigger downside volatility.
On the chart, key support is at 76,401 and the first resistance is at 77,620, followed by 78,063. A close above 77,620 would invalidate the bearish scenario; below 76,401 would confirm the downtrend.
Will it break 77,620 or return to 76,401? 🟢/🔴
#BTC #Tether
This is not financial advice. Verify before investing.
$BTC at $77,620: breakout or drop to support?
$BTC trades at US$77,226, while $ZEC rises +4.9% and $NEAR drops -1.9% in 24h.
According to Decrypt, Tether claims it holds 150,000 BTC, around 50,000 more than its reserves report indicates. (Source: Decrypt).
My take: if the figure is real, it could strengthen confidence in the stablecoin’s liquidity and boost bullish sentiment around BTC; but the lack of verification smells like a trap to me and could trigger downside volatility.
On the chart, key support is at 76,401 and the first resistance is at 77,620, followed by 78,063. A close above 77,620 would invalidate the bearish scenario; below 76,401 would confirm the downtrend.
Will it break 77,620 or return to 76,401? 🟢/🔴
#BTC #Tether
This is not financial advice. Verify before investing.
$BTC trades at US$77,226, while $ZEC rises +4.9% and $NEAR drops -1.9% in 24h.
According to Decrypt, Tether claims it holds 150,000 BTC, around 50,000 more than its reserves report indicates. (Source: Decrypt).
My take: if the figure is real, it could strengthen confidence in the stablecoin’s liquidity and boost bullish sentiment around BTC; but the lack of verification smells like a trap to me and could trigger downside volatility.
On the chart, key support is at 76,401 and the first resistance is at 77,620, followed by 78,063. A close above 77,620 would invalidate the bearish scenario; below 76,401 would confirm the downtrend.
Will it break 77,620 or return to 76,401? 🟢/🔴
#BTC #Tether
This is not financial advice. Verify before investing.
122
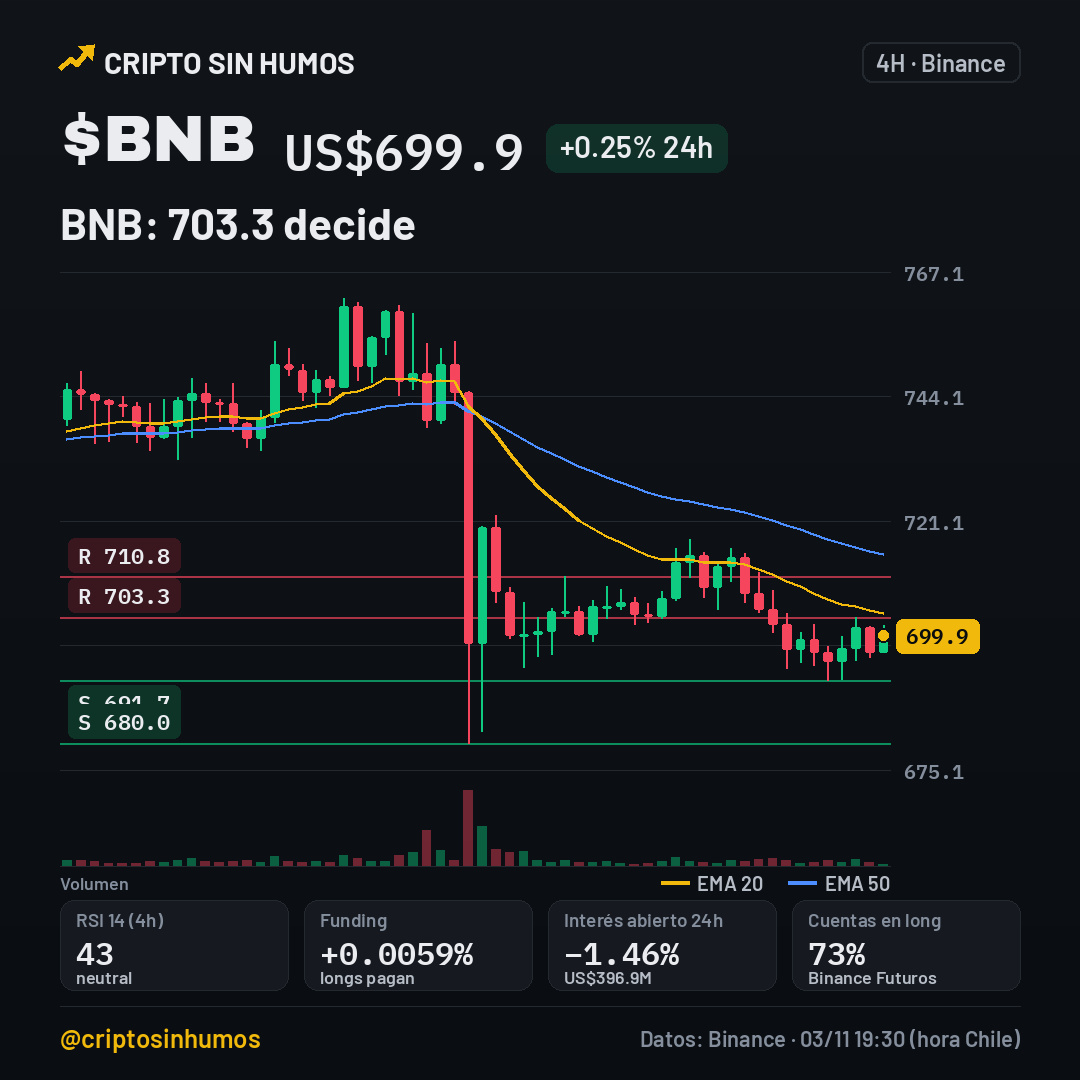
$BNB remains near 699.9: does it break 703.3 or fall to 680?
$BNB is trading at US$699.9, up a slight +0.25% over 24h. The day's range has been 691.7–703.3.
On the 4h chart, the EMA20 is at 704.1 and the EMA50 at 714.9, confirming the downtrend. The RSI14 at 43.1 indicates selling pressure but is not yet oversold. Key support is 691.7, followed by 680.0; resistance is 703.3, then 710.8.
Binance futures show funding at +0.0059% every 8h, and open interest fell 1.5% over 24h, even though 73% of accounts are long, with US$397 M at stake.
My take: as long as the price doesn't break 703.3, it remains trapped in a consolidation zone; a close above that level would point to 710.8. If it falls below 691.7, the next target would be 680. I wouldn't enter now; I'd wait for a bounce off support. $ZEC (+6.1%) and $XRP (+2.4%) are also moving.
Does it break 703.3 or return to 691.7? 🟢/🔴
#BNB #Binance
This is not financial advice. Do your own research before investing.
$BNB remains near 699.9: does it break 703.3 or fall to 680?
$BNB is trading at US$699.9, up a slight +0.25% over 24h. The day's range has been 691.7–703.3.
On the 4h chart, the EMA20 is at 704.1 and the EMA50 at 714.9, confirming the downtrend. The RSI14 at 43.1 indicates selling pressure but is not yet oversold. Key support is 691.7, followed by 680.0; resistance is 703.3, then 710.8.
Binance futures show funding at +0.0059% every 8h, and open interest fell 1.5% over 24h, even though 73% of accounts are long, with US$397 M at stake.
My take: as long as the price doesn't break 703.3, it remains trapped in a consolidation zone; a close above that level would point to 710.8. If it falls below 691.7, the next target would be 680. I wouldn't enter now; I'd wait for a bounce off support. $ZEC (+6.1%) and $XRP (+2.4%) are also moving.
Does it break 703.3 or return to 691.7? 🟢/🔴
#BNB #Binance
This is not financial advice. Do your own research before investing.
$BNB is trading at US$699.9, up a slight +0.25% over 24h. The day's range has been 691.7–703.3.
On the 4h chart, the EMA20 is at 704.1 and the EMA50 at 714.9, confirming the downtrend. The RSI14 at 43.1 indicates selling pressure but is not yet oversold. Key support is 691.7, followed by 680.0; resistance is 703.3, then 710.8.
Binance futures show funding at +0.0059% every 8h, and open interest fell 1.5% over 24h, even though 73% of accounts are long, with US$397 M at stake.
My take: as long as the price doesn't break 703.3, it remains trapped in a consolidation zone; a close above that level would point to 710.8. If it falls below 691.7, the next target would be 680. I wouldn't enter now; I'd wait for a bounce off support. $ZEC (+6.1%) and $XRP (+2.4%) are also moving.
Does it break 703.3 or return to 691.7? 🟢/🔴
#BNB #Binance
This is not financial advice. Do your own research before investing.
56
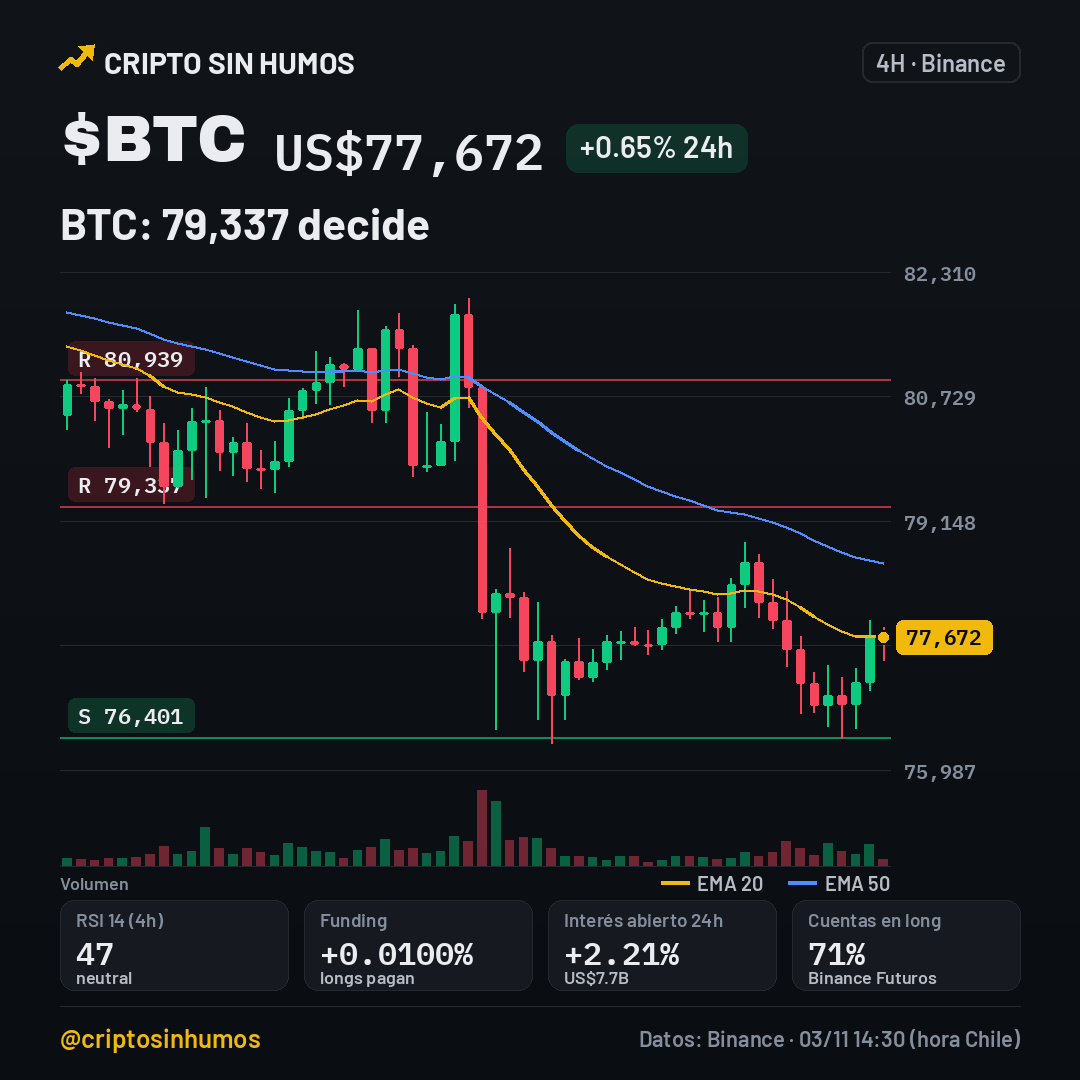
$BTC under pressure: break below 76,401 or bounce to 79,337?
$BTC is at the center of the latest controversy: CriptoNoticias revealed that a video call turned into a major scam that managed to infiltrate funds into Binance.
My take: until the news is officially confirmed, the rumor could cause fear and accelerate selling, pushing $BTC down.
On the 4h chart, we see EMA20 at 77,681 and EMA50 at 78,609, with a downtrend and RSI at 47.2. Key support is at 76,401; if it breaks, the next downside zone would be 74,000 (not shown). On the other hand, immediate resistance is at 79,337; a close above it would invalidate the bearish scenario and pave the way to 80,939.
$XRP (+3.2%) and $NEAR (-2.9%) are also moving over 24h.
Will it break 79,337 or return to 76,401? 🟢/🔴
#bitcoin #binance #futures
This is not financial advice. Verify before investing.
$BTC under pressure: break below 76,401 or bounce to 79,337?
$BTC is at the center of the latest controversy: CriptoNoticias revealed that a video call turned into a major scam that managed to infiltrate funds into Binance.
My take: until the news is officially confirmed, the rumor could cause fear and accelerate selling, pushing $BTC down.
On the 4h chart, we see EMA20 at 77,681 and EMA50 at 78,609, with a downtrend and RSI at 47.2. Key support is at 76,401; if it breaks, the next downside zone would be 74,000 (not shown). On the other hand, immediate resistance is at 79,337; a close above it would invalidate the bearish scenario and pave the way to 80,939.
$XRP (+3.2%) and $NEAR (-2.9%) are also moving over 24h.
Will it break 79,337 or return to 76,401? 🟢/🔴
#bitcoin #binance #futures
This is not financial advice. Verify before investing.
$BTC is at the center of the latest controversy: CriptoNoticias revealed that a video call turned into a major scam that managed to infiltrate funds into Binance.
My take: until the news is officially confirmed, the rumor could cause fear and accelerate selling, pushing $BTC down.
On the 4h chart, we see EMA20 at 77,681 and EMA50 at 78,609, with a downtrend and RSI at 47.2. Key support is at 76,401; if it breaks, the next downside zone would be 74,000 (not shown). On the other hand, immediate resistance is at 79,337; a close above it would invalidate the bearish scenario and pave the way to 80,939.
$XRP (+3.2%) and $NEAR (-2.9%) are also moving over 24h.
Will it break 79,337 or return to 76,401? 🟢/🔴
#bitcoin #binance #futures
This is not financial advice. Verify before investing.
158
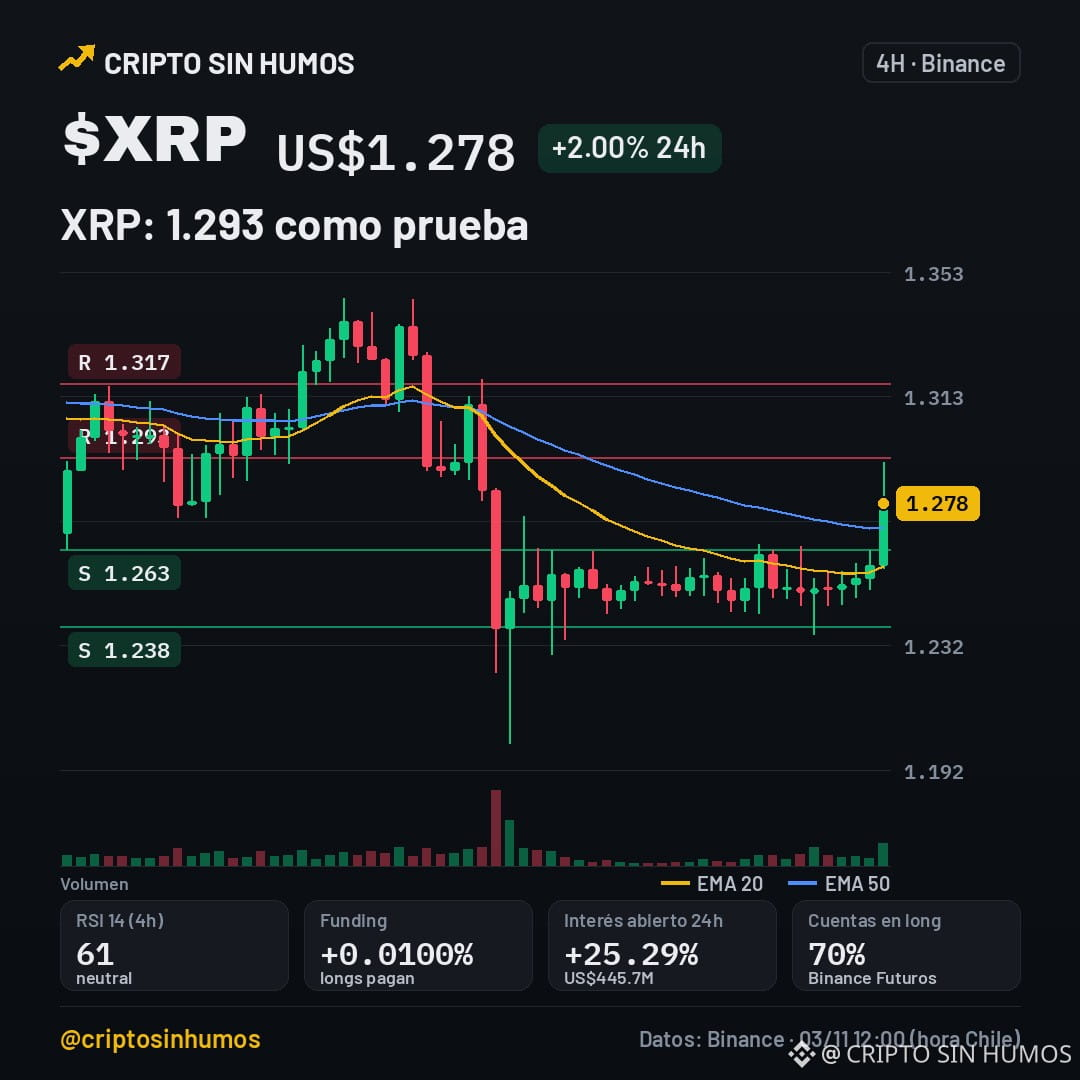
$XRP in 1.28: next surge or pullback?
$XRP rose 2% in 24h and is trading at US$1.278. The day's range was 1.236‑1.291 and volume reached $109 M. On the 4h chart, we see a sideways trend, EMA20 at 1.258 and EMA50 at 1.27, with RSI14 at 61.4.
$ZEC (-5.8%) and $NEAR (-5.2%) are also moving, with volumes of $221 M and $93 M respectively.
Binance futures show funding at +0.0100% every 8h, open interest rose 25.3% to $446 M, and 70% of accounts are long, indicating bullish pressure but also reversal risk.
Bullish scenario: if it breaks the resistance at 1.293, the next target would be 1.317; any drop below 1.263 invalidates this view. Bearish scenario: a break below 1.238 would open the way to 1.236, while moving back above 1.263 would rule out the drop.
I wouldn't enter now; the RSI doesn't show overbought conditions, and the market is waiting for a trigger. Does it break 1.293 or return to 1.263? 🟢/🔴
#XRP #Ripple #Futures
This is not financial advice. Verify before investing.
$XRP in 1.28: next surge or pullback?
$XRP rose 2% in 24h and is trading at US$1.278. The day's range was 1.236‑1.291 and volume reached $109 M. On the 4h chart, we see a sideways trend, EMA20 at 1.258 and EMA50 at 1.27, with RSI14 at 61.4.
$ZEC (-5.8%) and $NEAR (-5.2%) are also moving, with volumes of $221 M and $93 M respectively.
Binance futures show funding at +0.0100% every 8h, open interest rose 25.3% to $446 M, and 70% of accounts are long, indicating bullish pressure but also reversal risk.
Bullish scenario: if it breaks the resistance at 1.293, the next target would be 1.317; any drop below 1.263 invalidates this view. Bearish scenario: a break below 1.238 would open the way to 1.236, while moving back above 1.263 would rule out the drop.
I wouldn't enter now; the RSI doesn't show overbought conditions, and the market is waiting for a trigger. Does it break 1.293 or return to 1.263? 🟢/🔴
#XRP #Ripple #Futures
This is not financial advice. Verify before investing.
$XRP rose 2% in 24h and is trading at US$1.278. The day's range was 1.236‑1.291 and volume reached $109 M. On the 4h chart, we see a sideways trend, EMA20 at 1.258 and EMA50 at 1.27, with RSI14 at 61.4.
$ZEC (-5.8%) and $NEAR (-5.2%) are also moving, with volumes of $221 M and $93 M respectively.
Binance futures show funding at +0.0100% every 8h, open interest rose 25.3% to $446 M, and 70% of accounts are long, indicating bullish pressure but also reversal risk.
Bullish scenario: if it breaks the resistance at 1.293, the next target would be 1.317; any drop below 1.263 invalidates this view. Bearish scenario: a break below 1.238 would open the way to 1.236, while moving back above 1.263 would rule out the drop.
I wouldn't enter now; the RSI doesn't show overbought conditions, and the market is waiting for a trigger. Does it break 1.293 or return to 1.263? 🟢/🔴
#XRP #Ripple #Futures
This is not financial advice. Verify before investing.
188
$SOL below 92.5, next support?
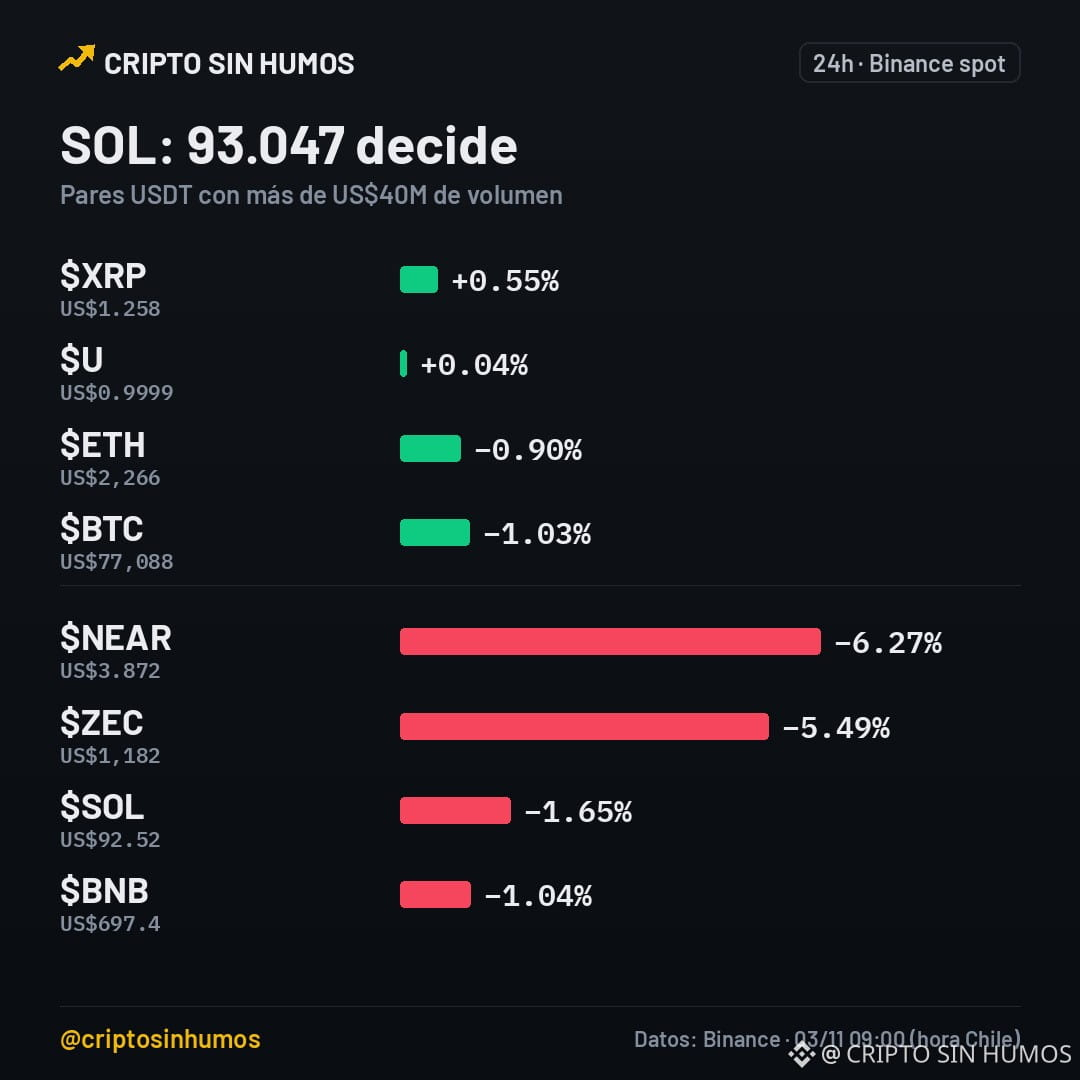
$SOL is trading at US$92.5, down 1.69% over 24h. The 4h trend remains bearish, and the RSI is at 35.1, indicating downward pressure.
On the 24h radar, $NEAR is plunging 6.27% and $ZEC is falling 5.49%, the sharpest moves in the group. XRP is barely up 0.55%, but the action in $NEAR and $ZEC points to nervousness in the sector.
Key support is at 90.87, with resistance at 93.047 and 94.96. The EMAs point to 94.078 (EMA20) and 96.745 (EMA50), both above the current price, confirming the bearish trend.
Bullish scenario: if $SOL breaks through the 93.047 resistance, the next target would be resistance at 94.96; any drop below 90.87 would invalidate this outlook. Bearish scenario: a break below 90.87 would open the door to further selling and reinforce the bearish trend.
Will it break through 93.047 or return to 90.87? 🟢/🔴
#Solana #DeFi
This is not financial advice. Do your own research before investing.
$SOL below 92.5, next support?
$SOL is trading at US$92.5, down 1.69% over 24h. The 4h trend remains bearish, and the RSI is at 35.1, indicating downward pressure.
On the 24h radar, $NEAR is plunging 6.27% and $ZEC is falling 5.49%, the sharpest moves in the group. XRP is barely up 0.55%, but the action in $NEAR and $ZEC points to nervousness in the sector.
Key support is at 90.87, with resistance at 93.047 and 94.96. The EMAs point to 94.078 (EMA20) and 96.745 (EMA50), both above the current price, confirming the bearish trend.
Bullish scenario: if $SOL breaks through the 93.047 resistance, the next target would be resistance at 94.96; any drop below 90.87 would invalidate this outlook. Bearish scenario: a break below 90.87 would open the door to further selling and reinforce the bearish trend.
Will it break through 93.047 or return to 90.87? 🟢/🔴
#Solana #DeFi
This is not financial advice. Do your own research before investing.
$SOL is trading at US$92.5, down 1.69% over 24h. The 4h trend remains bearish, and the RSI is at 35.1, indicating downward pressure.
On the 24h radar, $NEAR is plunging 6.27% and $ZEC is falling 5.49%, the sharpest moves in the group. XRP is barely up 0.55%, but the action in $NEAR and $ZEC points to nervousness in the sector.
Key support is at 90.87, with resistance at 93.047 and 94.96. The EMAs point to 94.078 (EMA20) and 96.745 (EMA50), both above the current price, confirming the bearish trend.
Bullish scenario: if $SOL breaks through the 93.047 resistance, the next target would be resistance at 94.96; any drop below 90.87 would invalidate this outlook. Bearish scenario: a break below 90.87 would open the door to further selling and reinforce the bearish trend.
Will it break through 93.047 or return to 90.87? 🟢/🔴
#Solana #DeFi
This is not financial advice. Do your own research before investing.
1
1
177
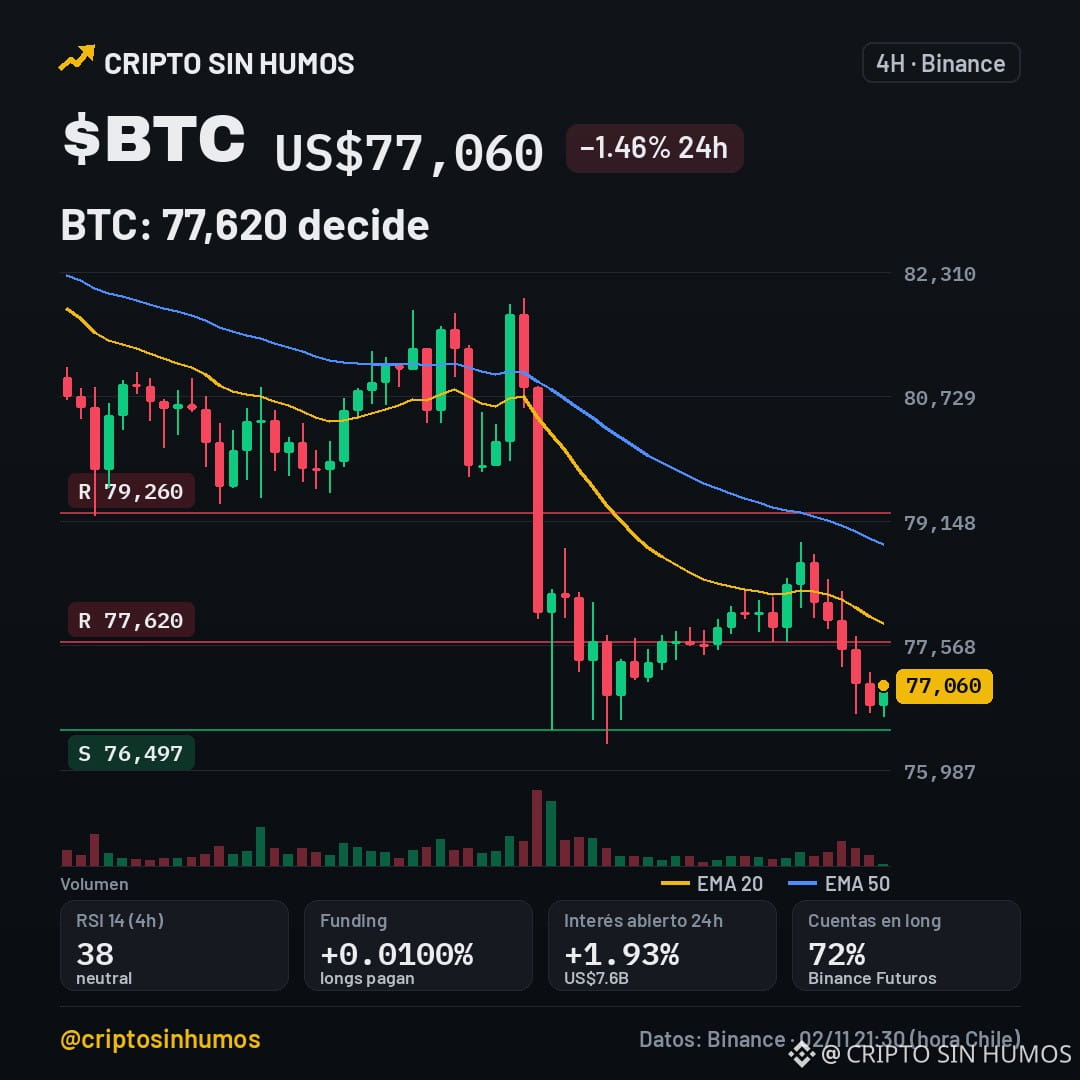
$BTC at 77,620: Is it testing resistance or seeking support?
$BTC is trading at US$77,060, down 1.46% in 24 hours. According to CriptoNoticias, North Korean hackers stole a large sum so far in 2026, an event that has yet to be confirmed.
$NEAR (-9.4%) and $ZEC (-6.5%) are also moving.
My take: the news could erode confidence and put downward pressure on $BTC, although the RSI at 38.1 and the EMA20 at 77,849 provide some support. The market is in a downtrend on the 4-hour chart.
If it breaks the key resistance at 77,620, the next target would be the 79,260 zone, invalidating the bearish scenario. However, if the price falls below support at 76,497, that support level is invalidated, and we could see additional downward pressure.
Will it break 77,620 or return to 76,497? 🟢/🔴
#btc #futuros #hackers
This is not financial advice. Do your own research before investing.
$BTC at 77,620: Is it testing resistance or seeking support?
$BTC is trading at US$77,060, down 1.46% in 24 hours. According to CriptoNoticias, North Korean hackers stole a large sum so far in 2026, an event that has yet to be confirmed.
$NEAR (-9.4%) and $ZEC (-6.5%) are also moving.
My take: the news could erode confidence and put downward pressure on $BTC , although the RSI at 38.1 and the EMA20 at 77,849 provide some support. The market is in a downtrend on the 4-hour chart.
If it breaks the key resistance at 77,620, the next target would be the 79,260 zone, invalidating the bearish scenario. However, if the price falls below support at 76,497, that support level is invalidated, and we could see additional downward pressure.
Will it break 77,620 or return to 76,497? 🟢/🔴
#btc #futuros #hackers
This is not financial advice. Do your own research before investing.
$BTC is trading at US$77,060, down 1.46% in 24 hours. According to CriptoNoticias, North Korean hackers stole a large sum so far in 2026, an event that has yet to be confirmed.
$NEAR (-9.4%) and $ZEC (-6.5%) are also moving.
My take: the news could erode confidence and put downward pressure on $BTC , although the RSI at 38.1 and the EMA20 at 77,849 provide some support. The market is in a downtrend on the 4-hour chart.
If it breaks the key resistance at 77,620, the next target would be the 79,260 zone, invalidating the bearish scenario. However, if the price falls below support at 76,497, that support level is invalidated, and we could see additional downward pressure.
Will it break 77,620 or return to 76,497? 🟢/🔴
#btc #futuros #hackers
This is not financial advice. Do your own research before investing.
109
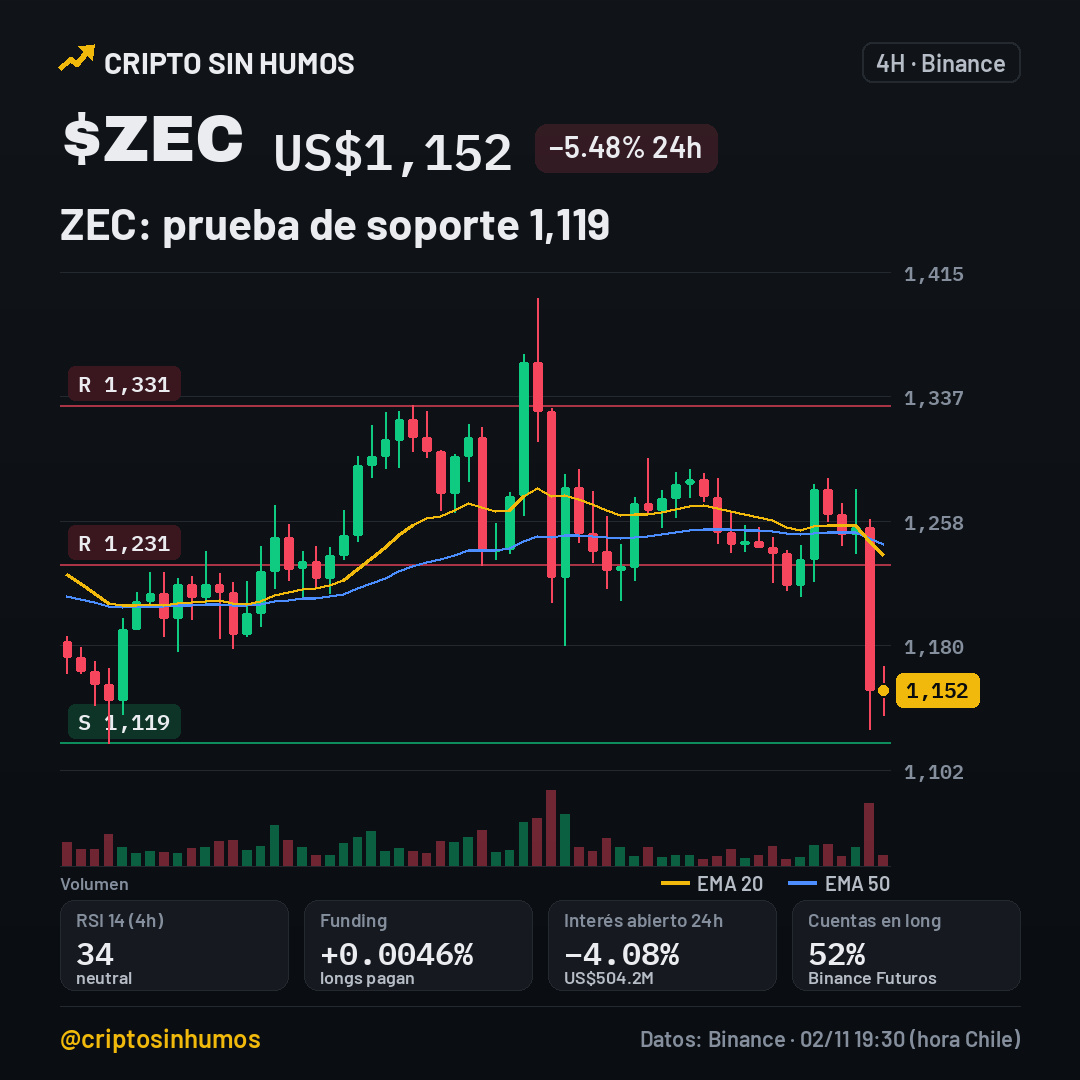
$ZEC a 1,152: Does it lose 1,119 or rise to 1,231?
Today we see $ZEC trading at US$1,152, down 5.48% over 24 hours. The daily range was between 1,127 and 1,285, and volume of $185M indicates moderate interest.
On the 4-hour chart, the EMA20 is at 1,236 and the EMA50 at 1,244, both above the price, confirming the downtrend. The RSI at 34.3 suggests there is still room for further declines.
The critical levels are: support at 1,119; resistance at 1,231 and 1,331. If the price breaks below 1,119, the bearish scenario is confirmed, and we could see a drop toward 1,027. A rebound above 1,231 would invalidate the downtrend and open the way to 1,331.
On Binance futures, funding is +0.0046% every 8 hours, and open interest fell 4.1% over 24 hours, with 52% of accounts holding long positions. I wouldn’t enter now; the market is showing bearish pressure, and positive funding penalizes longs.
$NEAR (-8.8%) and $SOL (-1.8%) are also on the move. Does it break 1,231 or return to 1,119? 🟢/🔴
#ZEC #DeFi
This is not financial advice. Do your own research before investing.
$ZEC a 1,152: Does it lose 1,119 or rise to 1,231?
Today we see $ZEC trading at US$1,152, down 5.48% over 24 hours. The daily range was between 1,127 and 1,285, and volume of $185M indicates moderate interest.
On the 4-hour chart, the EMA20 is at 1,236 and the EMA50 at 1,244, both above the price, confirming the downtrend. The RSI at 34.3 suggests there is still room for further declines.
The critical levels are: support at 1,119; resistance at 1,231 and 1,331. If the price breaks below 1,119, the bearish scenario is confirmed, and we could see a drop toward 1,027. A rebound above 1,231 would invalidate the downtrend and open the way to 1,331.
On Binance futures, funding is +0.0046% every 8 hours, and open interest fell 4.1% over 24 hours, with 52% of accounts holding long positions. I wouldn’t enter now; the market is showing bearish pressure, and positive funding penalizes longs.
$NEAR (-8.8%) and $SOL (-1.8%) are also on the move. Does it break 1,231 or return to 1,119? 🟢/🔴
#ZEC #DeFi
This is not financial advice. Do your own research before investing.
Today we see $ZEC trading at US$1,152, down 5.48% over 24 hours. The daily range was between 1,127 and 1,285, and volume of $185M indicates moderate interest.
On the 4-hour chart, the EMA20 is at 1,236 and the EMA50 at 1,244, both above the price, confirming the downtrend. The RSI at 34.3 suggests there is still room for further declines.
The critical levels are: support at 1,119; resistance at 1,231 and 1,331. If the price breaks below 1,119, the bearish scenario is confirmed, and we could see a drop toward 1,027. A rebound above 1,231 would invalidate the downtrend and open the way to 1,331.
On Binance futures, funding is +0.0046% every 8 hours, and open interest fell 4.1% over 24 hours, with 52% of accounts holding long positions. I wouldn’t enter now; the market is showing bearish pressure, and positive funding penalizes longs.
$NEAR (-8.8%) and $SOL (-1.8%) are also on the move. Does it break 1,231 or return to 1,119? 🟢/🔴
#ZEC #DeFi
This is not financial advice. Do your own research before investing.
240
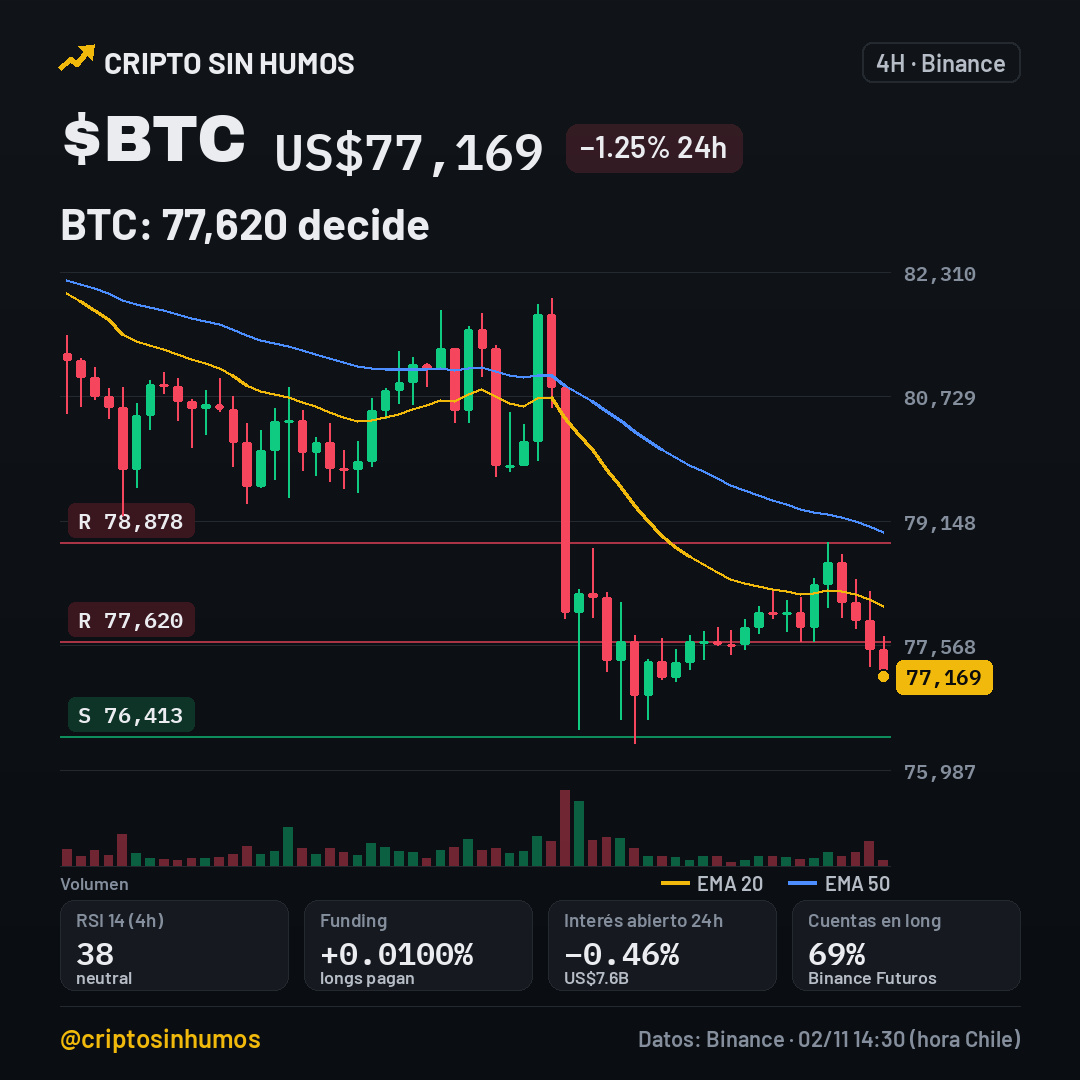
$BTC a 77,620: break resistance or fall to support?
Binance has completed its latest proof of reserves, attempting to return assets and enable withdrawals after the record-breaking hack, according to The Block (0.6 hours ago). $BTC trades at US$77,169, down 1.25% in 24 hours.
My read: the proof boosts confidence in Binance, but it doesn’t imply a buying frenzy for Bitcoin. With positive funding and 69% of accounts long, bearish momentum remains dominant (RSI 37.5).
$NEAR (-8.7%) and $ZEC (-3.8%) are also moving.
On the 4-hour chart, key support is at 76,413; if it breaks downward, the decline could head toward 75,000. Immediate resistance is at 77,620; breaking above it would invalidate the bearish scenario and open the way to 78,878.
Will it break 77,620 or return to 76,413? 🟢/🔴
#Bitcoin #Binance #ProofOfReserves
This is not financial advice. Do your research before investing.
$BTC a 77,620: break resistance or fall to support?
Binance has completed its latest proof of reserves, attempting to return assets and enable withdrawals after the record-breaking hack, according to The Block (0.6 hours ago). $BTC trades at US$77,169, down 1.25% in 24 hours.
My read: the proof boosts confidence in Binance, but it doesn’t imply a buying frenzy for Bitcoin. With positive funding and 69% of accounts long, bearish momentum remains dominant (RSI 37.5).
$NEAR (-8.7%) and $ZEC (-3.8%) are also moving.
On the 4-hour chart, key support is at 76,413; if it breaks downward, the decline could head toward 75,000. Immediate resistance is at 77,620; breaking above it would invalidate the bearish scenario and open the way to 78,878.
Will it break 77,620 or return to 76,413? 🟢/🔴
#Bitcoin #Binance #ProofOfReserves
This is not financial advice. Do your research before investing.
Binance has completed its latest proof of reserves, attempting to return assets and enable withdrawals after the record-breaking hack, according to The Block (0.6 hours ago). $BTC trades at US$77,169, down 1.25% in 24 hours.
My read: the proof boosts confidence in Binance, but it doesn’t imply a buying frenzy for Bitcoin. With positive funding and 69% of accounts long, bearish momentum remains dominant (RSI 37.5).
$NEAR (-8.7%) and $ZEC (-3.8%) are also moving.
On the 4-hour chart, key support is at 76,413; if it breaks downward, the decline could head toward 75,000. Immediate resistance is at 77,620; breaking above it would invalidate the bearish scenario and open the way to 78,878.
Will it break 77,620 or return to 76,413? 🟢/🔴
#Bitcoin #Binance #ProofOfReserves
This is not financial advice. Do your research before investing.
233
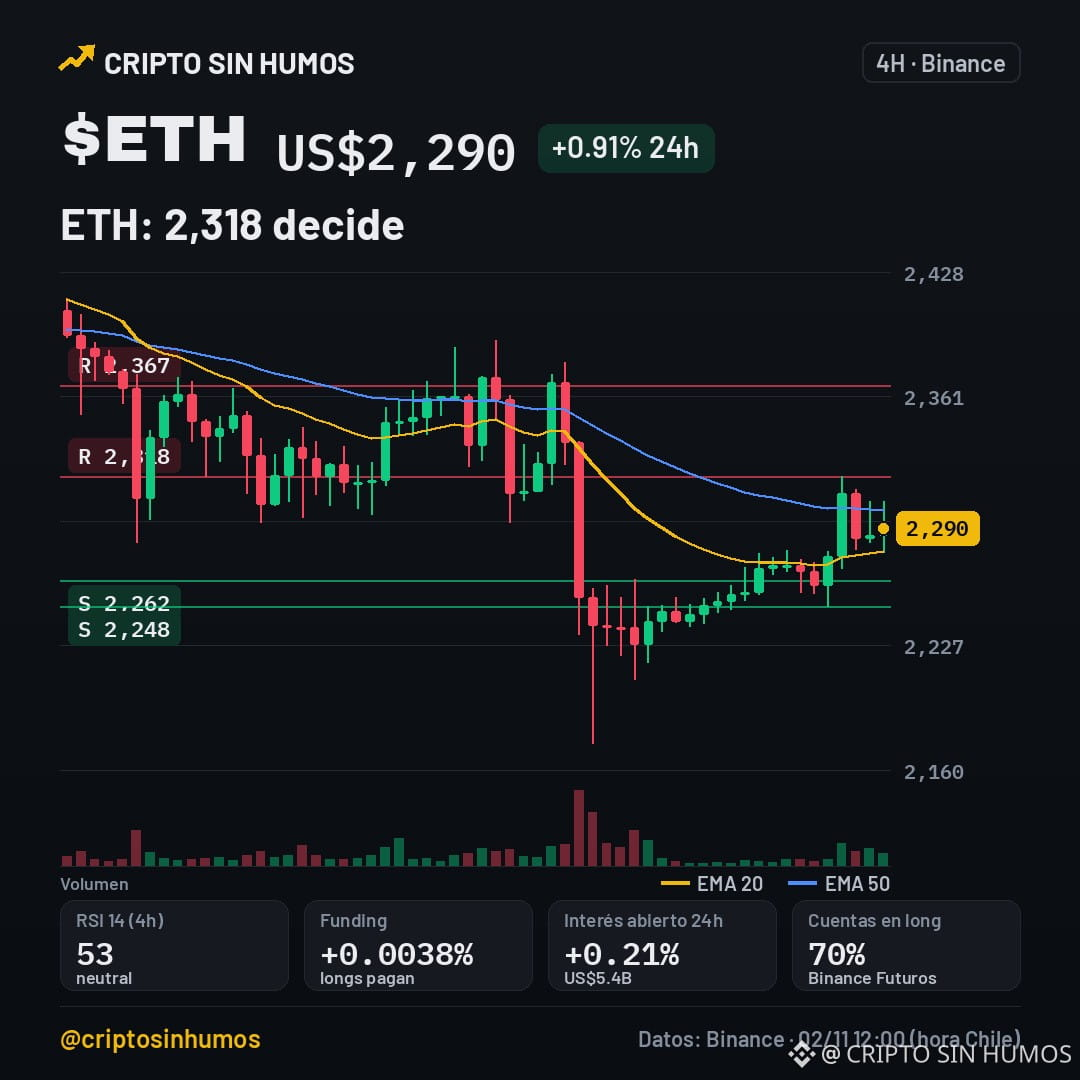
$ETH a 2,290: will it break out of the sideways range?
$ETH is trading at US$2,290, +0.91% over 24h, within the US$2,248–2,318 range. 24h volume is US$505 M.
On the 4h timeframe, the EMA20 is at 2,278 and the EMA50 at 2,300, with an RSI of 52.9 indicating a lack of momentum. The trend appears sideways.
Key support levels are 2,262 and 2,248; resistance levels are 2,318 and 2,367. If the price breaks above 2,318, the bullish scenario is activated, with a target of 2,367. A close below 2,262 would invalidate the bullish bias and could take us to 2,248.
On Binance futures, funding is +0.0038 % every 8 h and open interest rose 0.2 % in 24h, reaching US$5,381 M, with 70 % of accounts long—suggesting bullish pressure, but also liquidation risk.
I wouldn’t enter now without seeing clear confirmation; chasing the sideways range feels like a trap. $NEAR (-6.7%) and $ZEC (+1.8%) are also moving. Will it break 2,318 or return to 2,262? 🔴🟢
#Ethereum #DeFi #Futures
This is not financial advice. Verify before investing.
$ETH a 2,290: will it break out of the sideways range?
$ETH is trading at US$2,290, +0.91% over 24h, within the US$2,248–2,318 range. 24h volume is US$505 M.
On the 4h timeframe, the EMA20 is at 2,278 and the EMA50 at 2,300, with an RSI of 52.9 indicating a lack of momentum. The trend appears sideways.
Key support levels are 2,262 and 2,248; resistance levels are 2,318 and 2,367. If the price breaks above 2,318, the bullish scenario is activated, with a target of 2,367. A close below 2,262 would invalidate the bullish bias and could take us to 2,248.
On Binance futures, funding is +0.0038 % every 8 h and open interest rose 0.2 % in 24h, reaching US$5,381 M, with 70 % of accounts long—suggesting bullish pressure, but also liquidation risk.
I wouldn’t enter now without seeing clear confirmation; chasing the sideways range feels like a trap. $NEAR (-6.7%) and $ZEC (+1.8%) are also moving. Will it break 2,318 or return to 2,262? 🔴🟢
#Ethereum #DeFi #Futures
This is not financial advice. Verify before investing.
$ETH is trading at US$2,290, +0.91% over 24h, within the US$2,248–2,318 range. 24h volume is US$505 M.
On the 4h timeframe, the EMA20 is at 2,278 and the EMA50 at 2,300, with an RSI of 52.9 indicating a lack of momentum. The trend appears sideways.
Key support levels are 2,262 and 2,248; resistance levels are 2,318 and 2,367. If the price breaks above 2,318, the bullish scenario is activated, with a target of 2,367. A close below 2,262 would invalidate the bullish bias and could take us to 2,248.
On Binance futures, funding is +0.0038 % every 8 h and open interest rose 0.2 % in 24h, reaching US$5,381 M, with 70 % of accounts long—suggesting bullish pressure, but also liquidation risk.
I wouldn’t enter now without seeing clear confirmation; chasing the sideways range feels like a trap. $NEAR (-6.7%) and $ZEC (+1.8%) are also moving. Will it break 2,318 or return to 2,262? 🔴🟢
#Ethereum #DeFi #Futures
This is not financial advice. Verify before investing.
162
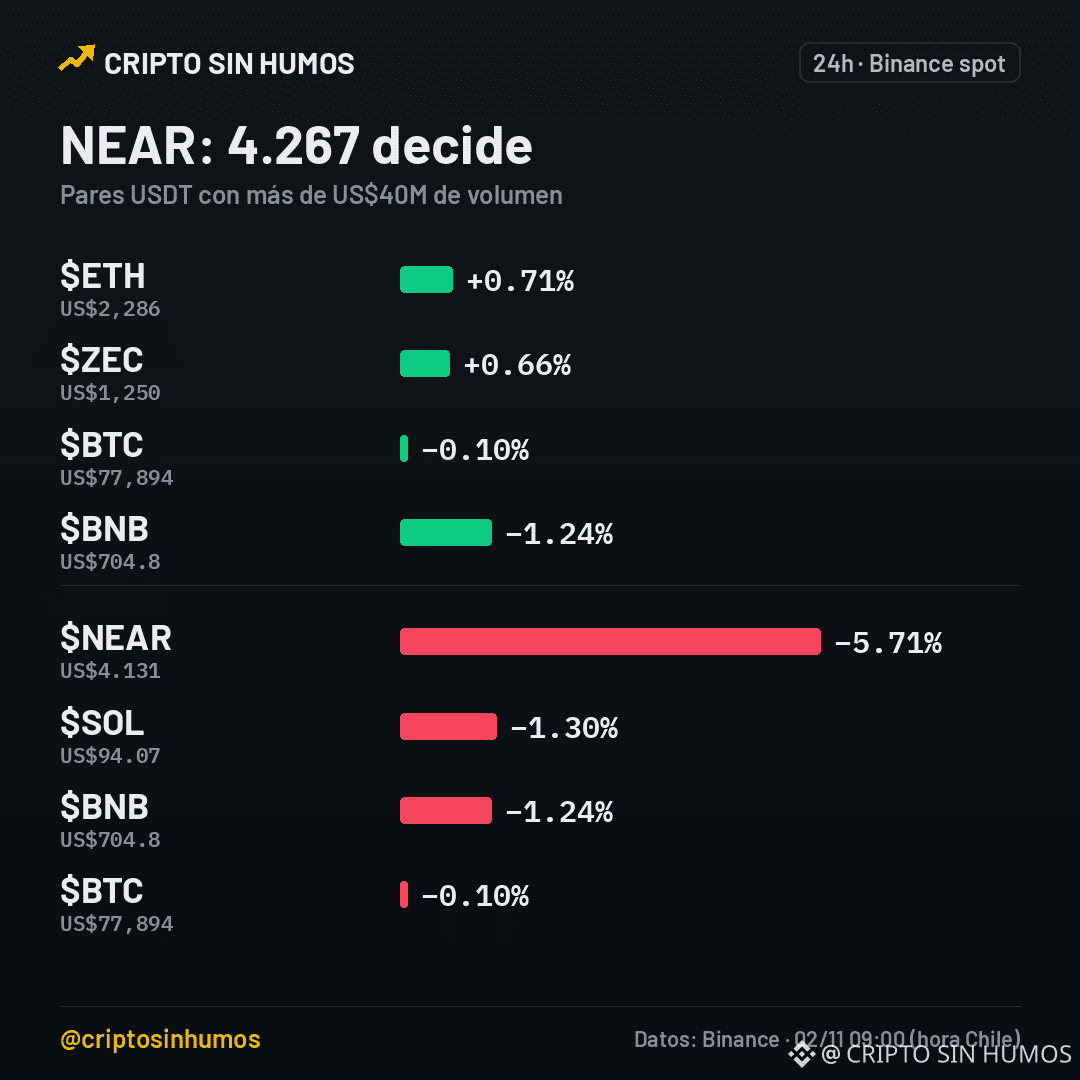
$NEAR down 5.68%: next rebound at 4.267?
$NEAR is trading at US$4.132, down 5.68% over the last 24h. The daily range is between 4.075 and 4.412, and volume is around US$64 M.
On the 4 h chart, the EMA20 (4.303) is below the EMA50 (4.426), and the RSI at 36.6 indicates bearish pressure. The current trend remains downward.
Key supports are 4.075 and 3.909; a break below 3.909 would invalidate the bullish scenario. Resistance levels are at 4.267 and 4.397; if the price moves above 4.267, the bullish target is triggered, while a drop below 4.075 would confirm further weakness.
Also moving with the trend now are $SOL (down 1.3% in 24h) and $BNB (down 1.2% in 24h), with volumes of US$114 M and US$70 M, respectively.
Will it break 4.267 or return to 4.075? 🟢/🔴
#NEAR #DeFi
This is not financial advice. Verify before investing.
$NEAR down 5.68%: next rebound at 4.267?
$NEAR is trading at US$4.132, down 5.68% over the last 24h. The daily range is between 4.075 and 4.412, and volume is around US$64 M.
On the 4 h chart, the EMA20 (4.303) is below the EMA50 (4.426), and the RSI at 36.6 indicates bearish pressure. The current trend remains downward.
Key supports are 4.075 and 3.909; a break below 3.909 would invalidate the bullish scenario. Resistance levels are at 4.267 and 4.397; if the price moves above 4.267, the bullish target is triggered, while a drop below 4.075 would confirm further weakness.
Also moving with the trend now are $SOL (down 1.3% in 24h) and $BNB (down 1.2% in 24h), with volumes of US$114 M and US$70 M, respectively.
Will it break 4.267 or return to 4.075? 🟢/🔴
#NEAR #DeFi
This is not financial advice. Verify before investing.
$NEAR is trading at US$4.132, down 5.68% over the last 24h. The daily range is between 4.075 and 4.412, and volume is around US$64 M.
On the 4 h chart, the EMA20 (4.303) is below the EMA50 (4.426), and the RSI at 36.6 indicates bearish pressure. The current trend remains downward.
Key supports are 4.075 and 3.909; a break below 3.909 would invalidate the bullish scenario. Resistance levels are at 4.267 and 4.397; if the price moves above 4.267, the bullish target is triggered, while a drop below 4.075 would confirm further weakness.
Also moving with the trend now are $SOL (down 1.3% in 24h) and $BNB (down 1.2% in 24h), with volumes of US$114 M and US$70 M, respectively.
Will it break 4.267 or return to 4.075? 🟢/🔴
#NEAR #DeFi
This is not financial advice. Verify before investing.
1
150
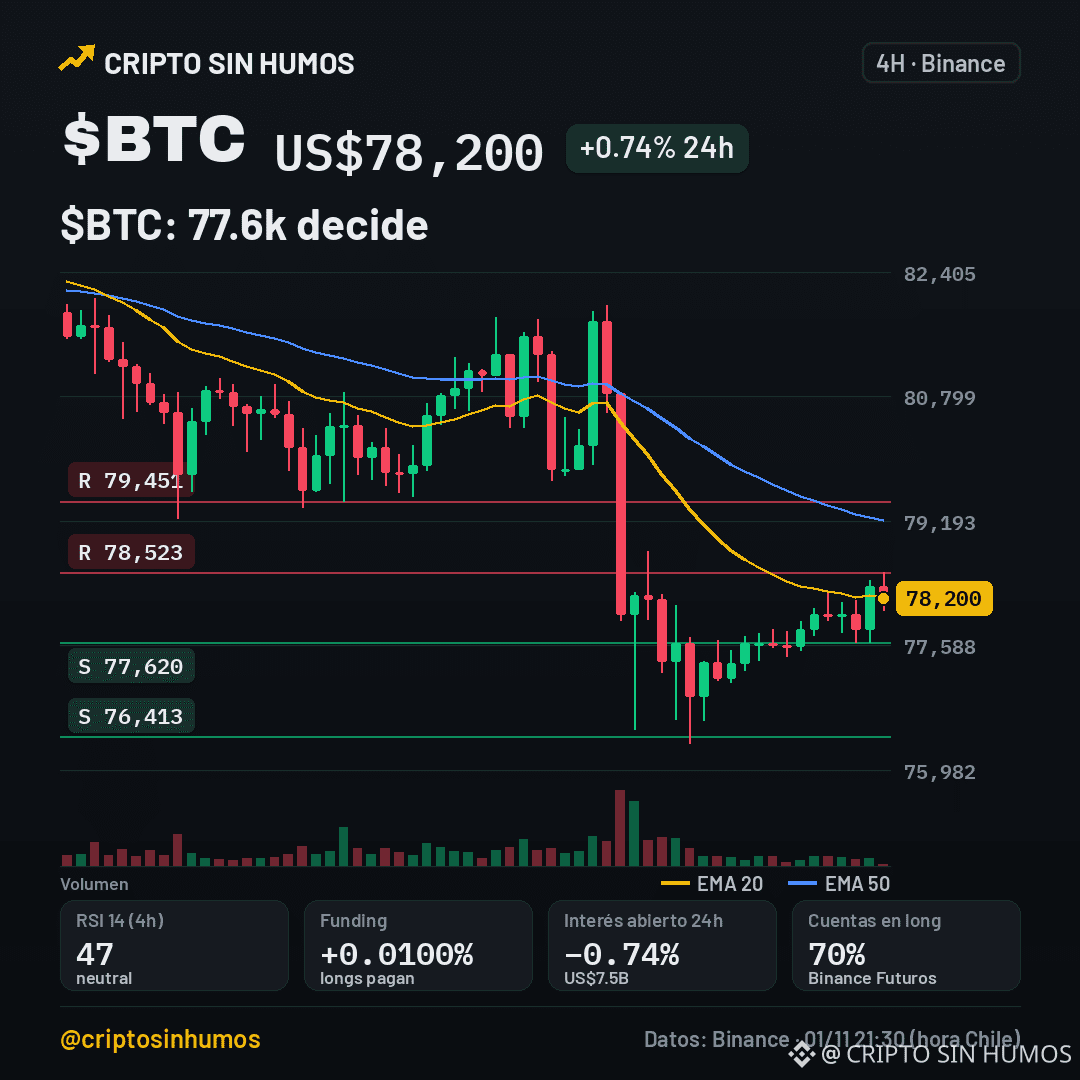
$BTC y $5.8B out of Binance: panic or cleanup?
$BTC is trading at US$78,200 after a +0.74% move in 24h. The news travels fast: Cointelegraph reports net outflows of US$5.8B from Binance after the hack.
My take: a lot of money is leaving, but funding remains mild (+0.01%) and OI is falling. I don’t see mass panic, more like repositioning.
4h technicals are bearish. RSI is at 46.8. Key support is at 77,620; if it loses that, watch 76,413. Above, 78,523 is capping the rebound.
$ZEC (-1.7%) and $SOL (-1.3%) are also moving.
Will 77.6k hold, or is it heading to the floor? 🟢/🔴
#Binance #BitcoinOutflow #CryptoLiquidity
This is not financial advice. Do your research before investing.
$BTC y $5.8B out of Binance: panic or cleanup?
$BTC is trading at US$78,200 after a +0.74% move in 24h. The news travels fast: Cointelegraph reports net outflows of US$5.8B from Binance after the hack.
My take: a lot of money is leaving, but funding remains mild (+0.01%) and OI is falling. I don’t see mass panic, more like repositioning.
4h technicals are bearish. RSI is at 46.8. Key support is at 77,620; if it loses that, watch 76,413. Above, 78,523 is capping the rebound.
$ZEC (-1.7%) and $SOL (-1.3%) are also moving.
Will 77.6k hold, or is it heading to the floor? 🟢/🔴
#Binance #BitcoinOutflow #CryptoLiquidity
This is not financial advice. Do your research before investing.
$BTC is trading at US$78,200 after a +0.74% move in 24h. The news travels fast: Cointelegraph reports net outflows of US$5.8B from Binance after the hack.
My take: a lot of money is leaving, but funding remains mild (+0.01%) and OI is falling. I don’t see mass panic, more like repositioning.
4h technicals are bearish. RSI is at 46.8. Key support is at 77,620; if it loses that, watch 76,413. Above, 78,523 is capping the rebound.
$ZEC (-1.7%) and $SOL (-1.3%) are also moving.
Will 77.6k hold, or is it heading to the floor? 🟢/🔴
#Binance #BitcoinOutflow #CryptoLiquidity
This is not financial advice. Do your research before investing.
139
Log in to explore more content
Join global crypto users on Binance Square
⚡️ Get latest and useful information about crypto.
💬 Trusted by the world’s largest crypto exchange.
👍 Discover real insights from verified creators.
Email / Phone number
Trending Topics
BinanceReopensWithdrawalsForMoreAssets
923,895 views
4,751 Discussing
Security Incident | Recovery Update #8: Withdrawals for More Assets to Reopen (2026-11-05)
Binance Announcement
·429 Likes
·2M views
Binance98PercentReplenished
230,258 views
1,958 Discussing
USStocksSlipandCryptoMarketUnderBroadPressure
30,532 views
296 Discussing