
#datosonchain
datosonchain
1,179 views
9 Discussing
Hot
Latest

·
--
🔍 $BMT ON-CHAIN DATA BETRAYAL: THE ONE DRAWING THE BUBBLES IS DEFLATING
While TRM Labs and Chainalysis track the $6,300M Binance heist and some $3,000M have already been frozen, everyone is watching which wallet moved what. To me, the irony of the day is that the token drawing those bubbles of linked wallets is falling the most among data tokens: when everyone needs transparency, the market isn’t paying for it.
Look at the detail no one is seeing:
→ TRM and Chainalysis are tracking the funds from the heist, with some $3,000M frozen with help from partners.
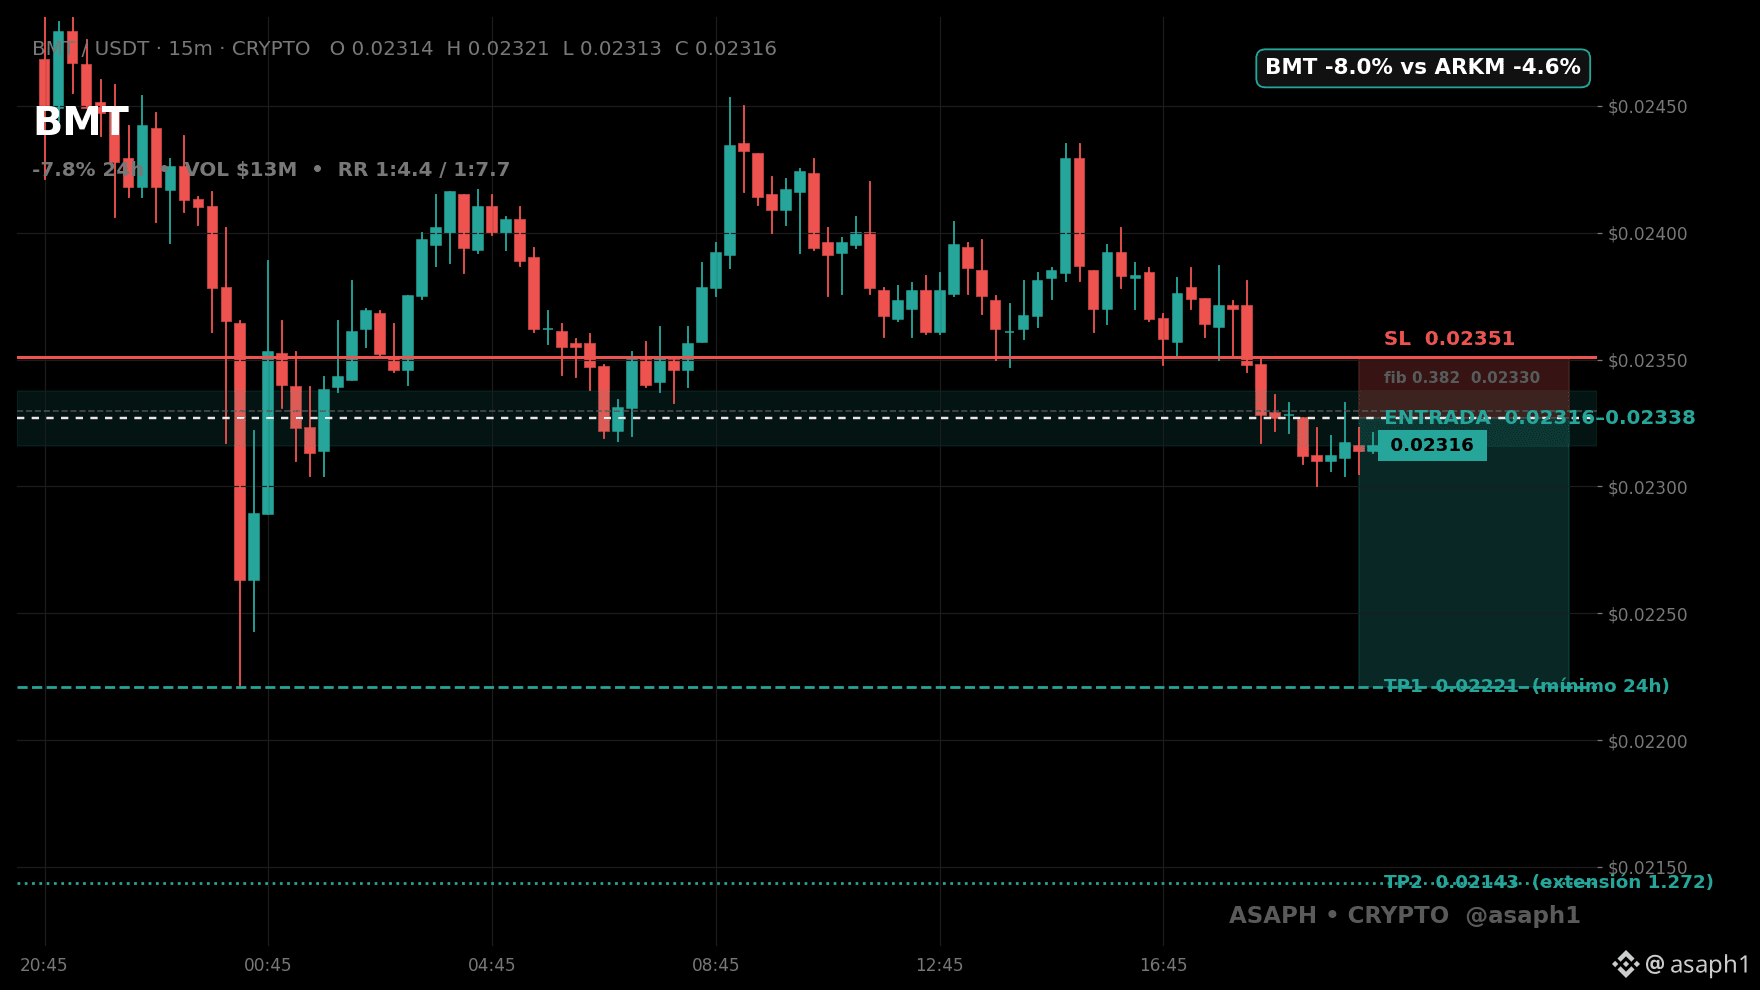
→ BMT -7.8% with $12.7M, while $ARKM -4.6% and $GRT -6.0% are falling less among on-chain data tokens.
→ Entry $0.02316–$0.023378, SL $0.023508, TP1 $0.02221 (-4.6%) → TP2 $0.021435 (-7.9%).
Are you shorting BMT or waiting to see if $0.02221 holds? 👇
$BMT
#Bubblemaps #DatosOnChain #Crypto
🔍 $BMT ON-CHAIN DATA BETRAYAL: THE ONE DRAWING THE BUBBLES IS DEFLATING
While TRM Labs and Chainalysis track the $6,300M Binance heist and some $3,000M have already been frozen, everyone is watching which wallet moved what. To me, the irony of the day is that the token drawing those bubbles of linked wallets is falling the most among data tokens: when everyone needs transparency, the market isn’t paying for it.
Look at the detail no one is seeing:
→ TRM and Chainalysis are tracking the funds from the heist, with some $3,000M frozen with help from partners.
→ BMT -7.8% with $12.7M, while $ARKM -4.6% and $GRT -6.0% are falling less among on-chain data tokens.
→ Entry $0.02316–$0.023378, SL $0.023508, TP1 $0.02221 (-4.6%) → TP2 $0.021435 (-7.9%).
Are you shorting BMT or waiting to see if $0.02221 holds? 👇
$BMT
#Bubblemaps #DatosOnChain #Crypto
While TRM Labs and Chainalysis track the $6,300M Binance heist and some $3,000M have already been frozen, everyone is watching which wallet moved what. To me, the irony of the day is that the token drawing those bubbles of linked wallets is falling the most among data tokens: when everyone needs transparency, the market isn’t paying for it.
Look at the detail no one is seeing:
→ TRM and Chainalysis are tracking the funds from the heist, with some $3,000M frozen with help from partners.
→ BMT -7.8% with $12.7M, while $ARKM -4.6% and $GRT -6.0% are falling less among on-chain data tokens.
→ Entry $0.02316–$0.023378, SL $0.023508, TP1 $0.02221 (-4.6%) → TP2 $0.021435 (-7.9%).
Are you shorting BMT or waiting to see if $0.02221 holds? 👇
$BMT
#Bubblemaps #DatosOnChain #Crypto
61

·
--
RLUSD: Many Payments Don’t Always Mean Much Value
A Bitquery analysis published on October 19 examined RLUSD payments on the XRP Ledger between September 19 and October 18, 2026. That is the period analyzed, not a measure of activity today.
According to the report, 110 wallets sent 7.79 million payments to three recipients: 99.6% of the payments analyzed. Together, they moved 7,722 RLUSD. The percentage refers to the number of transactions, not the share of money transferred.
The study counts payments between different accounts and excludes failed transactions, exchanges, and self-payments. It does not represent RLUSD activity on Ethereum or its global use. In addition, the authenticity of the micropayments’ issuer was checked through sampling, a relevant limitation of the analysis.
Bitquery infers automation from the observed patterns but does not identify the operator. These data do not prove that Ripple organized the activity, nor do they allow bots to be automatically equated with fraud.
The lesson is to compare the number of payments, value, participants, and methodology before talking about adoption. Volume may also include repeated movements or transfers between linked accounts.
Market reading: Binance spot, on 22/10 at 02:27 UTC, showed RLUSD at 1.0009 USDT and XRP at 1.3448 USDT (+0.88% in 24 hours). A price close to parity does not validate usage metrics. Nor does this study show that the observed pattern explains XRP’s price.
Source: Bitquery, research on RLUSD and micropayments on XRPL, 19/10/2026.
$RLUSD $XRP $USDT
Educational Content. Not financial advice.
#RLUSD #XRPL #DatosOnChain #FinancialEducation
RLUSD: Many Payments Don’t Always Mean Much Value
A Bitquery analysis published on October 19 examined RLUSD payments on the XRP Ledger between September 19 and October 18, 2026. That is the period analyzed, not a measure of activity today.
According to the report, 110 wallets sent 7.79 million payments to three recipients: 99.6% of the payments analyzed. Together, they moved 7,722 RLUSD. The percentage refers to the number of transactions, not the share of money transferred.
The study counts payments between different accounts and excludes failed transactions, exchanges, and self-payments. It does not represent RLUSD activity on Ethereum or its global use. In addition, the authenticity of the micropayments’ issuer was checked through sampling, a relevant limitation of the analysis.
Bitquery infers automation from the observed patterns but does not identify the operator. These data do not prove that Ripple organized the activity, nor do they allow bots to be automatically equated with fraud.
The lesson is to compare the number of payments, value, participants, and methodology before talking about adoption. Volume may also include repeated movements or transfers between linked accounts.
Market reading: Binance spot, on 22/10 at 02:27 UTC, showed RLUSD at 1.0009 USDT and XRP at 1.3448 USDT (+0.88% in 24 hours). A price close to parity does not validate usage metrics. Nor does this study show that the observed pattern explains XRP’s price.
Source: Bitquery, research on RLUSD and micropayments on XRPL, 19/10/2026.
$RLUSD $XRP $USDT
Educational Content. Not financial advice.
#RLUSD #XRPL #DatosOnChain #FinancialEducation
A Bitquery analysis published on October 19 examined RLUSD payments on the XRP Ledger between September 19 and October 18, 2026. That is the period analyzed, not a measure of activity today.
According to the report, 110 wallets sent 7.79 million payments to three recipients: 99.6% of the payments analyzed. Together, they moved 7,722 RLUSD. The percentage refers to the number of transactions, not the share of money transferred.
The study counts payments between different accounts and excludes failed transactions, exchanges, and self-payments. It does not represent RLUSD activity on Ethereum or its global use. In addition, the authenticity of the micropayments’ issuer was checked through sampling, a relevant limitation of the analysis.
Bitquery infers automation from the observed patterns but does not identify the operator. These data do not prove that Ripple organized the activity, nor do they allow bots to be automatically equated with fraud.
The lesson is to compare the number of payments, value, participants, and methodology before talking about adoption. Volume may also include repeated movements or transfers between linked accounts.
Market reading: Binance spot, on 22/10 at 02:27 UTC, showed RLUSD at 1.0009 USDT and XRP at 1.3448 USDT (+0.88% in 24 hours). A price close to parity does not validate usage metrics. Nor does this study show that the observed pattern explains XRP’s price.
Source: Bitquery, research on RLUSD and micropayments on XRPL, 19/10/2026.
$RLUSD $XRP $USDT
Educational Content. Not financial advice.
#RLUSD #XRPL #DatosOnChain #FinancialEducation

102
🚨 BINANCE RESUMED WITHDRAWALS. BUT THERE’S ONE FIGURE THAT DESERVES ATTENTION.
What happened after withdrawals began to resume?
On November 1, Binance reported that in the first nine and a half hours, it processed:
🔴 US$4.649 billion in withdrawals.
🟢 US$1.010 billion in deposits.
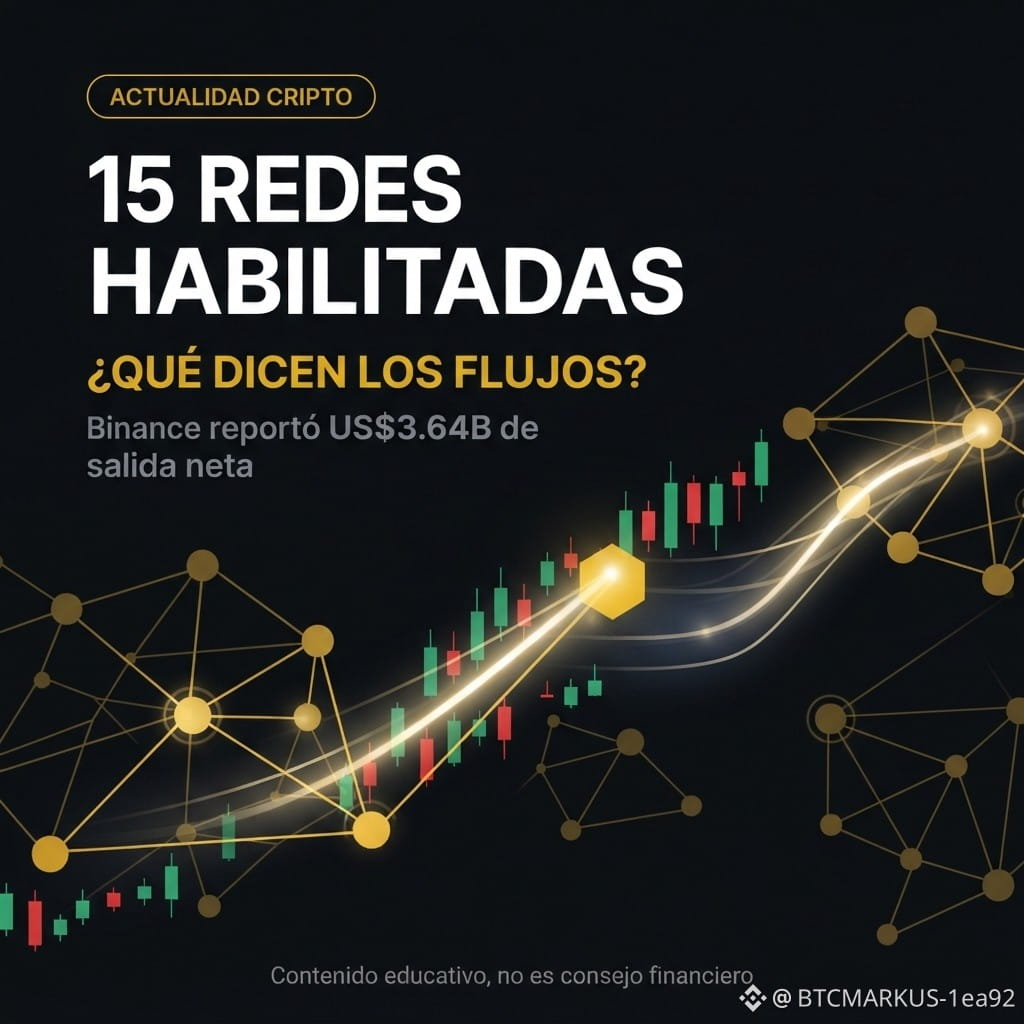
📊 Result: approximately US$3.640 billion in net outflows.
According to information published by the company, those outflows amount to 2.1% of the US$171 billion in assets under management reported in its October 28 Proof of Reserves.
There’s another important detail: at 12:36 UTC, Binance reported that withdrawals had been restored across the 15 networks and assets included in the first phase. This doesn’t mean that all networks on the platform are enabled.
The company also said that withdrawals were declining after the initial surge and that deposits remained substantial.
📈 Meanwhile, $BTC was trading at 78,834 USDT in our check at 22:47 (Peru time), up 1.349% over 24 hours.
What should we be watching now?
1️⃣ The release of the new Proof of Reserves report.
2️⃣ The stability of withdrawals and deposits over the next few days.
3️⃣ The technical report on the security incident.
💬 I’d like to hear your opinion: which figure do you think matters most when assessing the recovery of trust in an exchange? Reserves, withdrawal stability, or technical transparency?
I’m starting this community to analyze the market using data and sources, not promises or improvised signals. Follow me if you share this approach to learning.
#BTC #SeguridadCripto #PruebaDeReservas #DatosOnChain
$BTC
{spot}(BTCUSDT)
🚨 BINANCE RESUMED WITHDRAWALS. BUT THERE’S ONE FIGURE THAT DESERVES ATTENTION.
What happened after withdrawals began to resume?
On November 1, Binance reported that in the first nine and a half hours, it processed:
🔴 US$4.649 billion in withdrawals.
🟢 US$1.010 billion in deposits.
📊 Result: approximately US$3.640 billion in net outflows.
According to information published by the company, those outflows amount to 2.1% of the US$171 billion in assets under management reported in its October 28 Proof of Reserves.
There’s another important detail: at 12:36 UTC, Binance reported that withdrawals had been restored across the 15 networks and assets included in the first phase. This doesn’t mean that all networks on the platform are enabled.
The company also said that withdrawals were declining after the initial surge and that deposits remained substantial.
📈 Meanwhile, $BTC was trading at 78,834 USDT in our check at 22:47 (Peru time), up 1.349% over 24 hours.
What should we be watching now?
1️⃣ The release of the new Proof of Reserves report.
2️⃣ The stability of withdrawals and deposits over the next few days.
3️⃣ The technical report on the security incident.
💬 I’d like to hear your opinion: which figure do you think matters most when assessing the recovery of trust in an exchange? Reserves, withdrawal stability, or technical transparency?
I’m starting this community to analyze the market using data and sources, not promises or improvised signals. Follow me if you share this approach to learning.
#BTC #SeguridadCripto #PruebaDeReservas #DatosOnChain
$BTC
What happened after withdrawals began to resume?
On November 1, Binance reported that in the first nine and a half hours, it processed:
🔴 US$4.649 billion in withdrawals.
🟢 US$1.010 billion in deposits.
📊 Result: approximately US$3.640 billion in net outflows.
According to information published by the company, those outflows amount to 2.1% of the US$171 billion in assets under management reported in its October 28 Proof of Reserves.
There’s another important detail: at 12:36 UTC, Binance reported that withdrawals had been restored across the 15 networks and assets included in the first phase. This doesn’t mean that all networks on the platform are enabled.
The company also said that withdrawals were declining after the initial surge and that deposits remained substantial.
📈 Meanwhile, $BTC was trading at 78,834 USDT in our check at 22:47 (Peru time), up 1.349% over 24 hours.
What should we be watching now?
1️⃣ The release of the new Proof of Reserves report.
2️⃣ The stability of withdrawals and deposits over the next few days.
3️⃣ The technical report on the security incident.
💬 I’d like to hear your opinion: which figure do you think matters most when assessing the recovery of trust in an exchange? Reserves, withdrawal stability, or technical transparency?
I’m starting this community to analyze the market using data and sources, not promises or improvised signals. Follow me if you share this approach to learning.
#BTC #SeguridadCripto #PruebaDeReservas #DatosOnChain
$BTC
1
128
·
--
TRON surpasses 16 billion: what the counter measures
In a lookup on November 2, 2026, at 08:34 UTC, TRONSCAN recorded 16,043,393,090 cumulative transactions. This is a historical record of on-chain operations; the lookup date does not indicate when the milestone was reached.
The explorer distinguishes between TRX and USDT transfers, resource delegation, staking, votes, and other operations. A single account can generate many transactions. To understand network usage, it helps to separate the number of operations, the value transferred, and the participants.
TRX is the native asset. The network uses Bandwidth to measure transaction size and Energy to execute smart contracts. When available resources are insufficient, TRX may be consumed to cover costs, according to the rules for each resource.
USDT and USDD also circulate in this ecosystem. The total number of transactions does not reveal how many involve each stablecoin or allow their reserves to be assessed.
Public data: at 08:33 UTC, Binance spot showed TRX at 0.3159 USDT, up +1.772% over 24 hours.
Market perspective: the milestone provides context about cumulative activity. Assessing sustainable demand requires comparable data series on activity, users, and costs. More transactions do not guarantee a rise in TRX; volatility, smart contract, and stablecoin depegging risks remain.
$TRX $USDT $USDD
Educational Content. Not financial advice.
#TRON #Blockchain #Stablecoins #DatosOnChain #FinancialEducation
TRON surpasses 16 billion: what the counter measures
In a lookup on November 2, 2026, at 08:34 UTC, TRONSCAN recorded 16,043,393,090 cumulative transactions. This is a historical record of on-chain operations; the lookup date does not indicate when the milestone was reached.
The explorer distinguishes between TRX and USDT transfers, resource delegation, staking, votes, and other operations. A single account can generate many transactions. To understand network usage, it helps to separate the number of operations, the value transferred, and the participants.
TRX is the native asset. The network uses Bandwidth to measure transaction size and Energy to execute smart contracts. When available resources are insufficient, TRX may be consumed to cover costs, according to the rules for each resource.
USDT and USDD also circulate in this ecosystem. The total number of transactions does not reveal how many involve each stablecoin or allow their reserves to be assessed.
Public data: at 08:33 UTC, Binance spot showed TRX at 0.3159 USDT, up +1.772% over 24 hours.
Market perspective: the milestone provides context about cumulative activity. Assessing sustainable demand requires comparable data series on activity, users, and costs. More transactions do not guarantee a rise in TRX; volatility, smart contract, and stablecoin depegging risks remain.
$TRX $USDT $USDD
Educational Content. Not financial advice.
#TRON #Blockchain #Stablecoins #DatosOnChain #FinancialEducation
In a lookup on November 2, 2026, at 08:34 UTC, TRONSCAN recorded 16,043,393,090 cumulative transactions. This is a historical record of on-chain operations; the lookup date does not indicate when the milestone was reached.
The explorer distinguishes between TRX and USDT transfers, resource delegation, staking, votes, and other operations. A single account can generate many transactions. To understand network usage, it helps to separate the number of operations, the value transferred, and the participants.
TRX is the native asset. The network uses Bandwidth to measure transaction size and Energy to execute smart contracts. When available resources are insufficient, TRX may be consumed to cover costs, according to the rules for each resource.
USDT and USDD also circulate in this ecosystem. The total number of transactions does not reveal how many involve each stablecoin or allow their reserves to be assessed.
Public data: at 08:33 UTC, Binance spot showed TRX at 0.3159 USDT, up +1.772% over 24 hours.
Market perspective: the milestone provides context about cumulative activity. Assessing sustainable demand requires comparable data series on activity, users, and costs. More transactions do not guarantee a rise in TRX; volatility, smart contract, and stablecoin depegging risks remain.
$TRX $USDT $USDD
Educational Content. Not financial advice.
#TRON #Blockchain #Stablecoins #DatosOnChain #FinancialEducation

104

·
--
Bullish
📈 Every time $BTC has hit the FEAR zone... this is what happened next
History the market wants you to forget:
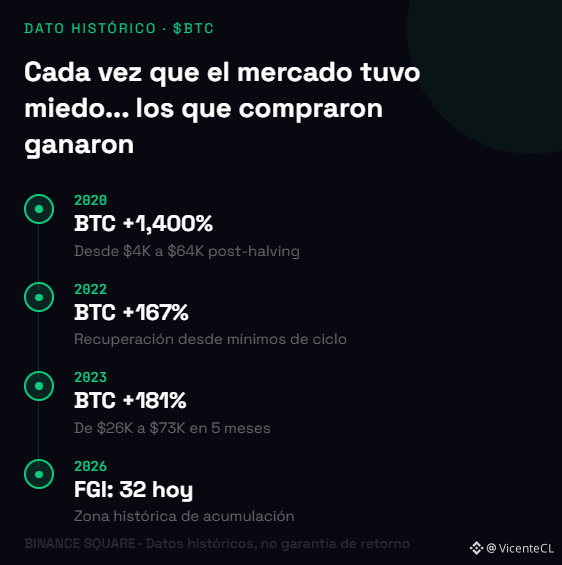
🟡 Jun 2019 — FGI: 10 → BTC jumped from $9K to $14K in 2 months (+56%)
🟡 Mar 2020 — FGI: 5 → BTC skyrocketed from $4K to $60K in 12 months (+1400%)
🟡 Jul 2022 — FGI: 15 → BTC surged from $18K to $48K in 8 months (+167%)
🟡 Nov 2023 — FGI: 25 → BTC rose from $26K to $73K in 5 months (+181%)
Today: FGI is at 32 — fear zone.
This isn’t financial advice. It’s a historical pattern the market repeats.
Are you taking advantage of it or waiting for prices to rise before you buy?
$BTC
{future}(BTCUSDT)
$ETH
{future}(ETHUSDT)
!!!WHAT ARE YOU WAITING FOR?!!!
#Bitcoin #HistoriaCrypto #DatosOnChain #BinanceSquare
📈 Every time $BTC has hit the FEAR zone... this is what happened next
History the market wants you to forget:
🟡 Jun 2019 — FGI: 10 → BTC jumped from $9K to $14K in 2 months (+56%)
🟡 Mar 2020 — FGI: 5 → BTC skyrocketed from $4K to $60K in 12 months (+1400%)
🟡 Jul 2022 — FGI: 15 → BTC surged from $18K to $48K in 8 months (+167%)
🟡 Nov 2023 — FGI: 25 → BTC rose from $26K to $73K in 5 months (+181%)
Today: FGI is at 32 — fear zone.
This isn’t financial advice. It’s a historical pattern the market repeats.
Are you taking advantage of it or waiting for prices to rise before you buy?
$BTC
$ETH
!!!WHAT ARE YOU WAITING FOR?!!!
#Bitcoin #HistoriaCrypto #DatosOnChain #BinanceSquare
History the market wants you to forget:
🟡 Jun 2019 — FGI: 10 → BTC jumped from $9K to $14K in 2 months (+56%)
🟡 Mar 2020 — FGI: 5 → BTC skyrocketed from $4K to $60K in 12 months (+1400%)
🟡 Jul 2022 — FGI: 15 → BTC surged from $18K to $48K in 8 months (+167%)
🟡 Nov 2023 — FGI: 25 → BTC rose from $26K to $73K in 5 months (+181%)
Today: FGI is at 32 — fear zone.
This isn’t financial advice. It’s a historical pattern the market repeats.
Are you taking advantage of it or waiting for prices to rise before you buy?
$BTC
$ETH
!!!WHAT ARE YOU WAITING FOR?!!!
#Bitcoin #HistoriaCrypto #DatosOnChain #BinanceSquare
1
2
1.2k
Log in to explore more content
Join global crypto users on Binance Square
⚡️ Get latest and useful information about crypto.
💬 Trusted by the world’s largest crypto exchange.
👍 Discover real insights from verified creators.
Email / Phone number
Trending Topics
1
#IsAnthropic’s$1.5TMarketCapJustified?
10,271 views
86 Discussing
2
#BTCRemainsUnderPressureAfterHawkishFOMCMinutes
237,791 views
2,075 Discussing
3
#NvidiaBoardReportedlySplitOverHuang’sReturn
115,762 views
1,120 Discussing
4
#StrategySTRCPreferredSlips3.65%Below$100Par
7,216 views
73 Discussing
5
#MASToUpgradeSGDTestnetToSGDigitalLedger
20,708 views
255 Discussing
6
#CanGTA6'sLaunchLiftTTWOShares?
83,152 views
810 Discussing
7
#Solana2027RoadmapTargetsDoubleComputeCapacity
8,652 views
132 Discussing
8
#InjectiveTokenizedRealEstateMortgagesTop$1.5B
1,129 views
28 Discussing
9
#TetherMakesStrategicInvestmentInSCRYPT
6,263 views
107 Discussing
10
#CapitalGroupAdds1264500StrategyShares
29,388 views
235 Discussing