
#bubblemaps
bubblemaps
5.9M views
30,967 Discussing
Hot
Latest

$BMT SURGES WITH OVER 4.8M VOL! RSI OVERSOLD RESET AT 36.30 — TARGETING A BREAKOUT PAST $0.02632 SAR RESISTANCE FOR $0.02645 PEAK RETEST?
Binance Infrastructure category gainers are holding solid liquidity in today's mid-day trading session! BMT (Bubblemaps) has logged a +5.16% daily surge, backed by an impressive 4.85M USDT (200.31M $BMT) in 24-hour trading volume!
After rocketing off its 0.02243 daily bottom floor and holding dynamic support around 0.02249, price action launched a strong parabolic surge to hit a 24-hour peak high of 0.02645. Following a healthy cooling-off pullback, $BMT is holding steady near 0.02427 right at its local demand consolidation floor.
Master Scalp Setup & Strategic Levels:
Trade Bias: Oversold Rebound / Scalp Long
Accumulation Entry Zone: 0.02316 – 0.02427 (Local demand support consolidation range)
Key Targets: 0.02491 ➡️ 0.02578 ➡️ 0.02645 (24h Peak Retest)
Stop Loss: Below 0.02220
Why This Setup is Primed for Expansion:
Clean RSI Oversold Reset: The 15m RSI (6) has cleanly reset from overbought levels down into an oversold zone at 36.30. This cool-down offers buyers optimal upside breathing room for a fast V-shape bounce.
Overhead SAR Breakout Trigger: Dynamic Parabolic SAR overhead resistance currently sits right above at 0.02632. A decisive 15m candle close above 0.02491 will flip momentum bullish and clear the pathway toward the SAR resistance at 0.02632 and a full retest of the 0.02645 peak high.
Are you taking a long entry on BMT at this $0.02316–$0.02427 support consolidation base, or waiting for a breakout close above $0.02491? Share your strategy in the comments below!
Trade Now $BMT
{spot}(BMTUSDT)
#BMT #Bubblemaps #BinanceSquare
$BMT SURGES WITH OVER 4.8M VOL! RSI OVERSOLD RESET AT 36.30 — TARGETING A BREAKOUT PAST $0.02632 SAR RESISTANCE FOR $0.02645 PEAK RETEST?
Binance Infrastructure category gainers are holding solid liquidity in today's mid-day trading session! BMT (Bubblemaps) has logged a +5.16% daily surge, backed by an impressive 4.85M USDT (200.31M $BMT ) in 24-hour trading volume!
After rocketing off its 0.02243 daily bottom floor and holding dynamic support around 0.02249, price action launched a strong parabolic surge to hit a 24-hour peak high of 0.02645. Following a healthy cooling-off pullback, $BMT is holding steady near 0.02427 right at its local demand consolidation floor.
Master Scalp Setup & Strategic Levels:
Trade Bias: Oversold Rebound / Scalp Long
Accumulation Entry Zone: 0.02316 – 0.02427 (Local demand support consolidation range)
Key Targets: 0.02491 ➡️ 0.02578 ➡️ 0.02645 (24h Peak Retest)
Stop Loss: Below 0.02220
Why This Setup is Primed for Expansion:
Clean RSI Oversold Reset: The 15m RSI (6) has cleanly reset from overbought levels down into an oversold zone at 36.30. This cool-down offers buyers optimal upside breathing room for a fast V-shape bounce.
Overhead SAR Breakout Trigger: Dynamic Parabolic SAR overhead resistance currently sits right above at 0.02632. A decisive 15m candle close above 0.02491 will flip momentum bullish and clear the pathway toward the SAR resistance at 0.02632 and a full retest of the 0.02645 peak high.
Are you taking a long entry on BMT at this $0.02316–$0.02427 support consolidation base, or waiting for a breakout close above $0.02491? Share your strategy in the comments below!
Trade Now $BMT
#BMT #Bubblemaps #BinanceSquare
Binance Infrastructure category gainers are holding solid liquidity in today's mid-day trading session! BMT (Bubblemaps) has logged a +5.16% daily surge, backed by an impressive 4.85M USDT (200.31M $BMT ) in 24-hour trading volume!
After rocketing off its 0.02243 daily bottom floor and holding dynamic support around 0.02249, price action launched a strong parabolic surge to hit a 24-hour peak high of 0.02645. Following a healthy cooling-off pullback, $BMT is holding steady near 0.02427 right at its local demand consolidation floor.
Master Scalp Setup & Strategic Levels:
Trade Bias: Oversold Rebound / Scalp Long
Accumulation Entry Zone: 0.02316 – 0.02427 (Local demand support consolidation range)
Key Targets: 0.02491 ➡️ 0.02578 ➡️ 0.02645 (24h Peak Retest)
Stop Loss: Below 0.02220
Why This Setup is Primed for Expansion:
Clean RSI Oversold Reset: The 15m RSI (6) has cleanly reset from overbought levels down into an oversold zone at 36.30. This cool-down offers buyers optimal upside breathing room for a fast V-shape bounce.
Overhead SAR Breakout Trigger: Dynamic Parabolic SAR overhead resistance currently sits right above at 0.02632. A decisive 15m candle close above 0.02491 will flip momentum bullish and clear the pathway toward the SAR resistance at 0.02632 and a full retest of the 0.02645 peak high.
Are you taking a long entry on BMT at this $0.02316–$0.02427 support consolidation base, or waiting for a breakout close above $0.02491? Share your strategy in the comments below!
Trade Now $BMT
#BMT #Bubblemaps #BinanceSquare
1
282

What does a legal threat do to a micro-cap token? BMT's answer this week: up 21% — and I'm watching the tape, not the lawyers.
The dispute broke Nov 2, when rival Trapmap published a pre-suit legal notice against Bubblemaps and its CEO, alleging a secret $45,000-a-month Proxima deal. Bubblemaps denied it Nov 3, calling the contract fabricated. Trapmap wants an answer by Nov 16; no court has ruled, and the claims are unproven.
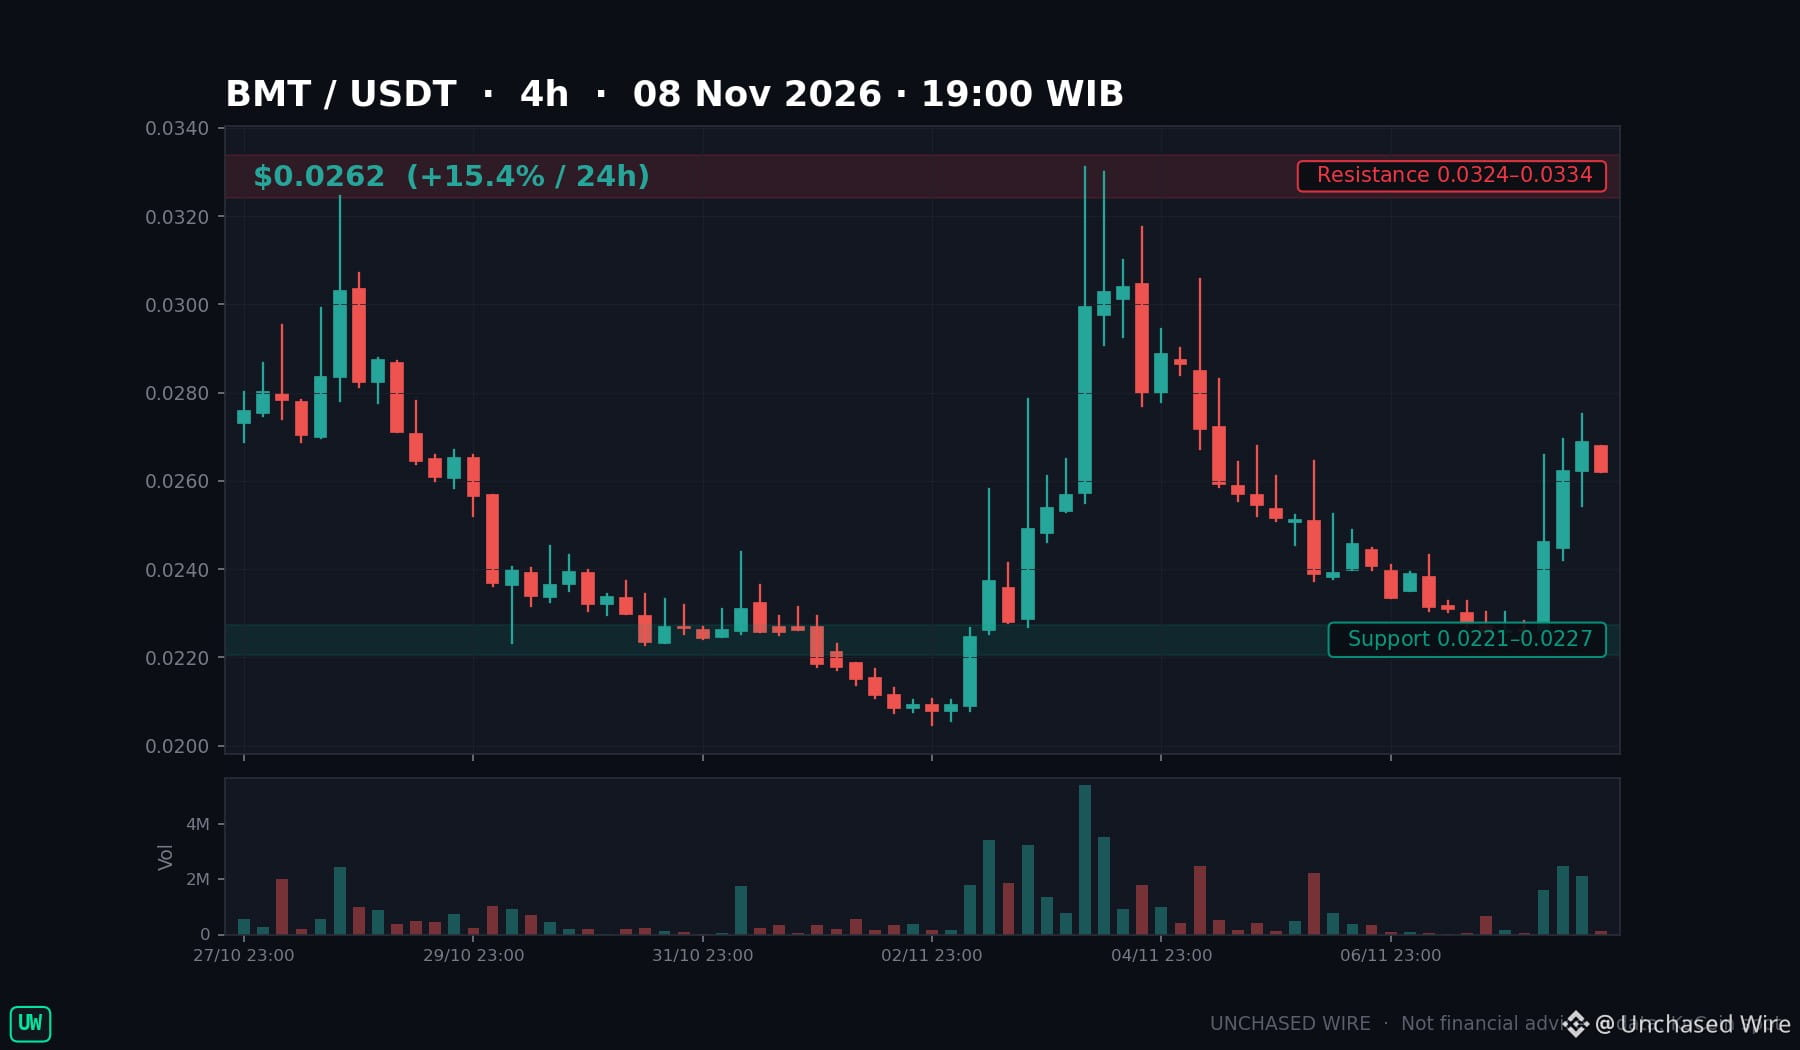
The tape moved first — thin books move fast. BMT printed +26% on Nov 3 on $14.8M of Binance volume, a $16M day on Nov 4, then cooled 21% over three sessions before jumping 18% to $0.0269.
The range math: Nov 4's high, $0.0329, sits 22% above here; this week's floor, $0.0224, sits 17% below. A daily close under $0.0224 ends the momentum read.
Watching next: a Bubblemaps response before Nov 16, a close above $0.0329, or $10M-a-day volume.
Does BMT clear $0.0329 before the deadline, or does $0.0224 give way first?
NFA, DYOR.
$BMT #Bubblemaps #OnChain #CryptoNews #MicroCap
What does a legal threat do to a micro-cap token? BMT's answer this week: up 21% — and I'm watching the tape, not the lawyers.
The dispute broke Nov 2, when rival Trapmap published a pre-suit legal notice against Bubblemaps and its CEO, alleging a secret $45,000-a-month Proxima deal. Bubblemaps denied it Nov 3, calling the contract fabricated. Trapmap wants an answer by Nov 16; no court has ruled, and the claims are unproven.
The tape moved first — thin books move fast. BMT printed +26% on Nov 3 on $14.8M of Binance volume, a $16M day on Nov 4, then cooled 21% over three sessions before jumping 18% to $0.0269.
The range math: Nov 4's high, $0.0329, sits 22% above here; this week's floor, $0.0224, sits 17% below. A daily close under $0.0224 ends the momentum read.
Watching next: a Bubblemaps response before Nov 16, a close above $0.0329, or $10M-a-day volume.
Does BMT clear $0.0329 before the deadline, or does $0.0224 give way first?
NFA, DYOR.
$BMT #Bubblemaps #OnChain #CryptoNews #MicroCap
The dispute broke Nov 2, when rival Trapmap published a pre-suit legal notice against Bubblemaps and its CEO, alleging a secret $45,000-a-month Proxima deal. Bubblemaps denied it Nov 3, calling the contract fabricated. Trapmap wants an answer by Nov 16; no court has ruled, and the claims are unproven.
The tape moved first — thin books move fast. BMT printed +26% on Nov 3 on $14.8M of Binance volume, a $16M day on Nov 4, then cooled 21% over three sessions before jumping 18% to $0.0269.
The range math: Nov 4's high, $0.0329, sits 22% above here; this week's floor, $0.0224, sits 17% below. A daily close under $0.0224 ends the momentum read.
Watching next: a Bubblemaps response before Nov 16, a close above $0.0329, or $10M-a-day volume.
Does BMT clear $0.0329 before the deadline, or does $0.0224 give way first?
NFA, DYOR.
$BMT #Bubblemaps #OnChain #CryptoNews #MicroCap
2


·
--
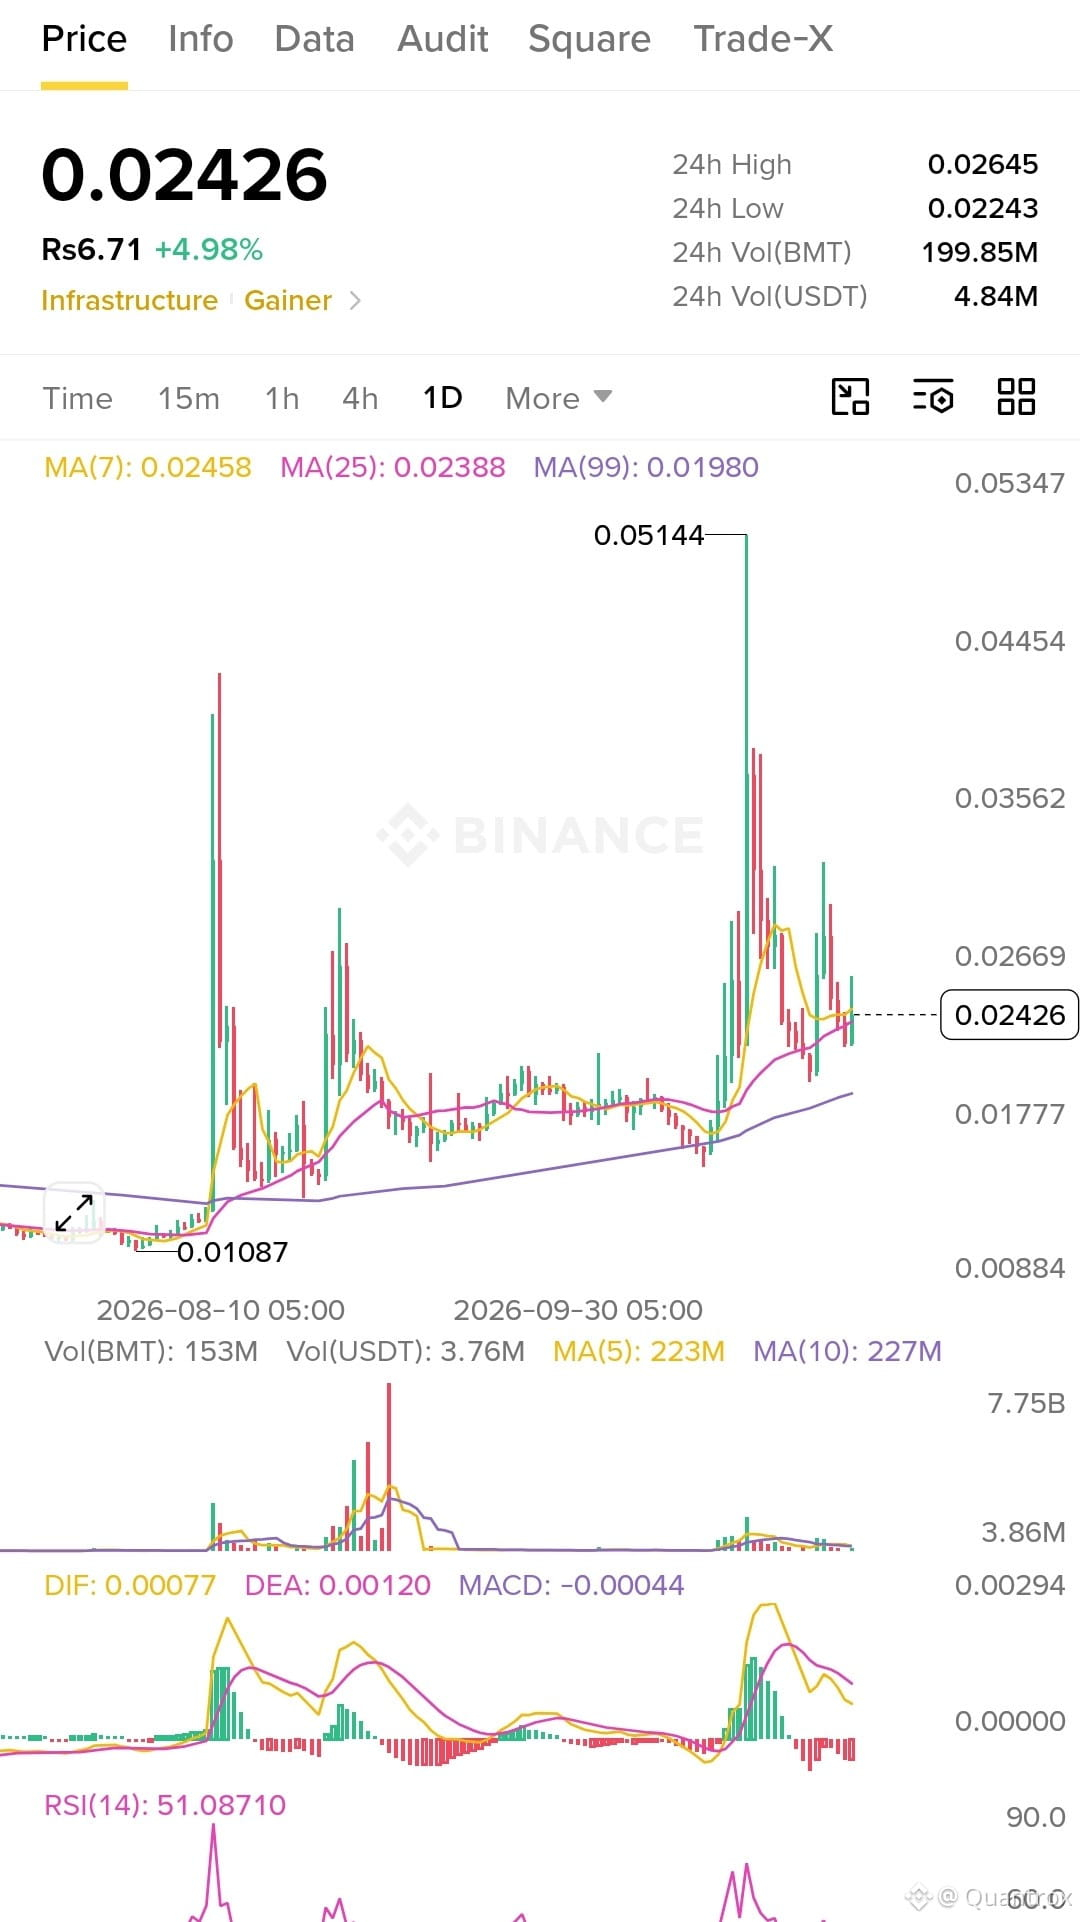
The coin built to expose rug pulls got listed on Upbit and printed 0.05144 👀
Now it's 0.02426. Half the pump is gone, but it's still +5% today with 4.8M USDT traded.
Dumps usually don't get bought like this.
Bubblemaps calls out other people's scams for a living. Funny that its own chart is getting this much attention.
I'm watching 0.0230–0.0240 for a hold.
Targets 0.0267 and 0.0356. Out below 0.0215.
Second leg or fade?
#BMT #Bubblemaps #CryptoTrading $BMT
DYOR / NFA
The coin built to expose rug pulls got listed on Upbit and printed 0.05144 👀
Now it's 0.02426. Half the pump is gone, but it's still +5% today with 4.8M USDT traded.
Dumps usually don't get bought like this.
Bubblemaps calls out other people's scams for a living. Funny that its own chart is getting this much attention.
I'm watching 0.0230–0.0240 for a hold.
Targets 0.0267 and 0.0356. Out below 0.0215.
Second leg or fade?
#BMT #Bubblemaps #CryptoTrading $BMT
DYOR / NFA
Now it's 0.02426. Half the pump is gone, but it's still +5% today with 4.8M USDT traded.
Dumps usually don't get bought like this.
Bubblemaps calls out other people's scams for a living. Funny that its own chart is getting this much attention.
I'm watching 0.0230–0.0240 for a hold.
Targets 0.0267 and 0.0356. Out below 0.0215.
Second leg or fade?
#BMT #Bubblemaps #CryptoTrading $BMT
DYOR / NFA
149

BMT +12% TODAY 🚀
BMT (Bubblemaps) is pumping today! Strong green move, buyers are back.
Momentum is building fast.
Are you holding BMT? 👇
#BMT #Bubblemaps #Crypto #bullish
BMT +12% TODAY 🚀
BMT (Bubblemaps) is pumping today! Strong green move, buyers are back.
Momentum is building fast.
Are you holding BMT? 👇
#BMT #Bubblemaps #Crypto #bullish
BMT (Bubblemaps) is pumping today! Strong green move, buyers are back.
Momentum is building fast.
Are you holding BMT? 👇
#BMT #Bubblemaps #Crypto #bullish
2
251

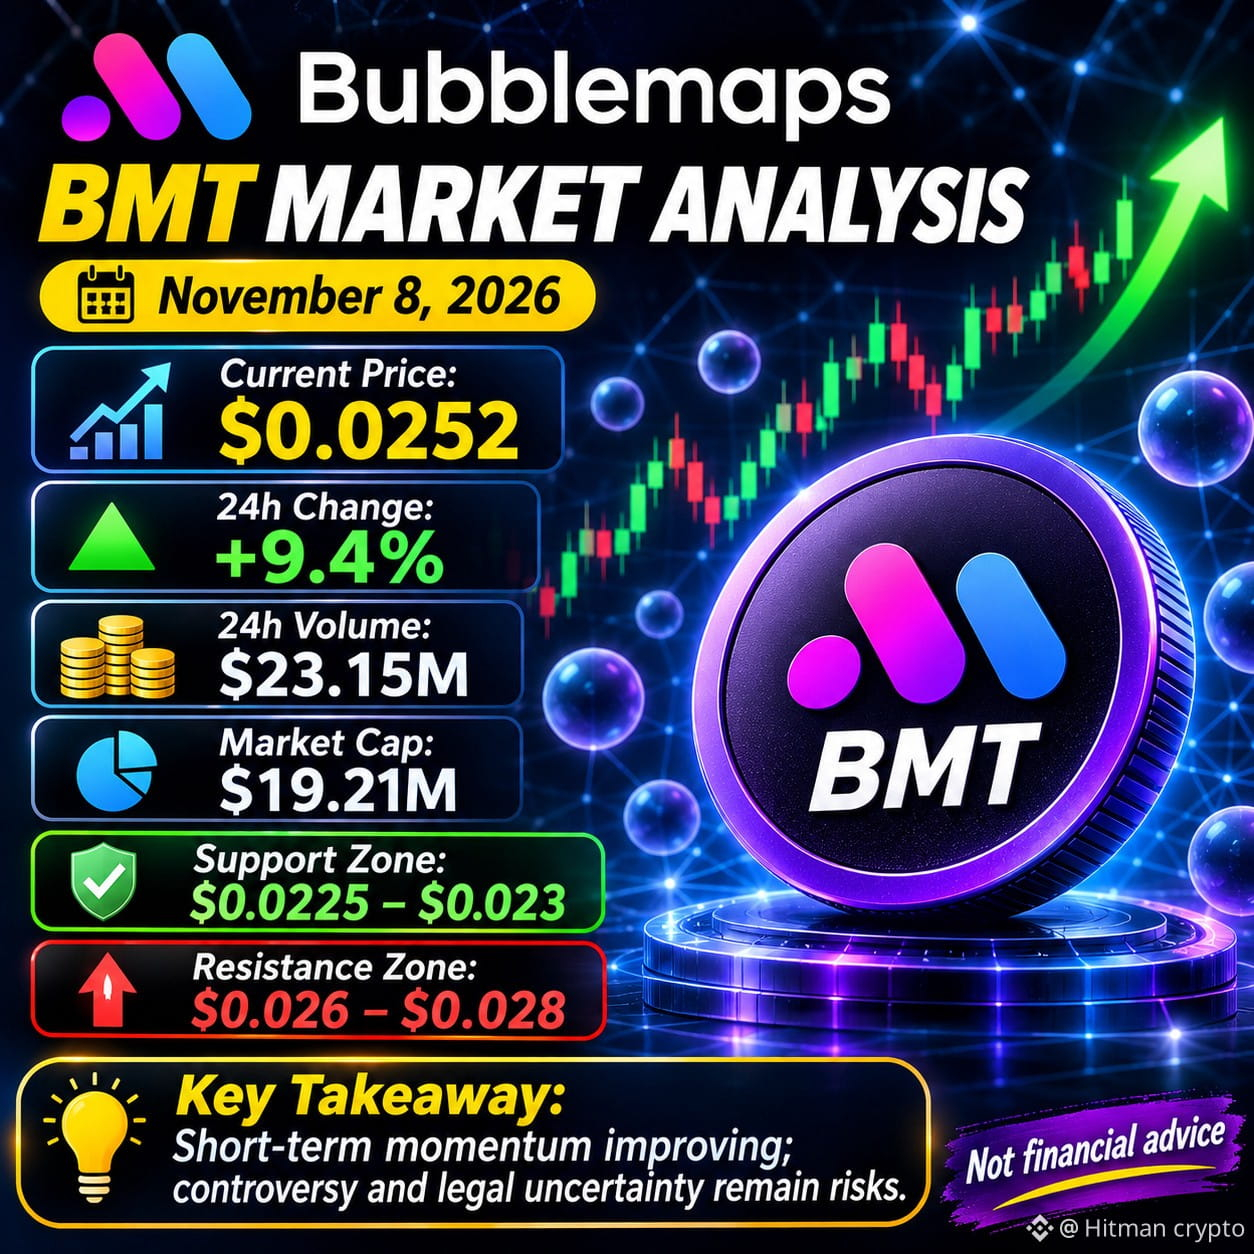
Bubblemaps ($BMT ) is showing a strong short-term recovery, trading around $0.0252, up approximately 9.4% in 24 hours. Trading volume has also increased, suggesting renewed market interest.
Current price: $0.0252
24h change: +9.4%
24h volume: $23.15M
Resistance: $0.026–$0.028
Support: $0.0225–$0.023
My outlook: Momentum is improving, but recent controversy and legal uncertainty remain important risks. A sustained move above resistance would strengthen the bullish case.
#Bubblemaps #BMT #Altcoins #Binance #CryptoMarket
Bubblemaps ($BMT ) is showing a strong short-term recovery, trading around $0.0252, up approximately 9.4% in 24 hours. Trading volume has also increased, suggesting renewed market interest.
Current price: $0.0252
24h change: +9.4%
24h volume: $23.15M
Resistance: $0.026–$0.028
Support: $0.0225–$0.023
My outlook: Momentum is improving, but recent controversy and legal uncertainty remain important risks. A sustained move above resistance would strengthen the bullish case.
#Bubblemaps #BMT #Altcoins #Binance #CryptoMarket
Current price: $0.0252
24h change: +9.4%
24h volume: $23.15M
Resistance: $0.026–$0.028
Support: $0.0225–$0.023
My outlook: Momentum is improving, but recent controversy and legal uncertainty remain important risks. A sustained move above resistance would strengthen the bullish case.
#Bubblemaps #BMT #Altcoins #Binance #CryptoMarket
2
198

·
--
Bullish
🚀Bubblemaps ($BMT ) surges ~16% while major assets remain in the red 👀
As of 3:16 PM (PKT), $BMT is up +16.02% over 24 hours to around $0.02679
At 10:57 AM this morning, it was only up +4.90%. In 4 hours, the gain increased by about 11 points.
Current market conditions:
$
• #BMT: +16.02%
• #ETH: -0.51%
• #BTC: -0.19%
• #XRP: -0.67%
• #SOL: -0.93%
• #ZEC: -3.92%
⚠️ Gains can fade quickly. Mitosis surged +18.87% overnight and is now down -1.57%. Check the volume, don't chase green candles, and only risk money you can afford to lose.
Will $BMT keep rising or see a similar decline? 👇
#Bubblemaps #BMT #Binance
This is not financial advice. Do your own research...
🚀Bubblemaps ($BMT ) surges ~16% while major assets remain in the red 👀
As of 3:16 PM (PKT), $BMT is up +16.02% over 24 hours to around $0.02679
At 10:57 AM this morning, it was only up +4.90%. In 4 hours, the gain increased by about 11 points.
Current market conditions:
$
• #BMT: +16.02%
• #ETH: -0.51%
• #BTC: -0.19%
• #XRP: -0.67%
• #SOL: -0.93%
• #ZEC: -3.92%
⚠️ Gains can fade quickly. Mitosis surged +18.87% overnight and is now down -1.57%. Check the volume, don't chase green candles, and only risk money you can afford to lose.
Will $BMT keep rising or see a similar decline? 👇
#Bubblemaps #BMT #Binance
This is not financial advice. Do your own research...
As of 3:16 PM (PKT), $BMT is up +16.02% over 24 hours to around $0.02679
At 10:57 AM this morning, it was only up +4.90%. In 4 hours, the gain increased by about 11 points.
Current market conditions:
$
• #BMT: +16.02%
• #ETH: -0.51%
• #BTC: -0.19%
• #XRP: -0.67%
• #SOL: -0.93%
• #ZEC: -3.92%
⚠️ Gains can fade quickly. Mitosis surged +18.87% overnight and is now down -1.57%. Check the volume, don't chase green candles, and only risk money you can afford to lose.
Will $BMT keep rising or see a similar decline? 👇
#Bubblemaps #BMT #Binance
This is not financial advice. Do your own research...
125

Bubblemaps has teased another reveal: it plans to expose one of “crypto’s biggest KOLs” for secretly siphoning millions from their followers. The reveal is coming in a few days. The post has 400,000 views, and half the replies are guessing who it is.
So far, they haven’t named anyone.
The tactics they listed are nothing new—using a public wallet to attract copy traders, then dumping from a hidden wallet; farming rewards through callouts; bundling tokens to conceal holdings. They’re right that launchpads only look at trading volume, and that social copy trading has turned dumping into a business.
But the teaser itself is also a play for attention. The evidence hasn’t been presented, yet they’re dangling the name to keep everyone refreshing—and the poster is the one who benefits. For copy trading, just look at public positions and reward structures. Don’t wait for a detective’s video to wake up.
By the way, this account was also called out by a former developer a few days ago over old allegations that it paid bundler-tool providers. Both sides have their own interests, so don’t treat Bubblemaps as gospel.
#Bubblemaps #KOL
Bubblemaps has teased another reveal: it plans to expose one of “crypto’s biggest KOLs” for secretly siphoning millions from their followers. The reveal is coming in a few days. The post has 400,000 views, and half the replies are guessing who it is.
So far, they haven’t named anyone.
The tactics they listed are nothing new—using a public wallet to attract copy traders, then dumping from a hidden wallet; farming rewards through callouts; bundling tokens to conceal holdings. They’re right that launchpads only look at trading volume, and that social copy trading has turned dumping into a business.
But the teaser itself is also a play for attention. The evidence hasn’t been presented, yet they’re dangling the name to keep everyone refreshing—and the poster is the one who benefits. For copy trading, just look at public positions and reward structures. Don’t wait for a detective’s video to wake up.
By the way, this account was also called out by a former developer a few days ago over old allegations that it paid bundler-tool providers. Both sides have their own interests, so don’t treat Bubblemaps as gospel.
#Bubblemaps #KOL
So far, they haven’t named anyone.
The tactics they listed are nothing new—using a public wallet to attract copy traders, then dumping from a hidden wallet; farming rewards through callouts; bundling tokens to conceal holdings. They’re right that launchpads only look at trading volume, and that social copy trading has turned dumping into a business.
But the teaser itself is also a play for attention. The evidence hasn’t been presented, yet they’re dangling the name to keep everyone refreshing—and the poster is the one who benefits. For copy trading, just look at public positions and reward structures. Don’t wait for a detective’s video to wake up.
By the way, this account was also called out by a former developer a few days ago over old allegations that it paid bundler-tool providers. Both sides have their own interests, so don’t treat Bubblemaps as gospel.
#Bubblemaps #KOL
2

·
--
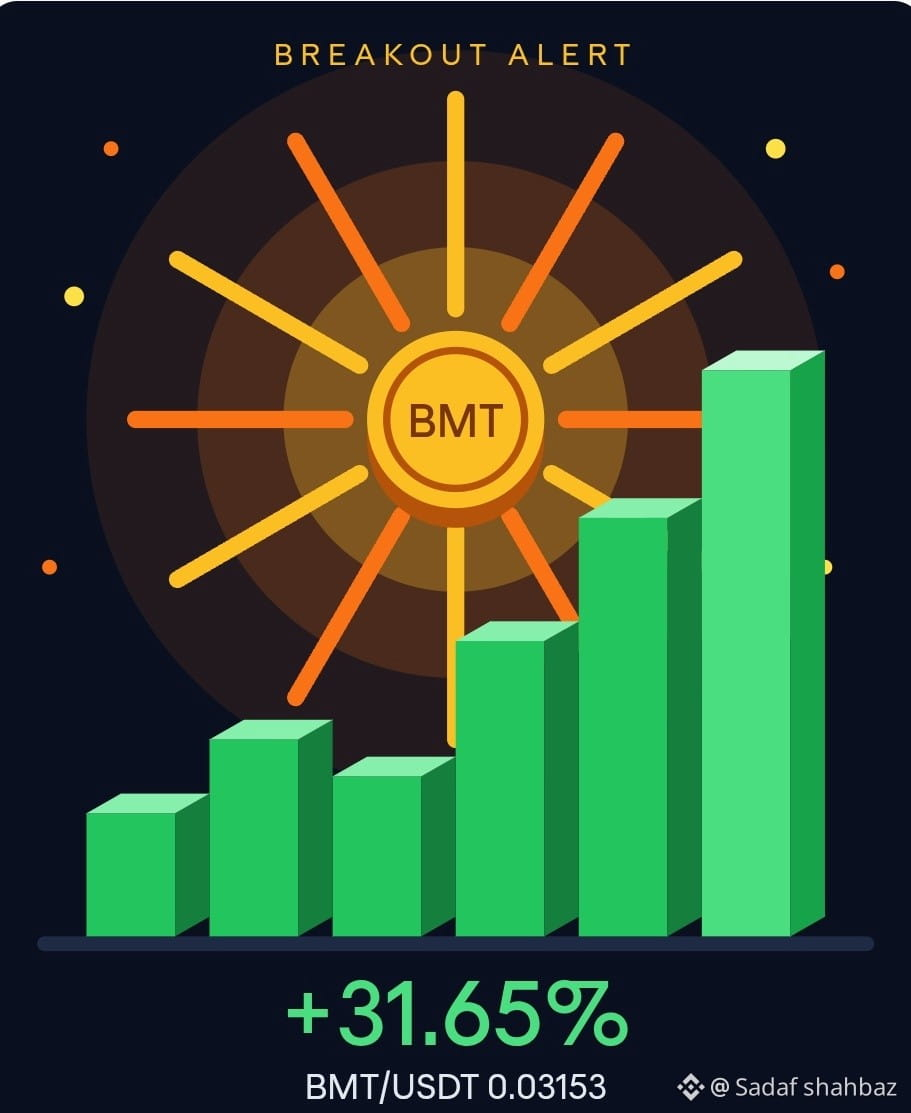
🚀 $BMT /USDT Breakout Alert!
Bubblemaps ($BMT ) is surging +31.65% to 0.03153, leading the Infrastructure Gainers with 18.49M USDT in 24h volume.
📊 4H Chart Highlights
Strong rebound from the 0.02 base
Price reclaimed MA(7), volume rising
Resistance: 0.03288, then 0.03748
Support: 0.02863
⚠️ RSI at 92 means overbought. A dip to 0.0286–0.0300 could offer a smarter entry than chasing the top.
Bulls are in control. Manage your risk! 💪
#BMT #Bubblemaps #Binance
🚀 $BMT /USDT Breakout Alert!
Bubblemaps ($BMT ) is surging +31.65% to 0.03153, leading the Infrastructure Gainers with 18.49M USDT in 24h volume.
📊 4H Chart Highlights
Strong rebound from the 0.02 base
Price reclaimed MA(7), volume rising
Resistance: 0.03288, then 0.03748
Support: 0.02863
⚠️ RSI at 92 means overbought. A dip to 0.0286–0.0300 could offer a smarter entry than chasing the top.
Bulls are in control. Manage your risk! 💪
#BMT #Bubblemaps #Binance
Bubblemaps ($BMT ) is surging +31.65% to 0.03153, leading the Infrastructure Gainers with 18.49M USDT in 24h volume.
📊 4H Chart Highlights
Strong rebound from the 0.02 base
Price reclaimed MA(7), volume rising
Resistance: 0.03288, then 0.03748
Support: 0.02863
⚠️ RSI at 92 means overbought. A dip to 0.0286–0.0300 could offer a smarter entry than chasing the top.
Bulls are in control. Manage your risk! 💪
#BMT #Bubblemaps #Binance
91
·
--
Bullish
Bullish market outlook
$BMT /USDT: Is Bubblemaps Preparing for Its Next Comeback?
BMT is worth watching as interest in blockchain transparency and on-chain intelligence continues to grow. The Bubblemaps ecosystem focuses on making complex blockchain activity easier to understand, helping users investigate wallet connections, token distributions, and suspicious activity.
What makes $BMT interesting is its connection to a real use case rather than hype alone. As crypto markets mature, transparency and on-chain research remain important tools for traders and investors.
The latest market activity is giving BMT another reason to attract attention. On November 4, BMT recorded a sharp 24-hour rally of roughly 30%, with trading volume climbing above $100 million. This suggests a significant increase in market participation, although the move appears largely volume-driven rather than linked to a confirmed new fundamental catalyst.
Another positive development is $BMT Upbit KRW market launch on October 24, expanding access to South Korean traders and potentially improving liquidity.
{future}(BMTUSDT)
Key levels to watch:
* Resistance: $0.032–$0.035
* Support: $0.025–$0.027
* Bullish confirmation: A sustained breakout above $0.032 with strong volume.
* Invalidation: Losing $0.025 could weaken the recovery structure.
If buyers maintain pressure and volume remains elevated, BMT could attempt another upward move toward $0.035 and potentially higher.
I'm bullish on BMT's recovery potential, but chasing a sharp green candle is risky. A healthy consolidation followed by a confirmed breakout would make the setup more convincing.
Can BMT turn this volume surge into a sustained rally, or will sellers take control again?
#BMT #Bubblemaps #Crypto #Binance #Altcoins
Bullish market outlook
$BMT /USDT: Is Bubblemaps Preparing for Its Next Comeback?
BMT is worth watching as interest in blockchain transparency and on-chain intelligence continues to grow. The Bubblemaps ecosystem focuses on making complex blockchain activity easier to understand, helping users investigate wallet connections, token distributions, and suspicious activity.
What makes $BMT interesting is its connection to a real use case rather than hype alone. As crypto markets mature, transparency and on-chain research remain important tools for traders and investors.
The latest market activity is giving BMT another reason to attract attention. On November 4, BMT recorded a sharp 24-hour rally of roughly 30%, with trading volume climbing above $100 million. This suggests a significant increase in market participation, although the move appears largely volume-driven rather than linked to a confirmed new fundamental catalyst.
Another positive development is $BMT Upbit KRW market launch on October 24, expanding access to South Korean traders and potentially improving liquidity.
Key levels to watch:
* Resistance: $0.032–$0.035
* Support: $0.025–$0.027
* Bullish confirmation: A sustained breakout above $0.032 with strong volume.
* Invalidation: Losing $0.025 could weaken the recovery structure.
If buyers maintain pressure and volume remains elevated, BMT could attempt another upward move toward $0.035 and potentially higher.
I'm bullish on BMT's recovery potential, but chasing a sharp green candle is risky. A healthy consolidation followed by a confirmed breakout would make the setup more convincing.
Can BMT turn this volume surge into a sustained rally, or will sellers take control again?
#BMT #Bubblemaps #Crypto #Binance #Altcoins
$BMT /USDT: Is Bubblemaps Preparing for Its Next Comeback?
BMT is worth watching as interest in blockchain transparency and on-chain intelligence continues to grow. The Bubblemaps ecosystem focuses on making complex blockchain activity easier to understand, helping users investigate wallet connections, token distributions, and suspicious activity.
What makes $BMT interesting is its connection to a real use case rather than hype alone. As crypto markets mature, transparency and on-chain research remain important tools for traders and investors.
The latest market activity is giving BMT another reason to attract attention. On November 4, BMT recorded a sharp 24-hour rally of roughly 30%, with trading volume climbing above $100 million. This suggests a significant increase in market participation, although the move appears largely volume-driven rather than linked to a confirmed new fundamental catalyst.
Another positive development is $BMT Upbit KRW market launch on October 24, expanding access to South Korean traders and potentially improving liquidity.
Key levels to watch:
* Resistance: $0.032–$0.035
* Support: $0.025–$0.027
* Bullish confirmation: A sustained breakout above $0.032 with strong volume.
* Invalidation: Losing $0.025 could weaken the recovery structure.
If buyers maintain pressure and volume remains elevated, BMT could attempt another upward move toward $0.035 and potentially higher.
I'm bullish on BMT's recovery potential, but chasing a sharp green candle is risky. A healthy consolidation followed by a confirmed breakout would make the setup more convincing.
Can BMT turn this volume surge into a sustained rally, or will sellers take control again?
#BMT #Bubblemaps #Crypto #Binance #Altcoins
157

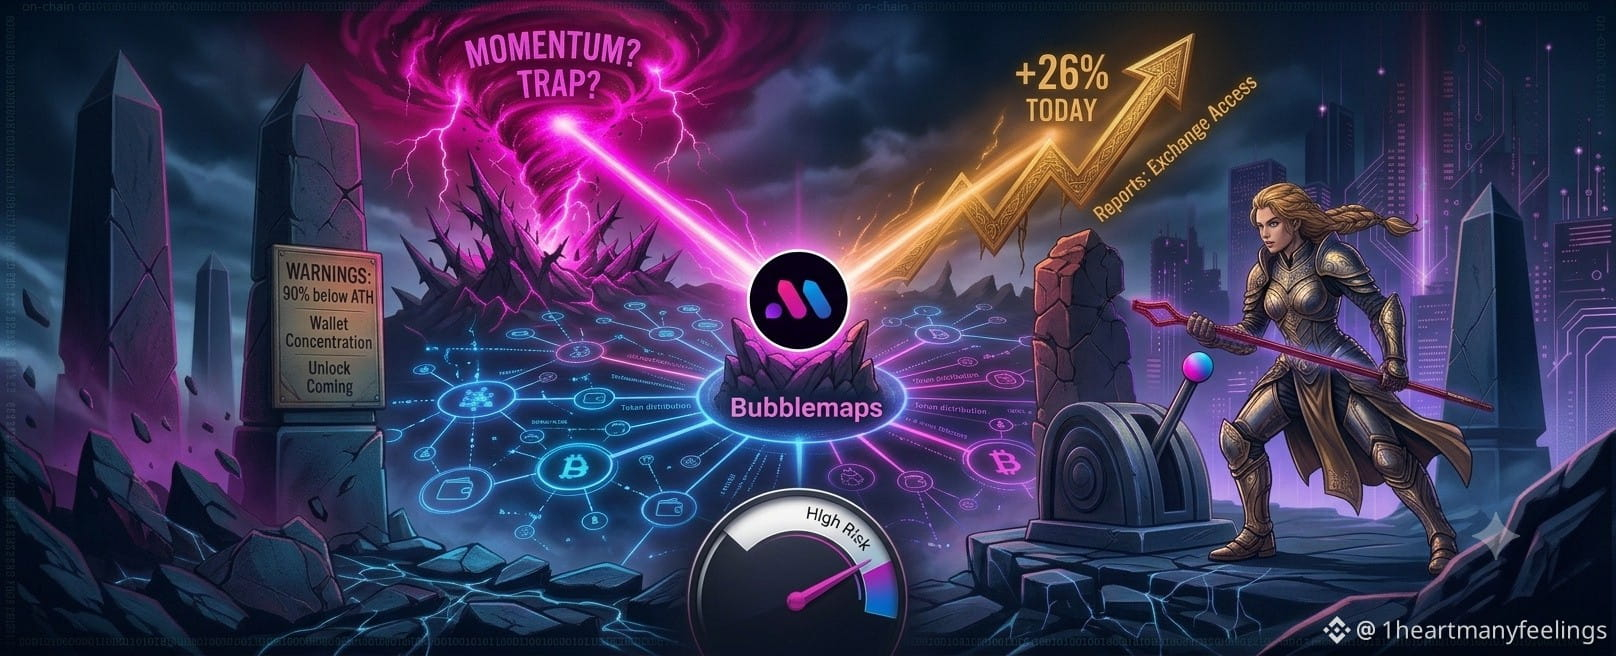
⚠️ BMT is up ~26% today. Before chasing it, here’s what you should know.
What it is: Bubblemaps is an on-chain analytics platform that maps wallet relationships and token distribution. Its BMT token unlocks premium features and governance.
Why it moved: Reports point to better trading and withdrawal access on major platforms. Volume ran at roughly 7x its monthly average.
What’s concerning:
It’s still ~90% below its all-time high.
Wallet holdings are concentrated.
A token unlock is coming, which can add selling pressure.
A sharp pump with heavy volume can reverse just as fast.
Tap $BMT for the live chart. Keep size tiny and never trade money you can’t afford to lose.
Momentum or trap? 👇
Disclosure: I may earn commissions from trades made through links or widgets in my posts (Binance Write to Earn / referral programs). This is analysis, not financial advice.
#BMT #Bubblemaps #crypto #BİNANCE
{future}(BMTUSDT)
⚠️ BMT is up ~26% today. Before chasing it, here’s what you should know.
What it is: Bubblemaps is an on-chain analytics platform that maps wallet relationships and token distribution. Its BMT token unlocks premium features and governance.
Why it moved: Reports point to better trading and withdrawal access on major platforms. Volume ran at roughly 7x its monthly average.
What’s concerning:
It’s still ~90% below its all-time high.
Wallet holdings are concentrated.
A token unlock is coming, which can add selling pressure.
A sharp pump with heavy volume can reverse just as fast.
Tap $BMT for the live chart. Keep size tiny and never trade money you can’t afford to lose.
Momentum or trap? 👇
Disclosure: I may earn commissions from trades made through links or widgets in my posts (Binance Write to Earn / referral programs). This is analysis, not financial advice.
#BMT #Bubblemaps #crypto #BİNANCE
What it is: Bubblemaps is an on-chain analytics platform that maps wallet relationships and token distribution. Its BMT token unlocks premium features and governance.
Why it moved: Reports point to better trading and withdrawal access on major platforms. Volume ran at roughly 7x its monthly average.
What’s concerning:
It’s still ~90% below its all-time high.
Wallet holdings are concentrated.
A token unlock is coming, which can add selling pressure.
A sharp pump with heavy volume can reverse just as fast.
Tap $BMT for the live chart. Keep size tiny and never trade money you can’t afford to lose.
Momentum or trap? 👇
Disclosure: I may earn commissions from trades made through links or widgets in my posts (Binance Write to Earn / referral programs). This is analysis, not financial advice.
#BMT #Bubblemaps #crypto #BİNANCE
180
$BMT MASSIVE EXPLOSION! +35% SURGE — OVER 18.5M VOL INFRASTRUCTURE GAINER WITH RSI NEUTRAL RESET AT 48.08 — TARGETING A BREAKOUT PAST $0.03154 SAR RESISTANCE FOR $0.03159 PEAK RETEST?
Binance Infrastructure top gainers are dominating the early morning session with massive bullish momentum! BMT (Bubblemaps) has logged an explosive +35.86% daily surge, backed by an impressive 18.50M USDT (706.84M $BMT) in 24-hour trading volume!
After rocketing off its 0.02164 daily bottom floor and recovering cleanly from its 0.02555 local swing support base, price action launched a vertical parabolic expansion to hit a double-top peak high of 0.03159. Following a healthy cooling-off retrace, $BMT is holding a solid higher-low support base near 0.02956.
Master Scalp Setup & Strategic Levels:
Trade Bias: Strong Bullish Rebound / Scalp Long
Accumulation Entry Zone: 0.02778 – 0.02956 (Local demand support consolidation range)
Key Targets: 0.03052 ➡️ 0.03154 ➡️ 0.03159 (24h Peak Retest)
Stop Loss: Below 0.02640
Why This Setup is Primed for Expansion:
Clean RSI Neutral Reset: The 15m RSI (6) has cleanly reset from overbought levels down to a healthy 48.08. This neutral positioning offers buyers optimal upside breathing room for the next breakout expansion leg.
Overhead SAR Breakout Trigger: Dynamic Parabolic SAR overhead resistance currently sits right above at 0.03154. A decisive 15m candle close above 0.03052 will flip momentum bullish and clear the pathway toward the SAR resistance at 0.03154 and a full retest of the 0.03159 peak high.
Are you taking a long entry on BMT at this $0.02778–$0.02956 support consolidation base, or waiting for a breakout close above $0.03052? Share your strategy in the comments below!
Trade Now $BMT
{spot}(BMTUSDT)
#BMT #Bubblemaps #altcoins
$BMT MASSIVE EXPLOSION! +35% SURGE — OVER 18.5M VOL INFRASTRUCTURE GAINER WITH RSI NEUTRAL RESET AT 48.08 — TARGETING A BREAKOUT PAST $0.03154 SAR RESISTANCE FOR $0.03159 PEAK RETEST?
Binance Infrastructure top gainers are dominating the early morning session with massive bullish momentum! BMT (Bubblemaps) has logged an explosive +35.86% daily surge, backed by an impressive 18.50M USDT (706.84M $BMT ) in 24-hour trading volume!
After rocketing off its 0.02164 daily bottom floor and recovering cleanly from its 0.02555 local swing support base, price action launched a vertical parabolic expansion to hit a double-top peak high of 0.03159. Following a healthy cooling-off retrace, $BMT is holding a solid higher-low support base near 0.02956.
Master Scalp Setup & Strategic Levels:
Trade Bias: Strong Bullish Rebound / Scalp Long
Accumulation Entry Zone: 0.02778 – 0.02956 (Local demand support consolidation range)
Key Targets: 0.03052 ➡️ 0.03154 ➡️ 0.03159 (24h Peak Retest)
Stop Loss: Below 0.02640
Why This Setup is Primed for Expansion:
Clean RSI Neutral Reset: The 15m RSI (6) has cleanly reset from overbought levels down to a healthy 48.08. This neutral positioning offers buyers optimal upside breathing room for the next breakout expansion leg.
Overhead SAR Breakout Trigger: Dynamic Parabolic SAR overhead resistance currently sits right above at 0.03154. A decisive 15m candle close above 0.03052 will flip momentum bullish and clear the pathway toward the SAR resistance at 0.03154 and a full retest of the 0.03159 peak high.
Are you taking a long entry on BMT at this $0.02778–$0.02956 support consolidation base, or waiting for a breakout close above $0.03052? Share your strategy in the comments below!
Trade Now $BMT
#BMT #Bubblemaps #altcoins
Binance Infrastructure top gainers are dominating the early morning session with massive bullish momentum! BMT (Bubblemaps) has logged an explosive +35.86% daily surge, backed by an impressive 18.50M USDT (706.84M $BMT ) in 24-hour trading volume!
After rocketing off its 0.02164 daily bottom floor and recovering cleanly from its 0.02555 local swing support base, price action launched a vertical parabolic expansion to hit a double-top peak high of 0.03159. Following a healthy cooling-off retrace, $BMT is holding a solid higher-low support base near 0.02956.
Master Scalp Setup & Strategic Levels:
Trade Bias: Strong Bullish Rebound / Scalp Long
Accumulation Entry Zone: 0.02778 – 0.02956 (Local demand support consolidation range)
Key Targets: 0.03052 ➡️ 0.03154 ➡️ 0.03159 (24h Peak Retest)
Stop Loss: Below 0.02640
Why This Setup is Primed for Expansion:
Clean RSI Neutral Reset: The 15m RSI (6) has cleanly reset from overbought levels down to a healthy 48.08. This neutral positioning offers buyers optimal upside breathing room for the next breakout expansion leg.
Overhead SAR Breakout Trigger: Dynamic Parabolic SAR overhead resistance currently sits right above at 0.03154. A decisive 15m candle close above 0.03052 will flip momentum bullish and clear the pathway toward the SAR resistance at 0.03154 and a full retest of the 0.03159 peak high.
Are you taking a long entry on BMT at this $0.02778–$0.02956 support consolidation base, or waiting for a breakout close above $0.03052? Share your strategy in the comments below!
Trade Now $BMT
#BMT #Bubblemaps #altcoins
1
234

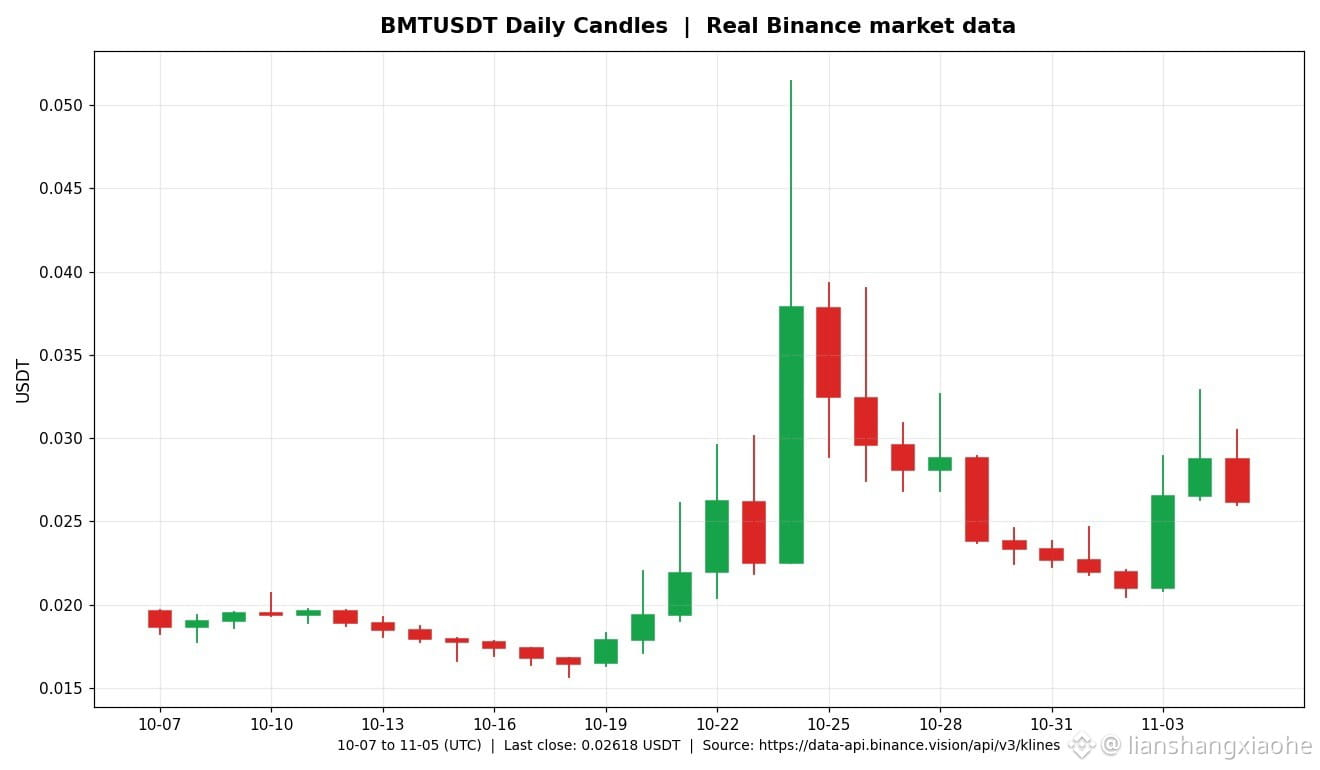
BMT’s price action today is enough to make your palms sweat: On November 4, its Binance daily high hit $0.0329, briefly climbing more than 20% from the previous day’s close. Snapshots from multiple sources showed a 24-hour gain of around +20% to +29% (CoinMarketCap reported +28.9% to $0.0299, with 24-hour trading volume of $122 million; CoinDataFlow reported +28.2% to $0.0305; Bitget reported +20% to $0.0293), propelling it into the day’s top three gainers. BMT’s full-day Binance close on November 4 was $0.02873, up about 8.3% from the previous day’s close of $0.02652. The 10,000 USDT you put in yesterday at $0.0265 would be worth about 10,830 USDT at the close. The driver wasn’t positive fundamentals, but a war of words: competitor Trap Map accused Bubblemaps of signing a secret consulting agreement with Proxima worth $45,000 a month and issued a pre-litigation notice requiring a response by November 16. Bubblemaps publicly denied the claim, saying the circulated contract was forged. The louder the dispute gets, the more excited speculators become—but with a lawsuit looming, think carefully about what you’re really paying for before chasing the price.$BMT #Bubblemaps #On-chain data
BMT’s price action today is enough to make your palms sweat: On November 4, its Binance daily high hit $0.0329, briefly climbing more than 20% from the previous day’s close. Snapshots from multiple sources showed a 24-hour gain of around +20% to +29% (CoinMarketCap reported +28.9% to $0.0299, with 24-hour trading volume of $122 million; CoinDataFlow reported +28.2% to $0.0305; Bitget reported +20% to $0.0293), propelling it into the day’s top three gainers. BMT’s full-day Binance close on November 4 was $0.02873, up about 8.3% from the previous day’s close of $0.02652. The 10,000 USDT you put in yesterday at $0.0265 would be worth about 10,830 USDT at the close. The driver wasn’t positive fundamentals, but a war of words: competitor Trap Map accused Bubblemaps of signing a secret consulting agreement with Proxima worth $45,000 a month and issued a pre-litigation notice requiring a response by November 16. Bubblemaps publicly denied the claim, saying the circulated contract was forged. The louder the dispute gets, the more excited speculators become—but with a lawsuit looming, think carefully about what you’re really paying for before chasing the price.$BMT #Bubblemaps #On-chain data
39

BMT Explodes 27% Off the $0.0204 Low and Reclaims the 4H MA(99)Bubblemaps (BMT) is trading at $0.02637, up 27.37% on the day, making it one of the top gainers on Binance right now. The 4-hour chart shows a sharp V-shaped reversal with volume to back it up.
What the numbers say
24h High: $0.02890
24h Low: $0.02060
24h Volume: 552.92M BMT (about $13.88M)
What I’m seeing on the 4H chart
BMT spent several sessions bleeding lower after getting rejected near $0.0289, eventually bottoming out at $0.02044. Sellers looked exhausted down there, with small-bodied candles printing near the lows before buyers took control. What followed was a powerful run of green 4H candles that carried price straight through the $0.0228 to $0.0250 zone, with one candle spiking as high as $0.0289 before a pullback. Price is now consolidating around $0.0264, holding most of the gains.
The moving averages confirm the shift. The MA(7) at 0.02412 has turned sharply upward and is well below price, and the MA(25) at 0.02278 is starting to flatten and curl up. Most importantly, price has pushed above the MA(99) at 0.02500, which had been acting as overhead resistance. That level is now the line bulls need to defend. Note that the MA(7) is still catching up and has not yet crossed above the MA(99), so the trend change isn’t fully confirmed.
Volume is the standout here. The breakout candles came with a clear surge in participation, far above the recent average, which makes this move more credible than a thin, low-volume pump. That said, the volume on the latest candle has cooled, and after a move of this size, a retest or pullback would not be surprising.
Key levels I’m watching
Support: $0.0250 (MA 99), then $0.0241 (MA 7) and $0.0228
Resistance: $0.0276, then $0.0289 and $0.0295
A hold above $0.0250 on any pullback would keep the breakout structure intact, and a clean 4H close above $0.0276 would open the door for another test of $0.0289. Losing the MA(99) would suggest this was a fast spike that is fading, with $0.0228 as the next downside area. After a 27% day, patience matters more than chasing.
#Bubblemaps #BMTUSDT #CryptoTrading #TechnicalAnalysis
$BMT
{spot}(BMTUSDT)
BMT Explodes 27% Off the $0.0204 Low and Reclaims the 4H MA(99)
Bubblemaps (BMT) is trading at $0.02637, up 27.37% on the day, making it one of the top gainers on Binance right now. The 4-hour chart shows a sharp V-shaped reversal with volume to back it up.
What the numbers say
24h High: $0.02890
24h Low: $0.02060
24h Volume: 552.92M BMT (about $13.88M)
What I’m seeing on the 4H chart
BMT spent several sessions bleeding lower after getting rejected near $0.0289, eventually bottoming out at $0.02044. Sellers looked exhausted down there, with small-bodied candles printing near the lows before buyers took control. What followed was a powerful run of green 4H candles that carried price straight through the $0.0228 to $0.0250 zone, with one candle spiking as high as $0.0289 before a pullback. Price is now consolidating around $0.0264, holding most of the gains.
The moving averages confirm the shift. The MA(7) at 0.02412 has turned sharply upward and is well below price, and the MA(25) at 0.02278 is starting to flatten and curl up. Most importantly, price has pushed above the MA(99) at 0.02500, which had been acting as overhead resistance. That level is now the line bulls need to defend. Note that the MA(7) is still catching up and has not yet crossed above the MA(99), so the trend change isn’t fully confirmed.
Volume is the standout here. The breakout candles came with a clear surge in participation, far above the recent average, which makes this move more credible than a thin, low-volume pump. That said, the volume on the latest candle has cooled, and after a move of this size, a retest or pullback would not be surprising.
Key levels I’m watching
Support: $0.0250 (MA 99), then $0.0241 (MA 7) and $0.0228
Resistance: $0.0276, then $0.0289 and $0.0295
A hold above $0.0250 on any pullback would keep the breakout structure intact, and a clean 4H close above $0.0276 would open the door for another test of $0.0289. Losing the MA(99) would suggest this was a fast spike that is fading, with $0.0228 as the next downside area. After a 27% day, patience matters more than chasing.
#Bubblemaps #BMTUSDT #CryptoTrading #TechnicalAnalysis
$BMT
What the numbers say
24h High: $0.02890
24h Low: $0.02060
24h Volume: 552.92M BMT (about $13.88M)
What I’m seeing on the 4H chart
BMT spent several sessions bleeding lower after getting rejected near $0.0289, eventually bottoming out at $0.02044. Sellers looked exhausted down there, with small-bodied candles printing near the lows before buyers took control. What followed was a powerful run of green 4H candles that carried price straight through the $0.0228 to $0.0250 zone, with one candle spiking as high as $0.0289 before a pullback. Price is now consolidating around $0.0264, holding most of the gains.
The moving averages confirm the shift. The MA(7) at 0.02412 has turned sharply upward and is well below price, and the MA(25) at 0.02278 is starting to flatten and curl up. Most importantly, price has pushed above the MA(99) at 0.02500, which had been acting as overhead resistance. That level is now the line bulls need to defend. Note that the MA(7) is still catching up and has not yet crossed above the MA(99), so the trend change isn’t fully confirmed.
Volume is the standout here. The breakout candles came with a clear surge in participation, far above the recent average, which makes this move more credible than a thin, low-volume pump. That said, the volume on the latest candle has cooled, and after a move of this size, a retest or pullback would not be surprising.
Key levels I’m watching
Support: $0.0250 (MA 99), then $0.0241 (MA 7) and $0.0228
Resistance: $0.0276, then $0.0289 and $0.0295
A hold above $0.0250 on any pullback would keep the breakout structure intact, and a clean 4H close above $0.0276 would open the door for another test of $0.0289. Losing the MA(99) would suggest this was a fast spike that is fading, with $0.0228 as the next downside area. After a 27% day, patience matters more than chasing.
#Bubblemaps #BMTUSDT #CryptoTrading #TechnicalAnalysis
$BMT
5

·
--
🚨 BMT (BUBBLEMAPS) — WHAT'S NEXT
$BMT
📊 BMT is showing strong short-term price momentum.
🔹 Recent 24H movement: Around +32%
🔹 Market activity: Trading volume has increased.
🔹 Bullish signal: Momentum indicators are positive.
🔹 Risk signal: RSI is in overbought territory.
🔹 Resistance: Watch the recent high near $0.0284.
🔹 Support: Watch the $0.0205–$0.0220 zone.
📈 Outlook: Momentum is positive, but a short-term pullback is possible.
⚠️ No guaranteed prediction. Wait for confirmation and DYOR.
What's your view on BMT — bullish or bearish?
#BMT #Bubblemaps #CryptoAnalysis s #BinanceSquare
🚨 BMT (BUBBLEMAPS) — WHAT'S NEXT
$BMT
📊 BMT is showing strong short-term price momentum.
🔹 Recent 24H movement: Around +32%
🔹 Market activity: Trading volume has increased.
🔹 Bullish signal: Momentum indicators are positive.
🔹 Risk signal: RSI is in overbought territory.
🔹 Resistance: Watch the recent high near $0.0284.
🔹 Support: Watch the $0.0205–$0.0220 zone.
📈 Outlook: Momentum is positive, but a short-term pullback is possible.
⚠️ No guaranteed prediction. Wait for confirmation and DYOR.
What's your view on BMT — bullish or bearish?
#BMT #Bubblemaps #CryptoAnalysis s #BinanceSquare
$BMT
📊 BMT is showing strong short-term price momentum.
🔹 Recent 24H movement: Around +32%
🔹 Market activity: Trading volume has increased.
🔹 Bullish signal: Momentum indicators are positive.
🔹 Risk signal: RSI is in overbought territory.
🔹 Resistance: Watch the recent high near $0.0284.
🔹 Support: Watch the $0.0205–$0.0220 zone.
📈 Outlook: Momentum is positive, but a short-term pullback is possible.
⚠️ No guaranteed prediction. Wait for confirmation and DYOR.
What's your view on BMT — bullish or bearish?
#BMT #Bubblemaps #CryptoAnalysis s #BinanceSquare

272

·
--
📊 $BMT
{future}(BMTUSDT)
– Bubblemaps
Bubblemaps brings blockchain transparency through visual on-chain data analysis. Its project concept makes it worth watching. Increasing volume and a sustained breakout could attract further market interest.
#BMT #Bubblemaps #Blockchain #Crypto
📊 $BMT
– Bubblemaps
Bubblemaps brings blockchain transparency through visual on-chain data analysis. Its project concept makes it worth watching. Increasing volume and a sustained breakout could attract further market interest.
#BMT #Bubblemaps #Blockchain #Crypto
– Bubblemaps
Bubblemaps brings blockchain transparency through visual on-chain data analysis. Its project concept makes it worth watching. Increasing volume and a sustained breakout could attract further market interest.
#BMT #Bubblemaps #Blockchain #Crypto
99

·
--
BMT is still trading at a discount to its 0.037 opening price on Upbit KRW markets! The truth behind Bubblemaps ($BMT)’s rebound on $160 million in trading volume
Bubblemaps (BMT), a leading on-chain data visualization platform, is up 24.16% today at $0.02929, with trading volume surging to $160 million!
In-depth review: When Upbit opened KRW spot trading on October 24, the price briefly surged to around $0.03700. Although today’s rolling window shows a green candle, the price is still below its first-day listing level. This indicates that the Korean opening premium has largely faded.
Conclusion: $0.02500 is the key support level that held before the opening. This is a technical rebound after listing hype has cooled—not a new major uptrend.
#BMT #Bubblemaps
$BMT
{future}(BMTUSDT)
BMT is still trading at a discount to its 0.037 opening price on Upbit KRW markets! The truth behind Bubblemaps ($BMT )’s rebound on $160 million in trading volume
Bubblemaps (BMT), a leading on-chain data visualization platform, is up 24.16% today at $0.02929, with trading volume surging to $160 million!
In-depth review: When Upbit opened KRW spot trading on October 24, the price briefly surged to around $0.03700. Although today’s rolling window shows a green candle, the price is still below its first-day listing level. This indicates that the Korean opening premium has largely faded.
Conclusion: $0.02500 is the key support level that held before the opening. This is a technical rebound after listing hype has cooled—not a new major uptrend.
#BMT #Bubblemaps
$BMT
Bubblemaps (BMT), a leading on-chain data visualization platform, is up 24.16% today at $0.02929, with trading volume surging to $160 million!
In-depth review: When Upbit opened KRW spot trading on October 24, the price briefly surged to around $0.03700. Although today’s rolling window shows a green candle, the price is still below its first-day listing level. This indicates that the Korean opening premium has largely faded.
Conclusion: $0.02500 is the key support level that held before the opening. This is a technical rebound after listing hype has cooled—not a new major uptrend.
#BMT #Bubblemaps
$BMT
1
502
BMT Surges on a Volume Spike While ZRO Tests Resistance: A Bounce Versus a PauseBMT Surges on a Volume Spike While ZRO Tests Resistance: A Bounce Versus a Pause
Bubblemaps and LayerZero are showing very different behavior today. BMT is the day’s standout with a sharp rebound, while ZRO is edging lower and struggling to reclaim key averages.
Bubblemaps (BMT/USDT)
BMT is trading around $0.02373, up 12.89% on the day. The 24h range is $0.02044 to $0.02600, with roughly 295.71M BMT changing hands (about $6.88M). That makes it one of the stronger movers in this group of charts.
The 4-hour chart shows a long, steady downtrend from the $0.03266 area, which bottomed at $0.02044. Then came one large green candle on heavy volume, the biggest volume bar on the chart by a wide margin. That pushed price back above MA(7) at 0.02203 and MA(25) at 0.02251 in one move, and it tagged the MA(99) at 0.02472 before pulling back. The latest candle is red, so the first wave of buyers is already taking some profit.
This is a strong reversal signal, but one candle doesn’t make a trend. The overall structure is still a series of lower highs, and the 99-MA is acting as resistance right now.
LayerZero (ZRO/USDT)
ZRO is at $1.759, down 1.07%, with a 24h range of $1.680 to $1.802. After the drop to $1.417 on October 30, it recovered strongly and peaked near $1.928, but that rally faded and price has since drifted back down.
Price is now sitting between the averages: just above MA(7) at 1.733, but below MA(25) at 1.771 and MA(99) at 1.779. Those two longer averages are bunched together right above price, creating a tight resistance zone around $1.77 to $1.78. The latest green candle is trying to push into that area, which makes the next few candles important. Volume is light compared with the earlier swings, so there’s little conviction either way.
What I’m watching
BMT: $0.02252 to $0.02203 is the zone where the MA(25) and MA(7) sit, and holding it would keep the bounce healthy. Above, a clean close over the 99-MA near $0.02472 is the next test, and $0.02600 is the daily high to beat.
ZRO: A push above $1.779 would flip the short-term picture, while $1.680 is the daily low to defend.
Volume: BMT needs follow-through volume to prove the spike wasn’t a one-off. ZRO needs a pickup to break out of its range.
BMT looks like a promising bounce that still has to prove itself, and ZRO is a coin consolidating just below resistance. I’d rather see confirmation than chase a single strong candle.
#Bubblemaps #LayerZero #BMT #ZRO #CryptoAnalysis
$BMT
{spot}(BMTUSDT)
$ZRO
{spot}(ZROUSDT)
BMT Surges on a Volume Spike While ZRO Tests Resistance: A Bounce Versus a Pause
BMT Surges on a Volume Spike While ZRO Tests Resistance: A Bounce Versus a Pause
Bubblemaps and LayerZero are showing very different behavior today. BMT is the day’s standout with a sharp rebound, while ZRO is edging lower and struggling to reclaim key averages.
Bubblemaps (BMT/USDT)
BMT is trading around $0.02373, up 12.89% on the day. The 24h range is $0.02044 to $0.02600, with roughly 295.71M BMT changing hands (about $6.88M). That makes it one of the stronger movers in this group of charts.
The 4-hour chart shows a long, steady downtrend from the $0.03266 area, which bottomed at $0.02044. Then came one large green candle on heavy volume, the biggest volume bar on the chart by a wide margin. That pushed price back above MA(7) at 0.02203 and MA(25) at 0.02251 in one move, and it tagged the MA(99) at 0.02472 before pulling back. The latest candle is red, so the first wave of buyers is already taking some profit.
This is a strong reversal signal, but one candle doesn’t make a trend. The overall structure is still a series of lower highs, and the 99-MA is acting as resistance right now.
LayerZero (ZRO/USDT)
ZRO is at $1.759, down 1.07%, with a 24h range of $1.680 to $1.802. After the drop to $1.417 on October 30, it recovered strongly and peaked near $1.928, but that rally faded and price has since drifted back down.
Price is now sitting between the averages: just above MA(7) at 1.733, but below MA(25) at 1.771 and MA(99) at 1.779. Those two longer averages are bunched together right above price, creating a tight resistance zone around $1.77 to $1.78. The latest green candle is trying to push into that area, which makes the next few candles important. Volume is light compared with the earlier swings, so there’s little conviction either way.
What I’m watching
BMT: $0.02252 to $0.02203 is the zone where the MA(25) and MA(7) sit, and holding it would keep the bounce healthy. Above, a clean close over the 99-MA near $0.02472 is the next test, and $0.02600 is the daily high to beat.
ZRO: A push above $1.779 would flip the short-term picture, while $1.680 is the daily low to defend.
Volume: BMT needs follow-through volume to prove the spike wasn’t a one-off. ZRO needs a pickup to break out of its range.
BMT looks like a promising bounce that still has to prove itself, and ZRO is a coin consolidating just below resistance. I’d rather see confirmation than chase a single strong candle.
#Bubblemaps #LayerZero #BMT #ZRO #CryptoAnalysis
$BMT
$ZRO
Bubblemaps and LayerZero are showing very different behavior today. BMT is the day’s standout with a sharp rebound, while ZRO is edging lower and struggling to reclaim key averages.
Bubblemaps (BMT/USDT)
BMT is trading around $0.02373, up 12.89% on the day. The 24h range is $0.02044 to $0.02600, with roughly 295.71M BMT changing hands (about $6.88M). That makes it one of the stronger movers in this group of charts.
The 4-hour chart shows a long, steady downtrend from the $0.03266 area, which bottomed at $0.02044. Then came one large green candle on heavy volume, the biggest volume bar on the chart by a wide margin. That pushed price back above MA(7) at 0.02203 and MA(25) at 0.02251 in one move, and it tagged the MA(99) at 0.02472 before pulling back. The latest candle is red, so the first wave of buyers is already taking some profit.
This is a strong reversal signal, but one candle doesn’t make a trend. The overall structure is still a series of lower highs, and the 99-MA is acting as resistance right now.
LayerZero (ZRO/USDT)
ZRO is at $1.759, down 1.07%, with a 24h range of $1.680 to $1.802. After the drop to $1.417 on October 30, it recovered strongly and peaked near $1.928, but that rally faded and price has since drifted back down.
Price is now sitting between the averages: just above MA(7) at 1.733, but below MA(25) at 1.771 and MA(99) at 1.779. Those two longer averages are bunched together right above price, creating a tight resistance zone around $1.77 to $1.78. The latest green candle is trying to push into that area, which makes the next few candles important. Volume is light compared with the earlier swings, so there’s little conviction either way.
What I’m watching
BMT: $0.02252 to $0.02203 is the zone where the MA(25) and MA(7) sit, and holding it would keep the bounce healthy. Above, a clean close over the 99-MA near $0.02472 is the next test, and $0.02600 is the daily high to beat.
ZRO: A push above $1.779 would flip the short-term picture, while $1.680 is the daily low to defend.
Volume: BMT needs follow-through volume to prove the spike wasn’t a one-off. ZRO needs a pickup to break out of its range.
BMT looks like a promising bounce that still has to prove itself, and ZRO is a coin consolidating just below resistance. I’d rather see confirmation than chase a single strong candle.
#Bubblemaps #LayerZero #BMT #ZRO #CryptoAnalysis
$BMT
$ZRO
33

#Bubblemaps
🚀 Bubblemaps ($BMT ) in the Spotlight: What’s Happening with the Token?
Over the last 24 hours, the BMT token has risen by 12.71%, reaching a price of $0.0240. The primary catalyst was an announcement from Binance, though the market remains tense.
Let’s break down the key factors driving the coin’s current movement:
1️⃣ New Development from Binance and Cross-Chain Integration
What happened: The Binance exchange announced support for the BMT token on the BSC and Solana networks (launching on November 3 at 04:00 UTC).
Pros: This provides a massive boost to liquidity and opens the project up to a broader audience of investors.
Cons: The introduction of new networks could fragment existing liquidity across different blockchains.
2️⃣ Massive Surge in Trading Volume
What happened: Trading volume has spiked by 240.15%, exceeding $35.1 million, with a volume-to-market-cap ratio of 1.92.
Pros: High liquidity ensures rapid order execution and indicates strong interest from traders.
Cons: Such sharp spikes are often accompanied by high volatility and the risk of a correction.
3️⃣ Technical Analysis and Key Levels
Current situation: BMT is attempting to establish a foothold above the $0.022 mark. Upside targets: Immediate resistance lies at $0.027. A breakout could lead to a move toward the $0.027–$0.030 range.
Support levels: In the event of a decline, $0.020 serves as a key defensive zone, while $0.018 is the critical level.
⚠️ Conclusion: Despite positive news from Binance, the market remains unpredictable.
{future}(BMTUSDT)
#Bubblemaps
🚀 Bubblemaps ($BMT ) in the Spotlight: What’s Happening with the Token?
Over the last 24 hours, the BMT token has risen by 12.71%, reaching a price of $0.0240. The primary catalyst was an announcement from Binance, though the market remains tense.
Let’s break down the key factors driving the coin’s current movement:
1️⃣ New Development from Binance and Cross-Chain Integration
What happened: The Binance exchange announced support for the BMT token on the BSC and Solana networks (launching on November 3 at 04:00 UTC).
Pros: This provides a massive boost to liquidity and opens the project up to a broader audience of investors.
Cons: The introduction of new networks could fragment existing liquidity across different blockchains.
2️⃣ Massive Surge in Trading Volume
What happened: Trading volume has spiked by 240.15%, exceeding $35.1 million, with a volume-to-market-cap ratio of 1.92.
Pros: High liquidity ensures rapid order execution and indicates strong interest from traders.
Cons: Such sharp spikes are often accompanied by high volatility and the risk of a correction.
3️⃣ Technical Analysis and Key Levels
Current situation: BMT is attempting to establish a foothold above the $0.022 mark. Upside targets: Immediate resistance lies at $0.027. A breakout could lead to a move toward the $0.027–$0.030 range.
Support levels: In the event of a decline, $0.020 serves as a key defensive zone, while $0.018 is the critical level.
⚠️ Conclusion: Despite positive news from Binance, the market remains unpredictable.
🚀 Bubblemaps ($BMT ) in the Spotlight: What’s Happening with the Token?
Over the last 24 hours, the BMT token has risen by 12.71%, reaching a price of $0.0240. The primary catalyst was an announcement from Binance, though the market remains tense.
Let’s break down the key factors driving the coin’s current movement:
1️⃣ New Development from Binance and Cross-Chain Integration
What happened: The Binance exchange announced support for the BMT token on the BSC and Solana networks (launching on November 3 at 04:00 UTC).
Pros: This provides a massive boost to liquidity and opens the project up to a broader audience of investors.
Cons: The introduction of new networks could fragment existing liquidity across different blockchains.
2️⃣ Massive Surge in Trading Volume
What happened: Trading volume has spiked by 240.15%, exceeding $35.1 million, with a volume-to-market-cap ratio of 1.92.
Pros: High liquidity ensures rapid order execution and indicates strong interest from traders.
Cons: Such sharp spikes are often accompanied by high volatility and the risk of a correction.
3️⃣ Technical Analysis and Key Levels
Current situation: BMT is attempting to establish a foothold above the $0.022 mark. Upside targets: Immediate resistance lies at $0.027. A breakout could lead to a move toward the $0.027–$0.030 range.
Support levels: In the event of a decline, $0.020 serves as a key defensive zone, while $0.018 is the critical level.
⚠️ Conclusion: Despite positive news from Binance, the market remains unpredictable.

59

·
--
Market Update: Bubblemaps (BMT) is gaining momentum in the short term, breaking above 0.03 USDT with a 24-hour increase of 32.14%.
As a project focused on visualizing on-chain token holdings, what makes BMT’s latest rally especially worth watching is the shift in holder structure behind the price action: whether whale addresses are accumulating, turnover is rising, and genuine buying support is coming in during the breakout will all affect its staying power.
A strong breakout can fuel FOMO, but short-term volatility is likely to intensify as well. Avoid chasing the price blindly. Watch how it performs on a pullback to support, and assess it alongside trading volume and broader market trends. Set a stop-loss and manage your position size before entering.
#Bubblemaps #BMT #CryptoMarket
https://foresightnews.pro/news/116804
Market Update: Bubblemaps (BMT) is gaining momentum in the short term, breaking above 0.03 USDT with a 24-hour increase of 32.14%.
As a project focused on visualizing on-chain token holdings, what makes BMT’s latest rally especially worth watching is the shift in holder structure behind the price action: whether whale addresses are accumulating, turnover is rising, and genuine buying support is coming in during the breakout will all affect its staying power.
A strong breakout can fuel FOMO, but short-term volatility is likely to intensify as well. Avoid chasing the price blindly. Watch how it performs on a pullback to support, and assess it alongside trading volume and broader market trends. Set a stop-loss and manage your position size before entering.
#Bubblemaps #BMT #CryptoMarket
https://foresightnews.pro/news/116804
As a project focused on visualizing on-chain token holdings, what makes BMT’s latest rally especially worth watching is the shift in holder structure behind the price action: whether whale addresses are accumulating, turnover is rising, and genuine buying support is coming in during the breakout will all affect its staying power.
A strong breakout can fuel FOMO, but short-term volatility is likely to intensify as well. Avoid chasing the price blindly. Watch how it performs on a pullback to support, and assess it alongside trading volume and broader market trends. Set a stop-loss and manage your position size before entering.
#Bubblemaps #BMT #CryptoMarket
https://foresightnews.pro/news/116804
7

Bubblemaps’ native token BMT has strengthened in the short term, breaking above 0.03 USDT, with a 24-hour gain of 32.14%. The rally has been accompanied by higher trading volume, indicating growing market interest. However, after such a rapid short-term rise, the risk of chasing the price is also mounting.
Bubblemaps focuses on visualizing on-chain token-holder structures, helping users identify whale holdings, token concentration, and linked addresses. It is a tool for data analysis and due diligence. For meme coins, new tokens, and highly volatile assets, tools like this can help investors quickly assess whether holdings are overly concentrated.
A rapid price rally does not mean fundamentals have improved in tandem. Investors should continue to monitor platform data usage, ecosystem partnerships, the token release schedule, and overall market sentiment. If the price fluctuates at elevated levels on high volume, watch for profit-taking; if it holds key levels and continues to receive volume support, the price action will be more meaningful.
For trading, it is advisable to manage position sizes and avoid blindly chasing the price after a sharp rally. It is preferable to wait for a confirmed pullback or further validation from trading volume. Crypto markets are highly volatile, and every individual market move should be considered within the framework of your own risk management.
#Bubblemaps #链上数据 #CryptoMarket
Bubblemaps’ native token BMT has strengthened in the short term, breaking above 0.03 USDT, with a 24-hour gain of 32.14%. The rally has been accompanied by higher trading volume, indicating growing market interest. However, after such a rapid short-term rise, the risk of chasing the price is also mounting.
Bubblemaps focuses on visualizing on-chain token-holder structures, helping users identify whale holdings, token concentration, and linked addresses. It is a tool for data analysis and due diligence. For meme coins, new tokens, and highly volatile assets, tools like this can help investors quickly assess whether holdings are overly concentrated.
A rapid price rally does not mean fundamentals have improved in tandem. Investors should continue to monitor platform data usage, ecosystem partnerships, the token release schedule, and overall market sentiment. If the price fluctuates at elevated levels on high volume, watch for profit-taking; if it holds key levels and continues to receive volume support, the price action will be more meaningful.
For trading, it is advisable to manage position sizes and avoid blindly chasing the price after a sharp rally. It is preferable to wait for a confirmed pullback or further validation from trading volume. Crypto markets are highly volatile, and every individual market move should be considered within the framework of your own risk management.
#Bubblemaps #链上数据 #CryptoMarket
Bubblemaps focuses on visualizing on-chain token-holder structures, helping users identify whale holdings, token concentration, and linked addresses. It is a tool for data analysis and due diligence. For meme coins, new tokens, and highly volatile assets, tools like this can help investors quickly assess whether holdings are overly concentrated.
A rapid price rally does not mean fundamentals have improved in tandem. Investors should continue to monitor platform data usage, ecosystem partnerships, the token release schedule, and overall market sentiment. If the price fluctuates at elevated levels on high volume, watch for profit-taking; if it holds key levels and continues to receive volume support, the price action will be more meaningful.
For trading, it is advisable to manage position sizes and avoid blindly chasing the price after a sharp rally. It is preferable to wait for a confirmed pullback or further validation from trading volume. Crypto markets are highly volatile, and every individual market move should be considered within the framework of your own risk management.
#Bubblemaps #链上数据 #CryptoMarket
Log in to explore more content
Join global crypto users on Binance Square
⚡️ Get latest and useful information about crypto.
💬 Trusted by the world’s largest crypto exchange.
👍 Discover real insights from verified creators.
Email / Phone number
Trending Topics
1
#BinanceReopensWithdrawalsForHYPE&APT
74,056 views
917 Discussing
2
#SouthKoreaDraftLawTargets15To20%ShareholderCap
74,533 views
604 Discussing
3
#TradFiForBeginners
174,045 views
1,800 Discussing
4
#KeplrAdvisesSocialLoginUsersToTransferAssets
41,820 views
492 Discussing
5
#TetherPlans€28.8MForJuventusCapitalIncrease
28,816 views
381 Discussing
6
#JobsReportRaisesHikeOdds
839,311 views
4,407 Discussing
7
#CPITestsDecemberRateOutlook
337,435 views
1,861 Discussing
8
#US Data Center Rules May Constrain AI Expansion
126,119 views
258 Discussing
9
#ARKPlans14ThematicETFsCoveringAIAndTokenizedMarkets
9,025 views
89 Discussing
10
#WillAnthropicListOnTime
266,262 views
1,874 Discussing