
#31
31
14,052 views
163 Discussing
Hot
Latest

SUI has an unlock date on 31/5, so the current price action is worth a closer look than usual.
Quick checklist for $SUI:
✅ Price around $0.92, 24h +0.63039% → slight volatility, no overly hot signals yet.
✅ Daily range $0.91–$0.94 → the $0.91 mark is crucial to watch if the market reacts to the unlock news.
✅ Token unlock valued at about $2.1M on 31/5 → this catalyst could make liquidity more sensitive, especially with a 24h volume sitting at $481.22M.
SUI is currently ranked #31, with a market cap of $3.68B. With this unlock catalyst, I'm not predicting the direction; I'm just prioritizing whether the price holds the range or breaks out post-event. 🔎
Which scenario are you leaning towards? #SUI $SUI #Crypto #BinanceSquare #DYOR
SUI has an unlock date on 31/5, so the current price action is worth a closer look than usual.
Quick checklist for $SUI :
✅ Price around $0.92, 24h +0.63039% → slight volatility, no overly hot signals yet.
✅ Daily range $0.91–$0.94 → the $0.91 mark is crucial to watch if the market reacts to the unlock news.
✅ Token unlock valued at about $2.1M on 31/5 → this catalyst could make liquidity more sensitive, especially with a 24h volume sitting at $481.22M.
SUI is currently ranked #31, with a market cap of $3.68B. With this unlock catalyst, I'm not predicting the direction; I'm just prioritizing whether the price holds the range or breaks out post-event. 🔎
Which scenario are you leaning towards? #SUI $SUI #Crypto #BinanceSquare #DYOR
Quick checklist for $SUI :
✅ Price around $0.92, 24h +0.63039% → slight volatility, no overly hot signals yet.
✅ Daily range $0.91–$0.94 → the $0.91 mark is crucial to watch if the market reacts to the unlock news.
✅ Token unlock valued at about $2.1M on 31/5 → this catalyst could make liquidity more sensitive, especially with a 24h volume sitting at $481.22M.
SUI is currently ranked #31, with a market cap of $3.68B. With this unlock catalyst, I'm not predicting the direction; I'm just prioritizing whether the price holds the range or breaks out post-event. 🔎
Which scenario are you leaning towards? #SUI $SUI #Crypto #BinanceSquare #DYOR
158

·
--
There’s something interesting going on with HUMA this time.
The price is down 1.21% over 15m, with volume at just 0.63x. That’s not really a major move, but OI is shrinking across both timeframes—15m: -2.06%, 1h: -2.87%—with about 300K U wiped off the notional. Price down + OI down is typically not new shorts piling in to drive the price lower; it’s longs pulling out, either through stop-losses or by reducing positions. There’s a strong deleveraging feel to it.
The active trade delta is -18%, and the buy/sell ratio is 0.69, so there’s selling pressure. But looking at OI alongside that, it seems more like panic selling than someone systematically shorting. The funding rate is still in a high percentile for recent levels, and longs were already pretty crowded with leverage at this point, so a round of liquidation wouldn’t be surprising.
It ranks #17 for anomalies across the whole pool and #31 for notional change—not the worst, but still up there. There’s still 68M in 24h trading volume, so liquidity hasn’t collapsed.
Personally, I find this kind of setup a lot more comfortable than “price down, OI up”—at least it’s not shorts pushing the price down. Now we’ll see whether longs are still willing to step in after this round of deleveraging is done. 🫠
There’s something interesting going on with HUMA this time.
The price is down 1.21% over 15m, with volume at just 0.63x. That’s not really a major move, but OI is shrinking across both timeframes—15m: -2.06%, 1h: -2.87%—with about 300K U wiped off the notional. Price down + OI down is typically not new shorts piling in to drive the price lower; it’s longs pulling out, either through stop-losses or by reducing positions. There’s a strong deleveraging feel to it.
The active trade delta is -18%, and the buy/sell ratio is 0.69, so there’s selling pressure. But looking at OI alongside that, it seems more like panic selling than someone systematically shorting. The funding rate is still in a high percentile for recent levels, and longs were already pretty crowded with leverage at this point, so a round of liquidation wouldn’t be surprising.
It ranks #17 for anomalies across the whole pool and #31 for notional change—not the worst, but still up there. There’s still 68M in 24h trading volume, so liquidity hasn’t collapsed.
Personally, I find this kind of setup a lot more comfortable than “price down, OI up”—at least it’s not shorts pushing the price down. Now we’ll see whether longs are still willing to step in after this round of deleveraging is done. 🫠
The price is down 1.21% over 15m, with volume at just 0.63x. That’s not really a major move, but OI is shrinking across both timeframes—15m: -2.06%, 1h: -2.87%—with about 300K U wiped off the notional. Price down + OI down is typically not new shorts piling in to drive the price lower; it’s longs pulling out, either through stop-losses or by reducing positions. There’s a strong deleveraging feel to it.
The active trade delta is -18%, and the buy/sell ratio is 0.69, so there’s selling pressure. But looking at OI alongside that, it seems more like panic selling than someone systematically shorting. The funding rate is still in a high percentile for recent levels, and longs were already pretty crowded with leverage at this point, so a round of liquidation wouldn’t be surprising.
It ranks #17 for anomalies across the whole pool and #31 for notional change—not the worst, but still up there. There’s still 68M in 24h trading volume, so liquidity hasn’t collapsed.
Personally, I find this kind of setup a lot more comfortable than “price down, OI up”—at least it’s not shorts pushing the price down. Now we’ll see whether longs are still willing to step in after this round of deleveraging is done. 🫠

·
--
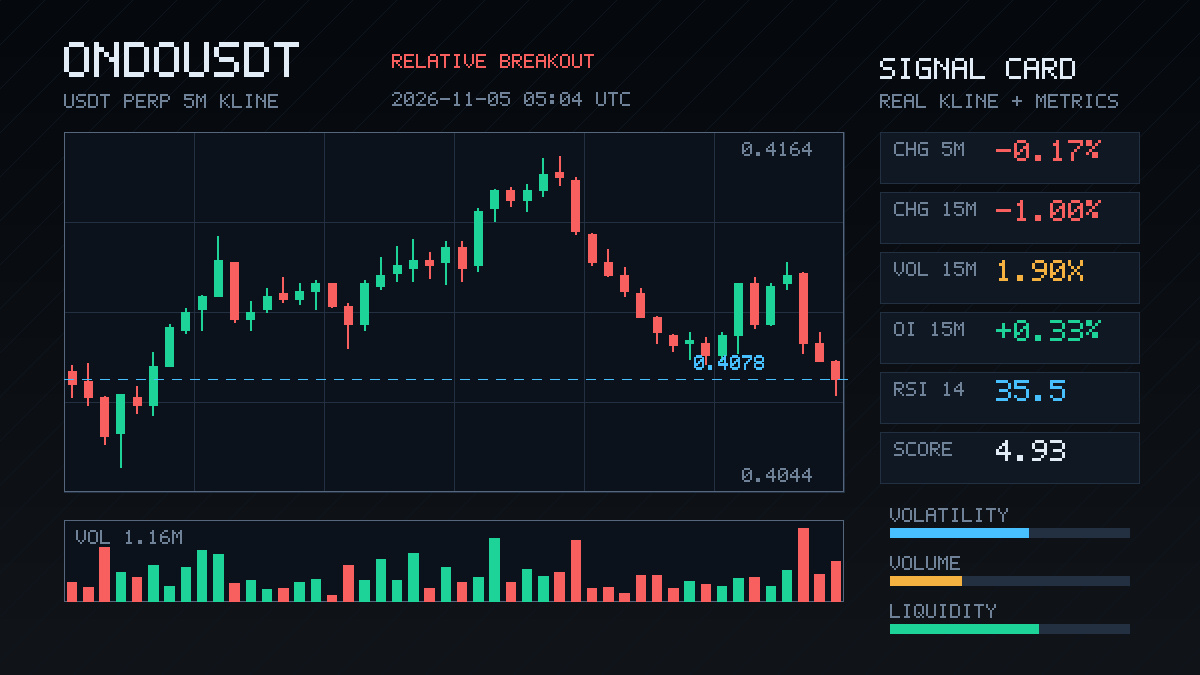
$ONDO is an interesting spot: price has broken below the lower bound of the last 20 5m candles, 15m volume has risen to 1.9x, and the aggressive buy/sell ratio is 0.71, so selling pressure is in control. But OI is up, +0.37% over 1h, which structurally looks more like new shorts entering than longs capitulating and exiting. Notional change ranks #31 across the pool, while its anomaly percentile is only 50.8%, suggesting a local volume-driven breakout rather than a market-wide move. Daily trading volume of 72M should support this depth. First, watch whether price can reclaim the lower bound of this range; if it can't, the bears remain in control.
$ONDO is an interesting spot: price has broken below the lower bound of the last 20 5m candles, 15m volume has risen to 1.9x, and the aggressive buy/sell ratio is 0.71, so selling pressure is in control. But OI is up, +0.37% over 1h, which structurally looks more like new shorts entering than longs capitulating and exiting. Notional change ranks #31 across the pool, while its anomaly percentile is only 50.8%, suggesting a local volume-driven breakout rather than a market-wide move. Daily trading volume of 72M should support this depth. First, watch whether price can reclaim the lower bound of this range; if it can't, the bears remain in control.
1

·
--
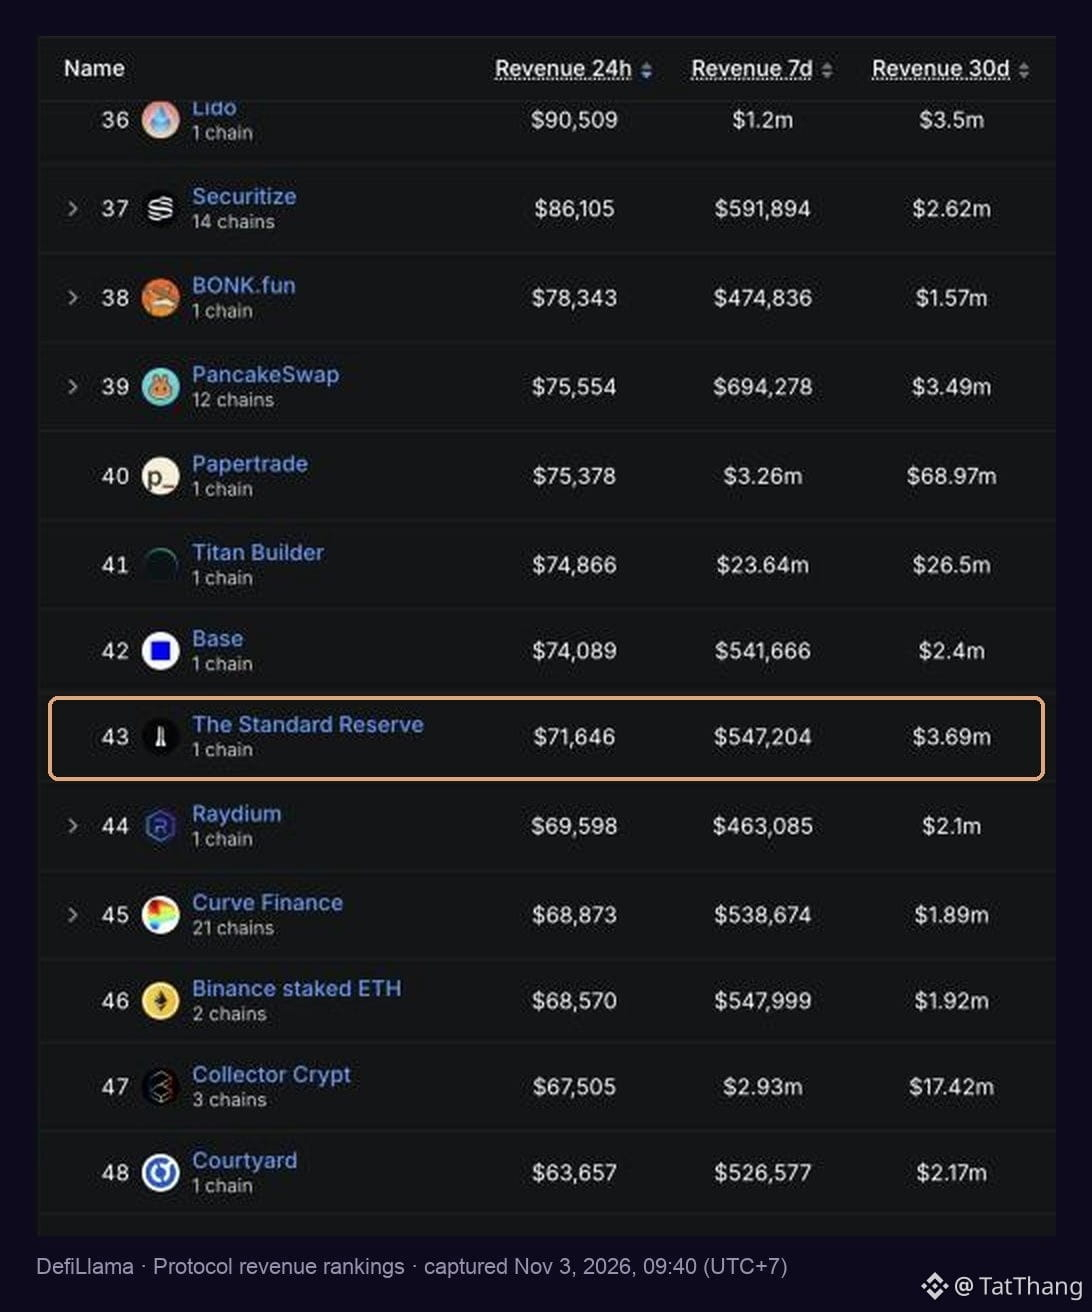
In the last 30 days, @standard_rsv made more revenue than Lido, PancakeSwap, and Curve.
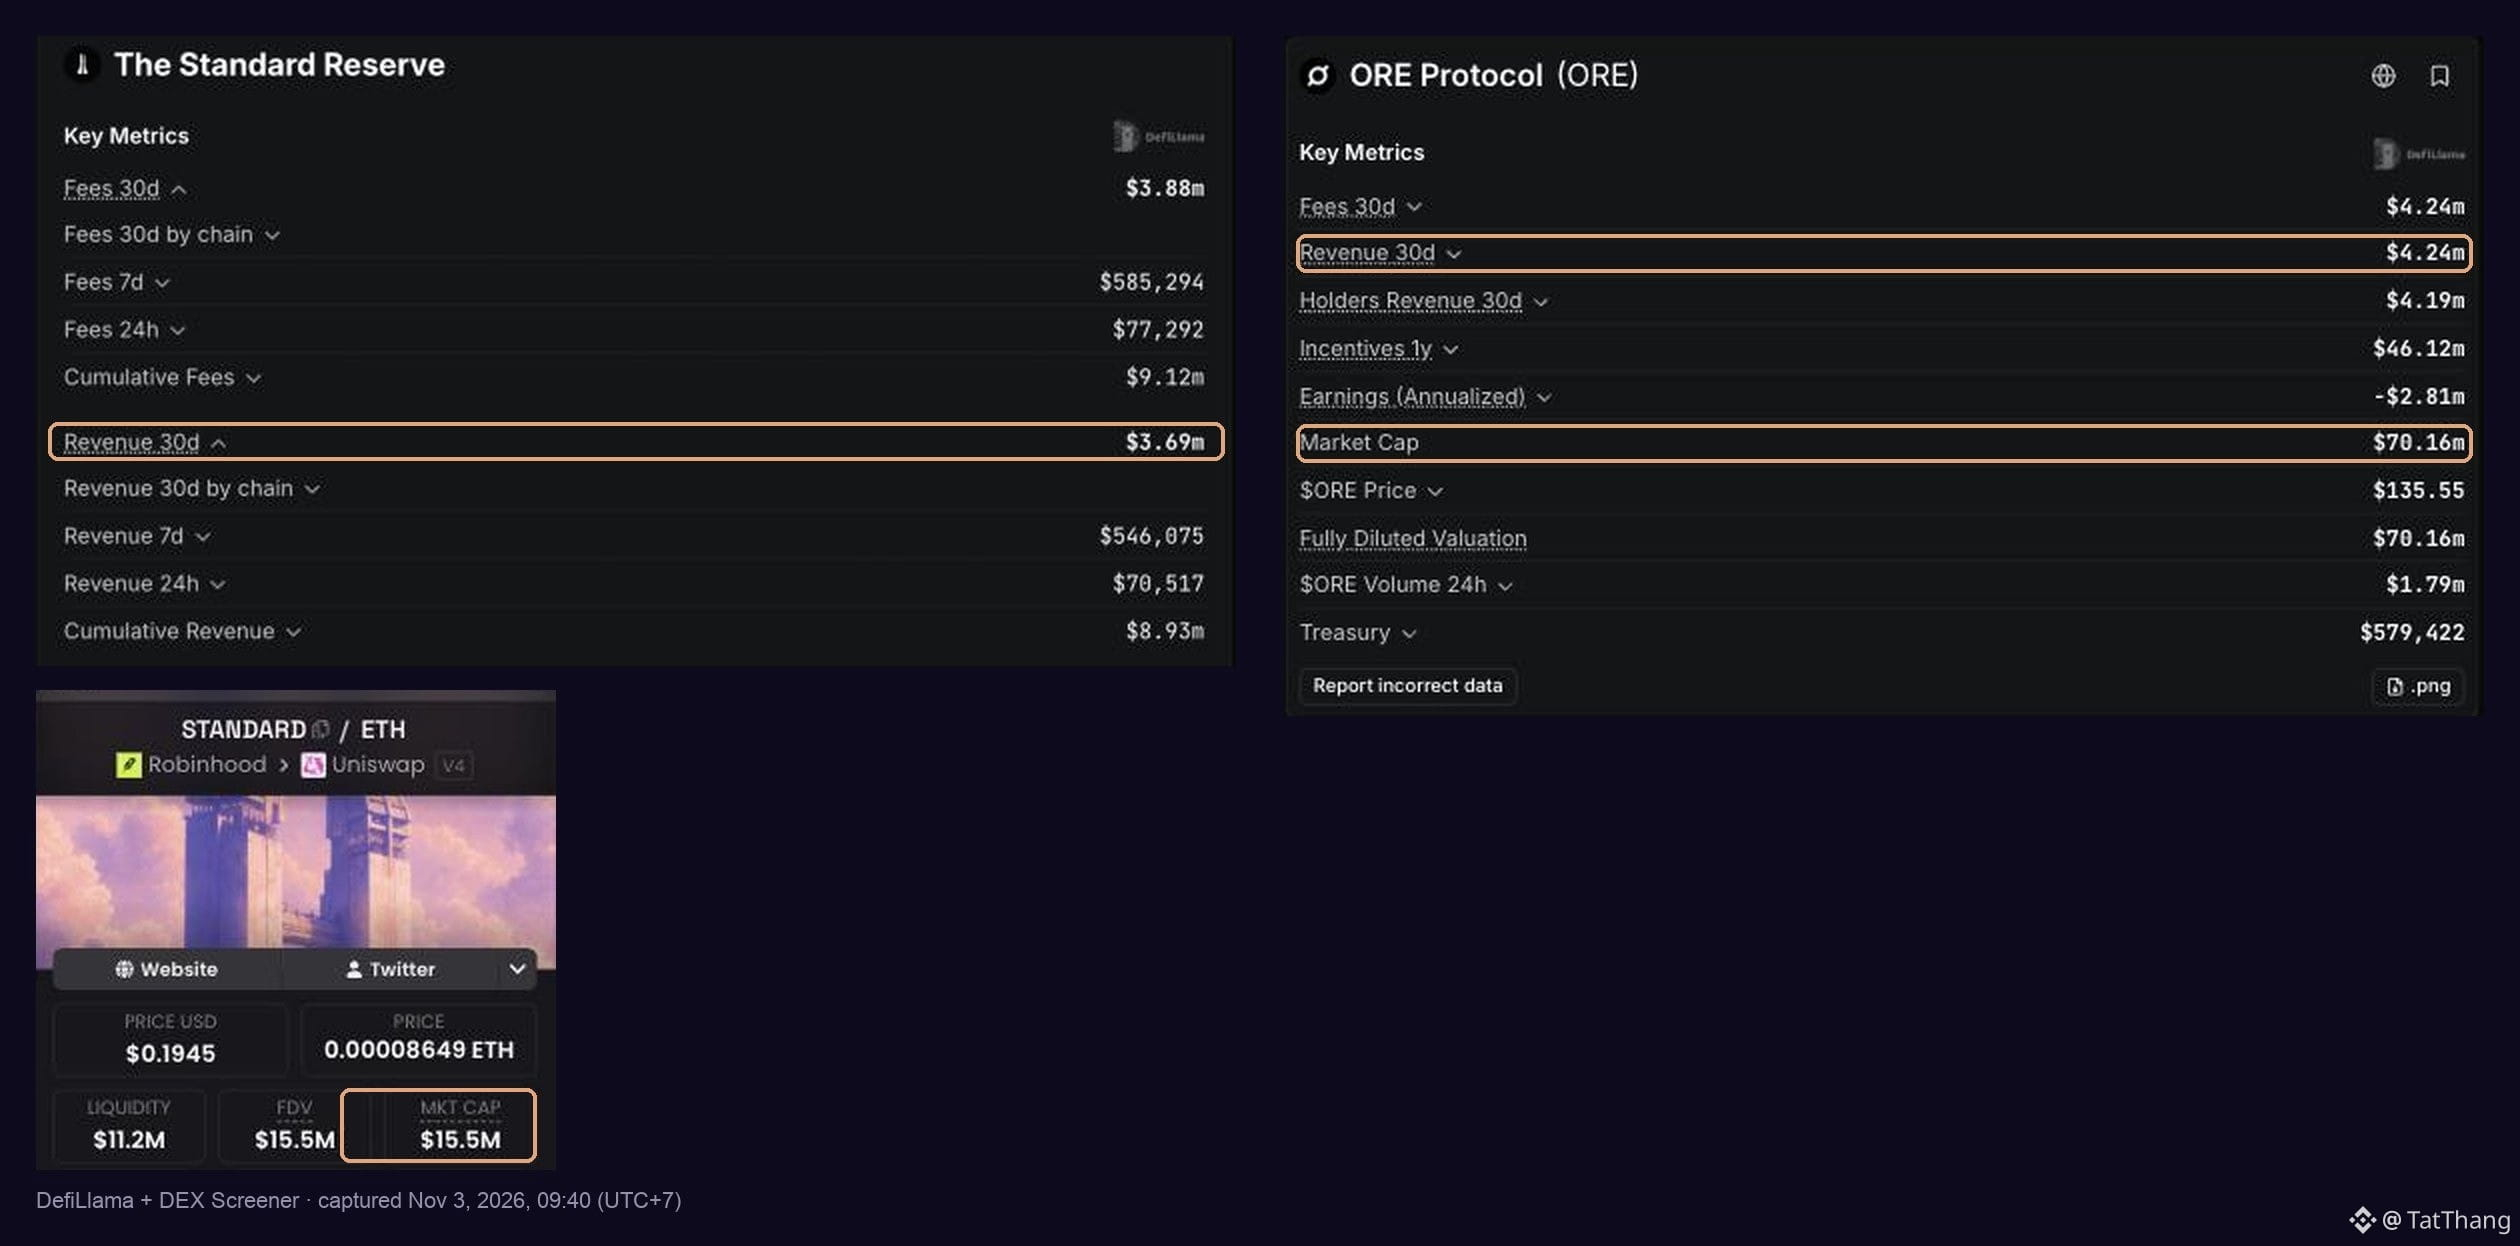
Its market cap is $15.55M.
That's DefiLlama's number: $3.69M in 30-day protocol revenue (#31 globally). ORE, the closest model on the list, made $4.38M in the same window and trades at a $70M market cap.
I maxed my bank at 10/10 branches this morning. Right now, I think this is the most underrated protocol on-chain:
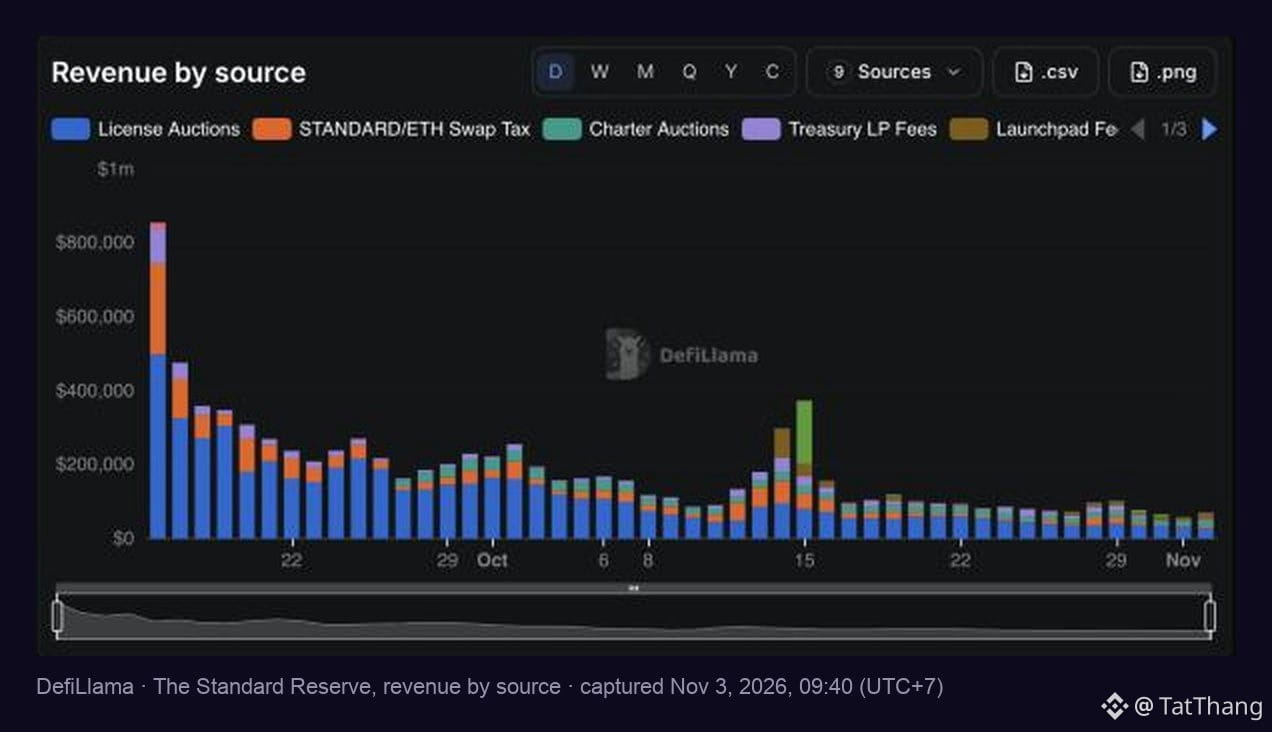
- #1 protocol on Robinhood Chain across 24h, 7d, and 30d revenue, with $8.49M all-time in ETH buybacks and auction burns
- $11.26M in main Uniswap v4 pool liquidity + $5.36M across reserve vaults in ETH, USDG, and tokenized stocks
- 30.3M $STANDARD permanently burned vs 20.2M ever issued. Supply dropped 20.1% from 100M to 79.88M, with 17.74M locked in S-Bills
Meanwhile @0xbeans got URC-5 merged into Uniswap, shipped Launchpad v2 and Uniswap v4 tokenized stock pools, and dropped the Isolated Exposure Tokens whitepaper.
Name another DeFi protocol at a $15.55M market cap putting up these numbers on-chain.
In the last 30 days, @standard_rsv made more revenue than Lido, PancakeSwap, and Curve.
Its market cap is $15.55M.
That's DefiLlama's number: $3.69M in 30-day protocol revenue (#31 globally). ORE, the closest model on the list, made $4.38M in the same window and trades at a $70M market cap.
I maxed my bank at 10/10 branches this morning. Right now, I think this is the most underrated protocol on-chain:
- #1 protocol on Robinhood Chain across 24h, 7d, and 30d revenue, with $8.49M all-time in ETH buybacks and auction burns
- $11.26M in main Uniswap v4 pool liquidity + $5.36M across reserve vaults in ETH, USDG, and tokenized stocks
- 30.3M $STANDARD permanently burned vs 20.2M ever issued. Supply dropped 20.1% from 100M to 79.88M, with 17.74M locked in S-Bills
Meanwhile @0xbeans got URC-5 merged into Uniswap, shipped Launchpad v2 and Uniswap v4 tokenized stock pools, and dropped the Isolated Exposure Tokens whitepaper.
Name another DeFi protocol at a $15.55M market cap putting up these numbers on-chain.
Its market cap is $15.55M.
That's DefiLlama's number: $3.69M in 30-day protocol revenue (#31 globally). ORE, the closest model on the list, made $4.38M in the same window and trades at a $70M market cap.
I maxed my bank at 10/10 branches this morning. Right now, I think this is the most underrated protocol on-chain:
- #1 protocol on Robinhood Chain across 24h, 7d, and 30d revenue, with $8.49M all-time in ETH buybacks and auction burns
- $11.26M in main Uniswap v4 pool liquidity + $5.36M across reserve vaults in ETH, USDG, and tokenized stocks
- 30.3M $STANDARD permanently burned vs 20.2M ever issued. Supply dropped 20.1% from 100M to 79.88M, with 17.74M locked in S-Bills
Meanwhile @0xbeans got URC-5 merged into Uniswap, shipped Launchpad v2 and Uniswap v4 tokenized stock pools, and dropped the Isolated Exposure Tokens whitepaper.
Name another DeFi protocol at a $15.55M market cap putting up these numbers on-chain.
98

·
--
📋 EXCHANGE NOTICES — Nov 02 · 06:00–12:00 KST (21:00–03:00 UTC)
Straight from Coinone & Bitget official notices. 🍳
📌 OTHER
• ZERO Trading Challenge #31: Trade ₩5,000 daily, earn 7-day USDT rewards — [Coinone]
• Warning: Virtual asset trade financing risks outlined — [Coinone]
• [Important] Bitget Announcement on Cash Dividend Settlement for SIMOUSDT Stock Perps — [Bitget]
#CookingBNB #Crypto #Bitcoin #BTC
📋 EXCHANGE NOTICES — Nov 02 · 06:00–12:00 KST (21:00–03:00 UTC)
Straight from Coinone & Bitget official notices. 🍳
📌 OTHER
• ZERO Trading Challenge #31: Trade ₩5,000 daily, earn 7-day USDT rewards — [Coinone]
• Warning: Virtual asset trade financing risks outlined — [Coinone]
• [Important] Bitget Announcement on Cash Dividend Settlement for SIMOUSDT Stock Perps — [Bitget]
#CookingBNB #Crypto #Bitcoin #BTC
Straight from Coinone & Bitget official notices. 🍳
📌 OTHER
• ZERO Trading Challenge #31: Trade ₩5,000 daily, earn 7-day USDT rewards — [Coinone]
• Warning: Virtual asset trade financing risks outlined — [Coinone]
• [Important] Bitget Announcement on Cash Dividend Settlement for SIMOUSDT Stock Perps — [Bitget]
#CookingBNB #Crypto #Bitcoin #BTC

SIMOUS+4.39%
8

·
--
$SOPH This move has been a bit too sharp—up 7 points in 15m, with volume expanding to 12 times its previous level. Looks like someone was in a hurry.
But looking closer, OI actually fell 0.07% over 15m, and was also negative over 1h at −0.56%. Price up, open interest down—this pattern is all too familiar: short covering, not fresh money coming in to build long positions. That 119K in notional change looks more like margin top-ups or position closures than a signal of aggressive buying.
The closing price broke above the upper end of the range from the last 20 5m candles. The taker buy-sell difference was 7.2%, so buyers have the upper hand for now, and the funding rate is also in the upper range of its recent levels. The problem is that this kind of setup usually doesn’t last. If OI doesn’t recover, the price will just move sideways after the rally, and anyone chasing the top could get stuck.
Ranked #15 for abnormal activity across the pool and #31 for notional change—not a top-tier event. But 24h trading volume is only 25.63M, liquidity is average, and slippage is something to watch out for.
I’ll keep an eye on it for now and wait for OI to turn positive. You can take a bite out of this short-squeeze bounce, but don’t treat it as a trend.
$SOPH This move has been a bit too sharp—up 7 points in 15m, with volume expanding to 12 times its previous level. Looks like someone was in a hurry.
But looking closer, OI actually fell 0.07% over 15m, and was also negative over 1h at −0.56%. Price up, open interest down—this pattern is all too familiar: short covering, not fresh money coming in to build long positions. That 119K in notional change looks more like margin top-ups or position closures than a signal of aggressive buying.
The closing price broke above the upper end of the range from the last 20 5m candles. The taker buy-sell difference was 7.2%, so buyers have the upper hand for now, and the funding rate is also in the upper range of its recent levels. The problem is that this kind of setup usually doesn’t last. If OI doesn’t recover, the price will just move sideways after the rally, and anyone chasing the top could get stuck.
Ranked #15 for abnormal activity across the pool and #31 for notional change—not a top-tier event. But 24h trading volume is only 25.63M, liquidity is average, and slippage is something to watch out for.
I’ll keep an eye on it for now and wait for OI to turn positive. You can take a bite out of this short-squeeze bounce, but don’t treat it as a trend.
But looking closer, OI actually fell 0.07% over 15m, and was also negative over 1h at −0.56%. Price up, open interest down—this pattern is all too familiar: short covering, not fresh money coming in to build long positions. That 119K in notional change looks more like margin top-ups or position closures than a signal of aggressive buying.
The closing price broke above the upper end of the range from the last 20 5m candles. The taker buy-sell difference was 7.2%, so buyers have the upper hand for now, and the funding rate is also in the upper range of its recent levels. The problem is that this kind of setup usually doesn’t last. If OI doesn’t recover, the price will just move sideways after the rally, and anyone chasing the top could get stuck.
Ranked #15 for abnormal activity across the pool and #31 for notional change—not a top-tier event. But 24h trading volume is only 25.63M, liquidity is average, and slippage is something to watch out for.
I’ll keep an eye on it for now and wait for OI to turn positive. You can take a bite out of this short-squeeze bounce, but don’t treat it as a trend.
7
·
--
$AERO had a pretty clean 15m push, with volume surging to 5.93x and a Z-score of 3.92. The close moved above the upper end of the past 20 5m candles. OI was modestly positive on both the 15m and 1h timeframes, with notional changes of 248K and 628K. Combined with a taker buy/sell ratio of 1.33 and a 14.1% volume delta, the signals lean bullish. The funding rate is also in a high recent percentile—this looks more like fresh leveraged longs driving the move than a short-covering spike. It ranks #14 for anomalies and #31 for notional change, with depth confirmation. 24h volume is only 16.98M, so the pool isn’t that large. Be mindful of this kind of sudden volume spike; you can chase the move, but don’t forget to use a stop-loss.
$AERO had a pretty clean 15m push, with volume surging to 5.93x and a Z-score of 3.92. The close moved above the upper end of the past 20 5m candles. OI was modestly positive on both the 15m and 1h timeframes, with notional changes of 248K and 628K. Combined with a taker buy/sell ratio of 1.33 and a 14.1% volume delta, the signals lean bullish. The funding rate is also in a high recent percentile—this looks more like fresh leveraged longs driving the move than a short-covering spike. It ranks #14 for anomalies and #31 for notional change, with depth confirmation. 24h volume is only 16.98M, so the pool isn’t that large. Be mindful of this kind of sudden volume spike; you can chase the move, but don’t forget to use a stop-loss.
1

·
--
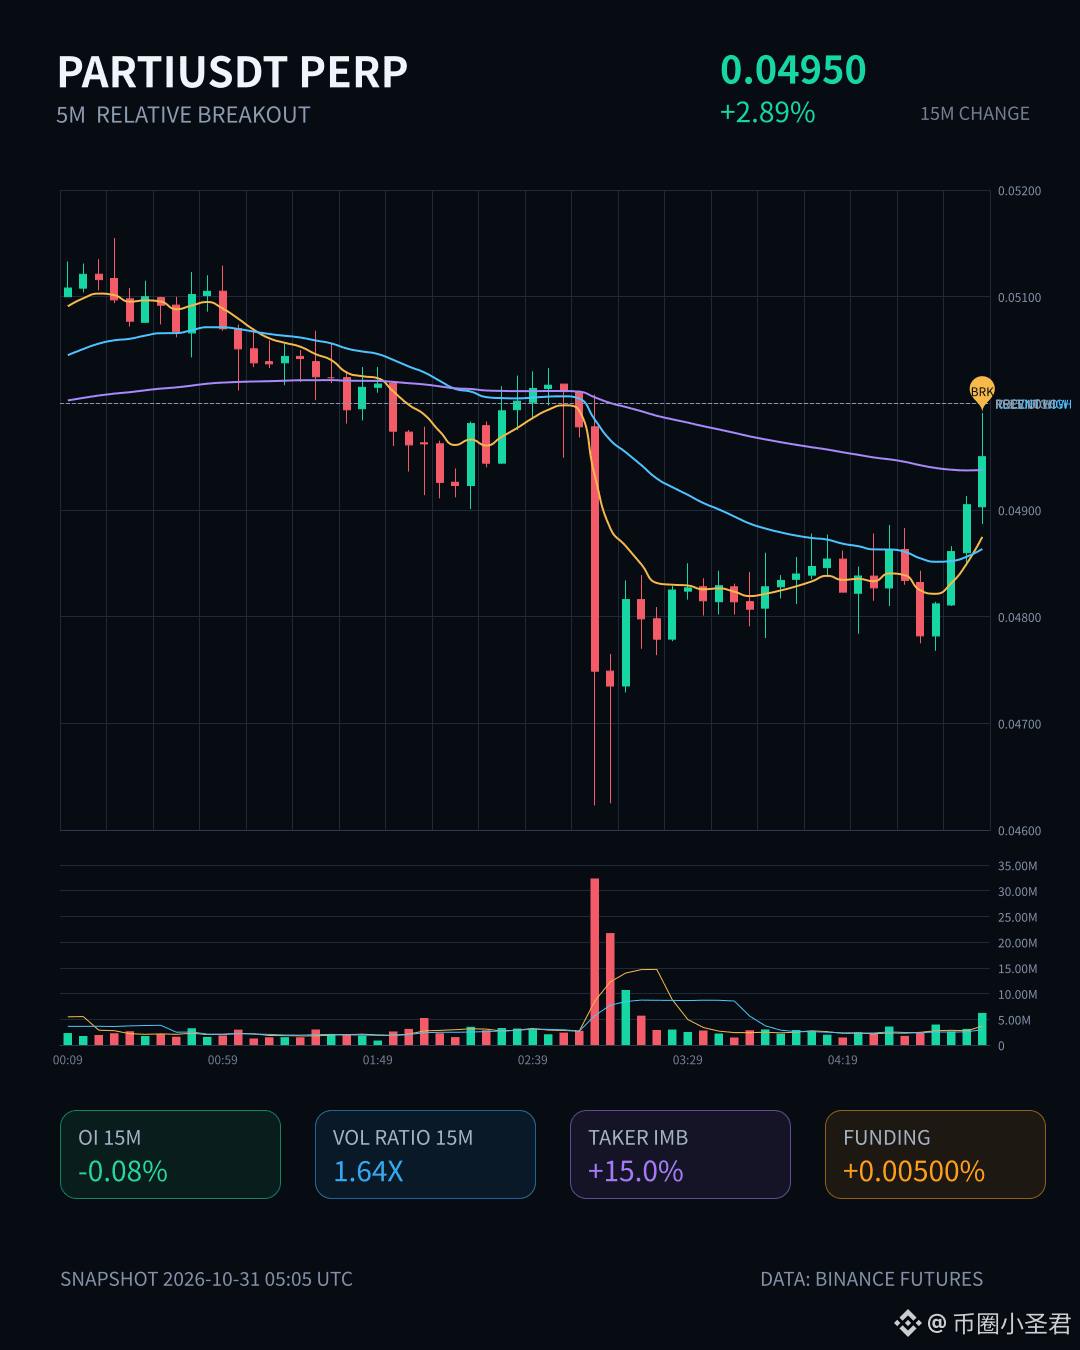
$PARTI is up 2.89% over 15m, with volume at 1.64x and an aggressive buy/sell ratio of 1.35. Price has also pushed above the upper end of the last 20 5m candles—it looks pretty lively.
But OI is falling: -0.08% over 15m and -1.31% over 1h. Price up, open interest down—this looks more like a rally driven by short covering and position closing than fresh longs stepping in to keep it going. It ranks #36 for anomalies across the whole pool and #31 for notional change, suggesting some money is moving, but not enough for a full-on rush in.
I generally wouldn’t chase a market like this too much. The breakout is real, but the driver is shaky. I’d wait for OI to stabilize and see if there’s a second leg; otherwise, it’s easy to buy at the tail end of a short-covering rally.
$PARTI is up 2.89% over 15m, with volume at 1.64x and an aggressive buy/sell ratio of 1.35. Price has also pushed above the upper end of the last 20 5m candles—it looks pretty lively.
But OI is falling: -0.08% over 15m and -1.31% over 1h. Price up, open interest down—this looks more like a rally driven by short covering and position closing than fresh longs stepping in to keep it going. It ranks #36 for anomalies across the whole pool and #31 for notional change, suggesting some money is moving, but not enough for a full-on rush in.
I generally wouldn’t chase a market like this too much. The breakout is real, but the driver is shaky. I’d wait for OI to stabilize and see if there’s a second leg; otherwise, it’s easy to buy at the tail end of a short-covering rally.
But OI is falling: -0.08% over 15m and -1.31% over 1h. Price up, open interest down—this looks more like a rally driven by short covering and position closing than fresh longs stepping in to keep it going. It ranks #36 for anomalies across the whole pool and #31 for notional change, suggesting some money is moving, but not enough for a full-on rush in.
I generally wouldn’t chase a market like this too much. The breakout is real, but the driver is shaky. I’d wait for OI to stabilize and see if there’s a second leg; otherwise, it’s easy to buy at the tail end of a short-covering rally.
6
·
--
$1000PEPE rallied 3.5% over 15m, with volume at 2.92x, breaking above the range formed by the last 20 5m candles. OI rose 0.42% over 15m, with a 1h notional change of +4.21%. Price and OI are both rising, suggesting new leveraged longs are entering. The taker buy/sell ratio is 1.34, taker volume delta is +14.5%, and it ranks #31 among pool-wide anomalies. 24h trading volume is 1.4 billion USDT, with decent market depth. Watch for support on a pullback after the spike.
$1000PEPE rallied 3.5% over 15m, with volume at 2.92x, breaking above the range formed by the last 20 5m candles. OI rose 0.42% over 15m, with a 1h notional change of +4.21%. Price and OI are both rising, suggesting new leveraged longs are entering. The taker buy/sell ratio is 1.34, taker volume delta is +14.5%, and it ranks #31 among pool-wide anomalies. 24h trading volume is 1.4 billion USDT, with decent market depth. Watch for support on a pullback after the spike.
1
·
--
$STRK This drop is interesting: price fell 1.39%, volume expanded to 2.06x, but OI declined instead of rising—the 15m contracts dipped slightly, while 1h notional fell by over 500K.
This doesn't look like new shorts entering and driving the price down; it looks more like bulls couldn't hold on and deleveraged. The buy/sell ratio is 0.38, and the taker volume delta is -45%, with clear selling pressure. Price has also broken below the lower bound of the most recent 20 5m candles, so the short-term structure has deteriorated.
The OI anomaly percentile is 91.3%, ranking #31 across the entire pool, which means this signal stands out. With OI shrinking as price falls, first see whether it can stabilize lower down—don't rush to buy the dip.
$STRK This drop is interesting: price fell 1.39%, volume expanded to 2.06x, but OI declined instead of rising—the 15m contracts dipped slightly, while 1h notional fell by over 500K.
This doesn't look like new shorts entering and driving the price down; it looks more like bulls couldn't hold on and deleveraged. The buy/sell ratio is 0.38, and the taker volume delta is -45%, with clear selling pressure. Price has also broken below the lower bound of the most recent 20 5m candles, so the short-term structure has deteriorated.
The OI anomaly percentile is 91.3%, ranking #31 across the entire pool, which means this signal stands out. With OI shrinking as price falls, first see whether it can stabilize lower down—don't rush to buy the dip.
This doesn't look like new shorts entering and driving the price down; it looks more like bulls couldn't hold on and deleveraged. The buy/sell ratio is 0.38, and the taker volume delta is -45%, with clear selling pressure. Price has also broken below the lower bound of the most recent 20 5m candles, so the short-term structure has deteriorated.
The OI anomaly percentile is 91.3%, ranking #31 across the entire pool, which means this signal stands out. With OI shrinking as price falls, first see whether it can stabilize lower down—don't rush to buy the dip.
3

·
--
$DOS surged 5% in 15m, with volume hitting 3.18x and a Z-score of 3.96. This doesn’t look like a random little spike.
OI edged up 0.35% over 15m but is still negative over 1h. Notional changes are rising across the board, and with both price and OI moving up, it looks more like fresh leveraged longs are driving the move than a purely spot-led rally. The close also broke above the highs of the last 20 5m candles. Aggressive trade delta was 5.3%, and the buy/sell ratio was 1.11—there’s real short-term buying pressure.
The anomaly percentile is 84.7%, ranking #31 across the pool, while notional change ranks #35. It’s not among the most explosive movers, but combined with the volume and range breakout, this level is worth watching. 24h trading volume is 78M, with adequate market depth.
Don’t get carried away: 1h OI is still declining. Before chasing the move, see whether price can hold above the breakout level.
$DOS surged 5% in 15m, with volume hitting 3.18x and a Z-score of 3.96. This doesn’t look like a random little spike.
OI edged up 0.35% over 15m but is still negative over 1h. Notional changes are rising across the board, and with both price and OI moving up, it looks more like fresh leveraged longs are driving the move than a purely spot-led rally. The close also broke above the highs of the last 20 5m candles. Aggressive trade delta was 5.3%, and the buy/sell ratio was 1.11—there’s real short-term buying pressure.
The anomaly percentile is 84.7%, ranking #31 across the pool, while notional change ranks #35. It’s not among the most explosive movers, but combined with the volume and range breakout, this level is worth watching. 24h trading volume is 78M, with adequate market depth.
Don’t get carried away: 1h OI is still declining. Before chasing the move, see whether price can hold above the breakout level.
OI edged up 0.35% over 15m but is still negative over 1h. Notional changes are rising across the board, and with both price and OI moving up, it looks more like fresh leveraged longs are driving the move than a purely spot-led rally. The close also broke above the highs of the last 20 5m candles. Aggressive trade delta was 5.3%, and the buy/sell ratio was 1.11—there’s real short-term buying pressure.
The anomaly percentile is 84.7%, ranking #31 across the pool, while notional change ranks #35. It’s not among the most explosive movers, but combined with the volume and range breakout, this level is worth watching. 24h trading volume is 78M, with adequate market depth.
Don’t get carried away: 1h OI is still declining. Before chasing the move, see whether price can hold above the breakout level.
44
·
--
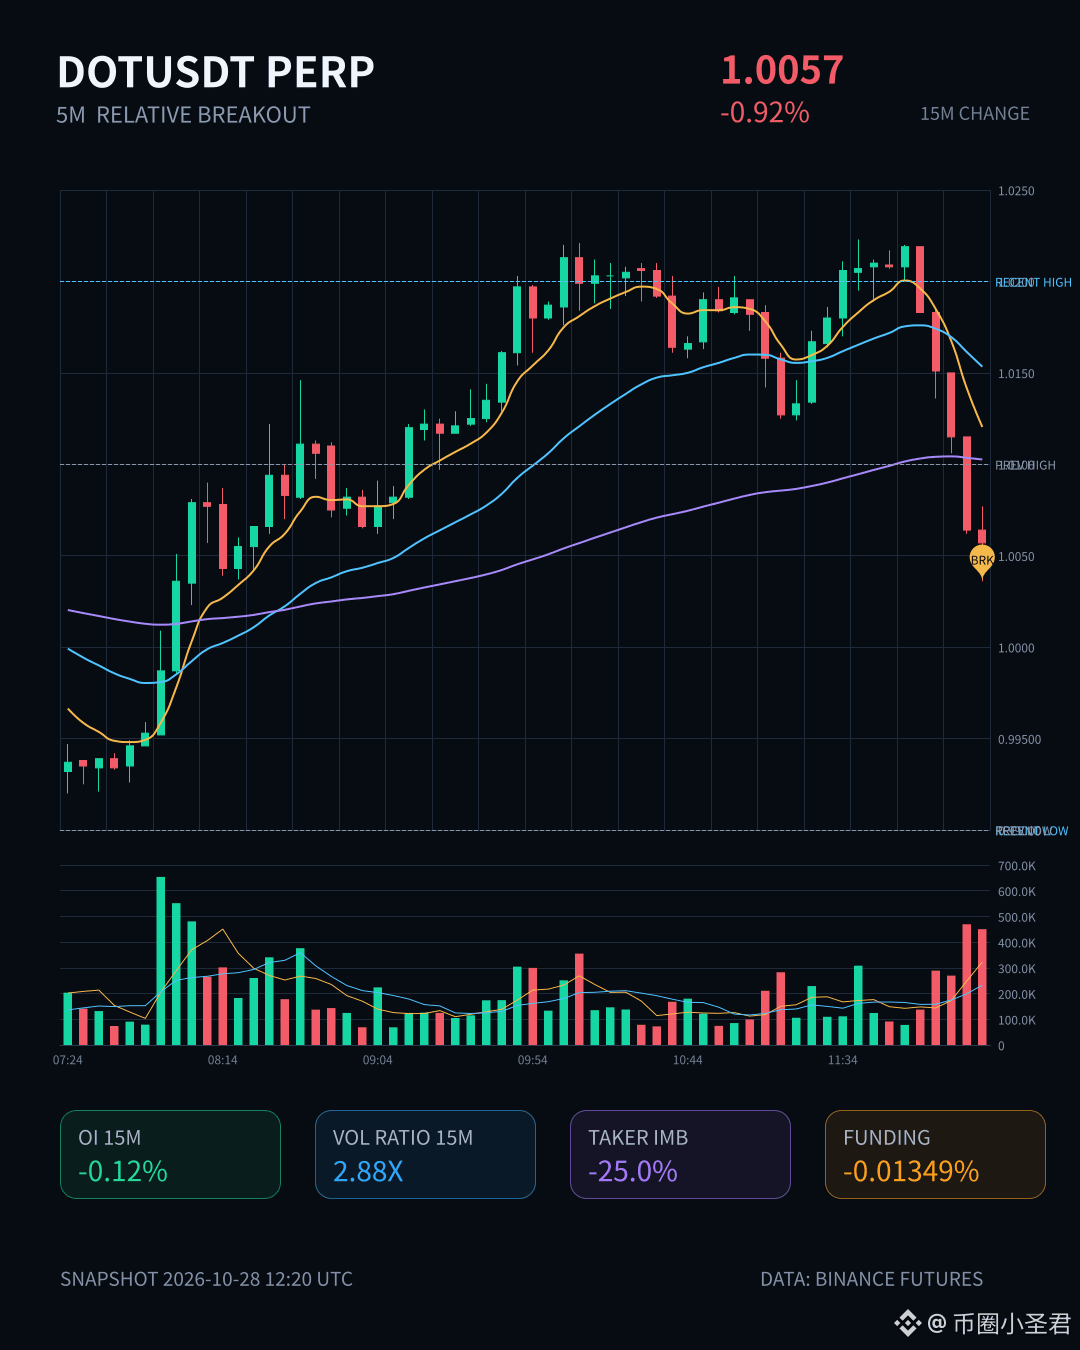
$DOT This drop looks a bit suspicious. In 15m, volume surged to 2.88x as the price broke below the lows of nearly 20 recent 5m candles. Aggressive trade flow was -25%, and the buy/sell ratio was 0.60, with sellers clearly in control.
But the key point is that OI is also falling at the same time: 15m contracts are down 0.12%, notional is down 463K, and the 1h figures are shrinking too. This doesn't look like fresh shorts entering; it's more likely longs deleveraging and stop-losses getting triggered. The OI anomaly percentile has already hit 99.8%, ranking #31 across the entire pool, and this has continued for several consecutive periods.
With this setup, I wouldn't feel comfortable chasing shorts. It looks more like a shakeout than the start of a trend. Wait for volume to subside, then see if there's a chance for a bounce. Don't try to catch a falling knife while leveraged positions are being flushed out.
$DOT This drop looks a bit suspicious. In 15m, volume surged to 2.88x as the price broke below the lows of nearly 20 recent 5m candles. Aggressive trade flow was -25%, and the buy/sell ratio was 0.60, with sellers clearly in control.
But the key point is that OI is also falling at the same time: 15m contracts are down 0.12%, notional is down 463K, and the 1h figures are shrinking too. This doesn't look like fresh shorts entering; it's more likely longs deleveraging and stop-losses getting triggered. The OI anomaly percentile has already hit 99.8%, ranking #31 across the entire pool, and this has continued for several consecutive periods.
With this setup, I wouldn't feel comfortable chasing shorts. It looks more like a shakeout than the start of a trend. Wait for volume to subside, then see if there's a chance for a bounce. Don't try to catch a falling knife while leveraged positions are being flushed out.
But the key point is that OI is also falling at the same time: 15m contracts are down 0.12%, notional is down 463K, and the 1h figures are shrinking too. This doesn't look like fresh shorts entering; it's more likely longs deleveraging and stop-losses getting triggered. The OI anomaly percentile has already hit 99.8%, ranking #31 across the entire pool, and this has continued for several consecutive periods.
With this setup, I wouldn't feel comfortable chasing shorts. It looks more like a shakeout than the start of a trend. Wait for volume to subside, then see if there's a chance for a bounce. Don't try to catch a falling knife while leveraged positions are being flushed out.
1
·
--
$ZRO This 15m move looks a bit off. Price dropped 0.67%, volume surged to 3.36x, and the close fell below the lows of nearly 20 previous 5m candles—but OI didn’t blow up along with it. Both 15m and 1h OI edged down, with the notional change only in the hundreds of thousands of U. Price down + OI down looks more like longs deleveraging or exiting via stop-losses, rather than new shorts piling in to push the price down.
What’s interesting is that the aggressive trade imbalance was 22.2%, the buy/sell ratio was 1.57, and the funding rate is still in the upper end of its recent range. Funding is relatively expensive, and aggressive buying is dominant, yet price broke down first—this setup is pretty contradictory. The anomaly ranks #31 across the whole pool, and the notional change ranks #19. Not the most conspicuous, but there’s enough confirmation from depth.
24h trading volume is 29.52M, so liquidity isn’t particularly deep. Chasing shorts at this level could easily get you schooled by a rebound. I’ll keep watching and wait until this round of leverage has been flushed out.
$ZRO This 15m move looks a bit off. Price dropped 0.67%, volume surged to 3.36x, and the close fell below the lows of nearly 20 previous 5m candles—but OI didn’t blow up along with it. Both 15m and 1h OI edged down, with the notional change only in the hundreds of thousands of U. Price down + OI down looks more like longs deleveraging or exiting via stop-losses, rather than new shorts piling in to push the price down.
What’s interesting is that the aggressive trade imbalance was 22.2%, the buy/sell ratio was 1.57, and the funding rate is still in the upper end of its recent range. Funding is relatively expensive, and aggressive buying is dominant, yet price broke down first—this setup is pretty contradictory. The anomaly ranks #31 across the whole pool, and the notional change ranks #19. Not the most conspicuous, but there’s enough confirmation from depth.
24h trading volume is 29.52M, so liquidity isn’t particularly deep. Chasing shorts at this level could easily get you schooled by a rebound. I’ll keep watching and wait until this round of leverage has been flushed out.
What’s interesting is that the aggressive trade imbalance was 22.2%, the buy/sell ratio was 1.57, and the funding rate is still in the upper end of its recent range. Funding is relatively expensive, and aggressive buying is dominant, yet price broke down first—this setup is pretty contradictory. The anomaly ranks #31 across the whole pool, and the notional change ranks #19. Not the most conspicuous, but there’s enough confirmation from depth.
24h trading volume is 29.52M, so liquidity isn’t particularly deep. Chasing shorts at this level could easily get you schooled by a rebound. I’ll keep watching and wait until this round of leverage has been flushed out.
1
·
--
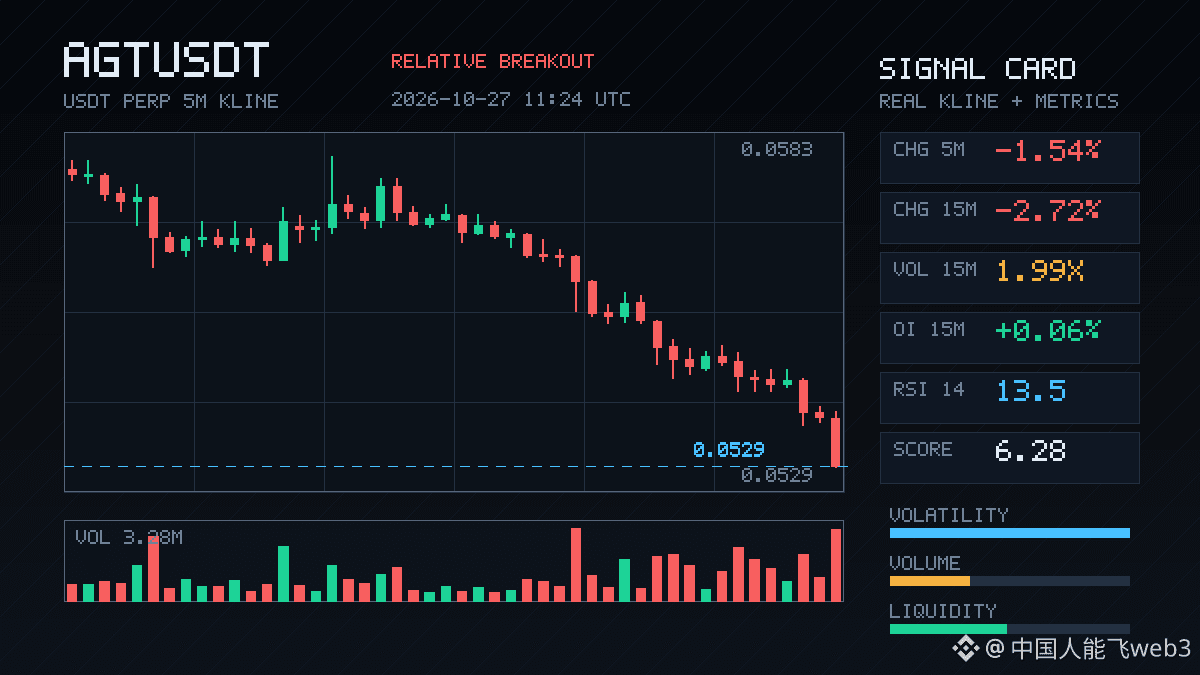
$AGT had a decisive 15-minute drop, falling 2.72% and breaking below the low of the past 20 five-minute candles. Volume nearly doubled, and volatility Z jumped to 4—this wasn’t a low-volume grind down; there was real buying and selling pressure driving it. Net aggressive volume was -16.3%, and the buy/sell ratio was 0.72, pointing to clear selling pressure.
Interestingly, OI rose rather than fell, with 1h futures up 0.41%. Price moving down while open interest increases looks more like new shorts entering and building leverage than longs capitulating and exiting. The notional change was negative (-648K USDT), suggesting the additional short leverage wasn’t especially large, but the direction was clear.
24h trading volume was 28.84M, putting it near the top for activity in the pool. Notional change ranked #31 across the pool and #84 among anomalies, so it’s a signal that made the cut. After breaking below the range, the short-term question is whether shorts keep adding positions or take profits. If OI starts to contract, this setup could easily see a rebound. Keep an eye on $AGT .
$AGT had a decisive 15-minute drop, falling 2.72% and breaking below the low of the past 20 five-minute candles. Volume nearly doubled, and volatility Z jumped to 4—this wasn’t a low-volume grind down; there was real buying and selling pressure driving it. Net aggressive volume was -16.3%, and the buy/sell ratio was 0.72, pointing to clear selling pressure.
Interestingly, OI rose rather than fell, with 1h futures up 0.41%. Price moving down while open interest increases looks more like new shorts entering and building leverage than longs capitulating and exiting. The notional change was negative (-648K USDT), suggesting the additional short leverage wasn’t especially large, but the direction was clear.
24h trading volume was 28.84M, putting it near the top for activity in the pool. Notional change ranked #31 across the pool and #84 among anomalies, so it’s a signal that made the cut. After breaking below the range, the short-term question is whether shorts keep adding positions or take profits. If OI starts to contract, this setup could easily see a rebound. Keep an eye on $AGT .
Interestingly, OI rose rather than fell, with 1h futures up 0.41%. Price moving down while open interest increases looks more like new shorts entering and building leverage than longs capitulating and exiting. The notional change was negative (-648K USDT), suggesting the additional short leverage wasn’t especially large, but the direction was clear.
24h trading volume was 28.84M, putting it near the top for activity in the pool. Notional change ranked #31 across the pool and #84 among anomalies, so it’s a signal that made the cut. After breaking below the range, the short-term question is whether shorts keep adding positions or take profits. If OI starts to contract, this setup could easily see a rebound. Keep an eye on $AGT .
·
--
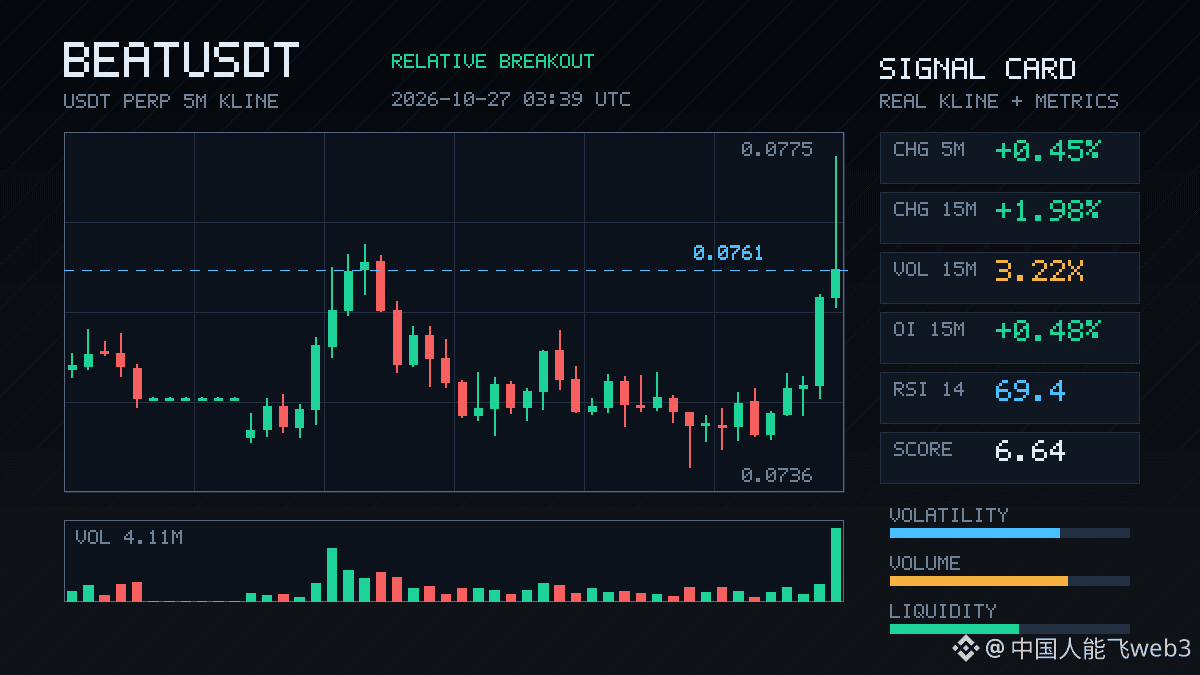
$BEAT This 15m move is getting interesting: volume surged to 3.22x its usual level, and OI is rising too—up 0.48% on both the 1h and 15m timeframes, suggesting a strong influx of new leveraged longs.
Price broke above the highs of nearly 20 recent 5m candles. The taker buy/sell imbalance is 18.1%, and the buy/sell ratio is 1.44, showing a clear buying bias. OI is at the 92.9th percentile, ranking #31 across the entire pool—not the most extreme, but still elevated.
24h trading volume is 39.86M, with adequate market depth. This structure looks more like a move driven by new capital than a short squeeze. First, watch whether price can hold above the range; if it can’t, this is a false breakout.
$BEAT This 15m move is getting interesting: volume surged to 3.22x its usual level, and OI is rising too—up 0.48% on both the 1h and 15m timeframes, suggesting a strong influx of new leveraged longs.
Price broke above the highs of nearly 20 recent 5m candles. The taker buy/sell imbalance is 18.1%, and the buy/sell ratio is 1.44, showing a clear buying bias. OI is at the 92.9th percentile, ranking #31 across the entire pool—not the most extreme, but still elevated.
24h trading volume is 39.86M, with adequate market depth. This structure looks more like a move driven by new capital than a short squeeze. First, watch whether price can hold above the range; if it can’t, this is a false breakout.
Price broke above the highs of nearly 20 recent 5m candles. The taker buy/sell imbalance is 18.1%, and the buy/sell ratio is 1.44, showing a clear buying bias. OI is at the 92.9th percentile, ranking #31 across the entire pool—not the most extreme, but still elevated.
24h trading volume is 39.86M, with adequate market depth. This structure looks more like a move driven by new capital than a short squeeze. First, watch whether price can hold above the range; if it can’t, this is a false breakout.
·
--
$BEAMX took a pretty hard hit in this move: it plunged 1.68% in 15m, with volume reaching 2.6 times normal and volatility Z hitting 3.68. Price fell below the lower bound of the last 20 5m candles, aggressive trade imbalance was -39.9%, and the buy/sell ratio was 0.43, showing clearly one-sided selling pressure.
The key point is open interest: 15m futures OI was down 0.03%, while 1h OI was actually up 0.10%, with notional changes of -238K / -361K USDT. The OI anomaly percentile was 93.3%, ranking #14 across the pool, while notional change ranked #31. This combination is interesting: price down + OI down looks more like longs deleveraging and getting stopped out than a major influx of new shorts. Funding rates are still in a high percentile relative to recent levels, suggesting longs had been crowded before and are now being forced to scale back.
The move has continued across multiple timeframes, and order-book depth confirms it; volume is above normal. 24h turnover is 19.51M USDT, which isn’t that high, so if deleveraging turns into a cascade at these levels, slippage could widen. Keep an eye on it for now—don’t rush to buy the dip.
$BEAMX took a pretty hard hit in this move: it plunged 1.68% in 15m, with volume reaching 2.6 times normal and volatility Z hitting 3.68. Price fell below the lower bound of the last 20 5m candles, aggressive trade imbalance was -39.9%, and the buy/sell ratio was 0.43, showing clearly one-sided selling pressure.
The key point is open interest: 15m futures OI was down 0.03%, while 1h OI was actually up 0.10%, with notional changes of -238K / -361K USDT. The OI anomaly percentile was 93.3%, ranking #14 across the pool, while notional change ranked #31. This combination is interesting: price down + OI down looks more like longs deleveraging and getting stopped out than a major influx of new shorts. Funding rates are still in a high percentile relative to recent levels, suggesting longs had been crowded before and are now being forced to scale back.
The move has continued across multiple timeframes, and order-book depth confirms it; volume is above normal. 24h turnover is 19.51M USDT, which isn’t that high, so if deleveraging turns into a cascade at these levels, slippage could widen. Keep an eye on it for now—don’t rush to buy the dip.
The key point is open interest: 15m futures OI was down 0.03%, while 1h OI was actually up 0.10%, with notional changes of -238K / -361K USDT. The OI anomaly percentile was 93.3%, ranking #14 across the pool, while notional change ranked #31. This combination is interesting: price down + OI down looks more like longs deleveraging and getting stopped out than a major influx of new shorts. Funding rates are still in a high percentile relative to recent levels, suggesting longs had been crowded before and are now being forced to scale back.
The move has continued across multiple timeframes, and order-book depth confirms it; volume is above normal. 24h turnover is 19.51M USDT, which isn’t that high, so if deleveraging turns into a cascade at these levels, slippage could widen. Keep an eye on it for now—don’t rush to buy the dip.
6
·
--
$AKE looks interesting here: 15m volume surged to 3.16x, while the price rose by less than 1 point. OI moved higher as well, with a +0.93% change in notional value. This looks more like new longs entering with leverage than shorts covering. The closing price just broke above the high of the last 20 5m candles, and the taker buy/sell ratio is 1.32, showing a clear tilt toward buyers.
Its anomaly percentile across the full pool is 81.5%, ranking #17, and its notional change ranks #31. It’s not among the most extreme cases, but there’s enough confirmation from market depth: volume is above normal and the price has reached the edge of the range. OI is still seeing a slight outflow on the 1h timeframe, suggesting most of the leverage entered over the short term. Watch whether the price can hold here—don’t let it turn into another quick spike and fade.
$AKE looks interesting here: 15m volume surged to 3.16x, while the price rose by less than 1 point. OI moved higher as well, with a +0.93% change in notional value. This looks more like new longs entering with leverage than shorts covering. The closing price just broke above the high of the last 20 5m candles, and the taker buy/sell ratio is 1.32, showing a clear tilt toward buyers.
Its anomaly percentile across the full pool is 81.5%, ranking #17, and its notional change ranks #31. It’s not among the most extreme cases, but there’s enough confirmation from market depth: volume is above normal and the price has reached the edge of the range. OI is still seeing a slight outflow on the 1h timeframe, suggesting most of the leverage entered over the short term. Watch whether the price can hold here—don’t let it turn into another quick spike and fade.
Its anomaly percentile across the full pool is 81.5%, ranking #17, and its notional change ranks #31. It’s not among the most extreme cases, but there’s enough confirmation from market depth: volume is above normal and the price has reached the edge of the range. OI is still seeing a slight outflow on the 1h timeframe, suggesting most of the leverage entered over the short term. Watch whether the price can hold here—don’t let it turn into another quick spike and fade.
27
·
--
$LIGHT This 15m move has ripped pretty hard: +5.54% on 5.31x volume, with the Z-score hitting 4.04—not the kind of low-volume fake breakout you often see. The key is that OI is rising in sync: +2.38% over 15m and +2.11% over 1h. The notional change is also near the top of the pack, making this look more like fresh leveraged longs entering than shorts covering. Aggressive trade delta is 16.8%, and the buy/sell ratio is 1.40, so the directional bias is pretty clear. Price has just closed above the top of the recent 20-bar 5m range, near a historical extreme. OI’s anomaly percentile is 95.6%, ranking #31 across the whole pool. I generally wouldn’t rush to chase the first candle in a setup like this—I’d wait for a pullback and confirmation—but it’s definitely worth keeping a close eye on.
$LIGHT This 15m move has ripped pretty hard: +5.54% on 5.31x volume, with the Z-score hitting 4.04—not the kind of low-volume fake breakout you often see. The key is that OI is rising in sync: +2.38% over 15m and +2.11% over 1h. The notional change is also near the top of the pack, making this look more like fresh leveraged longs entering than shorts covering. Aggressive trade delta is 16.8%, and the buy/sell ratio is 1.40, so the directional bias is pretty clear. Price has just closed above the top of the recent 20-bar 5m range, near a historical extreme. OI’s anomaly percentile is 95.6%, ranking #31 across the whole pool. I generally wouldn’t rush to chase the first candle in a setup like this—I’d wait for a pullback and confirmation—but it’s definitely worth keeping a close eye on.
1
·
--
$SIREN has something going on. 15m volume surged to 2.25x, and the price broke above the highs of the last 20 5m candles. OI is up on both the 15m and 1h timeframes—0.37% and 0.59%. The increase in notional value isn’t huge, but it’s been sustained for several consecutive periods, which looks more like new leveraged longs entering than a rally driven by short covering.
The taker buy-sell imbalance is 1.5%, and the buy/sell ratio is 1.03—bullish, but not enough to signal an imbalance. It ranks #9 across the pool for anomalies and #31 for notional change. 24h trading volume is only a little over 10M, so liquidity is still thin. At this level, if buyers pile in, the price can move fast; but a sell-off could be just as sharp.
First, watch whether it can hold above the top of this range. If it can’t, this is a false breakout.
$SIREN has something going on. 15m volume surged to 2.25x, and the price broke above the highs of the last 20 5m candles. OI is up on both the 15m and 1h timeframes—0.37% and 0.59%. The increase in notional value isn’t huge, but it’s been sustained for several consecutive periods, which looks more like new leveraged longs entering than a rally driven by short covering.
The taker buy-sell imbalance is 1.5%, and the buy/sell ratio is 1.03—bullish, but not enough to signal an imbalance. It ranks #9 across the pool for anomalies and #31 for notional change. 24h trading volume is only a little over 10M, so liquidity is still thin. At this level, if buyers pile in, the price can move fast; but a sell-off could be just as sharp.
First, watch whether it can hold above the top of this range. If it can’t, this is a false breakout.
The taker buy-sell imbalance is 1.5%, and the buy/sell ratio is 1.03—bullish, but not enough to signal an imbalance. It ranks #9 across the pool for anomalies and #31 for notional change. 24h trading volume is only a little over 10M, so liquidity is still thin. At this level, if buyers pile in, the price can move fast; but a sell-off could be just as sharp.
First, watch whether it can hold above the top of this range. If it can’t, this is a false breakout.
·
--
$JCT This sell-off looks cleaner than it appears on the surface—price fell 1.83%, but OI contracted 4.19% in an hour, shedding 914K in notional. That’s longs de-leveraging on their own, not shorts aggressively dumping.
Aggressive trade delta was -12%, the buy/sell ratio was 0.79, and selling pressure was dominant. The 5m close also broke below the lower end of the previous 20-candle range. Volume came in at 1.87x alongside the breakdown, suggesting there was real activity at this level.
What stands out is that the anomaly percentile was only 37.9%. The notional change ranked #31 across the whole pool, while the anomaly percentile ranked #101—meaning the size of the move has picked up, but crowding isn’t extreme yet. 24h trading volume of 172M is supportive, and liquidity looks fine for now.
My take: this looks more like a boundary test during a long de-leveraging process than a trend-driven collapse. But after breaking below the range, don’t rush to buy the dip. Watch whether OI keeps contracting. If it stabilizes and price moves back inside the range, that would be a meaningful signal. Chasing shorts here offers only average risk-reward.
$JCT This sell-off looks cleaner than it appears on the surface—price fell 1.83%, but OI contracted 4.19% in an hour, shedding 914K in notional. That’s longs de-leveraging on their own, not shorts aggressively dumping.
Aggressive trade delta was -12%, the buy/sell ratio was 0.79, and selling pressure was dominant. The 5m close also broke below the lower end of the previous 20-candle range. Volume came in at 1.87x alongside the breakdown, suggesting there was real activity at this level.
What stands out is that the anomaly percentile was only 37.9%. The notional change ranked #31 across the whole pool, while the anomaly percentile ranked #101—meaning the size of the move has picked up, but crowding isn’t extreme yet. 24h trading volume of 172M is supportive, and liquidity looks fine for now.
My take: this looks more like a boundary test during a long de-leveraging process than a trend-driven collapse. But after breaking below the range, don’t rush to buy the dip. Watch whether OI keeps contracting. If it stabilizes and price moves back inside the range, that would be a meaningful signal. Chasing shorts here offers only average risk-reward.
Aggressive trade delta was -12%, the buy/sell ratio was 0.79, and selling pressure was dominant. The 5m close also broke below the lower end of the previous 20-candle range. Volume came in at 1.87x alongside the breakdown, suggesting there was real activity at this level.
What stands out is that the anomaly percentile was only 37.9%. The notional change ranked #31 across the whole pool, while the anomaly percentile ranked #101—meaning the size of the move has picked up, but crowding isn’t extreme yet. 24h trading volume of 172M is supportive, and liquidity looks fine for now.
My take: this looks more like a boundary test during a long de-leveraging process than a trend-driven collapse. But after breaking below the range, don’t rush to buy the dip. Watch whether OI keeps contracting. If it stabilizes and price moves back inside the range, that would be a meaningful signal. Chasing shorts here offers only average risk-reward.
41
Log in to explore more content
Join global crypto users on Binance Square
⚡️ Get latest and useful information about crypto.
💬 Trusted by the world’s largest crypto exchange.
👍 Discover real insights from verified creators.
Email / Phone number
Trending Topics
1
#JobsReportRaisesHikeOdds
239,151 views
1,941 Discussing
2
#CPITestsDecemberRateOutlook
16,281 views
260 Discussing
3
#BitcoinRebounds$75KAsChipsLead
20,150 views
218 Discussing
4
#US Data Center Rules May Constrain AI Expansion
37,352 views
151 Discussing
5
#ARKPlans14ThematicETFsCoveringAIAndTokenizedMarkets
169 views
8 Discussing
6
#WillAnthropicListOnTime
56,611 views
746 Discussing
7
#WillUS-IranTensionsBoostSafe-HavenDemand?
8,949 views
106 Discussing
8
#BitcoinETFsSee$412MNetOutflows
2,447 views
43 Discussing
9
#HKSFCPlansToRestrictCryptoAndExchangeTerms
11,090 views
218 Discussing
10
#TradFiForBeginners
37,415 views
577 Discussing