

桀-1688
4.2k Posts

桀-1688
 Square Verified
Report
Block User
盯盘不追高,数据说人话。关注我,用数据拆行情,用白话讲市场。
High-Frequency Trader
9.1 Years
106 Following
11.3K+ Followers
2.5K+ Liked
Posts
·
--
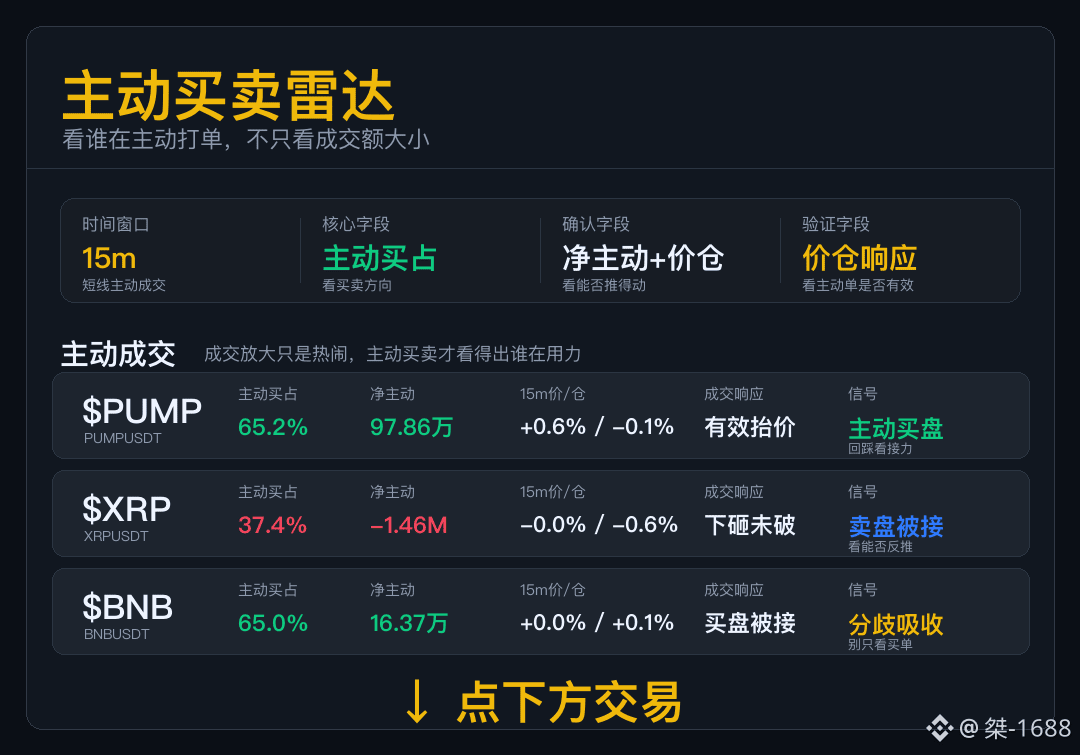
Active Buy/Sell Radar
Don’t just look at the turnover. Today, what matters most is whether the aggressive orders are able to push the market.
$PUMP ’s aggressive buy order lifted the price—this isn’t just volume spoofing. Next, watch whether there are still buyers stepping in on the pullback.
$XRP put out sell orders, but they didn’t break through—this suggests there is still support underneath. If you’re thinking of shorting, move a bit more cautiously.
$BNB has a relatively high proportion of aggressive buys, but the price hasn’t been pushed up. Market buy orders are being absorbed by the sell orders above.
The biggest risk here is assuming it’s all one direction at a glance. It’s more reliable to assess aggressive orders and the price response coin by coin.
Active Buy/Sell Radar
Don’t just look at the turnover. Today, what matters most is whether the aggressive orders are able to push the market.
$PUMP ’s aggressive buy order lifted the price—this isn’t just volume spoofing. Next, watch whether there are still buyers stepping in on the pullback.
$XRP put out sell orders, but they didn’t break through—this suggests there is still support underneath. If you’re thinking of shorting, move a bit more cautiously.
$BNB has a relatively high proportion of aggressive buys, but the price hasn’t been pushed up. Market buy orders are being absorbed by the sell orders above.
The biggest risk here is assuming it’s all one direction at a glance. It’s more reliable to assess aggressive orders and the price response coin by coin.
Don’t just look at the turnover. Today, what matters most is whether the aggressive orders are able to push the market.
$PUMP ’s aggressive buy order lifted the price—this isn’t just volume spoofing. Next, watch whether there are still buyers stepping in on the pullback.
$XRP put out sell orders, but they didn’t break through—this suggests there is still support underneath. If you’re thinking of shorting, move a bit more cautiously.
$BNB has a relatively high proportion of aggressive buys, but the price hasn’t been pushed up. Market buy orders are being absorbed by the sell orders above.
The biggest risk here is assuming it’s all one direction at a glance. It’s more reliable to assess aggressive orders and the price response coin by coin.
34
·
--
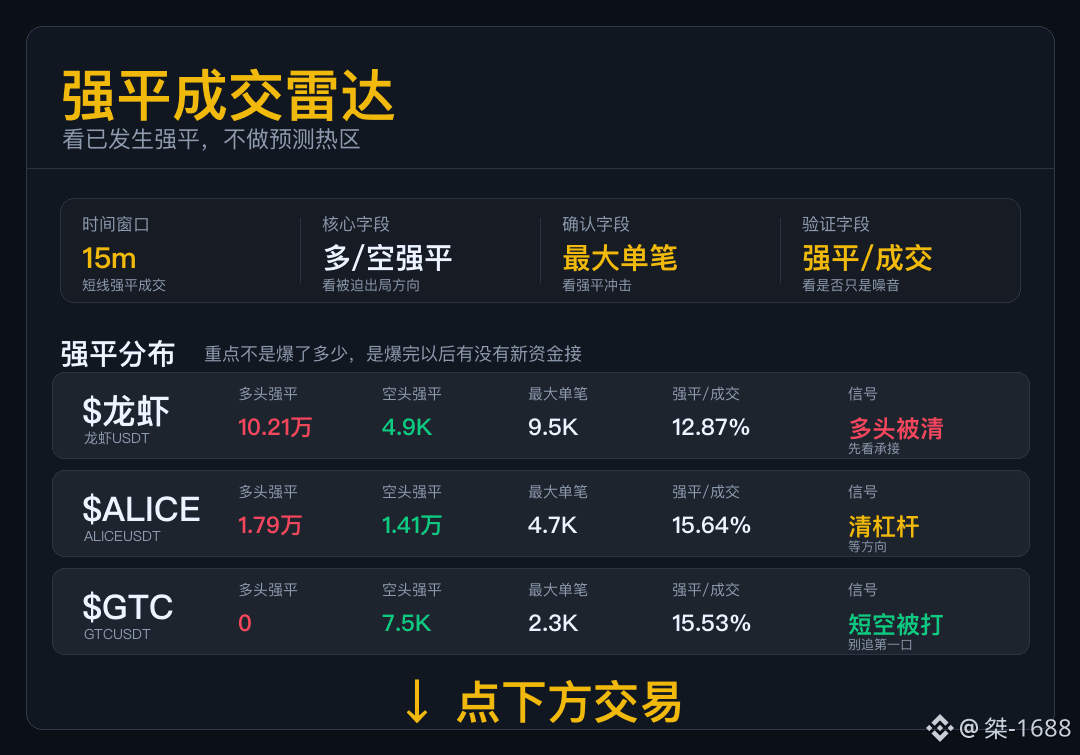
Increased-Position Exit Radar
For data like “strong liquidation,” first see who is being forced out.
When $Lobster long liquidation is driven by long positions, don’t rush to jump in on the first move—first see who comes in after the liquidation is completed.
With $ALICE , both sides’ liquidation levels are not low—first consider the size of the positions being cleared; later, who actively steps in to take over is what matters more.
With $GTC , the short side is squeezed more concentrated—momentum is already there. Next, watch whether there’s funding to hold up when the price retraces.
Some longs are liquidated, some shorts are squeezed—don’t merge it into a single market direction.
Increased-Position Exit Radar
For data like “strong liquidation,” first see who is being forced out.
When $Lobster long liquidation is driven by long positions, don’t rush to jump in on the first move—first see who comes in after the liquidation is completed.
With $ALICE , both sides’ liquidation levels are not low—first consider the size of the positions being cleared; later, who actively steps in to take over is what matters more.
With $GTC , the short side is squeezed more concentrated—momentum is already there. Next, watch whether there’s funding to hold up when the price retraces.
Some longs are liquidated, some shorts are squeezed—don’t merge it into a single market direction.
For data like “strong liquidation,” first see who is being forced out.
When $Lobster long liquidation is driven by long positions, don’t rush to jump in on the first move—first see who comes in after the liquidation is completed.
With $ALICE , both sides’ liquidation levels are not low—first consider the size of the positions being cleared; later, who actively steps in to take over is what matters more.
With $GTC , the short side is squeezed more concentrated—momentum is already there. Next, watch whether there’s funding to hold up when the price retraces.
Some longs are liquidated, some shorts are squeezed—don’t merge it into a single market direction.
372
·
--
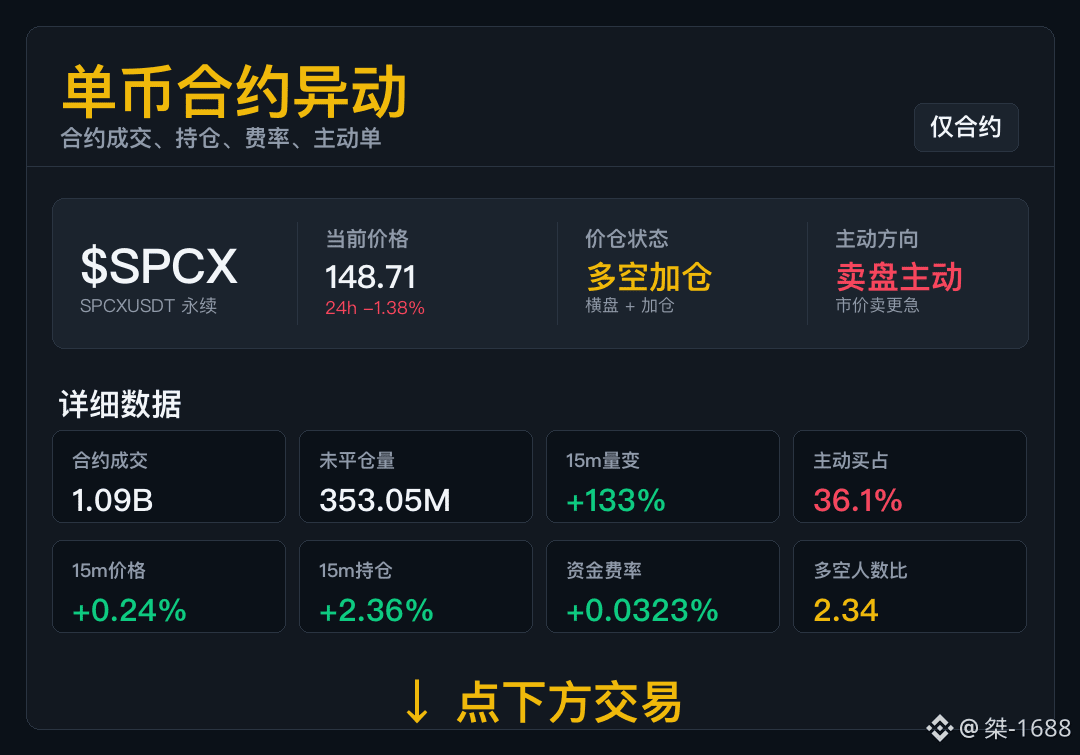
For this kind of contract-based order book, like $SPCX , the price is only the surface layer—changes in position are the real focus.
On the 15m timeframe: price +0.24%, open interest +2.36%. What it resembles right now is more like “adding to both long and short positions”: the price weakens while open interest expands. The disagreement between the contracts deepens at a low level. You can’t simply assign all newly added positions to the shorts based on open interest alone.
Aggressive buying accounts for 36.1%, while market selling here is more aggressive; the long-to-short participant ratio is 2.34—there are more longs—but for now it hasn’t reached a point of fee-rate squeeze.
Aggressive selling remains relatively high. Only then does the logic of new short-side sell pressure hold up.
For this kind of contract-based order book, like $SPCX , the price is only the surface layer—changes in position are the real focus.
On the 15m timeframe: price +0.24%, open interest +2.36%. What it resembles right now is more like “adding to both long and short positions”: the price weakens while open interest expands. The disagreement between the contracts deepens at a low level. You can’t simply assign all newly added positions to the shorts based on open interest alone.
Aggressive buying accounts for 36.1%, while market selling here is more aggressive; the long-to-short participant ratio is 2.34—there are more longs—but for now it hasn’t reached a point of fee-rate squeeze.
Aggressive selling remains relatively high. Only then does the logic of new short-side sell pressure hold up.
On the 15m timeframe: price +0.24%, open interest +2.36%. What it resembles right now is more like “adding to both long and short positions”: the price weakens while open interest expands. The disagreement between the contracts deepens at a low level. You can’t simply assign all newly added positions to the shorts based on open interest alone.
Aggressive buying accounts for 36.1%, while market selling here is more aggressive; the long-to-short participant ratio is 2.34—there are more longs—but for now it hasn’t reached a point of fee-rate squeeze.
Aggressive selling remains relatively high. Only then does the logic of new short-side sell pressure hold up.
226
·
--
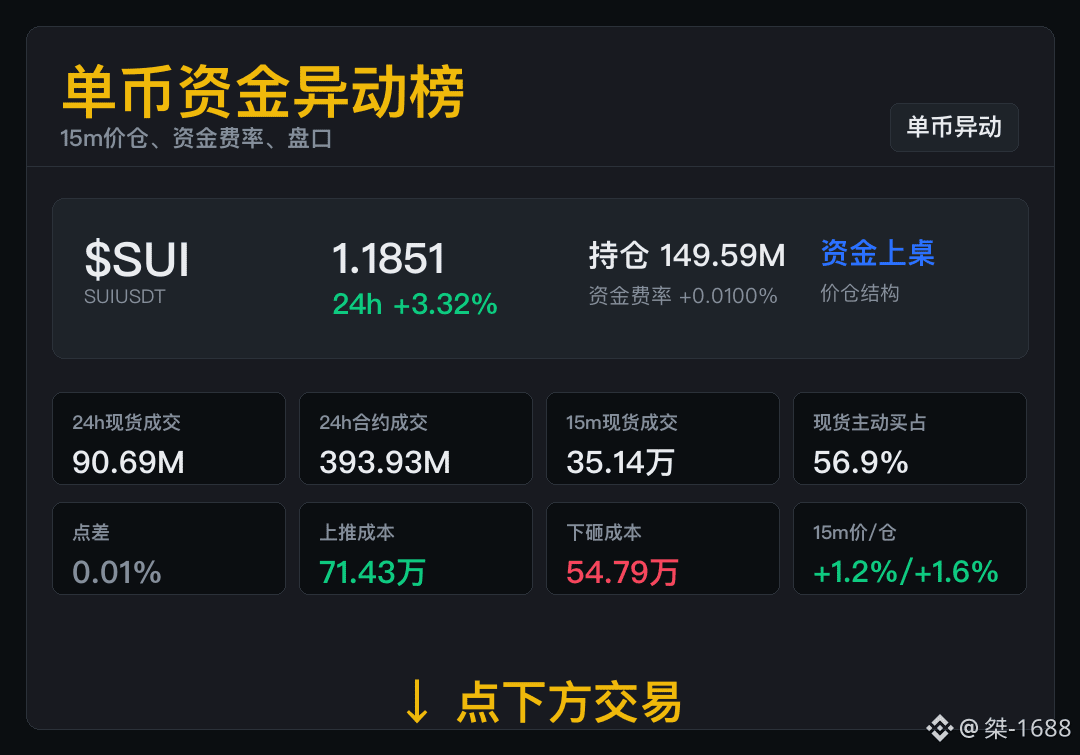
$SUI price and open interest rise at the same time, and short-term participation is increasing.
Current open interest 149.59M, funding rate +0.0100%; 15m price position +1.20% / +1.56%.
As the price moves higher, open interest expands, and short-term participation is strengthening.
For the price to keep rising, open interest and trading volume need to continue growing.
$SUI price and open interest rise at the same time, and short-term participation is increasing.
Current open interest 149.59M, funding rate +0.0100%; 15m price position +1.20% / +1.56%.
As the price moves higher, open interest expands, and short-term participation is strengthening.
For the price to keep rising, open interest and trading volume need to continue growing.
Current open interest 149.59M, funding rate +0.0100%; 15m price position +1.20% / +1.56%.
As the price moves higher, open interest expands, and short-term participation is strengthening.
For the price to keep rising, open interest and trading volume need to continue growing.
160
·
--
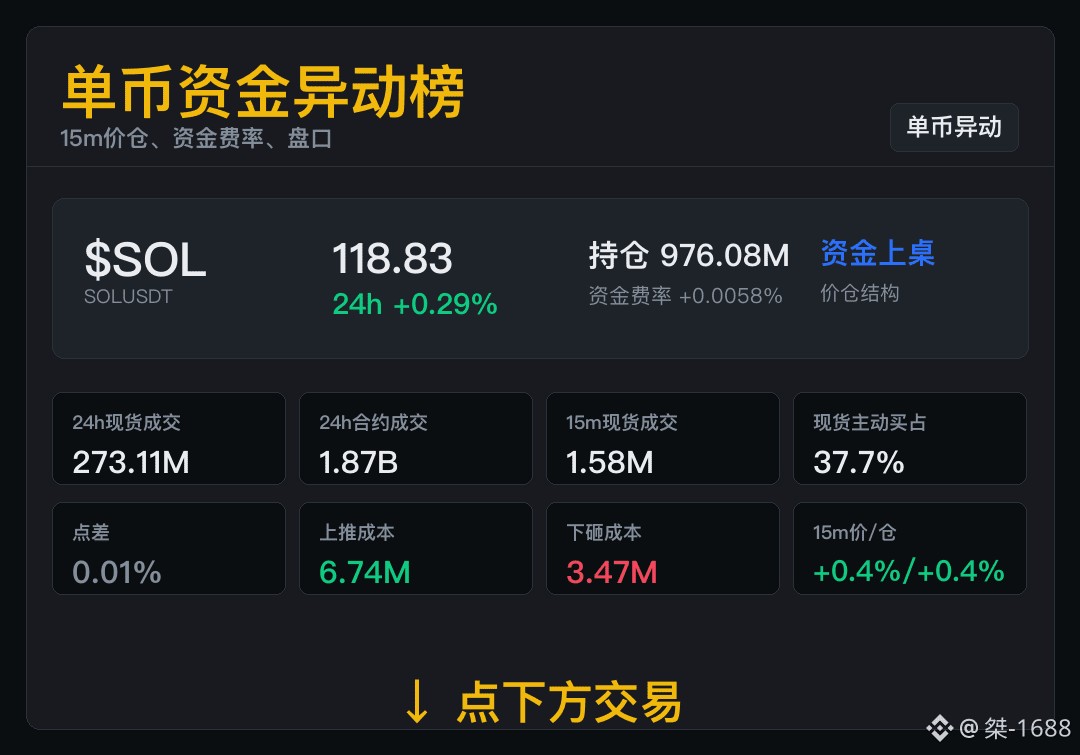
$SOL price is rising and open interest is expanding, and intraday game activity is increasing.
15m spot volume 1.58M, 15m price +0.38%, 15m open interest +0.39%.
No open-interest increase has been missed; the price-to-position structure is temporarily staying in the same direction.
In the next round, cross-check the increase in open interest and trading volume. As both readings continue to strengthen, we will keep tracking.
$SOL price is rising and open interest is expanding, and intraday game activity is increasing.
15m spot volume 1.58M, 15m price +0.38%, 15m open interest +0.39%.
No open-interest increase has been missed; the price-to-position structure is temporarily staying in the same direction.
In the next round, cross-check the increase in open interest and trading volume. As both readings continue to strengthen, we will keep tracking.
15m spot volume 1.58M, 15m price +0.38%, 15m open interest +0.39%.
No open-interest increase has been missed; the price-to-position structure is temporarily staying in the same direction.
In the next round, cross-check the increase in open interest and trading volume. As both readings continue to strengthen, we will keep tracking.
238
·
--
On short-term trades, don’t be greedy for too much at once. Pull out the few that have the clearest trading volume and structure.
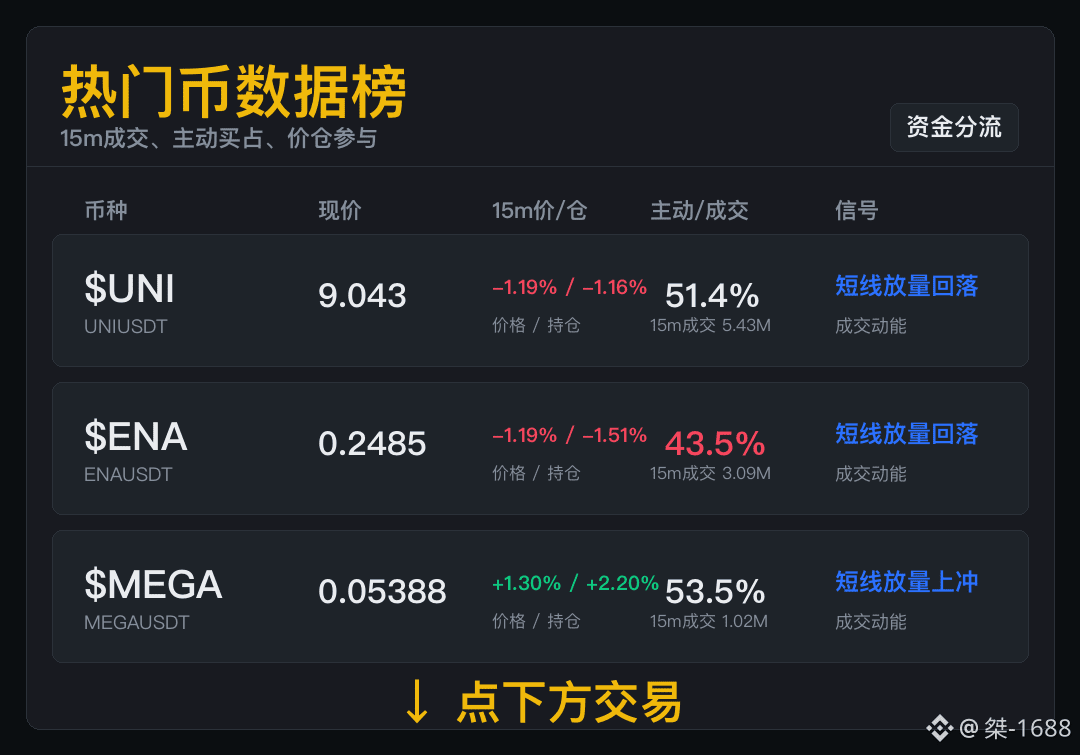
For $UNI , this round focuses on 15m participation: trading volume 5.43M, active buy accounts for 51.4%, and price-to-cash positions -1.19% / -1.16%. The intraday momentum is already there; the rest depends on whether the capital is willing to keep stepping in. Getting the flow is only the first step—the truly valuable part is that the trading volume doesn’t dry up.
For $ENA 15m, trading volume is 3.09M. Price-to-cash positions are -1.19% / -1.51%. For short-term participation, it matters more than simply looking at whether it’s up or down. You can watch what’s hot, but don’t treat popularity as a reason to heavily allocate.
Hot coins aren’t untradable—but don’t mistake the ranking for direction.
For $MEGA , first look at short-term trading volume at 1.02M, with active buy at 53.5%, then check price-to-cash positions +1.30% / +2.20%. If you want to participate short-term, first confirm that trading volume is still there during the pullback—don’t just chase the excitement of the first wave. Hotness is just a ticket, not a guaranteed win.
On short-term trades, don’t be greedy for too much at once. Pull out the few that have the clearest trading volume and structure.
For $UNI , this round focuses on 15m participation: trading volume 5.43M, active buy accounts for 51.4%, and price-to-cash positions -1.19% / -1.16%. The intraday momentum is already there; the rest depends on whether the capital is willing to keep stepping in. Getting the flow is only the first step—the truly valuable part is that the trading volume doesn’t dry up.
For $ENA 15m, trading volume is 3.09M. Price-to-cash positions are -1.19% / -1.51%. For short-term participation, it matters more than simply looking at whether it’s up or down. You can watch what’s hot, but don’t treat popularity as a reason to heavily allocate.
Hot coins aren’t untradable—but don’t mistake the ranking for direction.
For $MEGA , first look at short-term trading volume at 1.02M, with active buy at 53.5%, then check price-to-cash positions +1.30% / +2.20%. If you want to participate short-term, first confirm that trading volume is still there during the pullback—don’t just chase the excitement of the first wave. Hotness is just a ticket, not a guaranteed win.
For $UNI , this round focuses on 15m participation: trading volume 5.43M, active buy accounts for 51.4%, and price-to-cash positions -1.19% / -1.16%. The intraday momentum is already there; the rest depends on whether the capital is willing to keep stepping in. Getting the flow is only the first step—the truly valuable part is that the trading volume doesn’t dry up.
For $ENA 15m, trading volume is 3.09M. Price-to-cash positions are -1.19% / -1.51%. For short-term participation, it matters more than simply looking at whether it’s up or down. You can watch what’s hot, but don’t treat popularity as a reason to heavily allocate.
Hot coins aren’t untradable—but don’t mistake the ranking for direction.
For $MEGA , first look at short-term trading volume at 1.02M, with active buy at 53.5%, then check price-to-cash positions +1.30% / +2.20%. If you want to participate short-term, first confirm that trading volume is still there during the pullback—don’t just chase the excitement of the first wave. Hotness is just a ticket, not a guaranteed win.
172
·
--
Hot momentum rotates very quickly—first look at the few that still have volume staying in place.
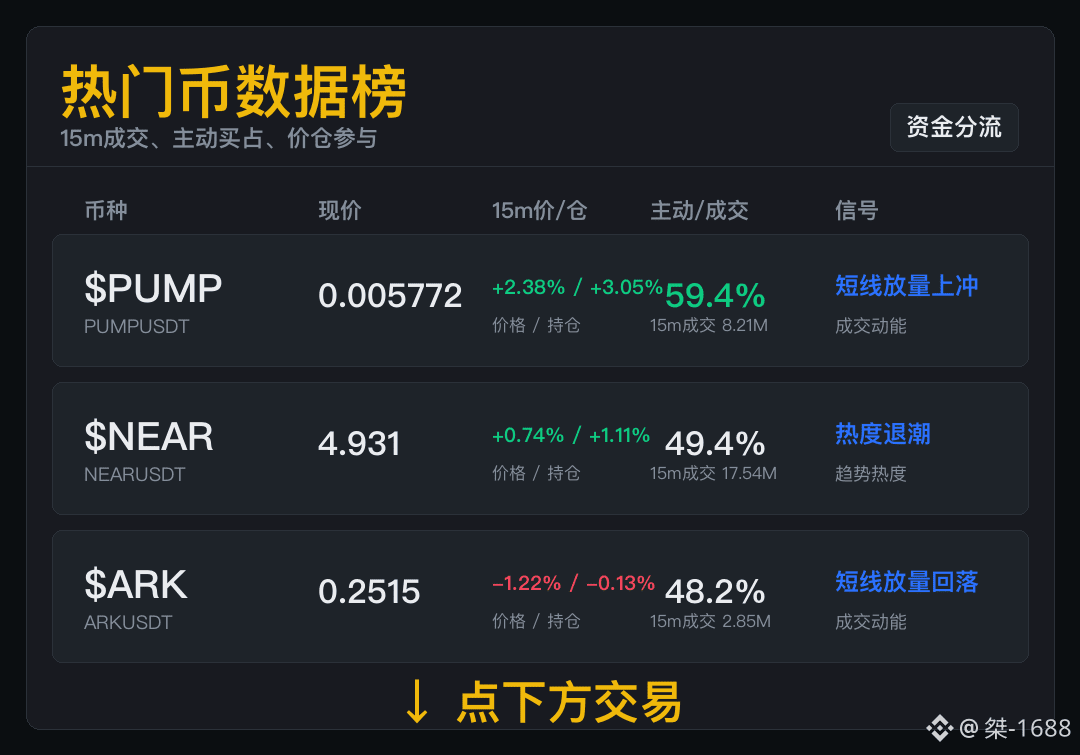
$PUMP 15m成交 8.21M, price position +2.38% / +3.05%. In the short term, participation matters more than only judging bullish vs bearish. People looking for opportunities can watch closely, but don’t treat the heat as direction. It’s good to have liquidity, but liquidity isn’t a steering wheel.
$NEAR 15m成交 17.54M, active buy accounts for 49.4%, price position +0.74% / +1.11%. Don’t rush to tell stories if you’re trapped—whether the rebound has volume is more important than the story. The heat is still there, but it’s starting to get hard to chase.
$ARK 15m成交 2.85M, active buy accounts for 48.2%, price position -1.22% / -0.13%. The heat is still there—next it depends on whether the funds are willing to stay. It’s easy to get heated up; whether you can hold your ground after the heat is the hard part.
Hot momentum rotates very quickly—first look at the few that still have volume staying in place.
$PUMP 15m成交 8.21M, price position +2.38% / +3.05%. In the short term, participation matters more than only judging bullish vs bearish. People looking for opportunities can watch closely, but don’t treat the heat as direction. It’s good to have liquidity, but liquidity isn’t a steering wheel.
$NEAR 15m成交 17.54M, active buy accounts for 49.4%, price position +0.74% / +1.11%. Don’t rush to tell stories if you’re trapped—whether the rebound has volume is more important than the story. The heat is still there, but it’s starting to get hard to chase.
$ARK 15m成交 2.85M, active buy accounts for 48.2%, price position -1.22% / -0.13%. The heat is still there—next it depends on whether the funds are willing to stay. It’s easy to get heated up; whether you can hold your ground after the heat is the hard part.
$PUMP 15m成交 8.21M, price position +2.38% / +3.05%. In the short term, participation matters more than only judging bullish vs bearish. People looking for opportunities can watch closely, but don’t treat the heat as direction. It’s good to have liquidity, but liquidity isn’t a steering wheel.
$NEAR 15m成交 17.54M, active buy accounts for 49.4%, price position +0.74% / +1.11%. Don’t rush to tell stories if you’re trapped—whether the rebound has volume is more important than the story. The heat is still there, but it’s starting to get hard to chase.
$ARK 15m成交 2.85M, active buy accounts for 48.2%, price position -1.22% / -0.13%. The heat is still there—next it depends on whether the funds are willing to stay. It’s easy to get heated up; whether you can hold your ground after the heat is the hard part.
179
·
--
When market sentiment is one-sided, fees often first spell out the risks.
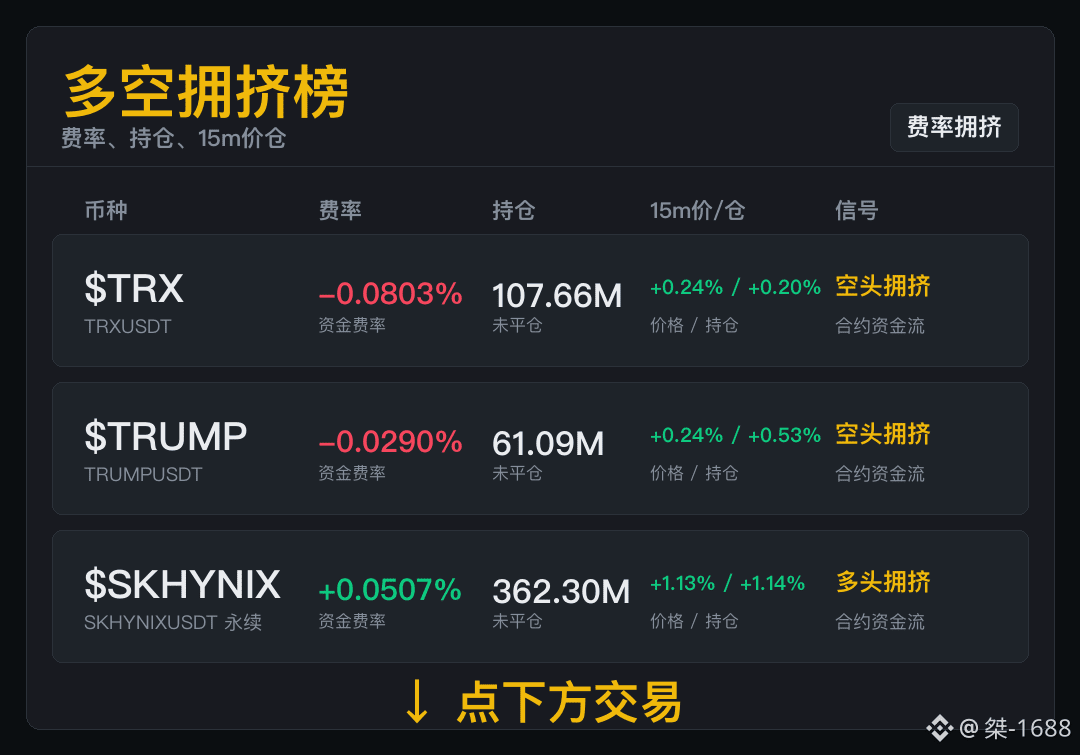
$TRX fee -0.0803% in conjunction with open interest of 107.66M—this kind mainly depends on whether the position size is still being built. If you’re trying to catch a rebound, don’t get too impatient; first check whether trading volume is willing to step up and hold its ground. It’s not that you can’t short, but shorts aren’t as cheap as they used to be right now.
$TRUMP contract temperature is here: fee -0.0290%, open interest 61.09M, short-term price positioning +0.24% / +0.53%. For those who are short, first see whether they can still break through; if they can’t, don’t fight the position size. There are plenty of shorts—if they can’t crush it, they’ll start to feel uncomfortable.
$SKHYNIX fee +0.0507%, open interest 362.30M, 15m price positioning +1.13% / +1.14%. Don’t force your way in if you missed it—comfortable entry points usually have already passed. It’s definitely hot, but chasing in may not be comfortable.
When market sentiment is one-sided, fees often first spell out the risks.
$TRX fee -0.0803% in conjunction with open interest of 107.66M—this kind mainly depends on whether the position size is still being built. If you’re trying to catch a rebound, don’t get too impatient; first check whether trading volume is willing to step up and hold its ground. It’s not that you can’t short, but shorts aren’t as cheap as they used to be right now.
$TRUMP contract temperature is here: fee -0.0290%, open interest 61.09M, short-term price positioning +0.24% / +0.53%. For those who are short, first see whether they can still break through; if they can’t, don’t fight the position size. There are plenty of shorts—if they can’t crush it, they’ll start to feel uncomfortable.
$SKHYNIX fee +0.0507%, open interest 362.30M, 15m price positioning +1.13% / +1.14%. Don’t force your way in if you missed it—comfortable entry points usually have already passed. It’s definitely hot, but chasing in may not be comfortable.
$TRX fee -0.0803% in conjunction with open interest of 107.66M—this kind mainly depends on whether the position size is still being built. If you’re trying to catch a rebound, don’t get too impatient; first check whether trading volume is willing to step up and hold its ground. It’s not that you can’t short, but shorts aren’t as cheap as they used to be right now.
$TRUMP contract temperature is here: fee -0.0290%, open interest 61.09M, short-term price positioning +0.24% / +0.53%. For those who are short, first see whether they can still break through; if they can’t, don’t fight the position size. There are plenty of shorts—if they can’t crush it, they’ll start to feel uncomfortable.
$SKHYNIX fee +0.0507%, open interest 362.30M, 15m price positioning +1.13% / +1.14%. Don’t force your way in if you missed it—comfortable entry points usually have already passed. It’s definitely hot, but chasing in may not be comfortable.
312
·
--
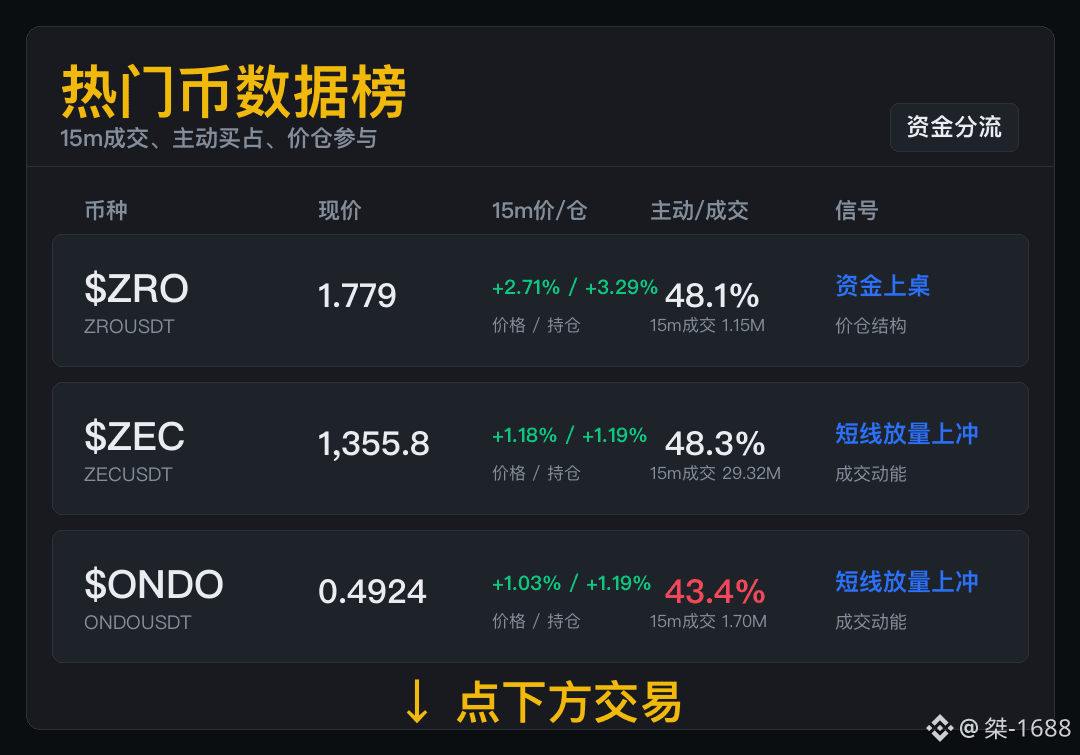
Heat is running everywhere—first check who isn’t just empty, showy fun.
$ZRO 15m Trade 1.15M in volume, with aggressive buys at 48.1%. The price warehouse is +2.71% / +3.29%. If you already have positions, don’t rush to add. Pullbacks are something to catch; they matter more than continuing to surge. Someone willing to enter is step one. Whether you can hold is step two.
$ZEC For a short-term setup, first look at traded volume of 29.32M, with aggressive buys at 48.3%. Then check the price warehouse +1.18% / +1.19%. If there’s人氣 (active participation) inside the venue, the next step is whether the funds are willing to keep picking up. It’s not a cold dish, so it’s worth watching—but “worth watching” doesn’t mean “charge in immediately.”
$ONDO The focus of this round is 15m participation: volume 1.70M, aggressive buys at 43.4%, and the price warehouse +1.03% / +1.19%. If you only want to watch a few coins, start with ones that actually have trades. The plaza loves excitement; traders need to see whether there’s real trading behind the noise.
Heat is running everywhere—first check who isn’t just empty, showy fun.
$ZRO 15m Trade 1.15M in volume, with aggressive buys at 48.1%. The price warehouse is +2.71% / +3.29%. If you already have positions, don’t rush to add. Pullbacks are something to catch; they matter more than continuing to surge. Someone willing to enter is step one. Whether you can hold is step two.
$ZEC For a short-term setup, first look at traded volume of 29.32M, with aggressive buys at 48.3%. Then check the price warehouse +1.18% / +1.19%. If there’s人氣 (active participation) inside the venue, the next step is whether the funds are willing to keep picking up. It’s not a cold dish, so it’s worth watching—but “worth watching” doesn’t mean “charge in immediately.”
$ONDO The focus of this round is 15m participation: volume 1.70M, aggressive buys at 43.4%, and the price warehouse +1.03% / +1.19%. If you only want to watch a few coins, start with ones that actually have trades. The plaza loves excitement; traders need to see whether there’s real trading behind the noise.
$ZRO 15m Trade 1.15M in volume, with aggressive buys at 48.1%. The price warehouse is +2.71% / +3.29%. If you already have positions, don’t rush to add. Pullbacks are something to catch; they matter more than continuing to surge. Someone willing to enter is step one. Whether you can hold is step two.
$ZEC For a short-term setup, first look at traded volume of 29.32M, with aggressive buys at 48.3%. Then check the price warehouse +1.18% / +1.19%. If there’s人氣 (active participation) inside the venue, the next step is whether the funds are willing to keep picking up. It’s not a cold dish, so it’s worth watching—but “worth watching” doesn’t mean “charge in immediately.”
$ONDO The focus of this round is 15m participation: volume 1.70M, aggressive buys at 43.4%, and the price warehouse +1.03% / +1.19%. If you only want to watch a few coins, start with ones that actually have trades. The plaza loves excitement; traders need to see whether there’s real trading behind the noise.
219
·
--
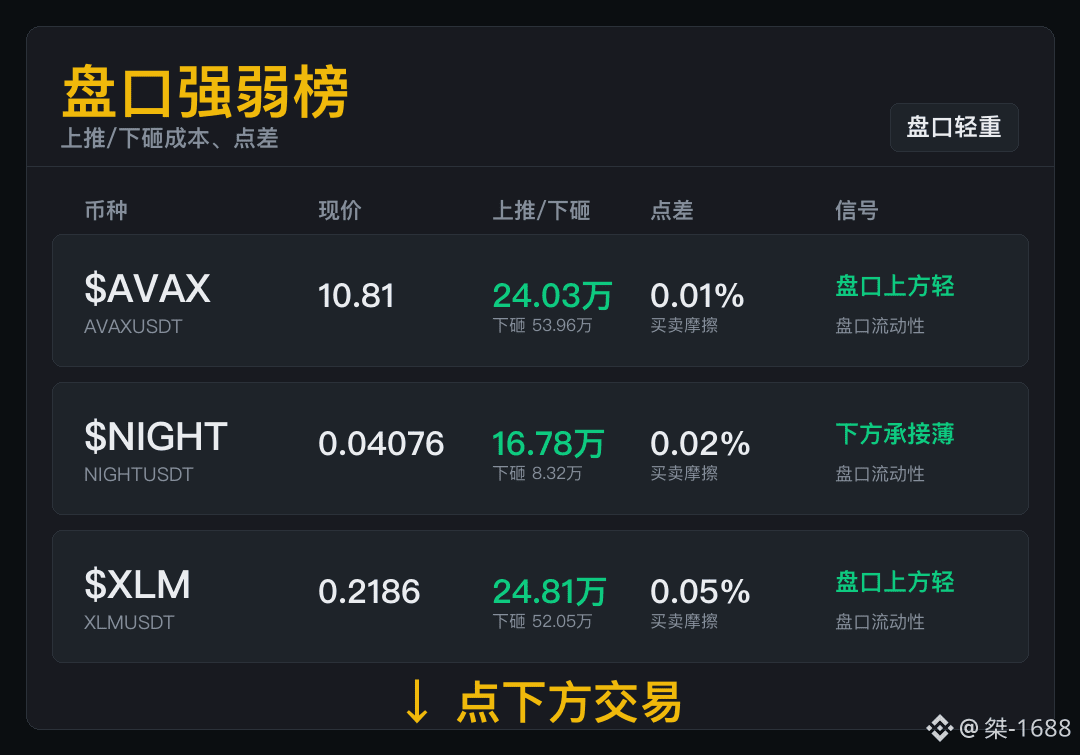
Many short-term traps aren’t about judgment—they’re about execution costs.
$AVAX : When executing, first look at the costs on both sides. Upward push: 240,300, downward dump: 539,600, spread: 0.01%. The thinness on the upper side can be watched, but if the buy orders aren’t continuous, don’t rush to accelerate. The order book only opens up space; the real move still depends on the buy-side orders.
$NIGHT : For this order book, look at three things. Upward push: 167,800, downward dump: 83,200, spread: 0.02%. Even if you can trade this kind of tape, do it lightly—don’t let a single downward dump throw off your rhythm. The downside isn’t thick; if it truly gets dumped, you won’t be given much time to think.
$XLM : When executing, first look at the costs on both sides. Upward push: 248,100, downward dump: 520,500, spread: 0.05%. If you want to chase, first check whether the aggressive orders have any breaks—don’t just look at the speed of the first move. Going up isn’t hard; it’s just the first layer. You also need to watch for sweeps on the second layer.
Many short-term traps aren’t about judgment—they’re about execution costs.
$AVAX : When executing, first look at the costs on both sides. Upward push: 240,300, downward dump: 539,600, spread: 0.01%. The thinness on the upper side can be watched, but if the buy orders aren’t continuous, don’t rush to accelerate. The order book only opens up space; the real move still depends on the buy-side orders.
$NIGHT : For this order book, look at three things. Upward push: 167,800, downward dump: 83,200, spread: 0.02%. Even if you can trade this kind of tape, do it lightly—don’t let a single downward dump throw off your rhythm. The downside isn’t thick; if it truly gets dumped, you won’t be given much time to think.
$XLM : When executing, first look at the costs on both sides. Upward push: 248,100, downward dump: 520,500, spread: 0.05%. If you want to chase, first check whether the aggressive orders have any breaks—don’t just look at the speed of the first move. Going up isn’t hard; it’s just the first layer. You also need to watch for sweeps on the second layer.
$AVAX : When executing, first look at the costs on both sides. Upward push: 240,300, downward dump: 539,600, spread: 0.01%. The thinness on the upper side can be watched, but if the buy orders aren’t continuous, don’t rush to accelerate. The order book only opens up space; the real move still depends on the buy-side orders.
$NIGHT : For this order book, look at three things. Upward push: 167,800, downward dump: 83,200, spread: 0.02%. Even if you can trade this kind of tape, do it lightly—don’t let a single downward dump throw off your rhythm. The downside isn’t thick; if it truly gets dumped, you won’t be given much time to think.
$XLM : When executing, first look at the costs on both sides. Upward push: 248,100, downward dump: 520,500, spread: 0.05%. If you want to chase, first check whether the aggressive orders have any breaks—don’t just look at the speed of the first move. Going up isn’t hard; it’s just the first layer. You also need to watch for sweeps on the second layer.
93
·
--
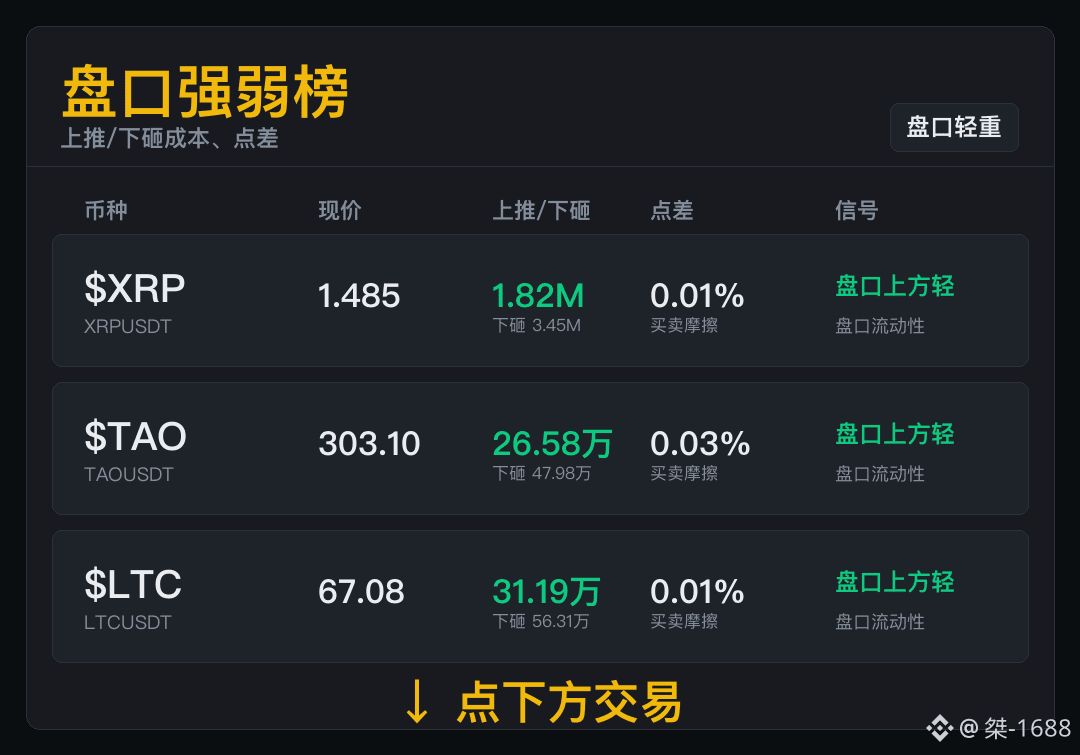
The real difficulty of short-term trading often lies in that moment of entering and exiting.
$XRP spot trading成交 163.00M, with the costs for pushing up / slamming down at 1.82M / 3.45M. With this kind of order book, it’s not just a question of whether the top side is light. When it pulls back, who is willing to take the position matters more. The doors being open doesn’t mean the car has already driven off—throttle still has to be actively buying pressure.
$TAO pushed up 265.8k and slammed down 479.8k, with a spread of 0.03%. The first buy order is just a test. Only if there’s still someone able to receive on the second bite does it mean it’s not a one-step sweep. Smooth momentum is only the first step; next you still have to see whether the buying pressure can stay connected.
$LTC spread 0.01%, pushing-up cost 311.9k. First, look to see whether the成交 can be taken over. Those who are eager can watch, but trend confirmation should be left to成交 and pullbacks. Whether short-term trading can break out depends on whether, after the first leg, there is further成交 to carry the momentum.
The real difficulty of short-term trading often lies in that moment of entering and exiting.
$XRP spot trading成交 163.00M, with the costs for pushing up / slamming down at 1.82M / 3.45M. With this kind of order book, it’s not just a question of whether the top side is light. When it pulls back, who is willing to take the position matters more. The doors being open doesn’t mean the car has already driven off—throttle still has to be actively buying pressure.
$TAO pushed up 265.8k and slammed down 479.8k, with a spread of 0.03%. The first buy order is just a test. Only if there’s still someone able to receive on the second bite does it mean it’s not a one-step sweep. Smooth momentum is only the first step; next you still have to see whether the buying pressure can stay connected.
$LTC spread 0.01%, pushing-up cost 311.9k. First, look to see whether the成交 can be taken over. Those who are eager can watch, but trend confirmation should be left to成交 and pullbacks. Whether short-term trading can break out depends on whether, after the first leg, there is further成交 to carry the momentum.
$XRP spot trading成交 163.00M, with the costs for pushing up / slamming down at 1.82M / 3.45M. With this kind of order book, it’s not just a question of whether the top side is light. When it pulls back, who is willing to take the position matters more. The doors being open doesn’t mean the car has already driven off—throttle still has to be actively buying pressure.
$TAO pushed up 265.8k and slammed down 479.8k, with a spread of 0.03%. The first buy order is just a test. Only if there’s still someone able to receive on the second bite does it mean it’s not a one-step sweep. Smooth momentum is only the first step; next you still have to see whether the buying pressure can stay connected.
$LTC spread 0.01%, pushing-up cost 311.9k. First, look to see whether the成交 can be taken over. Those who are eager can watch, but trend confirmation should be left to成交 and pullbacks. Whether short-term trading can break out depends on whether, after the first leg, there is further成交 to carry the momentum.
161
·
--
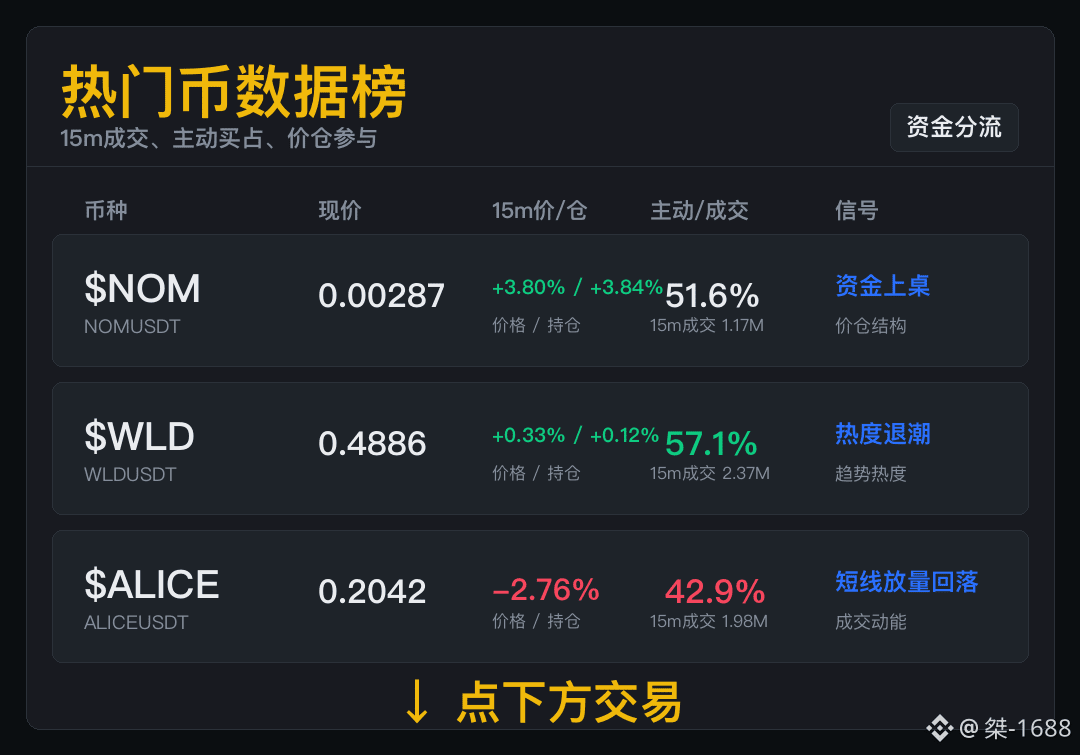
These three trades all happened in the front rows, but they didn’t follow the same playbook.
$NOM 15m Trade 1: 1.17M成交, price position +3.80% / +3.84%. For short-term participation, what matters more is the level of involvement rather than simply watching whether the trend looks bullish or bearish. You can take a look at this setup, but don’t fill your position just because you see people coming in. Watch how both price and positioning move together—it's more worth monitoring than a single K-line.
$WLD This round’s focus is 15m participation:成交 2.37M, with aggressive buys accounting for 57.1%, price position +0.33% / +0.12%. If you’re trapped, don’t fantasize about a quick V-reversal yet—first check whether the pullback rebound has volume. There are still people in the market, but the rhythm isn’t as smooth as it was earlier.
$ALICE 15m Trade: 成交 1.98M; on the 15m chart, price is -2.76%. Short-term participation matters more than just judging bullish/bearish signals. Where there are more people, opportunities are also more abundant—but so are misjudgments. Right now it has eyes on it and money being deployed, but popularity isn’t the direction.
These three trades all happened in the front rows, but they didn’t follow the same playbook.
$NOM 15m Trade 1: 1.17M成交, price position +3.80% / +3.84%. For short-term participation, what matters more is the level of involvement rather than simply watching whether the trend looks bullish or bearish. You can take a look at this setup, but don’t fill your position just because you see people coming in. Watch how both price and positioning move together—it's more worth monitoring than a single K-line.
$WLD This round’s focus is 15m participation:成交 2.37M, with aggressive buys accounting for 57.1%, price position +0.33% / +0.12%. If you’re trapped, don’t fantasize about a quick V-reversal yet—first check whether the pullback rebound has volume. There are still people in the market, but the rhythm isn’t as smooth as it was earlier.
$ALICE 15m Trade: 成交 1.98M; on the 15m chart, price is -2.76%. Short-term participation matters more than just judging bullish/bearish signals. Where there are more people, opportunities are also more abundant—but so are misjudgments. Right now it has eyes on it and money being deployed, but popularity isn’t the direction.
$NOM 15m Trade 1: 1.17M成交, price position +3.80% / +3.84%. For short-term participation, what matters more is the level of involvement rather than simply watching whether the trend looks bullish or bearish. You can take a look at this setup, but don’t fill your position just because you see people coming in. Watch how both price and positioning move together—it's more worth monitoring than a single K-line.
$WLD This round’s focus is 15m participation:成交 2.37M, with aggressive buys accounting for 57.1%, price position +0.33% / +0.12%. If you’re trapped, don’t fantasize about a quick V-reversal yet—first check whether the pullback rebound has volume. There are still people in the market, but the rhythm isn’t as smooth as it was earlier.
$ALICE 15m Trade: 成交 1.98M; on the 15m chart, price is -2.76%. Short-term participation matters more than just judging bullish/bearish signals. Where there are more people, opportunities are also more abundant—but so are misjudgments. Right now it has eyes on it and money being deployed, but popularity isn’t the direction.
176
·
--
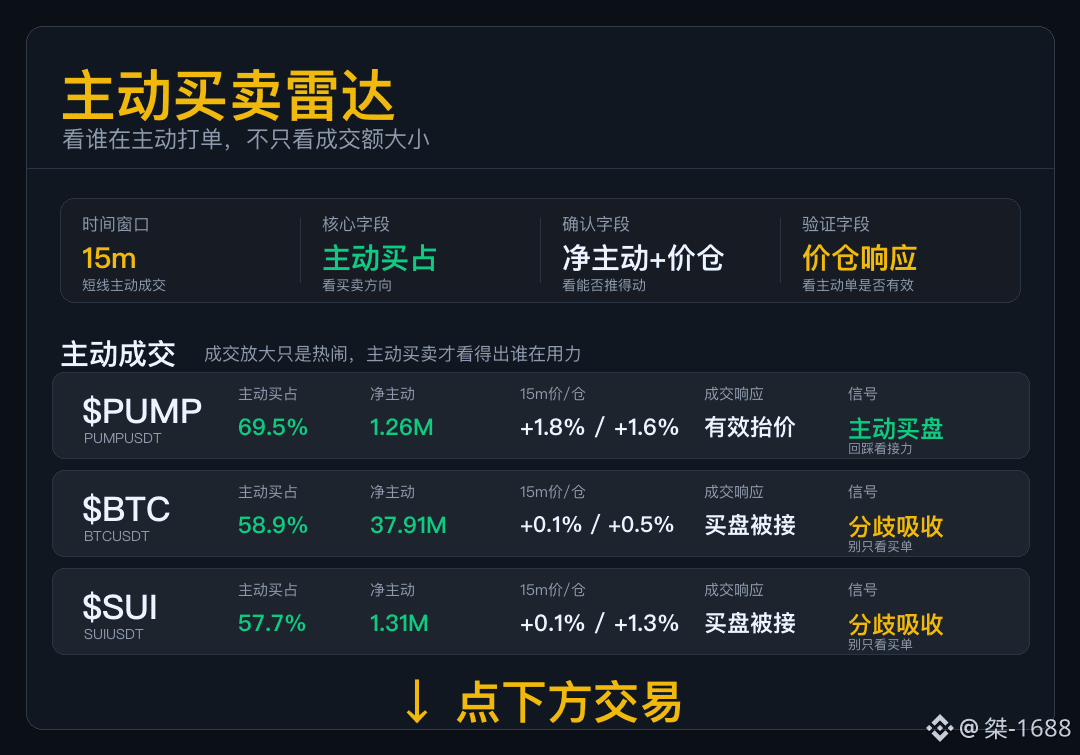
Active buy/sell radar
Don’t just look at the trading volume. Today, this set mainly focuses on whether the aggressive orders can push the order book.
$PUMP : The bid side has pushed the order book up a little. For the short term, don’t only look at how fast it climbs—focus on whether the next pullback has enough volume to get absorbed.
$BTC : The bid size is in the lead, but the price is still moving sideways. Pay more attention to the sell side’s willingness to unload.
$SUI : There are bids, but the price isn’t decisively pushed up. Treat it as a disagreement/contested order book at first—don’t directly assume a breakout just from aggressive buying.
The bid direction isn’t weak, but each coin’s reaction is different. It’s cleaner to assess the absorption one by one.
Active buy/sell radar
Don’t just look at the trading volume. Today, this set mainly focuses on whether the aggressive orders can push the order book.
$PUMP : The bid side has pushed the order book up a little. For the short term, don’t only look at how fast it climbs—focus on whether the next pullback has enough volume to get absorbed.
$BTC : The bid size is in the lead, but the price is still moving sideways. Pay more attention to the sell side’s willingness to unload.
$SUI : There are bids, but the price isn’t decisively pushed up. Treat it as a disagreement/contested order book at first—don’t directly assume a breakout just from aggressive buying.
The bid direction isn’t weak, but each coin’s reaction is different. It’s cleaner to assess the absorption one by one.
Don’t just look at the trading volume. Today, this set mainly focuses on whether the aggressive orders can push the order book.
$PUMP : The bid side has pushed the order book up a little. For the short term, don’t only look at how fast it climbs—focus on whether the next pullback has enough volume to get absorbed.
$BTC : The bid size is in the lead, but the price is still moving sideways. Pay more attention to the sell side’s willingness to unload.
$SUI : There are bids, but the price isn’t decisively pushed up. Treat it as a disagreement/contested order book at first—don’t directly assume a breakout just from aggressive buying.
The bid direction isn’t weak, but each coin’s reaction is different. It’s cleaner to assess the absorption one by one.
187
·
--
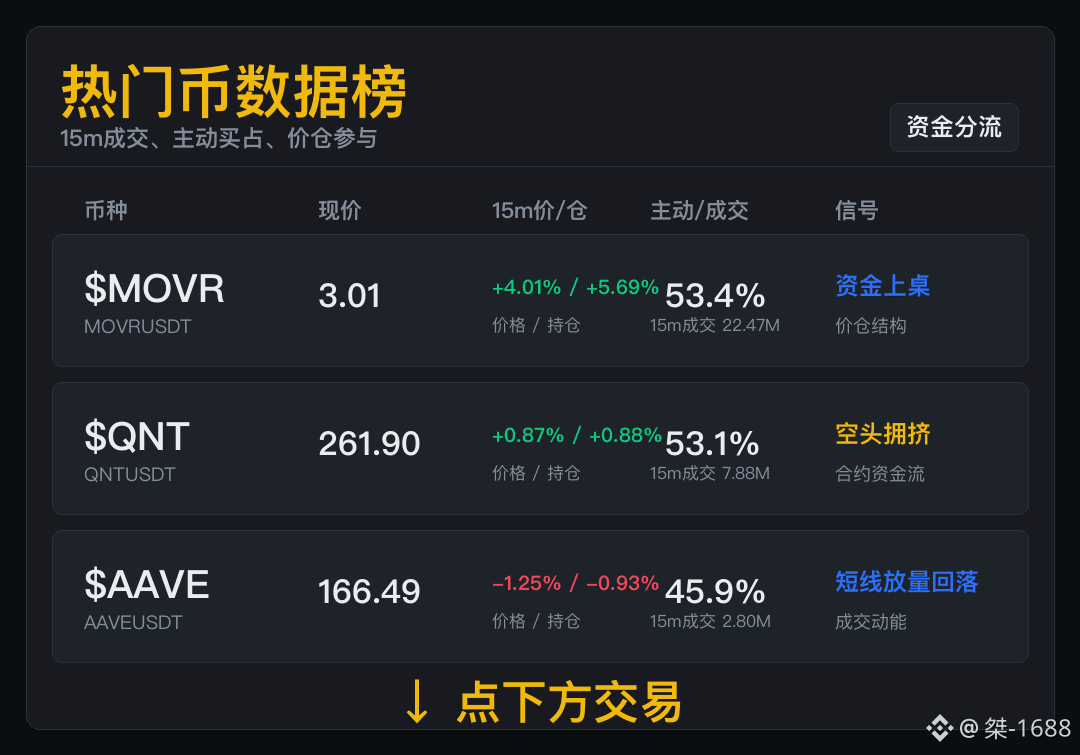
First filter real money during the trading session; put those with higher upfront turnover and position changes ahead.
$MOVR 15m: Turnover 22.47M. Active buy accounts for 53.4%, with price-position change +4.01% / +5.69%. At this point, the worst thing is impatience—being too eager often means chasing right after others have cashed out their short-term moves. When the price moves, money moves too. That’s what’s worth watching.
$QNT : For the short term, first look at turnover of 7.88M and active buy ratio of 53.1%. Then check the price-position change +0.87% / +0.88%. The more filled the shorts are, the more likely you’ll see that type of rebound that keeps people up at night. There are quite a few on the short side; if they can’t keep dumping, it will become uncomfortable.
$AAVE : The focus of this round is 15m participation: turnover 2.80M, active buy ratio 45.9%, and price-position change -1.25% / -0.93%. Screen-filling isn’t unusual—what’s unusual is whether it can stay in the front ranks. At least for now, people are watching this coin; it’s not dead.
First filter real money during the trading session; put those with higher upfront turnover and position changes ahead.
$MOVR 15m: Turnover 22.47M. Active buy accounts for 53.4%, with price-position change +4.01% / +5.69%. At this point, the worst thing is impatience—being too eager often means chasing right after others have cashed out their short-term moves. When the price moves, money moves too. That’s what’s worth watching.
$QNT : For the short term, first look at turnover of 7.88M and active buy ratio of 53.1%. Then check the price-position change +0.87% / +0.88%. The more filled the shorts are, the more likely you’ll see that type of rebound that keeps people up at night. There are quite a few on the short side; if they can’t keep dumping, it will become uncomfortable.
$AAVE : The focus of this round is 15m participation: turnover 2.80M, active buy ratio 45.9%, and price-position change -1.25% / -0.93%. Screen-filling isn’t unusual—what’s unusual is whether it can stay in the front ranks. At least for now, people are watching this coin; it’s not dead.
$MOVR 15m: Turnover 22.47M. Active buy accounts for 53.4%, with price-position change +4.01% / +5.69%. At this point, the worst thing is impatience—being too eager often means chasing right after others have cashed out their short-term moves. When the price moves, money moves too. That’s what’s worth watching.
$QNT : For the short term, first look at turnover of 7.88M and active buy ratio of 53.1%. Then check the price-position change +0.87% / +0.88%. The more filled the shorts are, the more likely you’ll see that type of rebound that keeps people up at night. There are quite a few on the short side; if they can’t keep dumping, it will become uncomfortable.
$AAVE : The focus of this round is 15m participation: turnover 2.80M, active buy ratio 45.9%, and price-position change -1.25% / -0.93%. Screen-filling isn’t unusual—what’s unusual is whether it can stay in the front ranks. At least for now, people are watching this coin; it’s not dead.
421
·
--
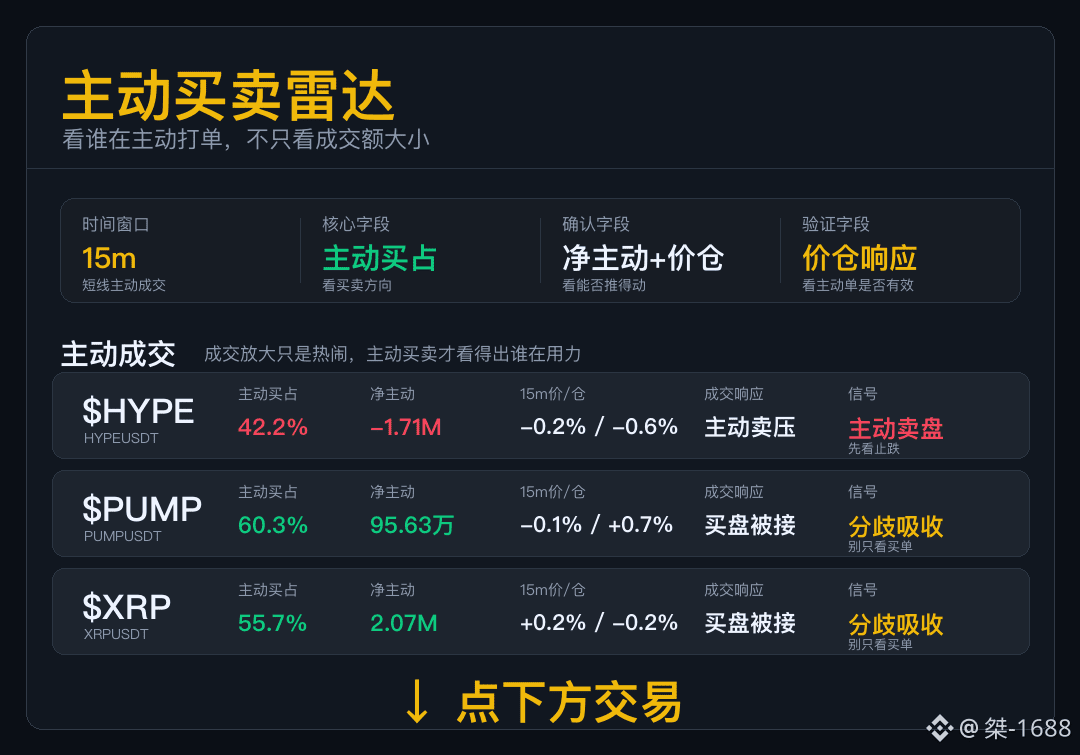
Active Buy/Sell Radar
Don’t just look at turnover. Today, this set mainly checks whether aggressive orders can push the order book.
$HYPE —aggressive sell pressure and price feedback move in the same direction; for the short term, watch the selling-side control of the pace.
$PUMP —aggressive buying, but the price-push efficiency is mediocre. Later, wait until the price truly breaks up and then increase the weighting.
$XRP —aggressive buying isn’t weak, but the price reaction is only so-so. This feels more like probing rather than a confirmed acceleration.
This set isn’t the same script. Track coin by coin: who can push, and who gets absorbed.
Active Buy/Sell Radar
Don’t just look at turnover. Today, this set mainly checks whether aggressive orders can push the order book.
$HYPE —aggressive sell pressure and price feedback move in the same direction; for the short term, watch the selling-side control of the pace.
$PUMP —aggressive buying, but the price-push efficiency is mediocre. Later, wait until the price truly breaks up and then increase the weighting.
$XRP —aggressive buying isn’t weak, but the price reaction is only so-so. This feels more like probing rather than a confirmed acceleration.
This set isn’t the same script. Track coin by coin: who can push, and who gets absorbed.
Don’t just look at turnover. Today, this set mainly checks whether aggressive orders can push the order book.
$HYPE —aggressive sell pressure and price feedback move in the same direction; for the short term, watch the selling-side control of the pace.
$PUMP —aggressive buying, but the price-push efficiency is mediocre. Later, wait until the price truly breaks up and then increase the weighting.
$XRP —aggressive buying isn’t weak, but the price reaction is only so-so. This feels more like probing rather than a confirmed acceleration.
This set isn’t the same script. Track coin by coin: who can push, and who gets absorbed.
199
·
--
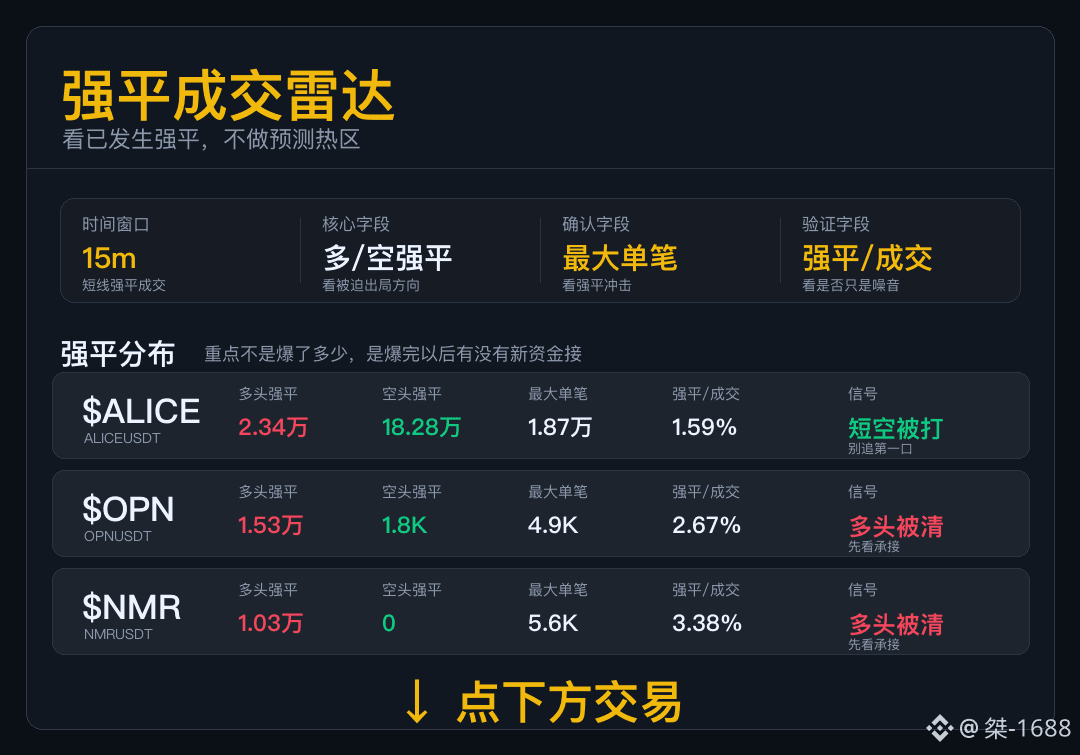
Strong and Forced Position Liquidation Radar
For data like “strong position liquidation,” first see who is being forced out.
$ALICE The short side’s strong liquidation provides fuel for a rebound, but the real continuation depends on whether subsequent trading volume connects.
$OPN When long leverage is hit and liquidated first, whether the pullback can turn into something depends on whether trading volume keeps up.
$NMR When long liquidation is leading, don’t rush to buy the first dip—first see clearly who comes in next after the liquidation.
Some longs get cleared, some shorts get squeezed—don’t merge them into a single market direction.
Strong and Forced Position Liquidation Radar
For data like “strong position liquidation,” first see who is being forced out.
$ALICE The short side’s strong liquidation provides fuel for a rebound, but the real continuation depends on whether subsequent trading volume connects.
$OPN When long leverage is hit and liquidated first, whether the pullback can turn into something depends on whether trading volume keeps up.
$NMR When long liquidation is leading, don’t rush to buy the first dip—first see clearly who comes in next after the liquidation.
Some longs get cleared, some shorts get squeezed—don’t merge them into a single market direction.
For data like “strong position liquidation,” first see who is being forced out.
$ALICE The short side’s strong liquidation provides fuel for a rebound, but the real continuation depends on whether subsequent trading volume connects.
$OPN When long leverage is hit and liquidated first, whether the pullback can turn into something depends on whether trading volume keeps up.
$NMR When long liquidation is leading, don’t rush to buy the first dip—first see clearly who comes in next after the liquidation.
Some longs get cleared, some shorts get squeezed—don’t merge them into a single market direction.
276
·
--
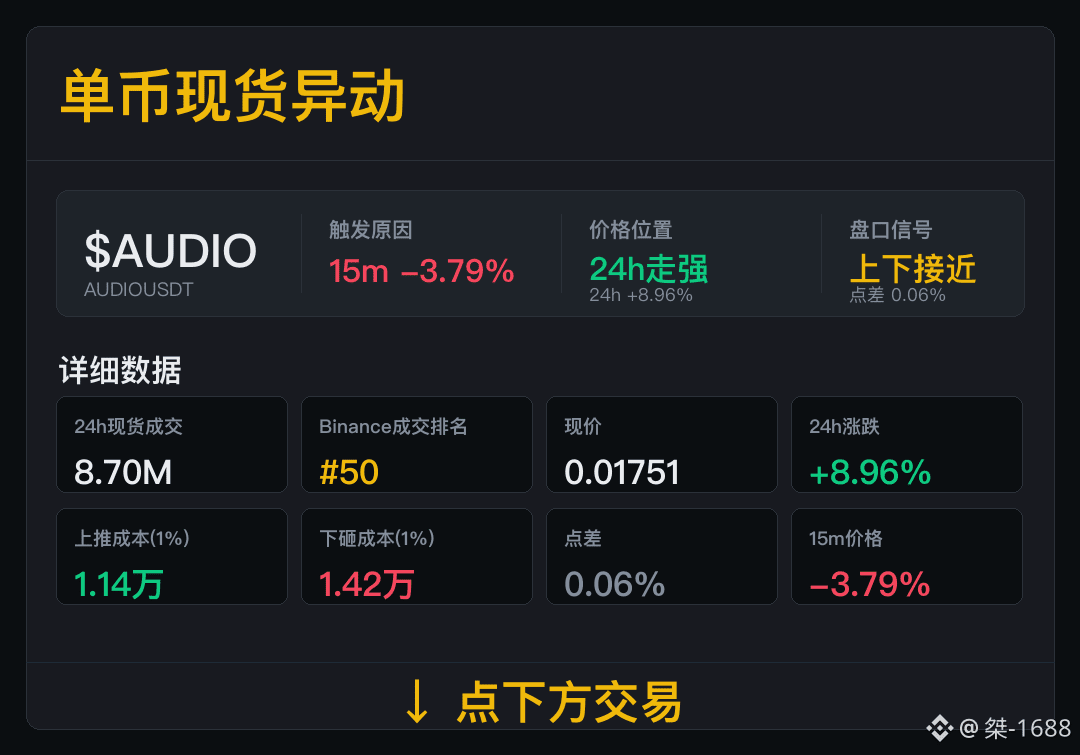
$AUDIO 15m Volatility has already appeared, and transaction quality comes first.
Spot transactions: 8.70M, Binance transaction ranking: #50. The current participation size has already been specified—next round, continue verifying the transactions.
Now, 24h price change +8.96%; spread 0.06%, pushed-up cost 114,000, slashed-down cost 142,000. Going forward, keep the spread at the current level and keep transactions active—short-term execution will be smoother.
In the next round, the focus is on verifying transactions and the spread; once both are stable, continue tracking.
$AUDIO 15m Volatility has already appeared, and transaction quality comes first.
Spot transactions: 8.70M, Binance transaction ranking: #50. The current participation size has already been specified—next round, continue verifying the transactions.
Now, 24h price change +8.96%; spread 0.06%, pushed-up cost 114,000, slashed-down cost 142,000. Going forward, keep the spread at the current level and keep transactions active—short-term execution will be smoother.
In the next round, the focus is on verifying transactions and the spread; once both are stable, continue tracking.
Spot transactions: 8.70M, Binance transaction ranking: #50. The current participation size has already been specified—next round, continue verifying the transactions.
Now, 24h price change +8.96%; spread 0.06%, pushed-up cost 114,000, slashed-down cost 142,000. Going forward, keep the spread at the current level and keep transactions active—short-term execution will be smoother.
In the next round, the focus is on verifying transactions and the spread; once both are stable, continue tracking.
115
·
--
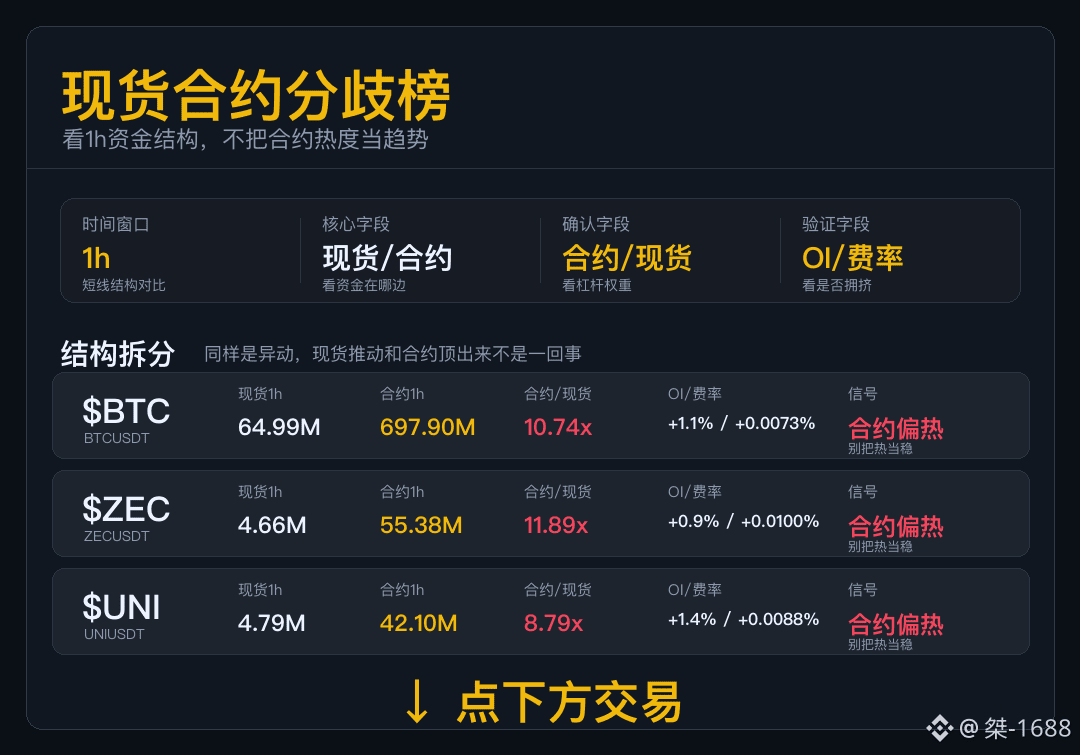
Spot Contract Divergence Ranking
In the last 1 hour, first split the sources of the incoming funds: is it the spot market that’s catching up, or are the contracts taking the lead and抢节奏 (setting the pace)?
$BTC leveraged funds moved ahead first—suitable for tracking the pace, not suitable to treat the heat in the first segment as a direct trend.
$ZEC contract trading has clearly outpaced spot; in the last hour, the move has mainly been driven by leveraged funds.
$UNI the leveraged side first pulled up the atmosphere—price action can move fast, but if spot hasn’t caught up yet, don’t get too overconfident.
If contracts heat up first, the market can speed up; but without spot participation, the speed is also likely to turn into back-and-forth swings.
Spot Contract Divergence Ranking
In the last 1 hour, first split the sources of the incoming funds: is it the spot market that’s catching up, or are the contracts taking the lead and抢节奏 (setting the pace)?
$BTC leveraged funds moved ahead first—suitable for tracking the pace, not suitable to treat the heat in the first segment as a direct trend.
$ZEC contract trading has clearly outpaced spot; in the last hour, the move has mainly been driven by leveraged funds.
$UNI the leveraged side first pulled up the atmosphere—price action can move fast, but if spot hasn’t caught up yet, don’t get too overconfident.
If contracts heat up first, the market can speed up; but without spot participation, the speed is also likely to turn into back-and-forth swings.
In the last 1 hour, first split the sources of the incoming funds: is it the spot market that’s catching up, or are the contracts taking the lead and抢节奏 (setting the pace)?
$BTC leveraged funds moved ahead first—suitable for tracking the pace, not suitable to treat the heat in the first segment as a direct trend.
$ZEC contract trading has clearly outpaced spot; in the last hour, the move has mainly been driven by leveraged funds.
$UNI the leveraged side first pulled up the atmosphere—price action can move fast, but if spot hasn’t caught up yet, don’t get too overconfident.
If contracts heat up first, the market can speed up; but without spot participation, the speed is also likely to turn into back-and-forth swings.
537
·
--
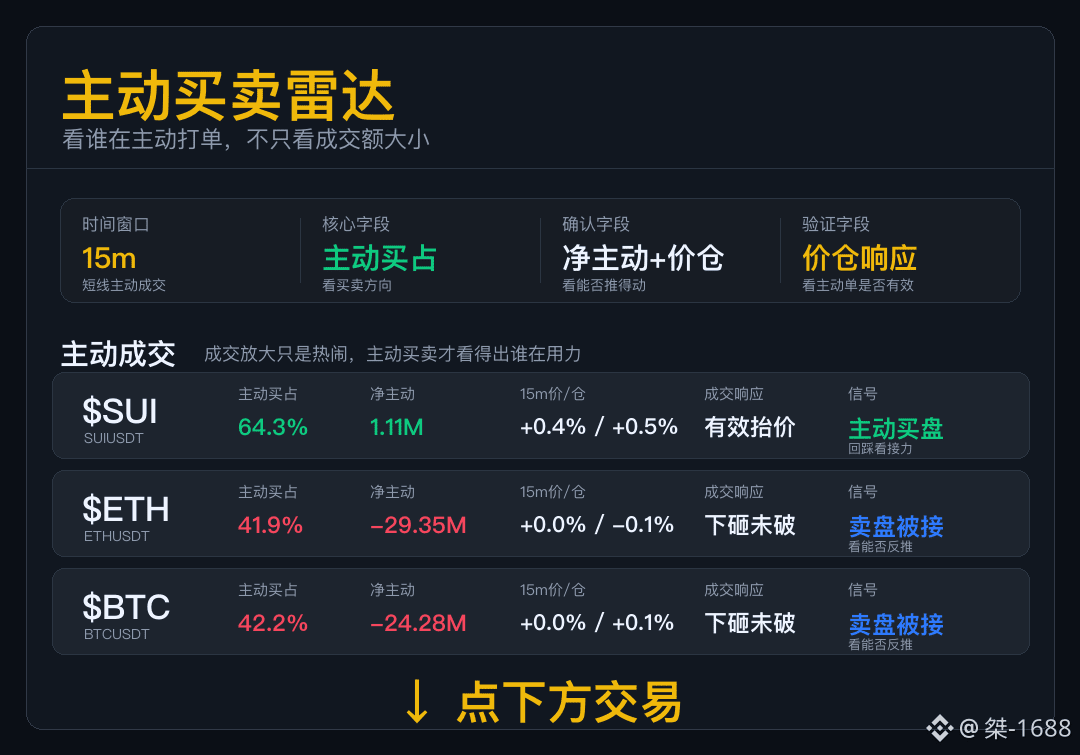
Active buy/sell radar
Don’t just look at the traded amount. Today, what matters most is whether the aggressive orders can push the price action.
$SUI : The aggressive buy orders pushed the price away. This isn’t just fake volume; next, watch whether on the pullback there are still people willing to step in.
$ETH : Sell orders were placed, but they didn’t break through downward. This suggests there’s support below—don’t rush to chase shorts.
$BTC : The seller moved first, but the price didn’t collapse downward in sequence. This means the support isn’t just for show.
The biggest risk here is mistaking everything as one unified direction. It’s more reliable to look at aggressive orders and how the price responds, coin by coin.
Active buy/sell radar
Don’t just look at the traded amount. Today, what matters most is whether the aggressive orders can push the price action.
$SUI : The aggressive buy orders pushed the price away. This isn’t just fake volume; next, watch whether on the pullback there are still people willing to step in.
$ETH : Sell orders were placed, but they didn’t break through downward. This suggests there’s support below—don’t rush to chase shorts.
$BTC : The seller moved first, but the price didn’t collapse downward in sequence. This means the support isn’t just for show.
The biggest risk here is mistaking everything as one unified direction. It’s more reliable to look at aggressive orders and how the price responds, coin by coin.
Don’t just look at the traded amount. Today, what matters most is whether the aggressive orders can push the price action.
$SUI : The aggressive buy orders pushed the price away. This isn’t just fake volume; next, watch whether on the pullback there are still people willing to step in.
$ETH : Sell orders were placed, but they didn’t break through downward. This suggests there’s support below—don’t rush to chase shorts.
$BTC : The seller moved first, but the price didn’t collapse downward in sequence. This means the support isn’t just for show.
The biggest risk here is mistaking everything as one unified direction. It’s more reliable to look at aggressive orders and how the price responds, coin by coin.
75
·
--
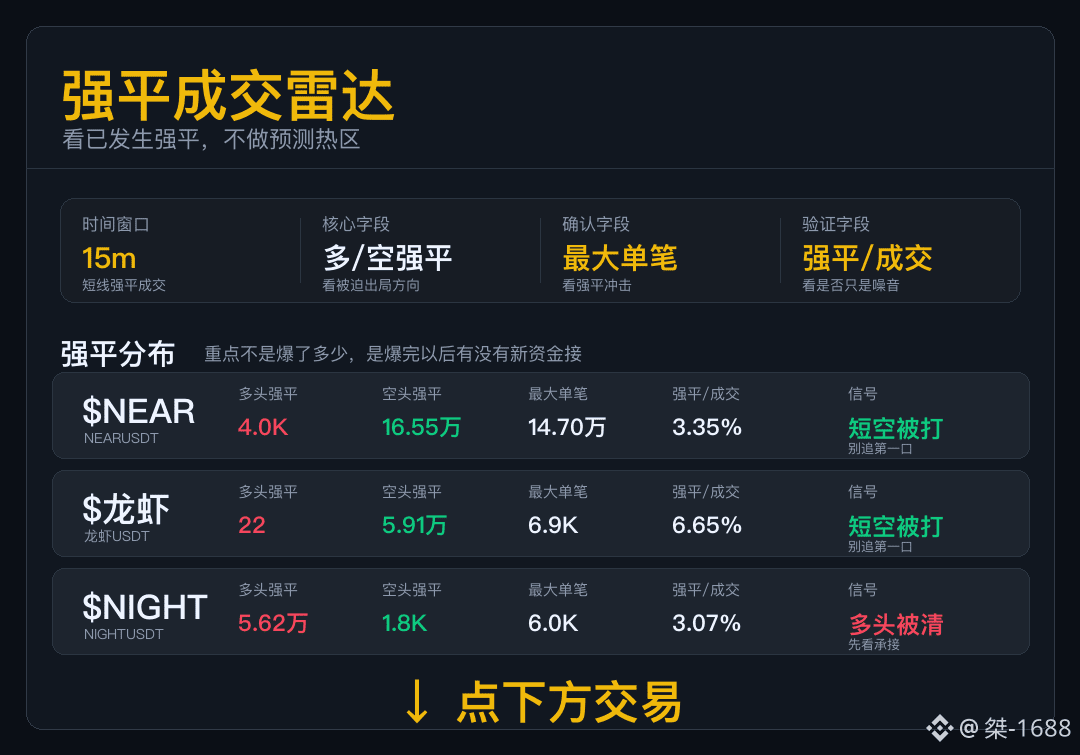
Strong liquidation of positions (forced exits) on the radar
For data like this, first see who is being forced out.
$NEAR : There are more short liquidations; it looks like a brief upward push that caught short positions. Don’t rush to chase on the first move—only a pullback that can hold indicates that someone is still stepping in.
$Lobster: The short liquidations have a larger amount; covering has already become part of that segment’s trading volume.
$NIGHT : Long liquidations suggest that leverage was shaken out in the first round. Whether it can hold depends on the follow-through after the liquidations—who takes over.
These forced liquidations don’t point in a single direction. After you check each coin clearly, see who still has the momentum to take it on next.
Strong liquidation of positions (forced exits) on the radar
For data like this, first see who is being forced out.
$NEAR : There are more short liquidations; it looks like a brief upward push that caught short positions. Don’t rush to chase on the first move—only a pullback that can hold indicates that someone is still stepping in.
$Lobster: The short liquidations have a larger amount; covering has already become part of that segment’s trading volume.
$NIGHT : Long liquidations suggest that leverage was shaken out in the first round. Whether it can hold depends on the follow-through after the liquidations—who takes over.
These forced liquidations don’t point in a single direction. After you check each coin clearly, see who still has the momentum to take it on next.
For data like this, first see who is being forced out.
$NEAR : There are more short liquidations; it looks like a brief upward push that caught short positions. Don’t rush to chase on the first move—only a pullback that can hold indicates that someone is still stepping in.
$Lobster: The short liquidations have a larger amount; covering has already become part of that segment’s trading volume.
$NIGHT : Long liquidations suggest that leverage was shaken out in the first round. Whether it can hold depends on the follow-through after the liquidations—who takes over.
These forced liquidations don’t point in a single direction. After you check each coin clearly, see who still has the momentum to take it on next.
534
Log in to explore more content
Join global crypto users on Binance Square
⚡️ Get latest and useful information about crypto.
💬 Trusted by the world’s largest crypto exchange.
👍 Discover real insights from verified creators.
Email / Phone number
Trending Topics
EtherGains70.9%InQ3
117,540 views
1,022 Discussing
One of the best third quarters in history 💰
September closed out last night, and with it, the quarter. For the quarter, BTC is up 42%—the second-best Q3 on record. ETH had a record-breaking Q3 overall, up 70%.
Looking at the chart, things are still looking good: we’re holding support, but we’re testing it more and more often. Plus, ETF momentum is weakening — inflows are gradually declining, and yesterday saw outflows for the first time in a long while.
Yes, historically, October has been a good month for crypto — it’s not called “Uptober” for nothing. But it’s also one of the most volatile months. Last year, for example, we managed to hit a new all-time high (ATH) and experience a flash crash.
🚀 High Accuracy Trades.
$BTC
$ETH
$SOL
#EtherGains70.9%InQ3 #DollarIndexHitsHighestSinceMay2025 #CFTCSubmitsTwoEventContractRulesToWhiteHouse #MicronBeatsEarningsLiftsGuidance
Knowledge is Power
·0 Likes
·200 views
TreasuryLetsStatesFileStablecoinCertificationsEarly
6,381 views
72 Discussing
US10YearYieldNears5.3%
132,471 views
1,055 Discussing