
Công Nguyễn Lucky
1.8k Posts

Công Nguyễn Lucky
Report
Block User
Giải thích cấu trúc thị trường, dữ liệu và quản trị rủi ro bằng ngôn ngữ dễ hiểu. Kịch bản có điều kiện, không hô kèo, không cam kết lợi nhuận.
Open Trade
High-Frequency Trader
5.7 Years
28 Following
58 Followers
77 Liked
Posts
Portfolio
Article
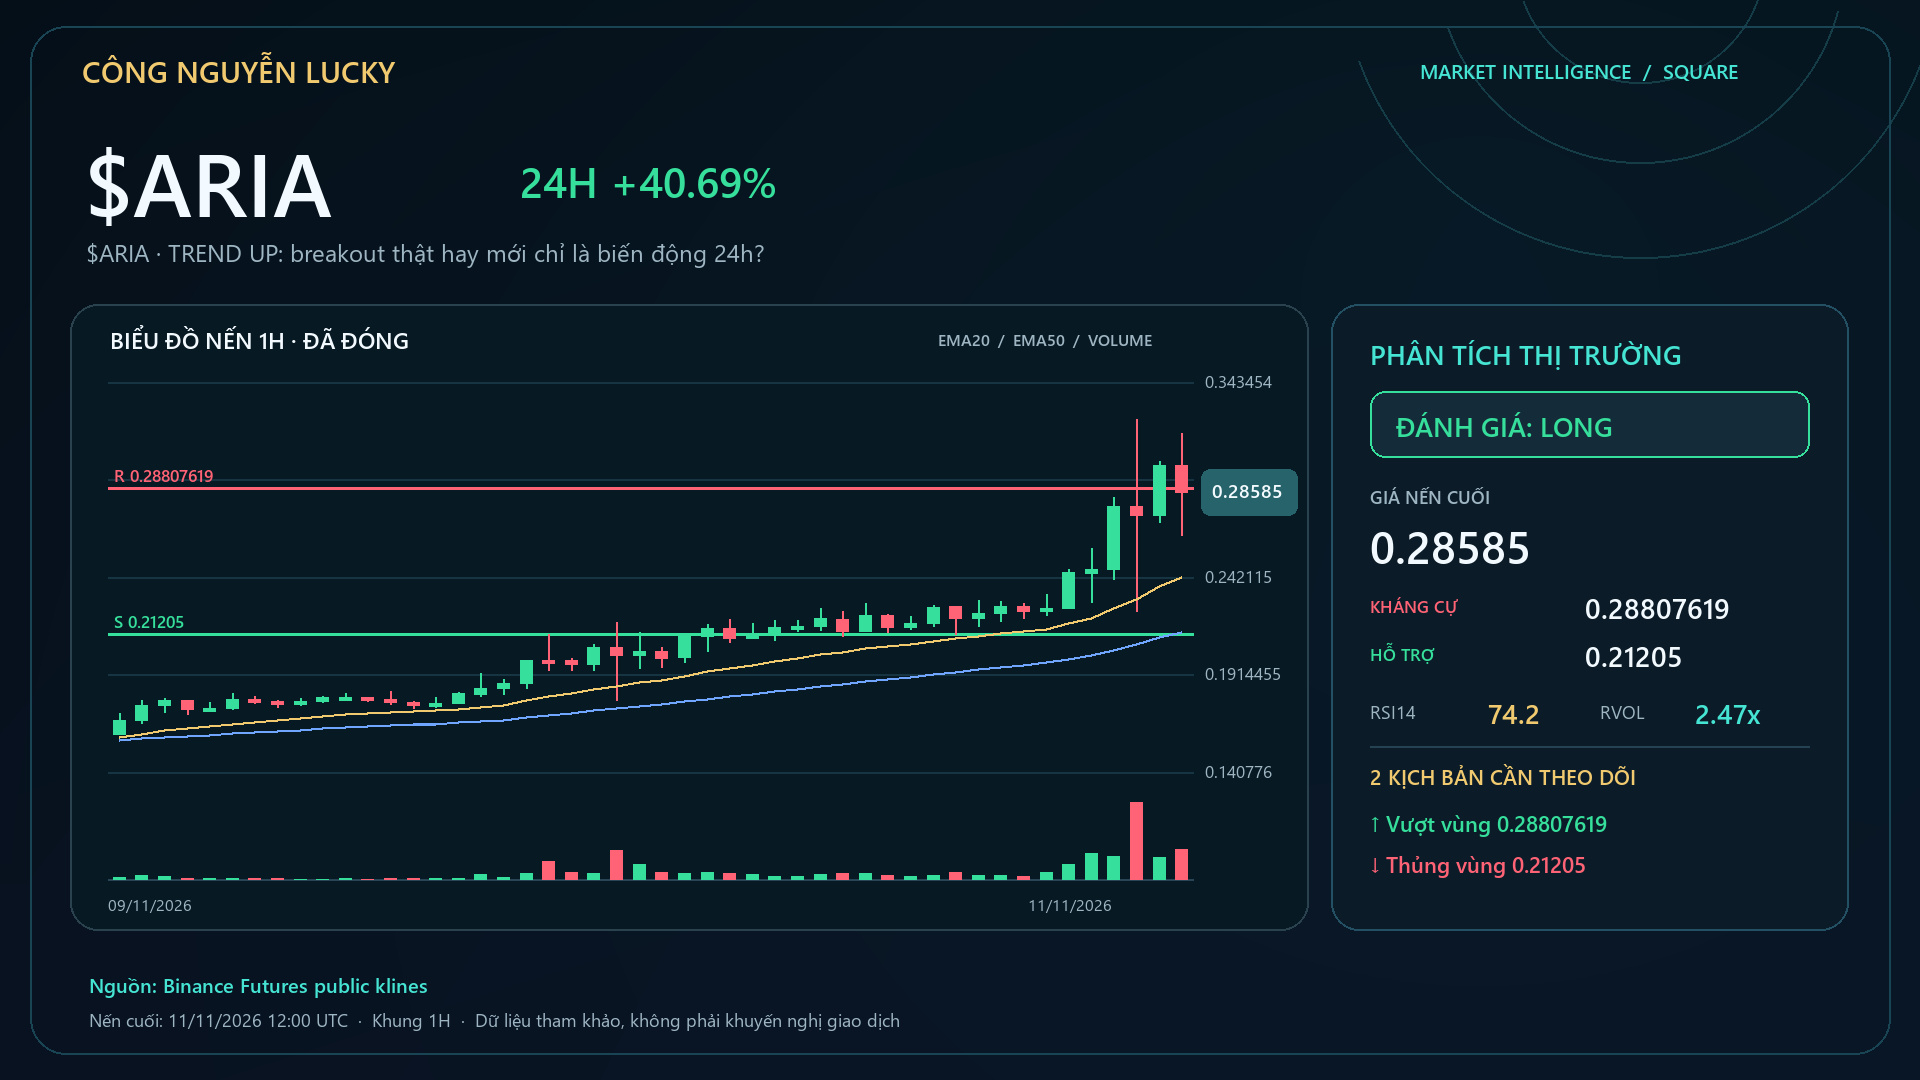
$ARIA · TREND UP: real breakout or just 24h volatility?🔥 $ARIA up +39.58% — but the percentage gain/loss alone isn’t enough to call this a good setup. Snapshot: 0.28518 · 24h +39.58% · volume ~252.8M USDT · 4,240,587 trades. 🟢 Bull/continuation case: A breakout above 0.32384 on expanding volume would make the continuation scenario more credible.
🔴 Bear/cooling case: Failing to hold the highs and falling back below the midpoint at 0.259545 would make the cooling scenario clearer. 🎯 Preferred trend: **LONG · STRONG · 86/100**.
$ARIA · TREND UP: real breakout or just 24h volatility?
🔥 $ARIA up +39.58% — but the percentage gain/loss alone isn’t enough to call this a good setup. Snapshot: 0.28518 · 24h +39.58% · volume ~252.8M USDT · 4,240,587 trades. 🟢 Bull/continuation case: A breakout above 0.32384 on expanding volume would make the continuation scenario more credible.
🔴 Bear/cooling case: Failing to hold the highs and falling back below the midpoint at 0.259545 would make the cooling scenario clearer. 🎯 Preferred trend: **LONG · STRONG · 86/100**.
🔴 Bear/cooling case: Failing to hold the highs and falling back below the midpoint at 0.259545 would make the cooling scenario clearer. 🎯 Preferred trend: **LONG · STRONG · 86/100**.
213
Article
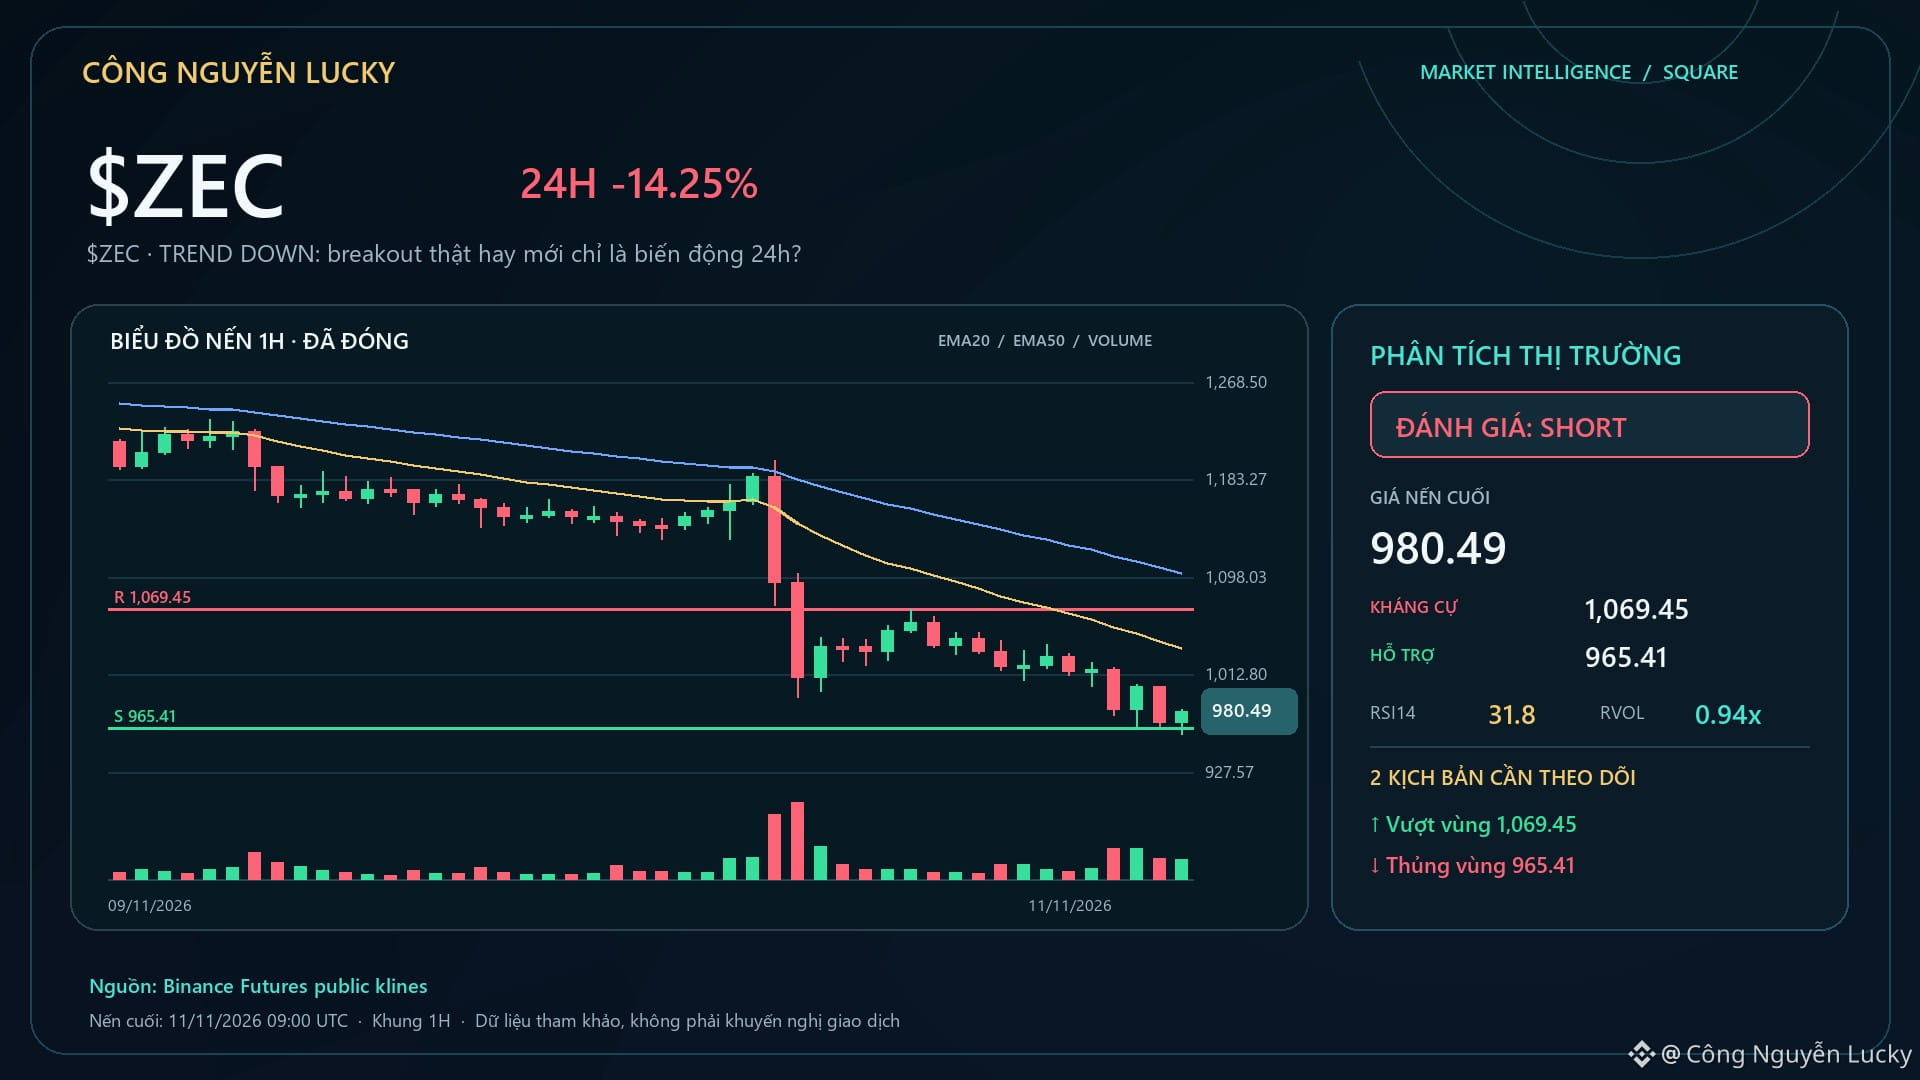
$ZEC · TREND DOWN: real breakout or just 24-hour volatility?$ZEC is hovering around 988.87. Looking only at the current price still leaves out the most important part: what confirms or invalidates the thesis? This is a signal of relative strength versus $BTC, but it still needs to be checked against flows and structure.
Baseline data: 988.87 · 24h -13.76% · volume ~3,156.6M USDT · 8,496,650 trades.
The price is around 12% of the daily range, still about 17.6% below the high. What I want to confirm next:
$ZEC · TREND DOWN: real breakout or just 24-hour volatility?
$ZEC is hovering around 988.87. Looking only at the current price still leaves out the most important part: what confirms or invalidates the thesis? This is a signal of relative strength versus $BTC , but it still needs to be checked against flows and structure.
Baseline data: 988.87 · 24h -13.76% · volume ~3,156.6M USDT · 8,496,650 trades.
The price is around 12% of the daily range, still about 17.6% below the high. What I want to confirm next:
Baseline data: 988.87 · 24h -13.76% · volume ~3,156.6M USDT · 8,496,650 trades.
The price is around 12% of the daily range, still about 17.6% below the high. What I want to confirm next:
441
Article
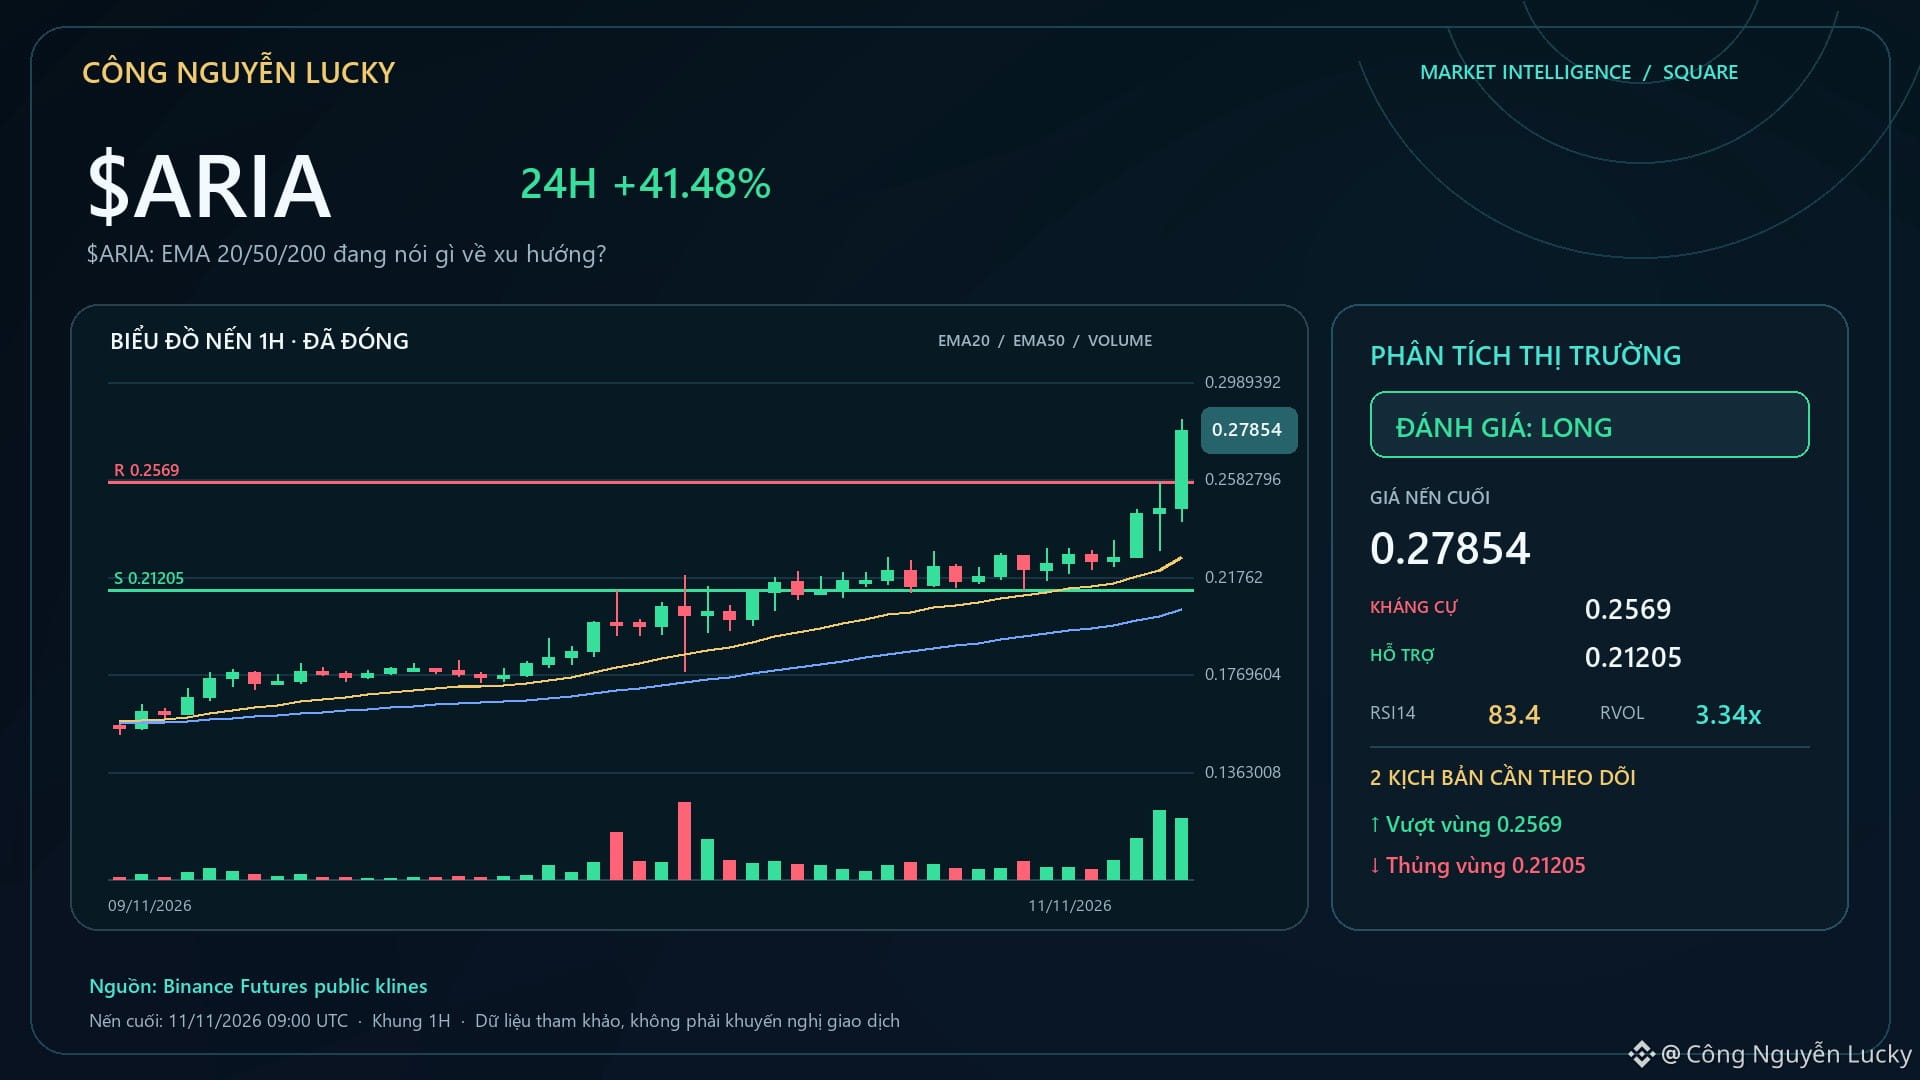
$ARIA: What are the 20/50/200 EMAs saying about the trend?🚨 $ARIA Currently in a BREAKOUT UP state — a genuine breakout or a move likely to be reversed? Market: 0.2583 · 24h +31.81% · volume ~210.2M USDT · 3,374,066 trades.
EMA20 0.22595807 · EMA50 0.20414663 · EMA200 0.15872731.
Structure: HH_HL · RSI14 83.4 · MACD histogram 0.00351239. Technical bias: LONG 99/100. EMA is only a trend filter; I only increase conviction when structure + momentum + money flow all confirm.
Nearby support/resistance: 0.21205 / 0.2569. The technical layers are selected based on the regime:
$ARIA: What are the 20/50/200 EMAs saying about the trend?
🚨 $ARIA Currently in a BREAKOUT UP state — a genuine breakout or a move likely to be reversed? Market: 0.2583 · 24h +31.81% · volume ~210.2M USDT · 3,374,066 trades.
EMA20 0.22595807 · EMA50 0.20414663 · EMA200 0.15872731.
Structure: HH_HL · RSI14 83.4 · MACD histogram 0.00351239. Technical bias: LONG 99/100. EMA is only a trend filter; I only increase conviction when structure + momentum + money flow all confirm.
Nearby support/resistance: 0.21205 / 0.2569. The technical layers are selected based on the regime:
EMA20 0.22595807 · EMA50 0.20414663 · EMA200 0.15872731.
Structure: HH_HL · RSI14 83.4 · MACD histogram 0.00351239. Technical bias: LONG 99/100. EMA is only a trend filter; I only increase conviction when structure + momentum + money flow all confirm.
Nearby support/resistance: 0.21205 / 0.2569. The technical layers are selected based on the regime:
626
Article
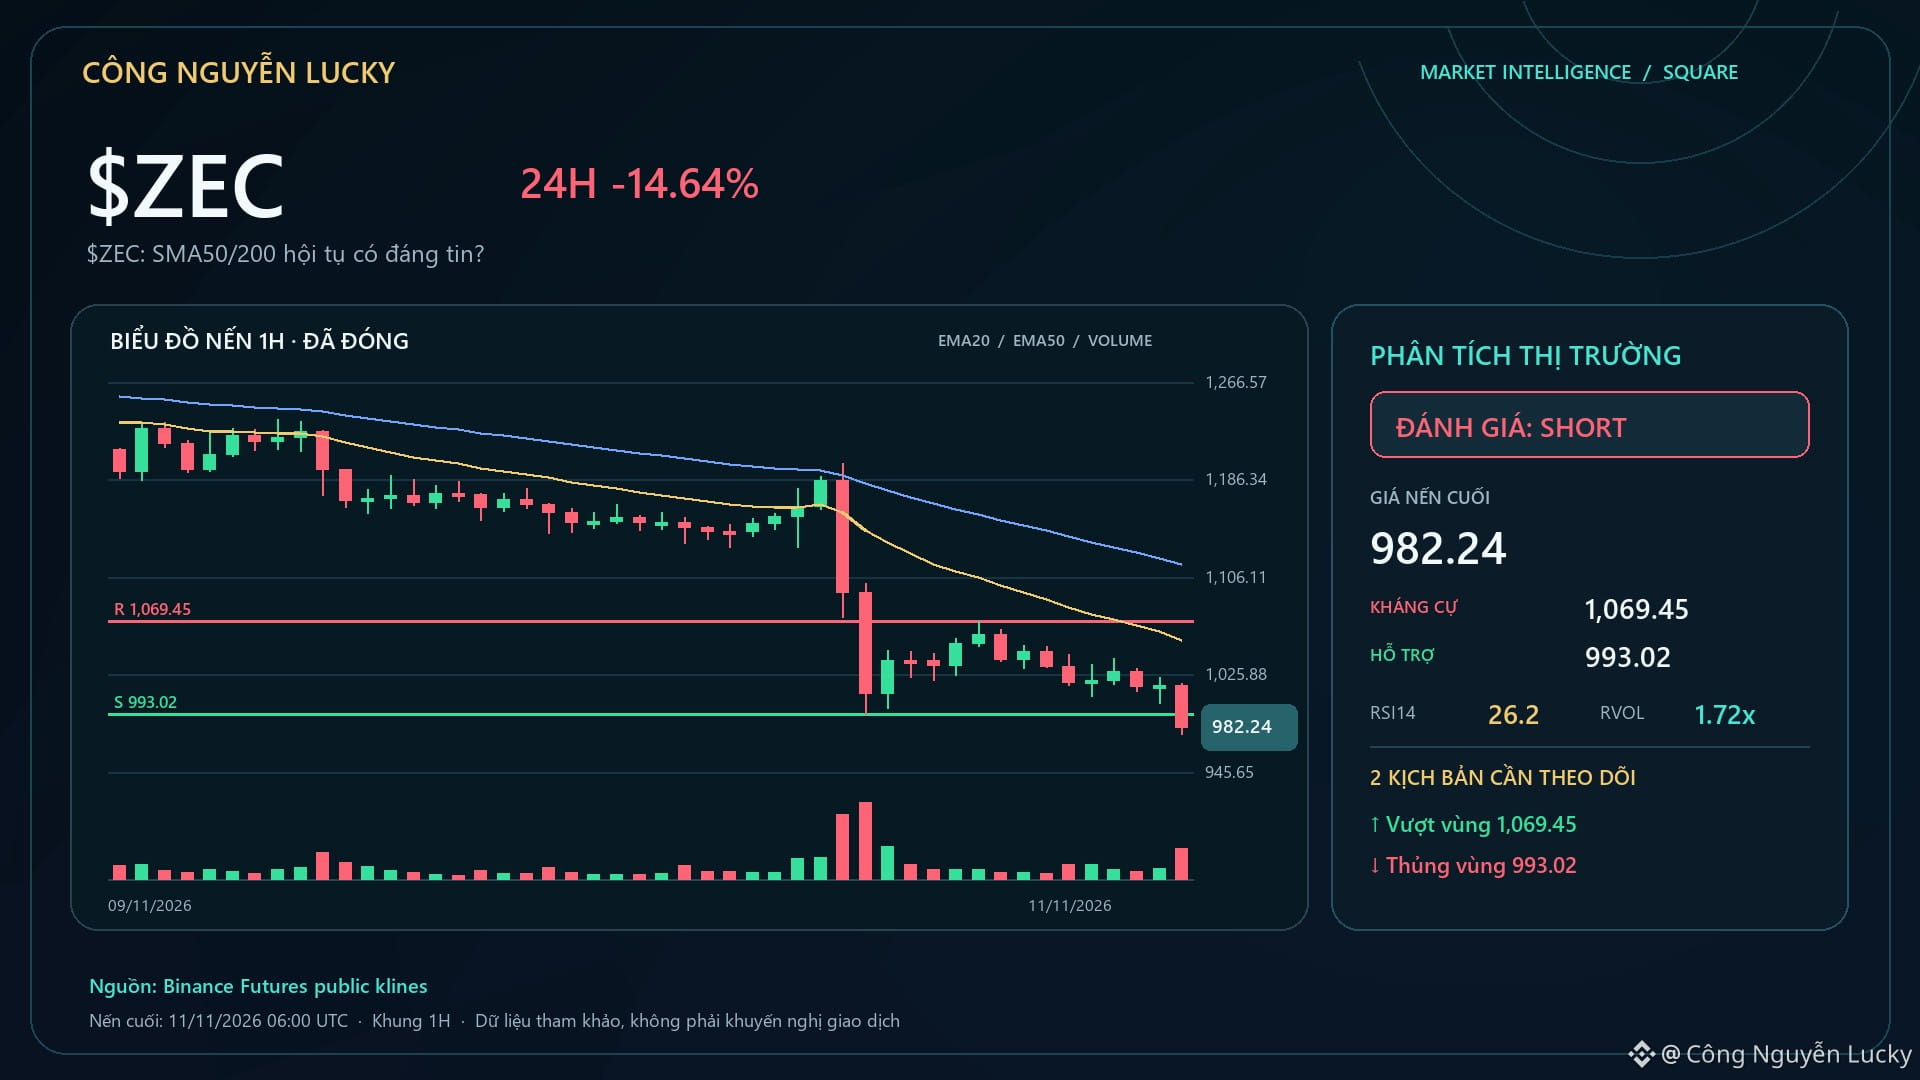
$ZEC: Is SMA50/200 convergence reliable?🚨 $ZEC is in BREAKOUT DOWN mode — a genuine breakout or a breakdown likely to reverse? Market: 991.07 · 24h -14.20% · volume ~2,969.9M USDT · 8,004,043 trades.
SMA50 1,132.14 · SMA200 1,231.31 · EMA20/50 1,053.70/1,116.24.
BREAKDOWN regime · technical bias SHORT 100/100. Confidence increases when structure + momentum align with the MA; if price crosses back through EMA50 and breaks nearby structure at 993.02/1,069.45, don't cling to the Golden/Death Cross labels. Technical layers are being selected according to the regime:
$ZEC: Is SMA50/200 convergence reliable?
🚨 $ZEC is in BREAKOUT DOWN mode — a genuine breakout or a breakdown likely to reverse? Market: 991.07 · 24h -14.20% · volume ~2,969.9M USDT · 8,004,043 trades.
SMA50 1,132.14 · SMA200 1,231.31 · EMA20/50 1,053.70/1,116.24.
BREAKDOWN regime · technical bias SHORT 100/100. Confidence increases when structure + momentum align with the MA; if price crosses back through EMA50 and breaks nearby structure at 993.02/1,069.45, don't cling to the Golden/Death Cross labels. Technical layers are being selected according to the regime:
SMA50 1,132.14 · SMA200 1,231.31 · EMA20/50 1,053.70/1,116.24.
BREAKDOWN regime · technical bias SHORT 100/100. Confidence increases when structure + momentum align with the MA; if price crosses back through EMA50 and breaks nearby structure at 993.02/1,069.45, don't cling to the Golden/Death Cross labels. Technical layers are being selected according to the regime:
492
Article
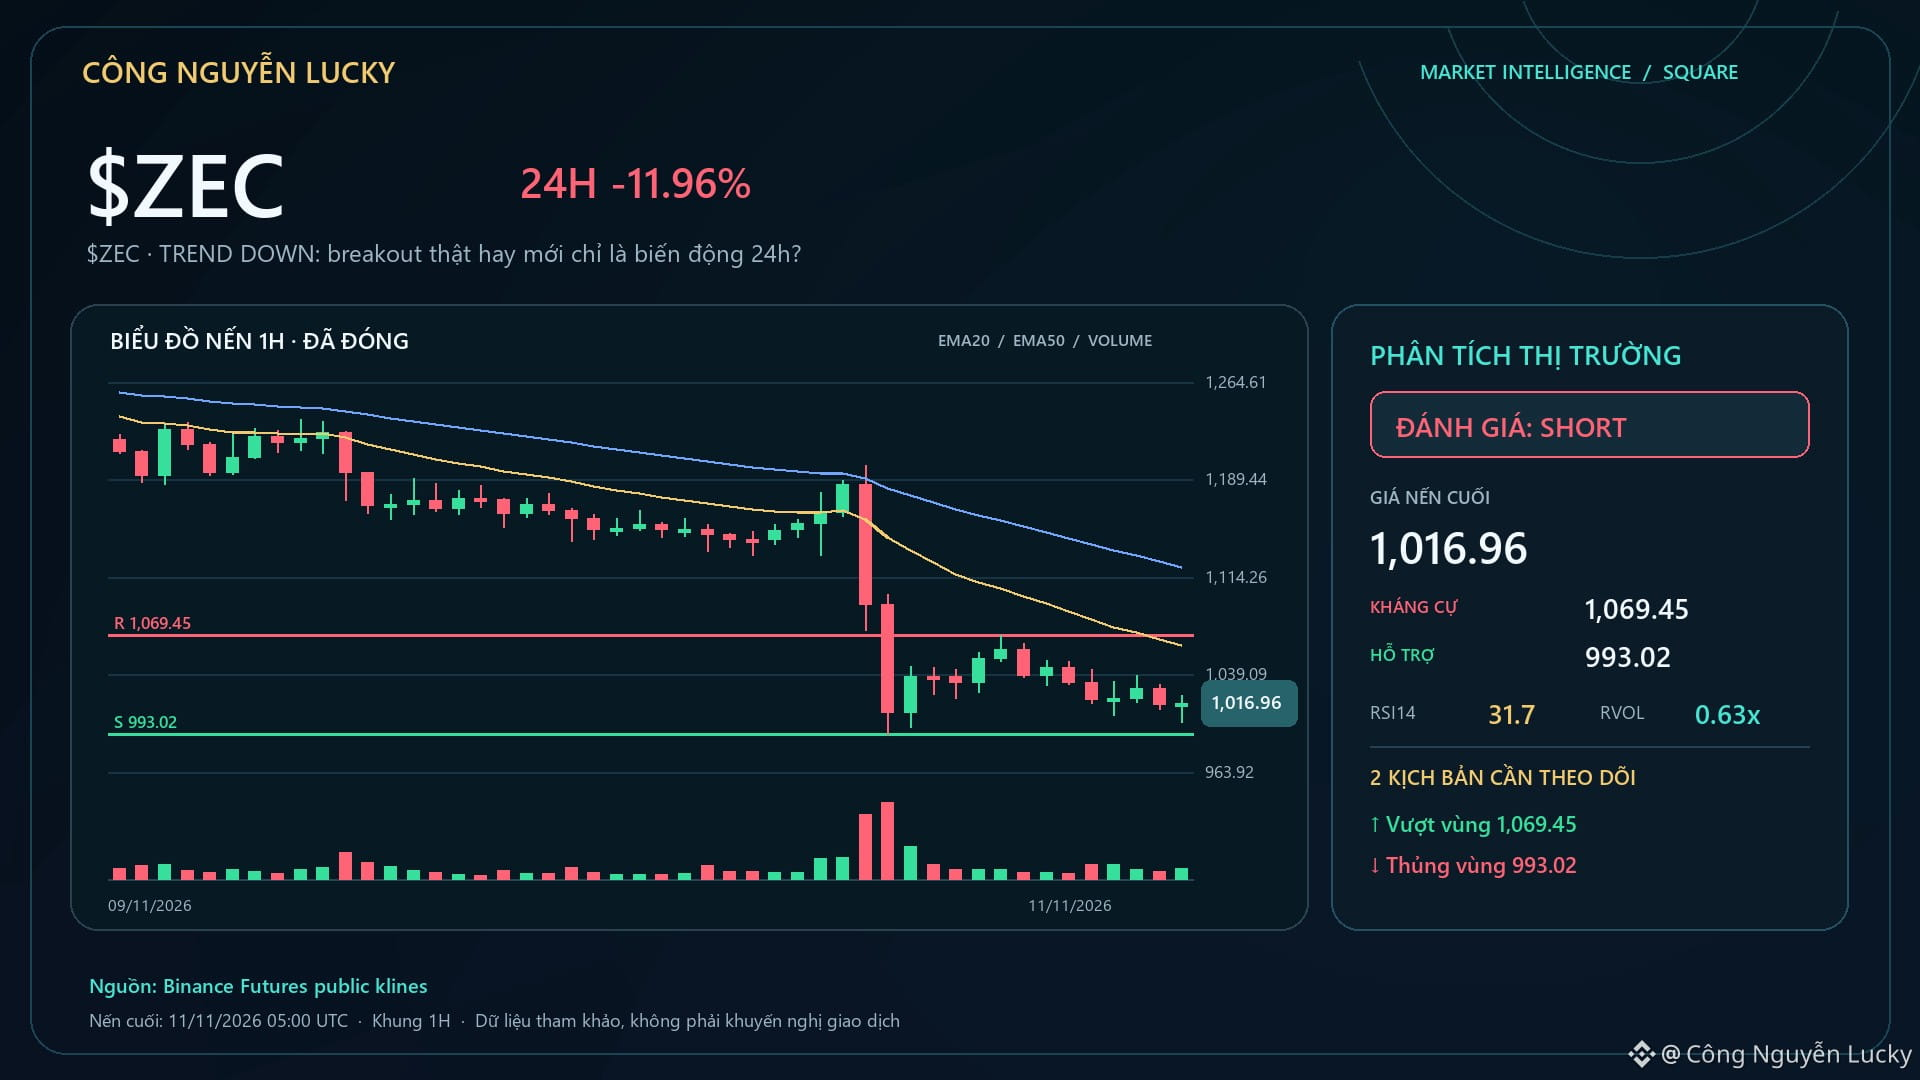
$ZEC · TREND DOWN: a real breakout or just 24-hour volatility?🔥 $ZEC down 12.33% — but the percentage move alone isn’t enough to call this a good setup. Market: 1,006.01 · 24h -12.33% · volume ~2,714.6M USDT · 7,468,835 trades.
Social context: ZEC Praised as Store-of-Value Candidate, Relative Strength and Privacy Narrative Highlighted, KOLs Track $1,375/$1,350 Levels and October-Low Risk, Developers Propose 25-to-20-Second Blocks. Social attention can lead prices, but it can also mean the crowd is getting in late.
$ZEC · TREND DOWN: a real breakout or just 24-hour volatility?
🔥 $ZEC down 12.33% — but the percentage move alone isn’t enough to call this a good setup. Market: 1,006.01 · 24h -12.33% · volume ~2,714.6M USDT · 7,468,835 trades.
Social context: ZEC Praised as Store-of-Value Candidate, Relative Strength and Privacy Narrative Highlighted, KOLs Track $1,375/$1,350 Levels and October-Low Risk, Developers Propose 25-to-20-Second Blocks. Social attention can lead prices, but it can also mean the crowd is getting in late.
Social context: ZEC Praised as Store-of-Value Candidate, Relative Strength and Privacy Narrative Highlighted, KOLs Track $1,375/$1,350 Levels and October-Low Risk, Developers Propose 25-to-20-Second Blocks. Social attention can lead prices, but it can also mean the crowd is getting in late.
661
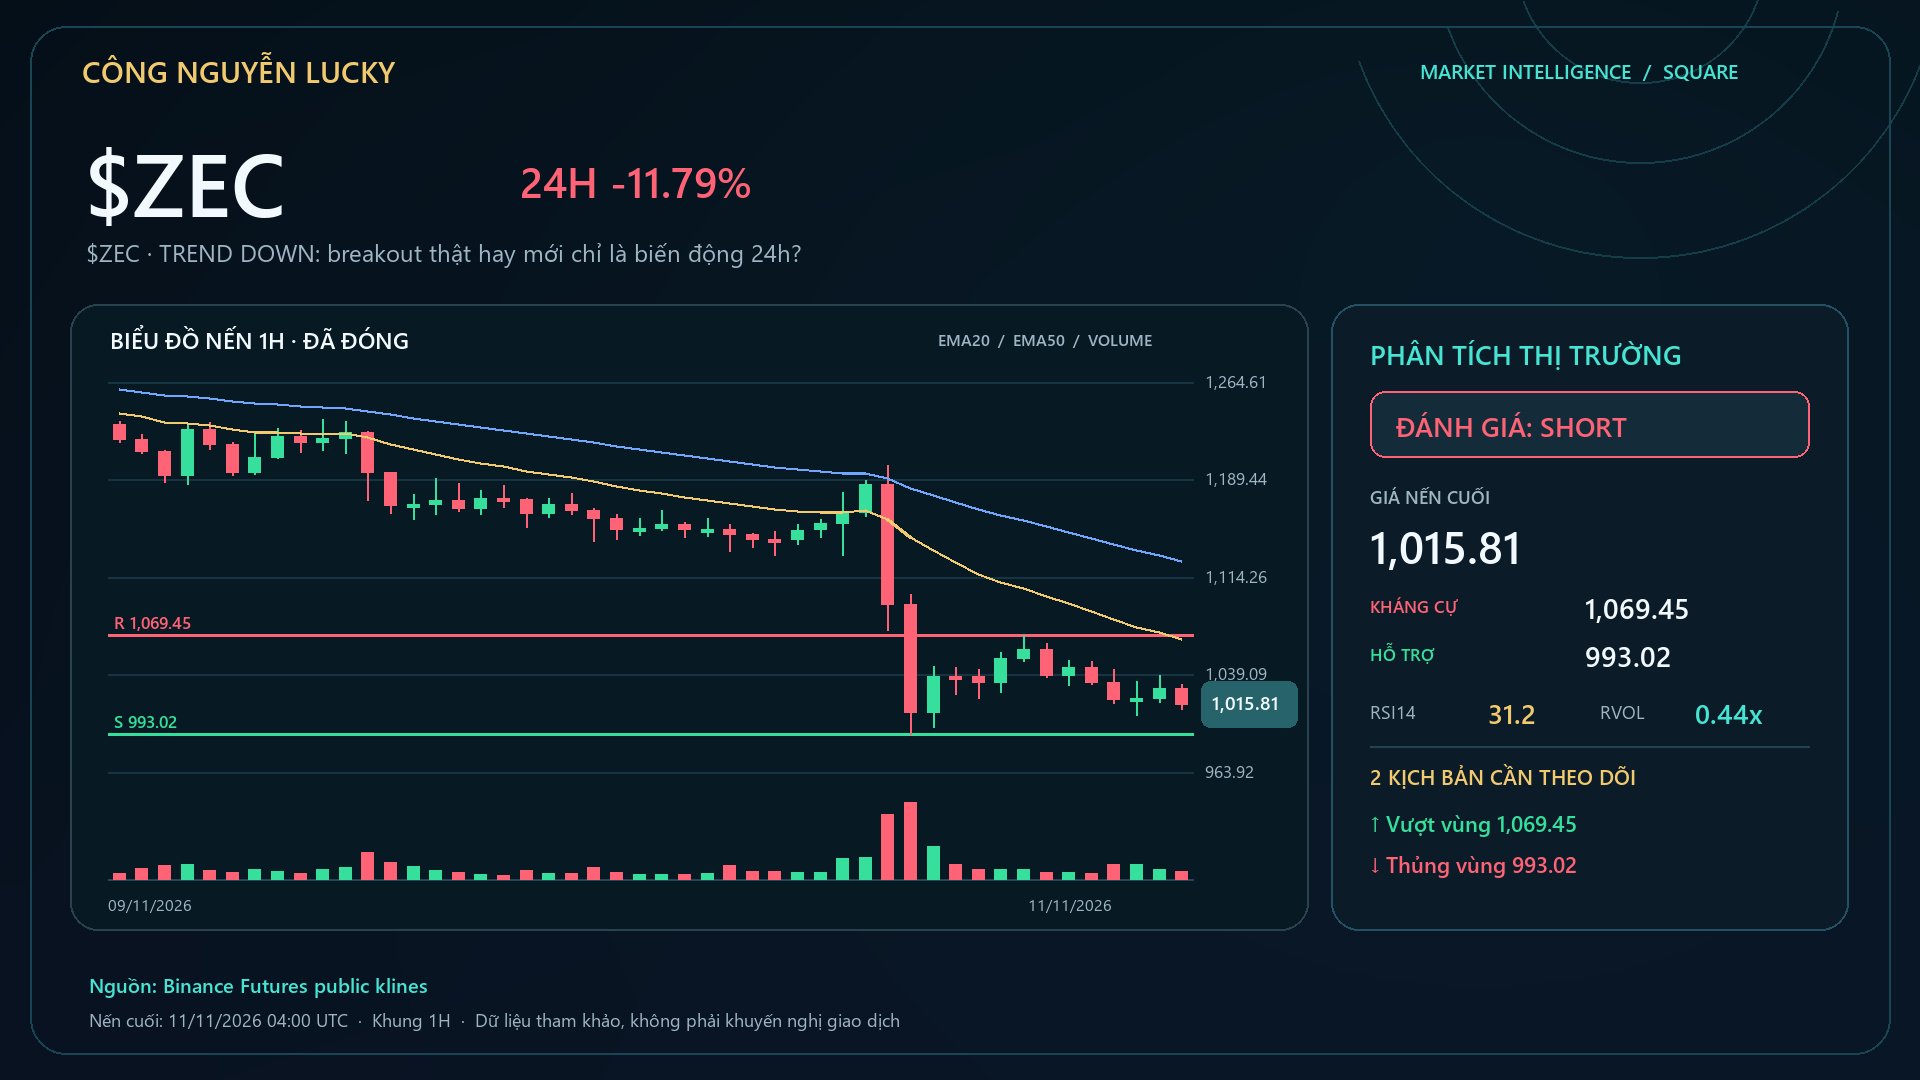
$ZEC added to her watchlist because the data is changing, not because she wants to force a signal. • 1,016.17 · 24h -12.37% · volume ~2,702.2M USDT · 7,424,353 trades. The condition to increase conviction: breaking 993.02 with expanding volume will make the bearish continuation scenario more credible.
What makes her ignore it: failing to hold the lower area and reclaim the midpoint 1,096.47 will weaken the downward pressure. 📌 LONG/SHORT view: **SHORT · STRONG · 87/100**.
Main basis: 24h price -12.37%; price is at 11/100 within the 24h range; weaker than BTC by -10.99 percentage points.
Further confirmation when: loses 1,096.47 then breaks 993.02 with sustained selling pressure.
Lower/cancel the bias if: it reclaims 1,096.47 and money flow shifts to buying. 📌 If you're following $ZEC, open the cashtag to check the price, liquidity, and current market context for yourself before deciding. 🔎 **Evidence check — SHORT 87/100**
• 1H: TREND DOWN; RSI14 31.2; confluence 100/100.
• Notable technicals: LH-LL structure; EMA 20/50/200 stacked bearish.
• 1H and 4H are moving in the same direction.
• Price 1,016.17; 24h -12.37%; volume 2.7B. 🧭 **Levels to watch:** Support 993.02 · resistance 1,069.45 · confirmation: loses 1,096.47 then breaks 993.02 with sustained selling pressure · invalidation: reclaims 1,096.47 and money flow shifts to buying Source cross-check: Binance Futures Market + Binance Web3 Trending + Binance Social Hype + Binance Klines / Technical · snapshot 2026-11-11 05:44:34 UTC
💬 **Discussion point:** Which confirmation are you waiting for with $ZEC: a clear break of resistance or a retest that holds the area before following?
Follow to see the next update when $ZEC confirms or loses one of the current key levels.
⚠️ Market analysis is for reference only, not a promise of profit. Do your own research (DYOR), manage your own risk, and take responsibility for your trading decisions. $ZEC $BTC
$ZEC added to her watchlist because the data is changing, not because she wants to force a signal. • 1,016.17 · 24h -12.37% · volume ~2,702.2M USDT · 7,424,353 trades. The condition to increase conviction: breaking 993.02 with expanding volume will make the bearish continuation scenario more credible.
What makes her ignore it: failing to hold the lower area and reclaim the midpoint 1,096.47 will weaken the downward pressure. 📌 LONG/SHORT view: **SHORT · STRONG · 87/100**.
Main basis: 24h price -12.37%; price is at 11/100 within the 24h range; weaker than BTC by -10.99 percentage points.
Further confirmation when: loses 1,096.47 then breaks 993.02 with sustained selling pressure.
Lower/cancel the bias if: it reclaims 1,096.47 and money flow shifts to buying. 📌 If you're following $ZEC , open the cashtag to check the price, liquidity, and current market context for yourself before deciding. 🔎 **Evidence check — SHORT 87/100**
• 1H: TREND DOWN; RSI14 31.2; confluence 100/100.
• Notable technicals: LH-LL structure; EMA 20/50/200 stacked bearish.
• 1H and 4H are moving in the same direction.
• Price 1,016.17; 24h -12.37%; volume 2.7B. 🧭 **Levels to watch:** Support 993.02 · resistance 1,069.45 · confirmation: loses 1,096.47 then breaks 993.02 with sustained selling pressure · invalidation: reclaims 1,096.47 and money flow shifts to buying Source cross-check: Binance Futures Market + Binance Web3 Trending + Binance Social Hype + Binance Klines / Technical · snapshot 2026-11-11 05:44:34 UTC
💬 **Discussion point:** Which confirmation are you waiting for with $ZEC : a clear break of resistance or a retest that holds the area before following?
Follow to see the next update when $ZEC confirms or loses one of the current key levels.
⚠️ Market analysis is for reference only, not a promise of profit. Do your own research (DYOR), manage your own risk, and take responsibility for your trading decisions. $ZEC $BTC
What makes her ignore it: failing to hold the lower area and reclaim the midpoint 1,096.47 will weaken the downward pressure. 📌 LONG/SHORT view: **SHORT · STRONG · 87/100**.
Main basis: 24h price -12.37%; price is at 11/100 within the 24h range; weaker than BTC by -10.99 percentage points.
Further confirmation when: loses 1,096.47 then breaks 993.02 with sustained selling pressure.
Lower/cancel the bias if: it reclaims 1,096.47 and money flow shifts to buying. 📌 If you're following $ZEC , open the cashtag to check the price, liquidity, and current market context for yourself before deciding. 🔎 **Evidence check — SHORT 87/100**
• 1H: TREND DOWN; RSI14 31.2; confluence 100/100.
• Notable technicals: LH-LL structure; EMA 20/50/200 stacked bearish.
• 1H and 4H are moving in the same direction.
• Price 1,016.17; 24h -12.37%; volume 2.7B. 🧭 **Levels to watch:** Support 993.02 · resistance 1,069.45 · confirmation: loses 1,096.47 then breaks 993.02 with sustained selling pressure · invalidation: reclaims 1,096.47 and money flow shifts to buying Source cross-check: Binance Futures Market + Binance Web3 Trending + Binance Social Hype + Binance Klines / Technical · snapshot 2026-11-11 05:44:34 UTC
💬 **Discussion point:** Which confirmation are you waiting for with $ZEC : a clear break of resistance or a retest that holds the area before following?
Follow to see the next update when $ZEC confirms or loses one of the current key levels.
⚠️ Market analysis is for reference only, not a promise of profit. Do your own research (DYOR), manage your own risk, and take responsibility for your trading decisions. $ZEC $BTC
764
Article
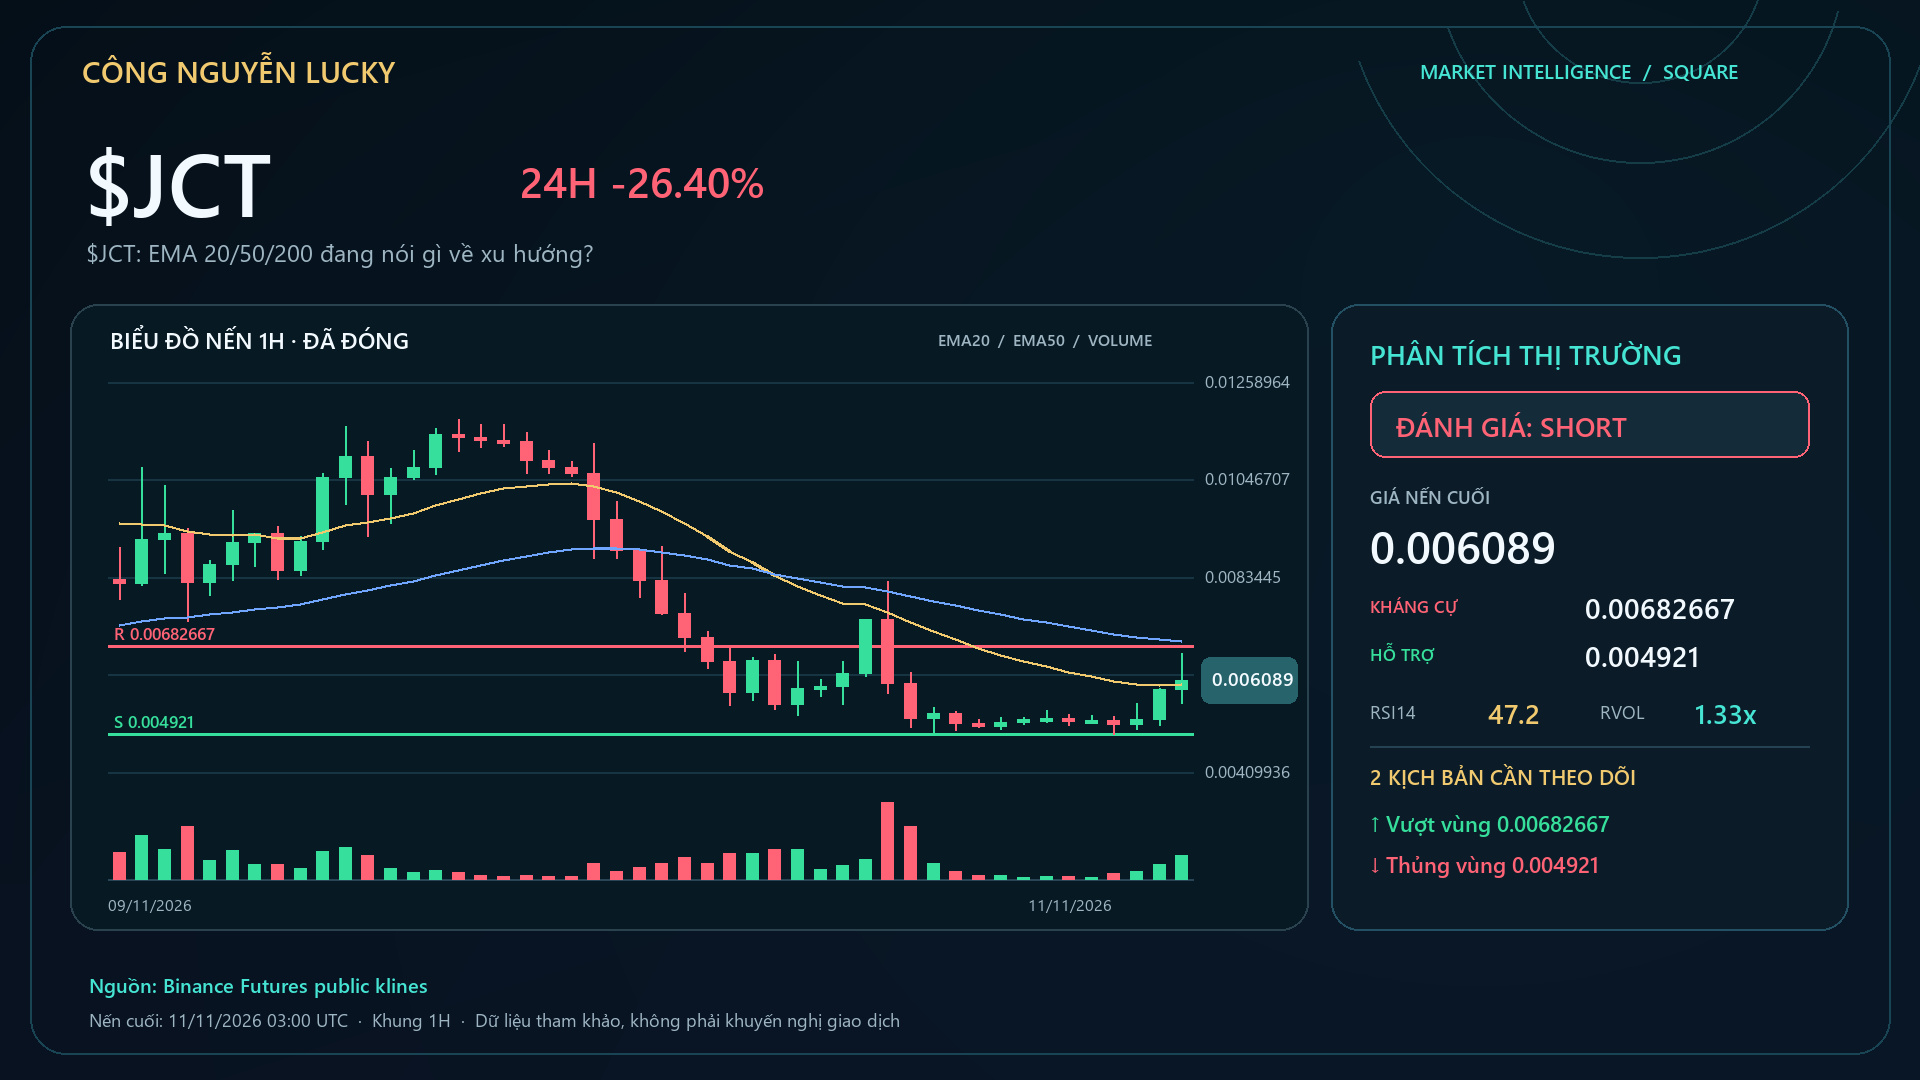
$JCT: What are the 20/50/200 EMAs saying about the trend?🔥 $JCT down -23.47% — but the percentage change alone isn't enough to call this a good setup. Market: 0.005994 · 24h -23.47% · volume ~566.9M USDT · 8,997,375 trades.
EMA20 0.00599648 · EMA50 0.00694748 · EMA200 0.00575407.
Structure: LH_LL · RSI14 47.2 · MACD histogram 0.000193572. Technical bias: NEUTRAL 63/100. EMA is only a trend filter; I only increase conviction when structure + momentum + money flow all confirm.
Nearby support/resistance: 0.004921 / 0.00682667. Technical layers are selected according to the regime:
$JCT: What are the 20/50/200 EMAs saying about the trend?
🔥 $JCT down -23.47% — but the percentage change alone isn't enough to call this a good setup. Market: 0.005994 · 24h -23.47% · volume ~566.9M USDT · 8,997,375 trades.
EMA20 0.00599648 · EMA50 0.00694748 · EMA200 0.00575407.
Structure: LH_LL · RSI14 47.2 · MACD histogram 0.000193572. Technical bias: NEUTRAL 63/100. EMA is only a trend filter; I only increase conviction when structure + momentum + money flow all confirm.
Nearby support/resistance: 0.004921 / 0.00682667. Technical layers are selected according to the regime:
EMA20 0.00599648 · EMA50 0.00694748 · EMA200 0.00575407.
Structure: LH_LL · RSI14 47.2 · MACD histogram 0.000193572. Technical bias: NEUTRAL 63/100. EMA is only a trend filter; I only increase conviction when structure + momentum + money flow all confirm.
Nearby support/resistance: 0.004921 / 0.00682667. Technical layers are selected according to the regime:
421
Article
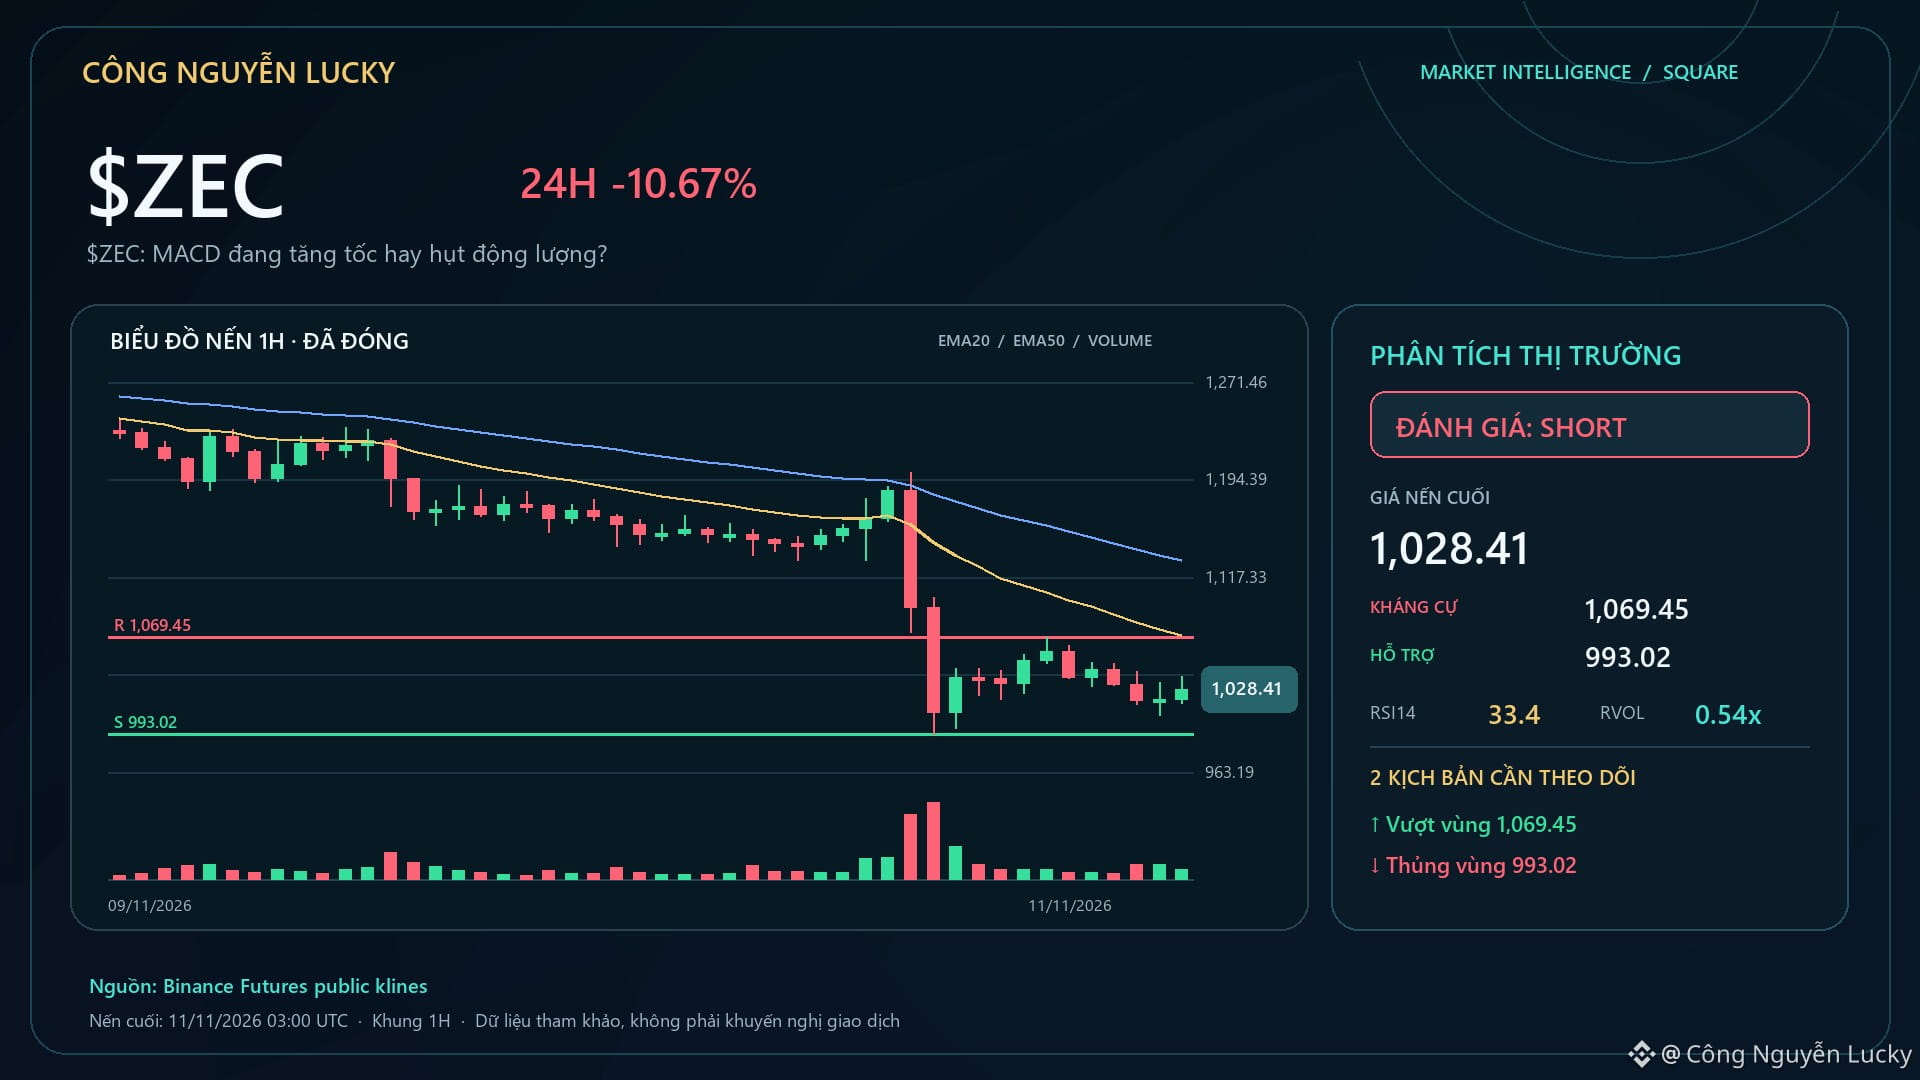
$ZEC: Is MACD accelerating or losing momentum?🔥 $ZEC is down 10.86% — but a percentage gain/loss alone isn't enough to call this a good setup. Market: 1,027.02 · 24h -10.86% · volume ~2,652.1M USDT · 7,341,094 trades.
MACD -37.7831 · signal -36.125 · histogram -1.65811.
EMA/structure currently shows a SHORT bias of 100/100. Confirm continuation when momentum aligns with the structure and price breaks above 993.02.
If the histogram weakens while price makes new extremes, the risk of divergence/mean reversion increases. The technical layers are selected according to the regime:
$ZEC: Is MACD accelerating or losing momentum?
🔥 $ZEC is down 10.86% — but a percentage gain/loss alone isn't enough to call this a good setup. Market: 1,027.02 · 24h -10.86% · volume ~2,652.1M USDT · 7,341,094 trades.
MACD -37.7831 · signal -36.125 · histogram -1.65811.
EMA/structure currently shows a SHORT bias of 100/100. Confirm continuation when momentum aligns with the structure and price breaks above 993.02.
If the histogram weakens while price makes new extremes, the risk of divergence/mean reversion increases. The technical layers are selected according to the regime:
MACD -37.7831 · signal -36.125 · histogram -1.65811.
EMA/structure currently shows a SHORT bias of 100/100. Confirm continuation when momentum aligns with the structure and price breaks above 993.02.
If the histogram weakens while price makes new extremes, the risk of divergence/mean reversion increases. The technical layers are selected according to the regime:
643
Article
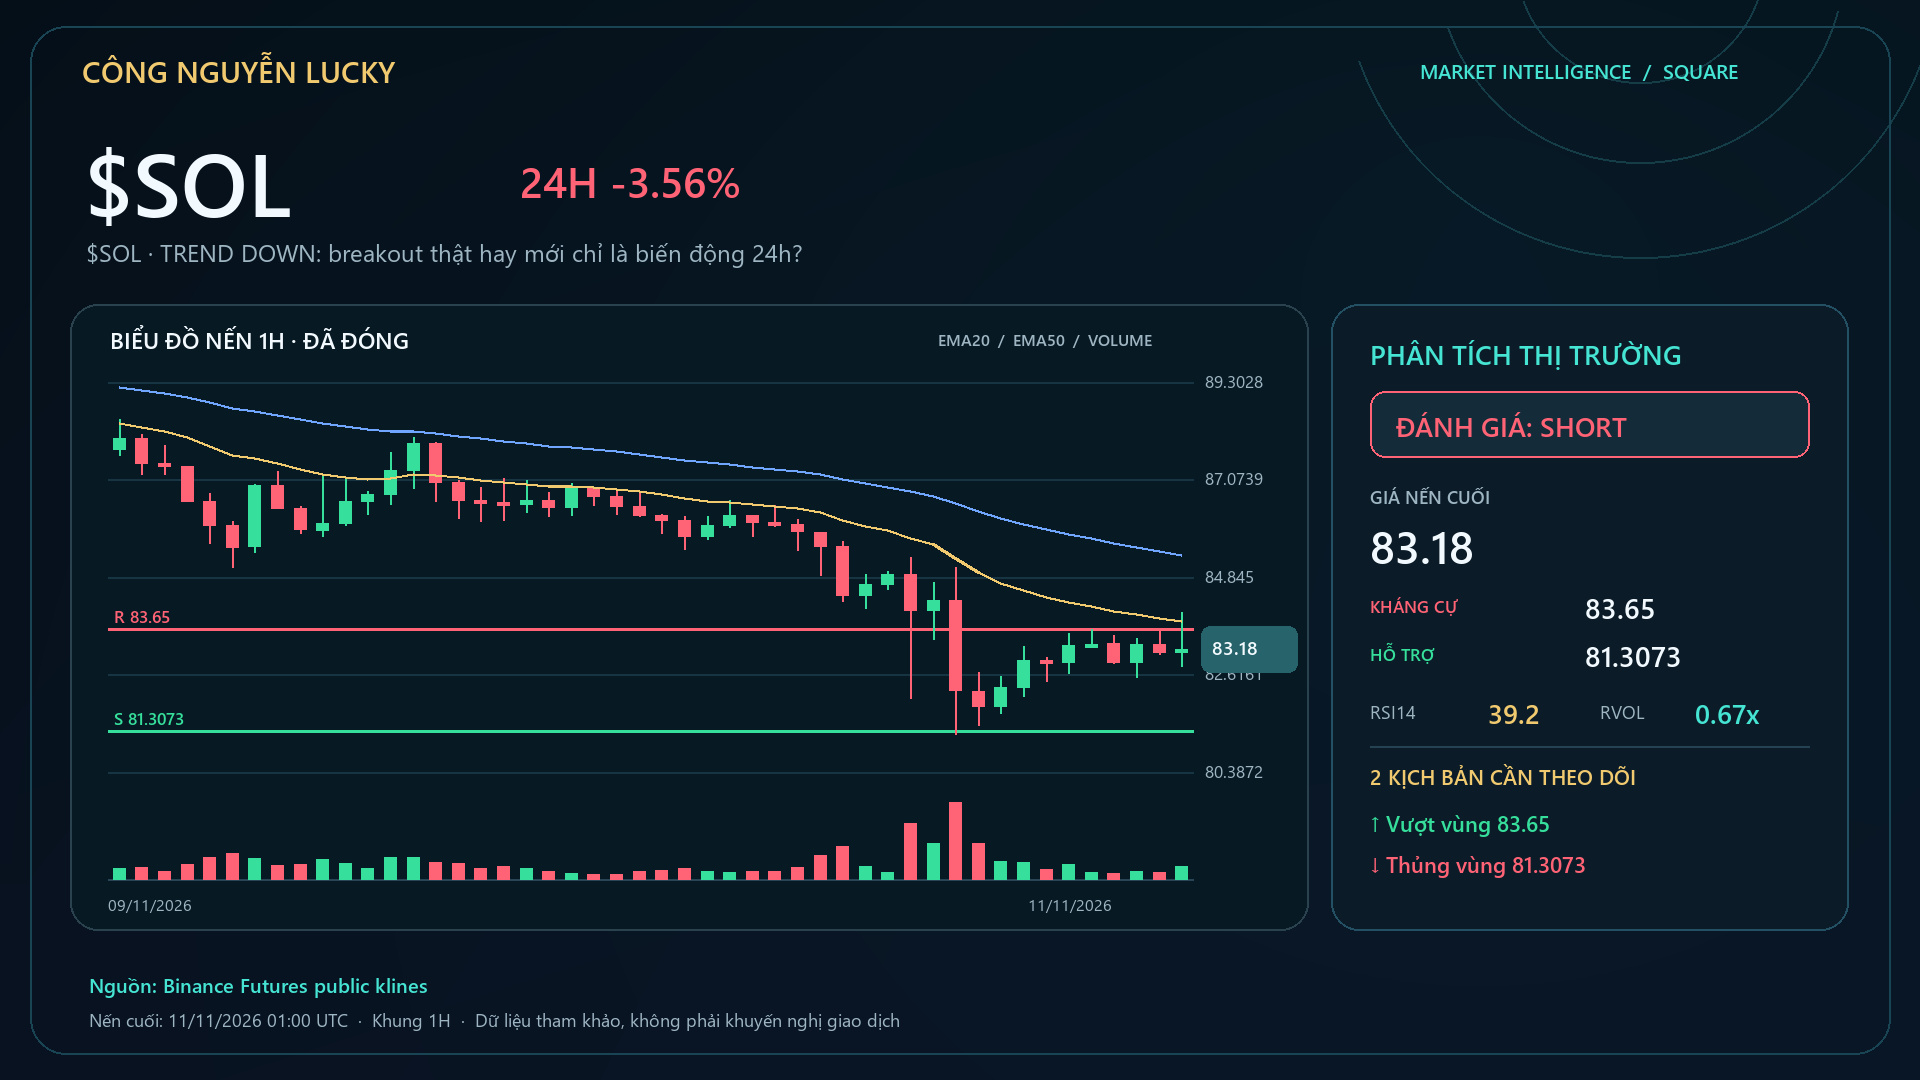
$SOL · TREND DOWN: a real breakout or just 24h volatility?🔎 \u003cc-7/\u003e currently -3.51%; OI at -0.61% is the data I want to see before chasing the price. Market: 82.95 · 24h -3.51% · volume ~1,739.5M USDT · 1,991,437 trades. When price moves in one direction but aggressive order flow moves in the other, that is often more noteworthy than the percentage change itself.
Watch: A break below 81.25 with expanding volume would make the continuation-of-downside scenario more credible.
Caution: Failing to hold the lower area and reclaim the midpoint at 83.92 will weaken downward pressure. 📌 LONG/SHORT view: **SHORT · MEDIUM · 71/100**.
$SOL · TREND DOWN: a real breakout or just 24h volatility?
🔎 \u003cc-7/\u003e currently -3.51%; OI at -0.61% is the data I want to see before chasing the price. Market: 82.95 · 24h -3.51% · volume ~1,739.5M USDT · 1,991,437 trades. When price moves in one direction but aggressive order flow moves in the other, that is often more noteworthy than the percentage change itself.
Watch: A break below 81.25 with expanding volume would make the continuation-of-downside scenario more credible.
Caution: Failing to hold the lower area and reclaim the midpoint at 83.92 will weaken downward pressure. 📌 LONG/SHORT view: **SHORT · MEDIUM · 71/100**.
Watch: A break below 81.25 with expanding volume would make the continuation-of-downside scenario more credible.
Caution: Failing to hold the lower area and reclaim the midpoint at 83.92 will weaken downward pressure. 📌 LONG/SHORT view: **SHORT · MEDIUM · 71/100**.
243
Article
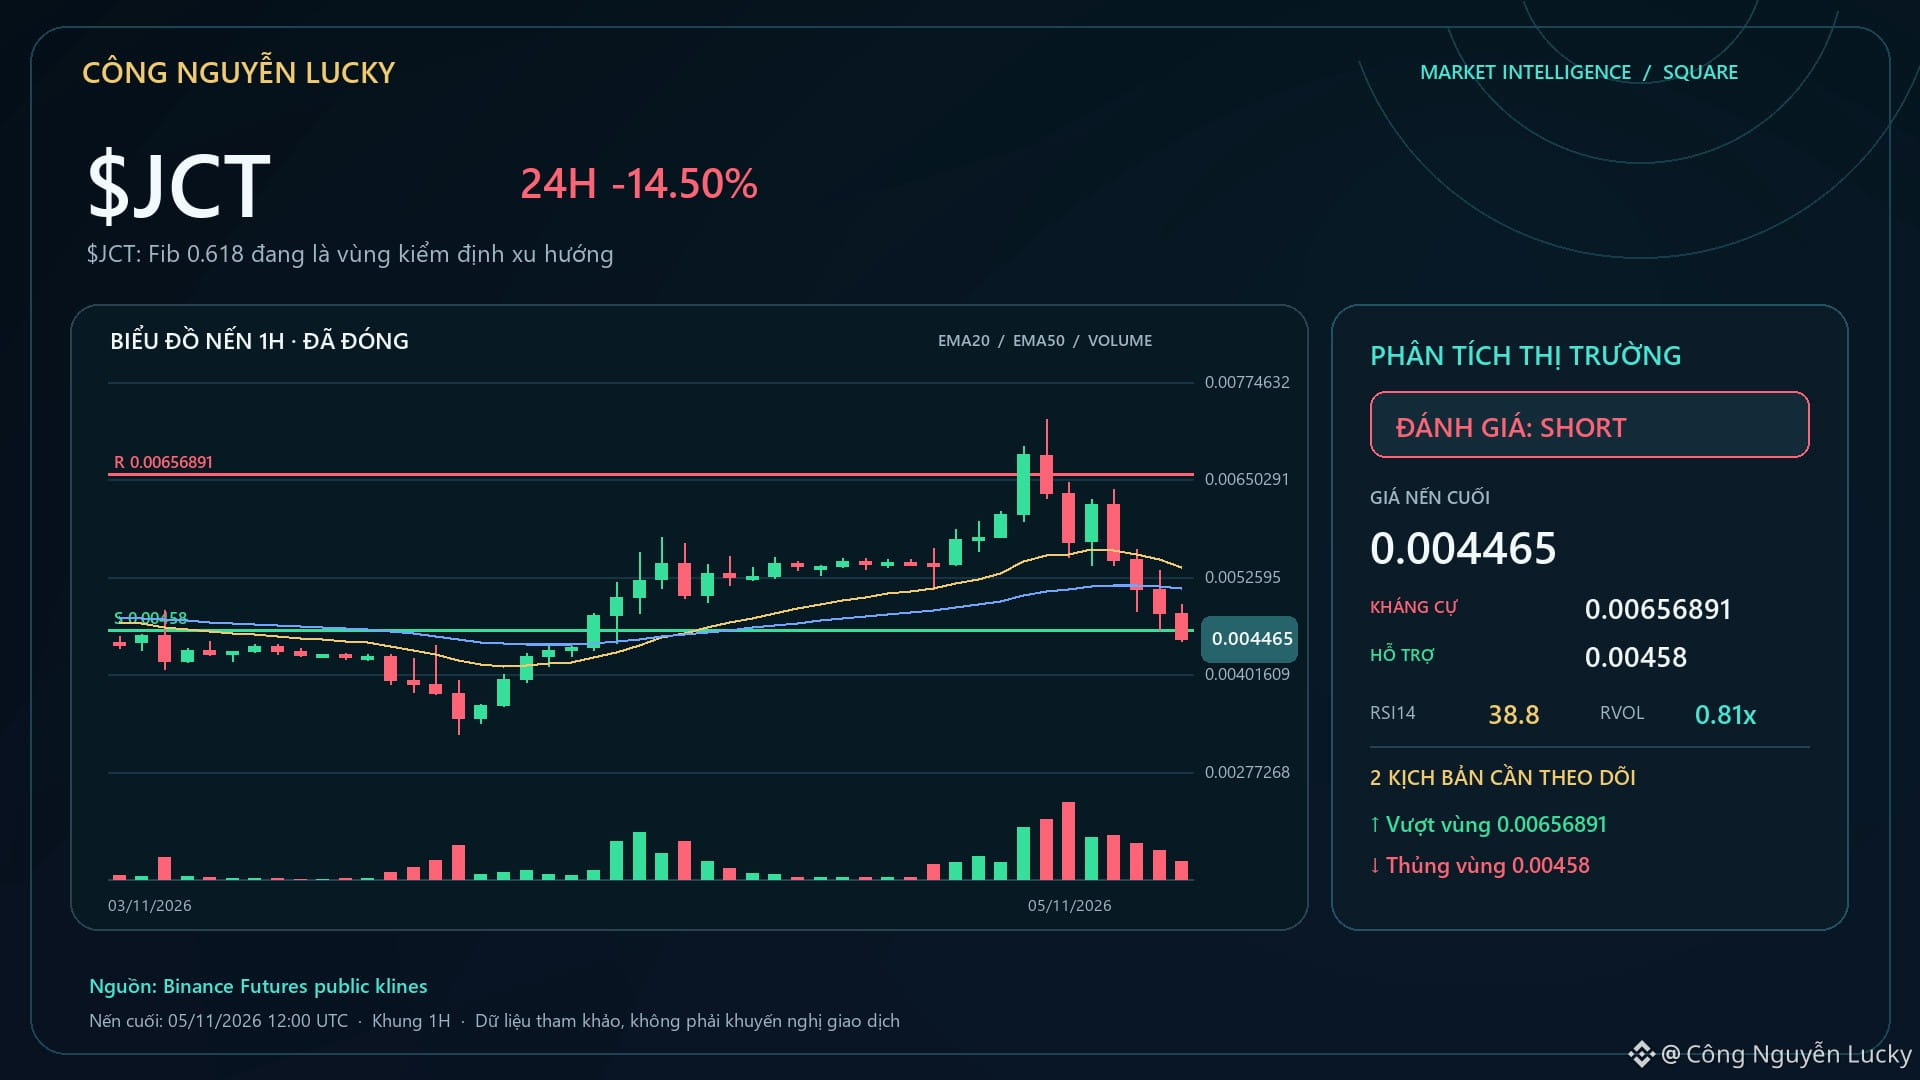
$JCT: Fib 0.618 is currently a trend-testing zone🔥 $JCT is down 21.01% — but percentage gains/losses aren't enough to call this a good setup. Market: 0.004236 · 24h -21.01% · volume ~354.9M USDT · 4,354,867 trades.
Technical context: MIXED · SHORT bias 68/100.
Golden zone 0.50–0.618: 0.0047862–0.0052595. Confirmation point: price reacts in the expected direction at the Fib zone and maintains the primary structure/EMA.
Invalidation point: breaks 0.00656891 with momentum moving against the bias. Technical layers are being selected according to the regime:
$JCT: Fib 0.618 is currently a trend-testing zone
🔥 $JCT is down 21.01% — but percentage gains/losses aren't enough to call this a good setup. Market: 0.004236 · 24h -21.01% · volume ~354.9M USDT · 4,354,867 trades.
Technical context: MIXED · SHORT bias 68/100.
Golden zone 0.50–0.618: 0.0047862–0.0052595. Confirmation point: price reacts in the expected direction at the Fib zone and maintains the primary structure/EMA.
Invalidation point: breaks 0.00656891 with momentum moving against the bias. Technical layers are being selected according to the regime:
Technical context: MIXED · SHORT bias 68/100.
Golden zone 0.50–0.618: 0.0047862–0.0052595. Confirmation point: price reacts in the expected direction at the Fib zone and maintains the primary structure/EMA.
Invalidation point: breaks 0.00656891 with momentum moving against the bias. Technical layers are being selected according to the regime:
1
550
Article
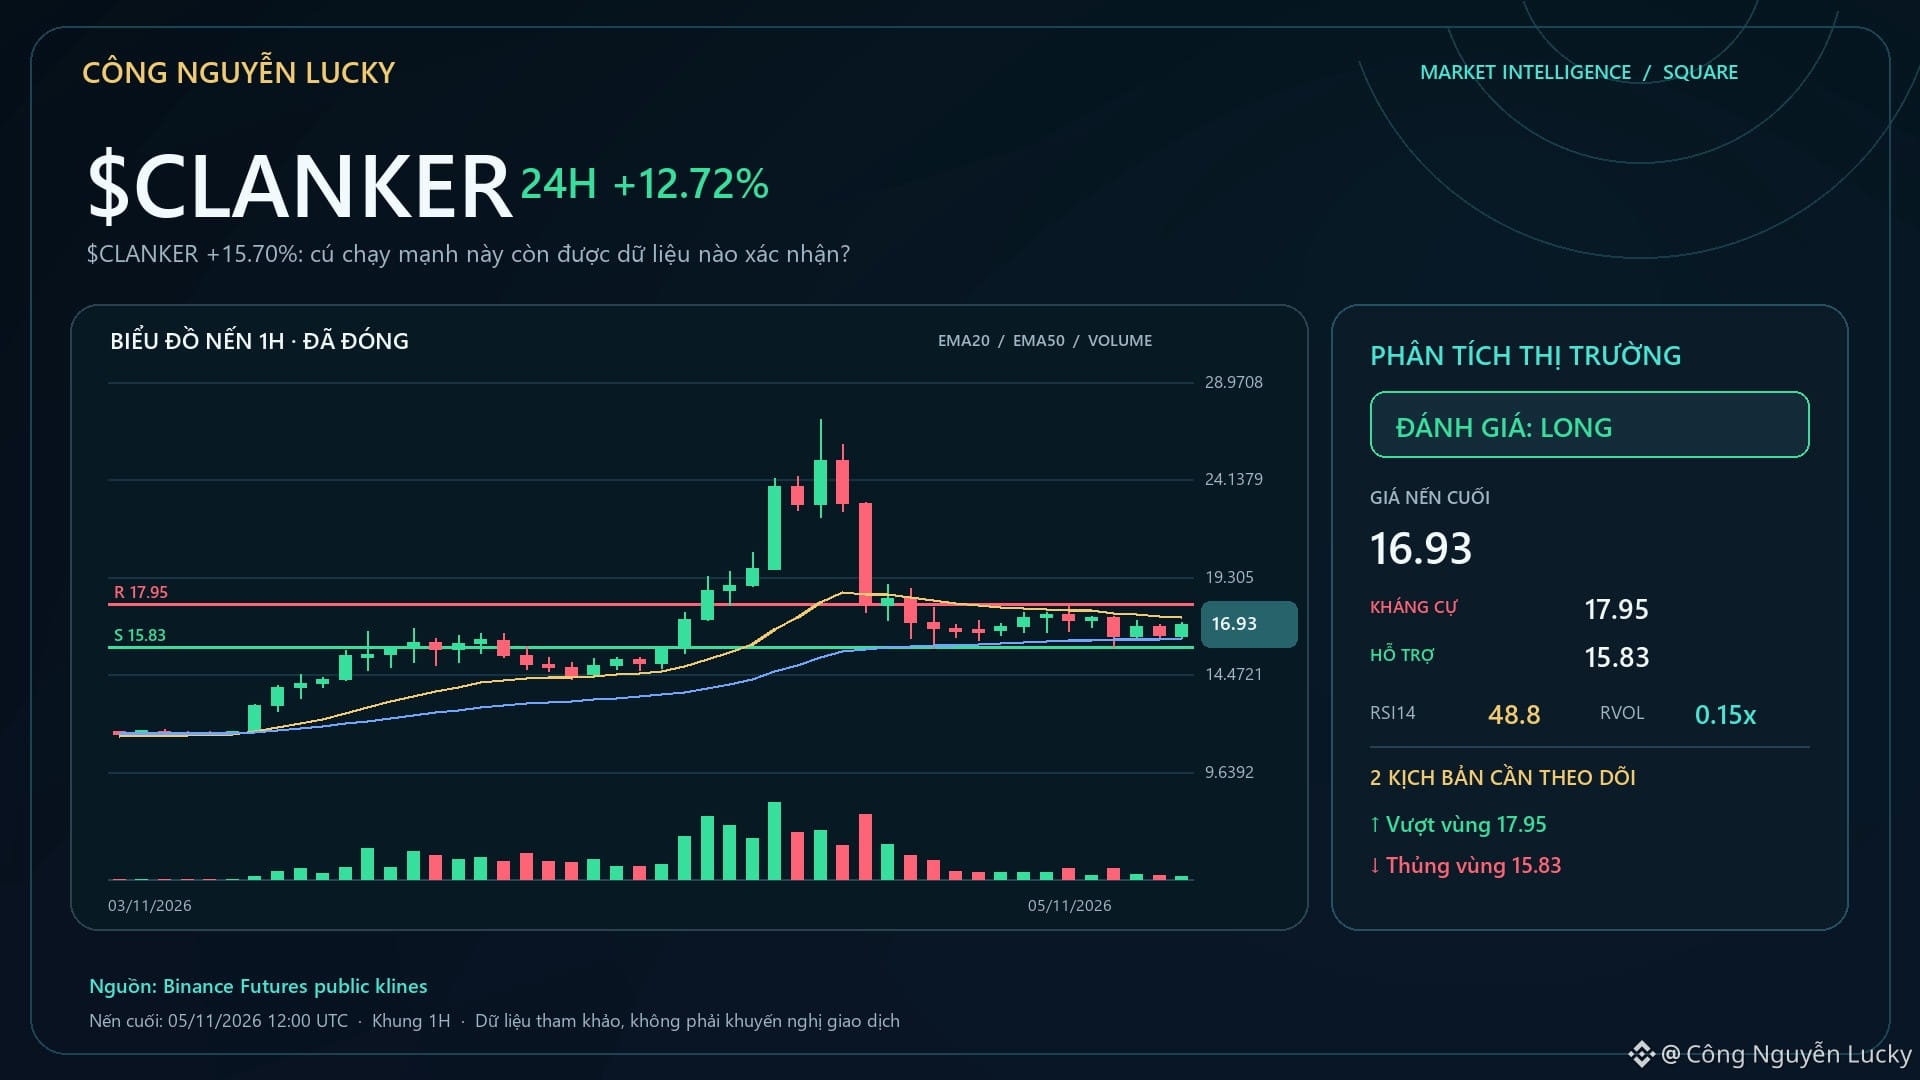
$CLANKER +15.70%: What else confirms this strong run?🔥 $CLANKER is up +15.70% — but the percentage change alone isn't enough to call this a good setup. 1️⃣ +15.70% — 24h change.
2️⃣ 431.9M USDT — 24h quote volume.
3️⃣ 20/100 — position within the daily range. A high number doesn't automatically make it a setup. What to confirm next:
• Breaking above 27.1 with expanding volume would make the continuation scenario more credible.
• Failing to hold the highs and falling back below the 21.02 midpoint would make the cooling-off scenario more evident. 🧭 Current bias: **LONG · STRONG · 87/100**.
$CLANKER +15.70%: What else confirms this strong run?
🔥 $CLANKER is up +15.70% — but the percentage change alone isn't enough to call this a good setup. 1️⃣ +15.70% — 24h change.
2️⃣ 431.9M USDT — 24h quote volume.
3️⃣ 20/100 — position within the daily range. A high number doesn't automatically make it a setup. What to confirm next:
• Breaking above 27.1 with expanding volume would make the continuation scenario more credible.
• Failing to hold the highs and falling back below the 21.02 midpoint would make the cooling-off scenario more evident. 🧭 Current bias: **LONG · STRONG · 87/100**.
2️⃣ 431.9M USDT — 24h quote volume.
3️⃣ 20/100 — position within the daily range. A high number doesn't automatically make it a setup. What to confirm next:
• Breaking above 27.1 with expanding volume would make the continuation scenario more credible.
• Failing to hold the highs and falling back below the 21.02 midpoint would make the cooling-off scenario more evident. 🧭 Current bias: **LONG · STRONG · 87/100**.
286
Article
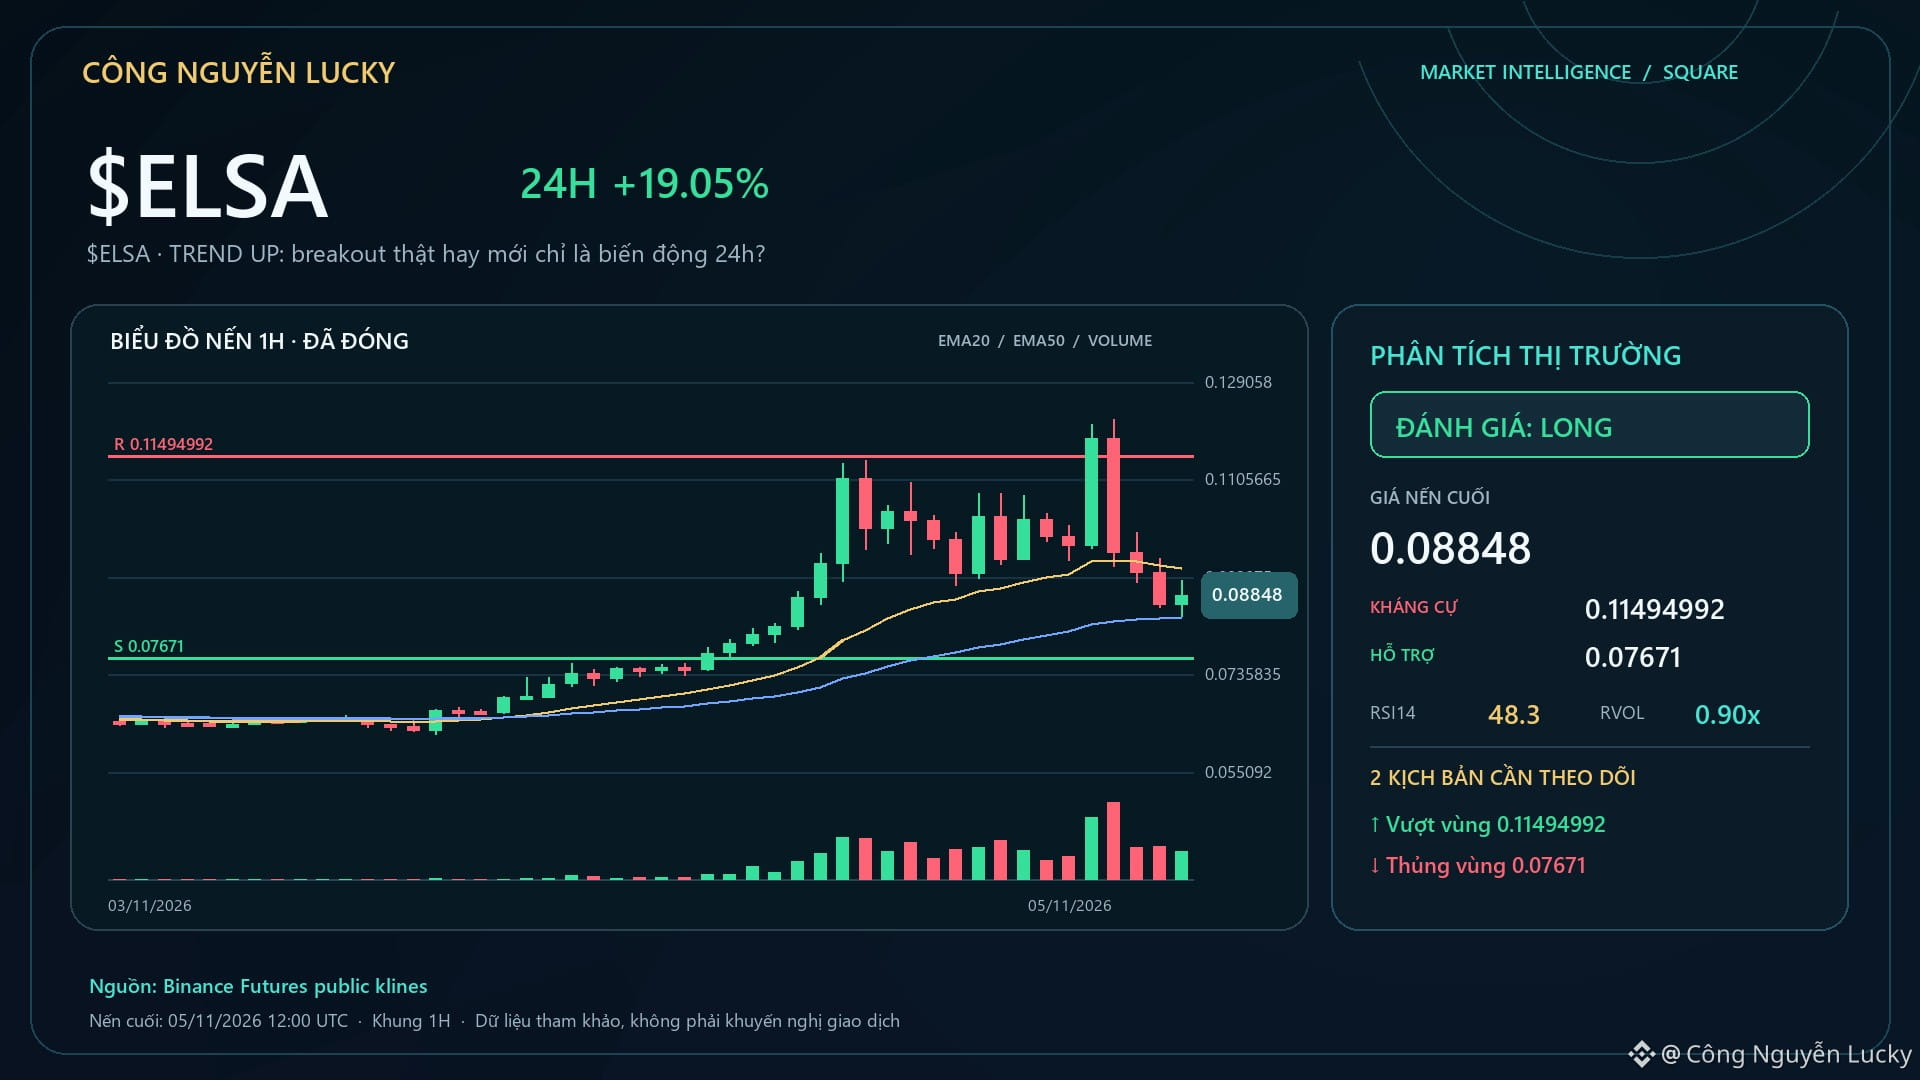
$ELSA · TREND UP: a genuine breakout or just 24-hour volatility?🔥 $ELSA is up +15.50% — but a percentage gain or loss alone isn't enough to call this a good setup. 0.08674 · 24h +15.50% · volume ~324.8M USDT · 3,959,694 trades.
Market-focus participation score: 97/100.
Range position: 28/100. Positive signal: A break above 0.1219 with expanding volume would make the continuation scenario more credible.
Sign to watch for: Failing to hold the highs and dropping back below the midpoint at 0.09765 would make the cooling-off scenario more likely. 📌 LONG/SHORT view: **LONG · STRONG · 87/100**.
$ELSA · TREND UP: a genuine breakout or just 24-hour volatility?
🔥 $ELSA is up +15.50% — but a percentage gain or loss alone isn't enough to call this a good setup. 0.08674 · 24h +15.50% · volume ~324.8M USDT · 3,959,694 trades.
Market-focus participation score: 97/100.
Range position: 28/100. Positive signal: A break above 0.1219 with expanding volume would make the continuation scenario more credible.
Sign to watch for: Failing to hold the highs and dropping back below the midpoint at 0.09765 would make the cooling-off scenario more likely. 📌 LONG/SHORT view: **LONG · STRONG · 87/100**.
Market-focus participation score: 97/100.
Range position: 28/100. Positive signal: A break above 0.1219 with expanding volume would make the continuation scenario more credible.
Sign to watch for: Failing to hold the highs and dropping back below the midpoint at 0.09765 would make the cooling-off scenario more likely. 📌 LONG/SHORT view: **LONG · STRONG · 87/100**.
348
Article
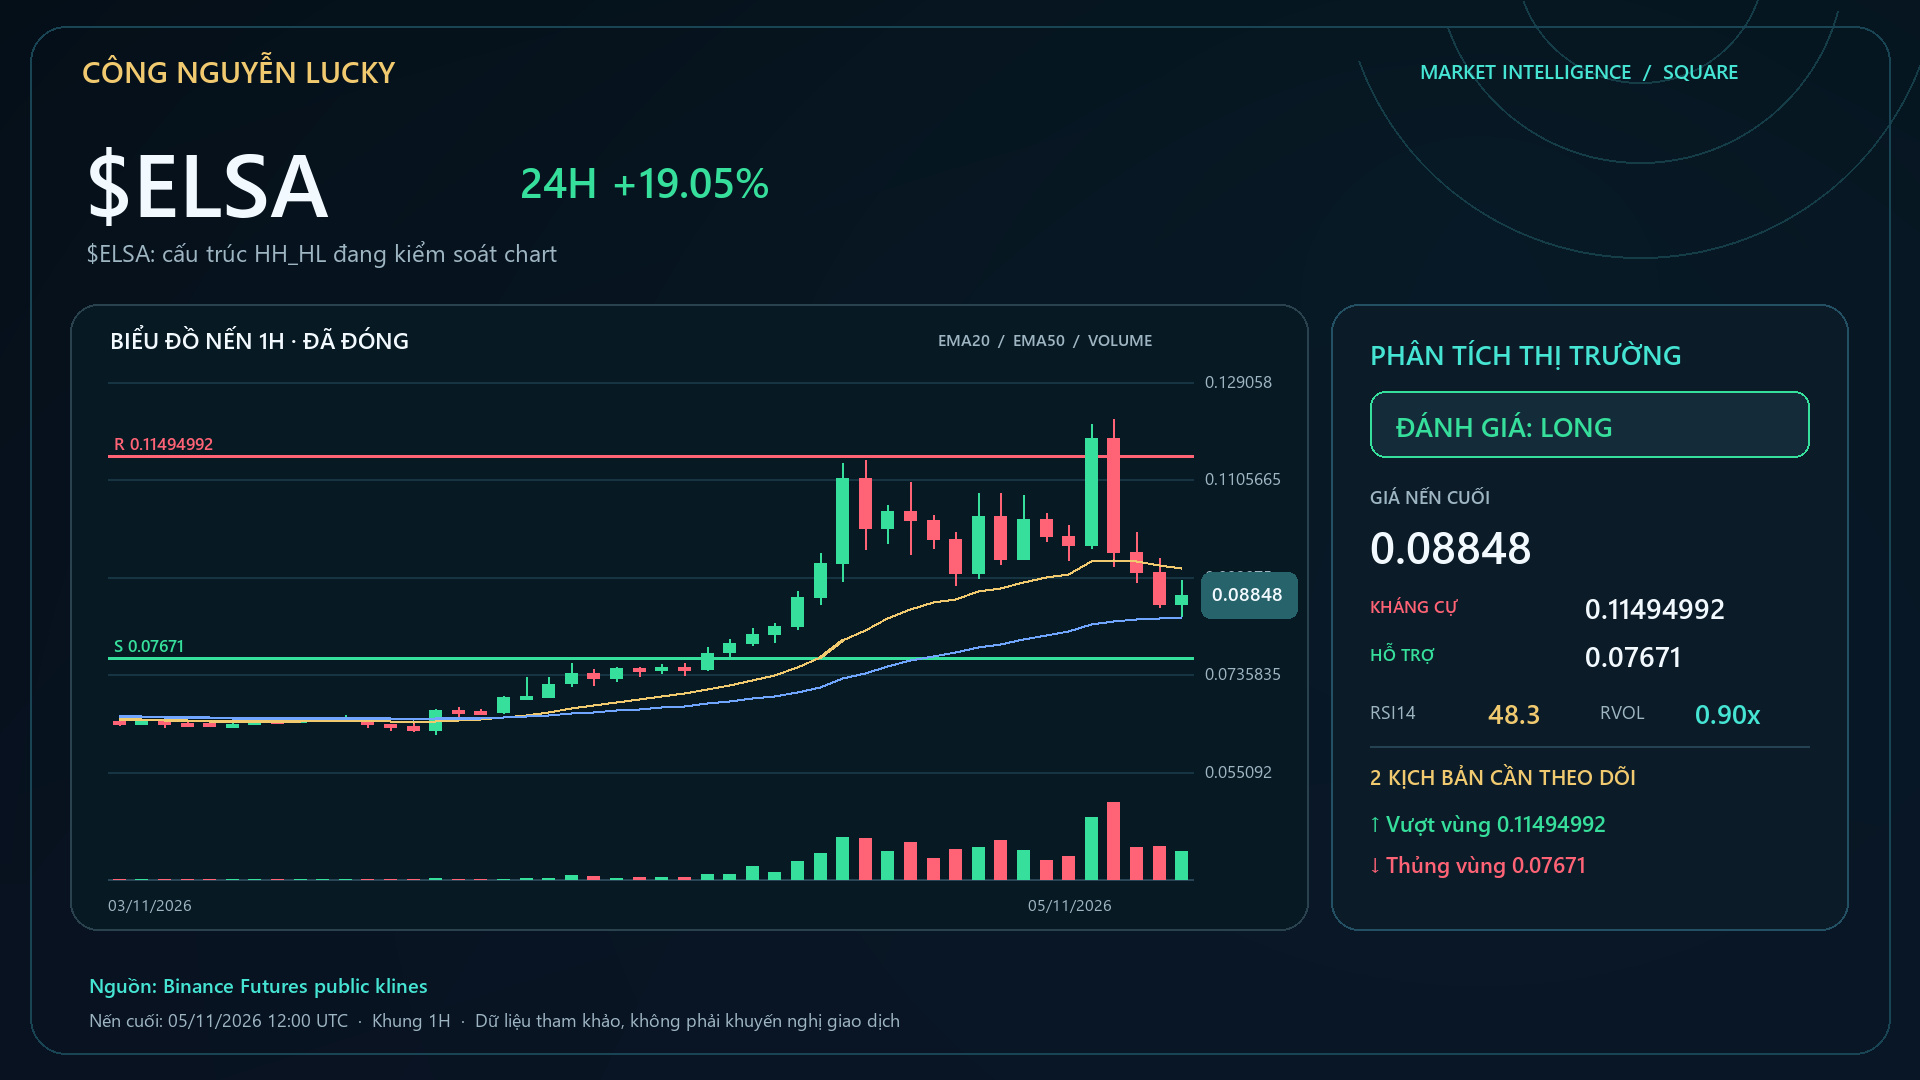
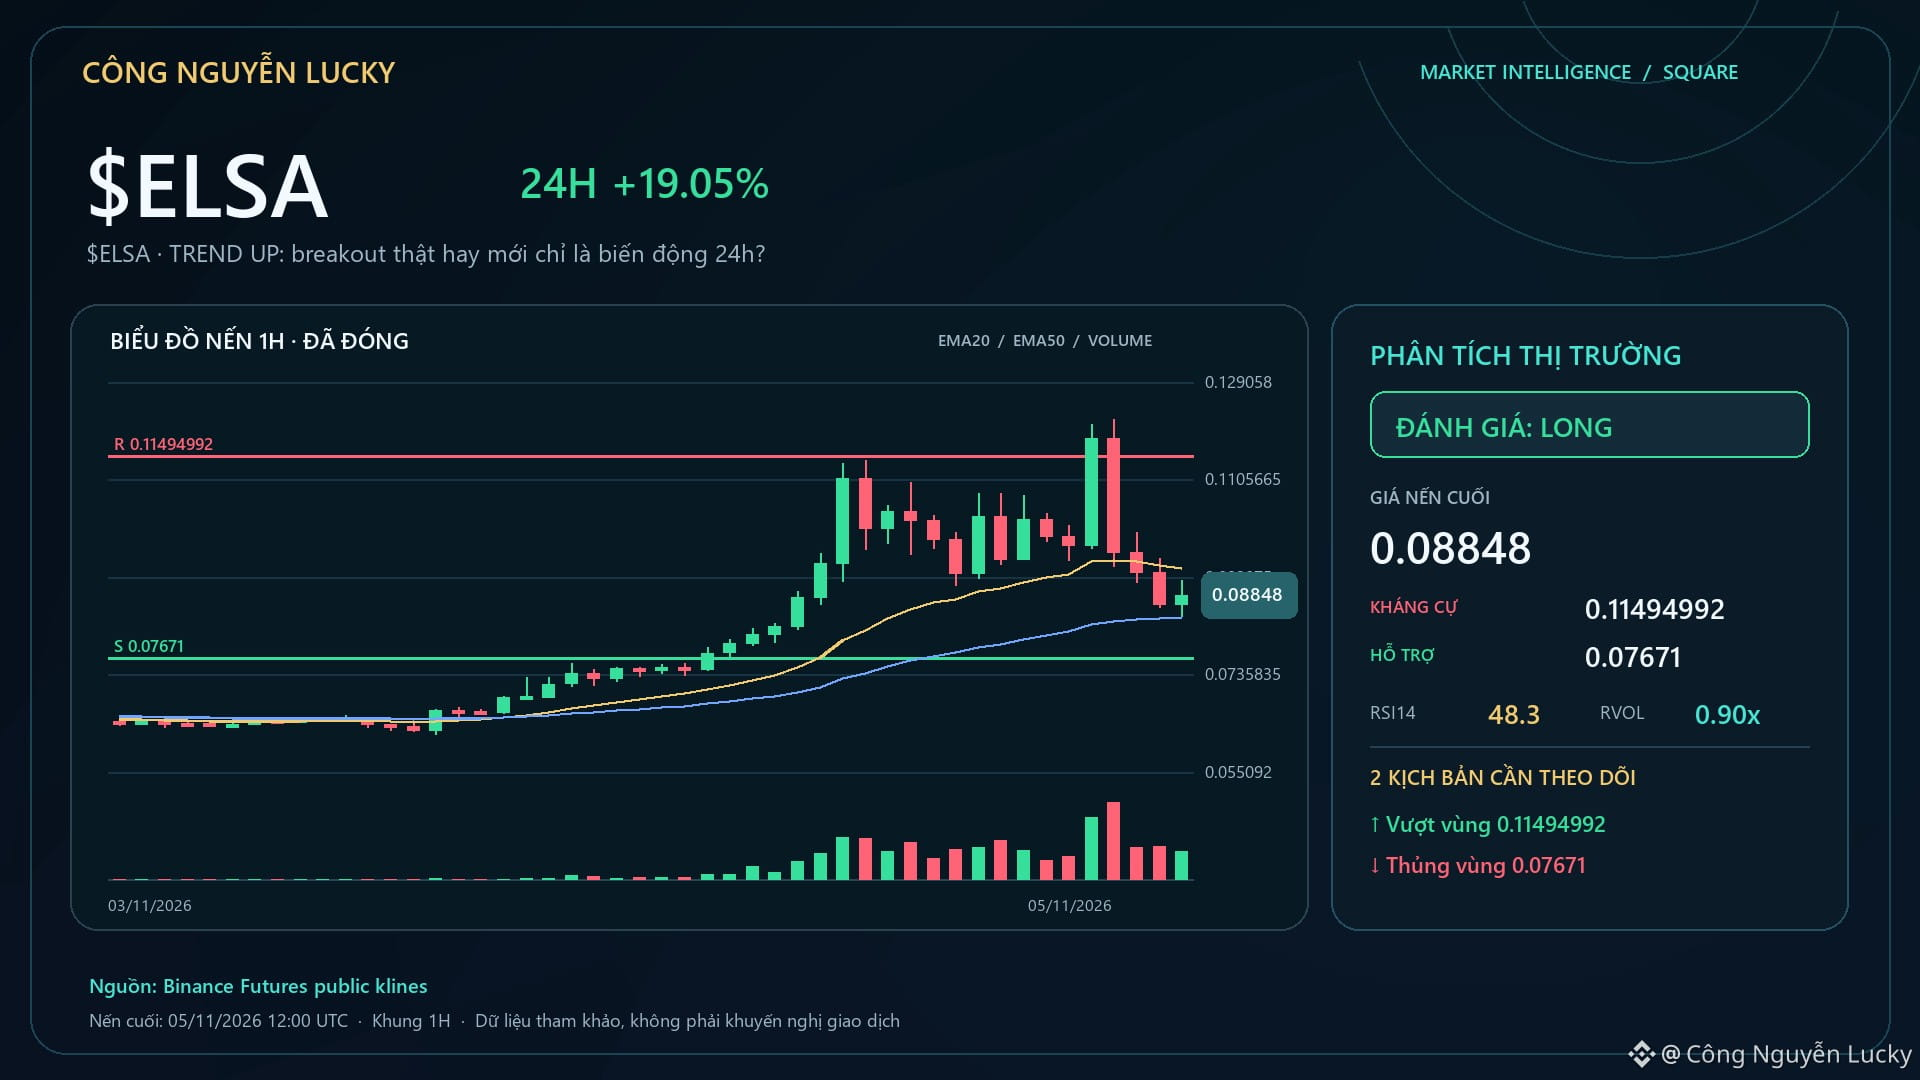
$ELSA: HH_HL structure is in control of the chart🔥 $ELSA is up +13.65% — but a percentage gain or loss alone isn’t enough to call this a good setup. Market: 0.08535 · 24h +13.65% · volume ~324.2M USDT · 3,954,266 trades.
Swing high near 0.1219 · swing low near 0.09042.
EMA50 0.08432625 · RSI14 48.3 · LONG bias 94/100. Indicators are used to confirm the structure, not replace it. Losing 0.07671 or breaking above 0.11494992 would be the clearest points at which the narrative changes. The technical layers are being selected according to the regime:
$ELSA: HH_HL structure is in control of the chart
🔥 $ELSA is up +13.65% — but a percentage gain or loss alone isn’t enough to call this a good setup. Market: 0.08535 · 24h +13.65% · volume ~324.2M USDT · 3,954,266 trades.
Swing high near 0.1219 · swing low near 0.09042.
EMA50 0.08432625 · RSI14 48.3 · LONG bias 94/100. Indicators are used to confirm the structure, not replace it. Losing 0.07671 or breaking above 0.11494992 would be the clearest points at which the narrative changes. The technical layers are being selected according to the regime:
Swing high near 0.1219 · swing low near 0.09042.
EMA50 0.08432625 · RSI14 48.3 · LONG bias 94/100. Indicators are used to confirm the structure, not replace it. Losing 0.07671 or breaking above 0.11494992 would be the clearest points at which the narrative changes. The technical layers are being selected according to the regime:
227
Article
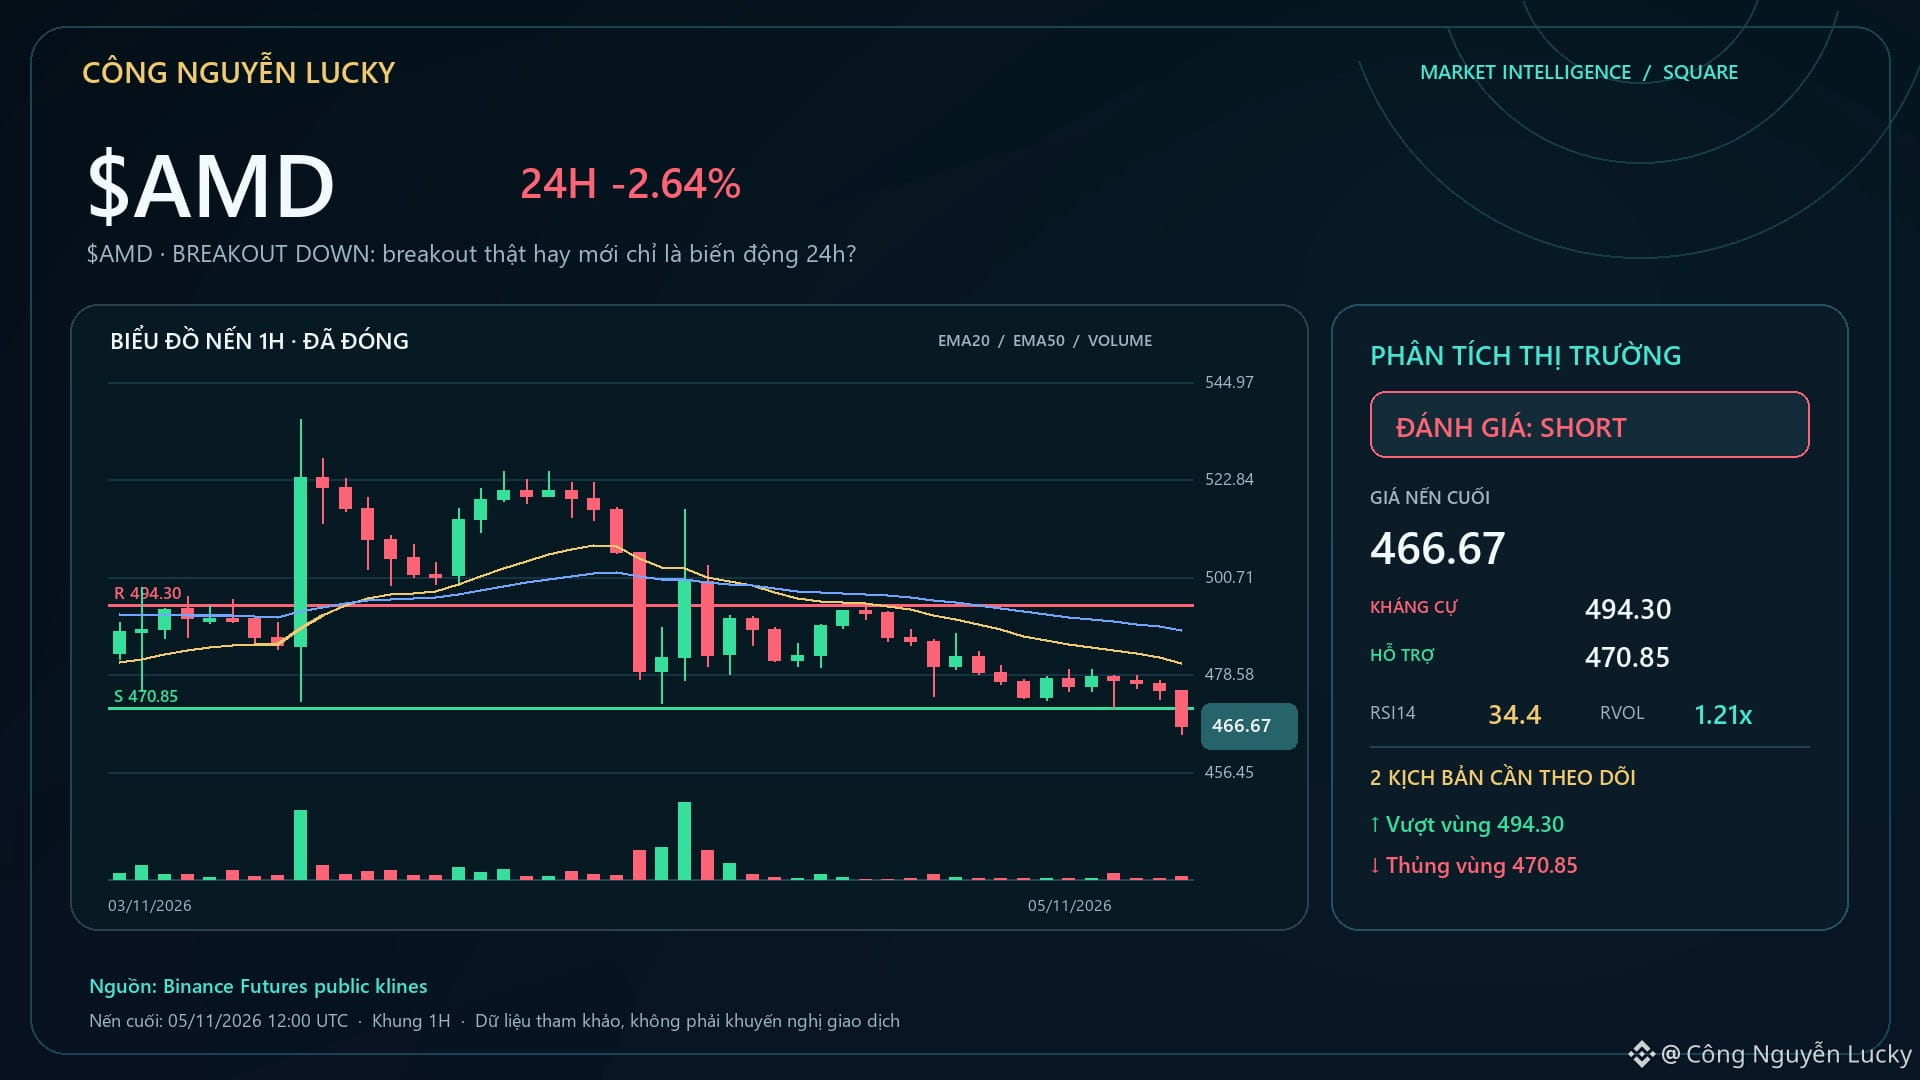
$AMD · BREAKOUT DOWN: a genuine breakout or just 24-hour volatility?🚨 $AMD is in a BREAKOUT DOWN state — a genuine breakout or a false break likely to reverse? Even a good setup with a position that's too large can turn into a bad trade. Capital management must come before profit expectations. Current market snapshot: 465.92 · 24h -3.52% · volume ~255.8M USDT · 925,494 trades. Takeaway: The goal is to survive across many probabilities, not to win with one all-in bet.
What to confirm next for $AMD: A break below 464.32 with expanding volume would make the continuation-of-the-downtrend scenario more convincing.
$AMD · BREAKOUT DOWN: a genuine breakout or just 24-hour volatility?
🚨 $AMD is in a BREAKOUT DOWN state — a genuine breakout or a false break likely to reverse? Even a good setup with a position that's too large can turn into a bad trade. Capital management must come before profit expectations. Current market snapshot: 465.92 · 24h -3.52% · volume ~255.8M USDT · 925,494 trades. Takeaway: The goal is to survive across many probabilities, not to win with one all-in bet.
What to confirm next for $AMD : A break below 464.32 with expanding volume would make the continuation-of-the-downtrend scenario more convincing.
What to confirm next for $AMD : A break below 464.32 with expanding volume would make the continuation-of-the-downtrend scenario more convincing.
19
Article
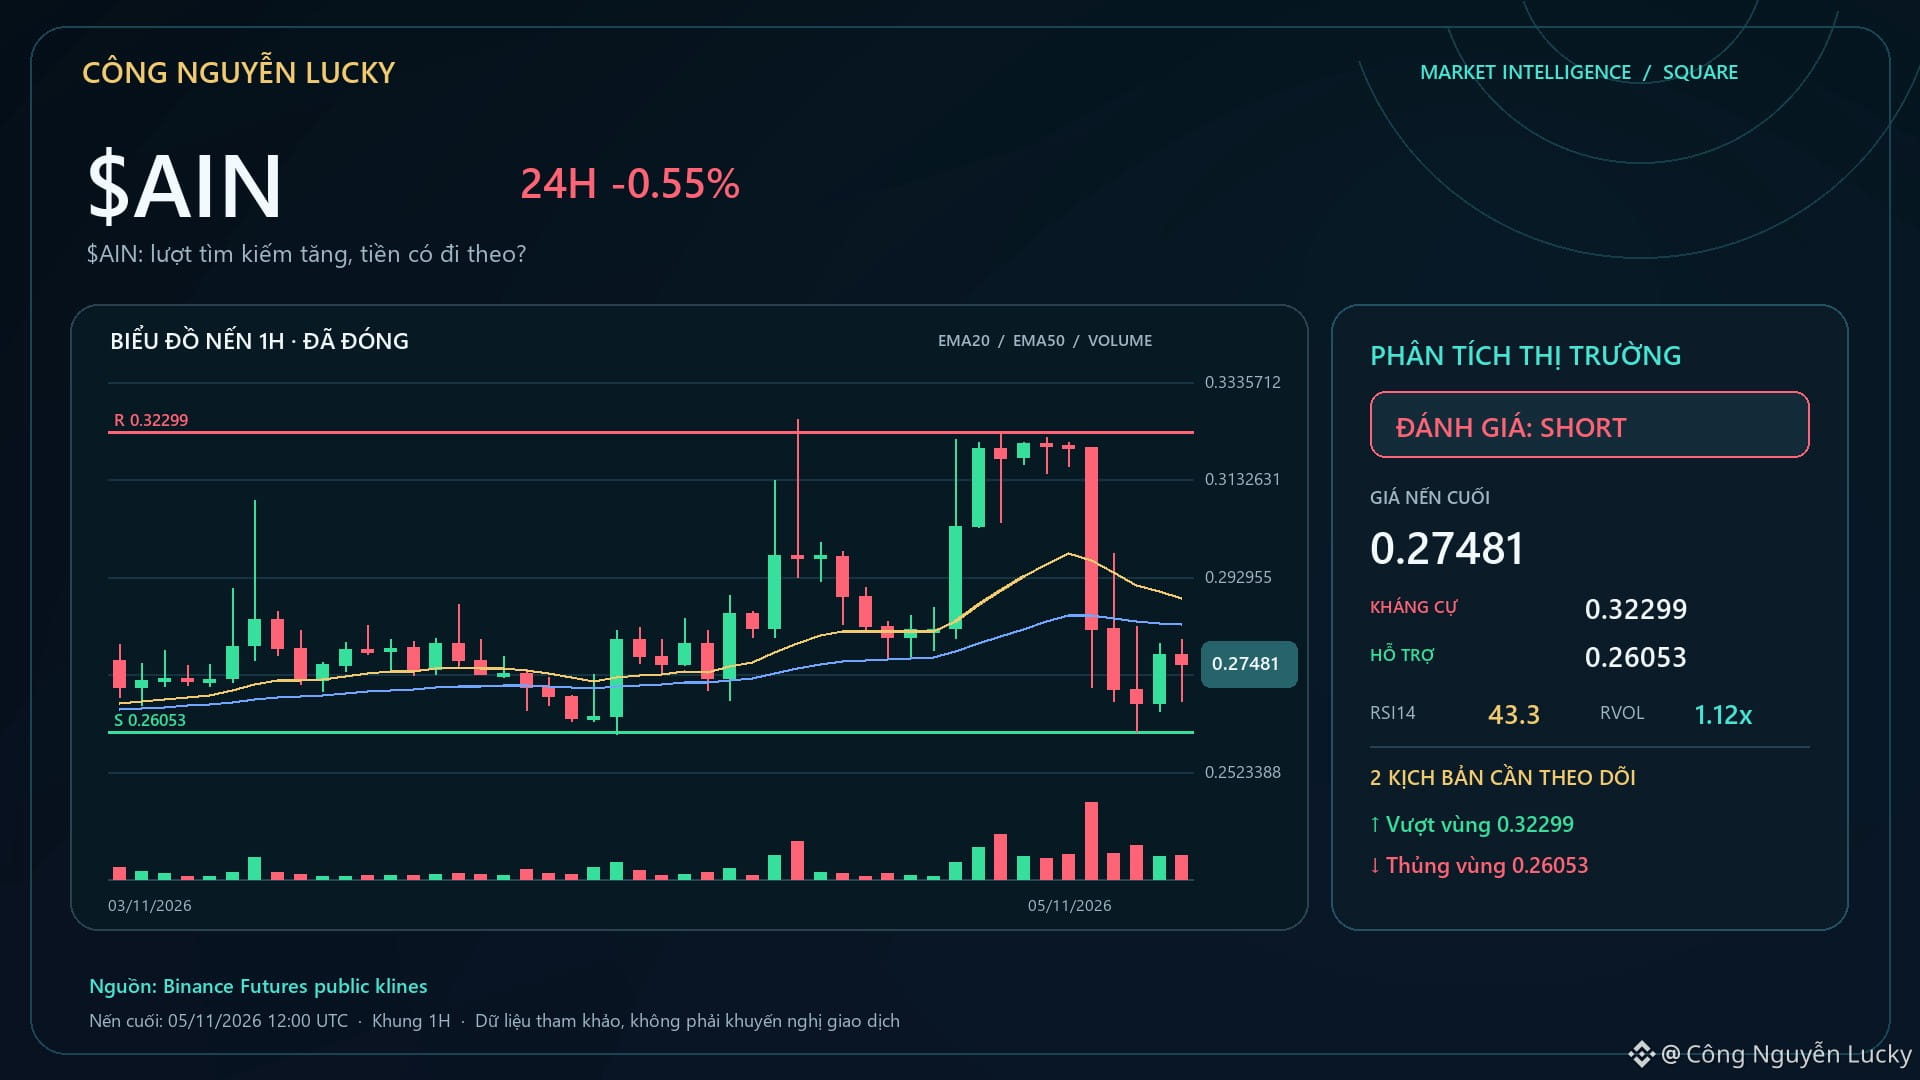
$AIN: Search interest is rising, but is the money following?🔎 $AIN is appearing among the most-searched assets on Binance (#24) — this signals interest, not a buy signal. Market: 0.27651 · 24h -0.44% · volume ~196.2M USDT · 2,678,308 trades.
User interest score: 33/100. If interest translates into actual trading: A break below 0.26053 on expanding volume would make the continuation of the bearish scenario more credible.
If search interest rises but the market doesn't confirm: Failure to hold the low zone and reclaim the midpoint at 0.29312 would weaken downward pressure. 🧭 Current outlook: **SHORT · STRONG · 89/100**.
$AIN: Search interest is rising, but is the money following?
🔎 $AIN is appearing among the most-searched assets on Binance (#24) — this signals interest, not a buy signal. Market: 0.27651 · 24h -0.44% · volume ~196.2M USDT · 2,678,308 trades.
User interest score: 33/100. If interest translates into actual trading: A break below 0.26053 on expanding volume would make the continuation of the bearish scenario more credible.
If search interest rises but the market doesn't confirm: Failure to hold the low zone and reclaim the midpoint at 0.29312 would weaken downward pressure. 🧭 Current outlook: **SHORT · STRONG · 89/100**.
User interest score: 33/100. If interest translates into actual trading: A break below 0.26053 on expanding volume would make the continuation of the bearish scenario more credible.
If search interest rises but the market doesn't confirm: Failure to hold the low zone and reclaim the midpoint at 0.29312 would weaken downward pressure. 🧭 Current outlook: **SHORT · STRONG · 89/100**.
224
Article
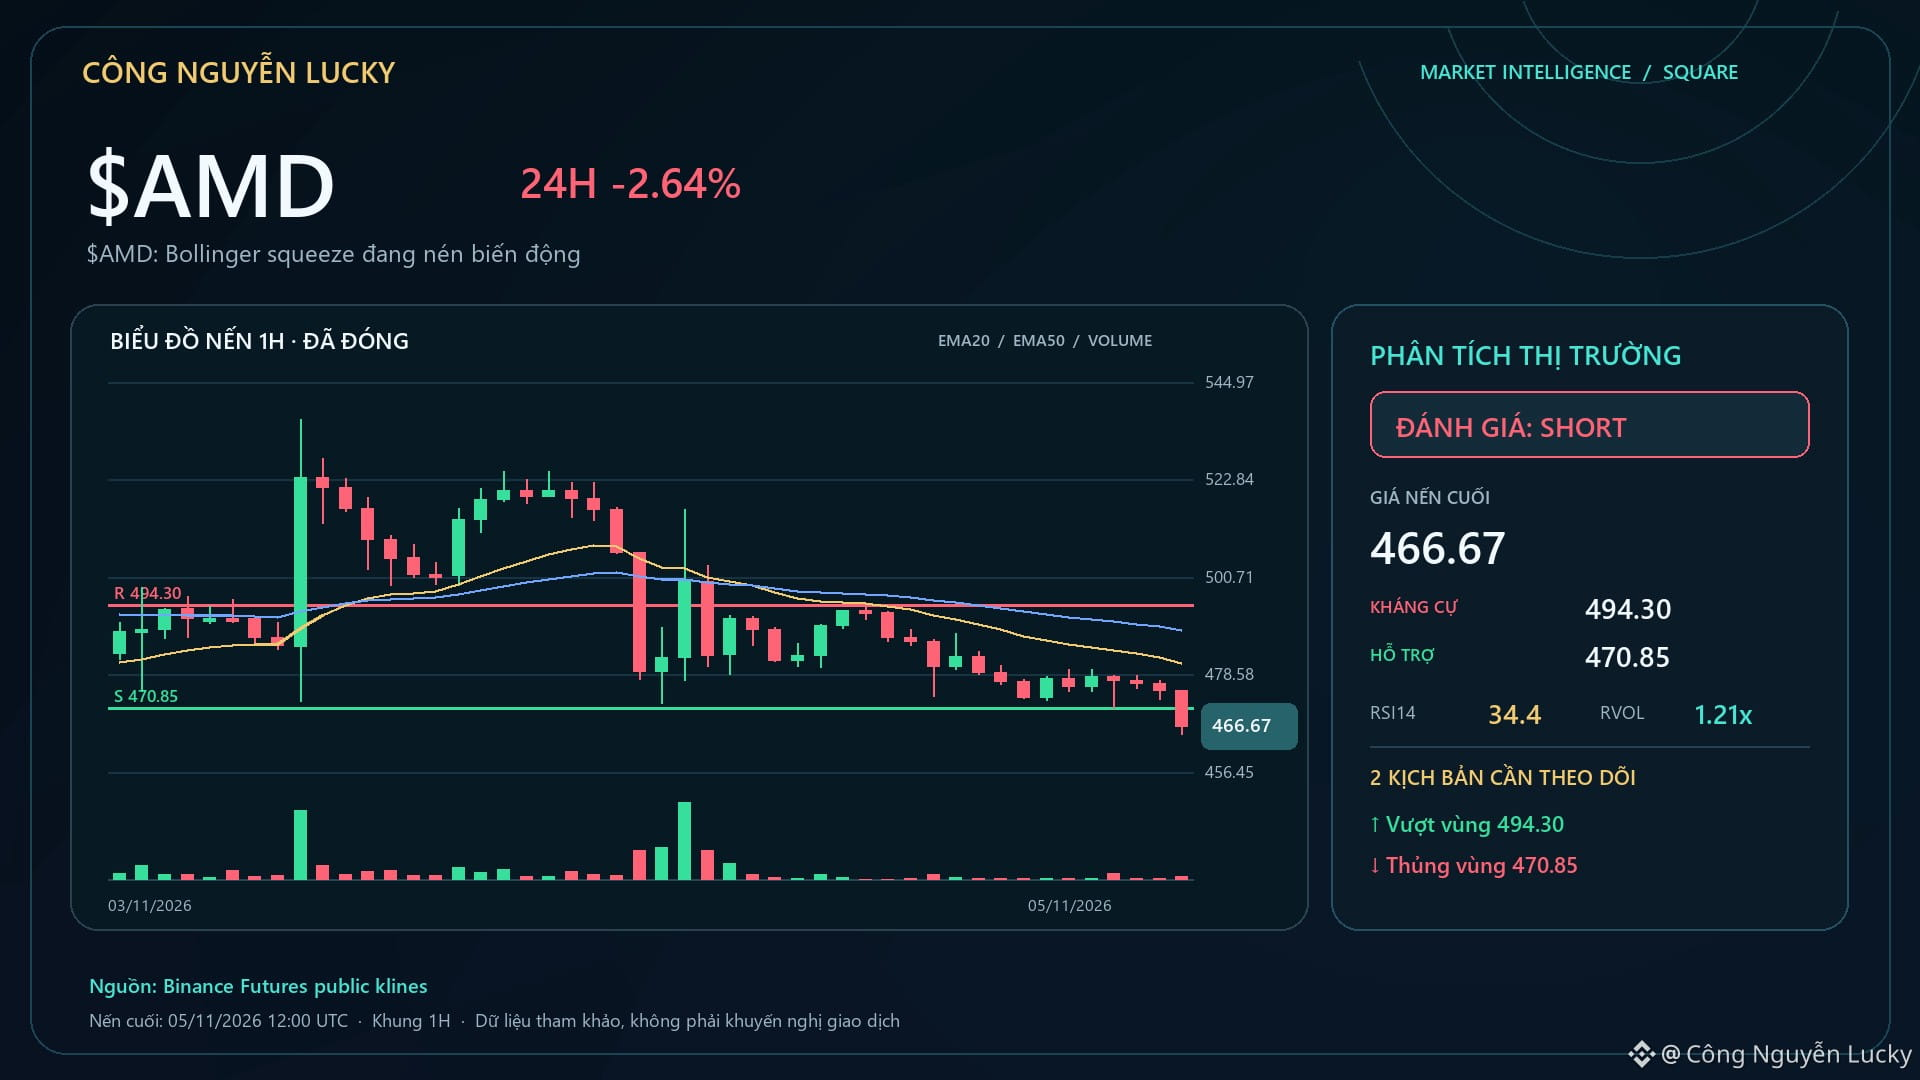
$AMD: Bollinger squeeze is compressing volatility🚨 $AMD is in a BREAKOUT DOWN state — a genuine breakout or a fakeout likely to reverse? Market: 465.95 · 24h -3.25% · volume ~258.4M USDT · 937,397 trades.
Bandwidth 5.54% · ATR14 1.69% of price · LH_LL structure. The breakout is more credible if price moves above 494.3 or drops below 470.85 with expanding volume/ATR.
If price pokes beyond a boundary but quickly returns to the Bollinger midline, favor a false breakout/range rotation. Technical layers are selected based on the regime:
$AMD: Bollinger squeeze is compressing volatility
🚨 $AMD is in a BREAKOUT DOWN state — a genuine breakout or a fakeout likely to reverse? Market: 465.95 · 24h -3.25% · volume ~258.4M USDT · 937,397 trades.
Bandwidth 5.54% · ATR14 1.69% of price · LH_LL structure. The breakout is more credible if price moves above 494.3 or drops below 470.85 with expanding volume/ATR.
If price pokes beyond a boundary but quickly returns to the Bollinger midline, favor a false breakout/range rotation. Technical layers are selected based on the regime:
Bandwidth 5.54% · ATR14 1.69% of price · LH_LL structure. The breakout is more credible if price moves above 494.3 or drops below 470.85 with expanding volume/ATR.
If price pokes beyond a boundary but quickly returns to the Bollinger midline, favor a false breakout/range rotation. Technical layers are selected based on the regime:
Article
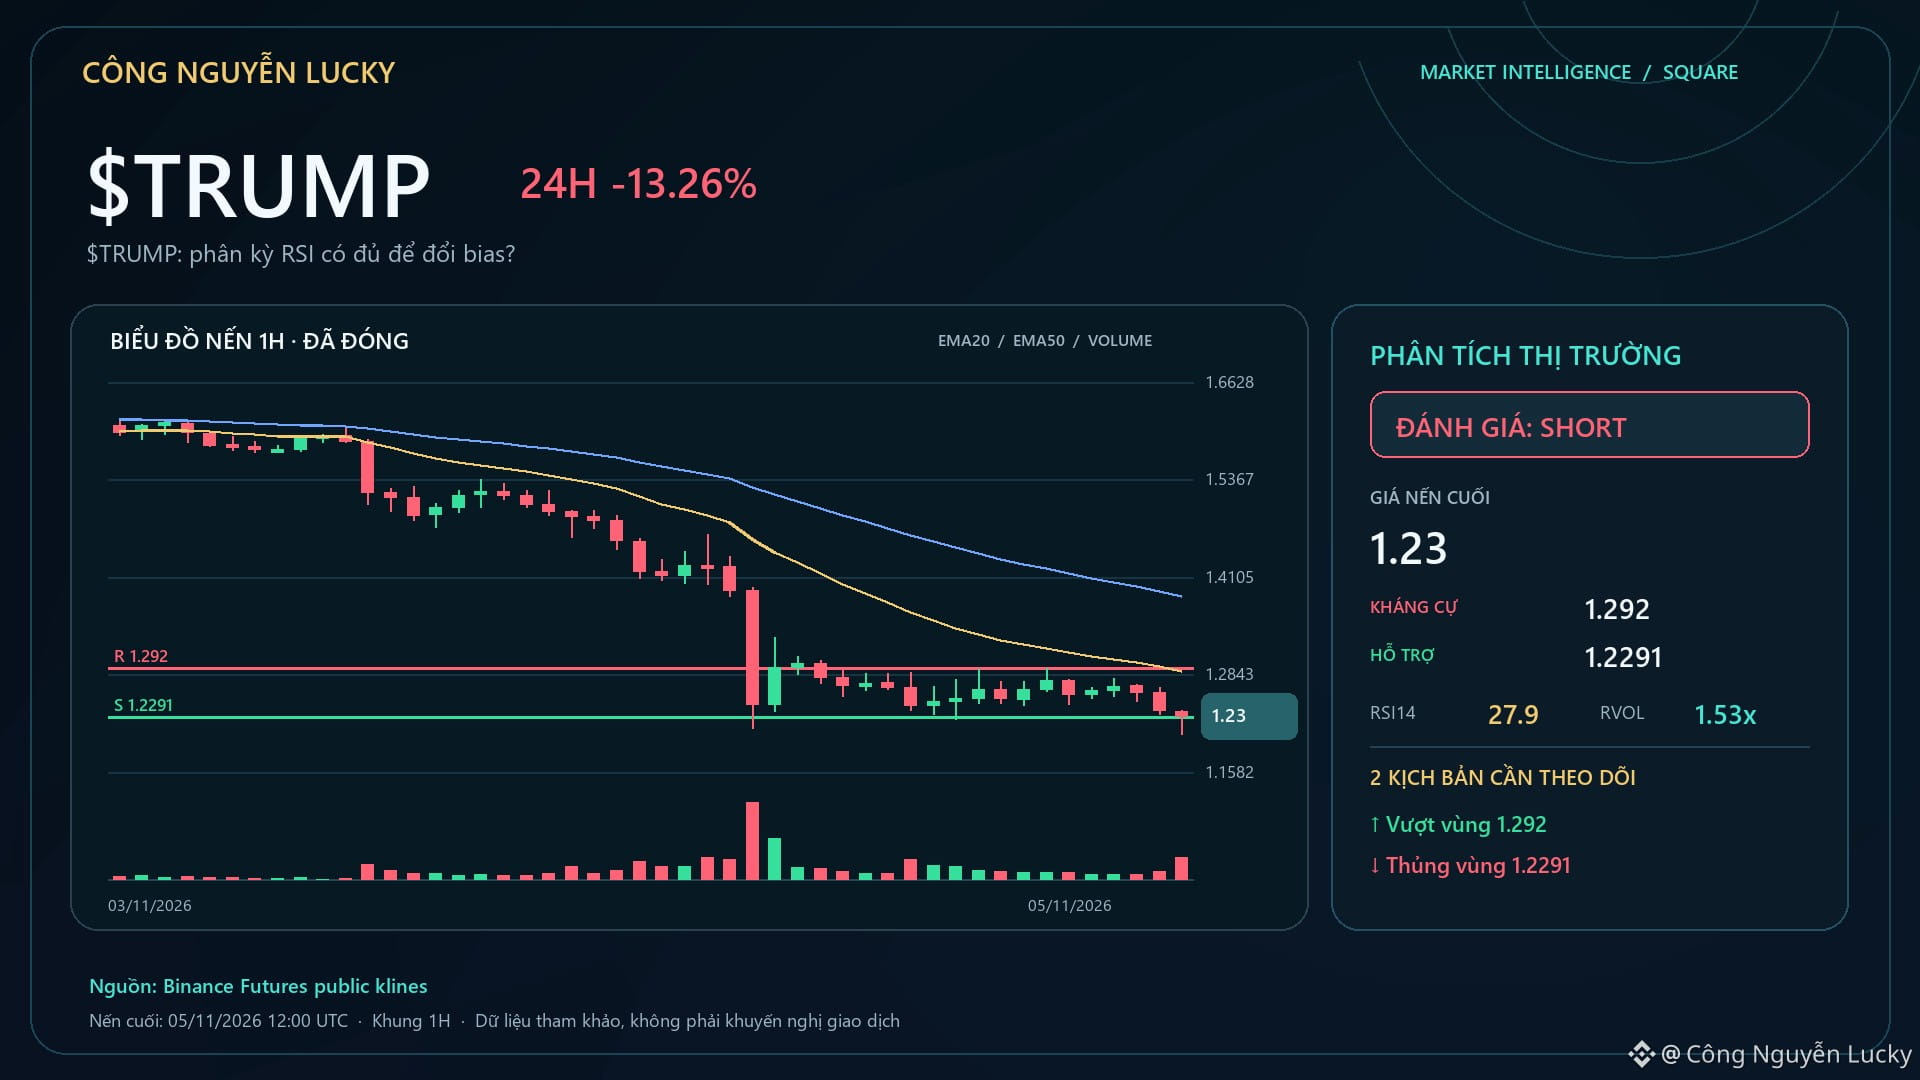
$TRUMP: Is RSI divergence enough to change the bias?🔥 $TRUMP is down 12.34% — but a percentage gain or loss alone isn’t enough to call this a good setup. Market: 1.236 · 24h -12.34% · volume ~309.9M USDT · 1,046,065 trades.
RSI14 27.9 · VOLATILITY COMPRESSION state · composite bias NEUTRAL 67/100. What I need to see next: a price reaction at 1.2291, confirmed by MACD and volume.
If price continues breaking structure in the direction of the old trend, the divergence is considered a failure rather than something to hold onto. Technical layers are selected based on the regime:
$TRUMP: Is RSI divergence enough to change the bias?
🔥 $TRUMP is down 12.34% — but a percentage gain or loss alone isn’t enough to call this a good setup. Market: 1.236 · 24h -12.34% · volume ~309.9M USDT · 1,046,065 trades.
RSI14 27.9 · VOLATILITY COMPRESSION state · composite bias NEUTRAL 67/100. What I need to see next: a price reaction at 1.2291, confirmed by MACD and volume.
If price continues breaking structure in the direction of the old trend, the divergence is considered a failure rather than something to hold onto. Technical layers are selected based on the regime:
RSI14 27.9 · VOLATILITY COMPRESSION state · composite bias NEUTRAL 67/100. What I need to see next: a price reaction at 1.2291, confirmed by MACD and volume.
If price continues breaking structure in the direction of the old trend, the divergence is considered a failure rather than something to hold onto. Technical layers are selected based on the regime:
271
Article
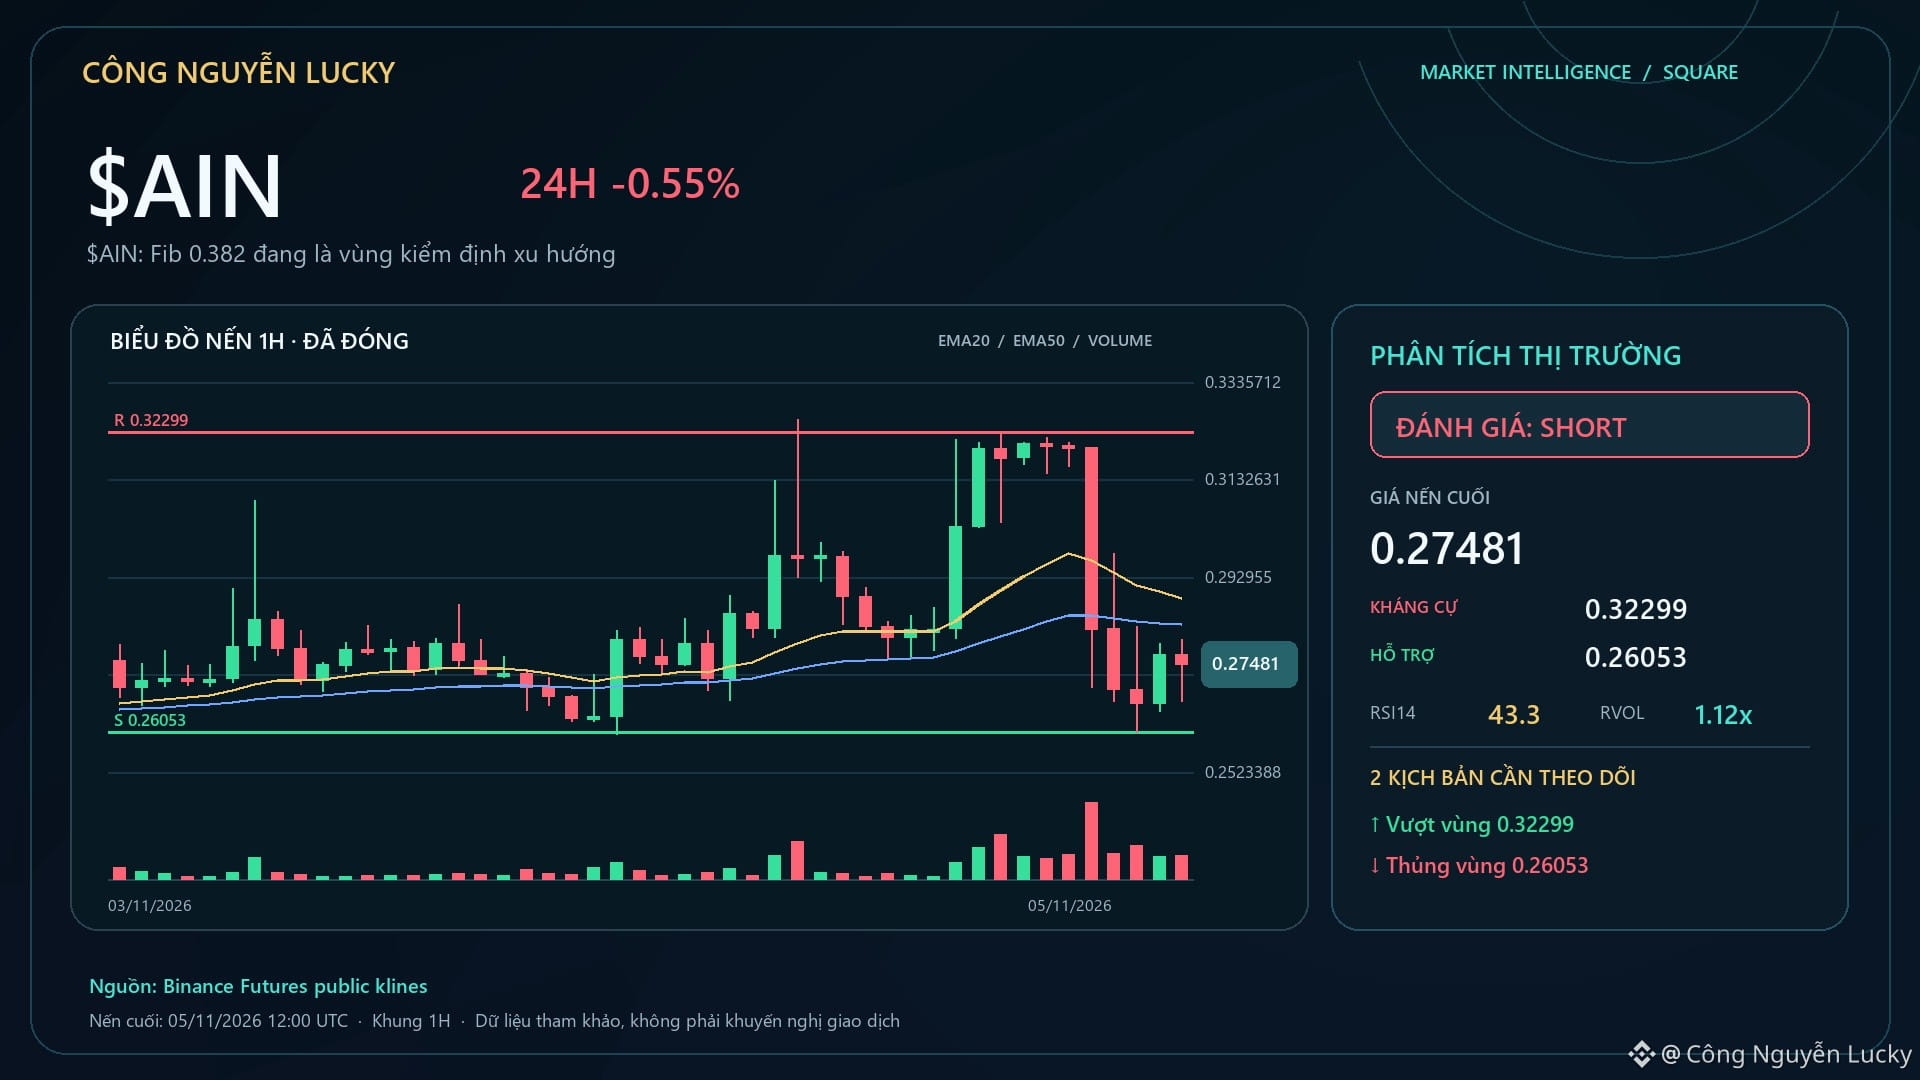
$AIN: Fib 0.382 is currently a trend-testing zone🔎 $AIN is at -0.22%; OI at -5.93% is the data I want to see before chasing price. Market: 0.27698 · 24h -0.22% · volume ~194.9M USDT · 2,663,627 trades.
Technical context: MIXED · SHORT bias 68/100.
Golden zone 0.50–0.618: 0.287645–0.30000078. Confirmation point: price reacts in the right direction at the Fib zone and holds the main structure/EMA.
Invalidation point: break above 0.32299 with momentum moving against the bias. The technical layers are being selected according to the regime:
$AIN: Fib 0.382 is currently a trend-testing zone
🔎 $AIN is at -0.22%; OI at -5.93% is the data I want to see before chasing price. Market: 0.27698 · 24h -0.22% · volume ~194.9M USDT · 2,663,627 trades.
Technical context: MIXED · SHORT bias 68/100.
Golden zone 0.50–0.618: 0.287645–0.30000078. Confirmation point: price reacts in the right direction at the Fib zone and holds the main structure/EMA.
Invalidation point: break above 0.32299 with momentum moving against the bias. The technical layers are being selected according to the regime:
Technical context: MIXED · SHORT bias 68/100.
Golden zone 0.50–0.618: 0.287645–0.30000078. Confirmation point: price reacts in the right direction at the Fib zone and holds the main structure/EMA.
Invalidation point: break above 0.32299 with momentum moving against the bias. The technical layers are being selected according to the regime:
160
Article
$ELSA · TREND UP: a genuine breakout or just 24-hour volatility?🧠 With $ELSA, getting the direction right still isn’t enough — position size and the invalidation point determine how long you can stay in the trade. Even a good setup can turn into a bad trade if your position is too large. Capital management must come before profit expectations. Current market snapshot: 0.08779 · 24h +17.38% · volume ~322.9M USDT · 3,940,317 trades. The takeaway: The goal is to survive across many probabilities, not to win with one all-in bet.
$ELSA · TREND UP: a genuine breakout or just 24-hour volatility?
🧠 With $ELSA , getting the direction right still isn’t enough — position size and the invalidation point determine how long you can stay in the trade. Even a good setup can turn into a bad trade if your position is too large. Capital management must come before profit expectations. Current market snapshot: 0.08779 · 24h +17.38% · volume ~322.9M USDT · 3,940,317 trades. The takeaway: The goal is to survive across many probabilities, not to win with one all-in bet.
243
Article
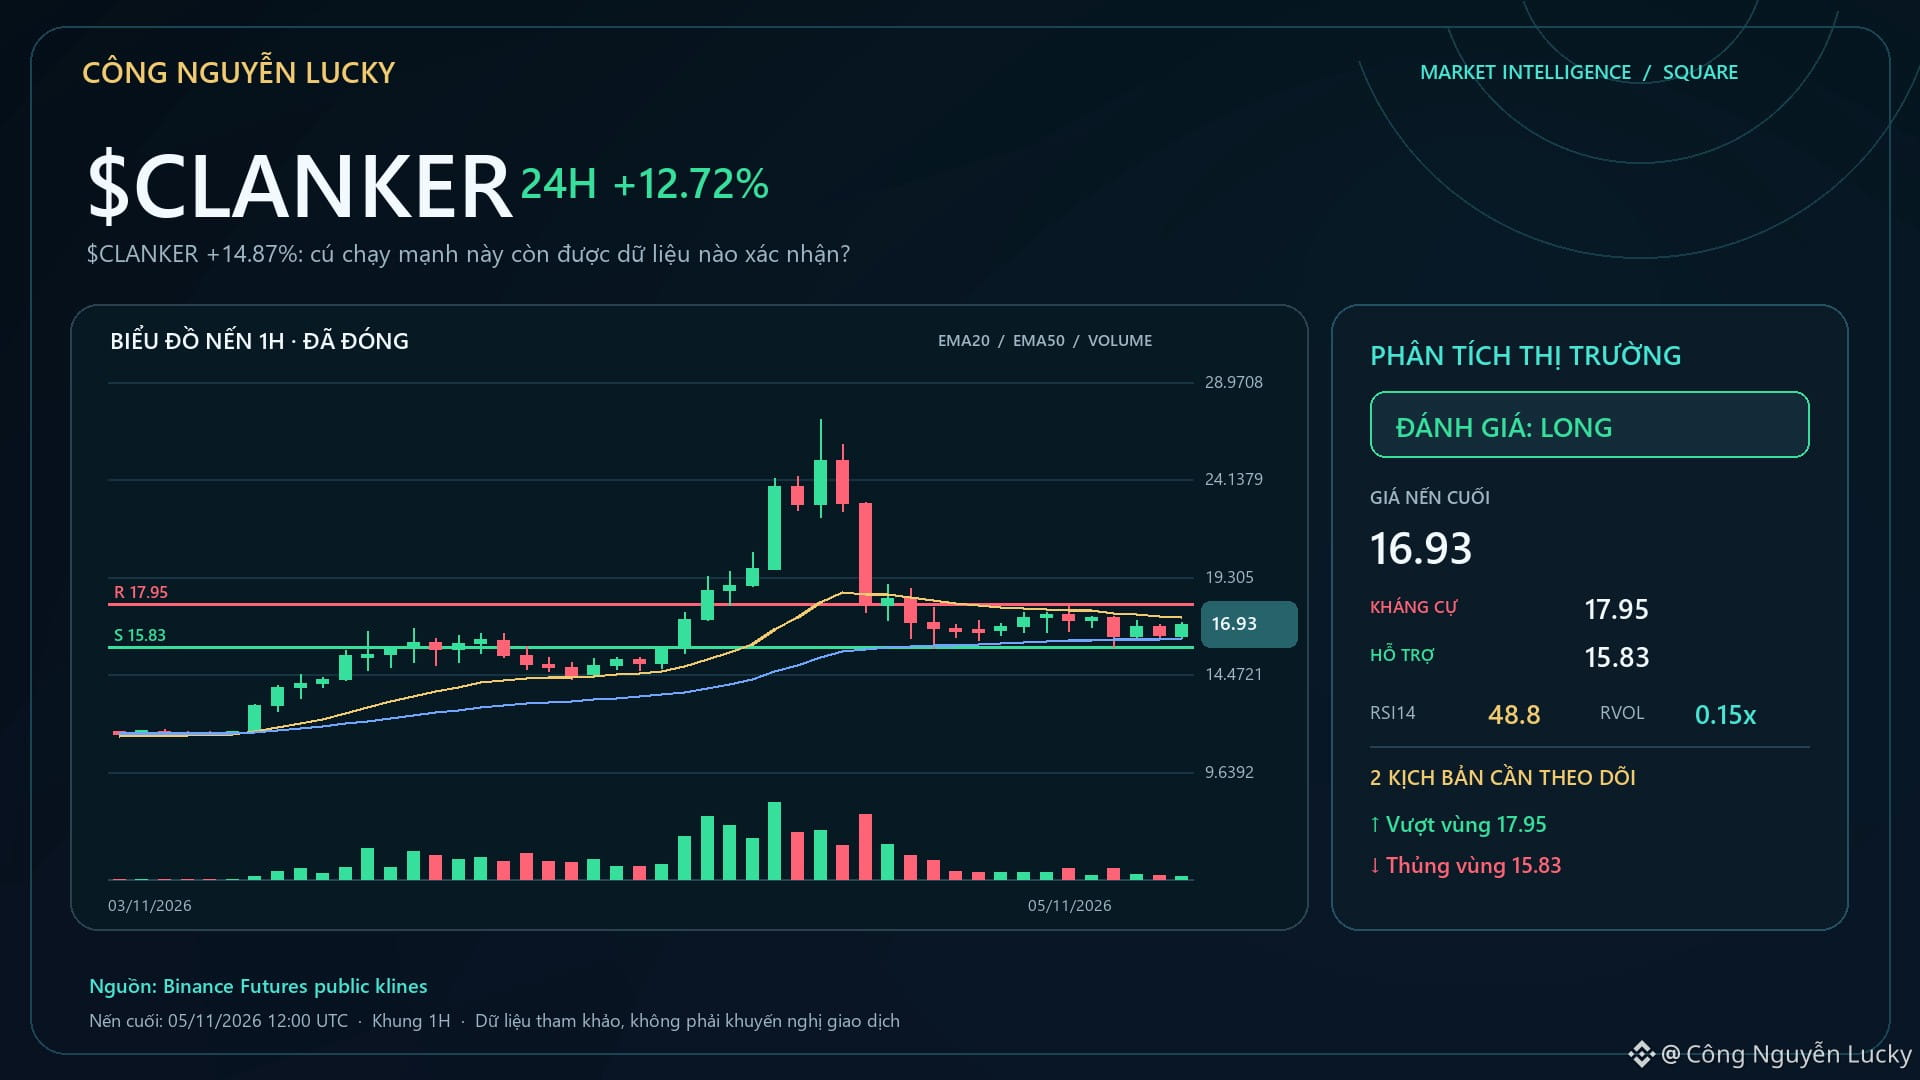
$CLANKER +14.87%: What data confirms this strong rally?🔎 $CLANKER: here’s a brief market note, keeping only verifiable facts. • 17.15 · 24h +14.87% · volume ~432.3M USDT · 4,007,749 trades. Condition for raising conviction: A break above 27.1 with expanding volume would make the continuation scenario more credible.
What would make me reconsider: Failing to hold the highs and falling back below the midpoint of 20.935 would make the cooling-off scenario more likely. 🧭 Current outlook: **LONG · STRONG · 87/100**.
$CLANKER +14.87%: What data confirms this strong rally?
🔎 $CLANKER : here’s a brief market note, keeping only verifiable facts. • 17.15 · 24h +14.87% · volume ~432.3M USDT · 4,007,749 trades. Condition for raising conviction: A break above 27.1 with expanding volume would make the continuation scenario more credible.
What would make me reconsider: Failing to hold the highs and falling back below the midpoint of 20.935 would make the cooling-off scenario more likely. 🧭 Current outlook: **LONG · STRONG · 87/100**.
What would make me reconsider: Failing to hold the highs and falling back below the midpoint of 20.935 would make the cooling-off scenario more likely. 🧭 Current outlook: **LONG · STRONG · 87/100**.
281
Log in to explore more content
Join global crypto users on Binance Square
⚡️ Get latest and useful information about crypto.
💬 Trusted by the world’s largest crypto exchange.
👍 Discover real insights from verified creators.
Email / Phone number
Trending Topics
WhatWillDriveCryptoandStocks’NextRebound?
67,260 views
923 Discussing
Bitcoin Slips Below $70,000 as Dollar Index Hits 19-Month High
Binance News
·19 Likes
·38.5k views
BitcoinBreaksBelow200WeekMovingAverage
622 views
31 Discussing
Anthropic’s6xIPODemandSignalsPotentialRecordRaise
21,667 views
438 Discussing