
#34
34
22,304 views
94 Discussing
Hot
Latest

·
--
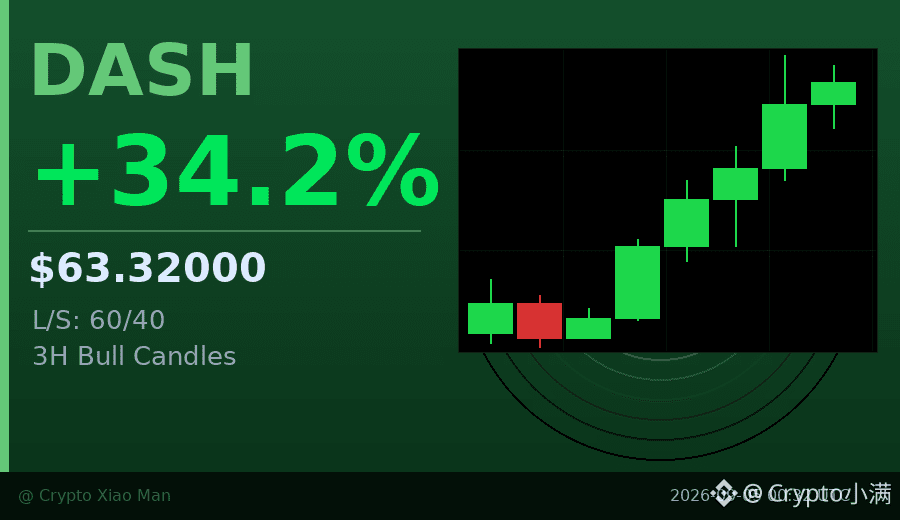
Behind the 34% surge, DASH posted a genuine price-and-volume breakout today.
24-hour trading volume surged to $348 million, while the price jumped straight from $46 to $63. The hourly chart has closed green for three consecutive candles, and the buying pace looks very steady.
The long/short ratio is 60/40, with longs in the lead but not yet crowded. Funding rate at 0.01% is almost neutral, suggesting this move wasn’t built on leverage.
I previously highlighted strong coins like FLOCK and TRIA, and DASH looks cleaner at this level—no extreme funding, no one-sided positioning, just real buying pressure pushing it up.
$DASH #强势突破 #34%
Click the card below to quickly check the market👇
Behind the 34% surge, DASH posted a genuine price-and-volume breakout today.
24-hour trading volume surged to $348 million, while the price jumped straight from $46 to $63. The hourly chart has closed green for three consecutive candles, and the buying pace looks very steady.
The long/short ratio is 60/40, with longs in the lead but not yet crowded. Funding rate at 0.01% is almost neutral, suggesting this move wasn’t built on leverage.
I previously highlighted strong coins like FLOCK and TRIA, and DASH looks cleaner at this level—no extreme funding, no one-sided positioning, just real buying pressure pushing it up.
$DASH #强势突破 #34%
Click the card below to quickly check the market👇
24-hour trading volume surged to $348 million, while the price jumped straight from $46 to $63. The hourly chart has closed green for three consecutive candles, and the buying pace looks very steady.
The long/short ratio is 60/40, with longs in the lead but not yet crowded. Funding rate at 0.01% is almost neutral, suggesting this move wasn’t built on leverage.
I previously highlighted strong coins like FLOCK and TRIA, and DASH looks cleaner at this level—no extreme funding, no one-sided positioning, just real buying pressure pushing it up.
$DASH #强势突破 #34%
Click the card below to quickly check the market👇
249
·
--
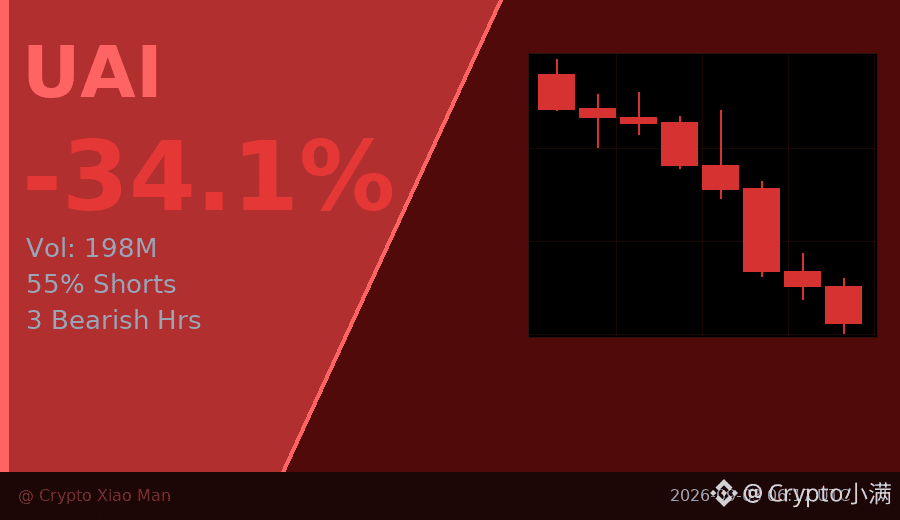
34% drop, 198M volume—this isn’t a normal pullback.
UAI was dumped straight from 0.59 to 0.36, and the hourly chart has already printed three consecutive red candles. Even more noteworthy: 55% of people are shorting, yet the funding rate is still positive—indicating that although many are bearish, the ones truly willing to pay for shorting aren’t being that aggressive.
In this kind of situation, the most likely scenario is that the short side is overcrowded, which actually leaves room for a rebound. Of course, the trend hasn’t reversed yet—the three red candles are still there, so catching the dip needs signals.
I’ll be watching the 0.38–0.40 range. If it can hold there, then I’ll reassess.
$UAI #暴跌行情 #34%
Click the small card below to quickly check the market 👇
34% drop, 198M volume—this isn’t a normal pullback.
UAI was dumped straight from 0.59 to 0.36, and the hourly chart has already printed three consecutive red candles. Even more noteworthy: 55% of people are shorting, yet the funding rate is still positive—indicating that although many are bearish, the ones truly willing to pay for shorting aren’t being that aggressive.
In this kind of situation, the most likely scenario is that the short side is overcrowded, which actually leaves room for a rebound. Of course, the trend hasn’t reversed yet—the three red candles are still there, so catching the dip needs signals.
I’ll be watching the 0.38–0.40 range. If it can hold there, then I’ll reassess.
$UAI #暴跌行情 #34%
Click the small card below to quickly check the market 👇
UAI was dumped straight from 0.59 to 0.36, and the hourly chart has already printed three consecutive red candles. Even more noteworthy: 55% of people are shorting, yet the funding rate is still positive—indicating that although many are bearish, the ones truly willing to pay for shorting aren’t being that aggressive.
In this kind of situation, the most likely scenario is that the short side is overcrowded, which actually leaves room for a rebound. Of course, the trend hasn’t reversed yet—the three red candles are still there, so catching the dip needs signals.
I’ll be watching the 0.38–0.40 range. If it can hold there, then I’ll reassess.
$UAI #暴跌行情 #34%
Click the small card below to quickly check the market 👇
116

·
--
In this round of “AI narrative” rotation, $TAO has been put back on the table again—but not via a broad-based pump; rather, through a volume-backed repricing. In 7 days: +44%, in 30 days: +29%, market cap has returned to 3.55B and the rank is #34. More importantly, 24h volume is still 479M, while the price is stuck around $313: it hasn’t broken above $325, and it hasn’t fallen below $307 either. The real signal was the 616M volume surge on Sep 22; after that, over the next three days the volume didn’t dissipate, and the price stayed range-bound at the highs—suggesting there are sellers who are being absorbed, but the buyers aren’t rushing to chase higher. $TAO is still -58% from its ATH of $757; this isn’t “cheap”—the benchmark from the previous bubble is still hanging there. What really needs confirmation is: if volume can hold above 400M and it breaks $326, then capital may treat it as the AI sector’s beta and continue to push it; if it drops back below $300 with shrinking volume, then Sep 22 looks even more like an event-driven spike. I care more whether subnetwork incentives, miner behavior, and exchange net inflows are moving in sync—not just the K-line. Which capital flow or market clue have you been seeing lately that truly changes $TAO’s narrative?
In this round of “AI narrative” rotation, $TAO has been put back on the table again—but not via a broad-based pump; rather, through a volume-backed repricing. In 7 days: +44%, in 30 days: +29%, market cap has returned to 3.55B and the rank is #34. More importantly, 24h volume is still 479M, while the price is stuck around $313: it hasn’t broken above $325, and it hasn’t fallen below $307 either. The real signal was the 616M volume surge on Sep 22; after that, over the next three days the volume didn’t dissipate, and the price stayed range-bound at the highs—suggesting there are sellers who are being absorbed, but the buyers aren’t rushing to chase higher. $TAO is still -58% from its ATH of $757; this isn’t “cheap”—the benchmark from the previous bubble is still hanging there. What really needs confirmation is: if volume can hold above 400M and it breaks $326, then capital may treat it as the AI sector’s beta and continue to push it; if it drops back below $300 with shrinking volume, then Sep 22 looks even more like an event-driven spike. I care more whether subnetwork incentives, miner behavior, and exchange net inflows are moving in sync—not just the K-line. Which capital flow or market clue have you been seeing lately that truly changes $TAO ’s narrative?
210

·
--
$TAKE This move in the 15m chart just dropped straight down—down 8%. Volume expanded to more than 5x. But what’s interesting is that OI didn’t fall; it actually increased—15m: +1.64%, and 1h already: +7.98%. Along with the price declining, this is a typical pattern of leveraged shorts entering, not a long squeeze.
Active trade difference: -14.9%, buy/sell ratio: 0.74, with sell pressure dominating. Oddly, the notional change is negative (-455K / -6.47%). The price is falling and new shorts are adding, yet the notional size inside the pool is shrinking, which suggests some are reducing exposure while others are increasing shorts—both sides are flipping positions.
Abnormal percentile: 82.3%, ranking #34 across the whole pool. Notional change ranks #15. Funding rate wasn’t provided, but just looking at the structure, it’s already pretty clear. 24h trading value: 630 million. Liquidity/depth is sufficient, but the direction is too obvious.
OI is rising while price is falling. The combination that’s most dangerous is a short-covering squeeze that compresses everyone upward. But it could also simply mean the downtrend continues. In this situation, chasing shorts and catching the dip both feel uncomfortable—I’d rather wait for OI to dip a bit before reassessing the direction. $TAKE
$TAKE This move in the 15m chart just dropped straight down—down 8%. Volume expanded to more than 5x. But what’s interesting is that OI didn’t fall; it actually increased—15m: +1.64%, and 1h already: +7.98%. Along with the price declining, this is a typical pattern of leveraged shorts entering, not a long squeeze.
Active trade difference: -14.9%, buy/sell ratio: 0.74, with sell pressure dominating. Oddly, the notional change is negative (-455K / -6.47%). The price is falling and new shorts are adding, yet the notional size inside the pool is shrinking, which suggests some are reducing exposure while others are increasing shorts—both sides are flipping positions.
Abnormal percentile: 82.3%, ranking #34 across the whole pool. Notional change ranks #15. Funding rate wasn’t provided, but just looking at the structure, it’s already pretty clear. 24h trading value: 630 million. Liquidity/depth is sufficient, but the direction is too obvious.
OI is rising while price is falling. The combination that’s most dangerous is a short-covering squeeze that compresses everyone upward. But it could also simply mean the downtrend continues. In this situation, chasing shorts and catching the dip both feel uncomfortable—I’d rather wait for OI to dip a bit before reassessing the direction. $TAKE
Active trade difference: -14.9%, buy/sell ratio: 0.74, with sell pressure dominating. Oddly, the notional change is negative (-455K / -6.47%). The price is falling and new shorts are adding, yet the notional size inside the pool is shrinking, which suggests some are reducing exposure while others are increasing shorts—both sides are flipping positions.
Abnormal percentile: 82.3%, ranking #34 across the whole pool. Notional change ranks #15. Funding rate wasn’t provided, but just looking at the structure, it’s already pretty clear. 24h trading value: 630 million. Liquidity/depth is sufficient, but the direction is too obvious.
OI is rising while price is falling. The combination that’s most dangerous is a short-covering squeeze that compresses everyone upward. But it could also simply mean the downtrend continues. In this situation, chasing shorts and catching the dip both feel uncomfortable—I’d rather wait for OI to dip a bit before reassessing the direction. $TAKE
33

·
--
🚨 LATEST MARKET UPDATE | $BTC Visa Moves to Close Meme Coin Credit Card Rewards Loophole ━━━━━━━━━━━━━━━━━━━━━
📌 KEY HIGHLIGHTS (TL;DR):
• After banks lost their push for tighter stablecoin rules in the failed Clarity Act, JP Morgan scored a narrower win as Visa moves to stop meme coin purchases from being coded as ordinary "digital media" and earning card rewards.
• Institutional flow and liquidity patterns are actively reacting to this news.
• Traders should closely watch key support and resistance zones for $BTC. 📊 MARKET IMPLICATIONS:
As volatility expands across the broader digital asset space, $BTC continues to be a central focal point for market momentum. Monitor order-book depth and funding rates for confirmation before entering high-leverage positions. 💬 COMMUNITY PULSE:
How do you see this impacting the market this week? Are you Bullish 🟢 or Bearish 🔴 on $BTC? Let us know in the comments below! 👇 ━━━━━━━━━━━━━━━━━━━━━
$BTC #BinanceSquare #CryptoNews
🚨 LATEST MARKET UPDATE | $BTC Visa Moves to Close Meme Coin Credit Card Rewards Loophole ━━━━━━━━━━━━━━━━━━━━━
📌 KEY HIGHLIGHTS (TL;DR):
• After banks lost their push for tighter stablecoin rules in the failed Clarity Act, JP Morgan scored a narrower win as Visa moves to stop meme coin purchases from being coded as ordinary "digital media" and earning card rewards.
• Institutional flow and liquidity patterns are actively reacting to this news.
• Traders should closely watch key support and resistance zones for $BTC . 📊 MARKET IMPLICATIONS:
As volatility expands across the broader digital asset space, $BTC continues to be a central focal point for market momentum. Monitor order-book depth and funding rates for confirmation before entering high-leverage positions. 💬 COMMUNITY PULSE:
How do you see this impacting the market this week? Are you Bullish 🟢 or Bearish 🔴 on $BTC ? Let us know in the comments below! 👇 ━━━━━━━━━━━━━━━━━━━━━
$BTC #BinanceSquare #CryptoNews
📌 KEY HIGHLIGHTS (TL;DR):
• After banks lost their push for tighter stablecoin rules in the failed Clarity Act, JP Morgan scored a narrower win as Visa moves to stop meme coin purchases from being coded as ordinary "digital media" and earning card rewards.
• Institutional flow and liquidity patterns are actively reacting to this news.
• Traders should closely watch key support and resistance zones for $BTC . 📊 MARKET IMPLICATIONS:
As volatility expands across the broader digital asset space, $BTC continues to be a central focal point for market momentum. Monitor order-book depth and funding rates for confirmation before entering high-leverage positions. 💬 COMMUNITY PULSE:
How do you see this impacting the market this week? Are you Bullish 🟢 or Bearish 🔴 on $BTC ? Let us know in the comments below! 👇 ━━━━━━━━━━━━━━━━━━━━━
$BTC #BinanceSquare #CryptoNews

20
·
--
BNB, something’s a bit off in these 15 minutes.
The price is down 0.82%, volume has immediately surged to 4.1x, aggressive trading is weaker by -16.2%, and the buy/sell ratio is 0.72—sell pressure is in control.
The key is this: OI (15m) is +0.60%, (1h) is +0.80%. While price is falling, open interest is rising. This isn’t long capitulation—it looks more like new shorts entering with leverage. Even though the notional change is still negative, the OI abnormal percentile is 58.7%, ranking #34 in the whole pool; notional change ranks #11. That means this structural shift is relatively prominent in the pool.
At the close, price has already broken below the lower band of the last ~20 5m candles. With over 4x volume aligned with the direction, short-term sentiment is bearish.
However, the OI notional change isn’t actually that big: -1.19M / -2.93M. The short position size backed by real money isn’t that large. Next, watch two things: if price keeps getting pressured but OI doesn’t rise, then shorts are just probing; if OI drops quickly during a rebound, then this batch of shorts will run faster than anyone.
$BNB
BNB, something’s a bit off in these 15 minutes.
The price is down 0.82%, volume has immediately surged to 4.1x, aggressive trading is weaker by -16.2%, and the buy/sell ratio is 0.72—sell pressure is in control.
The key is this: OI (15m) is +0.60%, (1h) is +0.80%. While price is falling, open interest is rising. This isn’t long capitulation—it looks more like new shorts entering with leverage. Even though the notional change is still negative, the OI abnormal percentile is 58.7%, ranking #34 in the whole pool; notional change ranks #11. That means this structural shift is relatively prominent in the pool.
At the close, price has already broken below the lower band of the last ~20 5m candles. With over 4x volume aligned with the direction, short-term sentiment is bearish.
However, the OI notional change isn’t actually that big: -1.19M / -2.93M. The short position size backed by real money isn’t that large. Next, watch two things: if price keeps getting pressured but OI doesn’t rise, then shorts are just probing; if OI drops quickly during a rebound, then this batch of shorts will run faster than anyone.
$BNB
The price is down 0.82%, volume has immediately surged to 4.1x, aggressive trading is weaker by -16.2%, and the buy/sell ratio is 0.72—sell pressure is in control.
The key is this: OI (15m) is +0.60%, (1h) is +0.80%. While price is falling, open interest is rising. This isn’t long capitulation—it looks more like new shorts entering with leverage. Even though the notional change is still negative, the OI abnormal percentile is 58.7%, ranking #34 in the whole pool; notional change ranks #11. That means this structural shift is relatively prominent in the pool.
At the close, price has already broken below the lower band of the last ~20 5m candles. With over 4x volume aligned with the direction, short-term sentiment is bearish.
However, the OI notional change isn’t actually that big: -1.19M / -2.93M. The short position size backed by real money isn’t that large. Next, watch two things: if price keeps getting pressured but OI doesn’t rise, then shorts are just probing; if OI drops quickly during a rebound, then this batch of shorts will run faster than anyone.
$BNB
43
·
--
$CELR 15m directly surged 5%. Volume-to-liquidity is 1.81x, and the Z-score is 3.6—this isn’t playing around.
What’s interesting is the OI: on 15m it’s +1.23%, on 1h it’s +3.5%, nominal change +12%. There are clear signs of new leveraged long positions coming in—this isn’t an air-pump.
The closing price just broke above the upper band of the latest ~20 5m candles. Active trade delta is +6.1%, buy/sell ratio is 1.13—buyers are pushing. In the abnormal pool ranking, it’s #28; nominal change rank #34. 24h trading volume is 330 million U—this depth is enough. It doesn’t feel like some small coin spikes and then gets dumped.
Funding rate is also at a relatively high percentile recently. Still—watch out. Don’t chase the top. I like this kind of structure, but I won’t chase; I’ll wait for a pullback and see how well it holds. $CELR
$CELR 15m directly surged 5%. Volume-to-liquidity is 1.81x, and the Z-score is 3.6—this isn’t playing around.
What’s interesting is the OI: on 15m it’s +1.23%, on 1h it’s +3.5%, nominal change +12%. There are clear signs of new leveraged long positions coming in—this isn’t an air-pump.
The closing price just broke above the upper band of the latest ~20 5m candles. Active trade delta is +6.1%, buy/sell ratio is 1.13—buyers are pushing. In the abnormal pool ranking, it’s #28; nominal change rank #34. 24h trading volume is 330 million U—this depth is enough. It doesn’t feel like some small coin spikes and then gets dumped.
Funding rate is also at a relatively high percentile recently. Still—watch out. Don’t chase the top. I like this kind of structure, but I won’t chase; I’ll wait for a pullback and see how well it holds. $CELR
What’s interesting is the OI: on 15m it’s +1.23%, on 1h it’s +3.5%, nominal change +12%. There are clear signs of new leveraged long positions coming in—this isn’t an air-pump.
The closing price just broke above the upper band of the latest ~20 5m candles. Active trade delta is +6.1%, buy/sell ratio is 1.13—buyers are pushing. In the abnormal pool ranking, it’s #28; nominal change rank #34. 24h trading volume is 330 million U—this depth is enough. It doesn’t feel like some small coin spikes and then gets dumped.
Funding rate is also at a relatively high percentile recently. Still—watch out. Don’t chase the top. I like this kind of structure, but I won’t chase; I’ll wait for a pullback and see how well it holds. $CELR
5

·
--
PIEVERSE This one’s kind of interesting.
On the 15m chart, it directly jumped 2.15%. Volume reached 1.67x, and the Z value is 5.02—this isn’t the kind of fake move where it randomly flicks up in a slow bleed. The key is that OI is rising along with it: 15m +0.11%, 1h +0.31%. Nominal change adds up to nearly 950k U. The abnormal percentile is 86.3%, ranking #34 in the whole pool. Price is up and OI is up—structurally it looks more like new leveraged longs entering, rather than shorts being squeezed.
The closing price has already broken above the top edge of the last ~20 consecutive 5m ranges. 24h trading value is 50.21M—liquidity looks sufficient. Taker buy-sell gap is 1.4%, buy/sell ratio is 1.03. The tape is bullish, but not to the point of extreme overcrowding.
At this level, it’s either the first step of a trend launch, or a liquidity trap before a “pin.” I’ll keep watching—no rush to chase.
PIEVERSE This one’s kind of interesting.
On the 15m chart, it directly jumped 2.15%. Volume reached 1.67x, and the Z value is 5.02—this isn’t the kind of fake move where it randomly flicks up in a slow bleed. The key is that OI is rising along with it: 15m +0.11%, 1h +0.31%. Nominal change adds up to nearly 950k U. The abnormal percentile is 86.3%, ranking #34 in the whole pool. Price is up and OI is up—structurally it looks more like new leveraged longs entering, rather than shorts being squeezed.
The closing price has already broken above the top edge of the last ~20 consecutive 5m ranges. 24h trading value is 50.21M—liquidity looks sufficient. Taker buy-sell gap is 1.4%, buy/sell ratio is 1.03. The tape is bullish, but not to the point of extreme overcrowding.
At this level, it’s either the first step of a trend launch, or a liquidity trap before a “pin.” I’ll keep watching—no rush to chase.
On the 15m chart, it directly jumped 2.15%. Volume reached 1.67x, and the Z value is 5.02—this isn’t the kind of fake move where it randomly flicks up in a slow bleed. The key is that OI is rising along with it: 15m +0.11%, 1h +0.31%. Nominal change adds up to nearly 950k U. The abnormal percentile is 86.3%, ranking #34 in the whole pool. Price is up and OI is up—structurally it looks more like new leveraged longs entering, rather than shorts being squeezed.
The closing price has already broken above the top edge of the last ~20 consecutive 5m ranges. 24h trading value is 50.21M—liquidity looks sufficient. Taker buy-sell gap is 1.4%, buy/sell ratio is 1.03. The tape is bullish, but not to the point of extreme overcrowding.
At this level, it’s either the first step of a trend launch, or a liquidity trap before a “pin.” I’ll keep watching—no rush to chase.
9

·
--
DOT This drop isn’t that savage, but the structure is pretty ugly. On the 15m timeframe, volume surged to 3.68x of normal directly. Price broke below the lower edge of the past ~20 5m candles. The buy/sell ratio is 0.58, and sell pressure is clearly dominant. More importantly, OI is falling—15m -0.03%, 1h -0.16%, with a nominal decrease of 1.1M. This isn’t new shorts rushing in to smash; it’s longs pulling back, either through stop-losses or passive de-risking.
The OI abnormal percentile is already at 93.3%. In the whole pool it ranks at #34, with nominal change at #31. This has been happening across several consecutive cycles, while volume is still expanding—suggesting it’s not just a single needle-like move. 24h trading value is 64.95M; the pool still has attention, but the direction is shifting toward contraction.
My take: this combination of downside + OI decreasing is cleaner than just a volume expansion sell-off—at least it’s not shorts adding to chase the kill. But that doesn’t mean it’s tradable to catch, either. When leverage is retreating, price usually still has momentum. After breaking the lower bound of the range, first look to see whether volume can bring it back. Until the active trade imbalance of -26.7% is repaired, don’t rush to buy the dip.
$DOT
DOT This drop isn’t that savage, but the structure is pretty ugly. On the 15m timeframe, volume surged to 3.68x of normal directly. Price broke below the lower edge of the past ~20 5m candles. The buy/sell ratio is 0.58, and sell pressure is clearly dominant. More importantly, OI is falling—15m -0.03%, 1h -0.16%, with a nominal decrease of 1.1M. This isn’t new shorts rushing in to smash; it’s longs pulling back, either through stop-losses or passive de-risking.
The OI abnormal percentile is already at 93.3%. In the whole pool it ranks at #34, with nominal change at #31. This has been happening across several consecutive cycles, while volume is still expanding—suggesting it’s not just a single needle-like move. 24h trading value is 64.95M; the pool still has attention, but the direction is shifting toward contraction.
My take: this combination of downside + OI decreasing is cleaner than just a volume expansion sell-off—at least it’s not shorts adding to chase the kill. But that doesn’t mean it’s tradable to catch, either. When leverage is retreating, price usually still has momentum. After breaking the lower bound of the range, first look to see whether volume can bring it back. Until the active trade imbalance of -26.7% is repaired, don’t rush to buy the dip.
$DOT
The OI abnormal percentile is already at 93.3%. In the whole pool it ranks at #34, with nominal change at #31. This has been happening across several consecutive cycles, while volume is still expanding—suggesting it’s not just a single needle-like move. 24h trading value is 64.95M; the pool still has attention, but the direction is shifting toward contraction.
My take: this combination of downside + OI decreasing is cleaner than just a volume expansion sell-off—at least it’s not shorts adding to chase the kill. But that doesn’t mean it’s tradable to catch, either. When leverage is retreating, price usually still has momentum. After breaking the lower bound of the range, first look to see whether volume can bring it back. Until the active trade imbalance of -26.7% is repaired, don’t rush to buy the dip.
$DOT
5

·
--
📡 SHADOW OPEN 🟣 | OPUSDT~1000SATSUSDT
Strategy: Pairs Z-Confirm
Shadow ID: #34
Model: PAIRS_Z_CONFIRM_SHADOW_V1
Legs: SHORT OPUSDT / LONG 1000SATSUSDT
Entry spread: A 0.119504138 | B 0.0000111834 | Z +2.66 → +2.55
Notional: 171.54 USDT
Margin: 17.15 USDT | Risk: 1.00 USDT
Leverage Shadow: 10x
UTC Open: 2026-09-19 01:00:27
Shadow simulation from LegelBOT. This is not a real order or financial advice.
$OP $1000SATS #Crypto #Trading #LegelBOT
📡 SHADOW OPEN 🟣 | OPUSDT~1000SATSUSDT
Strategy: Pairs Z-Confirm
Shadow ID: #34
Model: PAIRS_Z_CONFIRM_SHADOW_V1
Legs: SHORT OPUSDT / LONG 1000SATSUSDT
Entry spread: A 0.119504138 | B 0.0000111834 | Z +2.66 → +2.55
Notional: 171.54 USDT
Margin: 17.15 USDT | Risk: 1.00 USDT
Leverage Shadow: 10x
UTC Open: 2026-09-19 01:00:27
Shadow simulation from LegelBOT. This is not a real order or financial advice.
$OP $1000SATS #Crypto #Trading #LegelBOT
Strategy: Pairs Z-Confirm
Shadow ID: #34
Model: PAIRS_Z_CONFIRM_SHADOW_V1
Legs: SHORT OPUSDT / LONG 1000SATSUSDT
Entry spread: A 0.119504138 | B 0.0000111834 | Z +2.66 → +2.55
Notional: 171.54 USDT
Margin: 17.15 USDT | Risk: 1.00 USDT
Leverage Shadow: 10x
UTC Open: 2026-09-19 01:00:27
Shadow simulation from LegelBOT. This is not a real order or financial advice.
$OP $1000SATS #Crypto #Trading #LegelBOT
88

·
--
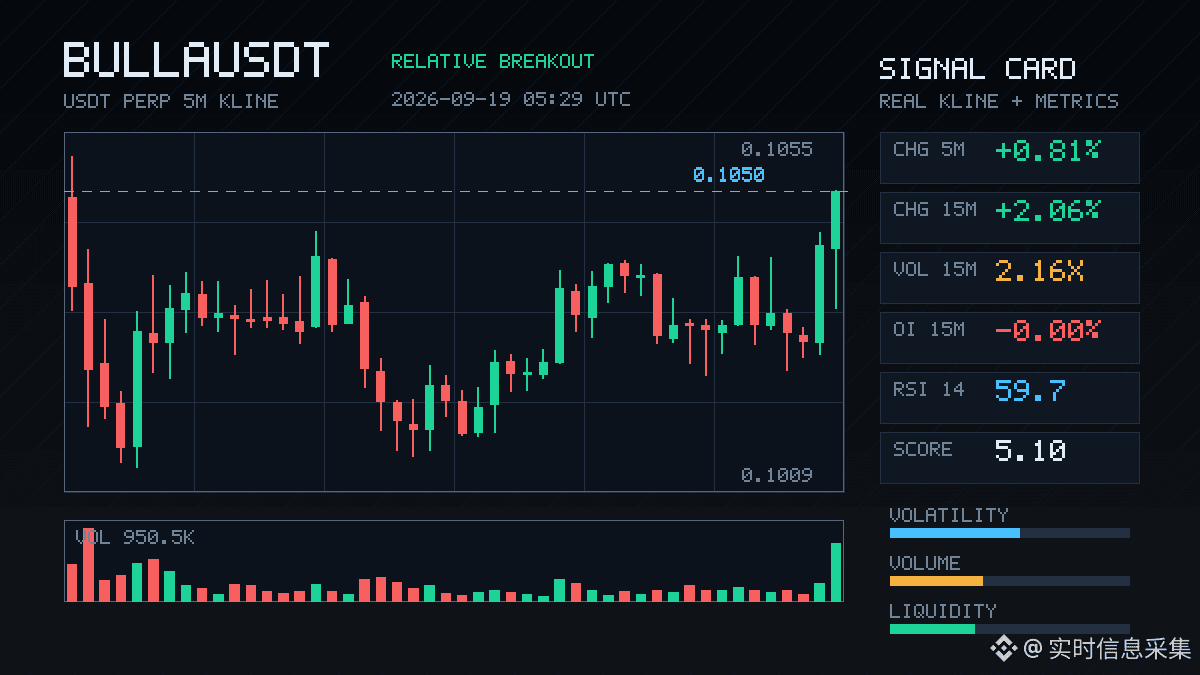
$BULLA This pull on the 15m looks pretty interesting.
A +2.06% gain, yet the trading volume directly reaches 2.16× the normal level. The Z value is also 2.16, so the volume-price coordination is fairly standard. The most important point: the price has broken above the upper band of the past 20 consecutive 5m K lines. Active trade imbalance is +9.6%, and the buy/sell ratio is 1.21—this suggests the buy-side is genuinely pushing.
But when you look at OI, things get a bit subtle. The 15m OI change is -0.00%, and for 1h it’s -0.09%. Although the nominal changes are positive ( +223K / +117K ), the contract open interest hasn’t really caught up. Price is rising while open interest stays flat or even dips slightly. This structure looks more like short covering or short-term position rebalancing, not new longs making a big entry.
The OI abnormal percentile is 89.7% (overall pool #12). The nominal change ranks #34—high abnormality, but the nominal size isn’t especially outrageous. The 24h turnover is 11.28M, and the float isn’t large. With this kind of volume, it’s definitely easy to trigger signals.
My take: the short-term breakout is real, but its follow-through depends on whether the subsequent OI can turn positive. If it’s just shorts getting squeezed and then they unwind, the probability of a push-up followed by a pullback isn’t low. Before chasing, make sure you understand what exactly you’re betting on.
$BULLA This pull on the 15m looks pretty interesting.
A +2.06% gain, yet the trading volume directly reaches 2.16× the normal level. The Z value is also 2.16, so the volume-price coordination is fairly standard. The most important point: the price has broken above the upper band of the past 20 consecutive 5m K lines. Active trade imbalance is +9.6%, and the buy/sell ratio is 1.21—this suggests the buy-side is genuinely pushing.
But when you look at OI, things get a bit subtle. The 15m OI change is -0.00%, and for 1h it’s -0.09%. Although the nominal changes are positive ( +223K / +117K ), the contract open interest hasn’t really caught up. Price is rising while open interest stays flat or even dips slightly. This structure looks more like short covering or short-term position rebalancing, not new longs making a big entry.
The OI abnormal percentile is 89.7% (overall pool #12). The nominal change ranks #34—high abnormality, but the nominal size isn’t especially outrageous. The 24h turnover is 11.28M, and the float isn’t large. With this kind of volume, it’s definitely easy to trigger signals.
My take: the short-term breakout is real, but its follow-through depends on whether the subsequent OI can turn positive. If it’s just shorts getting squeezed and then they unwind, the probability of a push-up followed by a pullback isn’t low. Before chasing, make sure you understand what exactly you’re betting on.
A +2.06% gain, yet the trading volume directly reaches 2.16× the normal level. The Z value is also 2.16, so the volume-price coordination is fairly standard. The most important point: the price has broken above the upper band of the past 20 consecutive 5m K lines. Active trade imbalance is +9.6%, and the buy/sell ratio is 1.21—this suggests the buy-side is genuinely pushing.
But when you look at OI, things get a bit subtle. The 15m OI change is -0.00%, and for 1h it’s -0.09%. Although the nominal changes are positive ( +223K / +117K ), the contract open interest hasn’t really caught up. Price is rising while open interest stays flat or even dips slightly. This structure looks more like short covering or short-term position rebalancing, not new longs making a big entry.
The OI abnormal percentile is 89.7% (overall pool #12). The nominal change ranks #34—high abnormality, but the nominal size isn’t especially outrageous. The 24h turnover is 11.28M, and the float isn’t large. With this kind of volume, it’s definitely easy to trigger signals.
My take: the short-term breakout is real, but its follow-through depends on whether the subsequent OI can turn positive. If it’s just shorts getting squeezed and then they unwind, the probability of a push-up followed by a pullback isn’t low. Before chasing, make sure you understand what exactly you’re betting on.
22
·
--
$AIN This drop is a bit brutal—on the 15m chart it’s directly -3.18%. Volume jumped to 2.96x, the Z value is 3.41—clearly not a normal fluctuation.
The structure is even more interesting: as price falls, OI is also dropping. Nominal funding change is -410K on the 1h timeframe and -288K on the 15m. This doesn’t look like fresh shorts rushing in to slam the market; it feels more like longs are de-leveraging / getting stopped out on their own. Position size is contracting.
Aggressive trade imbalance is -36.5%, buy/sell ratio is 0.47, with sell pressure acting more aggressively. Even the close broke below the lower edge of the last ~20 consecutive 5m candles.
OI’s abnormal percentile is 99%, in the full pool #5, nominal change #34—this kind of movement is among the earlier, more significant ones in the full pool. Over the past 24h, trading value is 23.68M, and depth confirms that the volume isn’t fake.
My interpretation: a deleveraging-style drop near a historical extreme range—not simply a hunt by shorts. After this kind of structure, either there will be a quick rebound and repair, or it will keep drifting lower to find the next support. Since positions have already shrunk, the risk-reward of chasing shorts is getting worse, but bottom-fishing still needs a signal that the aggressive sell pressure is exhausted.
For now, I’ll just watch—no rush to act.
$AIN This drop is a bit brutal—on the 15m chart it’s directly -3.18%. Volume jumped to 2.96x, the Z value is 3.41—clearly not a normal fluctuation.
The structure is even more interesting: as price falls, OI is also dropping. Nominal funding change is -410K on the 1h timeframe and -288K on the 15m. This doesn’t look like fresh shorts rushing in to slam the market; it feels more like longs are de-leveraging / getting stopped out on their own. Position size is contracting.
Aggressive trade imbalance is -36.5%, buy/sell ratio is 0.47, with sell pressure acting more aggressively. Even the close broke below the lower edge of the last ~20 consecutive 5m candles.
OI’s abnormal percentile is 99%, in the full pool #5, nominal change #34—this kind of movement is among the earlier, more significant ones in the full pool. Over the past 24h, trading value is 23.68M, and depth confirms that the volume isn’t fake.
My interpretation: a deleveraging-style drop near a historical extreme range—not simply a hunt by shorts. After this kind of structure, either there will be a quick rebound and repair, or it will keep drifting lower to find the next support. Since positions have already shrunk, the risk-reward of chasing shorts is getting worse, but bottom-fishing still needs a signal that the aggressive sell pressure is exhausted.
For now, I’ll just watch—no rush to act.
The structure is even more interesting: as price falls, OI is also dropping. Nominal funding change is -410K on the 1h timeframe and -288K on the 15m. This doesn’t look like fresh shorts rushing in to slam the market; it feels more like longs are de-leveraging / getting stopped out on their own. Position size is contracting.
Aggressive trade imbalance is -36.5%, buy/sell ratio is 0.47, with sell pressure acting more aggressively. Even the close broke below the lower edge of the last ~20 consecutive 5m candles.
OI’s abnormal percentile is 99%, in the full pool #5, nominal change #34—this kind of movement is among the earlier, more significant ones in the full pool. Over the past 24h, trading value is 23.68M, and depth confirms that the volume isn’t fake.
My interpretation: a deleveraging-style drop near a historical extreme range—not simply a hunt by shorts. After this kind of structure, either there will be a quick rebound and repair, or it will keep drifting lower to find the next support. Since positions have already shrunk, the risk-reward of chasing shorts is getting worse, but bottom-fishing still needs a signal that the aggressive sell pressure is exhausted.
For now, I’ll just watch—no rush to act.
16

·
--
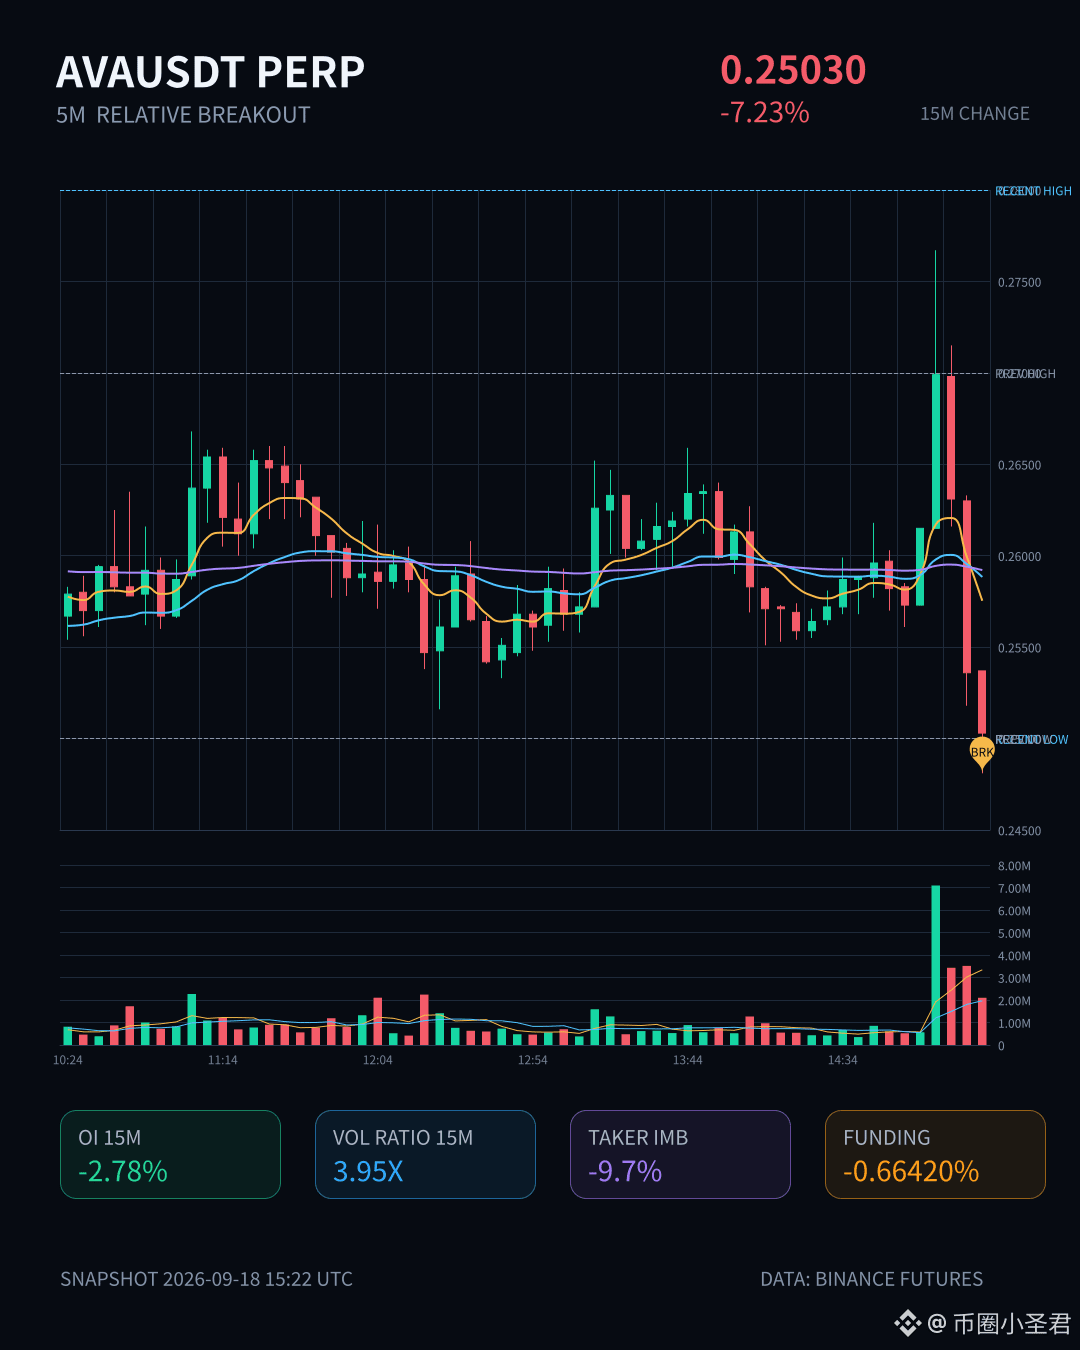
$AVA This one’s sold down pretty cleanly—within 15m it’s down directly -7.23%. Trading volume hit about 3.95 times the normal level. The Z value is 5.75, which is typical of cases where someone runs first.
Price broke below the lower edge of the recent 20-5m range. Passive trading shortfall is -9.7%, buy-sell ratio 0.82, and sell pressure is real. But interestingly, OI is also falling—15m -2.78%, 1h -3.38%. Even though the nominal change isn’t huge (-301K / -242K USDT), the direction matches the price. It looks more like longs de-leveraging and stop-losses being swept, rather than new shorts piling in aggressively.
The funding rate is still in the high percentile recently—this is a bit uncomfortable: longs are crowded in there, but price can’t hold first, so positions are being passively cut. OI abnormal percentile is 84.5%, and the overall pool’s nominal change ranks at #34, suggesting this isn’t an isolated event—people in the pool are adjusting positions in sync.
Over the past 24h, turnover is 296M. Liquidity isn’t lacking, but the current structure is “down + reducing positions,” not “down + adding positions.” The former is more like a washout; only the latter signals a real trend. Let’s see whether price can quickly reclaim the lower boundary of this range. If it can’t, the next wave of stop-losses may still be ahead.
$AVA This one’s sold down pretty cleanly—within 15m it’s down directly -7.23%. Trading volume hit about 3.95 times the normal level. The Z value is 5.75, which is typical of cases where someone runs first.
Price broke below the lower edge of the recent 20-5m range. Passive trading shortfall is -9.7%, buy-sell ratio 0.82, and sell pressure is real. But interestingly, OI is also falling—15m -2.78%, 1h -3.38%. Even though the nominal change isn’t huge (-301K / -242K USDT), the direction matches the price. It looks more like longs de-leveraging and stop-losses being swept, rather than new shorts piling in aggressively.
The funding rate is still in the high percentile recently—this is a bit uncomfortable: longs are crowded in there, but price can’t hold first, so positions are being passively cut. OI abnormal percentile is 84.5%, and the overall pool’s nominal change ranks at #34, suggesting this isn’t an isolated event—people in the pool are adjusting positions in sync.
Over the past 24h, turnover is 296M. Liquidity isn’t lacking, but the current structure is “down + reducing positions,” not “down + adding positions.” The former is more like a washout; only the latter signals a real trend. Let’s see whether price can quickly reclaim the lower boundary of this range. If it can’t, the next wave of stop-losses may still be ahead.
Price broke below the lower edge of the recent 20-5m range. Passive trading shortfall is -9.7%, buy-sell ratio 0.82, and sell pressure is real. But interestingly, OI is also falling—15m -2.78%, 1h -3.38%. Even though the nominal change isn’t huge (-301K / -242K USDT), the direction matches the price. It looks more like longs de-leveraging and stop-losses being swept, rather than new shorts piling in aggressively.
The funding rate is still in the high percentile recently—this is a bit uncomfortable: longs are crowded in there, but price can’t hold first, so positions are being passively cut. OI abnormal percentile is 84.5%, and the overall pool’s nominal change ranks at #34, suggesting this isn’t an isolated event—people in the pool are adjusting positions in sync.
Over the past 24h, turnover is 296M. Liquidity isn’t lacking, but the current structure is “down + reducing positions,” not “down + adding positions.” The former is more like a washout; only the latter signals a real trend. Let’s see whether price can quickly reclaim the lower boundary of this range. If it can’t, the next wave of stop-losses may still be ahead.
13
·
--
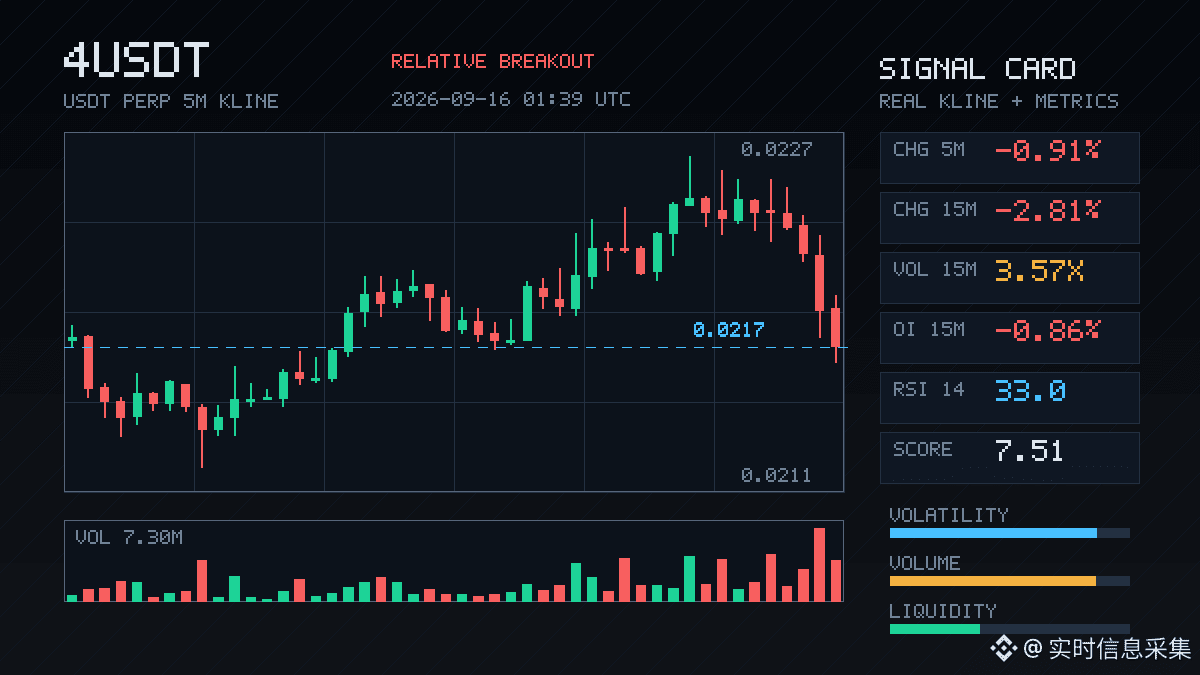
$4 This spot is kind of interesting.
In 15m, it just got hammered down 2.81%. Volume surged to 3.57x, volatility Z at 3.45. The close broke below the lower boundary of the recent 20 five-minute range.
Active volume imbalance is -14%, buy/sell ratio is 0.75, and sell pressure is pushing.
But the key point isn’t this bearish candle by itself—OI on 15m is -0.86%, nominally down 346K. The 1h timeframe is contracting as well. Price drops while OI falls: this doesn’t look like fresh shorts entering; it looks more like longs deleveraging, stop-losses getting swept, or positions being deliberately reduced. The abnormal percentile is 98.2%, ranking 9th in the whole pool, and several consecutive cycles are extending the pattern. This signal is worth watching more than the raw magnitude of the drop.
The 24h traded value is only 13M. The nominal change ranks #34 in the whole pool, which suggests this pool wasn’t thick to begin with—small position shifts can easily print extreme readings.
It’s approaching its own historical extreme zone. In this kind of structure, I don’t really want to catch the falling knife, and I’m not in a hurry to chase shorts. Deleveraging-type selloffs often aren’t the start of a new trend—they’re more about position clearing. Let’s wait for OI to stabilize and for the trade direction to show a clear bias before deciding.
$4 This spot is kind of interesting.
In 15m, it just got hammered down 2.81%. Volume surged to 3.57x, volatility Z at 3.45. The close broke below the lower boundary of the recent 20 five-minute range.
Active volume imbalance is -14%, buy/sell ratio is 0.75, and sell pressure is pushing.
But the key point isn’t this bearish candle by itself—OI on 15m is -0.86%, nominally down 346K. The 1h timeframe is contracting as well. Price drops while OI falls: this doesn’t look like fresh shorts entering; it looks more like longs deleveraging, stop-losses getting swept, or positions being deliberately reduced. The abnormal percentile is 98.2%, ranking 9th in the whole pool, and several consecutive cycles are extending the pattern. This signal is worth watching more than the raw magnitude of the drop.
The 24h traded value is only 13M. The nominal change ranks #34 in the whole pool, which suggests this pool wasn’t thick to begin with—small position shifts can easily print extreme readings.
It’s approaching its own historical extreme zone. In this kind of structure, I don’t really want to catch the falling knife, and I’m not in a hurry to chase shorts. Deleveraging-type selloffs often aren’t the start of a new trend—they’re more about position clearing. Let’s wait for OI to stabilize and for the trade direction to show a clear bias before deciding.
In 15m, it just got hammered down 2.81%. Volume surged to 3.57x, volatility Z at 3.45. The close broke below the lower boundary of the recent 20 five-minute range.
Active volume imbalance is -14%, buy/sell ratio is 0.75, and sell pressure is pushing.
But the key point isn’t this bearish candle by itself—OI on 15m is -0.86%, nominally down 346K. The 1h timeframe is contracting as well. Price drops while OI falls: this doesn’t look like fresh shorts entering; it looks more like longs deleveraging, stop-losses getting swept, or positions being deliberately reduced. The abnormal percentile is 98.2%, ranking 9th in the whole pool, and several consecutive cycles are extending the pattern. This signal is worth watching more than the raw magnitude of the drop.
The 24h traded value is only 13M. The nominal change ranks #34 in the whole pool, which suggests this pool wasn’t thick to begin with—small position shifts can easily print extreme readings.
It’s approaching its own historical extreme zone. In this kind of structure, I don’t really want to catch the falling knife, and I’m not in a hurry to chase shorts. Deleveraging-type selloffs often aren’t the start of a new trend—they’re more about position clearing. Let’s wait for OI to stabilize and for the trade direction to show a clear bias before deciding.
51
·
--
FIL This round is kind of interesting. The price at 15m dropped 1.3%, and the trading volume directly hit 6.98x the usual level. Aggressive volume was down by -19.3%, and the buy/sell ratio is 0.68—sell pressure is hitting the market hard, but it’s not the kind of panic-style volume spike. It feels more like someone is actively driving it lower.
What’s even more worth watching is the OI: the 1h contracts are +9.5%, with a notional change of 7.01M USDT, while the price is moving downward. When price falls and OI rises together, this combo usually isn’t short covering—it’s new leveraged shorts entering the market. The 15m OI only increased by 1.59%, suggesting that most of this positioning buildup happened over the past hour, and the timing is fairly concentrated.
The anomaly percentile is 72%. The whole-pool notional change ranks at #34— not at the absolute top tier, but the depth confirmation is there: volume is higher than normal, and the aggressive direction is skewed bearish. This isn’t just a simple emotion-driven spike.
My take: someone kept building shorts continuously around 22:49 and it doesn’t look like small-scale trading. Next, watch this: if the price keeps getting pressed but OI stops rising, it could mean shorts are already positioned and waiting for the cover. If OI keeps piling up while the price holds sideways and doesn’t drop further, be careful—there’s risk of getting squeezed. FIL liquidity is only average, and when leverage gets squeezed, it can throw out big wicks. Don’t pick the wrong side.
FIL This round is kind of interesting. The price at 15m dropped 1.3%, and the trading volume directly hit 6.98x the usual level. Aggressive volume was down by -19.3%, and the buy/sell ratio is 0.68—sell pressure is hitting the market hard, but it’s not the kind of panic-style volume spike. It feels more like someone is actively driving it lower.
What’s even more worth watching is the OI: the 1h contracts are +9.5%, with a notional change of 7.01M USDT, while the price is moving downward. When price falls and OI rises together, this combo usually isn’t short covering—it’s new leveraged shorts entering the market. The 15m OI only increased by 1.59%, suggesting that most of this positioning buildup happened over the past hour, and the timing is fairly concentrated.
The anomaly percentile is 72%. The whole-pool notional change ranks at #34— not at the absolute top tier, but the depth confirmation is there: volume is higher than normal, and the aggressive direction is skewed bearish. This isn’t just a simple emotion-driven spike.
My take: someone kept building shorts continuously around 22:49 and it doesn’t look like small-scale trading. Next, watch this: if the price keeps getting pressed but OI stops rising, it could mean shorts are already positioned and waiting for the cover. If OI keeps piling up while the price holds sideways and doesn’t drop further, be careful—there’s risk of getting squeezed. FIL liquidity is only average, and when leverage gets squeezed, it can throw out big wicks. Don’t pick the wrong side.
What’s even more worth watching is the OI: the 1h contracts are +9.5%, with a notional change of 7.01M USDT, while the price is moving downward. When price falls and OI rises together, this combo usually isn’t short covering—it’s new leveraged shorts entering the market. The 15m OI only increased by 1.59%, suggesting that most of this positioning buildup happened over the past hour, and the timing is fairly concentrated.
The anomaly percentile is 72%. The whole-pool notional change ranks at #34— not at the absolute top tier, but the depth confirmation is there: volume is higher than normal, and the aggressive direction is skewed bearish. This isn’t just a simple emotion-driven spike.
My take: someone kept building shorts continuously around 22:49 and it doesn’t look like small-scale trading. Next, watch this: if the price keeps getting pressed but OI stops rising, it could mean shorts are already positioned and waiting for the cover. If OI keeps piling up while the price holds sideways and doesn’t drop further, be careful—there’s risk of getting squeezed. FIL liquidity is only average, and when leverage gets squeezed, it can throw out big wicks. Don’t pick the wrong side.
28
·
--
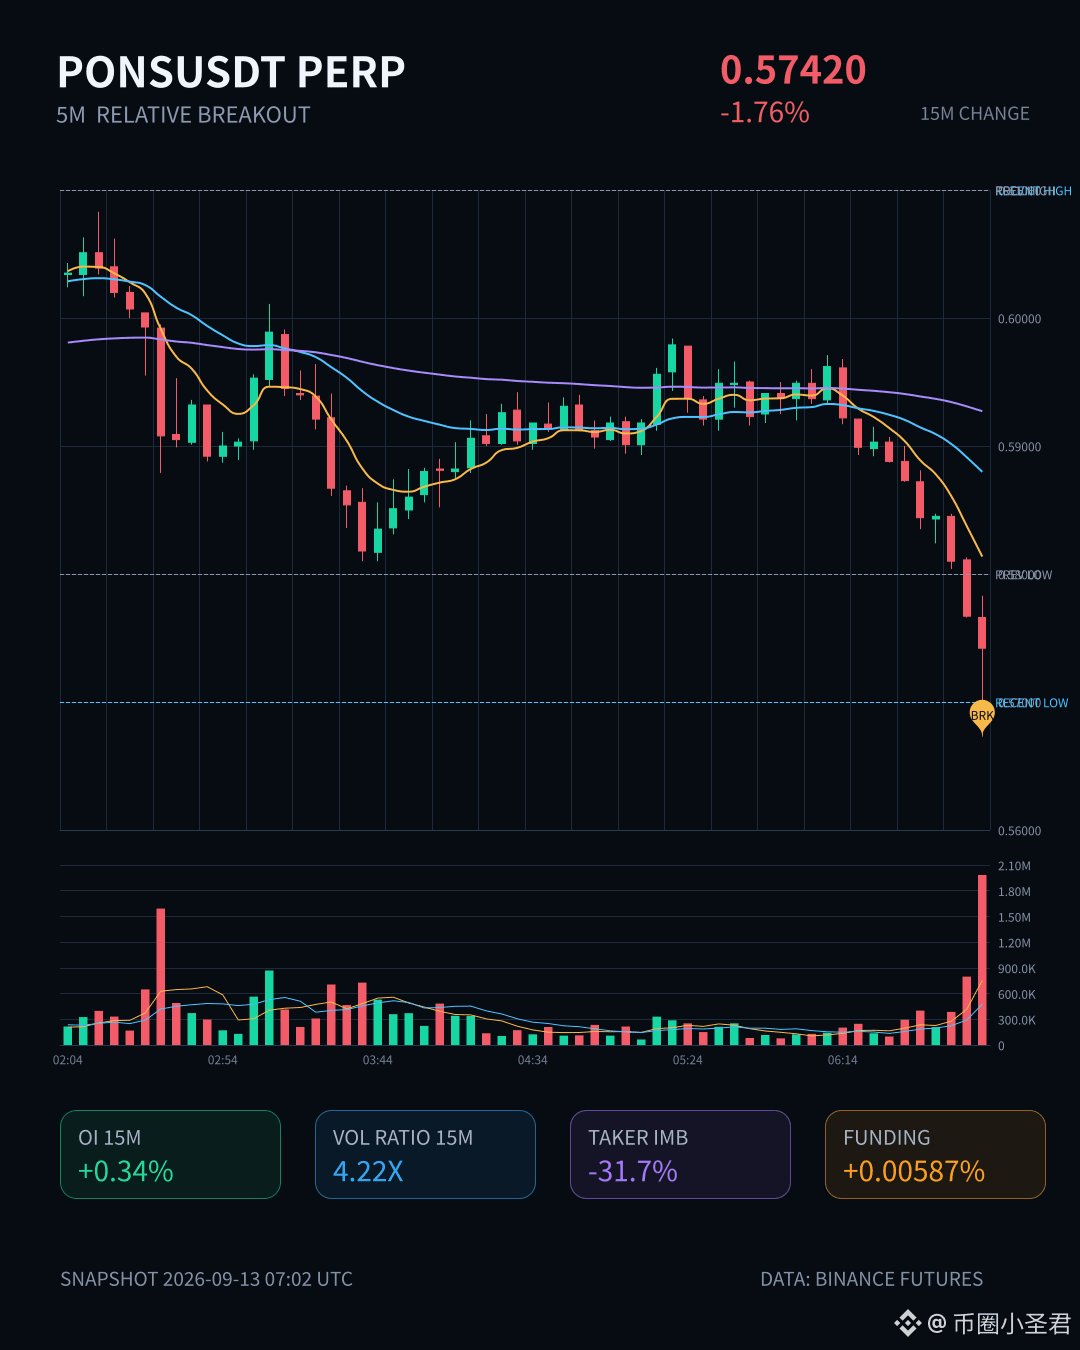
$PONS These last 15 minutes look a bit ugly. The price is down 1.76%, and the volume expansion has jumped straight to 4.22x, with a Z-score of 2.41—this isn’t a slow bleed; there’s capital at work. It’s broken below the lower edge of the past 20 5-minute bars, and the ratio of aggressive buys to sells is 0.52—sell pressure is clearly stronger.
But interestingly, the OI (open interest) shows otherwise: 15m is +0.34%, 1h is +0.20%, while the notional is shrinking. With OI rising, price falling, and notional decreasing, the structure looks more like newly added leveraged short positions coming in to press the move, rather than longs getting swept. The pool’s abnormal percentile is 79.6%, abnormal #34; notional change #19—the ranks on the board are all fairly high.
In the last 24 hours, turnover is 88.58M. With this kind of volume, a 1.76% drop isn’t too severe; the selling pressure isn’t as fierce as you might imagine. Whether the shorts are testing or building positions still depends on whether this 5m bar can reclaim the lower boundary of the range. If you chase a short after a breakdown, keep your eyes open.
$PONS These last 15 minutes look a bit ugly. The price is down 1.76%, and the volume expansion has jumped straight to 4.22x, with a Z-score of 2.41—this isn’t a slow bleed; there’s capital at work. It’s broken below the lower edge of the past 20 5-minute bars, and the ratio of aggressive buys to sells is 0.52—sell pressure is clearly stronger.
But interestingly, the OI (open interest) shows otherwise: 15m is +0.34%, 1h is +0.20%, while the notional is shrinking. With OI rising, price falling, and notional decreasing, the structure looks more like newly added leveraged short positions coming in to press the move, rather than longs getting swept. The pool’s abnormal percentile is 79.6%, abnormal #34; notional change #19—the ranks on the board are all fairly high.
In the last 24 hours, turnover is 88.58M. With this kind of volume, a 1.76% drop isn’t too severe; the selling pressure isn’t as fierce as you might imagine. Whether the shorts are testing or building positions still depends on whether this 5m bar can reclaim the lower boundary of the range. If you chase a short after a breakdown, keep your eyes open.
But interestingly, the OI (open interest) shows otherwise: 15m is +0.34%, 1h is +0.20%, while the notional is shrinking. With OI rising, price falling, and notional decreasing, the structure looks more like newly added leveraged short positions coming in to press the move, rather than longs getting swept. The pool’s abnormal percentile is 79.6%, abnormal #34; notional change #19—the ranks on the board are all fairly high.
In the last 24 hours, turnover is 88.58M. With this kind of volume, a 1.76% drop isn’t too severe; the selling pressure isn’t as fierce as you might imagine. Whether the shorts are testing or building positions still depends on whether this 5m bar can reclaim the lower boundary of the range. If you chase a short after a breakdown, keep your eyes open.
49
·
--
COTI this drop was pretty straightforward—on the 15m timeframe it directly dumped 2.55%. Volume rose to 1.43x, and the price closed below the lower edge of the recent ~20 5m candles. The aggressive order flow gap is -18.5%, and the buy/sell ratio is 0.69, with sell pressure clearly in the lead.
However, looking at OI, the 15m contract is -0.27% and the 1h is -0.77%, and the notional changes are all negative too. The price fell while OI dropped; this looks more like longs deleveraging or stopping out rather than shorts aggressively piling in. This kind of structure is sometimes actually healthier than a simple smash-down—at least it’s not “the more it falls, the more people open shorts.”
The pool’s abnormal percentile is 75.6%, and the notional change ranks at #34. In the past 24h, traded value is a bit over 40M. It’s not extremely crazy, but there is definitely capital moving. Next, let’s see whether price can reclaim the lower edge of this range. If it can’t, the next level may still have room to move.
COTI this drop was pretty straightforward—on the 15m timeframe it directly dumped 2.55%. Volume rose to 1.43x, and the price closed below the lower edge of the recent ~20 5m candles. The aggressive order flow gap is -18.5%, and the buy/sell ratio is 0.69, with sell pressure clearly in the lead.
However, looking at OI, the 15m contract is -0.27% and the 1h is -0.77%, and the notional changes are all negative too. The price fell while OI dropped; this looks more like longs deleveraging or stopping out rather than shorts aggressively piling in. This kind of structure is sometimes actually healthier than a simple smash-down—at least it’s not “the more it falls, the more people open shorts.”
The pool’s abnormal percentile is 75.6%, and the notional change ranks at #34. In the past 24h, traded value is a bit over 40M. It’s not extremely crazy, but there is definitely capital moving. Next, let’s see whether price can reclaim the lower edge of this range. If it can’t, the next level may still have room to move.
However, looking at OI, the 15m contract is -0.27% and the 1h is -0.77%, and the notional changes are all negative too. The price fell while OI dropped; this looks more like longs deleveraging or stopping out rather than shorts aggressively piling in. This kind of structure is sometimes actually healthier than a simple smash-down—at least it’s not “the more it falls, the more people open shorts.”
The pool’s abnormal percentile is 75.6%, and the notional change ranks at #34. In the past 24h, traded value is a bit over 40M. It’s not extremely crazy, but there is definitely capital moving. Next, let’s see whether price can reclaim the lower edge of this range. If it can’t, the next level may still have room to move.

18
·
--
$4 This one is a bit interesting.
In the 15m timeframe, it directly surged 2.79%. Volume reached 1.78x, the Z-value is 3.04—this isn’t the kind of slow, dragged-out climb; it’s a single push straight up. The closing price broke above the upper edge of nearly 20 consecutive 5m candles. The active trade gap is +41.6%, the buy/sell ratio is 2.42, and the bulls are clearly taking orders and buying decisively.
The key is OI. For the 15m contracts: +1.11% OI, nominal +302K; for the 1h: +0.79%. Price is rising while OI is also increasing—this means new leveraged longs are entering, not some false move from short covering. The OI abnormal percentile is 97.6%, ranking #3 across the pool; nominal change ranks #34. At this kind of extremity, it suggests it’s not just me watching.
24h trading value is 19.68M. The pool isn’t huge, but paired with this breakout structure, there is short-term momentum.
I didn’t chase it myself. The biggest risk at this position is thin liquidity + concentrated leverage. If it pulls back, OI can get trampled. Let’s see whether the retest can hold the upper edge of the prior range first.
$4 This one is a bit interesting.
In the 15m timeframe, it directly surged 2.79%. Volume reached 1.78x, the Z-value is 3.04—this isn’t the kind of slow, dragged-out climb; it’s a single push straight up. The closing price broke above the upper edge of nearly 20 consecutive 5m candles. The active trade gap is +41.6%, the buy/sell ratio is 2.42, and the bulls are clearly taking orders and buying decisively.
The key is OI. For the 15m contracts: +1.11% OI, nominal +302K; for the 1h: +0.79%. Price is rising while OI is also increasing—this means new leveraged longs are entering, not some false move from short covering. The OI abnormal percentile is 97.6%, ranking #3 across the pool; nominal change ranks #34. At this kind of extremity, it suggests it’s not just me watching.
24h trading value is 19.68M. The pool isn’t huge, but paired with this breakout structure, there is short-term momentum.
I didn’t chase it myself. The biggest risk at this position is thin liquidity + concentrated leverage. If it pulls back, OI can get trampled. Let’s see whether the retest can hold the upper edge of the prior range first.
In the 15m timeframe, it directly surged 2.79%. Volume reached 1.78x, the Z-value is 3.04—this isn’t the kind of slow, dragged-out climb; it’s a single push straight up. The closing price broke above the upper edge of nearly 20 consecutive 5m candles. The active trade gap is +41.6%, the buy/sell ratio is 2.42, and the bulls are clearly taking orders and buying decisively.
The key is OI. For the 15m contracts: +1.11% OI, nominal +302K; for the 1h: +0.79%. Price is rising while OI is also increasing—this means new leveraged longs are entering, not some false move from short covering. The OI abnormal percentile is 97.6%, ranking #3 across the pool; nominal change ranks #34. At this kind of extremity, it suggests it’s not just me watching.
24h trading value is 19.68M. The pool isn’t huge, but paired with this breakout structure, there is short-term momentum.
I didn’t chase it myself. The biggest risk at this position is thin liquidity + concentrated leverage. If it pulls back, OI can get trampled. Let’s see whether the retest can hold the upper edge of the prior range first.
2

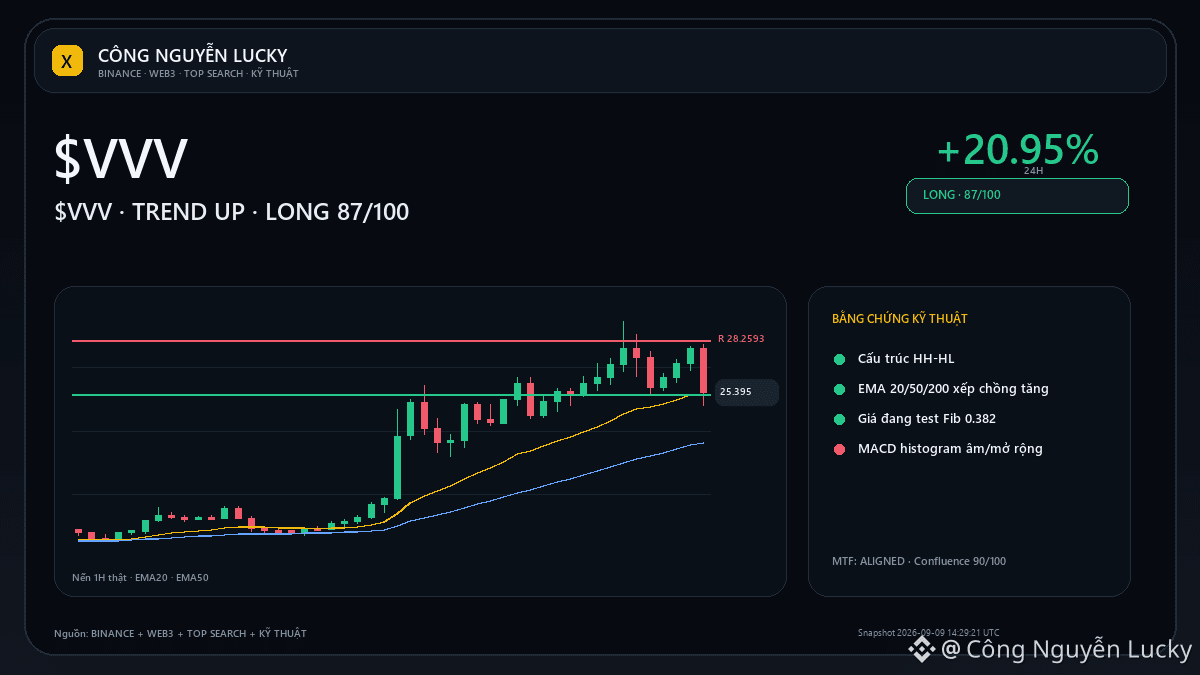
$VVV not only is it increasing/decreasing strongly — the notable point is that it’s outperforming $BTC to +19.74 points %.
This is a sign of relative strength versus $BTC, but it still needs to be confirmed by flow of funds and structure.
Background data: 25.761 · 24h +20.95% · volume ~707.4M USDT · 6,727,915 trades.
Price is around 58% of the daily range, still about 12.0% below the high.
What I want to confirm next:
• Breaking above 29.289 with expanded volume will make the continuation scenario more convincing.
• Failing to hold the high area and dropping back below the midpoint 25.1175 will make the cooling-off scenario clearer.
📌 LONG/SHORT outlook: **LONG · STRONG · 87/100**.
Key basis: price +20.95% over 24h; stronger than BTC by +19.74 points %; LONG technical setup 90/100 (HH-HL structure, EMA 20/50/200 stacked bullish).
Additional confirmation when: holding above 25.1175 and breaking 29.289 with volume/flow of funds continuing to confirm.
Invalidation/cancellation if: losing 25.1175 together with weaker taker/Leader fund flow.
💬 Sir/Ma’am, do you think $VVV is a continuation or a move that needs to cool down?
🔎 **Evidence check — LONG 87/100**
• 1H: UP TREND; RSI14 53.9; confluence 90/100.
• Notable technicals: HH-HL structure; EMA 20/50/200 stacked bullish.
• 1H and 4H are aligned in direction.
• Price 25.761; 24h +20.95%; volume 707.4M.
• Binance Top Search #34.
🧭 **Key levels to watch:** Support 25.254 · resistance 28.2593 · confirmation: hold above 25.1175 and break 29.289 with volume/fund flow continuing to confirm · invalidation: lose 25.1175 with weakening taker/Leader fund flow
Reference sources: Binance Futures Market + Binance Web3 Trending + Binance Top Search + Binance Klines / Technical · snapshot 2026-09-09 14:29:21 UTC
⚠️ This market analysis is for reference only, not a profit commitment. Everyone should do their own research (DYOR), manage risk themselves, and take responsibility for their trading decisions.
$VVV $BTC
$VVV not only is it increasing/decreasing strongly — the notable point is that it’s outperforming $BTC to +19.74 points %.
This is a sign of relative strength versus $BTC , but it still needs to be confirmed by flow of funds and structure.
Background data: 25.761 · 24h +20.95% · volume ~707.4M USDT · 6,727,915 trades.
Price is around 58% of the daily range, still about 12.0% below the high.
What I want to confirm next:
• Breaking above 29.289 with expanded volume will make the continuation scenario more convincing.
• Failing to hold the high area and dropping back below the midpoint 25.1175 will make the cooling-off scenario clearer.
📌 LONG/SHORT outlook: **LONG · STRONG · 87/100**.
Key basis: price +20.95% over 24h; stronger than BTC by +19.74 points %; LONG technical setup 90/100 (HH-HL structure, EMA 20/50/200 stacked bullish).
Additional confirmation when: holding above 25.1175 and breaking 29.289 with volume/flow of funds continuing to confirm.
Invalidation/cancellation if: losing 25.1175 together with weaker taker/Leader fund flow.
💬 Sir/Ma’am, do you think $VVV is a continuation or a move that needs to cool down?
🔎 **Evidence check — LONG 87/100**
• 1H: UP TREND; RSI14 53.9; confluence 90/100.
• Notable technicals: HH-HL structure; EMA 20/50/200 stacked bullish.
• 1H and 4H are aligned in direction.
• Price 25.761; 24h +20.95%; volume 707.4M.
• Binance Top Search #34.
🧭 **Key levels to watch:** Support 25.254 · resistance 28.2593 · confirmation: hold above 25.1175 and break 29.289 with volume/fund flow continuing to confirm · invalidation: lose 25.1175 with weakening taker/Leader fund flow
Reference sources: Binance Futures Market + Binance Web3 Trending + Binance Top Search + Binance Klines / Technical · snapshot 2026-09-09 14:29:21 UTC
⚠️ This market analysis is for reference only, not a profit commitment. Everyone should do their own research (DYOR), manage risk themselves, and take responsibility for their trading decisions.
$VVV $BTC
This is a sign of relative strength versus $BTC , but it still needs to be confirmed by flow of funds and structure.
Background data: 25.761 · 24h +20.95% · volume ~707.4M USDT · 6,727,915 trades.
Price is around 58% of the daily range, still about 12.0% below the high.
What I want to confirm next:
• Breaking above 29.289 with expanded volume will make the continuation scenario more convincing.
• Failing to hold the high area and dropping back below the midpoint 25.1175 will make the cooling-off scenario clearer.
📌 LONG/SHORT outlook: **LONG · STRONG · 87/100**.
Key basis: price +20.95% over 24h; stronger than BTC by +19.74 points %; LONG technical setup 90/100 (HH-HL structure, EMA 20/50/200 stacked bullish).
Additional confirmation when: holding above 25.1175 and breaking 29.289 with volume/flow of funds continuing to confirm.
Invalidation/cancellation if: losing 25.1175 together with weaker taker/Leader fund flow.
💬 Sir/Ma’am, do you think $VVV is a continuation or a move that needs to cool down?
🔎 **Evidence check — LONG 87/100**
• 1H: UP TREND; RSI14 53.9; confluence 90/100.
• Notable technicals: HH-HL structure; EMA 20/50/200 stacked bullish.
• 1H and 4H are aligned in direction.
• Price 25.761; 24h +20.95%; volume 707.4M.
• Binance Top Search #34.
🧭 **Key levels to watch:** Support 25.254 · resistance 28.2593 · confirmation: hold above 25.1175 and break 29.289 with volume/fund flow continuing to confirm · invalidation: lose 25.1175 with weakening taker/Leader fund flow
Reference sources: Binance Futures Market + Binance Web3 Trending + Binance Top Search + Binance Klines / Technical · snapshot 2026-09-09 14:29:21 UTC
⚠️ This market analysis is for reference only, not a profit commitment. Everyone should do their own research (DYOR), manage risk themselves, and take responsibility for their trading decisions.
$VVV $BTC
138
·
--
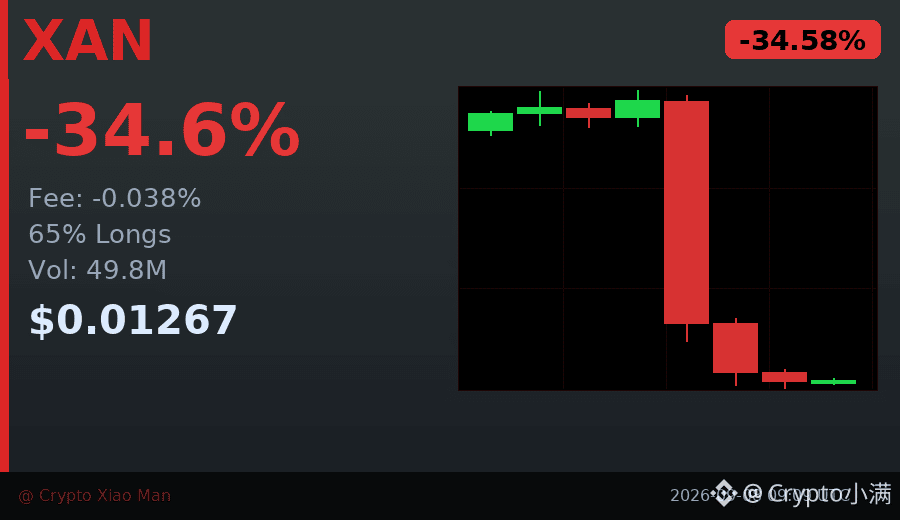
34% down move, but what’s truly worth noting is that the funding rate has already sunk to -0.038%.
XAN was smashed from 0.022 down to 0.0127—within 8 hours, it played out a full “long liquidation squeeze” script.
Trading volume swelled to 49.80 million USDT, and 65% of long positions are now being trapped inside.
This kind of extreme negative funding rate usually means: shorts are too crowded, so you should be careful about a short-term rebound.
That said, the trend hasn’t stabilized yet—bottom fishing right now is like catching a falling knife.
Wait until the candlesticks close with long lower wicks, or until the funding rate returns to neutral, for a safer read.
$XAN #资金费率 #34%跌幅
Click the card below to quickly check the market 👇
34% down move, but what’s truly worth noting is that the funding rate has already sunk to -0.038%.
XAN was smashed from 0.022 down to 0.0127—within 8 hours, it played out a full “long liquidation squeeze” script.
Trading volume swelled to 49.80 million USDT, and 65% of long positions are now being trapped inside.
This kind of extreme negative funding rate usually means: shorts are too crowded, so you should be careful about a short-term rebound.
That said, the trend hasn’t stabilized yet—bottom fishing right now is like catching a falling knife.
Wait until the candlesticks close with long lower wicks, or until the funding rate returns to neutral, for a safer read.
$XAN #资金费率 #34%跌幅
Click the card below to quickly check the market 👇
XAN was smashed from 0.022 down to 0.0127—within 8 hours, it played out a full “long liquidation squeeze” script.
Trading volume swelled to 49.80 million USDT, and 65% of long positions are now being trapped inside.
This kind of extreme negative funding rate usually means: shorts are too crowded, so you should be careful about a short-term rebound.
That said, the trend hasn’t stabilized yet—bottom fishing right now is like catching a falling knife.
Wait until the candlesticks close with long lower wicks, or until the funding rate returns to neutral, for a safer read.
$XAN #资金费率 #34%跌幅
Click the card below to quickly check the market 👇
87
Log in to explore more content
Join global crypto users on Binance Square
⚡️ Get latest and useful information about crypto.
💬 Trusted by the world’s largest crypto exchange.
👍 Discover real insights from verified creators.
Email / Phone number
Trending Topics
1
#AIStocksWhatNext
1.1M views
7,299 Discussing
2
#US10YTreasuryYieldHits19YearHigh
186 views
20 Discussing
3
#SpotBitcoinETFsInflow$2.31BInFourDays
48 views
12 Discussing
4
#BitcoinRejectedAt$87,300Twice
0 views
0 Discussing
5
#BCHJumps28%OnCMEFuturesListing
35,158 views
793 Discussing
6
#WallStreetEarningsRevisionsTurnBearish
25,191 views
584 Discussing
7
#DollarIndexReclaims101
20,980 views
509 Discussing
8
#21SharesLaunchesEuropesFirstZcashETP
63,447 views
1,277 Discussing
9
#CardanoJoinsX402PaymentStandard
39,124 views
900 Discussing
10
#BitcoinTops$87KAtEightMonthHigh
15,750 views
139 Discussing