
#16
16
20,008 views
206 Discussing
Hot
Latest

·
--
$AVA This 15 minutes is a bit interesting.
The price is up 3.85%, and the volume surged to 5.38x. The volatility Z hit 4.56—this isn’t one of those slow, steady climbs; it’s a move upward with volume pushing through.
The key is OI. The 15m contract is only +0.28% on the surface, but the notional change is +4.15%. The abnormal percentile is 94.4%, and it ranks #16 in the whole pool. On the 1h dimension, the notional is still +6.70%, which suggests it’s not just a single needle—there’s accumulation across multiple consecutive cycles.
Price is up, and OI is also up. Structurally, it looks more like new leveraged long positions being added rather than shorts getting squeezed.
The proactive trades are down 18.2%, the buy/sell ratio is 1.44, and the direction is also leaning bullish.
The closing price has just broken above the upper band of its recent 5m K lines (around 20). The 24h trading volume is 31.77M. This level is close to its own historical extreme range—if you’re chasing, weigh the risk yourself; don’t get carried away by the upside.
For now, keep an eye on whether this breakout can hold.
$AVA This 15 minutes is a bit interesting.
The price is up 3.85%, and the volume surged to 5.38x. The volatility Z hit 4.56—this isn’t one of those slow, steady climbs; it’s a move upward with volume pushing through.
The key is OI. The 15m contract is only +0.28% on the surface, but the notional change is +4.15%. The abnormal percentile is 94.4%, and it ranks #16 in the whole pool. On the 1h dimension, the notional is still +6.70%, which suggests it’s not just a single needle—there’s accumulation across multiple consecutive cycles.
Price is up, and OI is also up. Structurally, it looks more like new leveraged long positions being added rather than shorts getting squeezed.
The proactive trades are down 18.2%, the buy/sell ratio is 1.44, and the direction is also leaning bullish.
The closing price has just broken above the upper band of its recent 5m K lines (around 20). The 24h trading volume is 31.77M. This level is close to its own historical extreme range—if you’re chasing, weigh the risk yourself; don’t get carried away by the upside.
For now, keep an eye on whether this breakout can hold.
The price is up 3.85%, and the volume surged to 5.38x. The volatility Z hit 4.56—this isn’t one of those slow, steady climbs; it’s a move upward with volume pushing through.
The key is OI. The 15m contract is only +0.28% on the surface, but the notional change is +4.15%. The abnormal percentile is 94.4%, and it ranks #16 in the whole pool. On the 1h dimension, the notional is still +6.70%, which suggests it’s not just a single needle—there’s accumulation across multiple consecutive cycles.
Price is up, and OI is also up. Structurally, it looks more like new leveraged long positions being added rather than shorts getting squeezed.
The proactive trades are down 18.2%, the buy/sell ratio is 1.44, and the direction is also leaning bullish.
The closing price has just broken above the upper band of its recent 5m K lines (around 20). The 24h trading volume is 31.77M. This level is close to its own historical extreme range—if you’re chasing, weigh the risk yourself; don’t get carried away by the upside.
For now, keep an eye on whether this breakout can hold.
17
·
--
$B2 This 15m has some interesting action.
The price is up 3.72%, and the volume has directly reached 2.86x—this isn’t the kind of breakout on shrinking volume. The key is that OI is rising in sync: 15m +1.51%, 1h +2.00%. Combined, the nominal change adds up to nearly 1 million U. This is new leveraged long positioning, not short covering pushing it up.
The closing price has already broken above the upper edge of nearly 20 of the 5m candles. Active trade value difference is +17.6%, buy-sell ratio is 1.43, and the order flow is tilted toward buyers. 24h trading volume is 227 million, liquidity is sufficient—not some kind of thin book that collapses with a single poke.
In the whole-pool anomaly percentile, it’s at 81.9%. Nominal change ranks #16—toward the front, but not at an extreme. This kind of structure usually suggests there may still be room for continuation, but you also need to watch whether OI suddenly stops—if the price chops sideways while OI keeps climbing, be careful.
First, see whether it can hold and consolidate above the breakout level.
$B2 This 15m has some interesting action.
The price is up 3.72%, and the volume has directly reached 2.86x—this isn’t the kind of breakout on shrinking volume. The key is that OI is rising in sync: 15m +1.51%, 1h +2.00%. Combined, the nominal change adds up to nearly 1 million U. This is new leveraged long positioning, not short covering pushing it up.
The closing price has already broken above the upper edge of nearly 20 of the 5m candles. Active trade value difference is +17.6%, buy-sell ratio is 1.43, and the order flow is tilted toward buyers. 24h trading volume is 227 million, liquidity is sufficient—not some kind of thin book that collapses with a single poke.
In the whole-pool anomaly percentile, it’s at 81.9%. Nominal change ranks #16—toward the front, but not at an extreme. This kind of structure usually suggests there may still be room for continuation, but you also need to watch whether OI suddenly stops—if the price chops sideways while OI keeps climbing, be careful.
First, see whether it can hold and consolidate above the breakout level.
The price is up 3.72%, and the volume has directly reached 2.86x—this isn’t the kind of breakout on shrinking volume. The key is that OI is rising in sync: 15m +1.51%, 1h +2.00%. Combined, the nominal change adds up to nearly 1 million U. This is new leveraged long positioning, not short covering pushing it up.
The closing price has already broken above the upper edge of nearly 20 of the 5m candles. Active trade value difference is +17.6%, buy-sell ratio is 1.43, and the order flow is tilted toward buyers. 24h trading volume is 227 million, liquidity is sufficient—not some kind of thin book that collapses with a single poke.
In the whole-pool anomaly percentile, it’s at 81.9%. Nominal change ranks #16—toward the front, but not at an extreme. This kind of structure usually suggests there may still be room for continuation, but you also need to watch whether OI suddenly stops—if the price chops sideways while OI keeps climbing, be careful.
First, see whether it can hold and consolidate above the breakout level.
4

Article
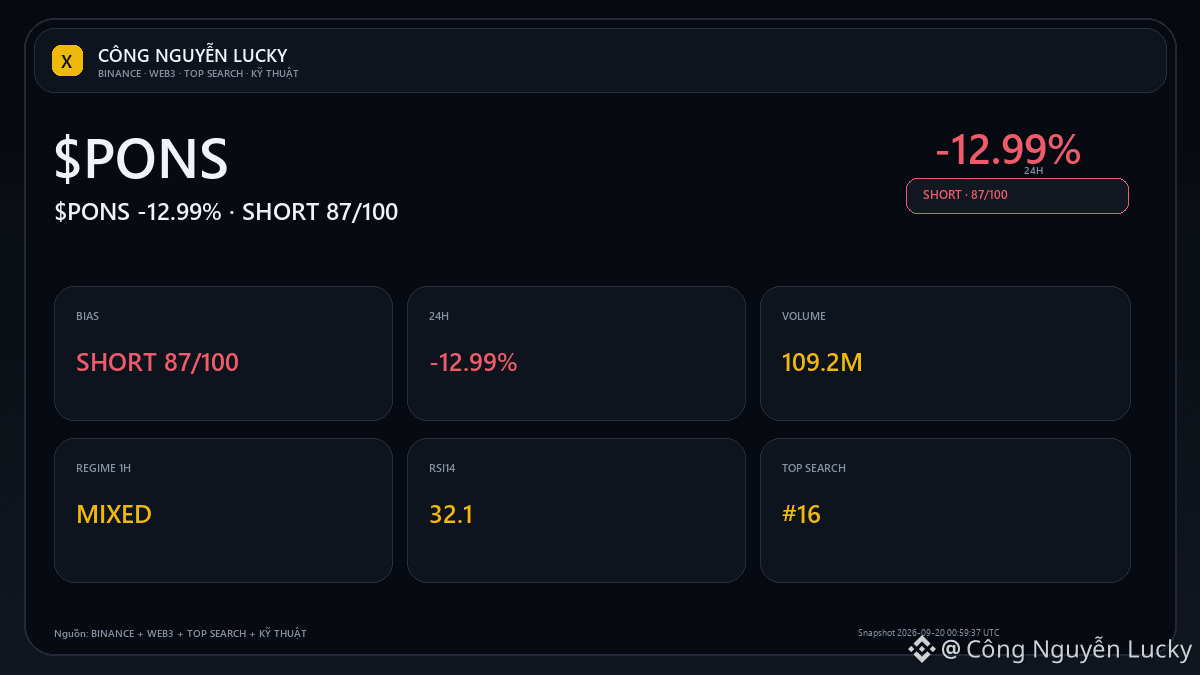
$PONS: the EXPANDING_RANGE structure is controlling the chart🔥 $PONS is -12.99% — but the percentage increase/decrease is not enough to call this a good setup yet. Market: 0.5947 · 24h -12.99% · volume ~109.2M USDT · 934,823 trades.
Swing high near 0.7034 · swing low near 0.6582.
EMA50 0.64252522 · RSI14 32.1 · bias SHORT 50/100. The indicator is used to confirm the structure, not to change the structure. Losing 0.564 or breaking above 0.7034 is the point where the narrative changes most clearly. The technical layers are selected according to the regime:
$PONS: the EXPANDING_RANGE structure is controlling the chart
🔥 $PONS is -12.99% — but the percentage increase/decrease is not enough to call this a good setup yet. Market: 0.5947 · 24h -12.99% · volume ~109.2M USDT · 934,823 trades.
Swing high near 0.7034 · swing low near 0.6582.
EMA50 0.64252522 · RSI14 32.1 · bias SHORT 50/100. The indicator is used to confirm the structure, not to change the structure. Losing 0.564 or breaking above 0.7034 is the point where the narrative changes most clearly. The technical layers are selected according to the regime:
Swing high near 0.7034 · swing low near 0.6582.
EMA50 0.64252522 · RSI14 32.1 · bias SHORT 50/100. The indicator is used to confirm the structure, not to change the structure. Losing 0.564 or breaking above 0.7034 is the point where the narrative changes most clearly. The technical layers are selected according to the regime:
12
·
--
$AAVE There’s a little something on the order book.
In the 15m chart, it directly surged 1.44%, and volume hit 2.66x. This price-volume combination doesn’t really look like a retail trader’s quick, random push. OI is also rising: in the 1h it added 0.83%, nominal at 2.19M. Along with the volume and the buy/sell ratio of the active buy orders at 1.53, it looks more like fresh leveraged longs entering rather than shorts covering.
The more crucial point is that the price closed above the upper boundary of the recent 5m range for nearly 20 candles—basically it’s touching the recent limit. The funding rate is also in the upper percentile, and sentiment isn’t cold.
In the whole pool, the abnormality ranked #12, with nominal change ranking #16—this position isn’t just noise anymore. The 24h trading value is 165M, and the depth is also sufficient.
Watch to see whether it can hold above this range’s upper edge; if it can’t, it’ll still be a fake breakout.
$AAVE There’s a little something on the order book.
In the 15m chart, it directly surged 1.44%, and volume hit 2.66x. This price-volume combination doesn’t really look like a retail trader’s quick, random push. OI is also rising: in the 1h it added 0.83%, nominal at 2.19M. Along with the volume and the buy/sell ratio of the active buy orders at 1.53, it looks more like fresh leveraged longs entering rather than shorts covering.
The more crucial point is that the price closed above the upper boundary of the recent 5m range for nearly 20 candles—basically it’s touching the recent limit. The funding rate is also in the upper percentile, and sentiment isn’t cold.
In the whole pool, the abnormality ranked #12, with nominal change ranking #16—this position isn’t just noise anymore. The 24h trading value is 165M, and the depth is also sufficient.
Watch to see whether it can hold above this range’s upper edge; if it can’t, it’ll still be a fake breakout.
In the 15m chart, it directly surged 1.44%, and volume hit 2.66x. This price-volume combination doesn’t really look like a retail trader’s quick, random push. OI is also rising: in the 1h it added 0.83%, nominal at 2.19M. Along with the volume and the buy/sell ratio of the active buy orders at 1.53, it looks more like fresh leveraged longs entering rather than shorts covering.
The more crucial point is that the price closed above the upper boundary of the recent 5m range for nearly 20 candles—basically it’s touching the recent limit. The funding rate is also in the upper percentile, and sentiment isn’t cold.
In the whole pool, the abnormality ranked #12, with nominal change ranking #16—this position isn’t just noise anymore. The 24h trading value is 165M, and the depth is also sufficient.
Watch to see whether it can hold above this range’s upper edge; if it can’t, it’ll still be a fake breakout.
13
·
--
ADA This move is kind of interesting.
On the 15m timeframe, it directly surged by 1.47%. Volume hit 3.04x, Z value is 4.2—clearly there’s capital entering and causing a stir. Price broke above the upper bounds of the last ~20 consecutive 5m K-bars. The aggressive buy/sell ratio is 1.38, aggressive trade volume is up +16.1%, and the bid side is pushing.
But pay attention to one detail—OI is falling. On the 15m timeframe, OI is -0.32%; on the 1h timeframe, OI is -0.45%. Price is up while positions are down. This kind of structure looks more like short covering or older positions being reduced—not large-scale new longs building fresh positions.
Still, the OI abnormal percentile is 97%. It’s #16 in the pool’s abnormal ranking, with nominal change ranked #14. That indicates the position change itself is extremely abnormal within the pool. Funding rate has also been sitting in high percentiles recently, and multiple consecutive cycles have continued this condition.
In the last 24h, the trading value is 260 million U, and depth is sufficient.
With this kind of structure, I usually take a closer look—if the rally driven by short covering doesn’t get followed by new longs, it can easily turn into a one-off move. But if the funding rate stays high and OI starts to increase again, then it’s a different story.
$ADA
ADA This move is kind of interesting.
On the 15m timeframe, it directly surged by 1.47%. Volume hit 3.04x, Z value is 4.2—clearly there’s capital entering and causing a stir. Price broke above the upper bounds of the last ~20 consecutive 5m K-bars. The aggressive buy/sell ratio is 1.38, aggressive trade volume is up +16.1%, and the bid side is pushing.
But pay attention to one detail—OI is falling. On the 15m timeframe, OI is -0.32%; on the 1h timeframe, OI is -0.45%. Price is up while positions are down. This kind of structure looks more like short covering or older positions being reduced—not large-scale new longs building fresh positions.
Still, the OI abnormal percentile is 97%. It’s #16 in the pool’s abnormal ranking, with nominal change ranked #14. That indicates the position change itself is extremely abnormal within the pool. Funding rate has also been sitting in high percentiles recently, and multiple consecutive cycles have continued this condition.
In the last 24h, the trading value is 260 million U, and depth is sufficient.
With this kind of structure, I usually take a closer look—if the rally driven by short covering doesn’t get followed by new longs, it can easily turn into a one-off move. But if the funding rate stays high and OI starts to increase again, then it’s a different story.
$ADA
On the 15m timeframe, it directly surged by 1.47%. Volume hit 3.04x, Z value is 4.2—clearly there’s capital entering and causing a stir. Price broke above the upper bounds of the last ~20 consecutive 5m K-bars. The aggressive buy/sell ratio is 1.38, aggressive trade volume is up +16.1%, and the bid side is pushing.
But pay attention to one detail—OI is falling. On the 15m timeframe, OI is -0.32%; on the 1h timeframe, OI is -0.45%. Price is up while positions are down. This kind of structure looks more like short covering or older positions being reduced—not large-scale new longs building fresh positions.
Still, the OI abnormal percentile is 97%. It’s #16 in the pool’s abnormal ranking, with nominal change ranked #14. That indicates the position change itself is extremely abnormal within the pool. Funding rate has also been sitting in high percentiles recently, and multiple consecutive cycles have continued this condition.
In the last 24h, the trading value is 260 million U, and depth is sufficient.
With this kind of structure, I usually take a closer look—if the rally driven by short covering doesn’t get followed by new longs, it can easily turn into a one-off move. But if the funding rate stays high and OI starts to increase again, then it’s a different story.
$ADA
1.1k

·
--
$ZEN This move is kind of interesting.
In the 15m timeframe, it’s up 1.93%. Volume immediately surged to 1.89x; volatility (range) hit 2.26. The closing price has broken above the upper trendline of the previous 20 5m candles. There’s active buying—someone is really eating up from the bid.
More importantly, the OI: 15m is +0.74%, and 1h is +0.95%. The nominal change sums to close to 670k U, with an abnormal percentile of 92.3%. It ranks #16 in the whole pool. Price is rising while OI rises in sync—this isn’t the kind of push that’s just short covering; it looks like newly added leveraged long positions are coming in.
Funding rate has also topped out near the recent high percentile. In the last 24h, trading volume is 58M, and the depth is there. Multiple consecutive cycles are extending, not just a single spike.
With this kind of structure, I usually watch for a pullback and confirmation. After the breakout of the boundary, only if volume keeps up and OI doesn’t drop do I consider it playable. Chasing is not worth it—there have been quite a few fake breakouts lately.
$ZEN This move is kind of interesting.
In the 15m timeframe, it’s up 1.93%. Volume immediately surged to 1.89x; volatility (range) hit 2.26. The closing price has broken above the upper trendline of the previous 20 5m candles. There’s active buying—someone is really eating up from the bid.
More importantly, the OI: 15m is +0.74%, and 1h is +0.95%. The nominal change sums to close to 670k U, with an abnormal percentile of 92.3%. It ranks #16 in the whole pool. Price is rising while OI rises in sync—this isn’t the kind of push that’s just short covering; it looks like newly added leveraged long positions are coming in.
Funding rate has also topped out near the recent high percentile. In the last 24h, trading volume is 58M, and the depth is there. Multiple consecutive cycles are extending, not just a single spike.
With this kind of structure, I usually watch for a pullback and confirmation. After the breakout of the boundary, only if volume keeps up and OI doesn’t drop do I consider it playable. Chasing is not worth it—there have been quite a few fake breakouts lately.
In the 15m timeframe, it’s up 1.93%. Volume immediately surged to 1.89x; volatility (range) hit 2.26. The closing price has broken above the upper trendline of the previous 20 5m candles. There’s active buying—someone is really eating up from the bid.
More importantly, the OI: 15m is +0.74%, and 1h is +0.95%. The nominal change sums to close to 670k U, with an abnormal percentile of 92.3%. It ranks #16 in the whole pool. Price is rising while OI rises in sync—this isn’t the kind of push that’s just short covering; it looks like newly added leveraged long positions are coming in.
Funding rate has also topped out near the recent high percentile. In the last 24h, trading volume is 58M, and the depth is there. Multiple consecutive cycles are extending, not just a single spike.
With this kind of structure, I usually watch for a pullback and confirmation. After the breakout of the boundary, only if volume keeps up and OI doesn’t drop do I consider it playable. Chasing is not worth it—there have been quite a few fake breakouts lately.
21

·
--
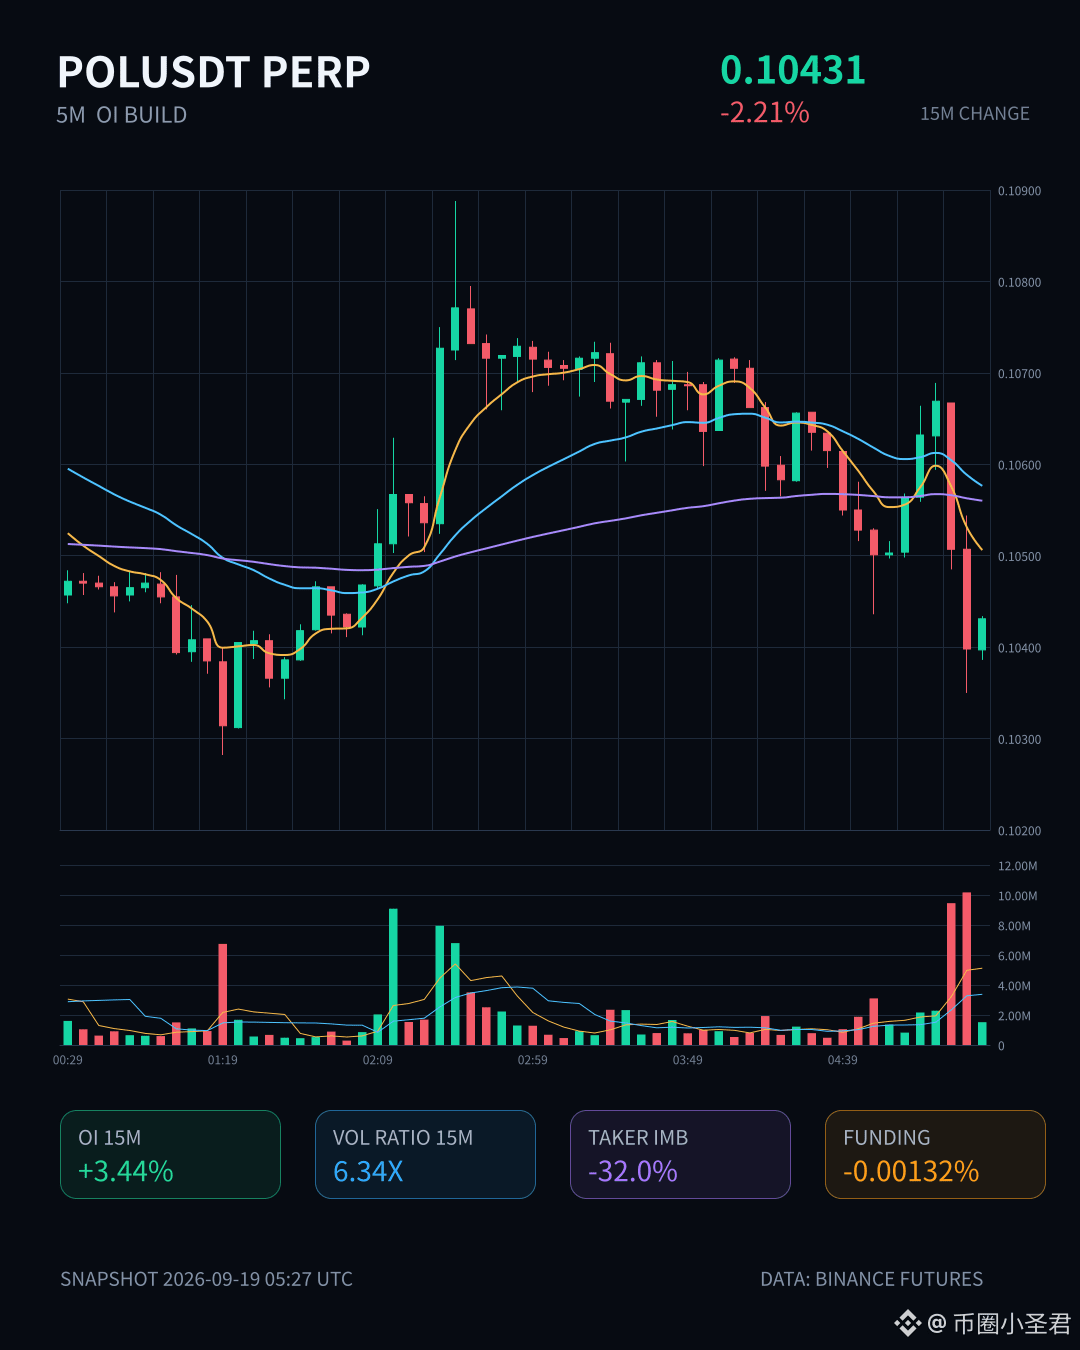
$POL In these 15 minutes, something seems off.
The price has been smashed down by 2.21%, and the volume has immediately surged to 6.34x the usual level, yet OI hasn’t fallen—instead it’s up. In 15m: +3.44%, in 1h: +3.67%. The abnormal percentile is 90.5%, and the whole pool ranks it at #16.
This isn’t liquidation panic caused by closing positions. It’s new shorts entering. The difference in active execution is -32%, the buy/sell ratio is 0.52, and sell-side pressure clearly leans the wrong way. Also, OI has been stacking upward for several consecutive periods; it doesn’t look like a one-off probe.
With 24h trading value just over 46M, for shorts to build their positions this way, either they came prepared—or they’re laying fuel for what comes next. I won’t take sides for now, but once this structure reverses, the squeeze won’t be gentle.
Keep watching first—let the volume and price reveal the answer.
$POL In these 15 minutes, something seems off.
The price has been smashed down by 2.21%, and the volume has immediately surged to 6.34x the usual level, yet OI hasn’t fallen—instead it’s up. In 15m: +3.44%, in 1h: +3.67%. The abnormal percentile is 90.5%, and the whole pool ranks it at #16.
This isn’t liquidation panic caused by closing positions. It’s new shorts entering. The difference in active execution is -32%, the buy/sell ratio is 0.52, and sell-side pressure clearly leans the wrong way. Also, OI has been stacking upward for several consecutive periods; it doesn’t look like a one-off probe.
With 24h trading value just over 46M, for shorts to build their positions this way, either they came prepared—or they’re laying fuel for what comes next. I won’t take sides for now, but once this structure reverses, the squeeze won’t be gentle.
Keep watching first—let the volume and price reveal the answer.
The price has been smashed down by 2.21%, and the volume has immediately surged to 6.34x the usual level, yet OI hasn’t fallen—instead it’s up. In 15m: +3.44%, in 1h: +3.67%. The abnormal percentile is 90.5%, and the whole pool ranks it at #16.
This isn’t liquidation panic caused by closing positions. It’s new shorts entering. The difference in active execution is -32%, the buy/sell ratio is 0.52, and sell-side pressure clearly leans the wrong way. Also, OI has been stacking upward for several consecutive periods; it doesn’t look like a one-off probe.
With 24h trading value just over 46M, for shorts to build their positions this way, either they came prepared—or they’re laying fuel for what comes next. I won’t take sides for now, but once this structure reverses, the squeeze won’t be gentle.
Keep watching first—let the volume and price reveal the answer.
41

·
--
$Bull, this wave is a bit like it’s real.
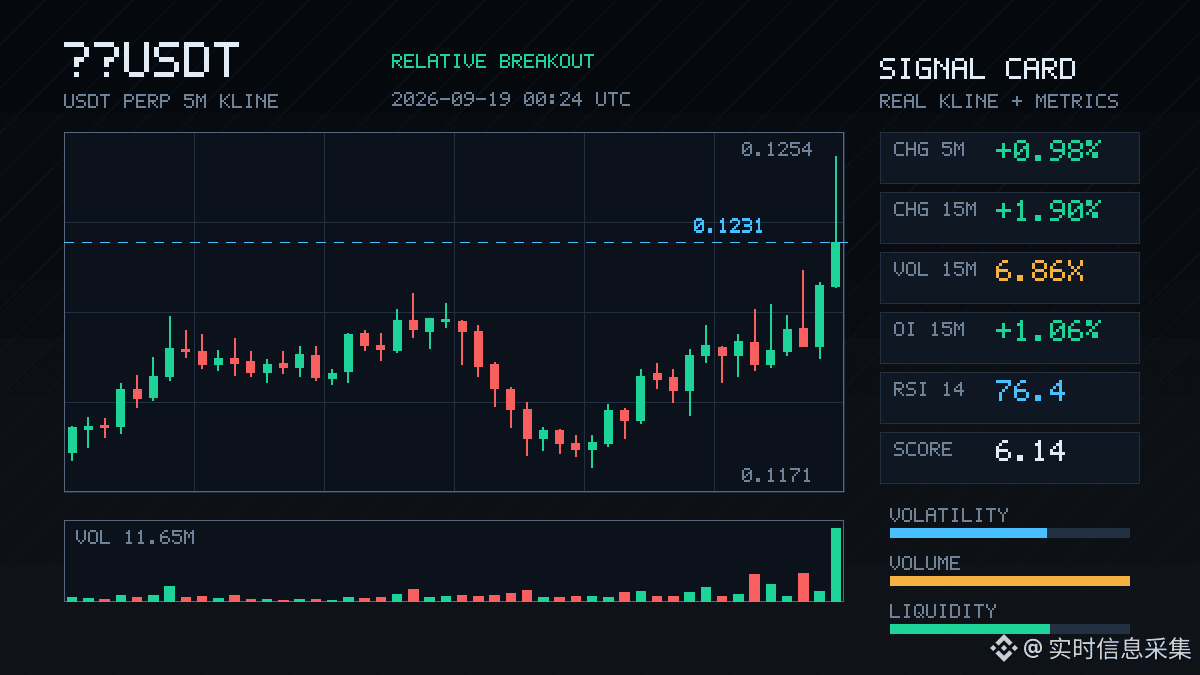
In the 15m timeframe it’s up 1.90%, volume surged straight to 6.86x, the Z value is 2.61, and the closing price has broken above the upper band of nearly 20 of the 5m candles. This isn’t some fakeout that just pokes through and immediately snaps back—it’s a volume-backed breakout.
More importantly: OI.
15m +1.06%, 1h +2.05%. The notional change for the 1h period is already 1.66M USDT. The anomaly percentile is 94.4%, ranking #16 in the whole pool by notional change, and the notional change ranks #9. Price is rising while OI is rising in sync—that means new leveraged longs are entering, not short covering pushing things up.
And this isn’t just a single-period breakout—it’s continuing across multiple consecutive cycles, and the trading activity is higher than normal. 24h trading value is 98.74M; liquidity looks deep enough—this isn’t a small-pool self-amplification situation.
Aggressive buy-sell delta is 0.9%, buy/sell ratio is 1.02. Slightly buyer-leaning but not extreme, suggesting it hasn’t reached the FOMO peak yet.
My take: this kind of structure either keeps running for a while, or it starts to range once it gets close to historical extreme zones. But at least for now, longs are still adding positions—not acting like they’re withdrawing.
Keep an eye on OI. If price stalls while OI continues to climb, that’s the real warning signal. For now, let the bullets fly for a bit.
$Bull, this wave is a bit like it’s real.
In the 15m timeframe it’s up 1.90%, volume surged straight to 6.86x, the Z value is 2.61, and the closing price has broken above the upper band of nearly 20 of the 5m candles. This isn’t some fakeout that just pokes through and immediately snaps back—it’s a volume-backed breakout.
More importantly: OI.
15m +1.06%, 1h +2.05%. The notional change for the 1h period is already 1.66M USDT. The anomaly percentile is 94.4%, ranking #16 in the whole pool by notional change, and the notional change ranks #9. Price is rising while OI is rising in sync—that means new leveraged longs are entering, not short covering pushing things up.
And this isn’t just a single-period breakout—it’s continuing across multiple consecutive cycles, and the trading activity is higher than normal. 24h trading value is 98.74M; liquidity looks deep enough—this isn’t a small-pool self-amplification situation.
Aggressive buy-sell delta is 0.9%, buy/sell ratio is 1.02. Slightly buyer-leaning but not extreme, suggesting it hasn’t reached the FOMO peak yet.
My take: this kind of structure either keeps running for a while, or it starts to range once it gets close to historical extreme zones. But at least for now, longs are still adding positions—not acting like they’re withdrawing.
Keep an eye on OI. If price stalls while OI continues to climb, that’s the real warning signal. For now, let the bullets fly for a bit.
In the 15m timeframe it’s up 1.90%, volume surged straight to 6.86x, the Z value is 2.61, and the closing price has broken above the upper band of nearly 20 of the 5m candles. This isn’t some fakeout that just pokes through and immediately snaps back—it’s a volume-backed breakout.
More importantly: OI.
15m +1.06%, 1h +2.05%. The notional change for the 1h period is already 1.66M USDT. The anomaly percentile is 94.4%, ranking #16 in the whole pool by notional change, and the notional change ranks #9. Price is rising while OI is rising in sync—that means new leveraged longs are entering, not short covering pushing things up.
And this isn’t just a single-period breakout—it’s continuing across multiple consecutive cycles, and the trading activity is higher than normal. 24h trading value is 98.74M; liquidity looks deep enough—this isn’t a small-pool self-amplification situation.
Aggressive buy-sell delta is 0.9%, buy/sell ratio is 1.02. Slightly buyer-leaning but not extreme, suggesting it hasn’t reached the FOMO peak yet.
My take: this kind of structure either keeps running for a while, or it starts to range once it gets close to historical extreme zones. But at least for now, longs are still adding positions—not acting like they’re withdrawing.
Keep an eye on OI. If price stalls while OI continues to climb, that’s the real warning signal. For now, let the bullets fly for a bit.
107
·
--
$ZEC This 15m move has risen 2.7 points, and the volume has directly jumped to 4.51x, with a Z value of 5.09—this isn’t a normal fluctuation.
The key is OI—the 15m and 1h contract open interest are both increasing, and the notional change is ranked #1 across the whole pool. Price is rising + OI is rising: that’s a typical leveraged long entry structure, not short covering pushing the market up.
The aggressive trade imbalance is -16.8%, and the buy/sell ratio is 1.4, so the direction is pretty clear. On 5m Binance, there were 4.85M liquidation agents in the buy side direction—buyers are more concentrated, meaning shorts were squeezed.
Abnormal percentile is 89.3%, ranked #16 in the whole pool, and notional change is #1. 24h trading value is 3.4B, and depth also confirms it: volume is higher than usual, and price has touched the boundary of the recent range.
This structure is exactly what I’m most afraid to chase. Adding leveraged longs means that if price doesn’t continue, the position could become potential sell pressure. But in the short term, buyer strength is still there; liquidations are concentrated on the buy direction, which suggests the upward momentum hasn’t finished yet.
Watch first—no need to move quickly. What gets piled up with leverage is the most dangerous when it starts to loosen.
$ZEC This 15m move has risen 2.7 points, and the volume has directly jumped to 4.51x, with a Z value of 5.09—this isn’t a normal fluctuation.
The key is OI—the 15m and 1h contract open interest are both increasing, and the notional change is ranked #1 across the whole pool. Price is rising + OI is rising: that’s a typical leveraged long entry structure, not short covering pushing the market up.
The aggressive trade imbalance is -16.8%, and the buy/sell ratio is 1.4, so the direction is pretty clear. On 5m Binance, there were 4.85M liquidation agents in the buy side direction—buyers are more concentrated, meaning shorts were squeezed.
Abnormal percentile is 89.3%, ranked #16 in the whole pool, and notional change is #1. 24h trading value is 3.4B, and depth also confirms it: volume is higher than usual, and price has touched the boundary of the recent range.
This structure is exactly what I’m most afraid to chase. Adding leveraged longs means that if price doesn’t continue, the position could become potential sell pressure. But in the short term, buyer strength is still there; liquidations are concentrated on the buy direction, which suggests the upward momentum hasn’t finished yet.
Watch first—no need to move quickly. What gets piled up with leverage is the most dangerous when it starts to loosen.
The key is OI—the 15m and 1h contract open interest are both increasing, and the notional change is ranked #1 across the whole pool. Price is rising + OI is rising: that’s a typical leveraged long entry structure, not short covering pushing the market up.
The aggressive trade imbalance is -16.8%, and the buy/sell ratio is 1.4, so the direction is pretty clear. On 5m Binance, there were 4.85M liquidation agents in the buy side direction—buyers are more concentrated, meaning shorts were squeezed.
Abnormal percentile is 89.3%, ranked #16 in the whole pool, and notional change is #1. 24h trading value is 3.4B, and depth also confirms it: volume is higher than usual, and price has touched the boundary of the recent range.
This structure is exactly what I’m most afraid to chase. Adding leveraged longs means that if price doesn’t continue, the position could become potential sell pressure. But in the short term, buyer strength is still there; liquidations are concentrated on the buy direction, which suggests the upward momentum hasn’t finished yet.
Watch first—no need to move quickly. What gets piled up with leverage is the most dangerous when it starts to loosen.
29
·
--
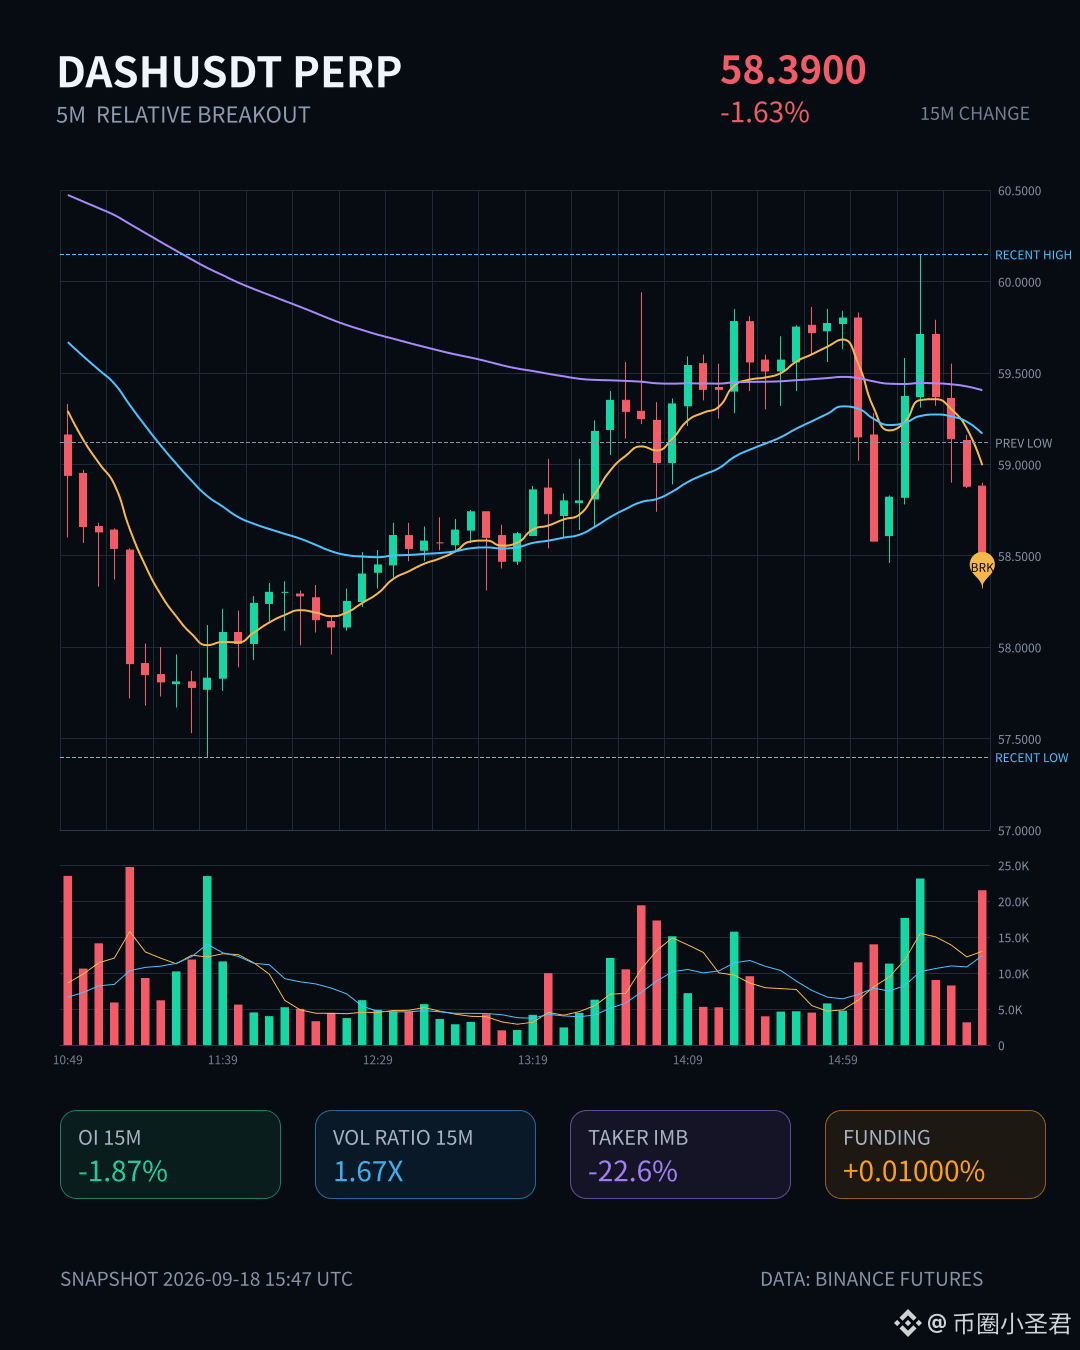
$DASH This drop is a bit sudden.
On the 15m timeframe, it’s down -1.63% with volume at 1.67x, and the Z value is 2.42—not the kind of slow bleed where you get cut gradually. It looks like someone is rushing to exit. Active buys vs. sells are 0.63: selling pressure is heavier, and the price has already broken below the lower band of the past ~20 5m candles.
But looking at OI: on 15m, OI is -1.87%; on 1h, -0.91%; and the notional change is close to -3%. Price is down + OI is down + active selling is up. This isn’t new short entries—it’s more like longs are deleveraging, getting stopped out, and reducing positions. Money is moving out, not getting pumped in.
OI’s abnormal percentile is 97%—the whole pool is #11, notional change is #16. Multiple consecutive periods are continuing. In plain terms, the position structure is being forcibly reshuffled. The funding rate is still in a high percentile recently—earlier longs got squeezed too full; now it’s repayment time.
DASH itself is already near a historical extreme zone. 24h trading value is a bit over 140M. At a spot like this, either it accelerates the bottoming process, or it serves as the starting point for the next round of repricing. I won’t catch the falling knife for now—I’ll watch whether OI keeps dropping. Once it bottoms out, then we can talk.
$DASH This drop is a bit sudden.
On the 15m timeframe, it’s down -1.63% with volume at 1.67x, and the Z value is 2.42—not the kind of slow bleed where you get cut gradually. It looks like someone is rushing to exit. Active buys vs. sells are 0.63: selling pressure is heavier, and the price has already broken below the lower band of the past ~20 5m candles.
But looking at OI: on 15m, OI is -1.87%; on 1h, -0.91%; and the notional change is close to -3%. Price is down + OI is down + active selling is up. This isn’t new short entries—it’s more like longs are deleveraging, getting stopped out, and reducing positions. Money is moving out, not getting pumped in.
OI’s abnormal percentile is 97%—the whole pool is #11, notional change is #16. Multiple consecutive periods are continuing. In plain terms, the position structure is being forcibly reshuffled. The funding rate is still in a high percentile recently—earlier longs got squeezed too full; now it’s repayment time.
DASH itself is already near a historical extreme zone. 24h trading value is a bit over 140M. At a spot like this, either it accelerates the bottoming process, or it serves as the starting point for the next round of repricing. I won’t catch the falling knife for now—I’ll watch whether OI keeps dropping. Once it bottoms out, then we can talk.
On the 15m timeframe, it’s down -1.63% with volume at 1.67x, and the Z value is 2.42—not the kind of slow bleed where you get cut gradually. It looks like someone is rushing to exit. Active buys vs. sells are 0.63: selling pressure is heavier, and the price has already broken below the lower band of the past ~20 5m candles.
But looking at OI: on 15m, OI is -1.87%; on 1h, -0.91%; and the notional change is close to -3%. Price is down + OI is down + active selling is up. This isn’t new short entries—it’s more like longs are deleveraging, getting stopped out, and reducing positions. Money is moving out, not getting pumped in.
OI’s abnormal percentile is 97%—the whole pool is #11, notional change is #16. Multiple consecutive periods are continuing. In plain terms, the position structure is being forcibly reshuffled. The funding rate is still in a high percentile recently—earlier longs got squeezed too full; now it’s repayment time.
DASH itself is already near a historical extreme zone. 24h trading value is a bit over 140M. At a spot like this, either it accelerates the bottoming process, or it serves as the starting point for the next round of repricing. I won’t catch the falling knife for now—I’ll watch whether OI keeps dropping. Once it bottoms out, then we can talk.
16

·
--
$GENIUS This round of longs de-leveraging is a bit brutal.
On the 15m chart, it directly dumped 2.62%, with volume up to 1.85x. OI fell in sync by 2.41%, and nominal value dropped by more than 500k U. Price down + OI down—this isn’t new shorts entering; it’s someone being carried out—either stopping out or actively shrinking positions.
Aggressive trades (price-driven) are down -16.7%, the buy/sell ratio is 0.71, and sell pressure is clearly one-sided. Funding rate is still in the higher percentile recently. The OI percentile is abnormal at 93.5%. Across the whole pool it ranks #16, and it has continued for several consecutive cycles. This suggests it’s not just a single needle movement—someone is continuously offloading leverage.
Over 24h, turnover is 173M. Depth is sufficient, but the direction is wrong. It’s approaching historical extreme ranges. At this level, either it gets a washout and then continues, or it marks the start of a trend reversal. Chasing longs now doesn’t offer good value; wait for OI to stabilize and funding rates to normalize before reassessing.
Let’s just watch for now. No rush to enter.
$GENIUS This round of longs de-leveraging is a bit brutal.
On the 15m chart, it directly dumped 2.62%, with volume up to 1.85x. OI fell in sync by 2.41%, and nominal value dropped by more than 500k U. Price down + OI down—this isn’t new shorts entering; it’s someone being carried out—either stopping out or actively shrinking positions.
Aggressive trades (price-driven) are down -16.7%, the buy/sell ratio is 0.71, and sell pressure is clearly one-sided. Funding rate is still in the higher percentile recently. The OI percentile is abnormal at 93.5%. Across the whole pool it ranks #16, and it has continued for several consecutive cycles. This suggests it’s not just a single needle movement—someone is continuously offloading leverage.
Over 24h, turnover is 173M. Depth is sufficient, but the direction is wrong. It’s approaching historical extreme ranges. At this level, either it gets a washout and then continues, or it marks the start of a trend reversal. Chasing longs now doesn’t offer good value; wait for OI to stabilize and funding rates to normalize before reassessing.
Let’s just watch for now. No rush to enter.
On the 15m chart, it directly dumped 2.62%, with volume up to 1.85x. OI fell in sync by 2.41%, and nominal value dropped by more than 500k U. Price down + OI down—this isn’t new shorts entering; it’s someone being carried out—either stopping out or actively shrinking positions.
Aggressive trades (price-driven) are down -16.7%, the buy/sell ratio is 0.71, and sell pressure is clearly one-sided. Funding rate is still in the higher percentile recently. The OI percentile is abnormal at 93.5%. Across the whole pool it ranks #16, and it has continued for several consecutive cycles. This suggests it’s not just a single needle movement—someone is continuously offloading leverage.
Over 24h, turnover is 173M. Depth is sufficient, but the direction is wrong. It’s approaching historical extreme ranges. At this level, either it gets a washout and then continues, or it marks the start of a trend reversal. Chasing longs now doesn’t offer good value; wait for OI to stabilize and funding rates to normalize before reassessing.
Let’s just watch for now. No rush to enter.
7

Article
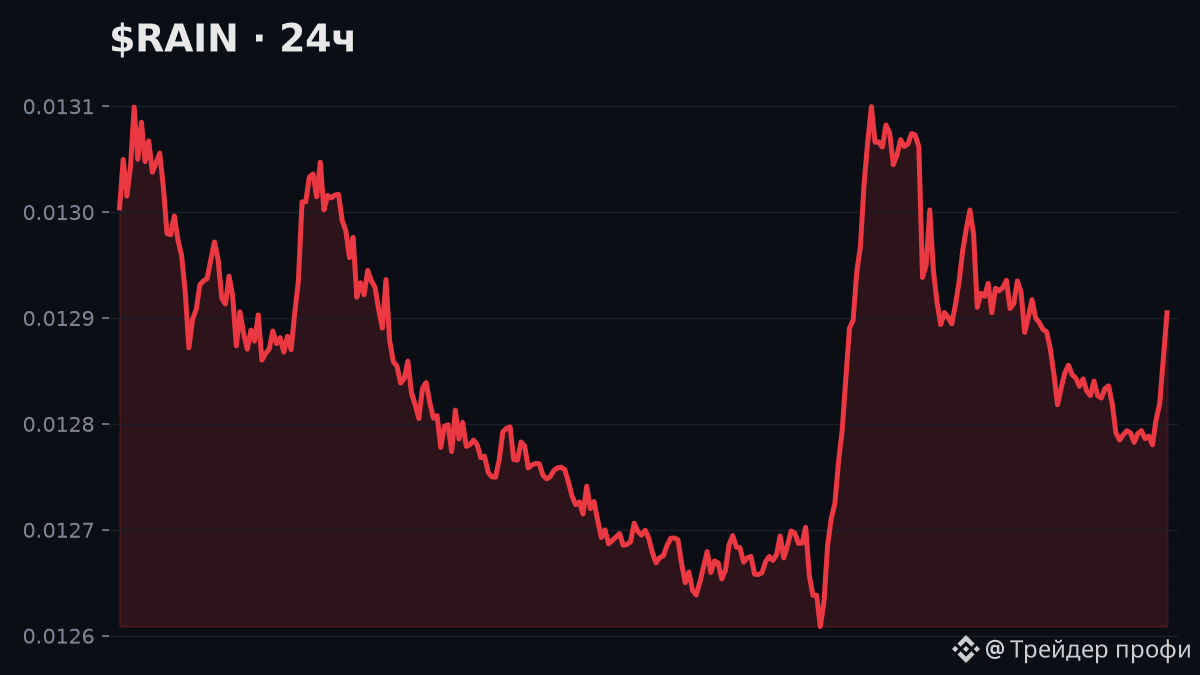
$RAIN -0.8% over 24h — dropped more than anyone else in the top-100!📉 $RAIN -0.8% over 24h — dropped more than anyone else in the top-100!
Have you seen this?
🧭 Summary: price movement is in line with a broader trend — 7D and 30D are in the same direction; volume is low — the move may be unstable.
🌍 Market context: out of 72 major coins showing noticeable movement over the last 24h — 🔼 70 gained, 🔽 2 fell
📉 Day’s underperformer: $RAIN -0.8% over 24h
$RAIN -0.8% over 24h — dropped more than anyone else in the top-100!
📉 $RAIN -0.8% over 24h — dropped more than anyone else in the top-100!
Have you seen this?
🧭 Summary: price movement is in line with a broader trend — 7D and 30D are in the same direction; volume is low — the move may be unstable.
🌍 Market context: out of 72 major coins showing noticeable movement over the last 24h — 🔼 70 gained, 🔽 2 fell
📉 Day’s underperformer: $RAIN -0.8% over 24h
Have you seen this?
🧭 Summary: price movement is in line with a broader trend — 7D and 30D are in the same direction; volume is low — the move may be unstable.
🌍 Market context: out of 72 major coins showing noticeable movement over the last 24h — 🔼 70 gained, 🔽 2 fell
📉 Day’s underperformer: $RAIN -0.8% over 24h
113
·
--
ETC—this is a bit interesting. In 15m it directly rallied 1.57%; volume hit 5.16x; the Z value is 4.50. Clearly this isn’t normal fluctuation—someone is moving the market.
But the key isn’t the price rising; it’s that OI is falling. In 15m it’s -0.11%, in 1h -0.13%. As price moves up, positions are actually being reduced. This isn’t new long capital coming in—it looks more like shorts are being pinned and forced to cover. The buy/sell ratio is 1.31, and the difference in active trades is 13.3%. The bid is definitely pushing. At the close it also broke above the top range of the last 20 consecutive 5m candles. In the past 24h, the trading value is only 27.60M, while the pool’s percentile is abnormally high at 95.4%—pool #16. Even the notional change ranks at #31 .
Put simply, this kind of structure means: it’s not that someone is firmly bullish—rather, the shorts are the first to break. Whether this can continue depends on whether there’s a true wave of incremental long buying to take the baton; otherwise, once the cover is done, it’s just a one-off move. Keep watching for now.
ETC—this is a bit interesting. In 15m it directly rallied 1.57%; volume hit 5.16x; the Z value is 4.50. Clearly this isn’t normal fluctuation—someone is moving the market.
But the key isn’t the price rising; it’s that OI is falling. In 15m it’s -0.11%, in 1h -0.13%. As price moves up, positions are actually being reduced. This isn’t new long capital coming in—it looks more like shorts are being pinned and forced to cover. The buy/sell ratio is 1.31, and the difference in active trades is 13.3%. The bid is definitely pushing. At the close it also broke above the top range of the last 20 consecutive 5m candles. In the past 24h, the trading value is only 27.60M, while the pool’s percentile is abnormally high at 95.4%—pool #16. Even the notional change ranks at #31 .
Put simply, this kind of structure means: it’s not that someone is firmly bullish—rather, the shorts are the first to break. Whether this can continue depends on whether there’s a true wave of incremental long buying to take the baton; otherwise, once the cover is done, it’s just a one-off move. Keep watching for now.
But the key isn’t the price rising; it’s that OI is falling. In 15m it’s -0.11%, in 1h -0.13%. As price moves up, positions are actually being reduced. This isn’t new long capital coming in—it looks more like shorts are being pinned and forced to cover. The buy/sell ratio is 1.31, and the difference in active trades is 13.3%. The bid is definitely pushing. At the close it also broke above the top range of the last 20 consecutive 5m candles. In the past 24h, the trading value is only 27.60M, while the pool’s percentile is abnormally high at 95.4%—pool #16. Even the notional change ranks at #31 .
Put simply, this kind of structure means: it’s not that someone is firmly bullish—rather, the shorts are the first to break. Whether this can continue depends on whether there’s a true wave of incremental long buying to take the baton; otherwise, once the cover is done, it’s just a one-off move. Keep watching for now.
5
·
--
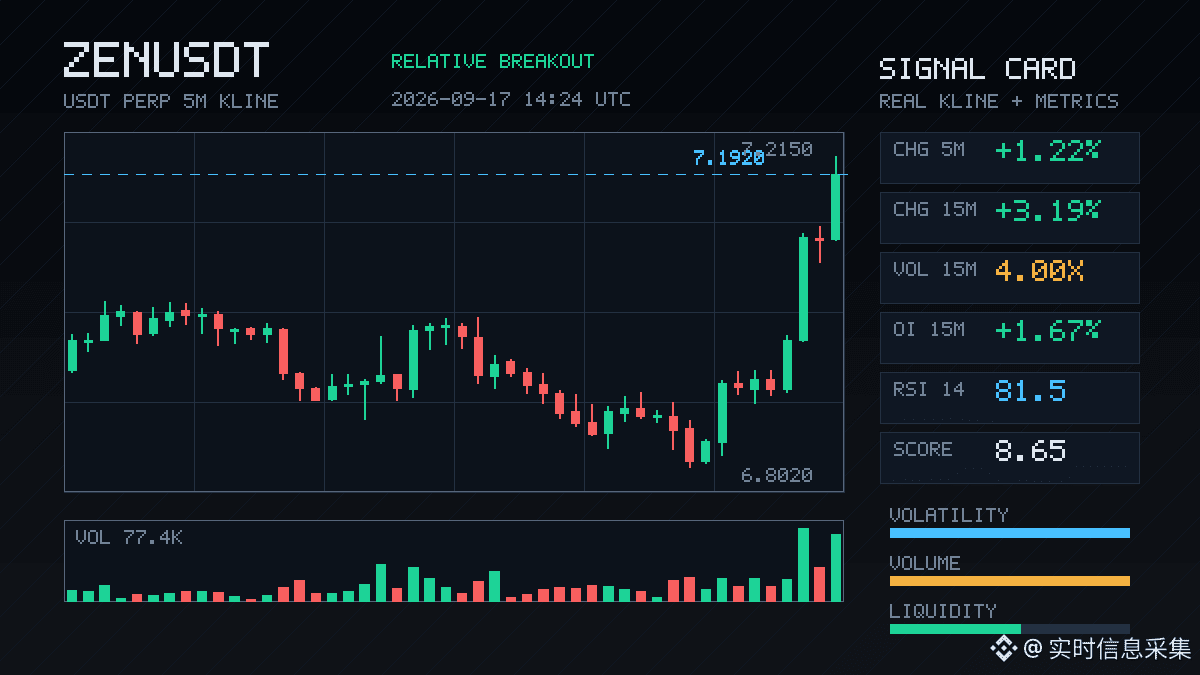
$ZEN This spot is getting interesting.
In 15m, it rose 3.19%. Volume surged straight to 4x—this isn’t some squeeze-low false breakout. The key is that OI is also moving up in sync: 1h +1.55%, 15m +1.67%. This kind of structure—price and open interest both being lifted together—looks more like new long positions adding leverage, not short-covering pushing it.
Active trade difference is 19.2%, buy-sell ratio 1.48, and the order book is clearly leaning bullish. The closing price has already moved above the upper edge of roughly the last 20 consecutive 5m candles. This recent range has effectively been pried open from above.
OI percentile is 98.2%—it ranks #16 across the whole pool. The notional change is also within the top 40, and several consecutive cycles are continuing the move; it’s not just a one-candle spike. In the past 24h, turnover is a bit over 42M, and depth is currently sufficient.
We’re getting close to historical extreme levels. At a spot like this, it either accelerates or turns up the pressure—keep your eyes on it.
$ZEN This spot is getting interesting.
In 15m, it rose 3.19%. Volume surged straight to 4x—this isn’t some squeeze-low false breakout. The key is that OI is also moving up in sync: 1h +1.55%, 15m +1.67%. This kind of structure—price and open interest both being lifted together—looks more like new long positions adding leverage, not short-covering pushing it.
Active trade difference is 19.2%, buy-sell ratio 1.48, and the order book is clearly leaning bullish. The closing price has already moved above the upper edge of roughly the last 20 consecutive 5m candles. This recent range has effectively been pried open from above.
OI percentile is 98.2%—it ranks #16 across the whole pool. The notional change is also within the top 40, and several consecutive cycles are continuing the move; it’s not just a one-candle spike. In the past 24h, turnover is a bit over 42M, and depth is currently sufficient.
We’re getting close to historical extreme levels. At a spot like this, it either accelerates or turns up the pressure—keep your eyes on it.
In 15m, it rose 3.19%. Volume surged straight to 4x—this isn’t some squeeze-low false breakout. The key is that OI is also moving up in sync: 1h +1.55%, 15m +1.67%. This kind of structure—price and open interest both being lifted together—looks more like new long positions adding leverage, not short-covering pushing it.
Active trade difference is 19.2%, buy-sell ratio 1.48, and the order book is clearly leaning bullish. The closing price has already moved above the upper edge of roughly the last 20 consecutive 5m candles. This recent range has effectively been pried open from above.
OI percentile is 98.2%—it ranks #16 across the whole pool. The notional change is also within the top 40, and several consecutive cycles are continuing the move; it’s not just a one-candle spike. In the past 24h, turnover is a bit over 42M, and depth is currently sufficient.
We’re getting close to historical extreme levels. At a spot like this, it either accelerates or turns up the pressure—keep your eyes on it.
18
·
--
$POL This wave is kind of interesting.
In the 15m timeframe it jumped 1.76%, and the volume surged to 3.54x. The Z-score is 5.02, and the 24h turnover is also expanded to 22.83M. Price broke above the upper band of the recent ~20 consecutive 5m ranges; the buy/sell ratio is 1.41, and the difference in active trades is -16.9%—the bids are genuinely moving in.
But the contracts side looks off: OI in 15m is -0.54%, 1h is -0.69%, and even the notional change only slightly increased by 158K/215K USDT.
Price rising while OI is falling is typical of short-covering, not new longs entering. The price pushed by a short squeeze isn’t the same as trend-building accumulation.
The OI abnormal percentile is already at 95.4%, in the whole pool #16, with multiple consecutive cycles continuing. Sentiment-wise, this level is definitely “hot,” but structurally be careful: the fuel for short-covering is limited—after the covers are done, who will接 the bids?
If afterward OI doesn’t rise along with price, this move may just be a pulse. If you really want to chase, wait until OI turns positive first.
$POL This wave is kind of interesting.
In the 15m timeframe it jumped 1.76%, and the volume surged to 3.54x. The Z-score is 5.02, and the 24h turnover is also expanded to 22.83M. Price broke above the upper band of the recent ~20 consecutive 5m ranges; the buy/sell ratio is 1.41, and the difference in active trades is -16.9%—the bids are genuinely moving in.
But the contracts side looks off: OI in 15m is -0.54%, 1h is -0.69%, and even the notional change only slightly increased by 158K/215K USDT.
Price rising while OI is falling is typical of short-covering, not new longs entering. The price pushed by a short squeeze isn’t the same as trend-building accumulation.
The OI abnormal percentile is already at 95.4%, in the whole pool #16, with multiple consecutive cycles continuing. Sentiment-wise, this level is definitely “hot,” but structurally be careful: the fuel for short-covering is limited—after the covers are done, who will接 the bids?
If afterward OI doesn’t rise along with price, this move may just be a pulse. If you really want to chase, wait until OI turns positive first.
In the 15m timeframe it jumped 1.76%, and the volume surged to 3.54x. The Z-score is 5.02, and the 24h turnover is also expanded to 22.83M. Price broke above the upper band of the recent ~20 consecutive 5m ranges; the buy/sell ratio is 1.41, and the difference in active trades is -16.9%—the bids are genuinely moving in.
But the contracts side looks off: OI in 15m is -0.54%, 1h is -0.69%, and even the notional change only slightly increased by 158K/215K USDT.
Price rising while OI is falling is typical of short-covering, not new longs entering. The price pushed by a short squeeze isn’t the same as trend-building accumulation.
The OI abnormal percentile is already at 95.4%, in the whole pool #16, with multiple consecutive cycles continuing. Sentiment-wise, this level is definitely “hot,” but structurally be careful: the fuel for short-covering is limited—after the covers are done, who will接 the bids?
If afterward OI doesn’t rise along with price, this move may just be a pulse. If you really want to chase, wait until OI turns positive first.
2
·
--
PENGU This one is a bit interesting.
The 15m price dropped 0.82%, and the volume directly hit 2.64x of its usual level. Volatility is 2.34—this isn’t the slow, drifting down kind of selloff; it’s selling pressure dropping with volume. It closed a broken-support candle and fell through the lower bound of the last ~20 5m range candles.
But the key is OI: 15m -0.15%, 1h -1.20%. Nominally, 800k U was wiped out. Price fell while OI also fell—this isn’t fresh shorts opening; it’s longs deleveraging, stopping out, or actively reducing positions. Active traded volume is down -15.8%, and the buy/sell ratio is 0.73, with sell pressure clearly skewed to one side.
The contract’s OI abnormal percentile is 87.1%, ranked #16 across the whole pool, and nominal change is #24. The funding rate is still in a high percentile recently—leverage longs were built up quite full before, and now it’s starting to loosen.
In 24h, trading value is 41M—this isn’t small for the size of this pool. Break of support + high volume + deleveraging: short-term sentiment is tight. Let’s first see whether the leverage cleanup can hold steady, don’t rush to catch it.
PENGU This one is a bit interesting.
The 15m price dropped 0.82%, and the volume directly hit 2.64x of its usual level. Volatility is 2.34—this isn’t the slow, drifting down kind of selloff; it’s selling pressure dropping with volume. It closed a broken-support candle and fell through the lower bound of the last ~20 5m range candles.
But the key is OI: 15m -0.15%, 1h -1.20%. Nominally, 800k U was wiped out. Price fell while OI also fell—this isn’t fresh shorts opening; it’s longs deleveraging, stopping out, or actively reducing positions. Active traded volume is down -15.8%, and the buy/sell ratio is 0.73, with sell pressure clearly skewed to one side.
The contract’s OI abnormal percentile is 87.1%, ranked #16 across the whole pool, and nominal change is #24. The funding rate is still in a high percentile recently—leverage longs were built up quite full before, and now it’s starting to loosen.
In 24h, trading value is 41M—this isn’t small for the size of this pool. Break of support + high volume + deleveraging: short-term sentiment is tight. Let’s first see whether the leverage cleanup can hold steady, don’t rush to catch it.
The 15m price dropped 0.82%, and the volume directly hit 2.64x of its usual level. Volatility is 2.34—this isn’t the slow, drifting down kind of selloff; it’s selling pressure dropping with volume. It closed a broken-support candle and fell through the lower bound of the last ~20 5m range candles.
But the key is OI: 15m -0.15%, 1h -1.20%. Nominally, 800k U was wiped out. Price fell while OI also fell—this isn’t fresh shorts opening; it’s longs deleveraging, stopping out, or actively reducing positions. Active traded volume is down -15.8%, and the buy/sell ratio is 0.73, with sell pressure clearly skewed to one side.
The contract’s OI abnormal percentile is 87.1%, ranked #16 across the whole pool, and nominal change is #24. The funding rate is still in a high percentile recently—leverage longs were built up quite full before, and now it’s starting to loosen.
In 24h, trading value is 41M—this isn’t small for the size of this pool. Break of support + high volume + deleveraging: short-term sentiment is tight. Let’s first see whether the leverage cleanup can hold steady, don’t rush to catch it.
9
·
--
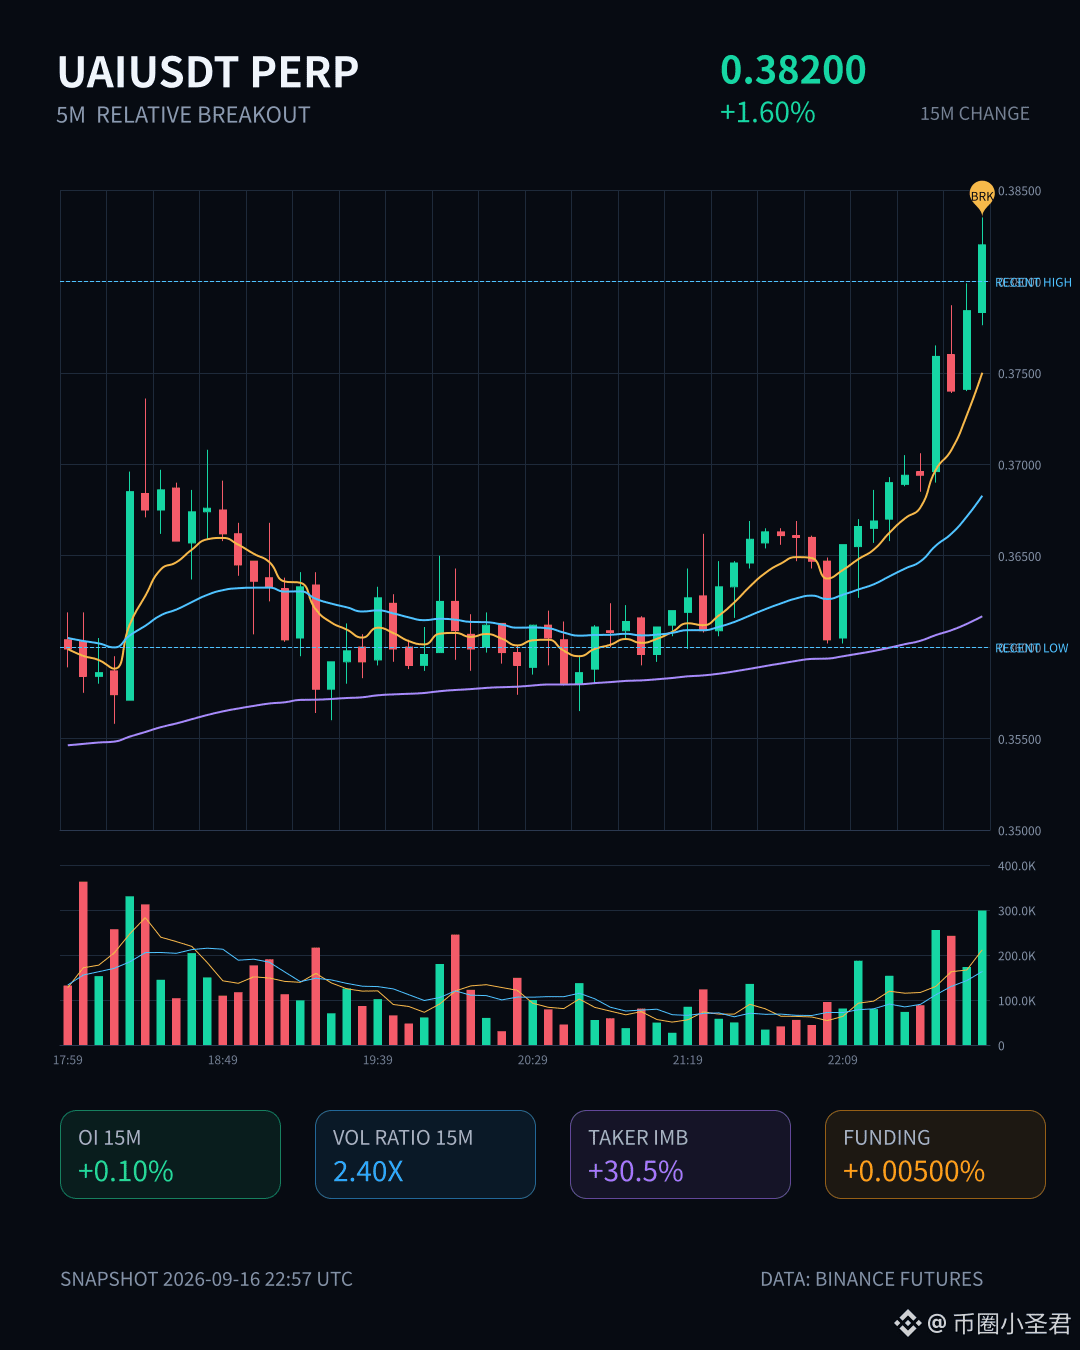
UAI has some substance in this 15m.
The price is up 1.60%, volume directly surged to 2.40x, and the close also broke above the upper boundary of the past ~20 5m candles. Active trade volume is down 30.5%, the buy/sell ratio is 1.88, indicating that someone is actively buying upward—not a fake move propped up by resting orders.
OI is also interesting: the 15m contract is +0.10%, with a notional change of 352K; the 1h notional is +3.30%, at 471K. When price rises and OI increases like this, it’s a typical leveraged long entry structure—not the kind of passive rebound caused by a short squeeze.
The abnormal percentile is 85.7%, pool #6, notional change ranked #16, and the order book depth confirmation has passed too.
However, the 24h traded value is only 38M, so the pool isn’t very deep. With volume like this, it can be a raid—but whether it can continue depends on whether the next few 5m candles can hold the upper boundary. Don’t get too excited and just rush in.
UAI has some substance in this 15m.
The price is up 1.60%, volume directly surged to 2.40x, and the close also broke above the upper boundary of the past ~20 5m candles. Active trade volume is down 30.5%, the buy/sell ratio is 1.88, indicating that someone is actively buying upward—not a fake move propped up by resting orders.
OI is also interesting: the 15m contract is +0.10%, with a notional change of 352K; the 1h notional is +3.30%, at 471K. When price rises and OI increases like this, it’s a typical leveraged long entry structure—not the kind of passive rebound caused by a short squeeze.
The abnormal percentile is 85.7%, pool #6, notional change ranked #16, and the order book depth confirmation has passed too.
However, the 24h traded value is only 38M, so the pool isn’t very deep. With volume like this, it can be a raid—but whether it can continue depends on whether the next few 5m candles can hold the upper boundary. Don’t get too excited and just rush in.
The price is up 1.60%, volume directly surged to 2.40x, and the close also broke above the upper boundary of the past ~20 5m candles. Active trade volume is down 30.5%, the buy/sell ratio is 1.88, indicating that someone is actively buying upward—not a fake move propped up by resting orders.
OI is also interesting: the 15m contract is +0.10%, with a notional change of 352K; the 1h notional is +3.30%, at 471K. When price rises and OI increases like this, it’s a typical leveraged long entry structure—not the kind of passive rebound caused by a short squeeze.
The abnormal percentile is 85.7%, pool #6, notional change ranked #16, and the order book depth confirmation has passed too.
However, the 24h traded value is only 38M, so the pool isn’t very deep. With volume like this, it can be a raid—but whether it can continue depends on whether the next few 5m candles can hold the upper boundary. Don’t get too excited and just rush in.
15
·
--
$LIT This one is a little interesting.
In the 15m chart, it’s up 2.62%. Volume shot straight to 3.05x, and the closing price broke above the upper band of the past ~20 5m candles. The aggressive buy-side imbalance is +8.6%, and the buy/sell ratio is 1.19—on the short-term chart, it really looks like someone is抢 (snapping up).
But take a closer look at OI: 15m is -0.03%, and 1h is -0.82%. Price is rising while open interest is falling. This doesn’t look like fresh long positions entering; it looks more like shorts being forced to cover. The OI abnormal percentile is 99%, across the whole pool #16, with nominal change #8. It’s been continuing across several consecutive cycles—this suggests it’s not just a one-off spike, but sustained pushing by capital.
In the last 24h, trading volume is 77M, and the depth is there. If they really wanted to push, it wouldn’t be that they can’t.
The question is: after the shorts cover and push it up, what happens once the covering is done? If OI still can’t turn back upward later, this move might just be an emotion-driven pulse. If you want to chase it, keep an eye on when OI turns positive.
$LIT This one is a little interesting.
In the 15m chart, it’s up 2.62%. Volume shot straight to 3.05x, and the closing price broke above the upper band of the past ~20 5m candles. The aggressive buy-side imbalance is +8.6%, and the buy/sell ratio is 1.19—on the short-term chart, it really looks like someone is抢 (snapping up).
But take a closer look at OI: 15m is -0.03%, and 1h is -0.82%. Price is rising while open interest is falling. This doesn’t look like fresh long positions entering; it looks more like shorts being forced to cover. The OI abnormal percentile is 99%, across the whole pool #16, with nominal change #8. It’s been continuing across several consecutive cycles—this suggests it’s not just a one-off spike, but sustained pushing by capital.
In the last 24h, trading volume is 77M, and the depth is there. If they really wanted to push, it wouldn’t be that they can’t.
The question is: after the shorts cover and push it up, what happens once the covering is done? If OI still can’t turn back upward later, this move might just be an emotion-driven pulse. If you want to chase it, keep an eye on when OI turns positive.
In the 15m chart, it’s up 2.62%. Volume shot straight to 3.05x, and the closing price broke above the upper band of the past ~20 5m candles. The aggressive buy-side imbalance is +8.6%, and the buy/sell ratio is 1.19—on the short-term chart, it really looks like someone is抢 (snapping up).
But take a closer look at OI: 15m is -0.03%, and 1h is -0.82%. Price is rising while open interest is falling. This doesn’t look like fresh long positions entering; it looks more like shorts being forced to cover. The OI abnormal percentile is 99%, across the whole pool #16, with nominal change #8. It’s been continuing across several consecutive cycles—this suggests it’s not just a one-off spike, but sustained pushing by capital.
In the last 24h, trading volume is 77M, and the depth is there. If they really wanted to push, it wouldn’t be that they can’t.
The question is: after the shorts cover and push it up, what happens once the covering is done? If OI still can’t turn back upward later, this move might just be an emotion-driven pulse. If you want to chase it, keep an eye on when OI turns positive.
7
·
--
$XPL This move is kind of interesting.
The 15m price dropped 0.93%. It doesn’t look like much, but the close broke directly below the lower band of the past nearly 20 5m candles. Volume surged to 1.69x, aggressive trade imbalance is -16%, and the buy/sell ratio is 0.72—selling pressure is pushing, not a low-volume, grinding bearish drift.
But what really made me take a second look is OI. In the 1h contracts, OI decreased by 0.14%, with notional falling by 819K; on the 15m, notional also dropped by 330K. The price is falling, yet OI is only contracting slightly—not the kind of structure where “price falls + OI spikes” and new shorts keep piling in. In other words, it looks more like downside with position reduction, not shorts stacking orders to smash it lower.
The abnormal quantile is 89.1%, whole pool #16, notional change #25. The signal has been consistently continued for several consecutive periods, so it’s relatively clean. 24h turnover is 33.68M, and the depth is sufficient—not a board that can be blown up with just tens of thousands.
I’ll keep an eye on how this structure plays out: if OI continues to shrink while price keeps bleeding lower, it could mean longs are gradually giving up. But if OI suddenly turns to increase and price accelerates downward, then it becomes a new round of short succession—and the nature of the move changes.
For now, I’ll just observe—no rush.
$XPL This move is kind of interesting.
The 15m price dropped 0.93%. It doesn’t look like much, but the close broke directly below the lower band of the past nearly 20 5m candles. Volume surged to 1.69x, aggressive trade imbalance is -16%, and the buy/sell ratio is 0.72—selling pressure is pushing, not a low-volume, grinding bearish drift.
But what really made me take a second look is OI. In the 1h contracts, OI decreased by 0.14%, with notional falling by 819K; on the 15m, notional also dropped by 330K. The price is falling, yet OI is only contracting slightly—not the kind of structure where “price falls + OI spikes” and new shorts keep piling in. In other words, it looks more like downside with position reduction, not shorts stacking orders to smash it lower.
The abnormal quantile is 89.1%, whole pool #16, notional change #25. The signal has been consistently continued for several consecutive periods, so it’s relatively clean. 24h turnover is 33.68M, and the depth is sufficient—not a board that can be blown up with just tens of thousands.
I’ll keep an eye on how this structure plays out: if OI continues to shrink while price keeps bleeding lower, it could mean longs are gradually giving up. But if OI suddenly turns to increase and price accelerates downward, then it becomes a new round of short succession—and the nature of the move changes.
For now, I’ll just observe—no rush.
The 15m price dropped 0.93%. It doesn’t look like much, but the close broke directly below the lower band of the past nearly 20 5m candles. Volume surged to 1.69x, aggressive trade imbalance is -16%, and the buy/sell ratio is 0.72—selling pressure is pushing, not a low-volume, grinding bearish drift.
But what really made me take a second look is OI. In the 1h contracts, OI decreased by 0.14%, with notional falling by 819K; on the 15m, notional also dropped by 330K. The price is falling, yet OI is only contracting slightly—not the kind of structure where “price falls + OI spikes” and new shorts keep piling in. In other words, it looks more like downside with position reduction, not shorts stacking orders to smash it lower.
The abnormal quantile is 89.1%, whole pool #16, notional change #25. The signal has been consistently continued for several consecutive periods, so it’s relatively clean. 24h turnover is 33.68M, and the depth is sufficient—not a board that can be blown up with just tens of thousands.
I’ll keep an eye on how this structure plays out: if OI continues to shrink while price keeps bleeding lower, it could mean longs are gradually giving up. But if OI suddenly turns to increase and price accelerates downward, then it becomes a new round of short succession—and the nature of the move changes.
For now, I’ll just observe—no rush.
6
·
--
$LSK There’s a bit of movement here.
Over 15m, it rallied 5.8%, with volume up to 2.54x, and the price directly pushed through the upper edge of nearly 20 of the 5m candles. What’s interesting is the OI—on the 15m contract, it’s still down 0.07%, and only the 1h chart has barely turned positive at +0.26%. Price is rising but open interest isn’t following—this structure looks more like shorts being forced to cover than fresh longs stepping in.
The active trades are also off by 1.2%, and the buy/sell ratio is 1.02. In plain terms, the bids have a slight edge, but it’s not to the point of going out of control.
Overall-pool abnormal ranking #16, nominal change #6, and 24h trading value is $1.35 billion. The position I fear most is chasing in to catch the tail end of a forced short cover—let OI actually catch up before saying anything. I’ll watch first.
$LSK There’s a bit of movement here.
Over 15m, it rallied 5.8%, with volume up to 2.54x, and the price directly pushed through the upper edge of nearly 20 of the 5m candles. What’s interesting is the OI—on the 15m contract, it’s still down 0.07%, and only the 1h chart has barely turned positive at +0.26%. Price is rising but open interest isn’t following—this structure looks more like shorts being forced to cover than fresh longs stepping in.
The active trades are also off by 1.2%, and the buy/sell ratio is 1.02. In plain terms, the bids have a slight edge, but it’s not to the point of going out of control.
Overall-pool abnormal ranking #16, nominal change #6, and 24h trading value is $1.35 billion. The position I fear most is chasing in to catch the tail end of a forced short cover—let OI actually catch up before saying anything. I’ll watch first.
Over 15m, it rallied 5.8%, with volume up to 2.54x, and the price directly pushed through the upper edge of nearly 20 of the 5m candles. What’s interesting is the OI—on the 15m contract, it’s still down 0.07%, and only the 1h chart has barely turned positive at +0.26%. Price is rising but open interest isn’t following—this structure looks more like shorts being forced to cover than fresh longs stepping in.
The active trades are also off by 1.2%, and the buy/sell ratio is 1.02. In plain terms, the bids have a slight edge, but it’s not to the point of going out of control.
Overall-pool abnormal ranking #16, nominal change #6, and 24h trading value is $1.35 billion. The position I fear most is chasing in to catch the tail end of a forced short cover—let OI actually catch up before saying anything. I’ll watch first.
19
Log in to explore more content
Join global crypto users on Binance Square
⚡️ Get latest and useful information about crypto.
💬 Trusted by the world’s largest crypto exchange.
👍 Discover real insights from verified creators.
Email / Phone number
Trending Topics
1
#AIStocksWhatNext
373,395 views
2,996 Discussing
2
#BitcoinBreaksAboveMayHighNears$86K
15,017 views
192 Discussing
3
#DogecoinRises15%
48,017 views
995 Discussing
4
#$14BBitcoinOptionsExpireFriday
3,898 views
89 Discussing
5
#BNBMarketCapPassesBNYMellon
30,273 views
711 Discussing
6
#CryptoMarketCapReclaims$3Trillion
5,166 views
82 Discussing
7
#MuseOvertakesChatGPTAsTopFreeIOSApp
17,850 views
534 Discussing
8
#TokenizedStockPlatformsCouldLaunchNextQuarter
28,268 views
588 Discussing
9
#StrategyAdds950Bitcoin
35,325 views
685 Discussing
10
#CardanoAddedToX402KitForADAPayments
30,021 views
658 Discussing