
#22
22
15,127 views
162 Discussing
Hot
Latest

·
--
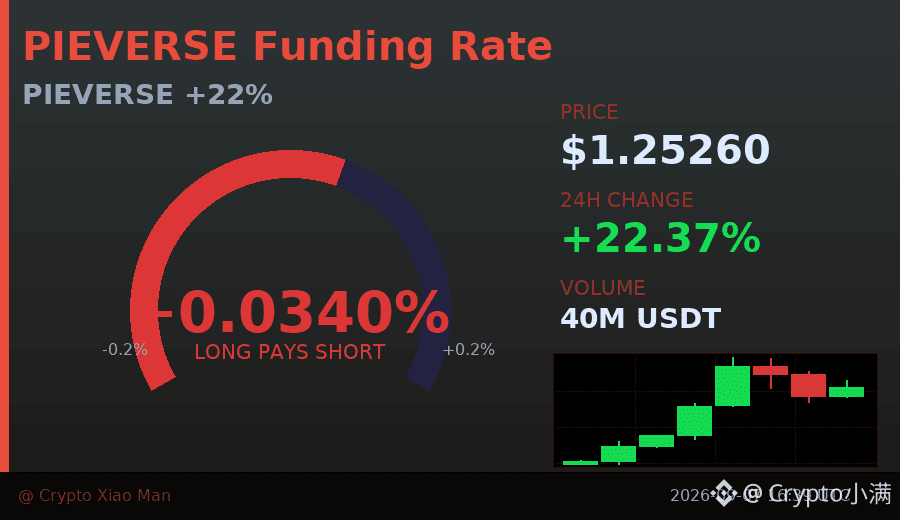
22% rise in price, but the funding rate has already spiked to 0.034%—is this a real breakthrough, or are the longs just too crowded?
PIEVERSE’s trading volume hit 40 million USDT today; in just 8 hours it kept strengthening, climbing from 1.02 to a high of 1.32.
However, the long-to-short ratio is now 48% to 52%, with shorts slightly in the lead. Add the high funding rate, and the risk of chasing longs isn’t small.
I lean toward waiting for the funding rate to pull back, and only then watching after the price holds above 1.25.
In this kind of sharp surge, it’s better to miss the first wave than to become a bag-holder.
$PIEVERSE #资金费率预警 #22%
Click the small card below to quickly check the market 👇
22% rise in price, but the funding rate has already spiked to 0.034%—is this a real breakthrough, or are the longs just too crowded?
PIEVERSE’s trading volume hit 40 million USDT today; in just 8 hours it kept strengthening, climbing from 1.02 to a high of 1.32.
However, the long-to-short ratio is now 48% to 52%, with shorts slightly in the lead. Add the high funding rate, and the risk of chasing longs isn’t small.
I lean toward waiting for the funding rate to pull back, and only then watching after the price holds above 1.25.
In this kind of sharp surge, it’s better to miss the first wave than to become a bag-holder.
$PIEVERSE #资金费率预警 #22%
Click the small card below to quickly check the market 👇
PIEVERSE’s trading volume hit 40 million USDT today; in just 8 hours it kept strengthening, climbing from 1.02 to a high of 1.32.
However, the long-to-short ratio is now 48% to 52%, with shorts slightly in the lead. Add the high funding rate, and the risk of chasing longs isn’t small.
I lean toward waiting for the funding rate to pull back, and only then watching after the price holds above 1.25.
In this kind of sharp surge, it’s better to miss the first wave than to become a bag-holder.
$PIEVERSE #资金费率预警 #22%
Click the small card below to quickly check the market 👇
50

·
--
NEAR rockets 17% — Altcoins on fire!NEAR Protocol (NEARUSDT) is trending right now!
Rank: #22
🚀 **NEAR just exploded +17.35%**, trading at **.207** with 52M volume! Hot on its heels, surged **+10.52%** to **/bin/sh.2447**, pumped **+9.98%** at **1.393**, and isn’t far behind with **+9.88%**. While and sit sideways, I’m betting this alt‑season momentum could moon the whole ecosystem. 🎯 **
#bitcoin #ethereum #crypto
NEAR rockets 17% — Altcoins on fire!
NEAR Protocol (NEARUSDT) is trending right now!
Rank: #22
🚀 **NEAR just exploded +17.35%**, trading at **.207** with 52M volume! Hot on its heels, surged **+10.52%** to **/bin/sh.2447**, pumped **+9.98%** at **1.393**, and isn’t far behind with **+9.88%**. While and sit sideways, I’m betting this alt‑season momentum could moon the whole ecosystem. 🎯 **
#bitcoin #ethereum #crypto
Rank: #22
🚀 **NEAR just exploded +17.35%**, trading at **.207** with 52M volume! Hot on its heels, surged **+10.52%** to **/bin/sh.2447**, pumped **+9.98%** at **1.393**, and isn’t far behind with **+9.88%**. While and sit sideways, I’m betting this alt‑season momentum could moon the whole ecosystem. 🎯 **
#bitcoin #ethereum #crypto
10

·
--
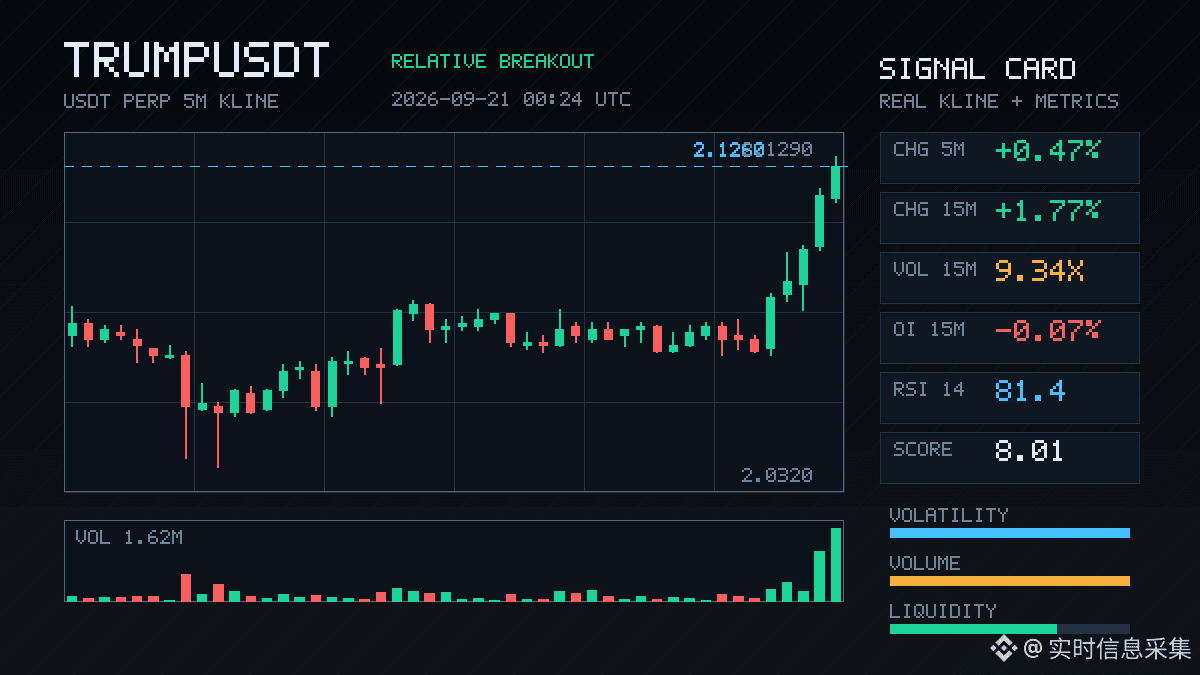
$TRUMP 15mThis move is kind of interesting—the volume pushed directly to 9.34x, the active buy/sell ratio is 1.52, and the closing price broke above the highs of the upper edges of the latest 20+ 5m candles.
But pay attention to one detail: as the price is rising, the OI on the 15m is actually -0.07%. This isn’t the structure of fresh long entry. It looks more like short covering or older positions getting pulled along passively. OI on the 1h is slightly turned positive at +0.18%, nominal change of 1.51M—not exactly “crazy” adding.
The abnormal percentile is 95.2%, ranking #32 in the whole pool, nominal change ranked #22—quite high, but not at the very top tier.
My understanding is: a squeeze in an extreme range—volume confirmed it, and depth confirmed it too. But OI didn’t keep up. This looks more like a momentum/feeling pulse rather than a trend starting. 24h trading value is 121M; the pool is thick enough. Still, before chasing higher, think clearly about one question—after shorts cover, who’s going to carry the baton next?
Watch the OI: if price keeps moving while OI starts rising in sync, then that’s the real signal.
$TRUMP 15mThis move is kind of interesting—the volume pushed directly to 9.34x, the active buy/sell ratio is 1.52, and the closing price broke above the highs of the upper edges of the latest 20+ 5m candles.
But pay attention to one detail: as the price is rising, the OI on the 15m is actually -0.07%. This isn’t the structure of fresh long entry. It looks more like short covering or older positions getting pulled along passively. OI on the 1h is slightly turned positive at +0.18%, nominal change of 1.51M—not exactly “crazy” adding.
The abnormal percentile is 95.2%, ranking #32 in the whole pool, nominal change ranked #22—quite high, but not at the very top tier.
My understanding is: a squeeze in an extreme range—volume confirmed it, and depth confirmed it too. But OI didn’t keep up. This looks more like a momentum/feeling pulse rather than a trend starting. 24h trading value is 121M; the pool is thick enough. Still, before chasing higher, think clearly about one question—after shorts cover, who’s going to carry the baton next?
Watch the OI: if price keeps moving while OI starts rising in sync, then that’s the real signal.
But pay attention to one detail: as the price is rising, the OI on the 15m is actually -0.07%. This isn’t the structure of fresh long entry. It looks more like short covering or older positions getting pulled along passively. OI on the 1h is slightly turned positive at +0.18%, nominal change of 1.51M—not exactly “crazy” adding.
The abnormal percentile is 95.2%, ranking #32 in the whole pool, nominal change ranked #22—quite high, but not at the very top tier.
My understanding is: a squeeze in an extreme range—volume confirmed it, and depth confirmed it too. But OI didn’t keep up. This looks more like a momentum/feeling pulse rather than a trend starting. 24h trading value is 121M; the pool is thick enough. Still, before chasing higher, think clearly about one question—after shorts cover, who’s going to carry the baton next?
Watch the OI: if price keeps moving while OI starts rising in sync, then that’s the real signal.
128

·
--
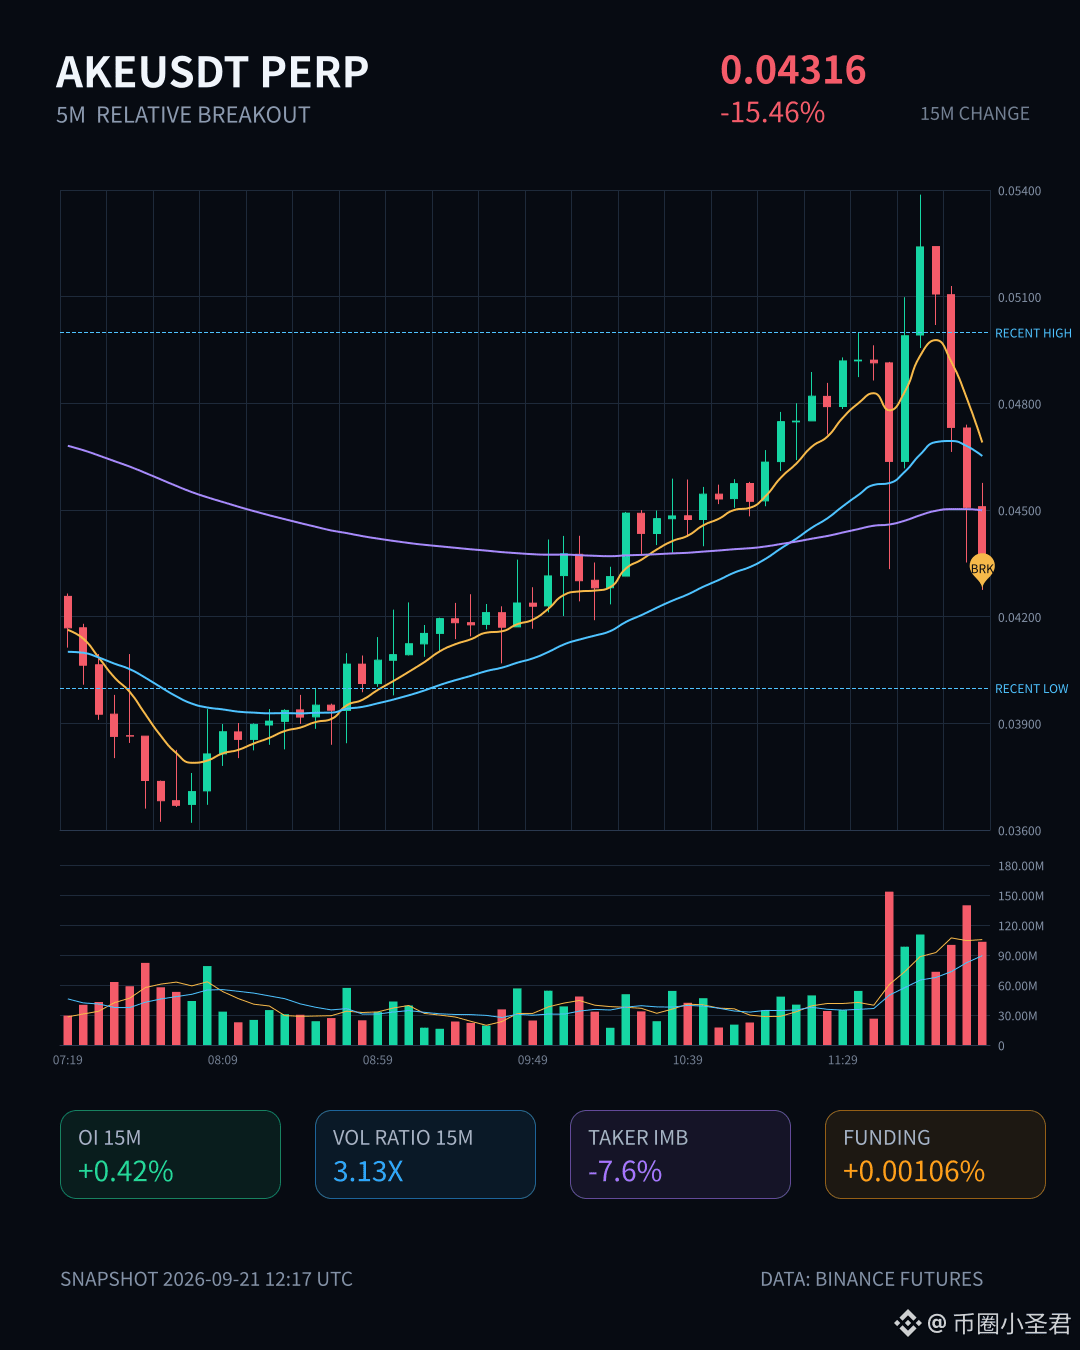
$AKE These 15 minutes smashed it pretty solidly, -15.46%. The volume directly hit 3.13x. Volatility Z is 4.96—this isn’t the kind of low-volume, slow bleed down. It’s a breakdown with volume.
The structure is worth studying more: as price drops, the OI for 15m actually increases by +0.42%. Nominal change is -3.99M; the difference in active trades is -7.6%; buy/sell ratio is 0.86. This doesn’t look like existing longs cutting and running. It looks more like new shorts stepping in and pressing their entry here. 1h OI is -2.15%, which suggests a round of leverage is regrouping at this level.
Whole pool abnormality #22, nominal change #5, abnormal percentile 92.3%. Multiple consecutive periods have continued; the depth confirmation also passed. The closing price broke below the lower edge of the most recent 20 five-minute ranges. This spot is pretty key—after breaking the lower edge, if it can’t get pulled back, below is a vacuum zone.
24h turnover is 647M, and the pool still has actively traded liquidity. Right now, chasing shorts has mediocre risk-reward. Wait for a rebound that fails to get back above the previous low, add it to your watchlist to observe. A weak rebound after a breakdown is the real opportunity.
$AKE These 15 minutes smashed it pretty solidly, -15.46%. The volume directly hit 3.13x. Volatility Z is 4.96—this isn’t the kind of low-volume, slow bleed down. It’s a breakdown with volume.
The structure is worth studying more: as price drops, the OI for 15m actually increases by +0.42%. Nominal change is -3.99M; the difference in active trades is -7.6%; buy/sell ratio is 0.86. This doesn’t look like existing longs cutting and running. It looks more like new shorts stepping in and pressing their entry here. 1h OI is -2.15%, which suggests a round of leverage is regrouping at this level.
Whole pool abnormality #22, nominal change #5, abnormal percentile 92.3%. Multiple consecutive periods have continued; the depth confirmation also passed. The closing price broke below the lower edge of the most recent 20 five-minute ranges. This spot is pretty key—after breaking the lower edge, if it can’t get pulled back, below is a vacuum zone.
24h turnover is 647M, and the pool still has actively traded liquidity. Right now, chasing shorts has mediocre risk-reward. Wait for a rebound that fails to get back above the previous low, add it to your watchlist to observe. A weak rebound after a breakdown is the real opportunity.
The structure is worth studying more: as price drops, the OI for 15m actually increases by +0.42%. Nominal change is -3.99M; the difference in active trades is -7.6%; buy/sell ratio is 0.86. This doesn’t look like existing longs cutting and running. It looks more like new shorts stepping in and pressing their entry here. 1h OI is -2.15%, which suggests a round of leverage is regrouping at this level.
Whole pool abnormality #22, nominal change #5, abnormal percentile 92.3%. Multiple consecutive periods have continued; the depth confirmation also passed. The closing price broke below the lower edge of the most recent 20 five-minute ranges. This spot is pretty key—after breaking the lower edge, if it can’t get pulled back, below is a vacuum zone.
24h turnover is 647M, and the pool still has actively traded liquidity. Right now, chasing shorts has mediocre risk-reward. Wait for a rebound that fails to get back above the previous low, add it to your watchlist to observe. A weak rebound after a breakdown is the real opportunity.
14
·
--
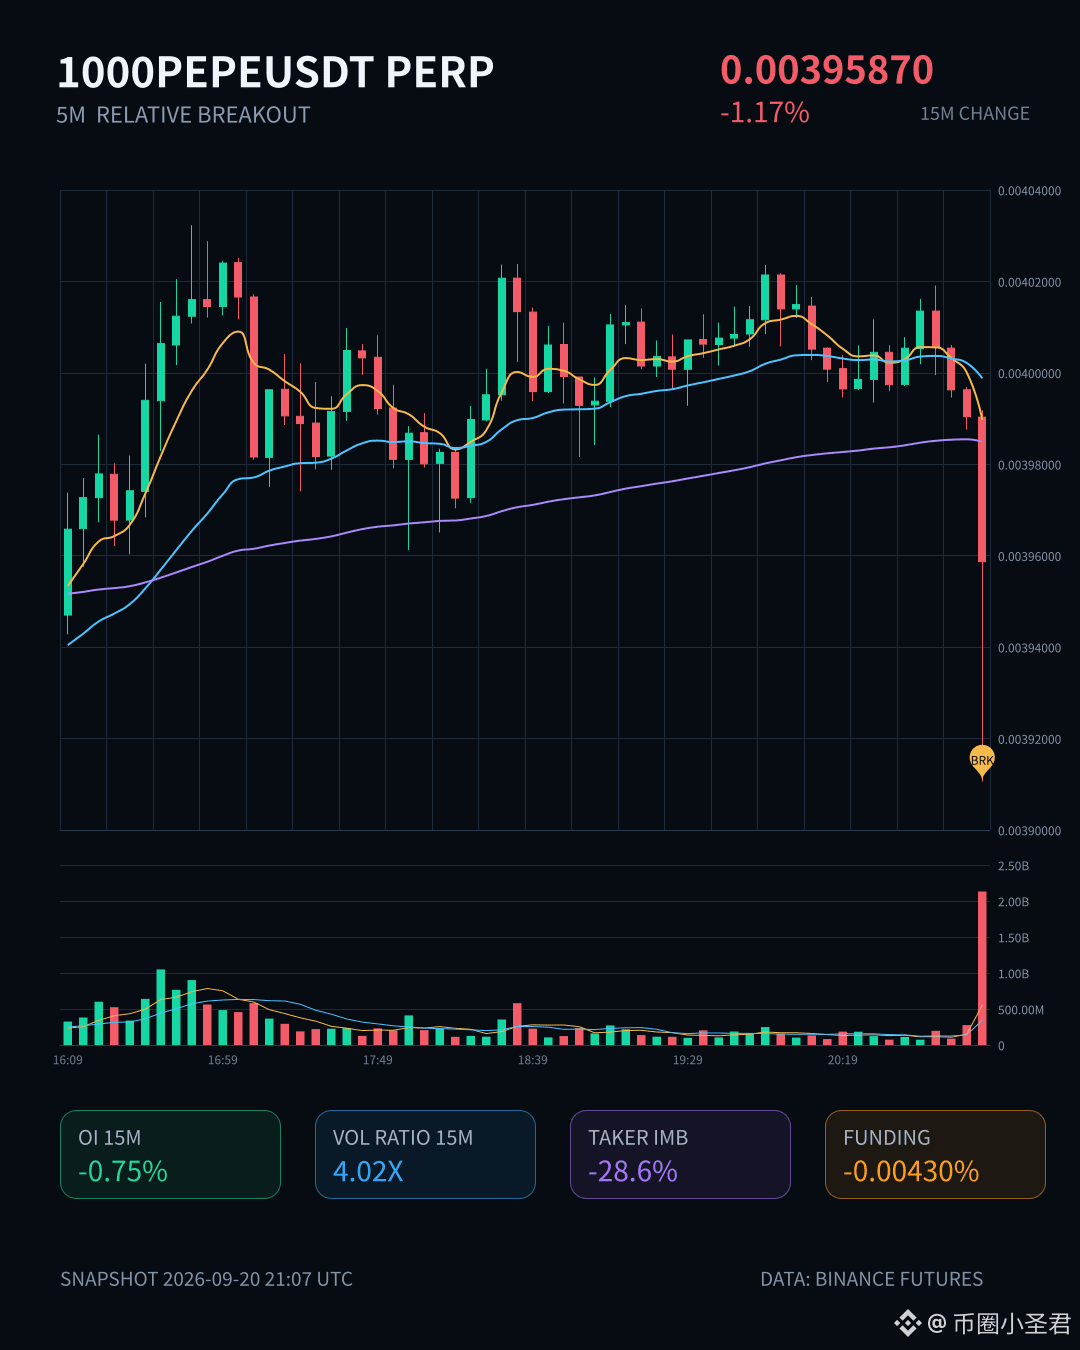
$1000PEPE This 15m move is pretty brutal—volume directly hit 4x, while the price still broke down through nearly the lower end of about 20 consecutive 5m ranges. The active trading volume gap is -28.6%, and the buy-sell ratio is 0.56—clearly someone is dumping.
But pay attention to OI: 15m -0.75%, 1h -0.65%, and the notional changes are all staying muted. This doesn’t look like fresh shorts entering; it looks more like longs de-leveraging, with stop-losses getting swept. OI’s abnormal percentile is 95.4%, in the whole pool #22, meaning positions were already crowded. Now it’s more like clearing out than a trend reversal into new shorts.
Over the past 24h, total trading value is still 446M, and the depth isn’t bad. Next, watch two things: whether OI can hold steady, and how strongly price bounces back toward the lower bound. If it’s just passive position reduction, after the liquidation the price may rebound easily; but if it continues with shrinking volume and drifting down, don’t rush to catch the falling move.
$1000PEPE This 15m move is pretty brutal—volume directly hit 4x, while the price still broke down through nearly the lower end of about 20 consecutive 5m ranges. The active trading volume gap is -28.6%, and the buy-sell ratio is 0.56—clearly someone is dumping.
But pay attention to OI: 15m -0.75%, 1h -0.65%, and the notional changes are all staying muted. This doesn’t look like fresh shorts entering; it looks more like longs de-leveraging, with stop-losses getting swept. OI’s abnormal percentile is 95.4%, in the whole pool #22, meaning positions were already crowded. Now it’s more like clearing out than a trend reversal into new shorts.
Over the past 24h, total trading value is still 446M, and the depth isn’t bad. Next, watch two things: whether OI can hold steady, and how strongly price bounces back toward the lower bound. If it’s just passive position reduction, after the liquidation the price may rebound easily; but if it continues with shrinking volume and drifting down, don’t rush to catch the falling move.
But pay attention to OI: 15m -0.75%, 1h -0.65%, and the notional changes are all staying muted. This doesn’t look like fresh shorts entering; it looks more like longs de-leveraging, with stop-losses getting swept. OI’s abnormal percentile is 95.4%, in the whole pool #22, meaning positions were already crowded. Now it’s more like clearing out than a trend reversal into new shorts.
Over the past 24h, total trading value is still 446M, and the depth isn’t bad. Next, watch two things: whether OI can hold steady, and how strongly price bounces back toward the lower bound. If it’s just passive position reduction, after the liquidation the price may rebound easily; but if it continues with shrinking volume and drifting down, don’t rush to catch the falling move.
18
·
--
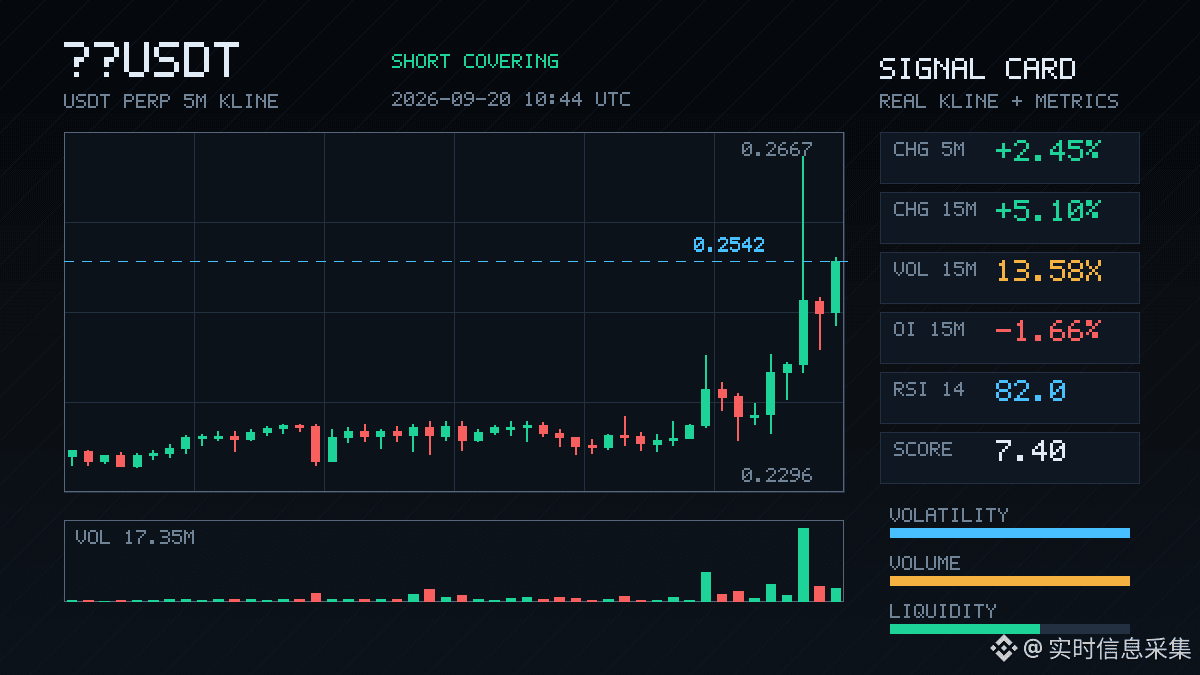
$ Lobster This move in 15m directly surged 5.1%, volume reached 13.58x, and the Z value is 5.21—a typical breakout burst with a needle. But take a look at the OI: on 15m it decreased by 1.66%, and on 1h it decreased by 2.22%. Price is up, but open interest is down—doesn’t that match the standard playbook for short covering?
The OI anomaly percentile is 94.2%, ranked #22 in the whole pool, with a nominal change of #5. Depth and volume both confirm it. The aggressive buy/sell ratio is 1.52, and the bid side is tilted at 20.7%, indicating that some capital is actively taking the order flow. 24h trading value is 72.99M, and liquidity isn’t too bad.
In this kind of structure, breakouts upward are often driven by shorts being forced to cover—not by fresh long positions entering. After the shorts cover, if OI doesn’t rise back up, it’s hard to say how much of this rally can be held. If you’re chasing higher prices, weigh it yourself—don’t end up being the one left holding the bag.
$ Lobster This move in 15m directly surged 5.1%, volume reached 13.58x, and the Z value is 5.21—a typical breakout burst with a needle. But take a look at the OI: on 15m it decreased by 1.66%, and on 1h it decreased by 2.22%. Price is up, but open interest is down—doesn’t that match the standard playbook for short covering?
The OI anomaly percentile is 94.2%, ranked #22 in the whole pool, with a nominal change of #5. Depth and volume both confirm it. The aggressive buy/sell ratio is 1.52, and the bid side is tilted at 20.7%, indicating that some capital is actively taking the order flow. 24h trading value is 72.99M, and liquidity isn’t too bad.
In this kind of structure, breakouts upward are often driven by shorts being forced to cover—not by fresh long positions entering. After the shorts cover, if OI doesn’t rise back up, it’s hard to say how much of this rally can be held. If you’re chasing higher prices, weigh it yourself—don’t end up being the one left holding the bag.
The OI anomaly percentile is 94.2%, ranked #22 in the whole pool, with a nominal change of #5. Depth and volume both confirm it. The aggressive buy/sell ratio is 1.52, and the bid side is tilted at 20.7%, indicating that some capital is actively taking the order flow. 24h trading value is 72.99M, and liquidity isn’t too bad.
In this kind of structure, breakouts upward are often driven by shorts being forced to cover—not by fresh long positions entering. After the shorts cover, if OI doesn’t rise back up, it’s hard to say how much of this rally can be held. If you’re chasing higher prices, weigh it yourself—don’t end up being the one left holding the bag.
20
·
--
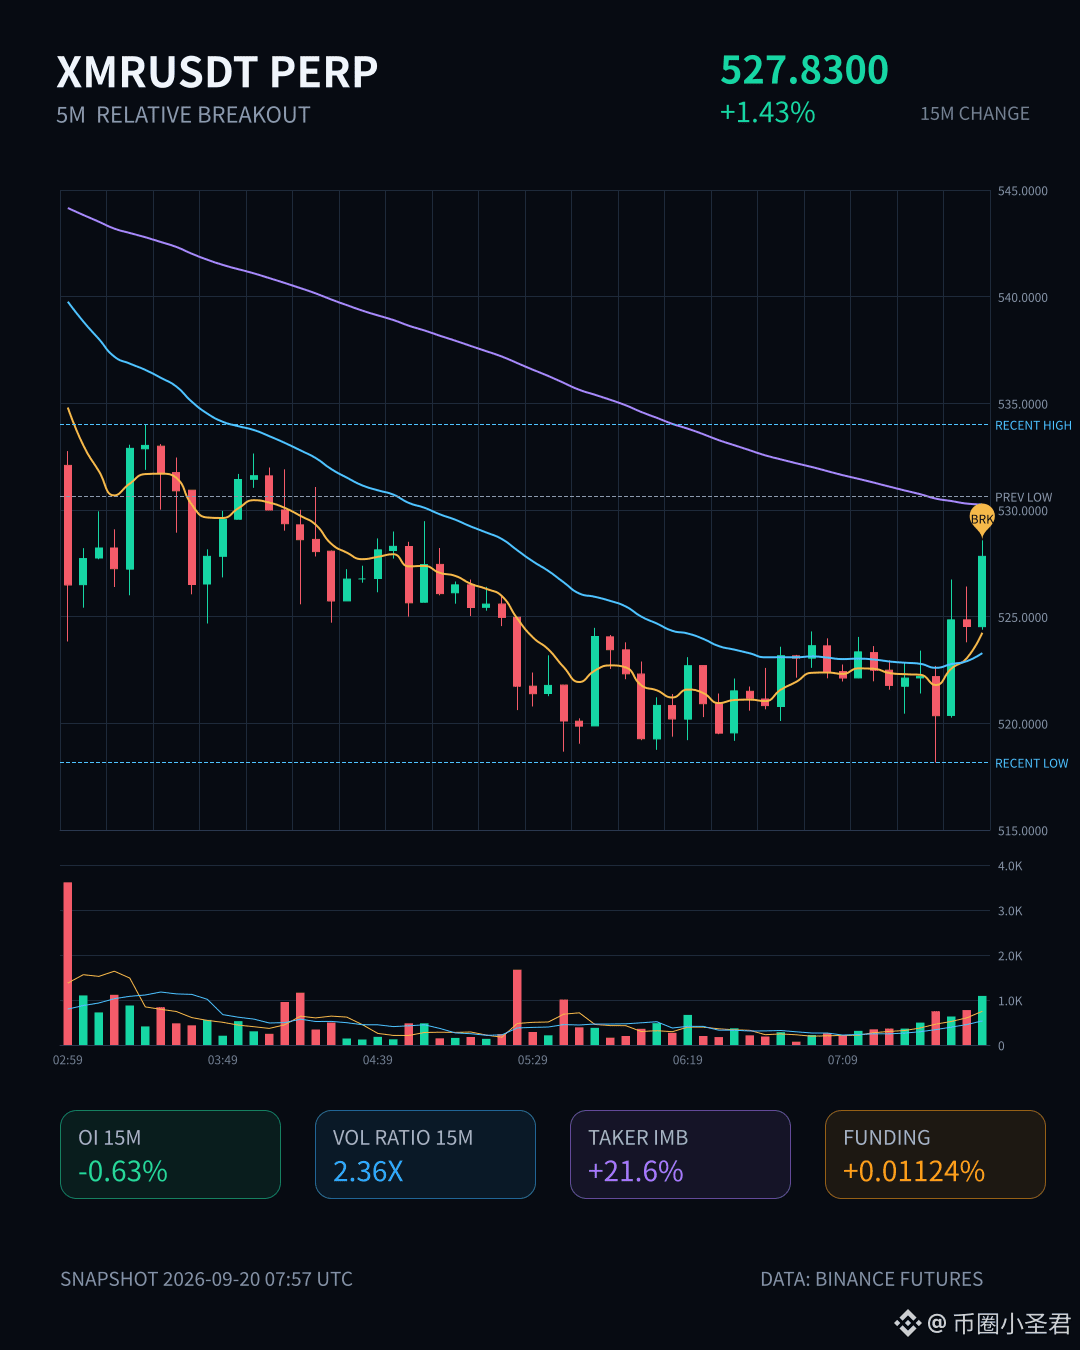
$XMR There’s a bit of interest over here.
In 15m, it directly pulled up by 1.43%. Volume reached 2.36x, and the closing price climbed above the upper edge of nearly 20 consecutive 5m candles. The buy/sell ratio of active orders is 1.55, and active trade volume is 21.6% lower—so the bias is toward buys.
But note one detail: OI in 15m is -0.63%, and in 1h is -1.06%. Price is rising while positions are falling. This isn’t the structure of fresh long entries; it looks more like short covering or existing positions being flattened.
So the sustainability of this push depends on whether, after the covering is done, there’s truly new “real money” stepping in. The traded volume is indeed higher than usual, and depth also confirms it. The notional change of 390K USDT ranks #22 in the whole pool, with an abnormal percentile of 74%—some movement, but not extraordinarily extreme.
For coins in this kind of privacy-sector segment like $XMR , liquidity is usually just so-so. When there’s suddenly a volume spike to more than 2x, it’s still worth staying cautious. The 24h trading value is 72M; the pool isn’t that deep—don’t chase.
First, see whether it can hold above the top edge of this range.
$XMR There’s a bit of interest over here.
In 15m, it directly pulled up by 1.43%. Volume reached 2.36x, and the closing price climbed above the upper edge of nearly 20 consecutive 5m candles. The buy/sell ratio of active orders is 1.55, and active trade volume is 21.6% lower—so the bias is toward buys.
But note one detail: OI in 15m is -0.63%, and in 1h is -1.06%. Price is rising while positions are falling. This isn’t the structure of fresh long entries; it looks more like short covering or existing positions being flattened.
So the sustainability of this push depends on whether, after the covering is done, there’s truly new “real money” stepping in. The traded volume is indeed higher than usual, and depth also confirms it. The notional change of 390K USDT ranks #22 in the whole pool, with an abnormal percentile of 74%—some movement, but not extraordinarily extreme.
For coins in this kind of privacy-sector segment like $XMR , liquidity is usually just so-so. When there’s suddenly a volume spike to more than 2x, it’s still worth staying cautious. The 24h trading value is 72M; the pool isn’t that deep—don’t chase.
First, see whether it can hold above the top edge of this range.
In 15m, it directly pulled up by 1.43%. Volume reached 2.36x, and the closing price climbed above the upper edge of nearly 20 consecutive 5m candles. The buy/sell ratio of active orders is 1.55, and active trade volume is 21.6% lower—so the bias is toward buys.
But note one detail: OI in 15m is -0.63%, and in 1h is -1.06%. Price is rising while positions are falling. This isn’t the structure of fresh long entries; it looks more like short covering or existing positions being flattened.
So the sustainability of this push depends on whether, after the covering is done, there’s truly new “real money” stepping in. The traded volume is indeed higher than usual, and depth also confirms it. The notional change of 390K USDT ranks #22 in the whole pool, with an abnormal percentile of 74%—some movement, but not extraordinarily extreme.
For coins in this kind of privacy-sector segment like $XMR , liquidity is usually just so-so. When there’s suddenly a volume spike to more than 2x, it’s still worth staying cautious. The 24h trading value is 72M; the pool isn’t that deep—don’t chase.
First, see whether it can hold above the top edge of this range.
10
·
--
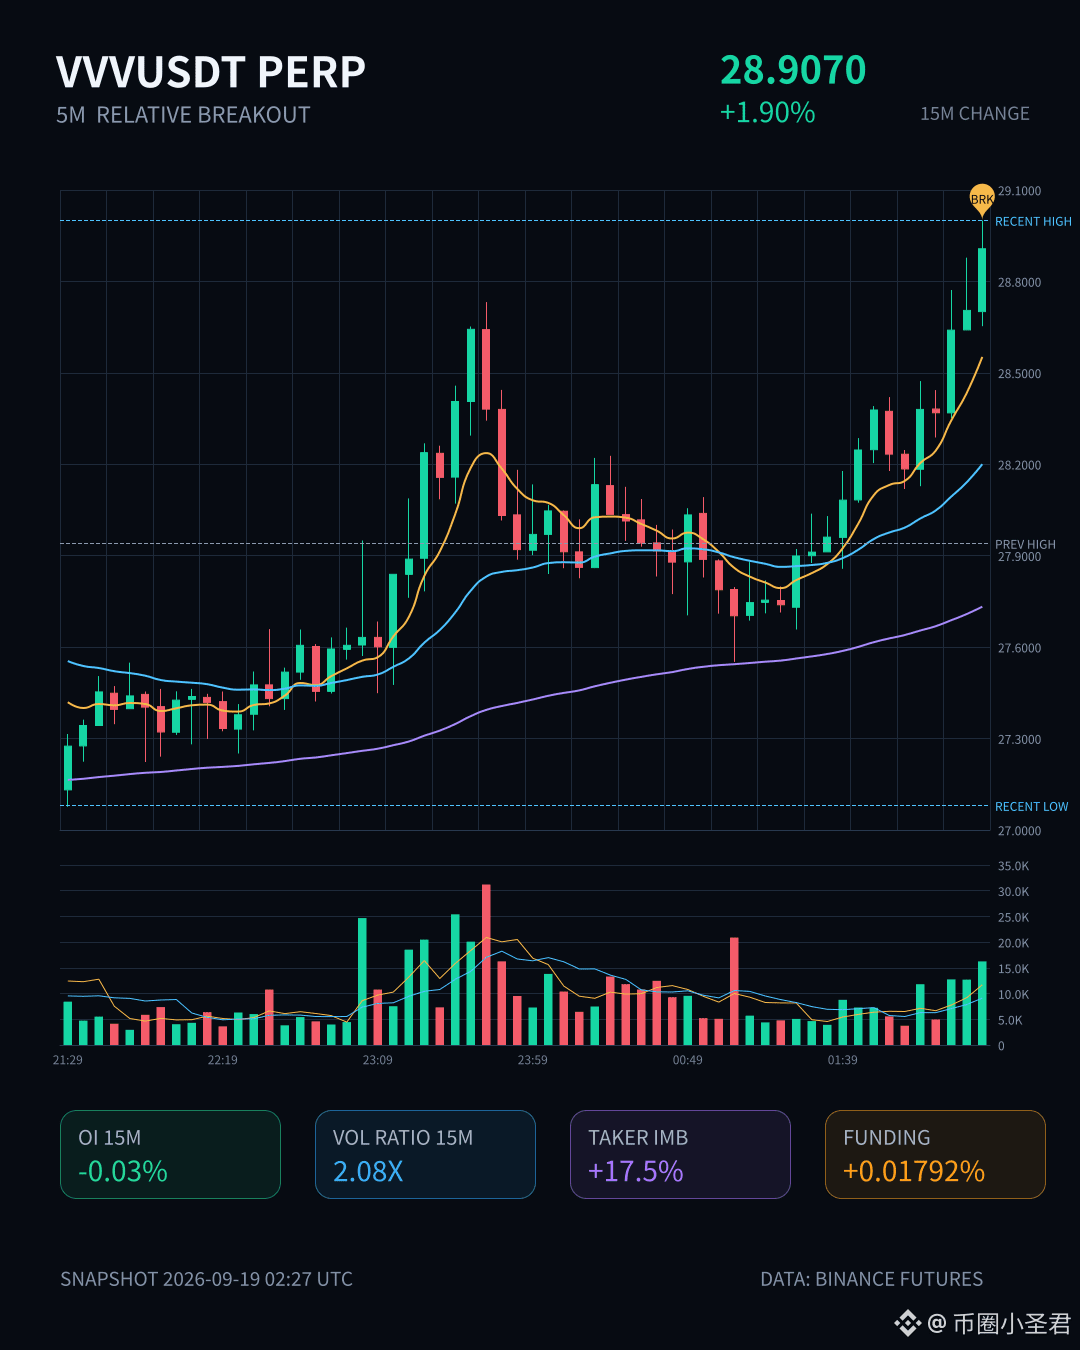
$VVV This move is kind of interesting.
The price pushed up by 1.9%, while volume directly surged to more than 2x. In the 5m close, it strongly broke through the upper edge of nearly 20 K-lines. But take a closer look at OI—on the 15m timeframe it’s actually negative, -0.03%.
So what does that indicate? This push upward doesn’t really look like fresh longs actively opening positions. It’s more like shorts are being forced into covering. Active buy/sell is 1.42, and active traded volume is 17.5% lower—buyers are indeed leading, but open interest didn’t keep up.
Instead, if you look at the 1h chart, OI turns slightly positive again, +0.28%, with nominal change of 1.28M. So my understanding is: in the short cycle, this is old positions being covered, while in the medium cycle, capital is slowly stepping in.
The OI abnormal percentile is 93.1%, ranking #11 across the whole pool; nominal change ranks #22. This is already an extreme zone. And it isn’t an isolated outlier of a single timeframe—multiple consecutive cycles are continuing, with volume higher than normal, and the price just happens to be pressing right up against the boundary of the recent range.
In other words, short covering can push the price up, but after it’s done, if there’s no new wave of fresh longs to take over, it’s just a pulse. Right now OI isn’t surging with heavy volume, so I lean toward observing first to see whether the upper end of this range can hold. If it holds, there’s still room. If it can’t, then once the covering is finished, it will likely disperse.
No rush to chase—let it move on its own.
$VVV This move is kind of interesting.
The price pushed up by 1.9%, while volume directly surged to more than 2x. In the 5m close, it strongly broke through the upper edge of nearly 20 K-lines. But take a closer look at OI—on the 15m timeframe it’s actually negative, -0.03%.
So what does that indicate? This push upward doesn’t really look like fresh longs actively opening positions. It’s more like shorts are being forced into covering. Active buy/sell is 1.42, and active traded volume is 17.5% lower—buyers are indeed leading, but open interest didn’t keep up.
Instead, if you look at the 1h chart, OI turns slightly positive again, +0.28%, with nominal change of 1.28M. So my understanding is: in the short cycle, this is old positions being covered, while in the medium cycle, capital is slowly stepping in.
The OI abnormal percentile is 93.1%, ranking #11 across the whole pool; nominal change ranks #22. This is already an extreme zone. And it isn’t an isolated outlier of a single timeframe—multiple consecutive cycles are continuing, with volume higher than normal, and the price just happens to be pressing right up against the boundary of the recent range.
In other words, short covering can push the price up, but after it’s done, if there’s no new wave of fresh longs to take over, it’s just a pulse. Right now OI isn’t surging with heavy volume, so I lean toward observing first to see whether the upper end of this range can hold. If it holds, there’s still room. If it can’t, then once the covering is finished, it will likely disperse.
No rush to chase—let it move on its own.
The price pushed up by 1.9%, while volume directly surged to more than 2x. In the 5m close, it strongly broke through the upper edge of nearly 20 K-lines. But take a closer look at OI—on the 15m timeframe it’s actually negative, -0.03%.
So what does that indicate? This push upward doesn’t really look like fresh longs actively opening positions. It’s more like shorts are being forced into covering. Active buy/sell is 1.42, and active traded volume is 17.5% lower—buyers are indeed leading, but open interest didn’t keep up.
Instead, if you look at the 1h chart, OI turns slightly positive again, +0.28%, with nominal change of 1.28M. So my understanding is: in the short cycle, this is old positions being covered, while in the medium cycle, capital is slowly stepping in.
The OI abnormal percentile is 93.1%, ranking #11 across the whole pool; nominal change ranks #22. This is already an extreme zone. And it isn’t an isolated outlier of a single timeframe—multiple consecutive cycles are continuing, with volume higher than normal, and the price just happens to be pressing right up against the boundary of the recent range.
In other words, short covering can push the price up, but after it’s done, if there’s no new wave of fresh longs to take over, it’s just a pulse. Right now OI isn’t surging with heavy volume, so I lean toward observing first to see whether the upper end of this range can hold. If it holds, there’s still room. If it can’t, then once the covering is finished, it will likely disperse.
No rush to chase—let it move on its own.
20

·
--
$UAI In these 15 minutes, it got a bit ruthless—straight down 3.62%. The volume surged to 5.31x, Z-score 4.62, clearly not normal turnover.
Price just broke below the lower band of the recent 20 5m candles. Active trades are down -35.6%, buy/sell ratio is 0.48, and the sell pressure is genuinely pushing downward. What’s interesting is this: OI nominal over 1h is still less by -712K, but in 15m it barely increased by +0.26%. Meanwhile the nominal change is -517K (-3.37%)—with price falling and OI not collapsing alongside it. This looks more like fresh shorts adding in to press down, not longs simply cutting losses.
The OI abnormal percentile has already spiked to 97%. In the whole pool, it’s abnormal #8; nominal change is #22. The total 24h trading value is only 20.99M. This pool isn’t very deep. With this kind of volume, slippage and wick-spikes (price pokes) can easily be amplified.
I won’t chase the short, and I won’t catch a falling knife. I’ll wait for this 15m candle to finish and see whether it can reclaim the lower boundary of the range. If it can’t, chances are there’s another leg down. If it instead quickly snaps back after a near-fake drop, then today’s 97th-percentile anomaly is likely an induced-short or bear-trap storyline. $UAI
$UAI In these 15 minutes, it got a bit ruthless—straight down 3.62%. The volume surged to 5.31x, Z-score 4.62, clearly not normal turnover.
Price just broke below the lower band of the recent 20 5m candles. Active trades are down -35.6%, buy/sell ratio is 0.48, and the sell pressure is genuinely pushing downward. What’s interesting is this: OI nominal over 1h is still less by -712K, but in 15m it barely increased by +0.26%. Meanwhile the nominal change is -517K (-3.37%)—with price falling and OI not collapsing alongside it. This looks more like fresh shorts adding in to press down, not longs simply cutting losses.
The OI abnormal percentile has already spiked to 97%. In the whole pool, it’s abnormal #8; nominal change is #22. The total 24h trading value is only 20.99M. This pool isn’t very deep. With this kind of volume, slippage and wick-spikes (price pokes) can easily be amplified.
I won’t chase the short, and I won’t catch a falling knife. I’ll wait for this 15m candle to finish and see whether it can reclaim the lower boundary of the range. If it can’t, chances are there’s another leg down. If it instead quickly snaps back after a near-fake drop, then today’s 97th-percentile anomaly is likely an induced-short or bear-trap storyline. $UAI
Price just broke below the lower band of the recent 20 5m candles. Active trades are down -35.6%, buy/sell ratio is 0.48, and the sell pressure is genuinely pushing downward. What’s interesting is this: OI nominal over 1h is still less by -712K, but in 15m it barely increased by +0.26%. Meanwhile the nominal change is -517K (-3.37%)—with price falling and OI not collapsing alongside it. This looks more like fresh shorts adding in to press down, not longs simply cutting losses.
The OI abnormal percentile has already spiked to 97%. In the whole pool, it’s abnormal #8; nominal change is #22. The total 24h trading value is only 20.99M. This pool isn’t very deep. With this kind of volume, slippage and wick-spikes (price pokes) can easily be amplified.
I won’t chase the short, and I won’t catch a falling knife. I’ll wait for this 15m candle to finish and see whether it can reclaim the lower boundary of the range. If it can’t, chances are there’s another leg down. If it instead quickly snaps back after a near-fake drop, then today’s 97th-percentile anomaly is likely an induced-short or bear-trap storyline. $UAI
17
·
--
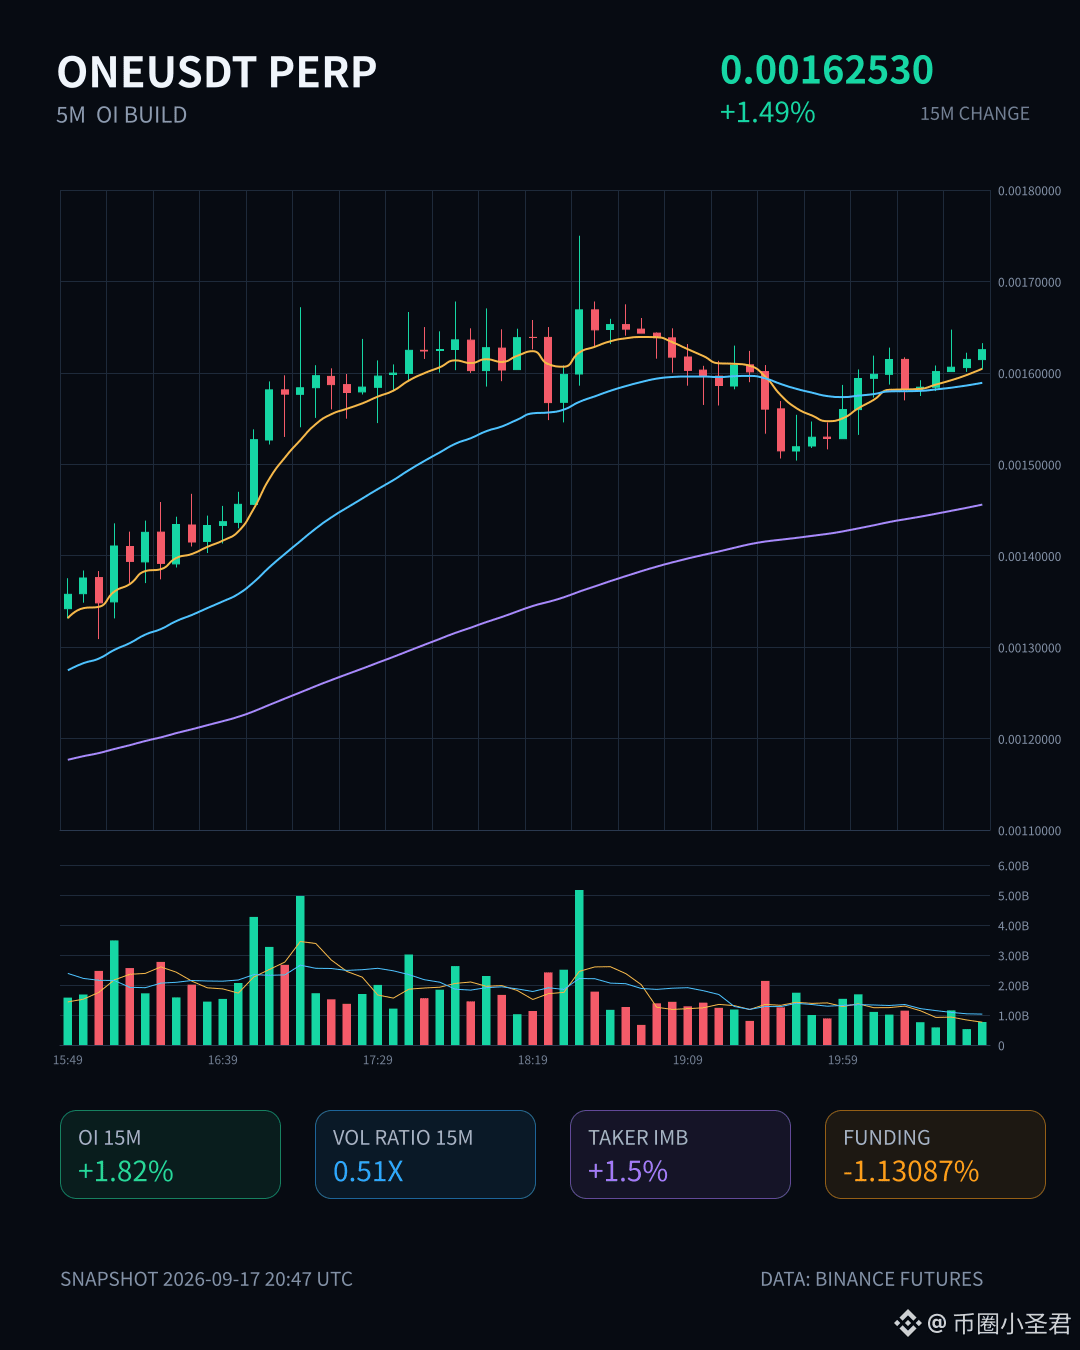
$ONE There’s something interesting here. The price for 15m climbed 15m, up 1.49%, but volume didn’t really pick up—volume at 0.51x paired with a 0.50 wave feels rather sluggish on the surface.
But the OI is secretly increasing. 15m +1.82%, 1h +1.68%. Nominal change in 1h reached 837K, +8.70%. This doesn’t look like it’s being pushed by closing positions—it’s more like new long positions are squeezing in.
The abnormal percentile is 82.9%. It ranks #28 in the whole pool by nominal change percentile (#22 for nominal change). The funding rate is still in the recent high percentile.
The buy/sell ratio is 1.03, and the active spread is 1.5%. The bid side has a slight edge, but it’s not really strong. The 24h trading value is 384M; the pool is not small. With OI growth at this pace, compared to this volume level, it’s got something to it.
My take: leveraged longs are slowly building positions. The price hasn’t truly moved yet, but the positioning is already in. This structure is either setting up for a play ahead of time, or it’s the group that later gets counter-punched. With the funding rate at a high percentile and OI stacking up fast, if the price doesn’t continue to follow through, it can easily turn into the squeeze target.
Watch it, don’t rush to chase.
$ONE There’s something interesting here. The price for 15m climbed 15m, up 1.49%, but volume didn’t really pick up—volume at 0.51x paired with a 0.50 wave feels rather sluggish on the surface.
But the OI is secretly increasing. 15m +1.82%, 1h +1.68%. Nominal change in 1h reached 837K, +8.70%. This doesn’t look like it’s being pushed by closing positions—it’s more like new long positions are squeezing in.
The abnormal percentile is 82.9%. It ranks #28 in the whole pool by nominal change percentile (#22 for nominal change). The funding rate is still in the recent high percentile.
The buy/sell ratio is 1.03, and the active spread is 1.5%. The bid side has a slight edge, but it’s not really strong. The 24h trading value is 384M; the pool is not small. With OI growth at this pace, compared to this volume level, it’s got something to it.
My take: leveraged longs are slowly building positions. The price hasn’t truly moved yet, but the positioning is already in. This structure is either setting up for a play ahead of time, or it’s the group that later gets counter-punched. With the funding rate at a high percentile and OI stacking up fast, if the price doesn’t continue to follow through, it can easily turn into the squeeze target.
Watch it, don’t rush to chase.
But the OI is secretly increasing. 15m +1.82%, 1h +1.68%. Nominal change in 1h reached 837K, +8.70%. This doesn’t look like it’s being pushed by closing positions—it’s more like new long positions are squeezing in.
The abnormal percentile is 82.9%. It ranks #28 in the whole pool by nominal change percentile (#22 for nominal change). The funding rate is still in the recent high percentile.
The buy/sell ratio is 1.03, and the active spread is 1.5%. The bid side has a slight edge, but it’s not really strong. The 24h trading value is 384M; the pool is not small. With OI growth at this pace, compared to this volume level, it’s got something to it.
My take: leveraged longs are slowly building positions. The price hasn’t truly moved yet, but the positioning is already in. This structure is either setting up for a play ahead of time, or it’s the group that later gets counter-punched. With the funding rate at a high percentile and OI stacking up fast, if the price doesn’t continue to follow through, it can easily turn into the squeeze target.
Watch it, don’t rush to chase.
6
·
--
$SAGA This move has something to it.
In 15m, it directly surged 2.38%. Volume reached 2.06x, with a Z value of 1.87. It wasn’t the kind of slow, grinding chop—there was volume pushing it up.
The closing price broke above the upper bound of the last ~20 5m candles. This spot happens to sit right on the recent range boundary—basically, it’s like lifting the ceiling off.
The key is the OI. In the 1h contracts, OI rose +1.32%, nominal change 606K. In the 15m timeframe, it also followed with +0.58%. While price was rising, open interest was also climbing—this structure suggests fresh leveraged longs entering, not just a spot “bulldozer.”
The OI abnormal percentile is 86.9%. In the whole pool, the abnormal ranking is #12, nominal change ranks #22. Depth confirmation also checked out: volume is higher than usual, it touched the range boundary, and the funding rate reached a high percentile in the recent period.
Aggressive trade delta is +5.5%, buy/sell ratio 1.12. The buy side has the edge, but it’s not wildly extreme. 24h turnover is 41.78M; the pool isn’t that big. At this level of volume, an OI increase of 600K is quite noticeable.
High funding-rate percentile combined with rapid OI buildup—this pairing is either fuel for a trend to kick off, or a risk being set up for later. The breakout is real; whether to chase or not is another question.
$SAGA This move has something to it.
In 15m, it directly surged 2.38%. Volume reached 2.06x, with a Z value of 1.87. It wasn’t the kind of slow, grinding chop—there was volume pushing it up.
The closing price broke above the upper bound of the last ~20 5m candles. This spot happens to sit right on the recent range boundary—basically, it’s like lifting the ceiling off.
The key is the OI. In the 1h contracts, OI rose +1.32%, nominal change 606K. In the 15m timeframe, it also followed with +0.58%. While price was rising, open interest was also climbing—this structure suggests fresh leveraged longs entering, not just a spot “bulldozer.”
The OI abnormal percentile is 86.9%. In the whole pool, the abnormal ranking is #12, nominal change ranks #22. Depth confirmation also checked out: volume is higher than usual, it touched the range boundary, and the funding rate reached a high percentile in the recent period.
Aggressive trade delta is +5.5%, buy/sell ratio 1.12. The buy side has the edge, but it’s not wildly extreme. 24h turnover is 41.78M; the pool isn’t that big. At this level of volume, an OI increase of 600K is quite noticeable.
High funding-rate percentile combined with rapid OI buildup—this pairing is either fuel for a trend to kick off, or a risk being set up for later. The breakout is real; whether to chase or not is another question.
In 15m, it directly surged 2.38%. Volume reached 2.06x, with a Z value of 1.87. It wasn’t the kind of slow, grinding chop—there was volume pushing it up.
The closing price broke above the upper bound of the last ~20 5m candles. This spot happens to sit right on the recent range boundary—basically, it’s like lifting the ceiling off.
The key is the OI. In the 1h contracts, OI rose +1.32%, nominal change 606K. In the 15m timeframe, it also followed with +0.58%. While price was rising, open interest was also climbing—this structure suggests fresh leveraged longs entering, not just a spot “bulldozer.”
The OI abnormal percentile is 86.9%. In the whole pool, the abnormal ranking is #12, nominal change ranks #22. Depth confirmation also checked out: volume is higher than usual, it touched the range boundary, and the funding rate reached a high percentile in the recent period.
Aggressive trade delta is +5.5%, buy/sell ratio 1.12. The buy side has the edge, but it’s not wildly extreme. 24h turnover is 41.78M; the pool isn’t that big. At this level of volume, an OI increase of 600K is quite noticeable.
High funding-rate percentile combined with rapid OI buildup—this pairing is either fuel for a trend to kick off, or a risk being set up for later. The breakout is real; whether to chase or not is another question.
9

·
--
$INJ This one is a bit interesting. In 15m it got dumped directly, down 2.34%. Volume surged to 6.34x, and the close even fell below the lower bound of the last ~20 5m bars. But the key is not that—OI in the 1h timeframe is still rising. New leverage is flowing in, yet the price is still dropping. This is a classic case of shorts adding positions, not longs panic-closing.
Active trade discrepancy -21.7%, buy/sell ratio 0.64, with sell pressure clearly more aggressive. The anomaly percentile is 96%. It’s ranked #22 across the whole pool, and several consecutive cycles continue—it’s not the kind of one-off spike noise.
My own feeling: this area is close to a historical extreme zone. The short crowding level is rapidly increasing. If this is a false breakdown, the squeeze fuel has already stacked up quite a bit. But if volume continues to expand and OI keeps building, then it’s short-building at a trend level—don’t rush to catch it.
Wait for a 15m stop-fall signal first. Reaching in now makes it easy to get hit.
$INJ This one is a bit interesting. In 15m it got dumped directly, down 2.34%. Volume surged to 6.34x, and the close even fell below the lower bound of the last ~20 5m bars. But the key is not that—OI in the 1h timeframe is still rising. New leverage is flowing in, yet the price is still dropping. This is a classic case of shorts adding positions, not longs panic-closing.
Active trade discrepancy -21.7%, buy/sell ratio 0.64, with sell pressure clearly more aggressive. The anomaly percentile is 96%. It’s ranked #22 across the whole pool, and several consecutive cycles continue—it’s not the kind of one-off spike noise.
My own feeling: this area is close to a historical extreme zone. The short crowding level is rapidly increasing. If this is a false breakdown, the squeeze fuel has already stacked up quite a bit. But if volume continues to expand and OI keeps building, then it’s short-building at a trend level—don’t rush to catch it.
Wait for a 15m stop-fall signal first. Reaching in now makes it easy to get hit.
Active trade discrepancy -21.7%, buy/sell ratio 0.64, with sell pressure clearly more aggressive. The anomaly percentile is 96%. It’s ranked #22 across the whole pool, and several consecutive cycles continue—it’s not the kind of one-off spike noise.
My own feeling: this area is close to a historical extreme zone. The short crowding level is rapidly increasing. If this is a false breakdown, the squeeze fuel has already stacked up quite a bit. But if volume continues to expand and OI keeps building, then it’s short-building at a trend level—don’t rush to catch it.
Wait for a 15m stop-fall signal first. Reaching in now makes it easy to get hit.
5
·
--
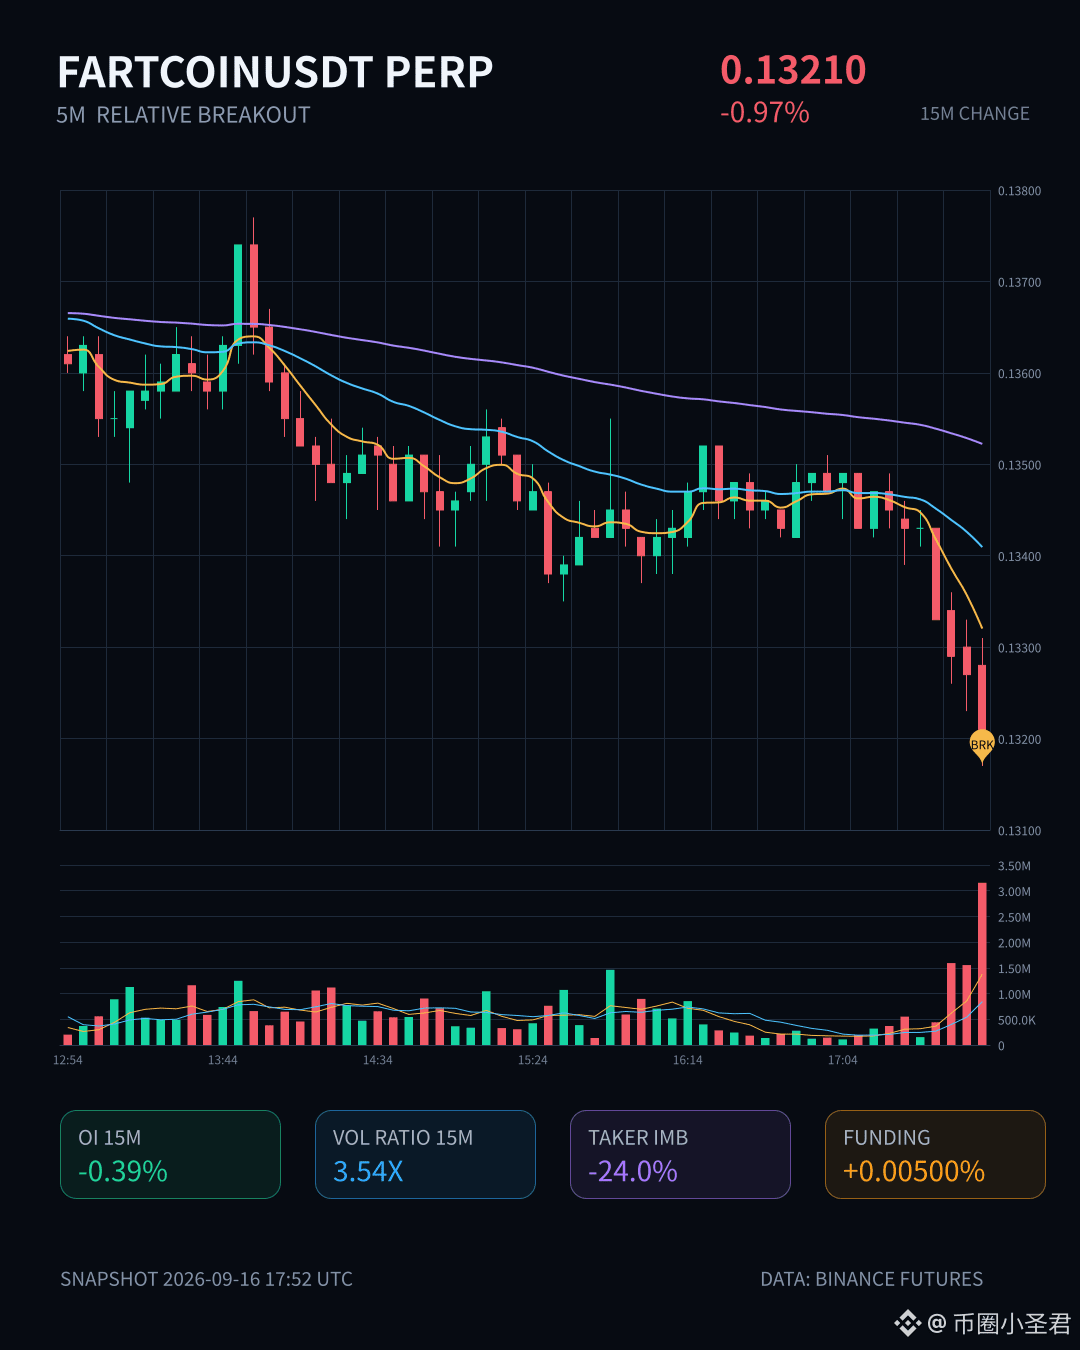
$FARTCOIN This dip isn’t too aggressive, but the structure is pretty interesting.
On the 15m chart, it fell 0.97%; volume immediately surged to 3.54x, the Z-value is 2.16, and the close even dropped below the lower edge of the past ~20 5m candles. Aggressive volume imbalance is -24%, buy/sell ratio is 0.61, sell pressure is in control—this doesn’t look like a fakeout.
The key is OI: 15m is -0.39%, 1h is -0.44%; nominally, nearly 400k U was wiped out. Price is down while OI is also falling—this looks more like longs de-leveraging and getting stopped out, not new shorts entering to smash the price. The OI abnormal percentile is 96.6%, within the whole pool #22. It has been continuing across several consecutive cycles, which suggests this isn’t just noise from a single wick.
Over 24h, trading value is 27.75M—liquidity is sufficient; if the move is really directional, there won’t be “nothing to trade.” Right now, price is not far from the historical extreme range. After a breakdown, if OI keeps shrinking and price can’t reclaim the 5m range, there’s likely more downside. If OI stabilizes and aggressive buying returns, this could be a shakeout “tail end” here.
No rush to jump in—wait for confirmation.
$FARTCOIN This dip isn’t too aggressive, but the structure is pretty interesting.
On the 15m chart, it fell 0.97%; volume immediately surged to 3.54x, the Z-value is 2.16, and the close even dropped below the lower edge of the past ~20 5m candles. Aggressive volume imbalance is -24%, buy/sell ratio is 0.61, sell pressure is in control—this doesn’t look like a fakeout.
The key is OI: 15m is -0.39%, 1h is -0.44%; nominally, nearly 400k U was wiped out. Price is down while OI is also falling—this looks more like longs de-leveraging and getting stopped out, not new shorts entering to smash the price. The OI abnormal percentile is 96.6%, within the whole pool #22. It has been continuing across several consecutive cycles, which suggests this isn’t just noise from a single wick.
Over 24h, trading value is 27.75M—liquidity is sufficient; if the move is really directional, there won’t be “nothing to trade.” Right now, price is not far from the historical extreme range. After a breakdown, if OI keeps shrinking and price can’t reclaim the 5m range, there’s likely more downside. If OI stabilizes and aggressive buying returns, this could be a shakeout “tail end” here.
No rush to jump in—wait for confirmation.
On the 15m chart, it fell 0.97%; volume immediately surged to 3.54x, the Z-value is 2.16, and the close even dropped below the lower edge of the past ~20 5m candles. Aggressive volume imbalance is -24%, buy/sell ratio is 0.61, sell pressure is in control—this doesn’t look like a fakeout.
The key is OI: 15m is -0.39%, 1h is -0.44%; nominally, nearly 400k U was wiped out. Price is down while OI is also falling—this looks more like longs de-leveraging and getting stopped out, not new shorts entering to smash the price. The OI abnormal percentile is 96.6%, within the whole pool #22. It has been continuing across several consecutive cycles, which suggests this isn’t just noise from a single wick.
Over 24h, trading value is 27.75M—liquidity is sufficient; if the move is really directional, there won’t be “nothing to trade.” Right now, price is not far from the historical extreme range. After a breakdown, if OI keeps shrinking and price can’t reclaim the 5m range, there’s likely more downside. If OI stabilizes and aggressive buying returns, this could be a shakeout “tail end” here.
No rush to jump in—wait for confirmation.
7
·
--
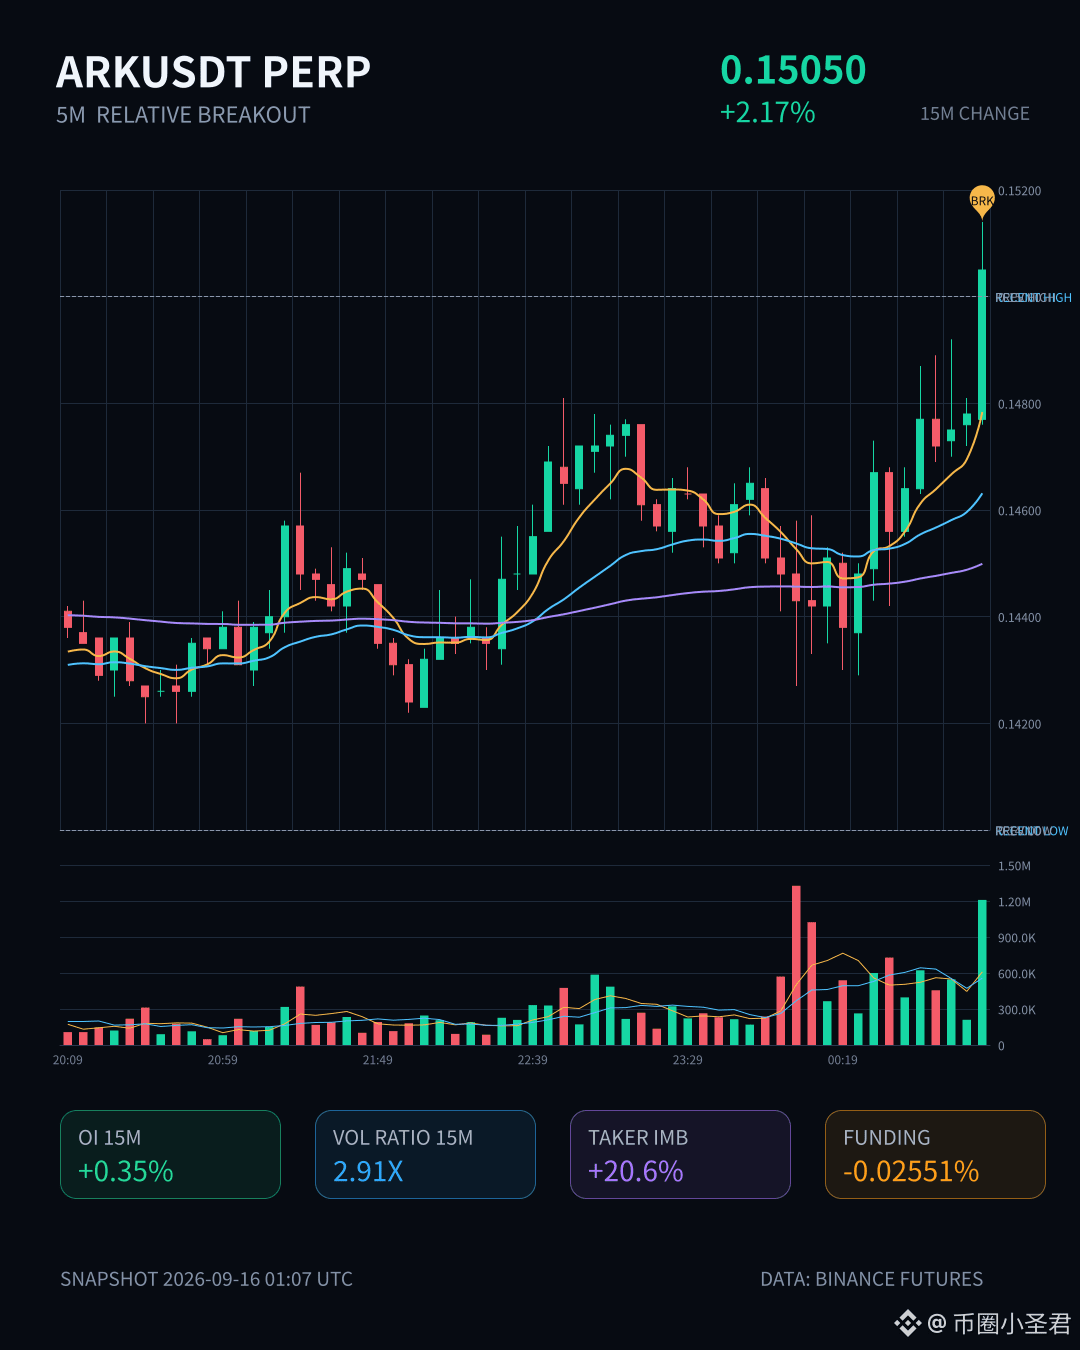
$ARK This move is a bit interesting: in 15m it pulled up 2.17%, and volume directly reached 2.91x. The Z value is 2.76—this isn’t a downward bleed disguised as an “up” move; it’s a breakout with volume above the upper edge of 20 consecutive 5m candles.
More importantly, OI kept pace: 15m +0.35%, 1h +0.65%, nominal +4.97%. This is new leveraged long positioning entering—this isn’t the kind of fake “heat” from short-covering. Active trade delta is 20.6% higher, buy/sell ratio is 1.52, and buy orders are pushing.
The 24h turnover is only 30M, so the pool isn’t that deep. Its anomaly percentile is 79.2%, ranking #22 in the whole pool—but once real money actually comes into a small cap like this, the upside potential is big. Watch whether it can hold this zone’s upper edge. If it can’t, then it’s a false breakout.
$ARK This move is a bit interesting: in 15m it pulled up 2.17%, and volume directly reached 2.91x. The Z value is 2.76—this isn’t a downward bleed disguised as an “up” move; it’s a breakout with volume above the upper edge of 20 consecutive 5m candles.
More importantly, OI kept pace: 15m +0.35%, 1h +0.65%, nominal +4.97%. This is new leveraged long positioning entering—this isn’t the kind of fake “heat” from short-covering. Active trade delta is 20.6% higher, buy/sell ratio is 1.52, and buy orders are pushing.
The 24h turnover is only 30M, so the pool isn’t that deep. Its anomaly percentile is 79.2%, ranking #22 in the whole pool—but once real money actually comes into a small cap like this, the upside potential is big. Watch whether it can hold this zone’s upper edge. If it can’t, then it’s a false breakout.
More importantly, OI kept pace: 15m +0.35%, 1h +0.65%, nominal +4.97%. This is new leveraged long positioning entering—this isn’t the kind of fake “heat” from short-covering. Active trade delta is 20.6% higher, buy/sell ratio is 1.52, and buy orders are pushing.
The 24h turnover is only 30M, so the pool isn’t that deep. Its anomaly percentile is 79.2%, ranking #22 in the whole pool—but once real money actually comes into a small cap like this, the upside potential is big. Watch whether it can hold this zone’s upper edge. If it can’t, then it’s a false breakout.
64
·
--
This move from Hakimi looks a bit ugly.
In the 15m timeframe, it dumped straight down by 2.78%, while volume surged to 2.3x. The Z score hit 2.47—this isn’t normal rotation; it looks like someone is unloading. The closing price broke below the lower band of the last 20 or so 5m candles. Active trading volume was down -41.4%, and the buy/sell ratio was 0.41—sell walls are crushing it.
The key is that OI is falling too. For the 15m contract, OI is -0.10%; for the 1h, it’s -0.12%. Combined nominal changes add up to over 500k U being pulled out. Price is down and OI is down—classic deleveraging rhythm. This isn’t a fresh short entry; it’s longs either cutting losses or getting force-liquidated. The abnormal percentile is 90.1%, with the whole pool ranking at #22. When you see an abnormal that persists across several consecutive cycles, it usually doesn’t end in a single candle.
The 24h trading value is only 7.68M, so the pool isn’t deep. At this scale, withdrawing liquidity like this is enough to punch a dip into the price. Don’t rush in—wait for OI to stabilize first.
This move from Hakimi looks a bit ugly.
In the 15m timeframe, it dumped straight down by 2.78%, while volume surged to 2.3x. The Z score hit 2.47—this isn’t normal rotation; it looks like someone is unloading. The closing price broke below the lower band of the last 20 or so 5m candles. Active trading volume was down -41.4%, and the buy/sell ratio was 0.41—sell walls are crushing it.
The key is that OI is falling too. For the 15m contract, OI is -0.10%; for the 1h, it’s -0.12%. Combined nominal changes add up to over 500k U being pulled out. Price is down and OI is down—classic deleveraging rhythm. This isn’t a fresh short entry; it’s longs either cutting losses or getting force-liquidated. The abnormal percentile is 90.1%, with the whole pool ranking at #22. When you see an abnormal that persists across several consecutive cycles, it usually doesn’t end in a single candle.
The 24h trading value is only 7.68M, so the pool isn’t deep. At this scale, withdrawing liquidity like this is enough to punch a dip into the price. Don’t rush in—wait for OI to stabilize first.
In the 15m timeframe, it dumped straight down by 2.78%, while volume surged to 2.3x. The Z score hit 2.47—this isn’t normal rotation; it looks like someone is unloading. The closing price broke below the lower band of the last 20 or so 5m candles. Active trading volume was down -41.4%, and the buy/sell ratio was 0.41—sell walls are crushing it.
The key is that OI is falling too. For the 15m contract, OI is -0.10%; for the 1h, it’s -0.12%. Combined nominal changes add up to over 500k U being pulled out. Price is down and OI is down—classic deleveraging rhythm. This isn’t a fresh short entry; it’s longs either cutting losses or getting force-liquidated. The abnormal percentile is 90.1%, with the whole pool ranking at #22. When you see an abnormal that persists across several consecutive cycles, it usually doesn’t end in a single candle.
The 24h trading value is only 7.68M, so the pool isn’t deep. At this scale, withdrawing liquidity like this is enough to punch a dip into the price. Don’t rush in—wait for OI to stabilize first.
16
·
--
$ARK shows a bit of unusual movement.
On the 15m chart, it’s up 2.97%, and volume is more than 2x. Price has just broken above the upper bound of the last ~20 5m bars. The OI side is more worth watching: on the 1h, contract open interest is up +8.97%, with notional increasing by 335K, and the 15m is also adding positions in sync. This kind of structure—price rising while OI rises together—is more solid than simply spiking on a volume bar. It looks more like newly added leveraged longs entering rather than shorts being passively forced out.
The abnormal percentile reached 90.9%, ranking #22 across the whole pool; notional change ranks #28. Heat isn’t at the absolute top, but it’s definitely noteworthy. Passive vs active trading difference is +3.7%, with a buy/sell ratio of 1.08, meaning slightly more aggressive buying.
For a small-cap ticker like ARK, if OI pumps quickly by 9% on an hourly timeframe, you should pay attention to what happens next. After breaking above the top of the range, if volume can keep going, then following the move for a stretch is fine. But if OI keeps surging while price just goes sideways, that’s leverage being piled in—watch out for a potential downside sweep. Keep an eye on it first; don’t rush to act.
$ARK shows a bit of unusual movement.
On the 15m chart, it’s up 2.97%, and volume is more than 2x. Price has just broken above the upper bound of the last ~20 5m bars. The OI side is more worth watching: on the 1h, contract open interest is up +8.97%, with notional increasing by 335K, and the 15m is also adding positions in sync. This kind of structure—price rising while OI rises together—is more solid than simply spiking on a volume bar. It looks more like newly added leveraged longs entering rather than shorts being passively forced out.
The abnormal percentile reached 90.9%, ranking #22 across the whole pool; notional change ranks #28. Heat isn’t at the absolute top, but it’s definitely noteworthy. Passive vs active trading difference is +3.7%, with a buy/sell ratio of 1.08, meaning slightly more aggressive buying.
For a small-cap ticker like ARK, if OI pumps quickly by 9% on an hourly timeframe, you should pay attention to what happens next. After breaking above the top of the range, if volume can keep going, then following the move for a stretch is fine. But if OI keeps surging while price just goes sideways, that’s leverage being piled in—watch out for a potential downside sweep. Keep an eye on it first; don’t rush to act.
On the 15m chart, it’s up 2.97%, and volume is more than 2x. Price has just broken above the upper bound of the last ~20 5m bars. The OI side is more worth watching: on the 1h, contract open interest is up +8.97%, with notional increasing by 335K, and the 15m is also adding positions in sync. This kind of structure—price rising while OI rises together—is more solid than simply spiking on a volume bar. It looks more like newly added leveraged longs entering rather than shorts being passively forced out.
The abnormal percentile reached 90.9%, ranking #22 across the whole pool; notional change ranks #28. Heat isn’t at the absolute top, but it’s definitely noteworthy. Passive vs active trading difference is +3.7%, with a buy/sell ratio of 1.08, meaning slightly more aggressive buying.
For a small-cap ticker like ARK, if OI pumps quickly by 9% on an hourly timeframe, you should pay attention to what happens next. After breaking above the top of the range, if volume can keep going, then following the move for a stretch is fine. But if OI keeps surging while price just goes sideways, that’s leverage being piled in—watch out for a potential downside sweep. Keep an eye on it first; don’t rush to act.
48
·
--
$I’m coming in, damn. With this name matching the current market, it’s actually kind of on point.
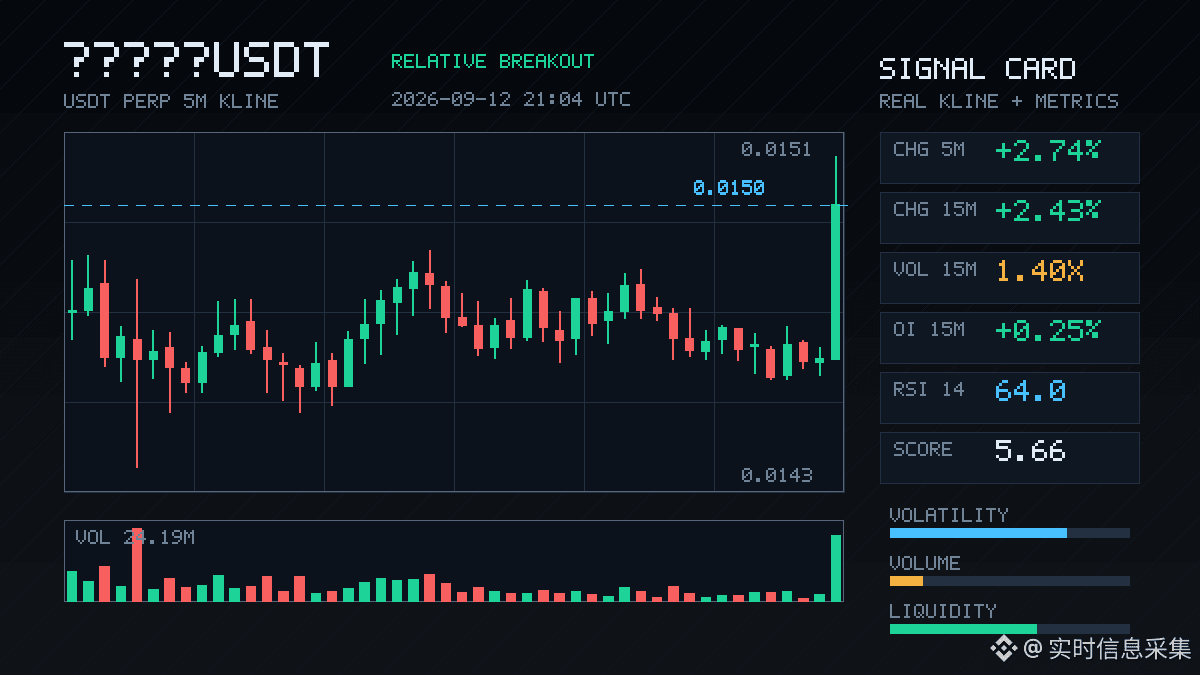
On the 15m chart it jumped straight up by 2.43%, volume was 1.40x, and the Z-score spiked to 2.94—this move isn’t just minor noise. The key is that the closing price broke above the highs of the last 20 five-minute candles, with aggressive volume 23.5% higher, and the buy/sell ratio at 1.62. The bids are genuinely sweeping—not propping the tape with posted orders.
The OI side is even more interesting: the 15m contract +0.25%, nominal +2.72%. The 1h is slightly down by 0.27%, but the nominal is still positive. The abnormal percentile for the whole pool is 81.9%, ranking #14, with nominal change ranking #22. Structurally it leans toward new leveraged long entries, not that “short-covering” kind of fake heat.
Over the last 24h, turnover is 67.44 million U. That’s mid-to-upper for the pool, and depth confirmation has also held.
At 05:04, the Asian session isn’t fully awake yet and liquidity is a bit thin—can this breakout withstand the sell pressure that’s likely to show up in the morning? But at least for now, the intent behind the aggressive buying is very clear.
I’m coming in—don’t miss the move.
$I’m coming in, damn. With this name matching the current market, it’s actually kind of on point.
On the 15m chart it jumped straight up by 2.43%, volume was 1.40x, and the Z-score spiked to 2.94—this move isn’t just minor noise. The key is that the closing price broke above the highs of the last 20 five-minute candles, with aggressive volume 23.5% higher, and the buy/sell ratio at 1.62. The bids are genuinely sweeping—not propping the tape with posted orders.
The OI side is even more interesting: the 15m contract +0.25%, nominal +2.72%. The 1h is slightly down by 0.27%, but the nominal is still positive. The abnormal percentile for the whole pool is 81.9%, ranking #14, with nominal change ranking #22. Structurally it leans toward new leveraged long entries, not that “short-covering” kind of fake heat.
Over the last 24h, turnover is 67.44 million U. That’s mid-to-upper for the pool, and depth confirmation has also held.
At 05:04, the Asian session isn’t fully awake yet and liquidity is a bit thin—can this breakout withstand the sell pressure that’s likely to show up in the morning? But at least for now, the intent behind the aggressive buying is very clear.
I’m coming in—don’t miss the move.
On the 15m chart it jumped straight up by 2.43%, volume was 1.40x, and the Z-score spiked to 2.94—this move isn’t just minor noise. The key is that the closing price broke above the highs of the last 20 five-minute candles, with aggressive volume 23.5% higher, and the buy/sell ratio at 1.62. The bids are genuinely sweeping—not propping the tape with posted orders.
The OI side is even more interesting: the 15m contract +0.25%, nominal +2.72%. The 1h is slightly down by 0.27%, but the nominal is still positive. The abnormal percentile for the whole pool is 81.9%, ranking #14, with nominal change ranking #22. Structurally it leans toward new leveraged long entries, not that “short-covering” kind of fake heat.
Over the last 24h, turnover is 67.44 million U. That’s mid-to-upper for the pool, and depth confirmation has also held.
At 05:04, the Asian session isn’t fully awake yet and liquidity is a bit thin—can this breakout withstand the sell pressure that’s likely to show up in the morning? But at least for now, the intent behind the aggressive buying is very clear.
I’m coming in—don’t miss the move.
14
·
--
$VTHO Today at the 15m level, there’s a bit of something. The price has pushed up by more than 3 points; volume is up to 1.59x, and the Z-value is almost 2. It directly breaks through the upper edge of nearly 20 of the 5m bars.
The key is the OI side: the 15m contracts are up +1.37%, and the notional change is +4.59%, but the 1h is still decreasing. This structure doesn’t look like the typical old positioning unwinds/re-filling of empty space; it’s more like short-term new leverage longs pushing it. The abnormal percentile is 88.7%, the whole pool is ranked #11, and the notional change is ranked #22. It’s not the very front of the list, but when you confirm the depth, the traded volume is above normal.
The aggressive buy order ratio is 1.11, down 5.3% versus the comparison—bullish but not extreme. At this spot, what to watch is: can the OI increase from this 15m push hold up, or is it another round of rallying to provide liquidity? Either way, the upper edge on the 5m just got broken—don’t rush; let the bullets fly for a bit.
$VTHO Today at the 15m level, there’s a bit of something. The price has pushed up by more than 3 points; volume is up to 1.59x, and the Z-value is almost 2. It directly breaks through the upper edge of nearly 20 of the 5m bars.
The key is the OI side: the 15m contracts are up +1.37%, and the notional change is +4.59%, but the 1h is still decreasing. This structure doesn’t look like the typical old positioning unwinds/re-filling of empty space; it’s more like short-term new leverage longs pushing it. The abnormal percentile is 88.7%, the whole pool is ranked #11, and the notional change is ranked #22. It’s not the very front of the list, but when you confirm the depth, the traded volume is above normal.
The aggressive buy order ratio is 1.11, down 5.3% versus the comparison—bullish but not extreme. At this spot, what to watch is: can the OI increase from this 15m push hold up, or is it another round of rallying to provide liquidity? Either way, the upper edge on the 5m just got broken—don’t rush; let the bullets fly for a bit.
The key is the OI side: the 15m contracts are up +1.37%, and the notional change is +4.59%, but the 1h is still decreasing. This structure doesn’t look like the typical old positioning unwinds/re-filling of empty space; it’s more like short-term new leverage longs pushing it. The abnormal percentile is 88.7%, the whole pool is ranked #11, and the notional change is ranked #22. It’s not the very front of the list, but when you confirm the depth, the traded volume is above normal.
The aggressive buy order ratio is 1.11, down 5.3% versus the comparison—bullish but not extreme. At this spot, what to watch is: can the OI increase from this 15m push hold up, or is it another round of rallying to provide liquidity? Either way, the upper edge on the 5m just got broken—don’t rush; let the bullets fly for a bit.
3
·
--
$BEAT This move has something.
On the 15m timeframe, it rallied 3.84%, and the volume directly hit 2.21x. OI on 15m +0.87%, on 1h +1.61%—price is rising and open interest is rising with it. This is a classic leveraged long position entering the market, not that kind of short-covering fueled by “hot air.”
The anomaly percentile is 99.4%, ranking #2 across the whole pool, with nominal change #22. It’s been continuing across several consecutive cycles, and the close even broke above the upper edge of the last ~20 5m bars. Depth also confirms it—the volume is being absorbed and held.
Buy/sell ratio is 1.01, with active trades off by 0.6%. The order book is actually fairly balanced; it’s not that crazy one-sided frenzy. But a 24h turnover of 33.68M at this level, plus it being close to a historical extreme range, is definitely worth a second look.
I’m not saying to rush in right now—just that this structure—OI and price moving up in sync—is more interesting than simply pumping a single green candle. Next, we’ll see whether it can hold the top of this range. If it can, there’s still a story to play out.
$BEAT This move has something.
On the 15m timeframe, it rallied 3.84%, and the volume directly hit 2.21x. OI on 15m +0.87%, on 1h +1.61%—price is rising and open interest is rising with it. This is a classic leveraged long position entering the market, not that kind of short-covering fueled by “hot air.”
The anomaly percentile is 99.4%, ranking #2 across the whole pool, with nominal change #22. It’s been continuing across several consecutive cycles, and the close even broke above the upper edge of the last ~20 5m bars. Depth also confirms it—the volume is being absorbed and held.
Buy/sell ratio is 1.01, with active trades off by 0.6%. The order book is actually fairly balanced; it’s not that crazy one-sided frenzy. But a 24h turnover of 33.68M at this level, plus it being close to a historical extreme range, is definitely worth a second look.
I’m not saying to rush in right now—just that this structure—OI and price moving up in sync—is more interesting than simply pumping a single green candle. Next, we’ll see whether it can hold the top of this range. If it can, there’s still a story to play out.
On the 15m timeframe, it rallied 3.84%, and the volume directly hit 2.21x. OI on 15m +0.87%, on 1h +1.61%—price is rising and open interest is rising with it. This is a classic leveraged long position entering the market, not that kind of short-covering fueled by “hot air.”
The anomaly percentile is 99.4%, ranking #2 across the whole pool, with nominal change #22. It’s been continuing across several consecutive cycles, and the close even broke above the upper edge of the last ~20 5m bars. Depth also confirms it—the volume is being absorbed and held.
Buy/sell ratio is 1.01, with active trades off by 0.6%. The order book is actually fairly balanced; it’s not that crazy one-sided frenzy. But a 24h turnover of 33.68M at this level, plus it being close to a historical extreme range, is definitely worth a second look.
I’m not saying to rush in right now—just that this structure—OI and price moving up in sync—is more interesting than simply pumping a single green candle. Next, we’ll see whether it can hold the top of this range. If it can, there’s still a story to play out.

31
·
--
ASTER This 15m move is kind of interesting.
The price dropped 0.74%, yet volume surged to 7.18x, and the close broke below the lower band of the past 20+ 5m candles. On the surface it looks like a breakdown, but the OI (open interest) is still rising. This shows a pattern of price falling while OI increases—more like new leveraged short positions being added to push it down, not just long liquidations.
Active trade imbalance is -6.8%, buy/sell ratio is 0.87, and sell-side pressure is there. However, the nominal change is negative: a bit over -300k U, and within 1h it's only about -390k U. The absolute volume isn’t that big. The abnormal percentile is 67.5%, ranking #29 in the whole pool and #22 nominally—front-runner, but not the most extreme tier.
With this kind of structure, I generally wouldn’t rush to chase shorts. Even though volume is expanding and there’s a breakdown, the OI increase isn’t aggressive enough—more like short-term leverage is probing. To really confirm, you need to see whether there will be continued active sell orders hammering it next. In the last 24h there’s $59.72m U in traded value; the pool is deep, so don’t get fooled into thinking a single 15m candle tells the whole story.
ASTER This 15m move is kind of interesting.
The price dropped 0.74%, yet volume surged to 7.18x, and the close broke below the lower band of the past 20+ 5m candles. On the surface it looks like a breakdown, but the OI (open interest) is still rising. This shows a pattern of price falling while OI increases—more like new leveraged short positions being added to push it down, not just long liquidations.
Active trade imbalance is -6.8%, buy/sell ratio is 0.87, and sell-side pressure is there. However, the nominal change is negative: a bit over -300k U, and within 1h it's only about -390k U. The absolute volume isn’t that big. The abnormal percentile is 67.5%, ranking #29 in the whole pool and #22 nominally—front-runner, but not the most extreme tier.
With this kind of structure, I generally wouldn’t rush to chase shorts. Even though volume is expanding and there’s a breakdown, the OI increase isn’t aggressive enough—more like short-term leverage is probing. To really confirm, you need to see whether there will be continued active sell orders hammering it next. In the last 24h there’s $59.72m U in traded value; the pool is deep, so don’t get fooled into thinking a single 15m candle tells the whole story.
The price dropped 0.74%, yet volume surged to 7.18x, and the close broke below the lower band of the past 20+ 5m candles. On the surface it looks like a breakdown, but the OI (open interest) is still rising. This shows a pattern of price falling while OI increases—more like new leveraged short positions being added to push it down, not just long liquidations.
Active trade imbalance is -6.8%, buy/sell ratio is 0.87, and sell-side pressure is there. However, the nominal change is negative: a bit over -300k U, and within 1h it's only about -390k U. The absolute volume isn’t that big. The abnormal percentile is 67.5%, ranking #29 in the whole pool and #22 nominally—front-runner, but not the most extreme tier.
With this kind of structure, I generally wouldn’t rush to chase shorts. Even though volume is expanding and there’s a breakdown, the OI increase isn’t aggressive enough—more like short-term leverage is probing. To really confirm, you need to see whether there will be continued active sell orders hammering it next. In the last 24h there’s $59.72m U in traded value; the pool is deep, so don’t get fooled into thinking a single 15m candle tells the whole story.
11
Log in to explore more content
Join global crypto users on Binance Square
⚡️ Get latest and useful information about crypto.
💬 Trusted by the world’s largest crypto exchange.
👍 Discover real insights from verified creators.
Email / Phone number
Trending Topics
1
#NEARRisesNearly80%InAWeek
7,961 views
498 Discussing
2
#MultiversXPlansHardForkRecovery
9,137 views
417 Discussing
3
#CircleLaunchesInstitutionalBTCBackedBorrowing
11,248 views
556 Discussing
4
#BitcoinHits$85K
14,852 views
237 Discussing
5
#ZetaChainVotesToMigrateZETAToSolana
9,766 views
340 Discussing
6
#ECBStartsBlockchainEuroSettlement
24,543 views
635 Discussing
7
#SouthAfricaProposesCryptoExchangeControls
36,415 views
817 Discussing
8
#SolanaCutsTargetSlotTimeTo250ms
39,074 views
729 Discussing
9
#EthereumSurpasses$2700
24,638 views
223 Discussing
10
#CanaryFilesSecondAmendmentForStakedSEIETF
54,223 views
1,065 Discussing