
#28
28
17,582 views
124 Discussing
Hot
Latest

·
--
$RAYSOL This drop is a bit interesting.
The price broke below the lower edge of the most recent 20 5m ranges, and the 15m volume directly surged to 2.91×. Z value is 1.78, with increased volume breaking through. The aggressive trade imbalance is -23.3%, the buy/sell ratio is 0.62, and sell pressure is clearly real.
But the key is to look at OI—15m is -1.54%, 1h is -0.31%, and the nominal change is also contracting. This doesn’t look like new shorts coming in to smash the market; it looks more like longs de-leveraging, where stops get hit—an “easy-to-break” kind of drop.
The OI anomaly percentile is 95.8%, the whole-pool anomaly is #11, and the nominal change is #28. Near extreme ranges, when this kind of structure appears, it usually means positions are being cleared quickly. The question is whether there’s follow-up support after the clearing.
In the last 24h, trading value is 25.44M; order book depth is okay, but right now the aggressive directional bias is overwhelmingly bearish. Wait for the OI to stabilize before reassessing—right now, catching the falling knife is not very attractive on risk-reward.
$RAYSOL This drop is a bit interesting.
The price broke below the lower edge of the most recent 20 5m ranges, and the 15m volume directly surged to 2.91×. Z value is 1.78, with increased volume breaking through. The aggressive trade imbalance is -23.3%, the buy/sell ratio is 0.62, and sell pressure is clearly real.
But the key is to look at OI—15m is -1.54%, 1h is -0.31%, and the nominal change is also contracting. This doesn’t look like new shorts coming in to smash the market; it looks more like longs de-leveraging, where stops get hit—an “easy-to-break” kind of drop.
The OI anomaly percentile is 95.8%, the whole-pool anomaly is #11, and the nominal change is #28. Near extreme ranges, when this kind of structure appears, it usually means positions are being cleared quickly. The question is whether there’s follow-up support after the clearing.
In the last 24h, trading value is 25.44M; order book depth is okay, but right now the aggressive directional bias is overwhelmingly bearish. Wait for the OI to stabilize before reassessing—right now, catching the falling knife is not very attractive on risk-reward.
The price broke below the lower edge of the most recent 20 5m ranges, and the 15m volume directly surged to 2.91×. Z value is 1.78, with increased volume breaking through. The aggressive trade imbalance is -23.3%, the buy/sell ratio is 0.62, and sell pressure is clearly real.
But the key is to look at OI—15m is -1.54%, 1h is -0.31%, and the nominal change is also contracting. This doesn’t look like new shorts coming in to smash the market; it looks more like longs de-leveraging, where stops get hit—an “easy-to-break” kind of drop.
The OI anomaly percentile is 95.8%, the whole-pool anomaly is #11, and the nominal change is #28. Near extreme ranges, when this kind of structure appears, it usually means positions are being cleared quickly. The question is whether there’s follow-up support after the clearing.
In the last 24h, trading value is 25.44M; order book depth is okay, but right now the aggressive directional bias is overwhelmingly bearish. Wait for the OI to stabilize before reassessing—right now, catching the falling knife is not very attractive on risk-reward.
4

·
--
$CELR 15m directly surged 5%. Volume-to-liquidity is 1.81x, and the Z-score is 3.6—this isn’t playing around.
What’s interesting is the OI: on 15m it’s +1.23%, on 1h it’s +3.5%, nominal change +12%. There are clear signs of new leveraged long positions coming in—this isn’t an air-pump.
The closing price just broke above the upper band of the latest ~20 5m candles. Active trade delta is +6.1%, buy/sell ratio is 1.13—buyers are pushing. In the abnormal pool ranking, it’s #28; nominal change rank #34. 24h trading volume is 330 million U—this depth is enough. It doesn’t feel like some small coin spikes and then gets dumped.
Funding rate is also at a relatively high percentile recently. Still—watch out. Don’t chase the top. I like this kind of structure, but I won’t chase; I’ll wait for a pullback and see how well it holds. $CELR
$CELR 15m directly surged 5%. Volume-to-liquidity is 1.81x, and the Z-score is 3.6—this isn’t playing around.
What’s interesting is the OI: on 15m it’s +1.23%, on 1h it’s +3.5%, nominal change +12%. There are clear signs of new leveraged long positions coming in—this isn’t an air-pump.
The closing price just broke above the upper band of the latest ~20 5m candles. Active trade delta is +6.1%, buy/sell ratio is 1.13—buyers are pushing. In the abnormal pool ranking, it’s #28; nominal change rank #34. 24h trading volume is 330 million U—this depth is enough. It doesn’t feel like some small coin spikes and then gets dumped.
Funding rate is also at a relatively high percentile recently. Still—watch out. Don’t chase the top. I like this kind of structure, but I won’t chase; I’ll wait for a pullback and see how well it holds. $CELR
What’s interesting is the OI: on 15m it’s +1.23%, on 1h it’s +3.5%, nominal change +12%. There are clear signs of new leveraged long positions coming in—this isn’t an air-pump.
The closing price just broke above the upper band of the latest ~20 5m candles. Active trade delta is +6.1%, buy/sell ratio is 1.13—buyers are pushing. In the abnormal pool ranking, it’s #28; nominal change rank #34. 24h trading volume is 330 million U—this depth is enough. It doesn’t feel like some small coin spikes and then gets dumped.
Funding rate is also at a relatively high percentile recently. Still—watch out. Don’t chase the top. I like this kind of structure, but I won’t chase; I’ll wait for a pullback and see how well it holds. $CELR
5

·
--
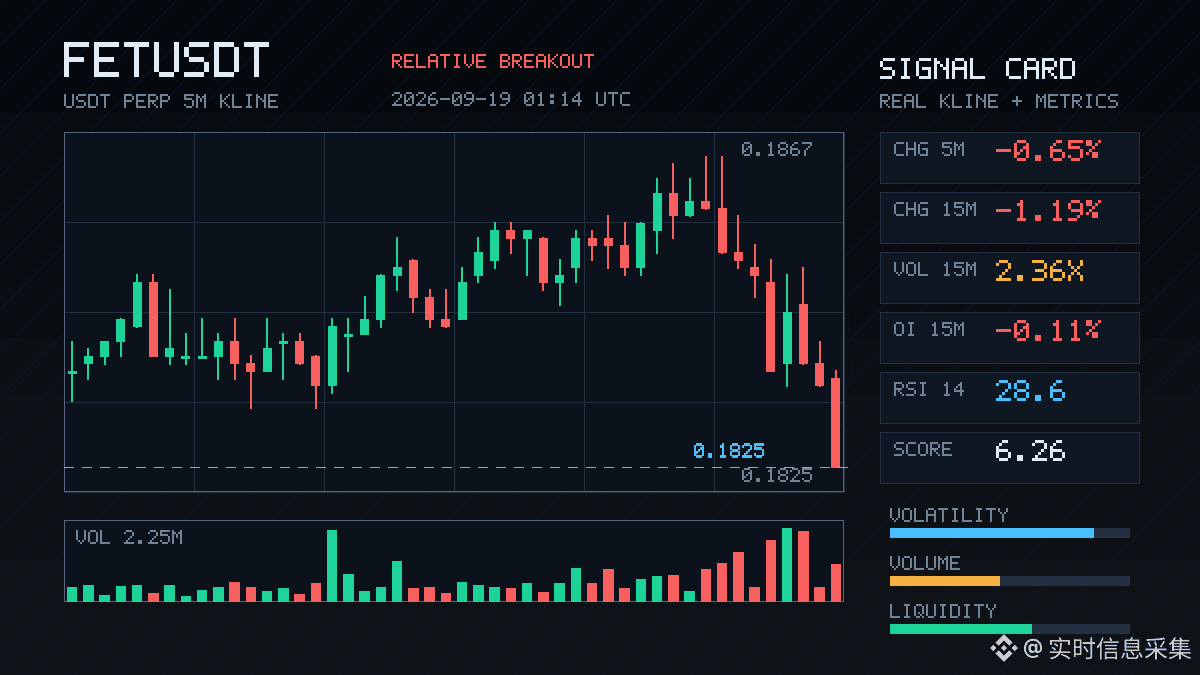
$FET This 15m timeframe is a bit interesting.
The price fell by 1.19%, yet the volume surged straight to 2.36x. The volatility indicator (Z) hit 3.39—this isn’t a normal dip; it looks like someone was concentrating distribution, or passive stop-losses were swept.
The close broke below the lower edge of the recent 20 five-minute range. Active trading value dropped by -13.2%, the buy-sell ratio is 0.77, and the sell pressure is absolutely real.
But the key is the OI (open interest): 15m -0.11%, 1h -0.80%. Notional decreased by 680k U. Price down while OI down—that’s typical deleveraging by longs, not new shorts entering to smash the market.
In plain terms, existing leveraged positions are being cleared, not someone actively building a new short.
The OI abnormal percentile is 93.5%, in the full pool #15, with notional change #28. This position alone already suggests FET’s position structure has reached a fairly extreme level.
When things are like this, be especially careful about two possible paths: either deleveraging ends and price quickly snaps back, or this is just the appetizer for a larger, higher-timeframe selloff.
In the past 24h, turnover is 59M. The pool isn’t big, and with limited liquidity depth, a volume amplification like this is definitely worth watching closely. I’ll hold off for now—I'll wait until the OI stabilizes before looking again.
$FET This 15m timeframe is a bit interesting.
The price fell by 1.19%, yet the volume surged straight to 2.36x. The volatility indicator (Z) hit 3.39—this isn’t a normal dip; it looks like someone was concentrating distribution, or passive stop-losses were swept.
The close broke below the lower edge of the recent 20 five-minute range. Active trading value dropped by -13.2%, the buy-sell ratio is 0.77, and the sell pressure is absolutely real.
But the key is the OI (open interest): 15m -0.11%, 1h -0.80%. Notional decreased by 680k U. Price down while OI down—that’s typical deleveraging by longs, not new shorts entering to smash the market.
In plain terms, existing leveraged positions are being cleared, not someone actively building a new short.
The OI abnormal percentile is 93.5%, in the full pool #15, with notional change #28. This position alone already suggests FET’s position structure has reached a fairly extreme level.
When things are like this, be especially careful about two possible paths: either deleveraging ends and price quickly snaps back, or this is just the appetizer for a larger, higher-timeframe selloff.
In the past 24h, turnover is 59M. The pool isn’t big, and with limited liquidity depth, a volume amplification like this is definitely worth watching closely. I’ll hold off for now—I'll wait until the OI stabilizes before looking again.
The price fell by 1.19%, yet the volume surged straight to 2.36x. The volatility indicator (Z) hit 3.39—this isn’t a normal dip; it looks like someone was concentrating distribution, or passive stop-losses were swept.
The close broke below the lower edge of the recent 20 five-minute range. Active trading value dropped by -13.2%, the buy-sell ratio is 0.77, and the sell pressure is absolutely real.
But the key is the OI (open interest): 15m -0.11%, 1h -0.80%. Notional decreased by 680k U. Price down while OI down—that’s typical deleveraging by longs, not new shorts entering to smash the market.
In plain terms, existing leveraged positions are being cleared, not someone actively building a new short.
The OI abnormal percentile is 93.5%, in the full pool #15, with notional change #28. This position alone already suggests FET’s position structure has reached a fairly extreme level.
When things are like this, be especially careful about two possible paths: either deleveraging ends and price quickly snaps back, or this is just the appetizer for a larger, higher-timeframe selloff.
In the past 24h, turnover is 59M. The pool isn’t big, and with limited liquidity depth, a volume amplification like this is definitely worth watching closely. I’ll hold off for now—I'll wait until the OI stabilizes before looking again.
82
·
--
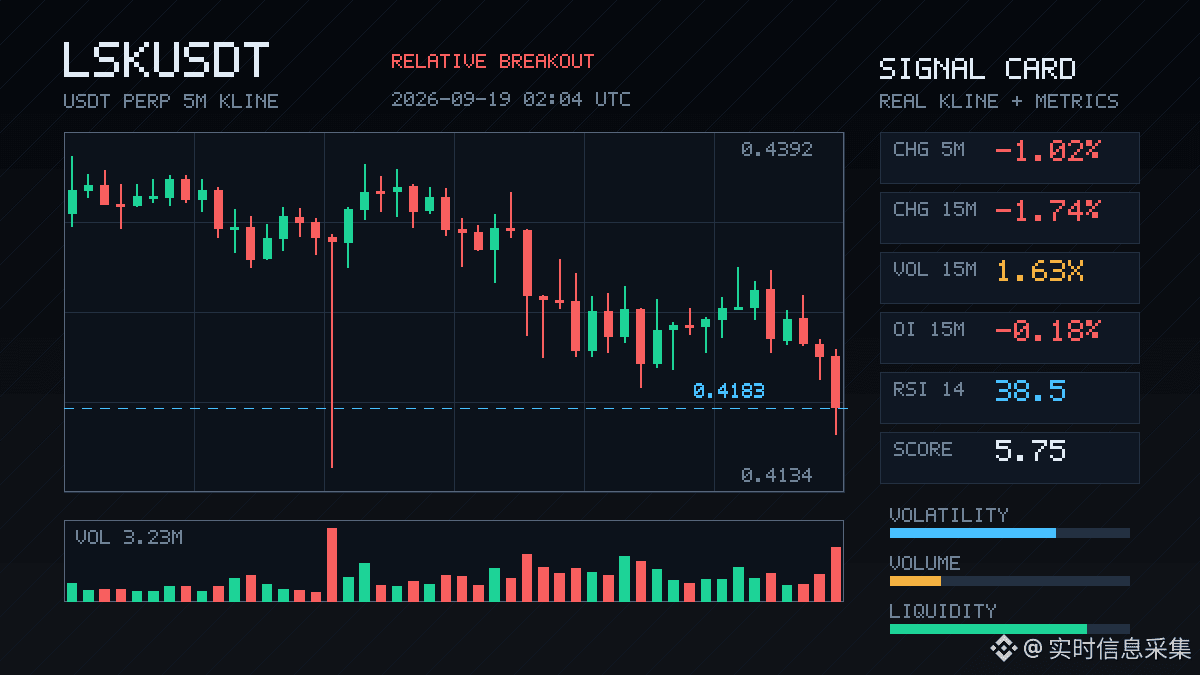
The 15-minute drop in stock $LSK was quite decisive. While the -1.74% drop isn't large, the volume of 1.63 times the base and the volatility Z of 2.75, coupled with the closing price breaking below the lower edge of nearly 20 5-minute trading ranges, indicate a genuine breakdown in the short-term structure.
More interestingly, the OI (On-the-Spot Index) shows a 15-minute -0.18% change, while the 1-hour chart shows a +0.59% change, with both nominal changes being negative. This isn't the typical short-selling strategy; it resembles a long position deleveraging, with strong signs of stop-loss orders and passive position reduction. The active trading volume difference is -14.4%, and the buy-sell ratio is 0.75, indicating a clear bias towards selling pressure.
The stock is at the 84.1% abnormal percentile, ranking as anomaly#28and nominal change #25. While not among the most explosive, it's still worth watching. The 24-hour trading volume is still 287.70 million, indicating decent liquidity. If the price continues to fall, the question is where the support will be.
My current view is: this isn't panic selling, it's a contraction of positions. Let's see when this deleveraging stops before rushing to buy. Wait for the selling pressure to subside.
The 15-minute drop in stock $LSK was quite decisive. While the -1.74% drop isn't large, the volume of 1.63 times the base and the volatility Z of 2.75, coupled with the closing price breaking below the lower edge of nearly 20 5-minute trading ranges, indicate a genuine breakdown in the short-term structure.
More interestingly, the OI (On-the-Spot Index) shows a 15-minute -0.18% change, while the 1-hour chart shows a +0.59% change, with both nominal changes being negative. This isn't the typical short-selling strategy; it resembles a long position deleveraging, with strong signs of stop-loss orders and passive position reduction. The active trading volume difference is -14.4%, and the buy-sell ratio is 0.75, indicating a clear bias towards selling pressure.
The stock is at the 84.1% abnormal percentile, ranking as anomaly#28and nominal change #25. While not among the most explosive, it's still worth watching. The 24-hour trading volume is still 287.70 million, indicating decent liquidity. If the price continues to fall, the question is where the support will be.
My current view is: this isn't panic selling, it's a contraction of positions. Let's see when this deleveraging stops before rushing to buy. Wait for the selling pressure to subside.
More interestingly, the OI (On-the-Spot Index) shows a 15-minute -0.18% change, while the 1-hour chart shows a +0.59% change, with both nominal changes being negative. This isn't the typical short-selling strategy; it resembles a long position deleveraging, with strong signs of stop-loss orders and passive position reduction. The active trading volume difference is -14.4%, and the buy-sell ratio is 0.75, indicating a clear bias towards selling pressure.
The stock is at the 84.1% abnormal percentile, ranking as anomaly#28and nominal change #25. While not among the most explosive, it's still worth watching. The 24-hour trading volume is still 287.70 million, indicating decent liquidity. If the price continues to fall, the question is where the support will be.
My current view is: this isn't panic selling, it's a contraction of positions. Let's see when this deleveraging stops before rushing to buy. Wait for the selling pressure to subside.
265
·
--
$WLD This drop isn't that vicious, but the structure is quite interesting—prices are getting hammered downward, and OI is falling along with it. This doesn't look like fresh short entries in a drive-by selloff; it’s more like longs can’t hold on themselves first, and then stop-losses trigger stop-losses, rolling all the way down.
On the 15m timeframe, active trade volume is down -21% and the buy-sell ratio is 0.65, with sell pressure continuously outputting on spot. However, the trading volume is still at about 1.8x the usual level, suggesting that people are genuinely making moves at this level—not a low-volume, drift lower kind of tape. Price has already broken through the lower edge of the last ~20 5m candles, grinding along the boundary of the range.
Looking at a larger cycle, on the 1h timeframe OI fell 1.31%, nominal -3M+; the deleveraging/position-reduction pace is still ongoing. The extreme percentile is 95.6%, with the whole pool ranking at #28—meaning the entire market gets swept once over; the extremity of this level is already on the front end. In other words, WLD is currently operating near its own historical extreme zone as part of this de-leveraging move.
Longs got shaken out, but price didn't accelerate into a collapse. Here are two interpretations: either the last wave of forced liquidation is almost over, or this is just a relay—there’s deeper washing still to come. Which one is more likely depends on whether the next few 5m candles can pull the price back to close the range lower edge. If it can’t be reclaimed, don’t rush.
$WLD This drop isn't that vicious, but the structure is quite interesting—prices are getting hammered downward, and OI is falling along with it. This doesn't look like fresh short entries in a drive-by selloff; it’s more like longs can’t hold on themselves first, and then stop-losses trigger stop-losses, rolling all the way down.
On the 15m timeframe, active trade volume is down -21% and the buy-sell ratio is 0.65, with sell pressure continuously outputting on spot. However, the trading volume is still at about 1.8x the usual level, suggesting that people are genuinely making moves at this level—not a low-volume, drift lower kind of tape. Price has already broken through the lower edge of the last ~20 5m candles, grinding along the boundary of the range.
Looking at a larger cycle, on the 1h timeframe OI fell 1.31%, nominal -3M+; the deleveraging/position-reduction pace is still ongoing. The extreme percentile is 95.6%, with the whole pool ranking at #28—meaning the entire market gets swept once over; the extremity of this level is already on the front end. In other words, WLD is currently operating near its own historical extreme zone as part of this de-leveraging move.
Longs got shaken out, but price didn't accelerate into a collapse. Here are two interpretations: either the last wave of forced liquidation is almost over, or this is just a relay—there’s deeper washing still to come. Which one is more likely depends on whether the next few 5m candles can pull the price back to close the range lower edge. If it can’t be reclaimed, don’t rush.
On the 15m timeframe, active trade volume is down -21% and the buy-sell ratio is 0.65, with sell pressure continuously outputting on spot. However, the trading volume is still at about 1.8x the usual level, suggesting that people are genuinely making moves at this level—not a low-volume, drift lower kind of tape. Price has already broken through the lower edge of the last ~20 5m candles, grinding along the boundary of the range.
Looking at a larger cycle, on the 1h timeframe OI fell 1.31%, nominal -3M+; the deleveraging/position-reduction pace is still ongoing. The extreme percentile is 95.6%, with the whole pool ranking at #28—meaning the entire market gets swept once over; the extremity of this level is already on the front end. In other words, WLD is currently operating near its own historical extreme zone as part of this de-leveraging move.
Longs got shaken out, but price didn't accelerate into a collapse. Here are two interpretations: either the last wave of forced liquidation is almost over, or this is just a relay—there’s deeper washing still to come. Which one is more likely depends on whether the next few 5m candles can pull the price back to close the range lower edge. If it can’t be reclaimed, don’t rush.
12

·
--
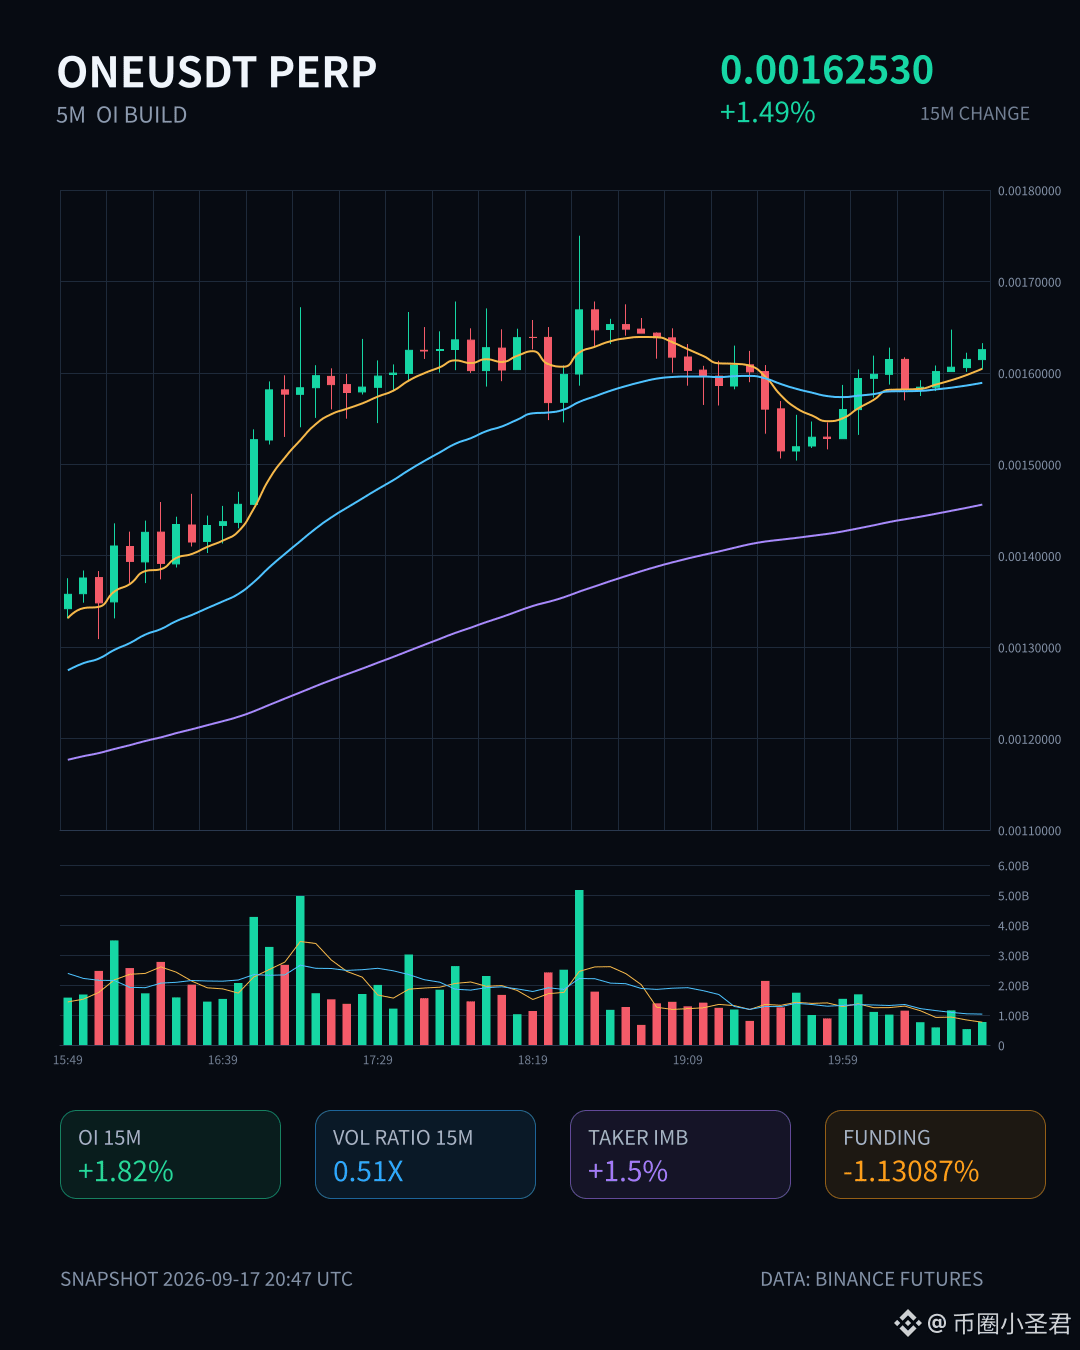
$ONE There’s something interesting here. The price for 15m climbed 15m, up 1.49%, but volume didn’t really pick up—volume at 0.51x paired with a 0.50 wave feels rather sluggish on the surface.
But the OI is secretly increasing. 15m +1.82%, 1h +1.68%. Nominal change in 1h reached 837K, +8.70%. This doesn’t look like it’s being pushed by closing positions—it’s more like new long positions are squeezing in.
The abnormal percentile is 82.9%. It ranks #28 in the whole pool by nominal change percentile (#22 for nominal change). The funding rate is still in the recent high percentile.
The buy/sell ratio is 1.03, and the active spread is 1.5%. The bid side has a slight edge, but it’s not really strong. The 24h trading value is 384M; the pool is not small. With OI growth at this pace, compared to this volume level, it’s got something to it.
My take: leveraged longs are slowly building positions. The price hasn’t truly moved yet, but the positioning is already in. This structure is either setting up for a play ahead of time, or it’s the group that later gets counter-punched. With the funding rate at a high percentile and OI stacking up fast, if the price doesn’t continue to follow through, it can easily turn into the squeeze target.
Watch it, don’t rush to chase.
$ONE There’s something interesting here. The price for 15m climbed 15m, up 1.49%, but volume didn’t really pick up—volume at 0.51x paired with a 0.50 wave feels rather sluggish on the surface.
But the OI is secretly increasing. 15m +1.82%, 1h +1.68%. Nominal change in 1h reached 837K, +8.70%. This doesn’t look like it’s being pushed by closing positions—it’s more like new long positions are squeezing in.
The abnormal percentile is 82.9%. It ranks #28 in the whole pool by nominal change percentile (#22 for nominal change). The funding rate is still in the recent high percentile.
The buy/sell ratio is 1.03, and the active spread is 1.5%. The bid side has a slight edge, but it’s not really strong. The 24h trading value is 384M; the pool is not small. With OI growth at this pace, compared to this volume level, it’s got something to it.
My take: leveraged longs are slowly building positions. The price hasn’t truly moved yet, but the positioning is already in. This structure is either setting up for a play ahead of time, or it’s the group that later gets counter-punched. With the funding rate at a high percentile and OI stacking up fast, if the price doesn’t continue to follow through, it can easily turn into the squeeze target.
Watch it, don’t rush to chase.
But the OI is secretly increasing. 15m +1.82%, 1h +1.68%. Nominal change in 1h reached 837K, +8.70%. This doesn’t look like it’s being pushed by closing positions—it’s more like new long positions are squeezing in.
The abnormal percentile is 82.9%. It ranks #28 in the whole pool by nominal change percentile (#22 for nominal change). The funding rate is still in the recent high percentile.
The buy/sell ratio is 1.03, and the active spread is 1.5%. The bid side has a slight edge, but it’s not really strong. The 24h trading value is 384M; the pool is not small. With OI growth at this pace, compared to this volume level, it’s got something to it.
My take: leveraged longs are slowly building positions. The price hasn’t truly moved yet, but the positioning is already in. This structure is either setting up for a play ahead of time, or it’s the group that later gets counter-punched. With the funding rate at a high percentile and OI stacking up fast, if the price doesn’t continue to follow through, it can easily turn into the squeeze target.
Watch it, don’t rush to chase.
8

·
--
** " Why I Still Say Not to 'Buy' at 76,871$ but to 'Sell'"NEAR Protocol (NEARUSDT) is trending right now!
Rank: #28
** I think that the fact that ' is currently at the 76,871$ level is being seen by many investors as a "buy" signal. However, personally, I believe it’s better to be more cautious rather than making a hurried purchase at this level. In the past 24 hours, we can see that ' has shown only a 1.04% increase, and trading volume is at the 29 billion dollar level. These figures may seem to indicate that the market is still within a strong trend, but for me there is a concerning sign: the gap with 's 1.76% increase. , has been gaining strength against it recently, and this could be a sign of a change in the market’s long-term trend. Personally, the fact that ' is at the 2,454$ level and remains stable at the 76,871$ level suggests to me that ' offers a more attractive investment opportunity. Of course, this is only my counter-opinion and the market can change at any moment. But for now, at 's high levels, I prefer to stand on the 'sell' side. Would you make a buy at 6,871$, or would you consider selling to lock in profits? **
** " Why I Still Say Not to 'Buy' at 76,871$ but to 'Sell'"
NEAR Protocol (NEARUSDT) is trending right now!
Rank: #28
** I think that the fact that ' is currently at the 76,871$ level is being seen by many investors as a "buy" signal. However, personally, I believe it’s better to be more cautious rather than making a hurried purchase at this level. In the past 24 hours, we can see that ' has shown only a 1.04% increase, and trading volume is at the 29 billion dollar level. These figures may seem to indicate that the market is still within a strong trend, but for me there is a concerning sign: the gap with 's 1.76% increase. , has been gaining strength against it recently, and this could be a sign of a change in the market’s long-term trend. Personally, the fact that ' is at the 2,454$ level and remains stable at the 76,871$ level suggests to me that ' offers a more attractive investment opportunity. Of course, this is only my counter-opinion and the market can change at any moment. But for now, at 's high levels, I prefer to stand on the 'sell' side. Would you make a buy at 6,871$, or would you consider selling to lock in profits? **
Rank: #28
** I think that the fact that ' is currently at the 76,871$ level is being seen by many investors as a "buy" signal. However, personally, I believe it’s better to be more cautious rather than making a hurried purchase at this level. In the past 24 hours, we can see that ' has shown only a 1.04% increase, and trading volume is at the 29 billion dollar level. These figures may seem to indicate that the market is still within a strong trend, but for me there is a concerning sign: the gap with 's 1.76% increase. , has been gaining strength against it recently, and this could be a sign of a change in the market’s long-term trend. Personally, the fact that ' is at the 2,454$ level and remains stable at the 76,871$ level suggests to me that ' offers a more attractive investment opportunity. Of course, this is only my counter-opinion and the market can change at any moment. But for now, at 's high levels, I prefer to stand on the 'sell' side. Would you make a buy at 6,871$, or would you consider selling to lock in profits? **
8
·
--
$T That was a bit brutal—on the 15m chart it directly dropped 3.15%. Volume spiked to 2.28x, volatility Z at 2.60. This isn’t the kind of low-volume, slow bleeding—it’s selling with volume pressing down.
Even more interesting is the OI: on 15m it’s +4.16%, on 1h it’s +7.65%. Price is down while open interest is up—this is a typical structure of shorts adding leverage and entering. Funding rate is -0.4854%, near-end percentile at 97%. The short crowding is already pushed up to the high percentile. Whole pool anomaly #28, notional change #43—depth confirmation shows both price and volume are abnormal.
Aggressive trade imbalance +2.8%, buy/sell ratio 1.06, and there’s still some support in the order book. In the past 24h, turnover is 94.27M. This isn’t a small market, but with such an extreme funding-rate percentile, the biggest risk is shorts stepping on their own feet. When the funding rate is negative down at the 97th percentile, it often means the market is stretched to the extreme at a certain stage—chasing shorts from here may not be the best risk-reward.
With OI rising, price falling, and funding extremely negative—if a rebound comes here, short covering orders will be very uncomfortable. Keep an eye on it first; don’t rush to pick a side.
$T That was a bit brutal—on the 15m chart it directly dropped 3.15%. Volume spiked to 2.28x, volatility Z at 2.60. This isn’t the kind of low-volume, slow bleeding—it’s selling with volume pressing down.
Even more interesting is the OI: on 15m it’s +4.16%, on 1h it’s +7.65%. Price is down while open interest is up—this is a typical structure of shorts adding leverage and entering. Funding rate is -0.4854%, near-end percentile at 97%. The short crowding is already pushed up to the high percentile. Whole pool anomaly #28, notional change #43—depth confirmation shows both price and volume are abnormal.
Aggressive trade imbalance +2.8%, buy/sell ratio 1.06, and there’s still some support in the order book. In the past 24h, turnover is 94.27M. This isn’t a small market, but with such an extreme funding-rate percentile, the biggest risk is shorts stepping on their own feet. When the funding rate is negative down at the 97th percentile, it often means the market is stretched to the extreme at a certain stage—chasing shorts from here may not be the best risk-reward.
With OI rising, price falling, and funding extremely negative—if a rebound comes here, short covering orders will be very uncomfortable. Keep an eye on it first; don’t rush to pick a side.
Even more interesting is the OI: on 15m it’s +4.16%, on 1h it’s +7.65%. Price is down while open interest is up—this is a typical structure of shorts adding leverage and entering. Funding rate is -0.4854%, near-end percentile at 97%. The short crowding is already pushed up to the high percentile. Whole pool anomaly #28, notional change #43—depth confirmation shows both price and volume are abnormal.
Aggressive trade imbalance +2.8%, buy/sell ratio 1.06, and there’s still some support in the order book. In the past 24h, turnover is 94.27M. This isn’t a small market, but with such an extreme funding-rate percentile, the biggest risk is shorts stepping on their own feet. When the funding rate is negative down at the 97th percentile, it often means the market is stretched to the extreme at a certain stage—chasing shorts from here may not be the best risk-reward.
With OI rising, price falling, and funding extremely negative—if a rebound comes here, short covering orders will be very uncomfortable. Keep an eye on it first; don’t rush to pick a side.
10
·
--
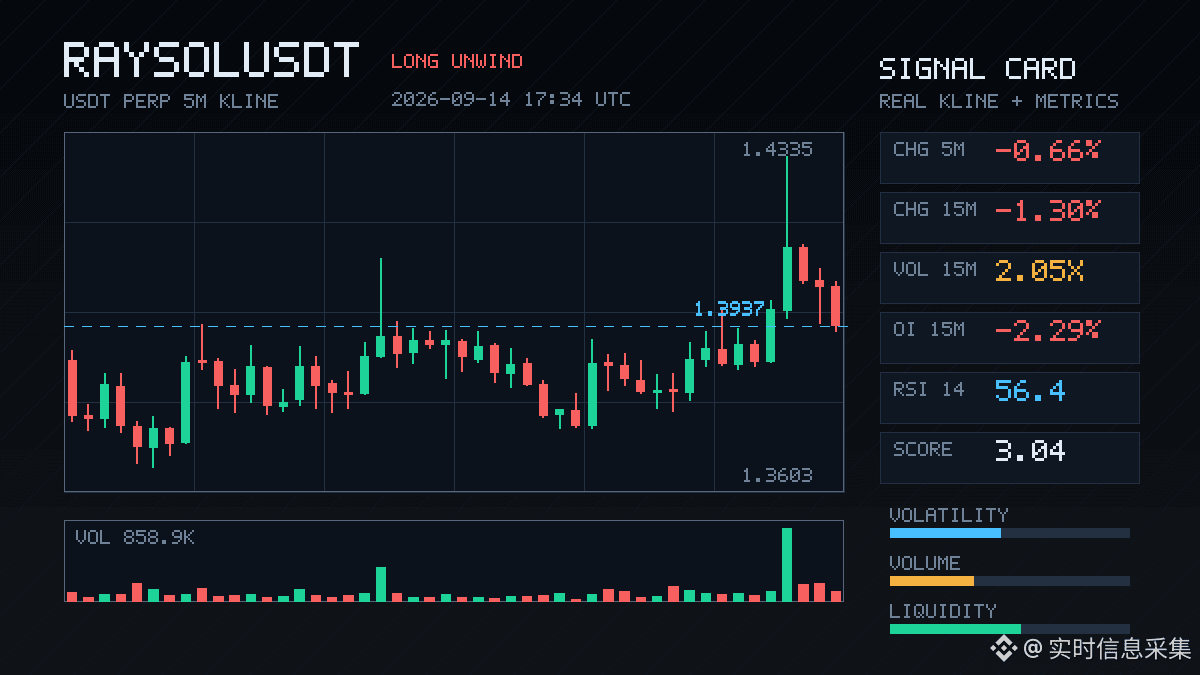
$RAYSOL OI abnormal quantile levels reached 93.5%. With an hour contract position, OI dropped directly by 3.27%, and the notional value decreased by more than 1.5 million.
Price on 15m fell 1.3%, aggressive trades had a difference of +16.7%, and buy/sell ratio was 1.40—just looking at this ratio it seems like someone is actively buying, but with both OI and notional dropping at the same time, it looks more like longs were squeezed out and liquidated to deleverage, not an upward structure from new capital entering.
In 24h, trading volume was 42M; on 15m, volume was 2.05x; volatility Z was 1.84. Depth data is sufficient. Whole-pool anomaly #6, notional change #28—among the earlier ones in the whole-pool scope, but not yet top-tier crowding.
Near its own historical extreme zone: a sample of longs deleveraging. Don’t rush to buy the dip in this situation—wait for OI to stabilize first.
$RAYSOL OI abnormal quantile levels reached 93.5%. With an hour contract position, OI dropped directly by 3.27%, and the notional value decreased by more than 1.5 million.
Price on 15m fell 1.3%, aggressive trades had a difference of +16.7%, and buy/sell ratio was 1.40—just looking at this ratio it seems like someone is actively buying, but with both OI and notional dropping at the same time, it looks more like longs were squeezed out and liquidated to deleverage, not an upward structure from new capital entering.
In 24h, trading volume was 42M; on 15m, volume was 2.05x; volatility Z was 1.84. Depth data is sufficient. Whole-pool anomaly #6, notional change #28—among the earlier ones in the whole-pool scope, but not yet top-tier crowding.
Near its own historical extreme zone: a sample of longs deleveraging. Don’t rush to buy the dip in this situation—wait for OI to stabilize first.
Price on 15m fell 1.3%, aggressive trades had a difference of +16.7%, and buy/sell ratio was 1.40—just looking at this ratio it seems like someone is actively buying, but with both OI and notional dropping at the same time, it looks more like longs were squeezed out and liquidated to deleverage, not an upward structure from new capital entering.
In 24h, trading volume was 42M; on 15m, volume was 2.05x; volatility Z was 1.84. Depth data is sufficient. Whole-pool anomaly #6, notional change #28—among the earlier ones in the whole-pool scope, but not yet top-tier crowding.
Near its own historical extreme zone: a sample of longs deleveraging. Don’t rush to buy the dip in this situation—wait for OI to stabilize first.
27
·
--
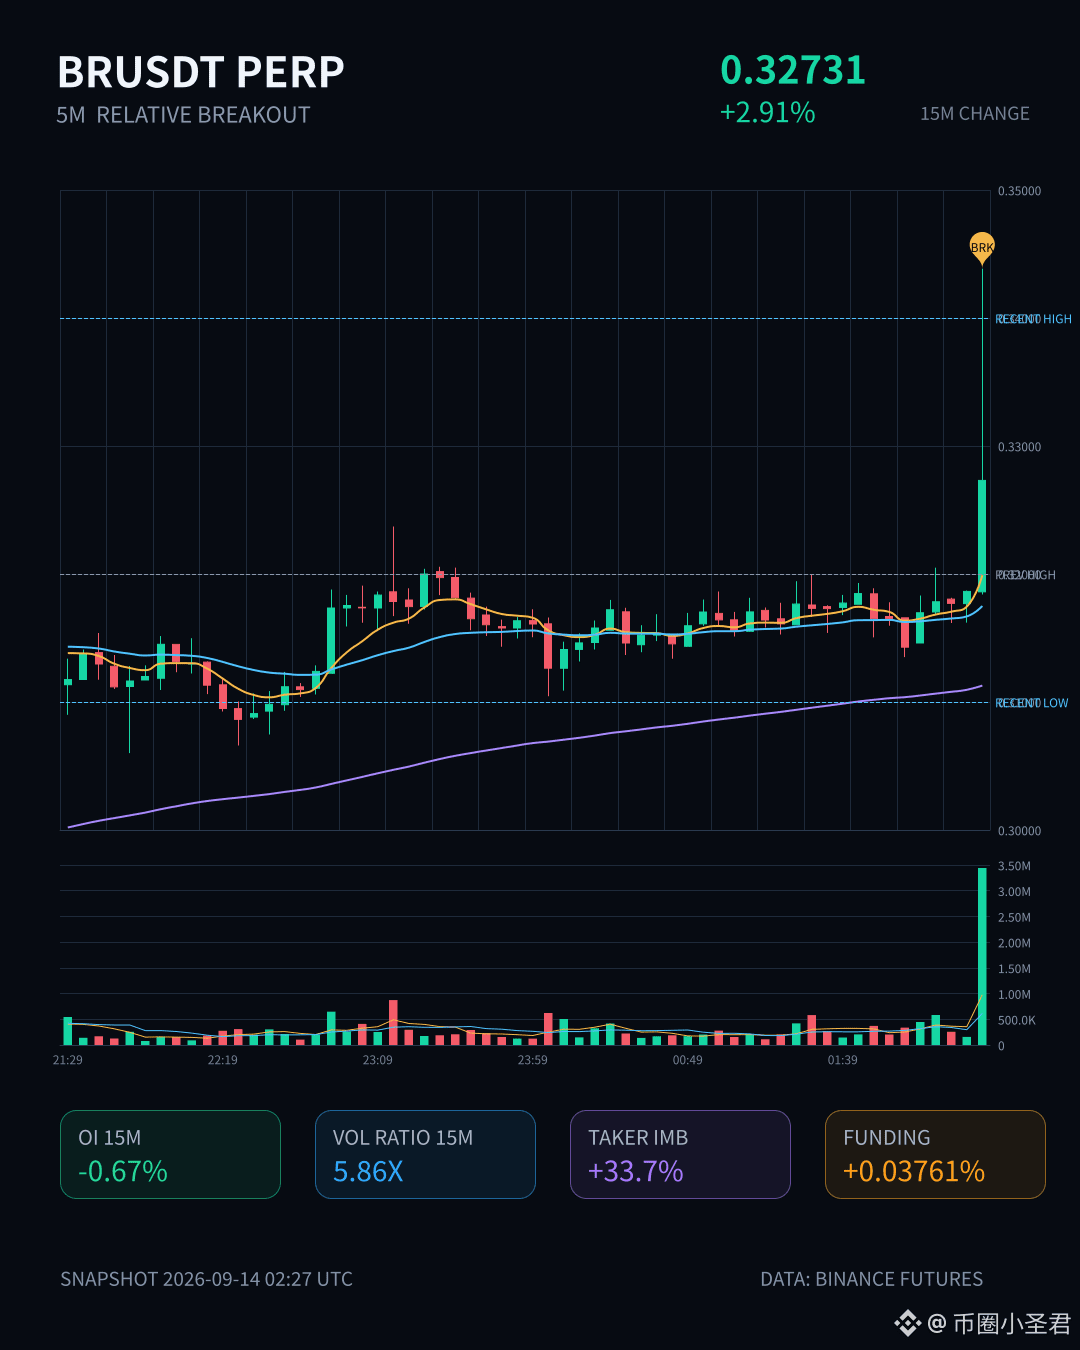
$BR This move has something in it.
On the 15m timeframe it directly surged 2.91%, with volume hitting 5.86x, Z value of 3.89—clearly not a retail crowd pushing it on a whim. Price broke above the upper edge of the last 20 five-minute (5m) ranges. The aggressive buy/sell ratio is 2.02, aggressive trades are +33.7% higher, and the buy orders are genuinely being placed firmly.
What’s interesting is the OI: the 15m contract is -0.67%, while only the 1h is +0.25%. Price is up while OI is down—this structure is more like short covering or position unwinding, not large-scale new long accumulation. Coupled with the funding rate being in a high percentile recently, it suggests longs are already a bit crowded. At times like this, the biggest risk is that once the covering ends, follow-through may not keep up.
Nominal change is 307K / 425K USDT; the entire pool anomaly is #21, nominal change ranks #28, and the anomaly percentile is 95.4%—it’s really touched its own historical extreme zone. Over the last 24h, trading value is 21.28M; the pool isn’t that big, and within the depth confirmation it’s true that trading volume is higher than normal. But whether it can continue depends on whether OI turns back up or keeps falling.
My view: the breakout is real, and the volume-price confirmation is real too. But the driving force is position covering, not new fresh entry. If you chase the move, be careful. Wait for a pullback and observe whether the support holds.
$BR This move has something in it.
On the 15m timeframe it directly surged 2.91%, with volume hitting 5.86x, Z value of 3.89—clearly not a retail crowd pushing it on a whim. Price broke above the upper edge of the last 20 five-minute (5m) ranges. The aggressive buy/sell ratio is 2.02, aggressive trades are +33.7% higher, and the buy orders are genuinely being placed firmly.
What’s interesting is the OI: the 15m contract is -0.67%, while only the 1h is +0.25%. Price is up while OI is down—this structure is more like short covering or position unwinding, not large-scale new long accumulation. Coupled with the funding rate being in a high percentile recently, it suggests longs are already a bit crowded. At times like this, the biggest risk is that once the covering ends, follow-through may not keep up.
Nominal change is 307K / 425K USDT; the entire pool anomaly is #21, nominal change ranks #28, and the anomaly percentile is 95.4%—it’s really touched its own historical extreme zone. Over the last 24h, trading value is 21.28M; the pool isn’t that big, and within the depth confirmation it’s true that trading volume is higher than normal. But whether it can continue depends on whether OI turns back up or keeps falling.
My view: the breakout is real, and the volume-price confirmation is real too. But the driving force is position covering, not new fresh entry. If you chase the move, be careful. Wait for a pullback and observe whether the support holds.
On the 15m timeframe it directly surged 2.91%, with volume hitting 5.86x, Z value of 3.89—clearly not a retail crowd pushing it on a whim. Price broke above the upper edge of the last 20 five-minute (5m) ranges. The aggressive buy/sell ratio is 2.02, aggressive trades are +33.7% higher, and the buy orders are genuinely being placed firmly.
What’s interesting is the OI: the 15m contract is -0.67%, while only the 1h is +0.25%. Price is up while OI is down—this structure is more like short covering or position unwinding, not large-scale new long accumulation. Coupled with the funding rate being in a high percentile recently, it suggests longs are already a bit crowded. At times like this, the biggest risk is that once the covering ends, follow-through may not keep up.
Nominal change is 307K / 425K USDT; the entire pool anomaly is #21, nominal change ranks #28, and the anomaly percentile is 95.4%—it’s really touched its own historical extreme zone. Over the last 24h, trading value is 21.28M; the pool isn’t that big, and within the depth confirmation it’s true that trading volume is higher than normal. But whether it can continue depends on whether OI turns back up or keeps falling.
My view: the breakout is real, and the volume-price confirmation is real too. But the driving force is position covering, not new fresh entry. If you chase the move, be careful. Wait for a pullback and observe whether the support holds.
10
·
--
$ARK shows a bit of unusual movement.
On the 15m chart, it’s up 2.97%, and volume is more than 2x. Price has just broken above the upper bound of the last ~20 5m bars. The OI side is more worth watching: on the 1h, contract open interest is up +8.97%, with notional increasing by 335K, and the 15m is also adding positions in sync. This kind of structure—price rising while OI rises together—is more solid than simply spiking on a volume bar. It looks more like newly added leveraged longs entering rather than shorts being passively forced out.
The abnormal percentile reached 90.9%, ranking #22 across the whole pool; notional change ranks #28. Heat isn’t at the absolute top, but it’s definitely noteworthy. Passive vs active trading difference is +3.7%, with a buy/sell ratio of 1.08, meaning slightly more aggressive buying.
For a small-cap ticker like ARK, if OI pumps quickly by 9% on an hourly timeframe, you should pay attention to what happens next. After breaking above the top of the range, if volume can keep going, then following the move for a stretch is fine. But if OI keeps surging while price just goes sideways, that’s leverage being piled in—watch out for a potential downside sweep. Keep an eye on it first; don’t rush to act.
$ARK shows a bit of unusual movement.
On the 15m chart, it’s up 2.97%, and volume is more than 2x. Price has just broken above the upper bound of the last ~20 5m bars. The OI side is more worth watching: on the 1h, contract open interest is up +8.97%, with notional increasing by 335K, and the 15m is also adding positions in sync. This kind of structure—price rising while OI rises together—is more solid than simply spiking on a volume bar. It looks more like newly added leveraged longs entering rather than shorts being passively forced out.
The abnormal percentile reached 90.9%, ranking #22 across the whole pool; notional change ranks #28. Heat isn’t at the absolute top, but it’s definitely noteworthy. Passive vs active trading difference is +3.7%, with a buy/sell ratio of 1.08, meaning slightly more aggressive buying.
For a small-cap ticker like ARK, if OI pumps quickly by 9% on an hourly timeframe, you should pay attention to what happens next. After breaking above the top of the range, if volume can keep going, then following the move for a stretch is fine. But if OI keeps surging while price just goes sideways, that’s leverage being piled in—watch out for a potential downside sweep. Keep an eye on it first; don’t rush to act.
On the 15m chart, it’s up 2.97%, and volume is more than 2x. Price has just broken above the upper bound of the last ~20 5m bars. The OI side is more worth watching: on the 1h, contract open interest is up +8.97%, with notional increasing by 335K, and the 15m is also adding positions in sync. This kind of structure—price rising while OI rises together—is more solid than simply spiking on a volume bar. It looks more like newly added leveraged longs entering rather than shorts being passively forced out.
The abnormal percentile reached 90.9%, ranking #22 across the whole pool; notional change ranks #28. Heat isn’t at the absolute top, but it’s definitely noteworthy. Passive vs active trading difference is +3.7%, with a buy/sell ratio of 1.08, meaning slightly more aggressive buying.
For a small-cap ticker like ARK, if OI pumps quickly by 9% on an hourly timeframe, you should pay attention to what happens next. After breaking above the top of the range, if volume can keep going, then following the move for a stretch is fine. But if OI keeps surging while price just goes sideways, that’s leverage being piled in—watch out for a potential downside sweep. Keep an eye on it first; don’t rush to act.
48
·
--
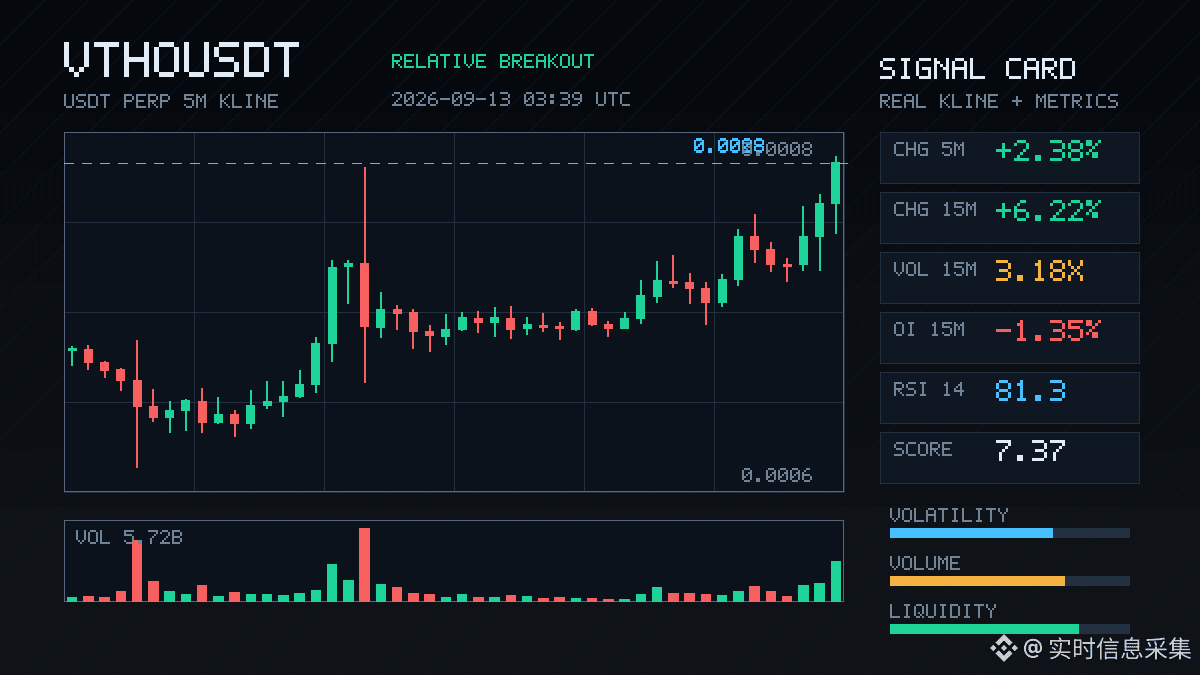
$VTHO This move is a bit interesting.
In 15m, it directly surged 6.22%. Volume hit more than 3 times the usual level, and the price closed outside the upper edge of the last ~20 five-minute candles. But the OI is trending downward—15m -1.35%, 1h -1.23%. Yet nominal changes are actually rising.
This kind of structure usually isn’t driven by fresh longs entering. It looks more like shorts are being forced to cover, or existing positions are being reduced. Active trade imbalance is +7%, and the buy/sell ratio is 1.15. Buyers are indeed chasing, but they’re chasing liquidity—not adding new positions.
The OI abnormal percentile is 94.6%. It ranks #20 across the whole pool by OI anomaly, and nominal change ranks #28. The location itself is also close to a historical extreme zone.
In the past 24h, trading value is 229 million—definitely not small. In a breakout where volume/price are diverging, chasing in can easily mean catching the end of a covering cycle. I’d rather first see whether it can hold steady above the breakout level; if OI doesn’t come back, the continuity will be very much in question.
$VTHO This move is a bit interesting.
In 15m, it directly surged 6.22%. Volume hit more than 3 times the usual level, and the price closed outside the upper edge of the last ~20 five-minute candles. But the OI is trending downward—15m -1.35%, 1h -1.23%. Yet nominal changes are actually rising.
This kind of structure usually isn’t driven by fresh longs entering. It looks more like shorts are being forced to cover, or existing positions are being reduced. Active trade imbalance is +7%, and the buy/sell ratio is 1.15. Buyers are indeed chasing, but they’re chasing liquidity—not adding new positions.
The OI abnormal percentile is 94.6%. It ranks #20 across the whole pool by OI anomaly, and nominal change ranks #28. The location itself is also close to a historical extreme zone.
In the past 24h, trading value is 229 million—definitely not small. In a breakout where volume/price are diverging, chasing in can easily mean catching the end of a covering cycle. I’d rather first see whether it can hold steady above the breakout level; if OI doesn’t come back, the continuity will be very much in question.
In 15m, it directly surged 6.22%. Volume hit more than 3 times the usual level, and the price closed outside the upper edge of the last ~20 five-minute candles. But the OI is trending downward—15m -1.35%, 1h -1.23%. Yet nominal changes are actually rising.
This kind of structure usually isn’t driven by fresh longs entering. It looks more like shorts are being forced to cover, or existing positions are being reduced. Active trade imbalance is +7%, and the buy/sell ratio is 1.15. Buyers are indeed chasing, but they’re chasing liquidity—not adding new positions.
The OI abnormal percentile is 94.6%. It ranks #20 across the whole pool by OI anomaly, and nominal change ranks #28. The location itself is also close to a historical extreme zone.
In the past 24h, trading value is 229 million—definitely not small. In a breakout where volume/price are diverging, chasing in can easily mean catching the end of a covering cycle. I’d rather first see whether it can hold steady above the breakout level; if OI doesn’t come back, the continuity will be very much in question.
23

·
--
$EIGEN This 15m is kind of interesting.
The price pushed up 1.08%, which isn’t outrageous, but the volume directly jumped to 2.60x. Volatility Z hit 3.08, buy/sell ratio is 3.50, and active volume is down 55.6%—this isn’t just scattered retail pushing around. Someone is actively driving it higher. The close also broke above the upper band of the last ~20 5m candles, and the price range boundary was touched.
More importantly: OI. On 15m it’s +0.63%, on 1h it’s +0.64%. Even though the notional change is only 124K/154K USDT, the anomalous percentile is already at 88.1%. In the whole pool, anomalies rank #11 and notional change ranks #28. Price rising alongside OI rising is typical of leveraged longs adding exposure—not shorts being squeezed out.
Funding rate has also climbed to a high percentile recently… people chasing longs at this point are already starting to pay the premium. 24h turnover is 21.51M, and the pool isn’t that deep. With volume at this level, it can be amplified easily—and conversely, pullbacks can happen just as fast.
Structurally it’s bullish, but at this funding-rate level I’d keep an extra eye on it—adding new long positions is a good thing, but if it gets too crowded, that’s not ideal. First, see whether it can hold steady above this upper boundary of the range.
$EIGEN This 15m is kind of interesting.
The price pushed up 1.08%, which isn’t outrageous, but the volume directly jumped to 2.60x. Volatility Z hit 3.08, buy/sell ratio is 3.50, and active volume is down 55.6%—this isn’t just scattered retail pushing around. Someone is actively driving it higher. The close also broke above the upper band of the last ~20 5m candles, and the price range boundary was touched.
More importantly: OI. On 15m it’s +0.63%, on 1h it’s +0.64%. Even though the notional change is only 124K/154K USDT, the anomalous percentile is already at 88.1%. In the whole pool, anomalies rank #11 and notional change ranks #28. Price rising alongside OI rising is typical of leveraged longs adding exposure—not shorts being squeezed out.
Funding rate has also climbed to a high percentile recently… people chasing longs at this point are already starting to pay the premium. 24h turnover is 21.51M, and the pool isn’t that deep. With volume at this level, it can be amplified easily—and conversely, pullbacks can happen just as fast.
Structurally it’s bullish, but at this funding-rate level I’d keep an extra eye on it—adding new long positions is a good thing, but if it gets too crowded, that’s not ideal. First, see whether it can hold steady above this upper boundary of the range.
The price pushed up 1.08%, which isn’t outrageous, but the volume directly jumped to 2.60x. Volatility Z hit 3.08, buy/sell ratio is 3.50, and active volume is down 55.6%—this isn’t just scattered retail pushing around. Someone is actively driving it higher. The close also broke above the upper band of the last ~20 5m candles, and the price range boundary was touched.
More importantly: OI. On 15m it’s +0.63%, on 1h it’s +0.64%. Even though the notional change is only 124K/154K USDT, the anomalous percentile is already at 88.1%. In the whole pool, anomalies rank #11 and notional change ranks #28. Price rising alongside OI rising is typical of leveraged longs adding exposure—not shorts being squeezed out.
Funding rate has also climbed to a high percentile recently… people chasing longs at this point are already starting to pay the premium. 24h turnover is 21.51M, and the pool isn’t that deep. With volume at this level, it can be amplified easily—and conversely, pullbacks can happen just as fast.
Structurally it’s bullish, but at this funding-rate level I’d keep an extra eye on it—adding new long positions is a good thing, but if it gets too crowded, that’s not ideal. First, see whether it can hold steady above this upper boundary of the range.
8
·
--
$IOST This order is a bit interesting—the move happened within 15 minutes and it ran up by two or three points, with the成交量 (trading volume) jumping to more than triple.
The key is that the资金 (capital) is synchronizing with the rise—OI has already turned up by +4% on the 1-hour timeframe. It’s the kind of price action where leveraged longs are entering; it’s not the “cancel orders and fake pump” type.
The $short-term nominal change squeezed into the whole pool’s unusual #25 and #28, which suggests it’s not just one person playing with their own small lot.
The fee rate has also been pushed to the recent high percentile, but the share of主动买盘 (aggressive buy orders) isn’t low either. The buy/sell ratio is 1.17—right now the longs are still willing to pay this fuel cost.
On direction: if volume and fee rate don’t diverge, this kind of structure often still has momentum to push a bit further.
Don’t get hotheaded chasing at highs—intraday swings are big. Keep control of your own position size.
$IOST This order is a bit interesting—the move happened within 15 minutes and it ran up by two or three points, with the成交量 (trading volume) jumping to more than triple.
The key is that the资金 (capital) is synchronizing with the rise—OI has already turned up by +4% on the 1-hour timeframe. It’s the kind of price action where leveraged longs are entering; it’s not the “cancel orders and fake pump” type.
The $short-term nominal change squeezed into the whole pool’s unusual #25 and #28, which suggests it’s not just one person playing with their own small lot.
The fee rate has also been pushed to the recent high percentile, but the share of主动买盘 (aggressive buy orders) isn’t low either. The buy/sell ratio is 1.17—right now the longs are still willing to pay this fuel cost.
On direction: if volume and fee rate don’t diverge, this kind of structure often still has momentum to push a bit further.
Don’t get hotheaded chasing at highs—intraday swings are big. Keep control of your own position size.
The key is that the资金 (capital) is synchronizing with the rise—OI has already turned up by +4% on the 1-hour timeframe. It’s the kind of price action where leveraged longs are entering; it’s not the “cancel orders and fake pump” type.
The $short-term nominal change squeezed into the whole pool’s unusual #25 and #28, which suggests it’s not just one person playing with their own small lot.
The fee rate has also been pushed to the recent high percentile, but the share of主动买盘 (aggressive buy orders) isn’t low either. The buy/sell ratio is 1.17—right now the longs are still willing to pay this fuel cost.
On direction: if volume and fee rate don’t diverge, this kind of structure often still has momentum to push a bit further.
Don’t get hotheaded chasing at highs—intraday swings are big. Keep control of your own position size.
38
·
--
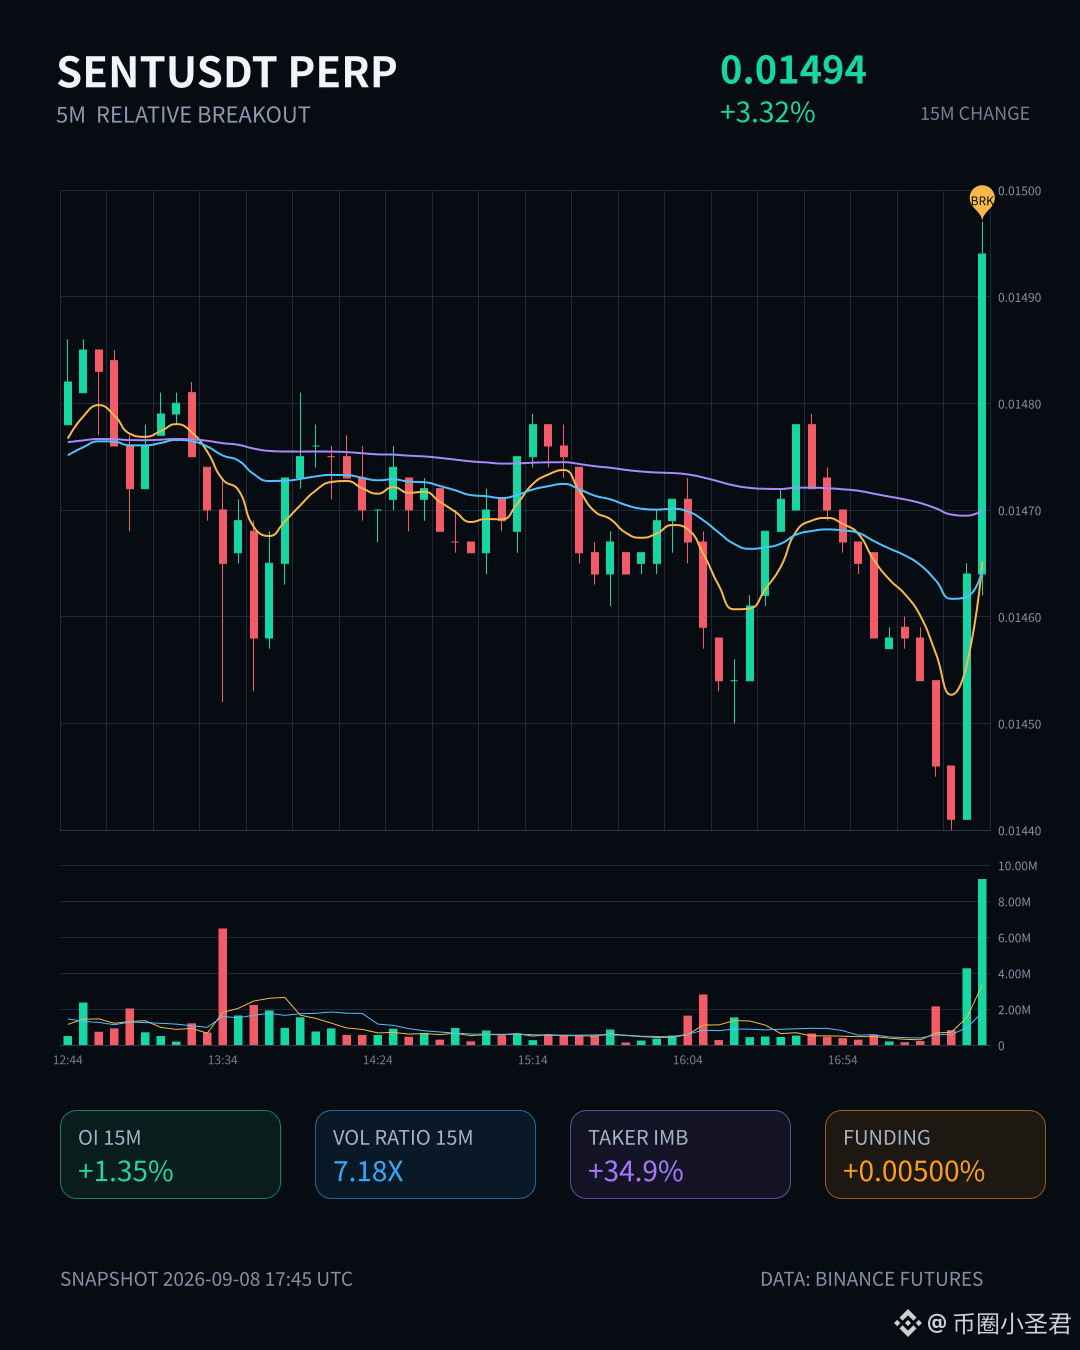
$SENT This move is a bit interesting.
In 15 minutes it jumped 3.32%, with trading volume reaching more than 7x the usual level. In the order book, aggressive buy orders are clearly in the lead—buys are about double the sells. This kind of structure isn’t common for short-term moves.
More worth noting: the positions are moving up in sync. Both the 15-minute and 1-hour timeframes are adding to positions. This isn’t just a simple emotional spike—it looks more like new leveraged longs are actually entering the market with real money. OI abnormal percentile reached 99.8%; across the entire pool it’s ranked #1, an extremely abnormal level. Although the nominal change is only a bit over $2 million and ranks #28 by size, within this pool it’s still extreme.
The close broke above the highs of the last nearly 20 five-minute candlesticks directly, and 24-hour volume was also pushed to 8 million+. Funding rates are at a high level recently, indicating the market is willing to pay for longs—this is usually a prerequisite condition for trend continuation.
Short-term is a textbook long-dominant setup, but changes of this magnitude are easy to mistake for prey. I’m not telling you to chase—just that based on the data structure, this coin is clearly holding something back.
$SENT This move is a bit interesting.
In 15 minutes it jumped 3.32%, with trading volume reaching more than 7x the usual level. In the order book, aggressive buy orders are clearly in the lead—buys are about double the sells. This kind of structure isn’t common for short-term moves.
More worth noting: the positions are moving up in sync. Both the 15-minute and 1-hour timeframes are adding to positions. This isn’t just a simple emotional spike—it looks more like new leveraged longs are actually entering the market with real money. OI abnormal percentile reached 99.8%; across the entire pool it’s ranked #1, an extremely abnormal level. Although the nominal change is only a bit over $2 million and ranks #28 by size, within this pool it’s still extreme.
The close broke above the highs of the last nearly 20 five-minute candlesticks directly, and 24-hour volume was also pushed to 8 million+. Funding rates are at a high level recently, indicating the market is willing to pay for longs—this is usually a prerequisite condition for trend continuation.
Short-term is a textbook long-dominant setup, but changes of this magnitude are easy to mistake for prey. I’m not telling you to chase—just that based on the data structure, this coin is clearly holding something back.
In 15 minutes it jumped 3.32%, with trading volume reaching more than 7x the usual level. In the order book, aggressive buy orders are clearly in the lead—buys are about double the sells. This kind of structure isn’t common for short-term moves.
More worth noting: the positions are moving up in sync. Both the 15-minute and 1-hour timeframes are adding to positions. This isn’t just a simple emotional spike—it looks more like new leveraged longs are actually entering the market with real money. OI abnormal percentile reached 99.8%; across the entire pool it’s ranked #1, an extremely abnormal level. Although the nominal change is only a bit over $2 million and ranks #28 by size, within this pool it’s still extreme.
The close broke above the highs of the last nearly 20 five-minute candlesticks directly, and 24-hour volume was also pushed to 8 million+. Funding rates are at a high level recently, indicating the market is willing to pay for longs—this is usually a prerequisite condition for trend continuation.
Short-term is a textbook long-dominant setup, but changes of this magnitude are easy to mistake for prey. I’m not telling you to chase—just that based on the data structure, this coin is clearly holding something back.
12
·
--
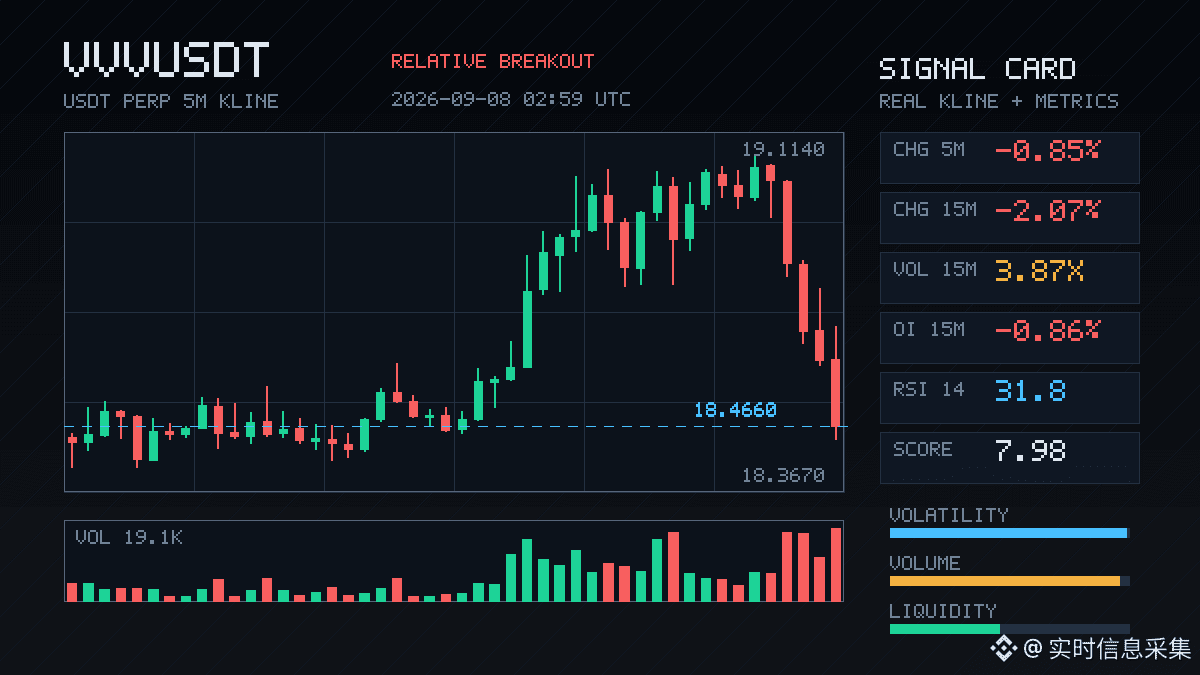
$VVV This 15-minute move dropped more than 2 points directly. Volume exploded to 3.87x—it's enough to make your eyelids twitch.
In passing, the price also broke through the lower ends of the ranges of nearly 20 five-minute candlesticks. Aggressive sell orders clearly have the absolute advantage, and the buy side can hardly fight back. Funding rates are still sitting at elevated levels. This combination of prices falling + positions shrinking looks more like liquidation/clearing of long leverage rather than a panic-style stampede.
On the contracts side, open interest is shrinking: the nominal changes over the 15-minute and 1-hour windows are both negative, and in total about several hundred thousand USD have been net withdrawn. The pool’s nominal change ranks as high as #28, and the OI abnormal percentile has climbed to 98.8%. For several consecutive cycles, it’s been in this kind of state, and the system has already flagged it as a high-quality event—indicating the market really is fairly extreme, not some ordinary, small-scale action.
Right now, it’s the “many kill many” script. In the next 24 hours there’s still over $23 million in trading volume providing support, so liquidity hasn’t dried up. After this, either it drops to the bottom and rebuilds strength, or there’s still one more jolt lower. Keep a close eye on it—don’t rush to bottom-fish, and don’t chase shorts either. Wait until the structure is clear before making a call.
$VVV This 15-minute move dropped more than 2 points directly. Volume exploded to 3.87x—it's enough to make your eyelids twitch.
In passing, the price also broke through the lower ends of the ranges of nearly 20 five-minute candlesticks. Aggressive sell orders clearly have the absolute advantage, and the buy side can hardly fight back. Funding rates are still sitting at elevated levels. This combination of prices falling + positions shrinking looks more like liquidation/clearing of long leverage rather than a panic-style stampede.
On the contracts side, open interest is shrinking: the nominal changes over the 15-minute and 1-hour windows are both negative, and in total about several hundred thousand USD have been net withdrawn. The pool’s nominal change ranks as high as #28, and the OI abnormal percentile has climbed to 98.8%. For several consecutive cycles, it’s been in this kind of state, and the system has already flagged it as a high-quality event—indicating the market really is fairly extreme, not some ordinary, small-scale action.
Right now, it’s the “many kill many” script. In the next 24 hours there’s still over $23 million in trading volume providing support, so liquidity hasn’t dried up. After this, either it drops to the bottom and rebuilds strength, or there’s still one more jolt lower. Keep a close eye on it—don’t rush to bottom-fish, and don’t chase shorts either. Wait until the structure is clear before making a call.
In passing, the price also broke through the lower ends of the ranges of nearly 20 five-minute candlesticks. Aggressive sell orders clearly have the absolute advantage, and the buy side can hardly fight back. Funding rates are still sitting at elevated levels. This combination of prices falling + positions shrinking looks more like liquidation/clearing of long leverage rather than a panic-style stampede.
On the contracts side, open interest is shrinking: the nominal changes over the 15-minute and 1-hour windows are both negative, and in total about several hundred thousand USD have been net withdrawn. The pool’s nominal change ranks as high as #28, and the OI abnormal percentile has climbed to 98.8%. For several consecutive cycles, it’s been in this kind of state, and the system has already flagged it as a high-quality event—indicating the market really is fairly extreme, not some ordinary, small-scale action.
Right now, it’s the “many kill many” script. In the next 24 hours there’s still over $23 million in trading volume providing support, so liquidity hasn’t dried up. After this, either it drops to the bottom and rebuilds strength, or there’s still one more jolt lower. Keep a close eye on it—don’t rush to bottom-fish, and don’t chase shorts either. Wait until the structure is clear before making a call.
105

·
--
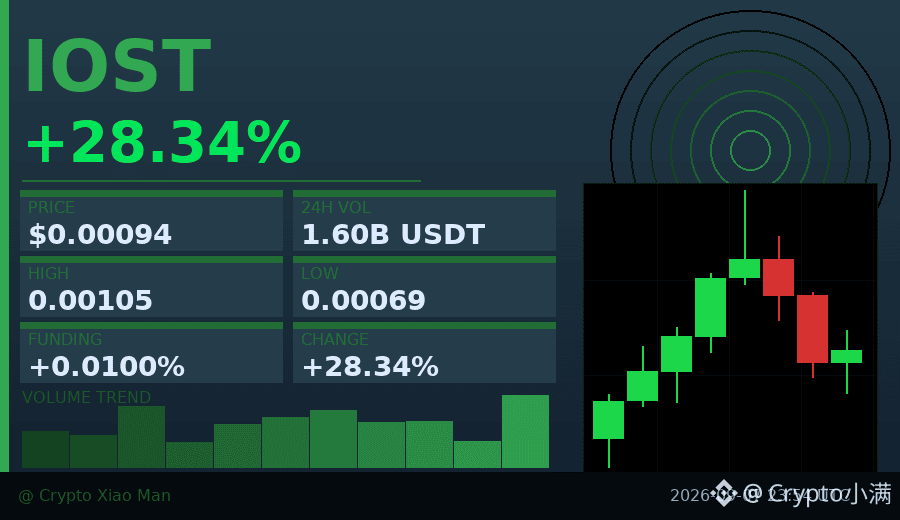
Behind the 28% surge, the funding rate is only 0.01%, and the long/short ratio is 51%/49%—this isn’t a FOMO-driven spike; it looks more like short covering combined with dip-buying.
IOST was ramped up from 0.00069 to 0.00104 in a stair-step rally over 8 hours, but in the past two hours it has started to pull back on lower volume, suggesting there isn’t strong chasing demand.
Trading volume of 160 million USDT isn’t small, but it hasn’t reached the level of “squeezing out” the market—more like an inertia push following a technical breakout.
If it can hold the 0.00092 support level next, there may be a second wave; if it breaks down, people who chased today’s rally may get trapped.
$IOST #资金费率偏低 #28%涨幅
Tap the small card below to quickly check the market👇
Behind the 28% surge, the funding rate is only 0.01%, and the long/short ratio is 51%/49%—this isn’t a FOMO-driven spike; it looks more like short covering combined with dip-buying.
IOST was ramped up from 0.00069 to 0.00104 in a stair-step rally over 8 hours, but in the past two hours it has started to pull back on lower volume, suggesting there isn’t strong chasing demand.
Trading volume of 160 million USDT isn’t small, but it hasn’t reached the level of “squeezing out” the market—more like an inertia push following a technical breakout.
If it can hold the 0.00092 support level next, there may be a second wave; if it breaks down, people who chased today’s rally may get trapped.
$IOST #资金费率偏低 #28%涨幅
Tap the small card below to quickly check the market👇
IOST was ramped up from 0.00069 to 0.00104 in a stair-step rally over 8 hours, but in the past two hours it has started to pull back on lower volume, suggesting there isn’t strong chasing demand.
Trading volume of 160 million USDT isn’t small, but it hasn’t reached the level of “squeezing out” the market—more like an inertia push following a technical breakout.
If it can hold the 0.00092 support level next, there may be a second wave; if it breaks down, people who chased today’s rally may get trapped.
$IOST #资金费率偏低 #28%涨幅
Tap the small card below to quickly check the market👇
21
·
--
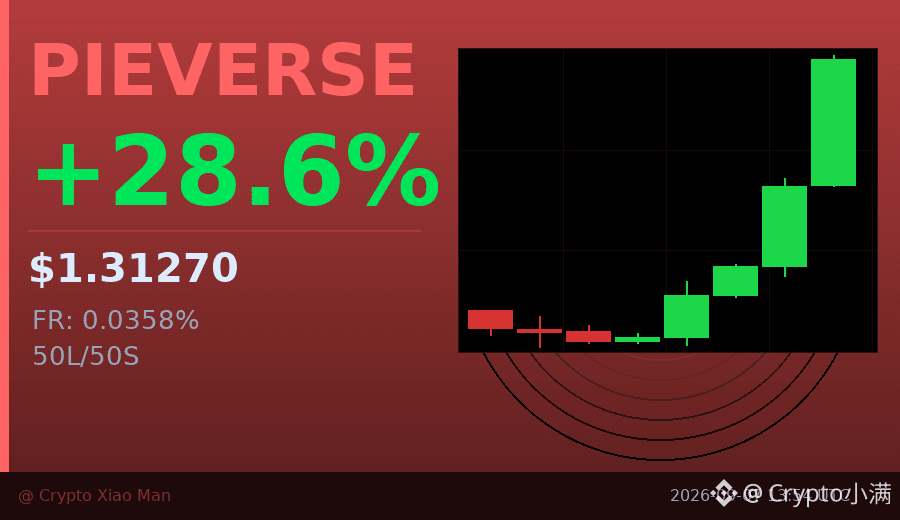
28% price increase, but the funding rate has already spiked to 0.0358%—what does that mean?
Today, PIERVERSE has surged from 1.02 all the way to 1.31, with trading volume hitting 18.1 million USDT.
The hourly candlesticks have been closing green consecutively, and the last candle clearly broke out with a surge in volume—the bids are coming in urgently.
But the long/short ratio is 50%/50%, which suggests nobody is willing to be the counterparty:
Longs are afraid of chasing after a spike, while shorts are afraid of getting squeezed—both sides are waiting.
This extreme funding rate combined with a volume breakout,
means either a short-squeeze move is just beginning, or it’s a short-term sentiment peak signal.
My preference is to first watch whether the next hourly candle can hold steady above 1.30.
$PIEVERSE #资金费率预警 #28%涨幅
Click the small card below to quickly check the行情👇
28% price increase, but the funding rate has already spiked to 0.0358%—what does that mean?
Today, PIERVERSE has surged from 1.02 all the way to 1.31, with trading volume hitting 18.1 million USDT.
The hourly candlesticks have been closing green consecutively, and the last candle clearly broke out with a surge in volume—the bids are coming in urgently.
But the long/short ratio is 50%/50%, which suggests nobody is willing to be the counterparty:
Longs are afraid of chasing after a spike, while shorts are afraid of getting squeezed—both sides are waiting.
This extreme funding rate combined with a volume breakout,
means either a short-squeeze move is just beginning, or it’s a short-term sentiment peak signal.
My preference is to first watch whether the next hourly candle can hold steady above 1.30.
$PIEVERSE #资金费率预警 #28%涨幅
Click the small card below to quickly check the行情👇
Today, PIERVERSE has surged from 1.02 all the way to 1.31, with trading volume hitting 18.1 million USDT.
The hourly candlesticks have been closing green consecutively, and the last candle clearly broke out with a surge in volume—the bids are coming in urgently.
But the long/short ratio is 50%/50%, which suggests nobody is willing to be the counterparty:
Longs are afraid of chasing after a spike, while shorts are afraid of getting squeezed—both sides are waiting.
This extreme funding rate combined with a volume breakout,
means either a short-squeeze move is just beginning, or it’s a short-term sentiment peak signal.
My preference is to first watch whether the next hourly candle can hold steady above 1.30.
$PIEVERSE #资金费率预警 #28%涨幅
Click the small card below to quickly check the行情👇
31
·
--
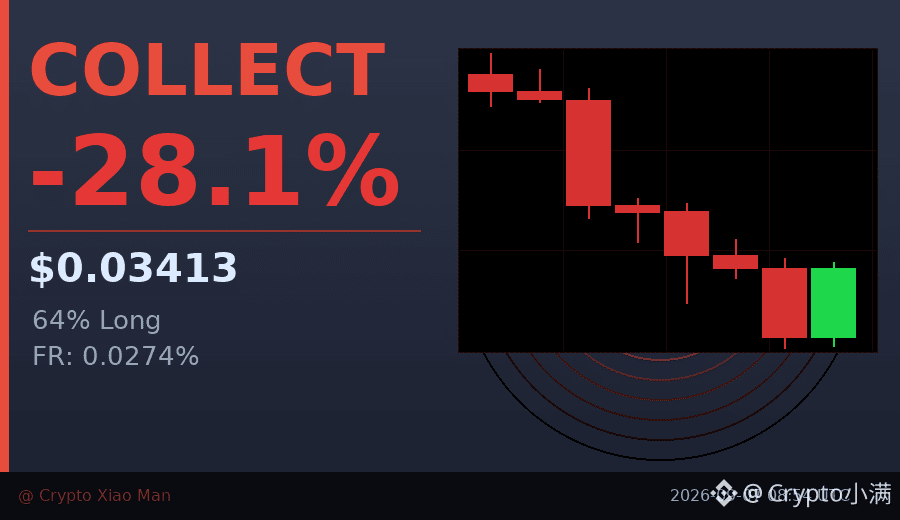
A 28% drop, yet volume surged to 38.8 million U. Something doesn’t add up.
COLLECT got hammered hard today, falling straight from 0.052 to 0.034. What’s interesting, though, is that the funding rate is still positive at 0.0274%, which means some traders are willing to pay interest to keep holding long positions.
Even stranger, 64% of traders are long and only 36% are short. Usually, such one-sided positioning is either crowded trading before a sharp drop, or someone quietly accumulating at the bottom.
Looking at the 8-hour candlestick chart, the overall trend is weakening, but the latest candle bounced back from 0.031 to 0.034, suggesting some tentative bottom-fishing by capital.
I wouldn’t rush in right now. For a move like this, either wait for a confirmed rebound or see whether it can hold steady around 0.03.
$COLLECT #山寨币异动 #28% drop
Click the small card below to quickly check the market👇
A 28% drop, yet volume surged to 38.8 million U. Something doesn’t add up.
COLLECT got hammered hard today, falling straight from 0.052 to 0.034. What’s interesting, though, is that the funding rate is still positive at 0.0274%, which means some traders are willing to pay interest to keep holding long positions.
Even stranger, 64% of traders are long and only 36% are short. Usually, such one-sided positioning is either crowded trading before a sharp drop, or someone quietly accumulating at the bottom.
Looking at the 8-hour candlestick chart, the overall trend is weakening, but the latest candle bounced back from 0.031 to 0.034, suggesting some tentative bottom-fishing by capital.
I wouldn’t rush in right now. For a move like this, either wait for a confirmed rebound or see whether it can hold steady around 0.03.
$COLLECT #山寨币异动 #28% drop
Click the small card below to quickly check the market👇
COLLECT got hammered hard today, falling straight from 0.052 to 0.034. What’s interesting, though, is that the funding rate is still positive at 0.0274%, which means some traders are willing to pay interest to keep holding long positions.
Even stranger, 64% of traders are long and only 36% are short. Usually, such one-sided positioning is either crowded trading before a sharp drop, or someone quietly accumulating at the bottom.
Looking at the 8-hour candlestick chart, the overall trend is weakening, but the latest candle bounced back from 0.031 to 0.034, suggesting some tentative bottom-fishing by capital.
I wouldn’t rush in right now. For a move like this, either wait for a confirmed rebound or see whether it can hold steady around 0.03.
$COLLECT #山寨币异动 #28% drop
Click the small card below to quickly check the market👇
30
·
--
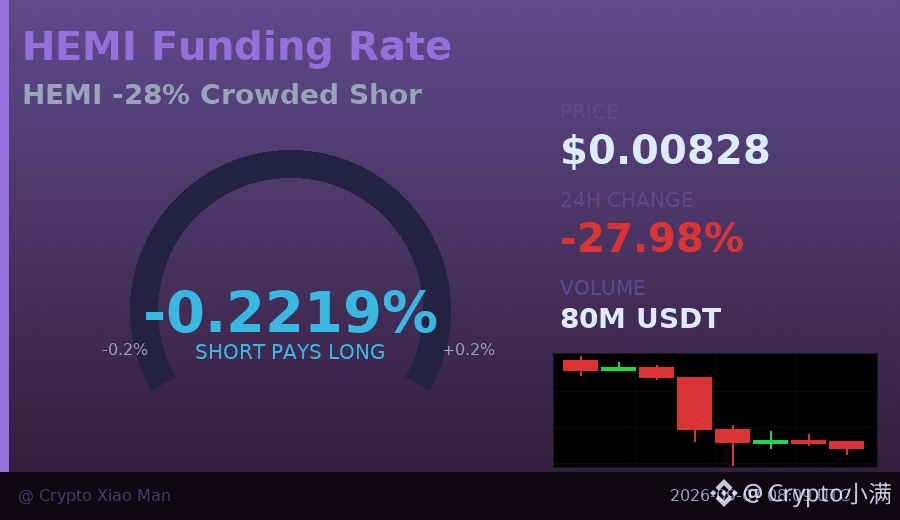
Down 28% in 24 hours, yet the funding rate has surged to -0.22% — what is happening to Hakimi?
The price has kept sliding to 0.00828, and the hourly candlestick chart has closed three bearish candles in a row, making it look like the bears are fully in control. But interestingly, 55% of open positions are shorts, so the crowding is already quite high.
Such an extreme negative funding rate usually means two things: either shorts are aggressively using leverage to bet on further declines, or someone is accumulating at the high funding cost. Trading volume of 79M USDT is not small, which suggests this is not a low-volume grind lower.
I tend to think this is close to a short-term sentiment bottom. That doesn't mean an immediate rebound, but chasing shorts has already become a poor risk-reward trade; instead, it may be worth watching for signs of stabilization.
$HEMI #资金费率极端 #28%跌幅
Click the small card below to quickly check the market 👇
Down 28% in 24 hours, yet the funding rate has surged to -0.22% — what is happening to Hakimi?
The price has kept sliding to 0.00828, and the hourly candlestick chart has closed three bearish candles in a row, making it look like the bears are fully in control. But interestingly, 55% of open positions are shorts, so the crowding is already quite high.
Such an extreme negative funding rate usually means two things: either shorts are aggressively using leverage to bet on further declines, or someone is accumulating at the high funding cost. Trading volume of 79M USDT is not small, which suggests this is not a low-volume grind lower.
I tend to think this is close to a short-term sentiment bottom. That doesn't mean an immediate rebound, but chasing shorts has already become a poor risk-reward trade; instead, it may be worth watching for signs of stabilization.
$HEMI #资金费率极端 #28%跌幅
Click the small card below to quickly check the market 👇
The price has kept sliding to 0.00828, and the hourly candlestick chart has closed three bearish candles in a row, making it look like the bears are fully in control. But interestingly, 55% of open positions are shorts, so the crowding is already quite high.
Such an extreme negative funding rate usually means two things: either shorts are aggressively using leverage to bet on further declines, or someone is accumulating at the high funding cost. Trading volume of 79M USDT is not small, which suggests this is not a low-volume grind lower.
I tend to think this is close to a short-term sentiment bottom. That doesn't mean an immediate rebound, but chasing shorts has already become a poor risk-reward trade; instead, it may be worth watching for signs of stabilization.
$HEMI #资金费率极端 #28%跌幅
Click the small card below to quickly check the market 👇
24
Log in to explore more content
Join global crypto users on Binance Square
⚡️ Get latest and useful information about crypto.
💬 Trusted by the world’s largest crypto exchange.
👍 Discover real insights from verified creators.
Email / Phone number
Trending Topics
1
#AIStocksWhatNext
589,151 views
4,401 Discussing
2
#21SharesLaunchesEuropesFirstZcashETP
3,290 views
179 Discussing
3
#CardanoJoinsX402PaymentStandard
2,373 views
145 Discussing
4
#BitcoinTops$87KAtEightMonthHigh
4,937 views
67 Discussing
5
#ZECBreaksAbove$1600AtRecordHigh
2,199 views
54 Discussing
6
#BitwiseNEARStakingETPAssetsTop$100M
21,534 views
69 Discussing
7
#BitcoinBreaksAboveMayHighNears$86K
26,070 views
253 Discussing
8
#DogecoinRises15%
93,998 views
1,566 Discussing
9
#$14BBitcoinOptionsExpireFriday
7,613 views
109 Discussing
10
#BNBMarketCapPassesBNYMellon
57,907 views
1,241 Discussing