
#11
11
54,162 views
365 Discussing
Hot
Latest

·
--
See translation
$LDO 这根15m有点意思。
价格只涨了1.28%,看着不起眼,但成交量直接干到3.59倍,OI 15m +0.63%、1h也在跟着加。这不是空头回补那种虚拉,更像新杠杆多头在往里面挤——价格和持仓同步往上走,结构比单纯的插针干净。
主动成交差15.1%,买卖比1.36,资金费率也顶到近期高分位。情绪是偏的,而且偏得不轻。
收盘刚突破近20根5m的上沿,OI异常分位94%,全池排到#11。连续几个周期都在延续,深度也够,不是那种一根线拉完就歇的。
这种位置我不太喜欢追第一根,但会盯着。突破能不能站稳、OI是继续堆还是开始松,比这1.28%本身重要得多。
$LDO 这根15m有点意思。
价格只涨了1.28%,看着不起眼,但成交量直接干到3.59倍,OI 15m +0.63%、1h也在跟着加。这不是空头回补那种虚拉,更像新杠杆多头在往里面挤——价格和持仓同步往上走,结构比单纯的插针干净。
主动成交差15.1%,买卖比1.36,资金费率也顶到近期高分位。情绪是偏的,而且偏得不轻。
收盘刚突破近20根5m的上沿,OI异常分位94%,全池排到#11。连续几个周期都在延续,深度也够,不是那种一根线拉完就歇的。
这种位置我不太喜欢追第一根,但会盯着。突破能不能站稳、OI是继续堆还是开始松,比这1.28%本身重要得多。
价格只涨了1.28%,看着不起眼,但成交量直接干到3.59倍,OI 15m +0.63%、1h也在跟着加。这不是空头回补那种虚拉,更像新杠杆多头在往里面挤——价格和持仓同步往上走,结构比单纯的插针干净。
主动成交差15.1%,买卖比1.36,资金费率也顶到近期高分位。情绪是偏的,而且偏得不轻。
收盘刚突破近20根5m的上沿,OI异常分位94%,全池排到#11。连续几个周期都在延续,深度也够,不是那种一根线拉完就歇的。
这种位置我不太喜欢追第一根,但会盯着。突破能不能站稳、OI是继续堆还是开始松,比这1.28%本身重要得多。
23
·
--
See translation
$USELESS 这波有点东西。
15m 拉了 5.54%,量能直接干到 2.37 倍,波动 Z 3.59。关键不是单纯拉盘——OI 也在同步往上走,15m +1.28%,1h +1.02%,名义变化加起来快 3M USDT。价格上涨 + OI 上升,这结构更像是新杠杆多头在进场,而不是空头被逼平。
OI 异常分位直接顶到 100%,全池异常排 #2,名义变化 #11。连续多个周期都在延续,不是一根针的事。
盘口这边,主动成交差 15.2%,买卖比 1.36,主动买占优。收盘价也突破了近 20 根 5m K 的上沿,刚好卡在近期价格区间边界上。24h 成交额 72.89M。
名字叫 USELESS,这走势倒是一点不 useless。不过 OI 堆这么高、分位打满,追多的要注意后面杠杆踩踏的风险。先看着。
$USELESS 这波有点东西。
15m 拉了 5.54%,量能直接干到 2.37 倍,波动 Z 3.59。关键不是单纯拉盘——OI 也在同步往上走,15m +1.28%,1h +1.02%,名义变化加起来快 3M USDT。价格上涨 + OI 上升,这结构更像是新杠杆多头在进场,而不是空头被逼平。
OI 异常分位直接顶到 100%,全池异常排 #2,名义变化 #11。连续多个周期都在延续,不是一根针的事。
盘口这边,主动成交差 15.2%,买卖比 1.36,主动买占优。收盘价也突破了近 20 根 5m K 的上沿,刚好卡在近期价格区间边界上。24h 成交额 72.89M。
名字叫 USELESS,这走势倒是一点不 useless。不过 OI 堆这么高、分位打满,追多的要注意后面杠杆踩踏的风险。先看着。
15m 拉了 5.54%,量能直接干到 2.37 倍,波动 Z 3.59。关键不是单纯拉盘——OI 也在同步往上走,15m +1.28%,1h +1.02%,名义变化加起来快 3M USDT。价格上涨 + OI 上升,这结构更像是新杠杆多头在进场,而不是空头被逼平。
OI 异常分位直接顶到 100%,全池异常排 #2,名义变化 #11。连续多个周期都在延续,不是一根针的事。
盘口这边,主动成交差 15.2%,买卖比 1.36,主动买占优。收盘价也突破了近 20 根 5m K 的上沿,刚好卡在近期价格区间边界上。24h 成交额 72.89M。
名字叫 USELESS,这走势倒是一点不 useless。不过 OI 堆这么高、分位打满,追多的要注意后面杠杆踩踏的风险。先看着。
7

·
--
$HYPE Today’s high touched $95.99, exactly at the all-time high, then it pulled back and closed at $92.78. Over the past 24 hours, it has basically gone sideways. The chart stage is very clear: after failing to break the ATH, it consolidated at the highs. It’s up 14.2% over 7 days and 17.32% over 30 days. The trend is still upward, but after the high-volume bullish candle on September 19, trading volume shrank from 1.87B to today’s 1.26B. The price has churned between $92 and $94 for three days and hasn’t moved further.
What I care about more is whether turnover is sufficient. $HYPE has been driven up from $77 to $96; short-term unrealized gains are close to 25%. With this kind of size (market cap 20.6B, rank #11), it’s impossible to punch through the historical high purely on sentiment—it must digest selling pressure near the ATH. Today’s rally-and-fade isn’t necessarily a bad sign. As long as the pullback doesn’t break the $85–$87 area and volume expands again, the up-move from the past few days can still be considered a preparatory stage for a valid breakout. Conversely, if volume keeps shrinking to below 800M and the price can’t hold $90, then this 14% rally can easily turn into a new trapped-holder zone.
The sharpest contradiction right now is on the chart: is today’s upper wick a probe before the breakout, or is it the first batch of holders exiting on the opportunity. The market hasn’t answered that yet.
$HYPE Today’s high touched $95.99, exactly at the all-time high, then it pulled back and closed at $92.78. Over the past 24 hours, it has basically gone sideways. The chart stage is very clear: after failing to break the ATH, it consolidated at the highs. It’s up 14.2% over 7 days and 17.32% over 30 days. The trend is still upward, but after the high-volume bullish candle on September 19, trading volume shrank from 1.87B to today’s 1.26B. The price has churned between $92 and $94 for three days and hasn’t moved further.
What I care about more is whether turnover is sufficient. $HYPE has been driven up from $77 to $96; short-term unrealized gains are close to 25%. With this kind of size (market cap 20.6B, rank #11), it’s impossible to punch through the historical high purely on sentiment—it must digest selling pressure near the ATH. Today’s rally-and-fade isn’t necessarily a bad sign. As long as the pullback doesn’t break the $85–$87 area and volume expands again, the up-move from the past few days can still be considered a preparatory stage for a valid breakout. Conversely, if volume keeps shrinking to below 800M and the price can’t hold $90, then this 14% rally can easily turn into a new trapped-holder zone.
The sharpest contradiction right now is on the chart: is today’s upper wick a probe before the breakout, or is it the first batch of holders exiting on the opportunity. The market hasn’t answered that yet.
What I care about more is whether turnover is sufficient. $HYPE has been driven up from $77 to $96; short-term unrealized gains are close to 25%. With this kind of size (market cap 20.6B, rank #11), it’s impossible to punch through the historical high purely on sentiment—it must digest selling pressure near the ATH. Today’s rally-and-fade isn’t necessarily a bad sign. As long as the pullback doesn’t break the $85–$87 area and volume expands again, the up-move from the past few days can still be considered a preparatory stage for a valid breakout. Conversely, if volume keeps shrinking to below 800M and the price can’t hold $90, then this 14% rally can easily turn into a new trapped-holder zone.
The sharpest contradiction right now is on the chart: is today’s upper wick a probe before the breakout, or is it the first batch of holders exiting on the opportunity. The market hasn’t answered that yet.
39

·
--
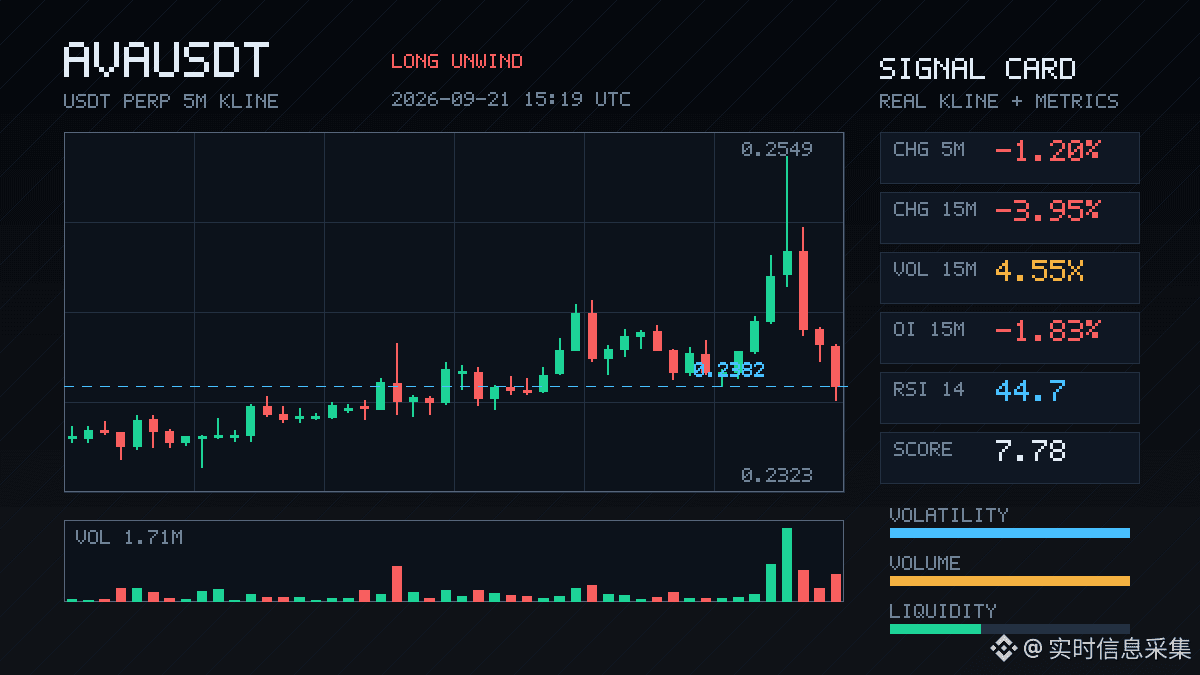
$AVA This 15m move dropped -3.95%. Volume/turnover reached 4.55x. The buy/sell ratio is 0.50. The active trade imbalance is -33.7%—all of it is being hit by market sell orders.
But pay attention to OI: the 15m contract is -1.83%, 1h is -0.83%, and the notional change is -222K. Price is down while OI is also falling—this is the typical long-side deleveraging, not fresh shorts entering.
The OI percentile is 97.6%, ranking #11 in the whole pool, and it has continued across multiple cycles. In plain language: longs are being bulk-liquidated and forced out—stop-losses and liquidations—while positions are shrinking.
This structure is more worth watching than the price itself. If it were a new short opening, OI should be rising. Now OI is dropping, which suggests the shorts aren’t getting follow-through; the longs are the ones doing the dumping.
Total成交 over 24h is only 13.37M, so the pool isn’t very deep. Wait for OI to stop falling and stabilize before seeing whether anyone steps in. Chasing shorts right now isn’t great in terms of risk/reward, and any bottom-picking still needs to wait for signals that deleveraging has ended.
$AVA This 15m move dropped -3.95%. Volume/turnover reached 4.55x. The buy/sell ratio is 0.50. The active trade imbalance is -33.7%—all of it is being hit by market sell orders.
But pay attention to OI: the 15m contract is -1.83%, 1h is -0.83%, and the notional change is -222K. Price is down while OI is also falling—this is the typical long-side deleveraging, not fresh shorts entering.
The OI percentile is 97.6%, ranking #11 in the whole pool, and it has continued across multiple cycles. In plain language: longs are being bulk-liquidated and forced out—stop-losses and liquidations—while positions are shrinking.
This structure is more worth watching than the price itself. If it were a new short opening, OI should be rising. Now OI is dropping, which suggests the shorts aren’t getting follow-through; the longs are the ones doing the dumping.
Total成交 over 24h is only 13.37M, so the pool isn’t very deep. Wait for OI to stop falling and stabilize before seeing whether anyone steps in. Chasing shorts right now isn’t great in terms of risk/reward, and any bottom-picking still needs to wait for signals that deleveraging has ended.
But pay attention to OI: the 15m contract is -1.83%, 1h is -0.83%, and the notional change is -222K. Price is down while OI is also falling—this is the typical long-side deleveraging, not fresh shorts entering.
The OI percentile is 97.6%, ranking #11 in the whole pool, and it has continued across multiple cycles. In plain language: longs are being bulk-liquidated and forced out—stop-losses and liquidations—while positions are shrinking.
This structure is more worth watching than the price itself. If it were a new short opening, OI should be rising. Now OI is dropping, which suggests the shorts aren’t getting follow-through; the longs are the ones doing the dumping.
Total成交 over 24h is only 13.37M, so the pool isn’t very deep. Wait for OI to stop falling and stabilize before seeing whether anyone steps in. Chasing shorts right now isn’t great in terms of risk/reward, and any bottom-picking still needs to wait for signals that deleveraging has ended.
4
·
--
See translation
$RAYSOL 这波下跌有点意思。
价格跌破近20根5m区间下沿,15m成交量直接干到2.91倍,Z值1.78,放量破位。主动成交差-23.3%,买卖比0.62,卖压是实实在在的。
但重点看OI——15m -1.54%,1h -0.31%,名义变化都在收缩。这不是新空进场砸盘,更像多头去杠杆,止损被打掉的那种跌法。
OI异常分位95.8%,全池异常#11,名义变化#28。极端区间附近出现这种结构,通常是仓位在快速出清。问题是出清完之后有没有承接。
24h成交额25.44M,深度还行,但现在的主动方向偏空太明显。等OI稳下来再看,现在接刀性价比一般。
$RAYSOL 这波下跌有点意思。
价格跌破近20根5m区间下沿,15m成交量直接干到2.91倍,Z值1.78,放量破位。主动成交差-23.3%,买卖比0.62,卖压是实实在在的。
但重点看OI——15m -1.54%,1h -0.31%,名义变化都在收缩。这不是新空进场砸盘,更像多头去杠杆,止损被打掉的那种跌法。
OI异常分位95.8%,全池异常#11,名义变化#28。极端区间附近出现这种结构,通常是仓位在快速出清。问题是出清完之后有没有承接。
24h成交额25.44M,深度还行,但现在的主动方向偏空太明显。等OI稳下来再看,现在接刀性价比一般。
价格跌破近20根5m区间下沿,15m成交量直接干到2.91倍,Z值1.78,放量破位。主动成交差-23.3%,买卖比0.62,卖压是实实在在的。
但重点看OI——15m -1.54%,1h -0.31%,名义变化都在收缩。这不是新空进场砸盘,更像多头去杠杆,止损被打掉的那种跌法。
OI异常分位95.8%,全池异常#11,名义变化#28。极端区间附近出现这种结构,通常是仓位在快速出清。问题是出清完之后有没有承接。
24h成交额25.44M,深度还行,但现在的主动方向偏空太明显。等OI稳下来再看,现在接刀性价比一般。
4
·
--
$HYPE is now standing at a very delicate point: $93.99, just 0.5% away from the ATH. In the past 7 days it has surged 18%, seemingly on track to set a new high. But the chart leaves an unappealing detail: the true volume that propelled the price upward appeared on the September 19th candle—a $1.87B high-volume bullish candle. After that, the price kept rising for two days, yet the volume fell back to around $850M. This kind of low-volume move near a prior high, in the eyes of technical traders, is often not “a buildup for a breakout,” but “questionable support.”
Rather than focusing on the 0.5% gap to the ATH, what I care about is whether this rally is driven by spot liquidity or by another round of derivative capital using a narrative to squeeze higher. A market cap of $20.9B ranks #11. For a project like Hyperliquid, which has story-driven momentum dating back to the dYdX era, the valuation itself has some support. However, the $857M 24h volume relative to market cap isn’t particularly high, suggesting that big players haven’t truly committed with heavy bets yet.
The real question worth continuing to ask is this: if $HYPE keeps probing in the $79–85 range, then confirms with a breakout on heavy volume, this low-volume advance would be perfectly normal—just another shakeout. But if tomorrow it prints another bearish candle with a price-volume divergence, then after the first pullback, we’ll have to see whether $87–88 can hold. Right now, the entire perp DEX sector’s capital attention is still locked on BTC’s fluctuations. Whether $HYPE can break away from the broader market to form an independent trend—how “real” this rebound is—at minimum still needs at least one more round of volume validation before any conclusion can be drawn.
$HYPE is now standing at a very delicate point: $93.99, just 0.5% away from the ATH. In the past 7 days it has surged 18%, seemingly on track to set a new high. But the chart leaves an unappealing detail: the true volume that propelled the price upward appeared on the September 19th candle—a $1.87B high-volume bullish candle. After that, the price kept rising for two days, yet the volume fell back to around $850M. This kind of low-volume move near a prior high, in the eyes of technical traders, is often not “a buildup for a breakout,” but “questionable support.”
Rather than focusing on the 0.5% gap to the ATH, what I care about is whether this rally is driven by spot liquidity or by another round of derivative capital using a narrative to squeeze higher. A market cap of $20.9B ranks #11. For a project like Hyperliquid, which has story-driven momentum dating back to the dYdX era, the valuation itself has some support. However, the $857M 24h volume relative to market cap isn’t particularly high, suggesting that big players haven’t truly committed with heavy bets yet.
The real question worth continuing to ask is this: if $HYPE keeps probing in the $79–85 range, then confirms with a breakout on heavy volume, this low-volume advance would be perfectly normal—just another shakeout. But if tomorrow it prints another bearish candle with a price-volume divergence, then after the first pullback, we’ll have to see whether $87–88 can hold. Right now, the entire perp DEX sector’s capital attention is still locked on BTC’s fluctuations. Whether $HYPE can break away from the broader market to form an independent trend—how “real” this rebound is—at minimum still needs at least one more round of volume validation before any conclusion can be drawn.
Rather than focusing on the 0.5% gap to the ATH, what I care about is whether this rally is driven by spot liquidity or by another round of derivative capital using a narrative to squeeze higher. A market cap of $20.9B ranks #11. For a project like Hyperliquid, which has story-driven momentum dating back to the dYdX era, the valuation itself has some support. However, the $857M 24h volume relative to market cap isn’t particularly high, suggesting that big players haven’t truly committed with heavy bets yet.
The real question worth continuing to ask is this: if $HYPE keeps probing in the $79–85 range, then confirms with a breakout on heavy volume, this low-volume advance would be perfectly normal—just another shakeout. But if tomorrow it prints another bearish candle with a price-volume divergence, then after the first pullback, we’ll have to see whether $87–88 can hold. Right now, the entire perp DEX sector’s capital attention is still locked on BTC’s fluctuations. Whether $HYPE can break away from the broader market to form an independent trend—how “real” this rebound is—at minimum still needs at least one more round of volume validation before any conclusion can be drawn.
7

·
--
JUP This one is kind of interesting.
In the 15m timeframe, it directly surged by 1.59%, with volume reaching 1.96x. The Z value is 3.04, and the price has just pushed up through the upper bound of the most recent 20 5m candles. More importantly, the OI: 15m +0.52%, 1h +0.33%. The notional changes are all still climbing, the percentile is at an abnormal 97.4%, and the whole pool ranks at #11.
This doesn’t look like just short covering. OI and price are rising together—more like new leveraged long positions are entering. Funding rate has also reached a high percentile recently, which suggests bullish sentiment is genuinely heating up.
However,主动成交差 (active order flow difference) is -5.2%, and the buy/sell ratio is 0.90. On the order book, sell pressure is still there. The price can be pushed up, but the active buy side hasn’t fully followed. So be careful here—whether it’s a real breakout or a bull trap depends on whether the subsequent volume/energy can keep up.
We’re approaching a historical extreme zone. It’s continued across multiple consecutive cycles, and depth has confirmed it too. In this kind of spot, it’s either acceleration—or the start of a single-direction move.
JUP This one is kind of interesting.
In the 15m timeframe, it directly surged by 1.59%, with volume reaching 1.96x. The Z value is 3.04, and the price has just pushed up through the upper bound of the most recent 20 5m candles. More importantly, the OI: 15m +0.52%, 1h +0.33%. The notional changes are all still climbing, the percentile is at an abnormal 97.4%, and the whole pool ranks at #11.
This doesn’t look like just short covering. OI and price are rising together—more like new leveraged long positions are entering. Funding rate has also reached a high percentile recently, which suggests bullish sentiment is genuinely heating up.
However,主动成交差 (active order flow difference) is -5.2%, and the buy/sell ratio is 0.90. On the order book, sell pressure is still there. The price can be pushed up, but the active buy side hasn’t fully followed. So be careful here—whether it’s a real breakout or a bull trap depends on whether the subsequent volume/energy can keep up.
We’re approaching a historical extreme zone. It’s continued across multiple consecutive cycles, and depth has confirmed it too. In this kind of spot, it’s either acceleration—or the start of a single-direction move.
In the 15m timeframe, it directly surged by 1.59%, with volume reaching 1.96x. The Z value is 3.04, and the price has just pushed up through the upper bound of the most recent 20 5m candles. More importantly, the OI: 15m +0.52%, 1h +0.33%. The notional changes are all still climbing, the percentile is at an abnormal 97.4%, and the whole pool ranks at #11.
This doesn’t look like just short covering. OI and price are rising together—more like new leveraged long positions are entering. Funding rate has also reached a high percentile recently, which suggests bullish sentiment is genuinely heating up.
However,主动成交差 (active order flow difference) is -5.2%, and the buy/sell ratio is 0.90. On the order book, sell pressure is still there. The price can be pushed up, but the active buy side hasn’t fully followed. So be careful here—whether it’s a real breakout or a bull trap depends on whether the subsequent volume/energy can keep up.
We’re approaching a historical extreme zone. It’s continued across multiple consecutive cycles, and depth has confirmed it too. In this kind of spot, it’s either acceleration—or the start of a single-direction move.
14
·
--
$PIEVERSE This move is a bit interesting.
In 15m, it jumped 4 percentage points directly. Volume reached 3.8x the normal level, Z value is above 3, buy/sell ratio from active trading is 1.53, and it closed near the top edge of the last 20 five-minute candles—classic “range edge” getting lit up.
But what really makes me take a second look is the OI: in the 15m contract, OI is -0.11% while the price is still rising, and the notional value also increased by 3.99%. This structure doesn’t look like brand-new longs charging in hard—it looks more like shorts are being forced to cover, or positions are rapidly rotating. The 1h OI only increased slightly by 0.08%, suggesting it’s not that kind of brutal, sustained leverage ramp.
The abnormal percentile is 97.4%, whole pool #1, notional change #11. 24h trading volume is 34.84M. Both the data and sentiment are pushed into extreme territory.
At a spot like this, both chasing higher and catching the falling knife feel justified. I’m not picking sides—I’ll just watch how the OI moves next. If price keeps going up, and OI doesn’t move or keeps dropping, then the nature of this move will become very clear.
$PIEVERSE This move is a bit interesting.
In 15m, it jumped 4 percentage points directly. Volume reached 3.8x the normal level, Z value is above 3, buy/sell ratio from active trading is 1.53, and it closed near the top edge of the last 20 five-minute candles—classic “range edge” getting lit up.
But what really makes me take a second look is the OI: in the 15m contract, OI is -0.11% while the price is still rising, and the notional value also increased by 3.99%. This structure doesn’t look like brand-new longs charging in hard—it looks more like shorts are being forced to cover, or positions are rapidly rotating. The 1h OI only increased slightly by 0.08%, suggesting it’s not that kind of brutal, sustained leverage ramp.
The abnormal percentile is 97.4%, whole pool #1, notional change #11. 24h trading volume is 34.84M. Both the data and sentiment are pushed into extreme territory.
At a spot like this, both chasing higher and catching the falling knife feel justified. I’m not picking sides—I’ll just watch how the OI moves next. If price keeps going up, and OI doesn’t move or keeps dropping, then the nature of this move will become very clear.
In 15m, it jumped 4 percentage points directly. Volume reached 3.8x the normal level, Z value is above 3, buy/sell ratio from active trading is 1.53, and it closed near the top edge of the last 20 five-minute candles—classic “range edge” getting lit up.
But what really makes me take a second look is the OI: in the 15m contract, OI is -0.11% while the price is still rising, and the notional value also increased by 3.99%. This structure doesn’t look like brand-new longs charging in hard—it looks more like shorts are being forced to cover, or positions are rapidly rotating. The 1h OI only increased slightly by 0.08%, suggesting it’s not that kind of brutal, sustained leverage ramp.
The abnormal percentile is 97.4%, whole pool #1, notional change #11. 24h trading volume is 34.84M. Both the data and sentiment are pushed into extreme territory.
At a spot like this, both chasing higher and catching the falling knife feel justified. I’m not picking sides—I’ll just watch how the OI moves next. If price keeps going up, and OI doesn’t move or keeps dropping, then the nature of this move will become very clear.
2

DERIVATIVES LIQUIDITY SURGES AS TOP-TIER VENUE CRACKS THE GLOBAL TOP 15 FOR $BTC 📊 ⚡
Order flow institutional depth is migrating toward cleaner execution hubs. A prominent derivatives trading venue just leaped 23 spots to claim the #11 rank globally on top analytics benchmarks, locking in a near-perfect trust rating of 9 out of 10. 📊
When serious liquidity pools expand this rapidly, smart money takes notice. Deep order books and refined execution mean tighter spreads across major pairs like $BTC , giving high-conviction traders the edge needed during volatility expansion. 🦈 ⚡
This structural shift in market share proves traders are demanding institutional-grade infrastructure over retail hype. 💡 Are you sticking to legacy platforms or migrating your size to venues offering deeper liquidity reserves? 🤔
⚠️ Not financial advice. Always manage your risk. 🛡️
🏷️ #BTC #Derivatives #Liquidity #Crypto #Trading
🦈 ⚡
DERIVATIVES LIQUIDITY SURGES AS TOP-TIER VENUE CRACKS THE GLOBAL TOP 15 FOR $BTC 📊 ⚡
Order flow institutional depth is migrating toward cleaner execution hubs. A prominent derivatives trading venue just leaped 23 spots to claim the #11 rank globally on top analytics benchmarks, locking in a near-perfect trust rating of 9 out of 10. 📊
When serious liquidity pools expand this rapidly, smart money takes notice. Deep order books and refined execution mean tighter spreads across major pairs like $BTC , giving high-conviction traders the edge needed during volatility expansion. 🦈 ⚡
This structural shift in market share proves traders are demanding institutional-grade infrastructure over retail hype. 💡 Are you sticking to legacy platforms or migrating your size to venues offering deeper liquidity reserves? 🤔
⚠️ Not financial advice. Always manage your risk. 🛡️
🏷️ #BTC #Derivatives #Liquidity #Crypto #Trading
🦈 ⚡
Order flow institutional depth is migrating toward cleaner execution hubs. A prominent derivatives trading venue just leaped 23 spots to claim the #11 rank globally on top analytics benchmarks, locking in a near-perfect trust rating of 9 out of 10. 📊
When serious liquidity pools expand this rapidly, smart money takes notice. Deep order books and refined execution mean tighter spreads across major pairs like $BTC , giving high-conviction traders the edge needed during volatility expansion. 🦈 ⚡
This structural shift in market share proves traders are demanding institutional-grade infrastructure over retail hype. 💡 Are you sticking to legacy platforms or migrating your size to venues offering deeper liquidity reserves? 🤔
⚠️ Not financial advice. Always manage your risk. 🛡️
🏷️ #BTC #Derivatives #Liquidity #Crypto #Trading
🦈 ⚡
9
·
--
$UAI This spot has something going on.
In 15m, it surged up 2.36%, and the volume directly hit 1.81x. Volatility (Z) reached 2.55. The buy/sell ratio is 1.71, and the difference in active trading is 26.1%—the bid is really sweeping, not just posting orders to look good.
But what really made me take a second look is OI. As price moves upward, OI in 15m is -0.22% and in 1h is -0.34%, yet the notional is still slightly increasing. The abnormal percentile is already at 94.6%, in the whole pool #11. This structure doesn’t look like new longs aggressively entering; it looks more like shorts are being forced to close—when it’s pumped up, not many people add leverage to chase; instead, some are withdrawing.
The closing price just broke above the upper edge of the recent 5m range of nearly 20 candles, right near the historical extreme zone. It’s been in this state for several consecutive cycles—this isn’t just a single needle.
In the past 24h, turnover is only 11.89M, and the pool isn’t very deep. At this scale, upside driven by short-covering often moves faster than that driven by long-side aggression, but it also tends to get stuck once the fuel burns out.
How many shorts are still not closed up above—that’s what I most want to know right now.
$UAI This spot has something going on.
In 15m, it surged up 2.36%, and the volume directly hit 1.81x. Volatility (Z) reached 2.55. The buy/sell ratio is 1.71, and the difference in active trading is 26.1%—the bid is really sweeping, not just posting orders to look good.
But what really made me take a second look is OI. As price moves upward, OI in 15m is -0.22% and in 1h is -0.34%, yet the notional is still slightly increasing. The abnormal percentile is already at 94.6%, in the whole pool #11. This structure doesn’t look like new longs aggressively entering; it looks more like shorts are being forced to close—when it’s pumped up, not many people add leverage to chase; instead, some are withdrawing.
The closing price just broke above the upper edge of the recent 5m range of nearly 20 candles, right near the historical extreme zone. It’s been in this state for several consecutive cycles—this isn’t just a single needle.
In the past 24h, turnover is only 11.89M, and the pool isn’t very deep. At this scale, upside driven by short-covering often moves faster than that driven by long-side aggression, but it also tends to get stuck once the fuel burns out.
How many shorts are still not closed up above—that’s what I most want to know right now.
In 15m, it surged up 2.36%, and the volume directly hit 1.81x. Volatility (Z) reached 2.55. The buy/sell ratio is 1.71, and the difference in active trading is 26.1%—the bid is really sweeping, not just posting orders to look good.
But what really made me take a second look is OI. As price moves upward, OI in 15m is -0.22% and in 1h is -0.34%, yet the notional is still slightly increasing. The abnormal percentile is already at 94.6%, in the whole pool #11. This structure doesn’t look like new longs aggressively entering; it looks more like shorts are being forced to close—when it’s pumped up, not many people add leverage to chase; instead, some are withdrawing.
The closing price just broke above the upper edge of the recent 5m range of nearly 20 candles, right near the historical extreme zone. It’s been in this state for several consecutive cycles—this isn’t just a single needle.
In the past 24h, turnover is only 11.89M, and the pool isn’t very deep. At this scale, upside driven by short-covering often moves faster than that driven by long-side aggression, but it also tends to get stuck once the fuel burns out.
How many shorts are still not closed up above—that’s what I most want to know right now.
2
·
--
See translation
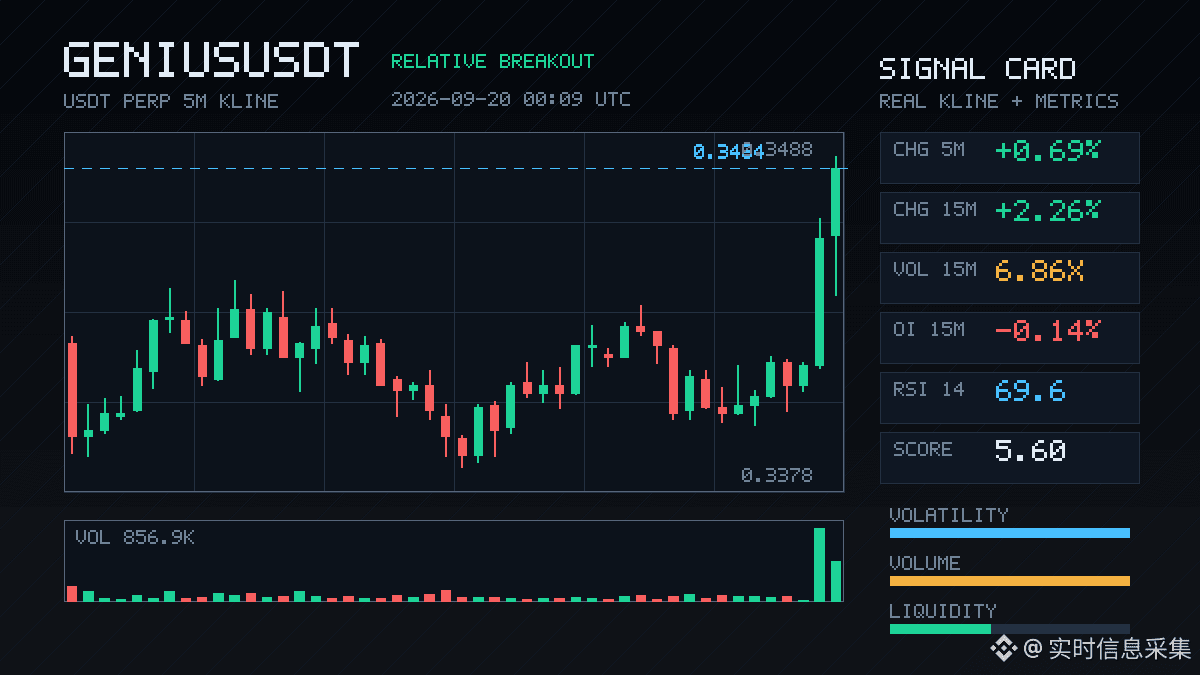
$GENIUS 15m 拉了 2.26%,量能 6.86 倍,收盘突破近 20 根 5m 区间上沿。
但 OI 是负的,1h 也在减。买卖比 0.53,主动成交差 -30.7%,拉的空间里主动买盘没跟上,撑起这波的大概率是空头回补而不是新增多头。资金费率在近期高分位,OI 异常分位 91.1%,全池排到 #11。
这种结构我不太追,更像借流动性把价格推过边界,而非趋势起点。要么等回踩确认是否还有现货接力,要么就当看戏。急着进场的注意一下买盘深度,卖单挂得很快。
$GENIUS 15m 拉了 2.26%,量能 6.86 倍,收盘突破近 20 根 5m 区间上沿。
但 OI 是负的,1h 也在减。买卖比 0.53,主动成交差 -30.7%,拉的空间里主动买盘没跟上,撑起这波的大概率是空头回补而不是新增多头。资金费率在近期高分位,OI 异常分位 91.1%,全池排到 #11。
这种结构我不太追,更像借流动性把价格推过边界,而非趋势起点。要么等回踩确认是否还有现货接力,要么就当看戏。急着进场的注意一下买盘深度,卖单挂得很快。
但 OI 是负的,1h 也在减。买卖比 0.53,主动成交差 -30.7%,拉的空间里主动买盘没跟上,撑起这波的大概率是空头回补而不是新增多头。资金费率在近期高分位,OI 异常分位 91.1%,全池排到 #11。
这种结构我不太追,更像借流动性把价格推过边界,而非趋势起点。要么等回踩确认是否还有现货接力,要么就当看戏。急着进场的注意一下买盘深度,卖单挂得很快。
62

·
--
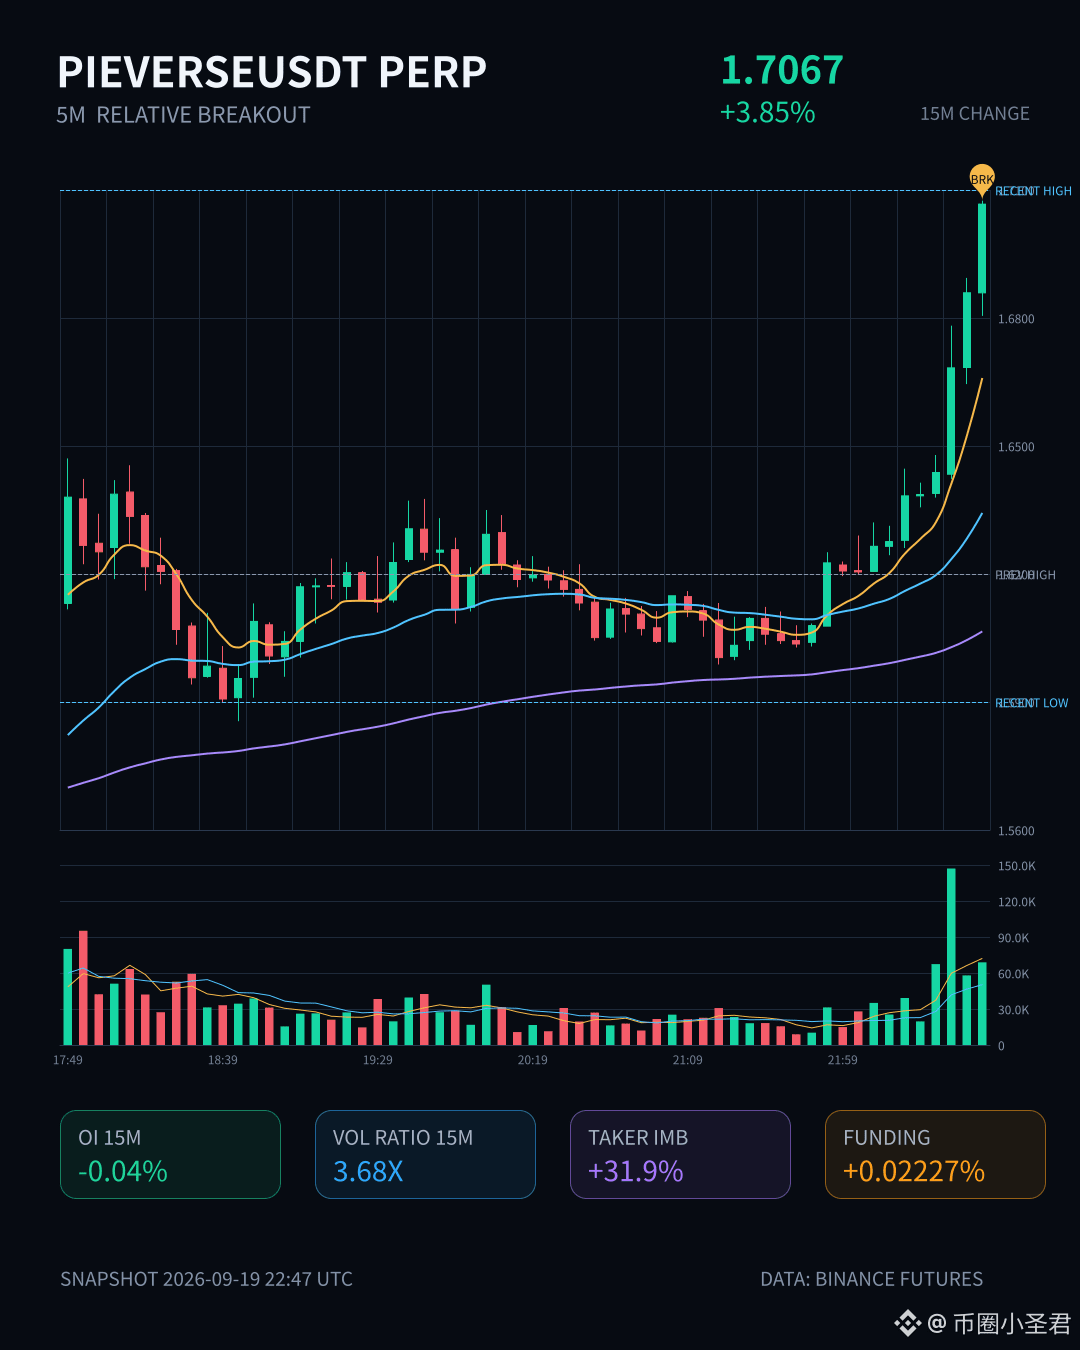
$PIEVERSE This is a bit something.
In 15m, it’s up 3.85%. The volume expanded straight to 3.68x, with a Z value of 5.59—this isn’t just a random shake.
The closing price broke above the upper edge of the recent 20 5m intervals. Aggressive traded volume difference is +31.9%, buy/sell ratio is 1.94—clearly there’s capital pushing upward.
But what’s interesting is the OI: in the 15m contracts, OI is -0.04%. While price is rising, open interest is falling. This setup looks more like short covering or passive position unwinding, not big new longs piling in.
On the 1h timeframe, OI is slightly +0.16%. The notional change is 1.39M—so it only barely counts as a continuation signal.
The abnormal percentile is 95.6%, with the whole pool at #4 and notional change at #11. It has been consistently extending across multiple consecutive cycles, and the order book depth also confirms it. Over 24h, the trading amount is 52.8M—not small.
Overall, this spot is already close to its own historical extreme range. The squeeze flavor is stronger than the trend-start signal. If you chase higher, you’d better think it through: a move pushed up by covering and buy-side support—once the covering completes, the upside “elasticity” will fade quickly. I’ll watch it for now; I’m not in a hurry to act.
$PIEVERSE This is a bit something.
In 15m, it’s up 3.85%. The volume expanded straight to 3.68x, with a Z value of 5.59—this isn’t just a random shake.
The closing price broke above the upper edge of the recent 20 5m intervals. Aggressive traded volume difference is +31.9%, buy/sell ratio is 1.94—clearly there’s capital pushing upward.
But what’s interesting is the OI: in the 15m contracts, OI is -0.04%. While price is rising, open interest is falling. This setup looks more like short covering or passive position unwinding, not big new longs piling in.
On the 1h timeframe, OI is slightly +0.16%. The notional change is 1.39M—so it only barely counts as a continuation signal.
The abnormal percentile is 95.6%, with the whole pool at #4 and notional change at #11. It has been consistently extending across multiple consecutive cycles, and the order book depth also confirms it. Over 24h, the trading amount is 52.8M—not small.
Overall, this spot is already close to its own historical extreme range. The squeeze flavor is stronger than the trend-start signal. If you chase higher, you’d better think it through: a move pushed up by covering and buy-side support—once the covering completes, the upside “elasticity” will fade quickly. I’ll watch it for now; I’m not in a hurry to act.
In 15m, it’s up 3.85%. The volume expanded straight to 3.68x, with a Z value of 5.59—this isn’t just a random shake.
The closing price broke above the upper edge of the recent 20 5m intervals. Aggressive traded volume difference is +31.9%, buy/sell ratio is 1.94—clearly there’s capital pushing upward.
But what’s interesting is the OI: in the 15m contracts, OI is -0.04%. While price is rising, open interest is falling. This setup looks more like short covering or passive position unwinding, not big new longs piling in.
On the 1h timeframe, OI is slightly +0.16%. The notional change is 1.39M—so it only barely counts as a continuation signal.
The abnormal percentile is 95.6%, with the whole pool at #4 and notional change at #11. It has been consistently extending across multiple consecutive cycles, and the order book depth also confirms it. Over 24h, the trading amount is 52.8M—not small.
Overall, this spot is already close to its own historical extreme range. The squeeze flavor is stronger than the trend-start signal. If you chase higher, you’d better think it through: a move pushed up by covering and buy-side support—once the covering completes, the upside “elasticity” will fade quickly. I’ll watch it for now; I’m not in a hurry to act.
19
·
--
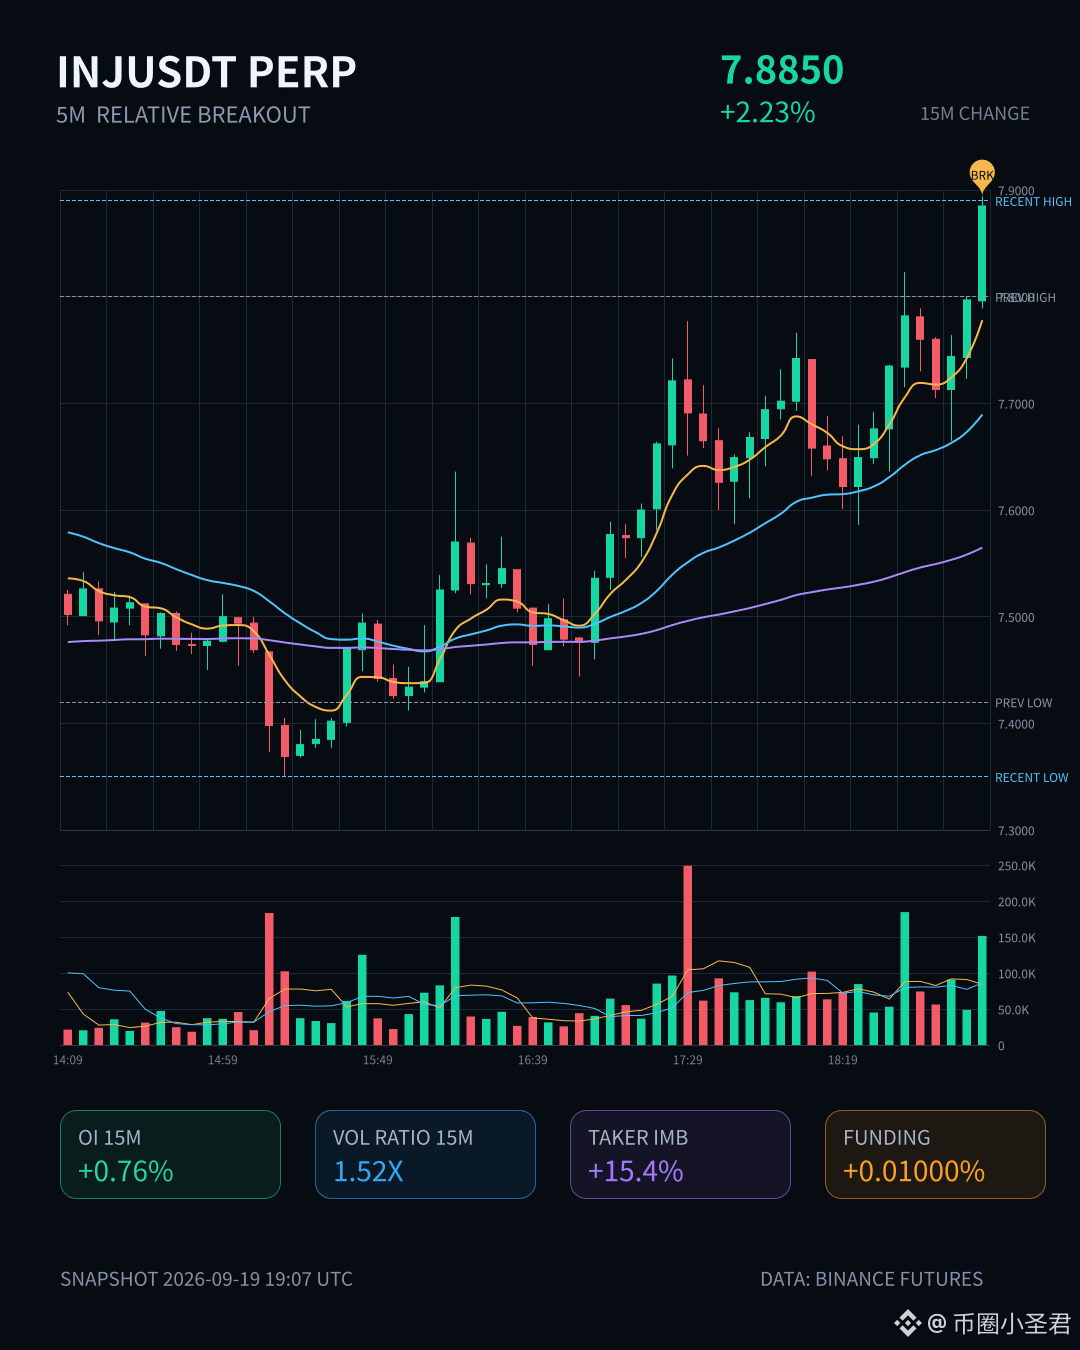
$INJ There’s something interesting about this 15m around midnight. +2.23% isn’t too crazy, but volume is 1.52x, and the volatility (Z) is pushed up to 2.51—definitely not just a random drawn channel.
The key is that OI moved up in sync, up +0.76%, with nominal +1.05M. Price is up and open interest is also up—classic incremental leveraged long entries. Meanwhile, OI over the last 1h actually dipped slightly, suggesting this push is more like new short-term capital rushing in rather than old positions gradually lying out.
The closing price has already broken above the upper boundary of the last ~20 5m range. Passive/active deal imbalance is +15.4%, and the buy-sell ratio is 1.36—active buying is dominant, and depth confirms it as well. OI’s abnormal percentile is 96.4%, the whole pool is #5. This name change is #11; at this time of night with liquidity like this, it’s already on the front end.
In the last 24h, turnover is 142.8M—enough liquidity. At this spot near the historical extreme range, it’s easiest to see wick/tail pokes, and it could also trigger acceleration. I’m watching whether it can hold. If it can’t, then it’s a fake breakout. If it does hold, there won’t be many reference points above it.
$INJ There’s something interesting about this 15m around midnight. +2.23% isn’t too crazy, but volume is 1.52x, and the volatility (Z) is pushed up to 2.51—definitely not just a random drawn channel.
The key is that OI moved up in sync, up +0.76%, with nominal +1.05M. Price is up and open interest is also up—classic incremental leveraged long entries. Meanwhile, OI over the last 1h actually dipped slightly, suggesting this push is more like new short-term capital rushing in rather than old positions gradually lying out.
The closing price has already broken above the upper boundary of the last ~20 5m range. Passive/active deal imbalance is +15.4%, and the buy-sell ratio is 1.36—active buying is dominant, and depth confirms it as well. OI’s abnormal percentile is 96.4%, the whole pool is #5. This name change is #11; at this time of night with liquidity like this, it’s already on the front end.
In the last 24h, turnover is 142.8M—enough liquidity. At this spot near the historical extreme range, it’s easiest to see wick/tail pokes, and it could also trigger acceleration. I’m watching whether it can hold. If it can’t, then it’s a fake breakout. If it does hold, there won’t be many reference points above it.
The key is that OI moved up in sync, up +0.76%, with nominal +1.05M. Price is up and open interest is also up—classic incremental leveraged long entries. Meanwhile, OI over the last 1h actually dipped slightly, suggesting this push is more like new short-term capital rushing in rather than old positions gradually lying out.
The closing price has already broken above the upper boundary of the last ~20 5m range. Passive/active deal imbalance is +15.4%, and the buy-sell ratio is 1.36—active buying is dominant, and depth confirms it as well. OI’s abnormal percentile is 96.4%, the whole pool is #5. This name change is #11; at this time of night with liquidity like this, it’s already on the front end.
In the last 24h, turnover is 142.8M—enough liquidity. At this spot near the historical extreme range, it’s easiest to see wick/tail pokes, and it could also trigger acceleration. I’m watching whether it can hold. If it can’t, then it’s a fake breakout. If it does hold, there won’t be many reference points above it.
1
64
·
--
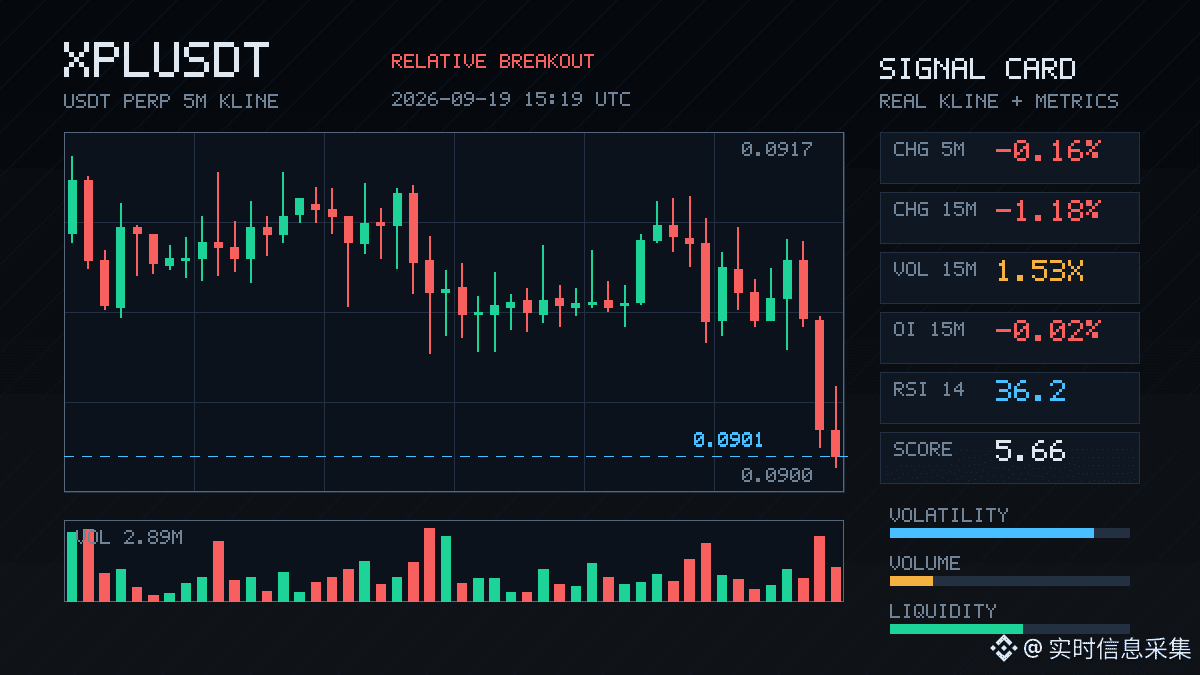
$XPL This drop is a bit brutal—on the 15m chart it’s already down -1.18%. Trading volume surged to 1.53x, with volatility Z at 3.39. The market is clearly not calm.
Looking closely at the structure, it resembles long-side deleveraging more than anything—OI on both the 15m and 1h is falling. Notional has shrunk by over 500k U. Active trading is down -46.5%, the buy/sell ratio is 0.36. Sell pressure is dominant, but positions are also being pulled back—there’s a strong “stop-loss and contraction” vibe.
The closing price has already broken below the lower bound of the last ~20 5m K-bars. The funding rate is still in the high percentile recently. OI’s percentile is abnormal at 95%, and the anomaly is #11 across the whole pool. This signal has been continuing across multiple consecutive cycles, and depth has also confirmed it—it’s not just a single wick.
Don’t rush to pick up longs in a deleveraging setup like this. Wait until the OI stabilizes before deciding.
$XPL This drop is a bit brutal—on the 15m chart it’s already down -1.18%. Trading volume surged to 1.53x, with volatility Z at 3.39. The market is clearly not calm.
Looking closely at the structure, it resembles long-side deleveraging more than anything—OI on both the 15m and 1h is falling. Notional has shrunk by over 500k U. Active trading is down -46.5%, the buy/sell ratio is 0.36. Sell pressure is dominant, but positions are also being pulled back—there’s a strong “stop-loss and contraction” vibe.
The closing price has already broken below the lower bound of the last ~20 5m K-bars. The funding rate is still in the high percentile recently. OI’s percentile is abnormal at 95%, and the anomaly is #11 across the whole pool. This signal has been continuing across multiple consecutive cycles, and depth has also confirmed it—it’s not just a single wick.
Don’t rush to pick up longs in a deleveraging setup like this. Wait until the OI stabilizes before deciding.
Looking closely at the structure, it resembles long-side deleveraging more than anything—OI on both the 15m and 1h is falling. Notional has shrunk by over 500k U. Active trading is down -46.5%, the buy/sell ratio is 0.36. Sell pressure is dominant, but positions are also being pulled back—there’s a strong “stop-loss and contraction” vibe.
The closing price has already broken below the lower bound of the last ~20 5m K-bars. The funding rate is still in the high percentile recently. OI’s percentile is abnormal at 95%, and the anomaly is #11 across the whole pool. This signal has been continuing across multiple consecutive cycles, and depth has also confirmed it—it’s not just a single wick.
Don’t rush to pick up longs in a deleveraging setup like this. Wait until the OI stabilizes before deciding.
7

·
--
$XMR This spot is kind of interesting.
In the 15m timeframe, it pulled up 1.64%, and the volume directly surged to 2.54x. The Z value is 3.40—this isn’t the kind of drizzle-like fluctuation. The key point is that the close broke above the upper edge of the past 20 consecutive 5m intervals, with an aggressive成交差 (aggressive trade difference) of +20.5%. The buy-sell ratio is 1.52, which is tilted bullish.
Even more interesting is the OI (open interest)—15m +0.17%, 1h +0.58%. While the absolute change isn’t explosive, the abnormal percentile is already at 93.5%. It’s ranked #11 in the abnormal list across the whole pool, and it’s been continuing for multiple consecutive periods. Price is rising while OI is rising—this combination looks more like new leveraged long positions are entering, not shorts getting squeezed.
In 24h terms, the成交额 (trading value) is 151M, and the depth is sufficient—not some fake breakout stabbed up by a single needle. This signal near its own historical extreme range is also worth keeping an eye on. XMR usually doesn’t move much; when it does, it often isn’t a small play.
First, see whether it can hold above the upper edge of this 5m range. If it can’t, it’s just a trap. If it can, then look for whether the move continues.
$XMR This spot is kind of interesting.
In the 15m timeframe, it pulled up 1.64%, and the volume directly surged to 2.54x. The Z value is 3.40—this isn’t the kind of drizzle-like fluctuation. The key point is that the close broke above the upper edge of the past 20 consecutive 5m intervals, with an aggressive成交差 (aggressive trade difference) of +20.5%. The buy-sell ratio is 1.52, which is tilted bullish.
Even more interesting is the OI (open interest)—15m +0.17%, 1h +0.58%. While the absolute change isn’t explosive, the abnormal percentile is already at 93.5%. It’s ranked #11 in the abnormal list across the whole pool, and it’s been continuing for multiple consecutive periods. Price is rising while OI is rising—this combination looks more like new leveraged long positions are entering, not shorts getting squeezed.
In 24h terms, the成交额 (trading value) is 151M, and the depth is sufficient—not some fake breakout stabbed up by a single needle. This signal near its own historical extreme range is also worth keeping an eye on. XMR usually doesn’t move much; when it does, it often isn’t a small play.
First, see whether it can hold above the upper edge of this 5m range. If it can’t, it’s just a trap. If it can, then look for whether the move continues.
In the 15m timeframe, it pulled up 1.64%, and the volume directly surged to 2.54x. The Z value is 3.40—this isn’t the kind of drizzle-like fluctuation. The key point is that the close broke above the upper edge of the past 20 consecutive 5m intervals, with an aggressive成交差 (aggressive trade difference) of +20.5%. The buy-sell ratio is 1.52, which is tilted bullish.
Even more interesting is the OI (open interest)—15m +0.17%, 1h +0.58%. While the absolute change isn’t explosive, the abnormal percentile is already at 93.5%. It’s ranked #11 in the abnormal list across the whole pool, and it’s been continuing for multiple consecutive periods. Price is rising while OI is rising—this combination looks more like new leveraged long positions are entering, not shorts getting squeezed.
In 24h terms, the成交额 (trading value) is 151M, and the depth is sufficient—not some fake breakout stabbed up by a single needle. This signal near its own historical extreme range is also worth keeping an eye on. XMR usually doesn’t move much; when it does, it often isn’t a small play.
First, see whether it can hold above the upper edge of this 5m range. If it can’t, it’s just a trap. If it can, then look for whether the move continues.
3
·
--
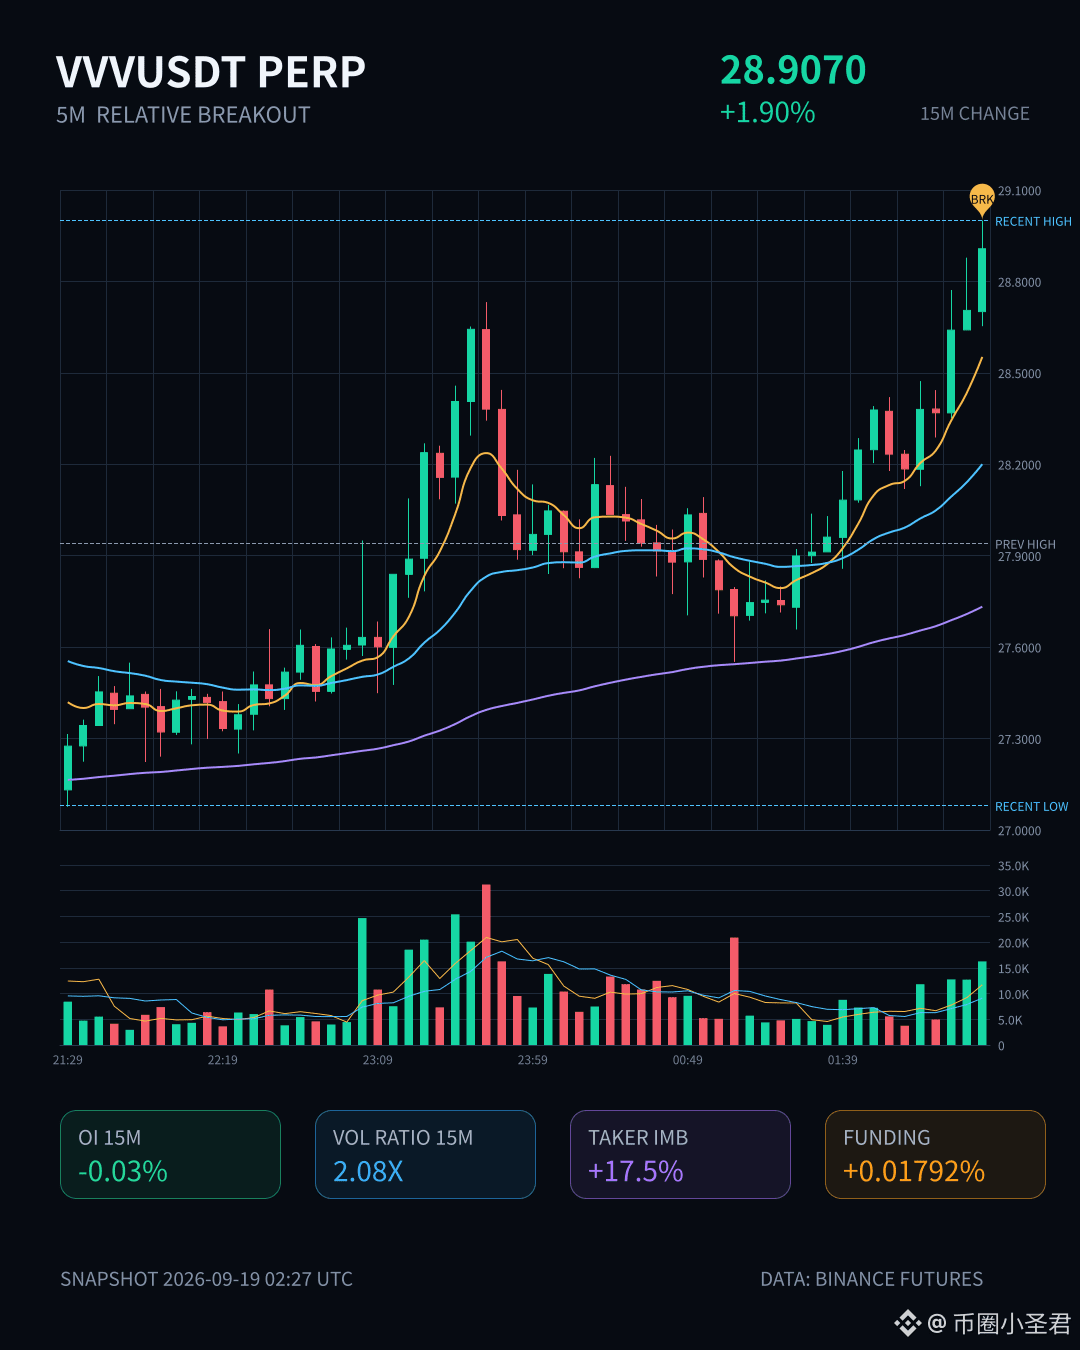
$VVV This move is kind of interesting.
The price pushed up by 1.9%, while volume directly surged to more than 2x. In the 5m close, it strongly broke through the upper edge of nearly 20 K-lines. But take a closer look at OI—on the 15m timeframe it’s actually negative, -0.03%.
So what does that indicate? This push upward doesn’t really look like fresh longs actively opening positions. It’s more like shorts are being forced into covering. Active buy/sell is 1.42, and active traded volume is 17.5% lower—buyers are indeed leading, but open interest didn’t keep up.
Instead, if you look at the 1h chart, OI turns slightly positive again, +0.28%, with nominal change of 1.28M. So my understanding is: in the short cycle, this is old positions being covered, while in the medium cycle, capital is slowly stepping in.
The OI abnormal percentile is 93.1%, ranking #11 across the whole pool; nominal change ranks #22. This is already an extreme zone. And it isn’t an isolated outlier of a single timeframe—multiple consecutive cycles are continuing, with volume higher than normal, and the price just happens to be pressing right up against the boundary of the recent range.
In other words, short covering can push the price up, but after it’s done, if there’s no new wave of fresh longs to take over, it’s just a pulse. Right now OI isn’t surging with heavy volume, so I lean toward observing first to see whether the upper end of this range can hold. If it holds, there’s still room. If it can’t, then once the covering is finished, it will likely disperse.
No rush to chase—let it move on its own.
$VVV This move is kind of interesting.
The price pushed up by 1.9%, while volume directly surged to more than 2x. In the 5m close, it strongly broke through the upper edge of nearly 20 K-lines. But take a closer look at OI—on the 15m timeframe it’s actually negative, -0.03%.
So what does that indicate? This push upward doesn’t really look like fresh longs actively opening positions. It’s more like shorts are being forced into covering. Active buy/sell is 1.42, and active traded volume is 17.5% lower—buyers are indeed leading, but open interest didn’t keep up.
Instead, if you look at the 1h chart, OI turns slightly positive again, +0.28%, with nominal change of 1.28M. So my understanding is: in the short cycle, this is old positions being covered, while in the medium cycle, capital is slowly stepping in.
The OI abnormal percentile is 93.1%, ranking #11 across the whole pool; nominal change ranks #22. This is already an extreme zone. And it isn’t an isolated outlier of a single timeframe—multiple consecutive cycles are continuing, with volume higher than normal, and the price just happens to be pressing right up against the boundary of the recent range.
In other words, short covering can push the price up, but after it’s done, if there’s no new wave of fresh longs to take over, it’s just a pulse. Right now OI isn’t surging with heavy volume, so I lean toward observing first to see whether the upper end of this range can hold. If it holds, there’s still room. If it can’t, then once the covering is finished, it will likely disperse.
No rush to chase—let it move on its own.
The price pushed up by 1.9%, while volume directly surged to more than 2x. In the 5m close, it strongly broke through the upper edge of nearly 20 K-lines. But take a closer look at OI—on the 15m timeframe it’s actually negative, -0.03%.
So what does that indicate? This push upward doesn’t really look like fresh longs actively opening positions. It’s more like shorts are being forced into covering. Active buy/sell is 1.42, and active traded volume is 17.5% lower—buyers are indeed leading, but open interest didn’t keep up.
Instead, if you look at the 1h chart, OI turns slightly positive again, +0.28%, with nominal change of 1.28M. So my understanding is: in the short cycle, this is old positions being covered, while in the medium cycle, capital is slowly stepping in.
The OI abnormal percentile is 93.1%, ranking #11 across the whole pool; nominal change ranks #22. This is already an extreme zone. And it isn’t an isolated outlier of a single timeframe—multiple consecutive cycles are continuing, with volume higher than normal, and the price just happens to be pressing right up against the boundary of the recent range.
In other words, short covering can push the price up, but after it’s done, if there’s no new wave of fresh longs to take over, it’s just a pulse. Right now OI isn’t surging with heavy volume, so I lean toward observing first to see whether the upper end of this range can hold. If it holds, there’s still room. If it can’t, then once the covering is finished, it will likely disperse.
No rush to chase—let it move on its own.
20
·
--
ONDO has something here.
In 15m, it jumped straight up by 1.5%, with volume reaching 4.3 times the average, Z value at 2.89. This isn’t that kind of stealthy pump—there’s real volume smashing in.
More importantly is OI—15m +0.63%, 1h +0.95%. The cumulative nominal increase is over 3.0 million U. The abnormal percentile is 95.8%, ranking #11 in the whole pool. The price is up while OI is also up; new leveraged long positions are entering. Structurally, it’s more solid than a pure spot-driven pull.
The closing price has already pierced the upper edge of the most recent 20 of the 5m candles. The buy/sell ratio is 1.18, active trading is 8.2% lower, and the funding rate is also at a high percentile recently—bullish sentiment is definitely heating up.
But one reminder: an abnormal percentile hitting 95.8% means it’s already close to its own historical extreme zone. With the funding rate high plus OI still climbing, chasing here is basically handing other people the leverage. Either wait for a pullback to confirm, or follow with a light position—don’t go all in.
24h turnover is 160M. The pool seems relatively active; keep watching OI changes. If price holds sideways but OI keeps rising, be careful.
ONDO has something here.
In 15m, it jumped straight up by 1.5%, with volume reaching 4.3 times the average, Z value at 2.89. This isn’t that kind of stealthy pump—there’s real volume smashing in.
More importantly is OI—15m +0.63%, 1h +0.95%. The cumulative nominal increase is over 3.0 million U. The abnormal percentile is 95.8%, ranking #11 in the whole pool. The price is up while OI is also up; new leveraged long positions are entering. Structurally, it’s more solid than a pure spot-driven pull.
The closing price has already pierced the upper edge of the most recent 20 of the 5m candles. The buy/sell ratio is 1.18, active trading is 8.2% lower, and the funding rate is also at a high percentile recently—bullish sentiment is definitely heating up.
But one reminder: an abnormal percentile hitting 95.8% means it’s already close to its own historical extreme zone. With the funding rate high plus OI still climbing, chasing here is basically handing other people the leverage. Either wait for a pullback to confirm, or follow with a light position—don’t go all in.
24h turnover is 160M. The pool seems relatively active; keep watching OI changes. If price holds sideways but OI keeps rising, be careful.
In 15m, it jumped straight up by 1.5%, with volume reaching 4.3 times the average, Z value at 2.89. This isn’t that kind of stealthy pump—there’s real volume smashing in.
More importantly is OI—15m +0.63%, 1h +0.95%. The cumulative nominal increase is over 3.0 million U. The abnormal percentile is 95.8%, ranking #11 in the whole pool. The price is up while OI is also up; new leveraged long positions are entering. Structurally, it’s more solid than a pure spot-driven pull.
The closing price has already pierced the upper edge of the most recent 20 of the 5m candles. The buy/sell ratio is 1.18, active trading is 8.2% lower, and the funding rate is also at a high percentile recently—bullish sentiment is definitely heating up.
But one reminder: an abnormal percentile hitting 95.8% means it’s already close to its own historical extreme zone. With the funding rate high plus OI still climbing, chasing here is basically handing other people the leverage. Either wait for a pullback to confirm, or follow with a light position—don’t go all in.
24h turnover is 160M. The pool seems relatively active; keep watching OI changes. If price holds sideways but OI keeps rising, be careful.
12
·
--
ZRO This wave is getting a bit serious.
On the 15m, it pulled directly +1.51%, with volume hitting 4.59x. OI 15m +0.41%, 1h +0.54%. Both sides show a structure of fresh leveraged long entries. The abnormal percentile is 95.8%, whole pool #11.
Price broke above the upper edge of the last ~20 consecutive 5m ranges; aggressive trade flow difference is +3.0%, and the buy/sell ratio is 1.06. The funding rate has already been in the high percentile range recently.
With this kind of setup, either it keeps squeezing higher, or the fuel has already been stacked enough. Keep watching.
ZRO This wave is getting a bit serious.
On the 15m, it pulled directly +1.51%, with volume hitting 4.59x. OI 15m +0.41%, 1h +0.54%. Both sides show a structure of fresh leveraged long entries. The abnormal percentile is 95.8%, whole pool #11.
Price broke above the upper edge of the last ~20 consecutive 5m ranges; aggressive trade flow difference is +3.0%, and the buy/sell ratio is 1.06. The funding rate has already been in the high percentile range recently.
With this kind of setup, either it keeps squeezing higher, or the fuel has already been stacked enough. Keep watching.
On the 15m, it pulled directly +1.51%, with volume hitting 4.59x. OI 15m +0.41%, 1h +0.54%. Both sides show a structure of fresh leveraged long entries. The abnormal percentile is 95.8%, whole pool #11.
Price broke above the upper edge of the last ~20 consecutive 5m ranges; aggressive trade flow difference is +3.0%, and the buy/sell ratio is 1.06. The funding rate has already been in the high percentile range recently.
With this kind of setup, either it keeps squeezing higher, or the fuel has already been stacked enough. Keep watching.
·
--
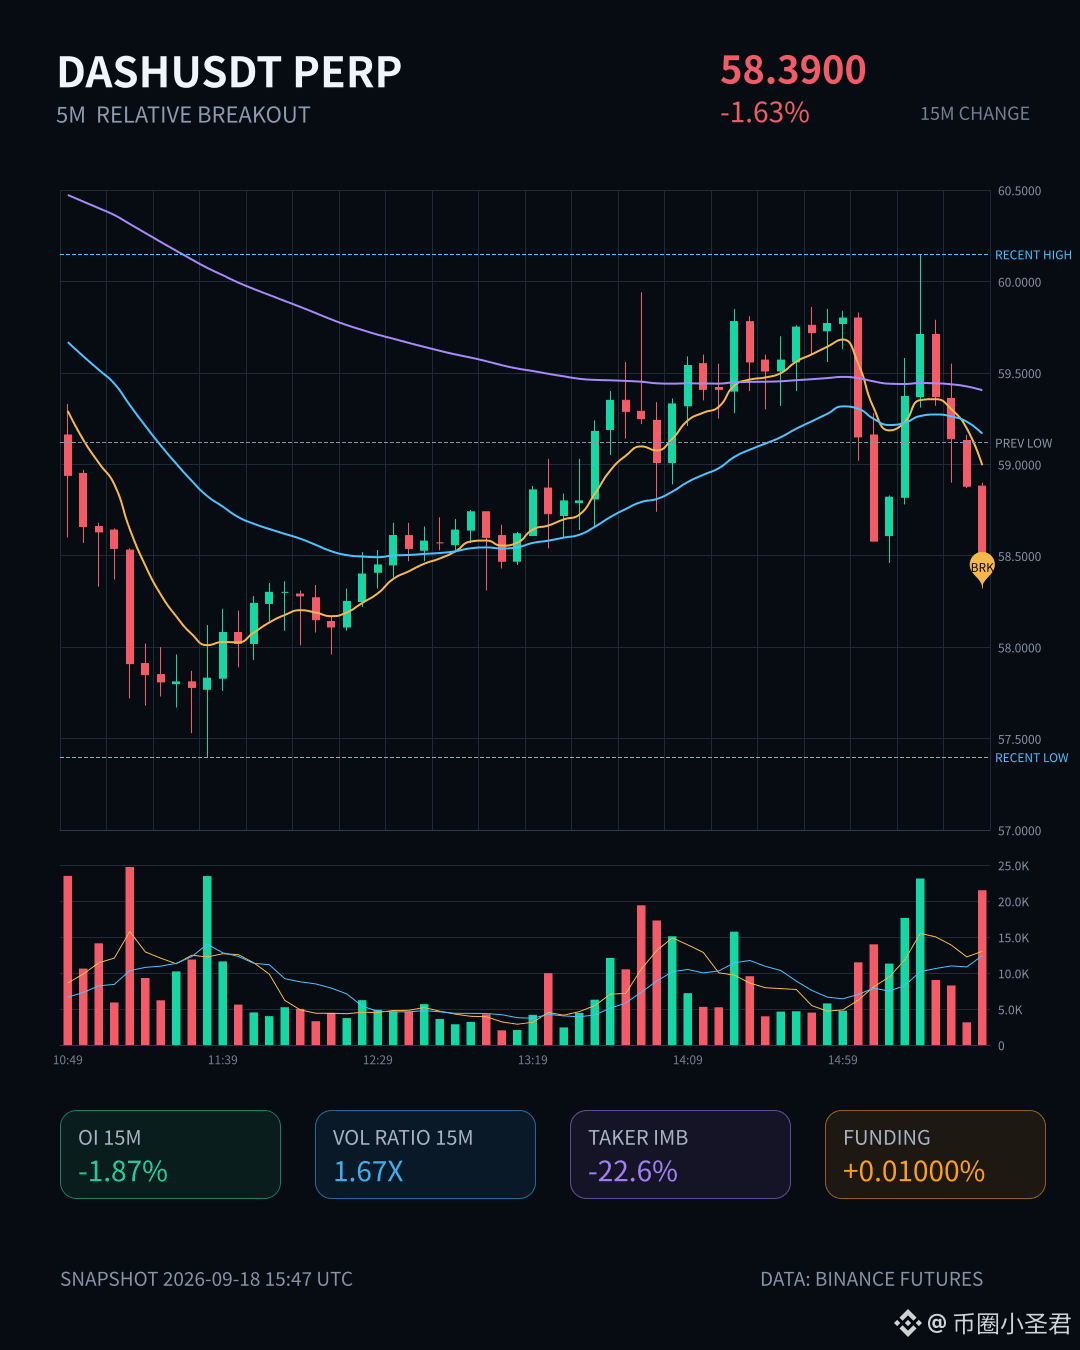
$DASH This drop is a bit sudden.
On the 15m timeframe, it’s down -1.63% with volume at 1.67x, and the Z value is 2.42—not the kind of slow bleed where you get cut gradually. It looks like someone is rushing to exit. Active buys vs. sells are 0.63: selling pressure is heavier, and the price has already broken below the lower band of the past ~20 5m candles.
But looking at OI: on 15m, OI is -1.87%; on 1h, -0.91%; and the notional change is close to -3%. Price is down + OI is down + active selling is up. This isn’t new short entries—it’s more like longs are deleveraging, getting stopped out, and reducing positions. Money is moving out, not getting pumped in.
OI’s abnormal percentile is 97%—the whole pool is #11, notional change is #16. Multiple consecutive periods are continuing. In plain terms, the position structure is being forcibly reshuffled. The funding rate is still in a high percentile recently—earlier longs got squeezed too full; now it’s repayment time.
DASH itself is already near a historical extreme zone. 24h trading value is a bit over 140M. At a spot like this, either it accelerates the bottoming process, or it serves as the starting point for the next round of repricing. I won’t catch the falling knife for now—I’ll watch whether OI keeps dropping. Once it bottoms out, then we can talk.
$DASH This drop is a bit sudden.
On the 15m timeframe, it’s down -1.63% with volume at 1.67x, and the Z value is 2.42—not the kind of slow bleed where you get cut gradually. It looks like someone is rushing to exit. Active buys vs. sells are 0.63: selling pressure is heavier, and the price has already broken below the lower band of the past ~20 5m candles.
But looking at OI: on 15m, OI is -1.87%; on 1h, -0.91%; and the notional change is close to -3%. Price is down + OI is down + active selling is up. This isn’t new short entries—it’s more like longs are deleveraging, getting stopped out, and reducing positions. Money is moving out, not getting pumped in.
OI’s abnormal percentile is 97%—the whole pool is #11, notional change is #16. Multiple consecutive periods are continuing. In plain terms, the position structure is being forcibly reshuffled. The funding rate is still in a high percentile recently—earlier longs got squeezed too full; now it’s repayment time.
DASH itself is already near a historical extreme zone. 24h trading value is a bit over 140M. At a spot like this, either it accelerates the bottoming process, or it serves as the starting point for the next round of repricing. I won’t catch the falling knife for now—I’ll watch whether OI keeps dropping. Once it bottoms out, then we can talk.
On the 15m timeframe, it’s down -1.63% with volume at 1.67x, and the Z value is 2.42—not the kind of slow bleed where you get cut gradually. It looks like someone is rushing to exit. Active buys vs. sells are 0.63: selling pressure is heavier, and the price has already broken below the lower band of the past ~20 5m candles.
But looking at OI: on 15m, OI is -1.87%; on 1h, -0.91%; and the notional change is close to -3%. Price is down + OI is down + active selling is up. This isn’t new short entries—it’s more like longs are deleveraging, getting stopped out, and reducing positions. Money is moving out, not getting pumped in.
OI’s abnormal percentile is 97%—the whole pool is #11, notional change is #16. Multiple consecutive periods are continuing. In plain terms, the position structure is being forcibly reshuffled. The funding rate is still in a high percentile recently—earlier longs got squeezed too full; now it’s repayment time.
DASH itself is already near a historical extreme zone. 24h trading value is a bit over 140M. At a spot like this, either it accelerates the bottoming process, or it serves as the starting point for the next round of repricing. I won’t catch the falling knife for now—I’ll watch whether OI keeps dropping. Once it bottoms out, then we can talk.
16
·
--
$XPL This order book has something interesting.
On the 15m timeframe it’s up 1.12% with volume at 1.63x. It doesn’t look overly dramatic at first glance, but what made me look twice is the OI (open interest)—15m OI +0.43%, 1h OI +1.84%. The nominal change is 659K and 1.43M respectively, and the anomalous percentile is already at 97.6%, ranking #11 across the whole pool.
This isn’t just a simple short covering move. Price and OI are being lifted together—more like someone is adding leverage from this level and pushing higher.
And it’s not just a one-off wick. Multiple consecutive periods are continuing the move: the closing price has already broken above the upper limit of the past 20 consecutive 5m candles. Active trade value is +11%, buy/sell ratio is 1.25, and the funding rate is also sitting in the higher percentiles recently. Depth checks are basically all confirmed.
In the past 24h, traded volume is 46.3M—not small. The question now is: has this just started, or is it already approaching its historical extreme zone? After all, the trigger type is written as relative_breakout, and the position itself isn’t low.
For now I won’t chase. I’ll first see whether this 15m candle can hold above the upper band. If it can, we’ll talk again; if it can’t, it’s the classic script of a fake breakout.
$XPL This order book has something interesting.
On the 15m timeframe it’s up 1.12% with volume at 1.63x. It doesn’t look overly dramatic at first glance, but what made me look twice is the OI (open interest)—15m OI +0.43%, 1h OI +1.84%. The nominal change is 659K and 1.43M respectively, and the anomalous percentile is already at 97.6%, ranking #11 across the whole pool.
This isn’t just a simple short covering move. Price and OI are being lifted together—more like someone is adding leverage from this level and pushing higher.
And it’s not just a one-off wick. Multiple consecutive periods are continuing the move: the closing price has already broken above the upper limit of the past 20 consecutive 5m candles. Active trade value is +11%, buy/sell ratio is 1.25, and the funding rate is also sitting in the higher percentiles recently. Depth checks are basically all confirmed.
In the past 24h, traded volume is 46.3M—not small. The question now is: has this just started, or is it already approaching its historical extreme zone? After all, the trigger type is written as relative_breakout, and the position itself isn’t low.
For now I won’t chase. I’ll first see whether this 15m candle can hold above the upper band. If it can, we’ll talk again; if it can’t, it’s the classic script of a fake breakout.
On the 15m timeframe it’s up 1.12% with volume at 1.63x. It doesn’t look overly dramatic at first glance, but what made me look twice is the OI (open interest)—15m OI +0.43%, 1h OI +1.84%. The nominal change is 659K and 1.43M respectively, and the anomalous percentile is already at 97.6%, ranking #11 across the whole pool.
This isn’t just a simple short covering move. Price and OI are being lifted together—more like someone is adding leverage from this level and pushing higher.
And it’s not just a one-off wick. Multiple consecutive periods are continuing the move: the closing price has already broken above the upper limit of the past 20 consecutive 5m candles. Active trade value is +11%, buy/sell ratio is 1.25, and the funding rate is also sitting in the higher percentiles recently. Depth checks are basically all confirmed.
In the past 24h, traded volume is 46.3M—not small. The question now is: has this just started, or is it already approaching its historical extreme zone? After all, the trigger type is written as relative_breakout, and the position itself isn’t low.
For now I won’t chase. I’ll first see whether this 15m candle can hold above the upper band. If it can, we’ll talk again; if it can’t, it’s the classic script of a fake breakout.
1
Log in to explore more content
Join global crypto users on Binance Square
⚡️ Get latest and useful information about crypto.
💬 Trusted by the world’s largest crypto exchange.
👍 Discover real insights from verified creators.
Email / Phone number
Trending Topics
1
#NEARRisesNearly80%InAWeek
7,365 views
474 Discussing
2
#MultiversXPlansHardForkRecovery
8,575 views
405 Discussing
3
#CircleLaunchesInstitutionalBTCBackedBorrowing
11,248 views
543 Discussing
4
#BitcoinHits$85K
14,348 views
236 Discussing
5
#ZetaChainVotesToMigrateZETAToSolana
9,399 views
335 Discussing
6
#ECBStartsBlockchainEuroSettlement
23,803 views
629 Discussing
7
#SouthAfricaProposesCryptoExchangeControls
36,415 views
812 Discussing
8
#SolanaCutsTargetSlotTimeTo250ms
38,344 views
724 Discussing
9
#EthereumSurpasses$2700
24,638 views
223 Discussing
10
#CanaryFilesSecondAmendmentForStakedSEIETF
54,223 views
1,059 Discussing