
#32
32
5,115 views
78 Discussing
Hot
Latest

·
--
BTC Holds 1K Amidst Market CalmSui (SUIUSDT) is trending right now!
Rank: #32
BTC today hovering at **1,232** with a slight **-0.26%** drop 📉. ETH also steady at **,635**, down **-0.14%**. Volumes are decent, but action's muted. I'm thinking this calmness might be a sign of a bigger move coming soon! Are we gearing up for a breakout or a fakeout? 🤔
#bitcoin #ethereum #crypto
BTC Holds 1K Amidst Market Calm
Sui (SUIUSDT) is trending right now!
Rank: #32
BTC today hovering at **1,232** with a slight **-0.26%** drop 📉. ETH also steady at **,635**, down **-0.14%**. Volumes are decent, but action's muted. I'm thinking this calmness might be a sign of a bigger move coming soon! Are we gearing up for a breakout or a fakeout? 🤔
#bitcoin #ethereum #crypto
Rank: #32
BTC today hovering at **1,232** with a slight **-0.26%** drop 📉. ETH also steady at **,635**, down **-0.14%**. Volumes are decent, but action's muted. I'm thinking this calmness might be a sign of a bigger move coming soon! Are we gearing up for a breakout or a fakeout? 🤔
#bitcoin #ethereum #crypto
10

·
--
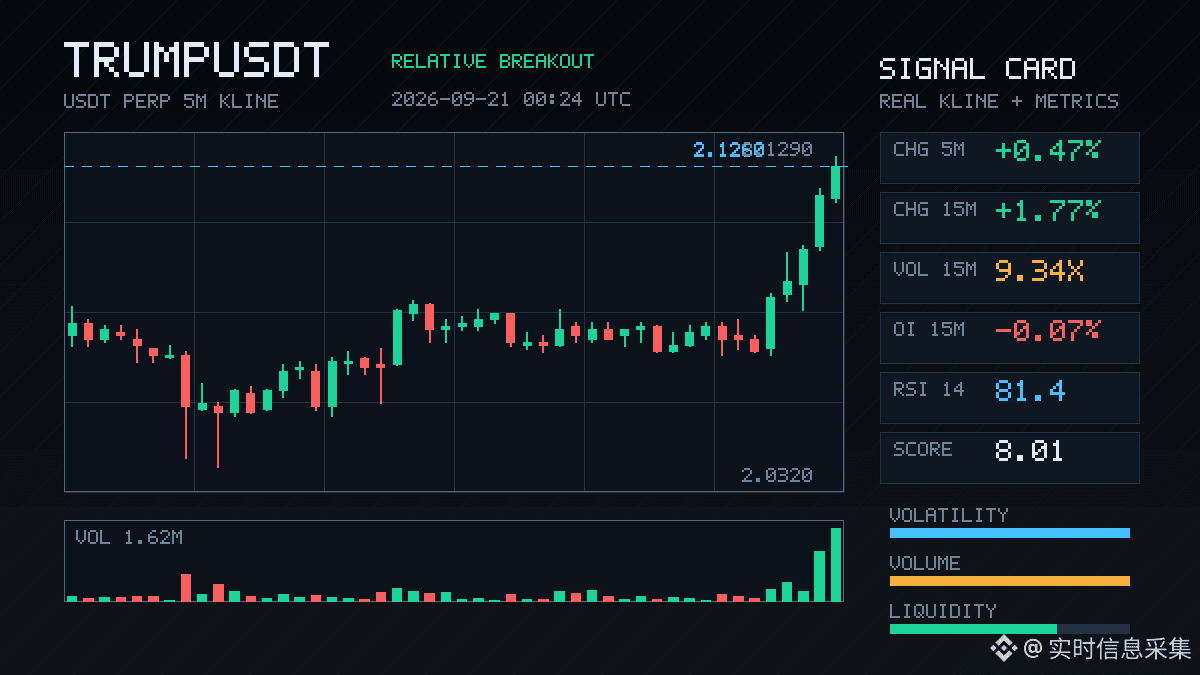
$TRUMP 15mThis move is kind of interesting—the volume pushed directly to 9.34x, the active buy/sell ratio is 1.52, and the closing price broke above the highs of the upper edges of the latest 20+ 5m candles.
But pay attention to one detail: as the price is rising, the OI on the 15m is actually -0.07%. This isn’t the structure of fresh long entry. It looks more like short covering or older positions getting pulled along passively. OI on the 1h is slightly turned positive at +0.18%, nominal change of 1.51M—not exactly “crazy” adding.
The abnormal percentile is 95.2%, ranking #32 in the whole pool, nominal change ranked #22—quite high, but not at the very top tier.
My understanding is: a squeeze in an extreme range—volume confirmed it, and depth confirmed it too. But OI didn’t keep up. This looks more like a momentum/feeling pulse rather than a trend starting. 24h trading value is 121M; the pool is thick enough. Still, before chasing higher, think clearly about one question—after shorts cover, who’s going to carry the baton next?
Watch the OI: if price keeps moving while OI starts rising in sync, then that’s the real signal.
$TRUMP 15mThis move is kind of interesting—the volume pushed directly to 9.34x, the active buy/sell ratio is 1.52, and the closing price broke above the highs of the upper edges of the latest 20+ 5m candles.
But pay attention to one detail: as the price is rising, the OI on the 15m is actually -0.07%. This isn’t the structure of fresh long entry. It looks more like short covering or older positions getting pulled along passively. OI on the 1h is slightly turned positive at +0.18%, nominal change of 1.51M—not exactly “crazy” adding.
The abnormal percentile is 95.2%, ranking #32 in the whole pool, nominal change ranked #22—quite high, but not at the very top tier.
My understanding is: a squeeze in an extreme range—volume confirmed it, and depth confirmed it too. But OI didn’t keep up. This looks more like a momentum/feeling pulse rather than a trend starting. 24h trading value is 121M; the pool is thick enough. Still, before chasing higher, think clearly about one question—after shorts cover, who’s going to carry the baton next?
Watch the OI: if price keeps moving while OI starts rising in sync, then that’s the real signal.
But pay attention to one detail: as the price is rising, the OI on the 15m is actually -0.07%. This isn’t the structure of fresh long entry. It looks more like short covering or older positions getting pulled along passively. OI on the 1h is slightly turned positive at +0.18%, nominal change of 1.51M—not exactly “crazy” adding.
The abnormal percentile is 95.2%, ranking #32 in the whole pool, nominal change ranked #22—quite high, but not at the very top tier.
My understanding is: a squeeze in an extreme range—volume confirmed it, and depth confirmed it too. But OI didn’t keep up. This looks more like a momentum/feeling pulse rather than a trend starting. 24h trading value is 121M; the pool is thick enough. Still, before chasing higher, think clearly about one question—after shorts cover, who’s going to carry the baton next?
Watch the OI: if price keeps moving while OI starts rising in sync, then that’s the real signal.
128

·
--
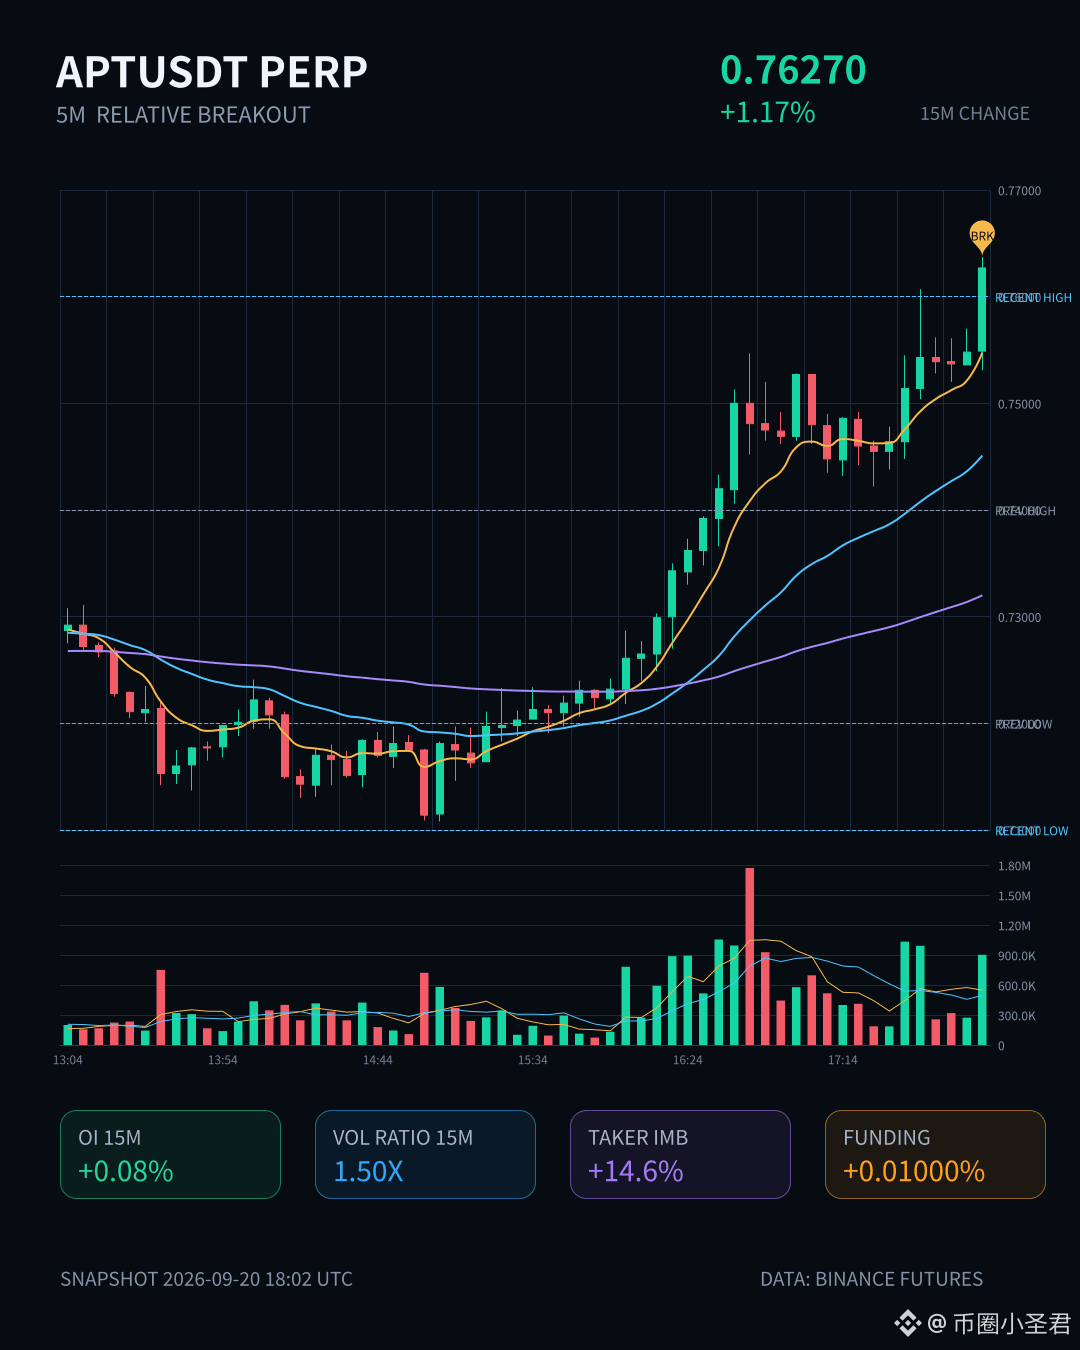
APT This round is kind of interesting.
On the 15m timeframe, it surged 1.17%, with volume at 1.5x. The closing price even directly chewed through nearly 20 of the 5m upper boundary lines. The proactive trading imbalance is +14.6%, and the buy-sell ratio is 1.34. The bids came in with direction—not some fake breakout propped up by idle limit orders.
Even more importantly, OI is lifting at the same time. 15m +0.08%, 1h +0.68%, with nominal increase of over 500k U. Price is up, positions are up—this is a classic case of incremental leveraged longs entering, not short covering pushing price. The abnormal percentile is 83.5%, ranked #20 across the whole pool, and nominal change is #32. It’s not the most explosive tier, but within APT’s liquidity, this amount is definitely worth watching.
In the past 24h, turnover is 64.6M. Depth confirmation looks fine; the volume is higher than usual, and the boundary breakout isn’t just a needle-through.
Of course, with only 1h OI up 0.68%, leverage is still somewhat restrained—not the kind of structure that rockets straight to the sky in one go. Whether it can continue will depend on whether there’s a pullback-and-confirm after the 5m upper boundary breakout—don’t let it get slapped back the moment the session opens.
Just watch it for now; don’t chase the price.
APT This round is kind of interesting.
On the 15m timeframe, it surged 1.17%, with volume at 1.5x. The closing price even directly chewed through nearly 20 of the 5m upper boundary lines. The proactive trading imbalance is +14.6%, and the buy-sell ratio is 1.34. The bids came in with direction—not some fake breakout propped up by idle limit orders.
Even more importantly, OI is lifting at the same time. 15m +0.08%, 1h +0.68%, with nominal increase of over 500k U. Price is up, positions are up—this is a classic case of incremental leveraged longs entering, not short covering pushing price. The abnormal percentile is 83.5%, ranked #20 across the whole pool, and nominal change is #32. It’s not the most explosive tier, but within APT’s liquidity, this amount is definitely worth watching.
In the past 24h, turnover is 64.6M. Depth confirmation looks fine; the volume is higher than usual, and the boundary breakout isn’t just a needle-through.
Of course, with only 1h OI up 0.68%, leverage is still somewhat restrained—not the kind of structure that rockets straight to the sky in one go. Whether it can continue will depend on whether there’s a pullback-and-confirm after the 5m upper boundary breakout—don’t let it get slapped back the moment the session opens.
Just watch it for now; don’t chase the price.
On the 15m timeframe, it surged 1.17%, with volume at 1.5x. The closing price even directly chewed through nearly 20 of the 5m upper boundary lines. The proactive trading imbalance is +14.6%, and the buy-sell ratio is 1.34. The bids came in with direction—not some fake breakout propped up by idle limit orders.
Even more importantly, OI is lifting at the same time. 15m +0.08%, 1h +0.68%, with nominal increase of over 500k U. Price is up, positions are up—this is a classic case of incremental leveraged longs entering, not short covering pushing price. The abnormal percentile is 83.5%, ranked #20 across the whole pool, and nominal change is #32. It’s not the most explosive tier, but within APT’s liquidity, this amount is definitely worth watching.
In the past 24h, turnover is 64.6M. Depth confirmation looks fine; the volume is higher than usual, and the boundary breakout isn’t just a needle-through.
Of course, with only 1h OI up 0.68%, leverage is still somewhat restrained—not the kind of structure that rockets straight to the sky in one go. Whether it can continue will depend on whether there’s a pullback-and-confirm after the 5m upper boundary breakout—don’t let it get slapped back the moment the session opens.
Just watch it for now; don’t chase the price.
4

·
--
$CELR This move is a little interesting.
In the 15m timeframe, it directly surged 7.66%, but the volume was only 0.92x—not the kind of blow-off breakout with huge volume, more like someone slowly pushing it. What really caught my attention is the OI: 15m +4.17%, 1h +16.88%. The abnormal percentile is as high as 99.4%, the highest in the entire pool.
Price rising + OI rising = new long positions entering the market, not shorts getting squeezed. Also, the funding rate has already reached a recent high percentile, and multiple consecutive periods have continued.
Translation: leveraged longs are piling up positions here—stacking them aggressively.
The 24h trading value is only 26M; the notional change within a thin pool jumped to #32 in the whole pool. This structure either means someone knew something in advance, or it’s a collective impulse.
I won’t comment on direction, but for the longs at this spot, the odds don’t look particularly good.
$CELR This move is a little interesting.
In the 15m timeframe, it directly surged 7.66%, but the volume was only 0.92x—not the kind of blow-off breakout with huge volume, more like someone slowly pushing it. What really caught my attention is the OI: 15m +4.17%, 1h +16.88%. The abnormal percentile is as high as 99.4%, the highest in the entire pool.
Price rising + OI rising = new long positions entering the market, not shorts getting squeezed. Also, the funding rate has already reached a recent high percentile, and multiple consecutive periods have continued.
Translation: leveraged longs are piling up positions here—stacking them aggressively.
The 24h trading value is only 26M; the notional change within a thin pool jumped to #32 in the whole pool. This structure either means someone knew something in advance, or it’s a collective impulse.
I won’t comment on direction, but for the longs at this spot, the odds don’t look particularly good.
In the 15m timeframe, it directly surged 7.66%, but the volume was only 0.92x—not the kind of blow-off breakout with huge volume, more like someone slowly pushing it. What really caught my attention is the OI: 15m +4.17%, 1h +16.88%. The abnormal percentile is as high as 99.4%, the highest in the entire pool.
Price rising + OI rising = new long positions entering the market, not shorts getting squeezed. Also, the funding rate has already reached a recent high percentile, and multiple consecutive periods have continued.
Translation: leveraged longs are piling up positions here—stacking them aggressively.
The 24h trading value is only 26M; the notional change within a thin pool jumped to #32 in the whole pool. This structure either means someone knew something in advance, or it’s a collective impulse.
I won’t comment on direction, but for the longs at this spot, the odds don’t look particularly good.
64

·
--
PENDLE, this wave is going down pretty decisively.
On the 15m chart, it’s down 0.73%, with volume hitting 1.63x, Z value at 1.75. It directly breaks below the lower band of the past 20 5m candles. The aggressive trade imbalance is -29.8%, buy/sell ratio is 0.54, and sell pressure is clearly dominant.
The key is that OI is dropping in sync—on the 15m contract -0.22%, on the 1h -0.64%, with notional down about 450k U in total. This doesn’t look like brand-new shorts entering; it’s more like longs are deleveraging—stopping out or passively shrinking positions. The abnormal percentile is 82.1%, ranking #29 in the whole pool, and the notional change ranks #32.
Over the last 24h, turnover is 27.9M, and the order-book depth confirms enough. With this kind of structure, it usually doesn’t V-reverse immediately. First, we’ll see whether the bearish momentum can stabilize.
PENDLE, this wave is going down pretty decisively.
On the 15m chart, it’s down 0.73%, with volume hitting 1.63x, Z value at 1.75. It directly breaks below the lower band of the past 20 5m candles. The aggressive trade imbalance is -29.8%, buy/sell ratio is 0.54, and sell pressure is clearly dominant.
The key is that OI is dropping in sync—on the 15m contract -0.22%, on the 1h -0.64%, with notional down about 450k U in total. This doesn’t look like brand-new shorts entering; it’s more like longs are deleveraging—stopping out or passively shrinking positions. The abnormal percentile is 82.1%, ranking #29 in the whole pool, and the notional change ranks #32.
Over the last 24h, turnover is 27.9M, and the order-book depth confirms enough. With this kind of structure, it usually doesn’t V-reverse immediately. First, we’ll see whether the bearish momentum can stabilize.
On the 15m chart, it’s down 0.73%, with volume hitting 1.63x, Z value at 1.75. It directly breaks below the lower band of the past 20 5m candles. The aggressive trade imbalance is -29.8%, buy/sell ratio is 0.54, and sell pressure is clearly dominant.
The key is that OI is dropping in sync—on the 15m contract -0.22%, on the 1h -0.64%, with notional down about 450k U in total. This doesn’t look like brand-new shorts entering; it’s more like longs are deleveraging—stopping out or passively shrinking positions. The abnormal percentile is 82.1%, ranking #29 in the whole pool, and the notional change ranks #32.
Over the last 24h, turnover is 27.9M, and the order-book depth confirms enough. With this kind of structure, it usually doesn’t V-reverse immediately. First, we’ll see whether the bearish momentum can stabilize.
5
·
--
$ON This move has some substance.
In 15m, it went straight in and gained 2.56%, with volume reaching 4.90 times the normal level. The volatility Z moved up to 4.59, and the close also stayed above the upper edge of nearly 20 5m candles. The aggressive volume difference is 34.3%, the buy/sell ratio is 2.05, and the bid is really pushing.
But there’s one detail that’s pretty interesting—when the price rises, OI actually drops. In the 15m contract: -0.18%; in the 1h: -0.22%. On the surface, the notional change looks positive, +2.37% / +2.69%, but open interest itself is shrinking. This structure doesn’t really look like fresh longs entering—it’s more like shorts being forced to cover, or older positions getting flattened.
Abnormal percentile: 84.1%, ranking #21 in the whole pool, notional change ranking #32, with 24h trading value only 8.45M. The order book isn’t big—once it’s pulled up, it’s easy; and once it gets hit down, it falls fast.
The breakout is indeed a real one. It’s just that this open-interest structure makes me hesitant to chase. Let’s first see if it can hold above the upper edge of this range. If it can’t, then it’s very likely just a round of short covering that finishes quickly.
$ON This move has some substance.
In 15m, it went straight in and gained 2.56%, with volume reaching 4.90 times the normal level. The volatility Z moved up to 4.59, and the close also stayed above the upper edge of nearly 20 5m candles. The aggressive volume difference is 34.3%, the buy/sell ratio is 2.05, and the bid is really pushing.
But there’s one detail that’s pretty interesting—when the price rises, OI actually drops. In the 15m contract: -0.18%; in the 1h: -0.22%. On the surface, the notional change looks positive, +2.37% / +2.69%, but open interest itself is shrinking. This structure doesn’t really look like fresh longs entering—it’s more like shorts being forced to cover, or older positions getting flattened.
Abnormal percentile: 84.1%, ranking #21 in the whole pool, notional change ranking #32, with 24h trading value only 8.45M. The order book isn’t big—once it’s pulled up, it’s easy; and once it gets hit down, it falls fast.
The breakout is indeed a real one. It’s just that this open-interest structure makes me hesitant to chase. Let’s first see if it can hold above the upper edge of this range. If it can’t, then it’s very likely just a round of short covering that finishes quickly.
In 15m, it went straight in and gained 2.56%, with volume reaching 4.90 times the normal level. The volatility Z moved up to 4.59, and the close also stayed above the upper edge of nearly 20 5m candles. The aggressive volume difference is 34.3%, the buy/sell ratio is 2.05, and the bid is really pushing.
But there’s one detail that’s pretty interesting—when the price rises, OI actually drops. In the 15m contract: -0.18%; in the 1h: -0.22%. On the surface, the notional change looks positive, +2.37% / +2.69%, but open interest itself is shrinking. This structure doesn’t really look like fresh longs entering—it’s more like shorts being forced to cover, or older positions getting flattened.
Abnormal percentile: 84.1%, ranking #21 in the whole pool, notional change ranking #32, with 24h trading value only 8.45M. The order book isn’t big—once it’s pulled up, it’s easy; and once it gets hit down, it falls fast.
The breakout is indeed a real one. It’s just that this open-interest structure makes me hesitant to chase. Let’s first see if it can hold above the upper edge of this range. If it can’t, then it’s very likely just a round of short covering that finishes quickly.
5

Article
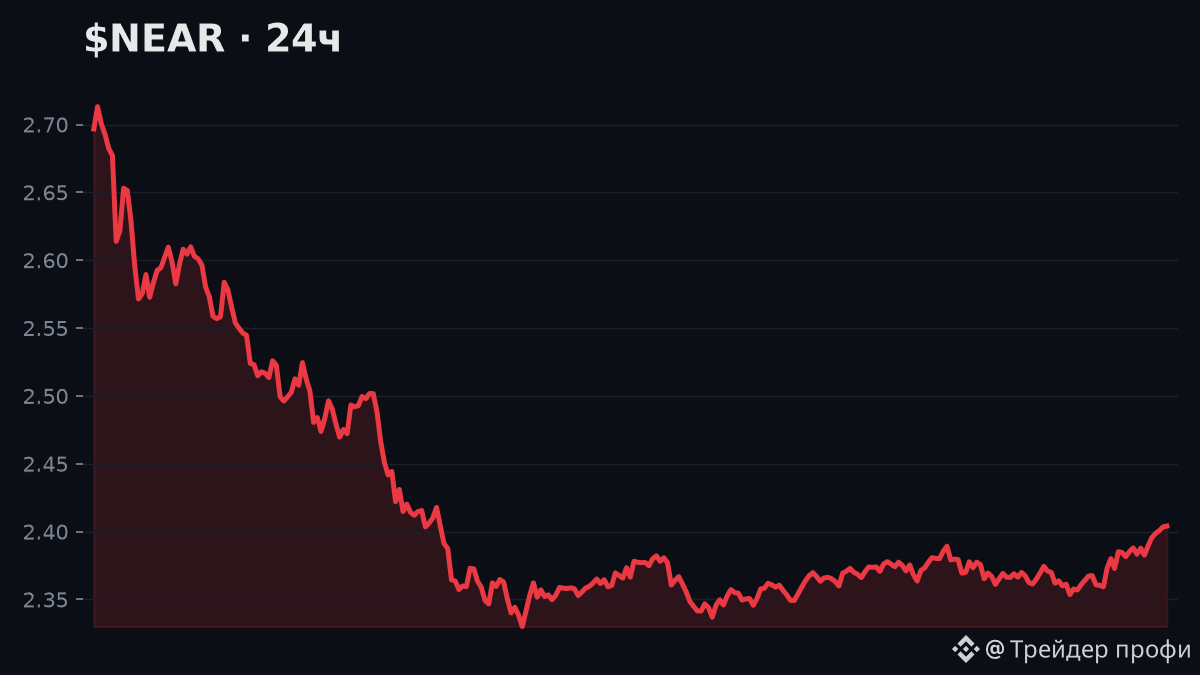
$NEAR -10.8% in 24h — delivered the worst performance of the day in the top-100!💥 $NEAR <t-10.8%> in 24h — delivered the worst performance of the day in the top-100!
The market didn’t spare everyone today. 👀
🧭 Summary: price movement is GOING AGAINST the broader trend (7d/30d in the other direction) — it looks like a short-term rebound/correction, not a trend reversal.
🌍 Market context: out of 69 major coins with notable movement in the last 24h — 🔼 17 rose, 🔽 52 fell
$NEAR -10.8% in 24h — delivered the worst performance of the day in the top-100!
💥 $NEAR <t-10.8%> in 24h — delivered the worst performance of the day in the top-100!
The market didn’t spare everyone today. 👀
🧭 Summary: price movement is GOING AGAINST the broader trend (7d/30d in the other direction) — it looks like a short-term rebound/correction, not a trend reversal.
🌍 Market context: out of 69 major coins with notable movement in the last 24h — 🔼 17 rose, 🔽 52 fell
The market didn’t spare everyone today. 👀
🧭 Summary: price movement is GOING AGAINST the broader trend (7d/30d in the other direction) — it looks like a short-term rebound/correction, not a trend reversal.
🌍 Market context: out of 69 major coins with notable movement in the last 24h — 🔼 17 rose, 🔽 52 fell
112
·
--
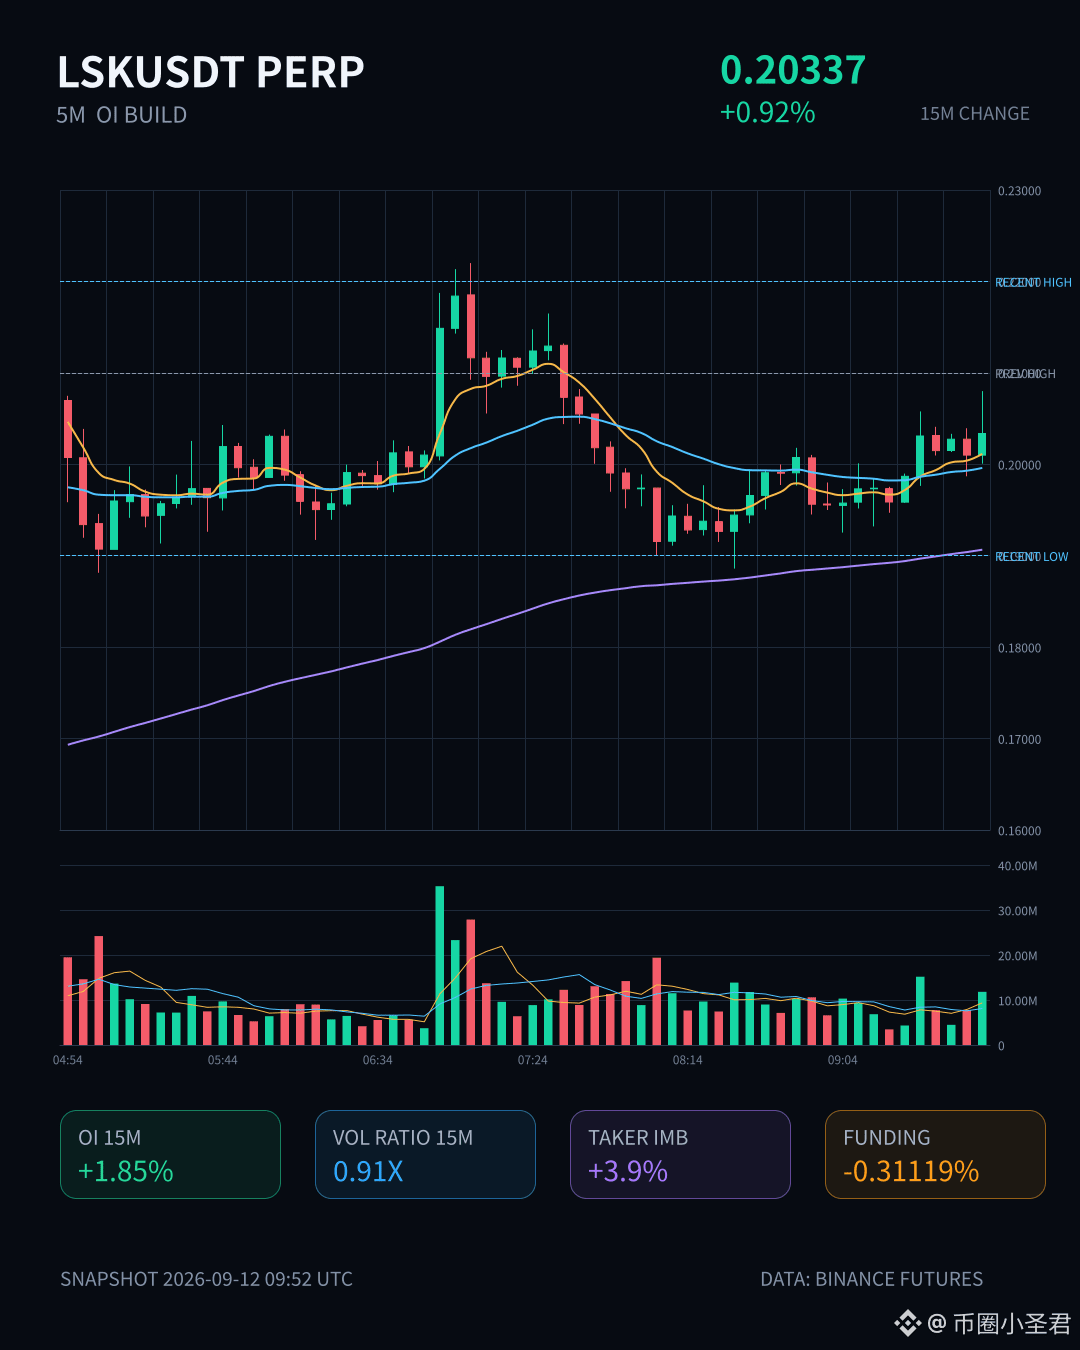
$LSK This move has some substance.
In the 15m timeframe, it’s up 0.92%, volume hasn’t exploded (0.91x), but the OI is quietly stacking—1h futures open interest is up 4.56%, notional increased by 660k U, and the full-pool notional change ranks #32.
The key is funding rates have already been pushed to the higher end of the recent range. As price rises and OI rises, this is classic leveraged long positioning getting crowded in. The aggressive buy/sell ratio is 1.08, a 3.9% gap—buys are slightly stronger, but not overly aggressive.
Over the past 24h, trading volume is a bit over 240M U, and liquidity is sufficient.
This structure is either someone has been setting things up in advance, or it’s the prelude to a squeeze. Long sentiment is already there, and high funding at these levels means volatility ahead won’t be small. Watch to see if it can break out with volume—just piling on leverage won’t hold it up.
$LSK
$LSK This move has some substance.
In the 15m timeframe, it’s up 0.92%, volume hasn’t exploded (0.91x), but the OI is quietly stacking—1h futures open interest is up 4.56%, notional increased by 660k U, and the full-pool notional change ranks #32.
The key is funding rates have already been pushed to the higher end of the recent range. As price rises and OI rises, this is classic leveraged long positioning getting crowded in. The aggressive buy/sell ratio is 1.08, a 3.9% gap—buys are slightly stronger, but not overly aggressive.
Over the past 24h, trading volume is a bit over 240M U, and liquidity is sufficient.
This structure is either someone has been setting things up in advance, or it’s the prelude to a squeeze. Long sentiment is already there, and high funding at these levels means volatility ahead won’t be small. Watch to see if it can break out with volume—just piling on leverage won’t hold it up.
$LSK
In the 15m timeframe, it’s up 0.92%, volume hasn’t exploded (0.91x), but the OI is quietly stacking—1h futures open interest is up 4.56%, notional increased by 660k U, and the full-pool notional change ranks #32.
The key is funding rates have already been pushed to the higher end of the recent range. As price rises and OI rises, this is classic leveraged long positioning getting crowded in. The aggressive buy/sell ratio is 1.08, a 3.9% gap—buys are slightly stronger, but not overly aggressive.
Over the past 24h, trading volume is a bit over 240M U, and liquidity is sufficient.
This structure is either someone has been setting things up in advance, or it’s the prelude to a squeeze. Long sentiment is already there, and high funding at these levels means volatility ahead won’t be small. Watch to see if it can break out with volume—just piling on leverage won’t hold it up.
$LSK
3
·
--
$PENDLE This drop is kind of interesting.
The price broke below the lower boundary of the most recent 20 5-minute range; on the 15m timeframe it fell 1.38%, with volume at 1.48x, the buy/sell ratio for active orders at 0.68, and selling pressure is in control. But what’s really worth watching is OI—15m -0.13%, 1h -0.36%, and the notional positions dropped by nearly 570k U.
When price falls and OI also declines, it’s not fresh short entries—it’s longs de-leveraging, with stop-losses hit and positions being reduced. The OI percentile is at 96.4%, across the whole pool #32; it has been continuing for several consecutive cycles, and the extremity is among the earlier ones.
This kind of structure is cleaner than a simple high-volume selloff. It wasn’t something being smashed—it’s insiders撤走 (withdrawing).
$PENDLE This drop is kind of interesting.
The price broke below the lower boundary of the most recent 20 5-minute range; on the 15m timeframe it fell 1.38%, with volume at 1.48x, the buy/sell ratio for active orders at 0.68, and selling pressure is in control. But what’s really worth watching is OI—15m -0.13%, 1h -0.36%, and the notional positions dropped by nearly 570k U.
When price falls and OI also declines, it’s not fresh short entries—it’s longs de-leveraging, with stop-losses hit and positions being reduced. The OI percentile is at 96.4%, across the whole pool #32; it has been continuing for several consecutive cycles, and the extremity is among the earlier ones.
This kind of structure is cleaner than a simple high-volume selloff. It wasn’t something being smashed—it’s insiders撤走 (withdrawing).
The price broke below the lower boundary of the most recent 20 5-minute range; on the 15m timeframe it fell 1.38%, with volume at 1.48x, the buy/sell ratio for active orders at 0.68, and selling pressure is in control. But what’s really worth watching is OI—15m -0.13%, 1h -0.36%, and the notional positions dropped by nearly 570k U.
When price falls and OI also declines, it’s not fresh short entries—it’s longs de-leveraging, with stop-losses hit and positions being reduced. The OI percentile is at 96.4%, across the whole pool #32; it has been continuing for several consecutive cycles, and the extremity is among the earlier ones.
This kind of structure is cleaner than a simple high-volume selloff. It wasn’t something being smashed—it’s insiders撤走 (withdrawing).
1
·
--
$BCH There’s something a bit off about the 15m.
The price drop of 0.71% isn’t that harsh, but the trading volume has directly surged to 2.5x. The Z value is 2.02—clearly someone is pushing. The key OI is also still rising: 15m +0.05%, 1h +0.03%. Combined with the price falling, this structure looks more like new shorts entering, not old longs closing out. Taker flow is worse by -43.7%, the buy/sell ratio is 0.39, and sell pressure is dominating.
By the close, the price has already broken below the lower bound of the recent ~20 5m candles. The whole pool shows an abnormality ranked up to #32, with nominal change #30; depth also confirms it. 24h trading value is 74M—there’s plenty of volume.
At this position, it’s either a fake breakout sweeping liquidity, or it really wants to move down for a stretch. I’ll just set an observation first; I’m not in a hurry to act. Let’s see whether the next 15m candle can reclaim the range.
$BCH There’s something a bit off about the 15m.
The price drop of 0.71% isn’t that harsh, but the trading volume has directly surged to 2.5x. The Z value is 2.02—clearly someone is pushing. The key OI is also still rising: 15m +0.05%, 1h +0.03%. Combined with the price falling, this structure looks more like new shorts entering, not old longs closing out. Taker flow is worse by -43.7%, the buy/sell ratio is 0.39, and sell pressure is dominating.
By the close, the price has already broken below the lower bound of the recent ~20 5m candles. The whole pool shows an abnormality ranked up to #32, with nominal change #30; depth also confirms it. 24h trading value is 74M—there’s plenty of volume.
At this position, it’s either a fake breakout sweeping liquidity, or it really wants to move down for a stretch. I’ll just set an observation first; I’m not in a hurry to act. Let’s see whether the next 15m candle can reclaim the range.
The price drop of 0.71% isn’t that harsh, but the trading volume has directly surged to 2.5x. The Z value is 2.02—clearly someone is pushing. The key OI is also still rising: 15m +0.05%, 1h +0.03%. Combined with the price falling, this structure looks more like new shorts entering, not old longs closing out. Taker flow is worse by -43.7%, the buy/sell ratio is 0.39, and sell pressure is dominating.
By the close, the price has already broken below the lower bound of the recent ~20 5m candles. The whole pool shows an abnormality ranked up to #32, with nominal change #30; depth also confirms it. 24h trading value is 74M—there’s plenty of volume.
At this position, it’s either a fake breakout sweeping liquidity, or it really wants to move down for a stretch. I’ll just set an observation first; I’m not in a hurry to act. Let’s see whether the next 15m candle can reclaim the range.
6

·
--
$RAYSOL This move on the 15m isn’t that aggressive—only 0.93%. But the contract OI is increasing on both the 15m and 1h, which is interesting. On the 1h, OI is up 2.81%, with notional of 216K U. It’s not huge, but compared to the pool’s abnormal percentile—at 82.1% and positioned at #32 —it’s not something to take lightly. The difference in aggressive executions is 30.4%, the buy/sell ratio is 1.87, and the funding rate is also at a high percentile recently. The flavor is pretty clear—not a short-covering move. More like someone is actively building leveraged long positions upward. Over 24h, trading volume is 207.92M, and the pool is deep enough that this increment likely won’t send the chart flying, but the direction is quite clear. Keep an eye on it: if OI keeps stacking and the price can’t be pushed back, there may be another stretch ahead.
$RAYSOL This move on the 15m isn’t that aggressive—only 0.93%. But the contract OI is increasing on both the 15m and 1h, which is interesting. On the 1h, OI is up 2.81%, with notional of 216K U. It’s not huge, but compared to the pool’s abnormal percentile—at 82.1% and positioned at #32 —it’s not something to take lightly. The difference in aggressive executions is 30.4%, the buy/sell ratio is 1.87, and the funding rate is also at a high percentile recently. The flavor is pretty clear—not a short-covering move. More like someone is actively building leveraged long positions upward. Over 24h, trading volume is 207.92M, and the pool is deep enough that this increment likely won’t send the chart flying, but the direction is quite clear. Keep an eye on it: if OI keeps stacking and the price can’t be pushed back, there may be another stretch ahead.
81
·
--
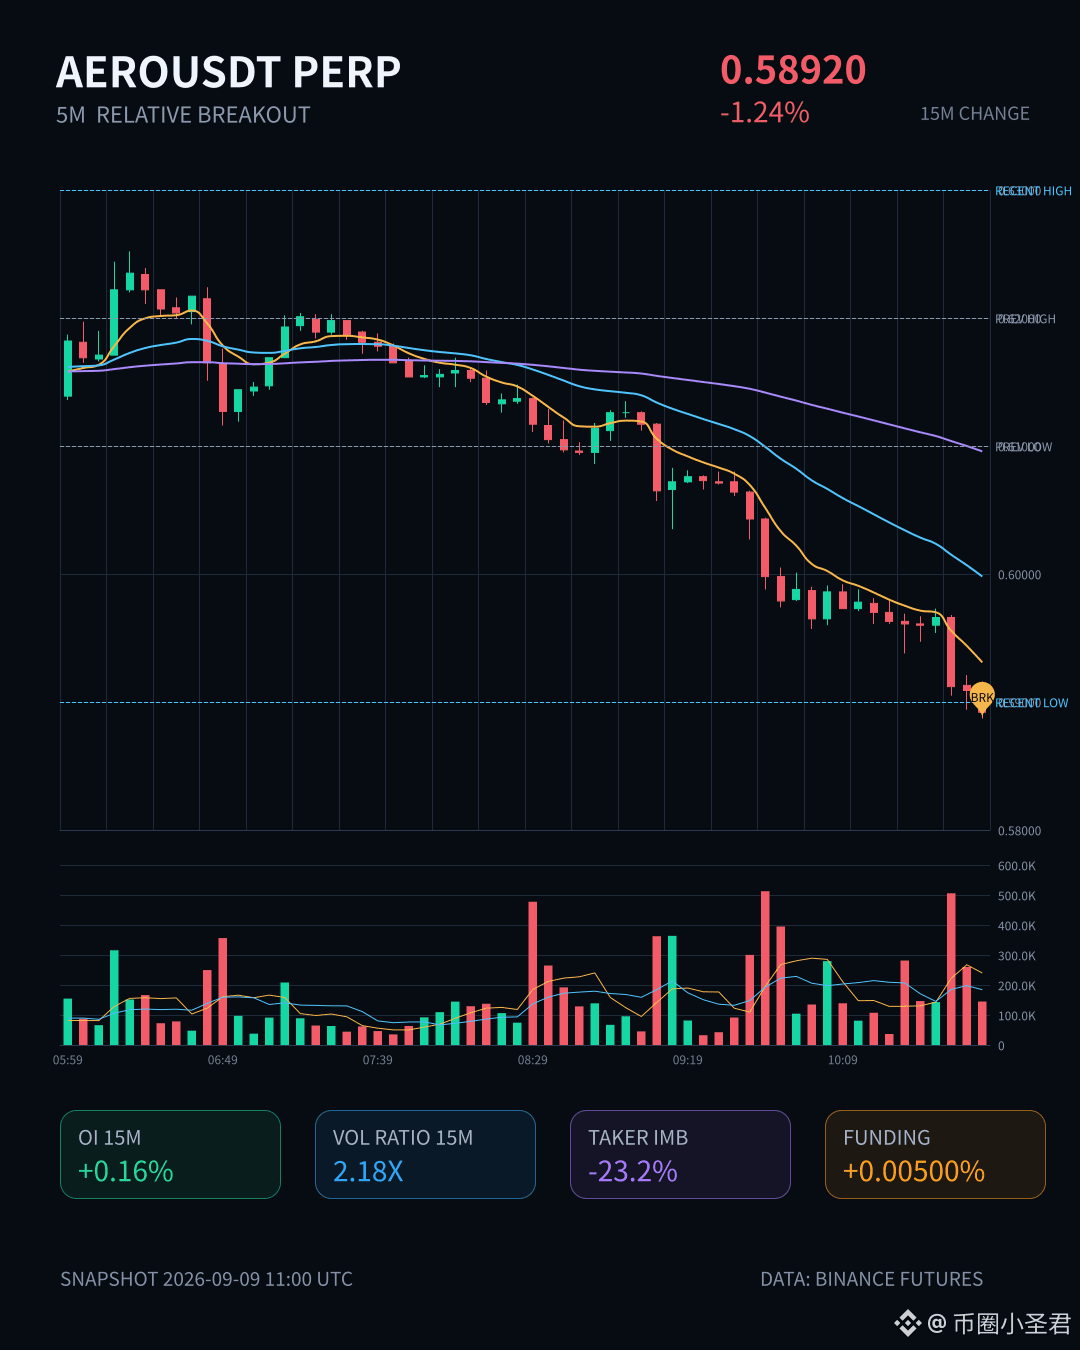
$AERO There’s quite a bit of movement this time—within 15 minutes it dropped 1.24% straight away, and the closing price even fell below the lower edge of the last 20 five-minute candlesticks. Trading volume hit 2.18x, volatility Z reached 2.29—definitely not behaving normally.
In the order book, there’s heavy sell-side pressure on the active side; the buy/sell ratio is only 0.62. The active traded amount is down -23.2%, and the shorts are smashing in rhythm. OI in the 15-minute window is still slightly up: price is down while positions are increasing, which looks more like fresh leveraged short orders entering. In the 1-hour window OI contracts a bit, but the entire pool’s abnormal count ranking is #32, nominal change is #31—so capital coordination and depth don’t look fake.
This move breaks below the range’s lower bound, so the short-term structure is bearish. But the 2.18x volume shows that there’s money trading and battling at this level. Keep an eye on it—don’t rush to catch. Wait until this wave of aggressive sell pressure runs out before deciding.
$AERO There’s quite a bit of movement this time—within 15 minutes it dropped 1.24% straight away, and the closing price even fell below the lower edge of the last 20 five-minute candlesticks. Trading volume hit 2.18x, volatility Z reached 2.29—definitely not behaving normally.
In the order book, there’s heavy sell-side pressure on the active side; the buy/sell ratio is only 0.62. The active traded amount is down -23.2%, and the shorts are smashing in rhythm. OI in the 15-minute window is still slightly up: price is down while positions are increasing, which looks more like fresh leveraged short orders entering. In the 1-hour window OI contracts a bit, but the entire pool’s abnormal count ranking is #32, nominal change is #31—so capital coordination and depth don’t look fake.
This move breaks below the range’s lower bound, so the short-term structure is bearish. But the 2.18x volume shows that there’s money trading and battling at this level. Keep an eye on it—don’t rush to catch. Wait until this wave of aggressive sell pressure runs out before deciding.
In the order book, there’s heavy sell-side pressure on the active side; the buy/sell ratio is only 0.62. The active traded amount is down -23.2%, and the shorts are smashing in rhythm. OI in the 15-minute window is still slightly up: price is down while positions are increasing, which looks more like fresh leveraged short orders entering. In the 1-hour window OI contracts a bit, but the entire pool’s abnormal count ranking is #32, nominal change is #31—so capital coordination and depth don’t look fake.
This move breaks below the range’s lower bound, so the short-term structure is bearish. But the 2.18x volume shows that there’s money trading and battling at this level. Keep an eye on it—don’t rush to catch. Wait until this wave of aggressive sell pressure runs out before deciding.
25

·
--
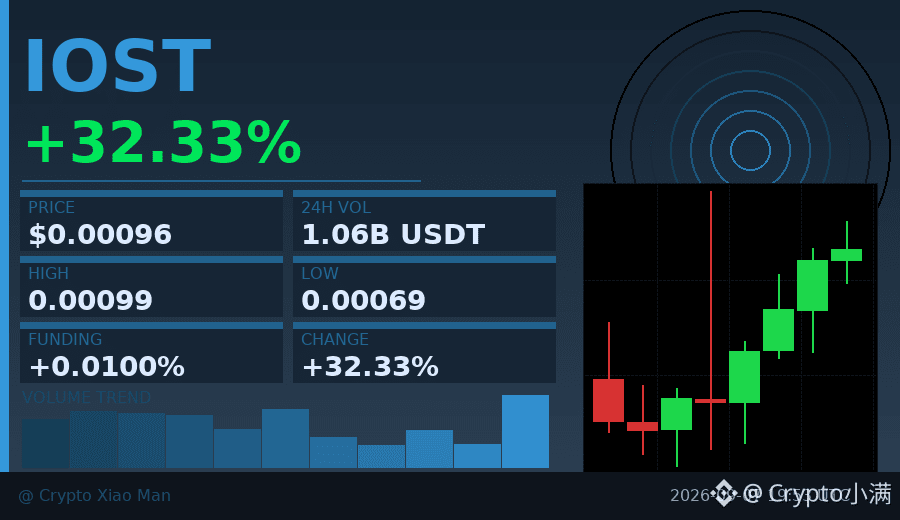
Behind the 32% surge, trading volume quietly grows to more than $100 million.
This IOST move is kind of interesting: the price is pushed up, but the funding rate is only 0.01%, and the long/short ratio of 56/44 isn’t particularly extreme. This suggests the rally isn’t built by leverage stacking, but by real money coming in.
The hourly chart keeps closing higher in consecutive days, and each step is taken fairly steadily. This kind of volume-price coordination is more worth tracking than those rallies where funding goes through the roof.
$IOST #量价分析 #32%
Click the card below to quickly check the market 👇
Behind the 32% surge, trading volume quietly grows to more than $100 million.
This IOST move is kind of interesting: the price is pushed up, but the funding rate is only 0.01%, and the long/short ratio of 56/44 isn’t particularly extreme. This suggests the rally isn’t built by leverage stacking, but by real money coming in.
The hourly chart keeps closing higher in consecutive days, and each step is taken fairly steadily. This kind of volume-price coordination is more worth tracking than those rallies where funding goes through the roof.
$IOST #量价分析 #32%
Click the card below to quickly check the market 👇
This IOST move is kind of interesting: the price is pushed up, but the funding rate is only 0.01%, and the long/short ratio of 56/44 isn’t particularly extreme. This suggests the rally isn’t built by leverage stacking, but by real money coming in.
The hourly chart keeps closing higher in consecutive days, and each step is taken fairly steadily. This kind of volume-price coordination is more worth tracking than those rallies where funding goes through the roof.
$IOST #量价分析 #32%
Click the card below to quickly check the market 👇
24
·
--
There’s a dangerous signal hidden behind the 32% surge.
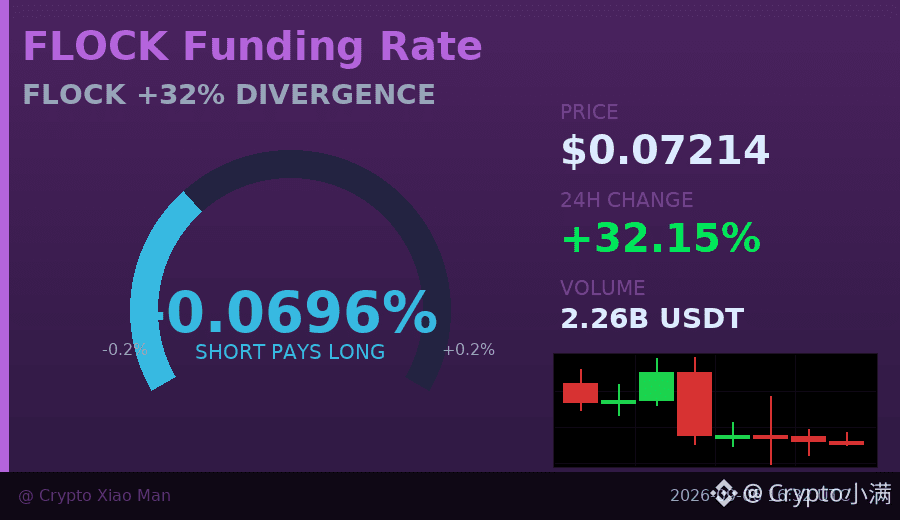
FLOCK was indeed very strong today, surging from 0.05 to 0.082 before pulling back to 0.072. A trading volume of $226 million shows that capital participation was very high. But looking more closely, the hourly chart has closed red for three consecutive candles, and the price is pulling back.
What’s even stranger is that the funding rate is negative at -0.0069%, which means shorts are paying longs. Yet open interest shows 57% longs and 43% shorts — even though longs are clearly dominant, why is the funding rate negative?
This usually means: although there are more longs on paper, the people actually opening shorts are more willing to pay the cost and hold positions, or big money is quietly shorting. Combined with three straight red hourly candles, short-term pullback pressure is building.
I’m not saying it must fall, but this divergence is worth watching. If you’ve already got profits, you could consider taking some off in stages; if you want to chase, at least wait until the hourly chart turns green again.
$FLOCK #资金费率背离 #32%涨幅
Click the small card below to quickly check the market👇
There’s a dangerous signal hidden behind the 32% surge.
FLOCK was indeed very strong today, surging from 0.05 to 0.082 before pulling back to 0.072. A trading volume of $226 million shows that capital participation was very high. But looking more closely, the hourly chart has closed red for three consecutive candles, and the price is pulling back.
What’s even stranger is that the funding rate is negative at -0.0069%, which means shorts are paying longs. Yet open interest shows 57% longs and 43% shorts — even though longs are clearly dominant, why is the funding rate negative?
This usually means: although there are more longs on paper, the people actually opening shorts are more willing to pay the cost and hold positions, or big money is quietly shorting. Combined with three straight red hourly candles, short-term pullback pressure is building.
I’m not saying it must fall, but this divergence is worth watching. If you’ve already got profits, you could consider taking some off in stages; if you want to chase, at least wait until the hourly chart turns green again.
$FLOCK #资金费率背离 #32%涨幅
Click the small card below to quickly check the market👇
FLOCK was indeed very strong today, surging from 0.05 to 0.082 before pulling back to 0.072. A trading volume of $226 million shows that capital participation was very high. But looking more closely, the hourly chart has closed red for three consecutive candles, and the price is pulling back.
What’s even stranger is that the funding rate is negative at -0.0069%, which means shorts are paying longs. Yet open interest shows 57% longs and 43% shorts — even though longs are clearly dominant, why is the funding rate negative?
This usually means: although there are more longs on paper, the people actually opening shorts are more willing to pay the cost and hold positions, or big money is quietly shorting. Combined with three straight red hourly candles, short-term pullback pressure is building.
I’m not saying it must fall, but this divergence is worth watching. If you’ve already got profits, you could consider taking some off in stages; if you want to chase, at least wait until the hourly chart turns green again.
$FLOCK #资金费率背离 #32%涨幅
Click the small card below to quickly check the market👇
16
·
--
Behind the 32% surge, capital is voting with its feet.
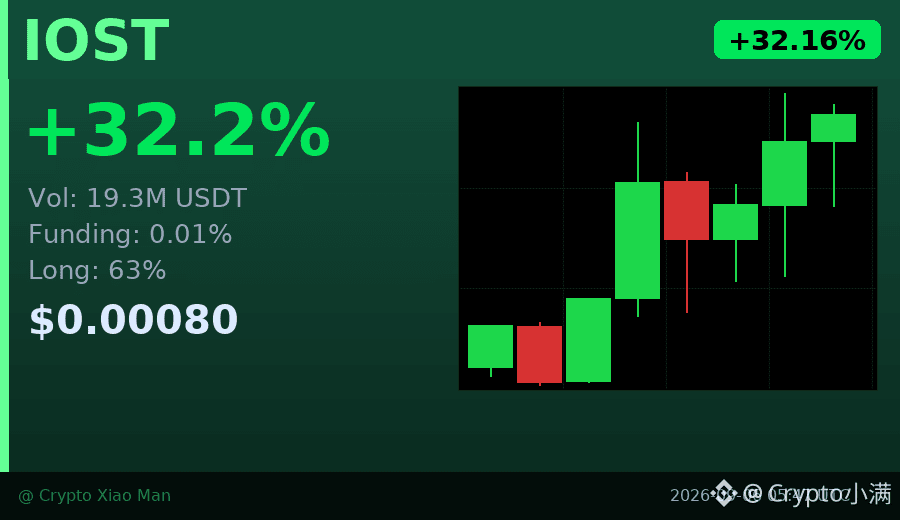
IOST’s trading volume today surged to 19.3 million USDT, and the price climbed from 0.0006058 to 0.0008014. Three consecutive bullish hourly candles show that buying pressure is not a brief spike, but a sustained entry.
The funding rate is only 0.01%, which is not considered overheated. The long-short ratio is 63% to 37%, with longs in the lead but not yet at a frenzy. This structure is actually healthy—differences of opinion leave room for further upside.
Coins that rose too sharply before often saw funding rates explode, while IOST now looks more like it is just at the start of a move.
$IOST #山寨季 #32%涨幅
Click the small card below to quickly view the market 👇
Behind the 32% surge, capital is voting with its feet.
IOST’s trading volume today surged to 19.3 million USDT, and the price climbed from 0.0006058 to 0.0008014. Three consecutive bullish hourly candles show that buying pressure is not a brief spike, but a sustained entry.
The funding rate is only 0.01%, which is not considered overheated. The long-short ratio is 63% to 37%, with longs in the lead but not yet at a frenzy. This structure is actually healthy—differences of opinion leave room for further upside.
Coins that rose too sharply before often saw funding rates explode, while IOST now looks more like it is just at the start of a move.
$IOST #山寨季 #32%涨幅
Click the small card below to quickly view the market 👇
IOST’s trading volume today surged to 19.3 million USDT, and the price climbed from 0.0006058 to 0.0008014. Three consecutive bullish hourly candles show that buying pressure is not a brief spike, but a sustained entry.
The funding rate is only 0.01%, which is not considered overheated. The long-short ratio is 63% to 37%, with longs in the lead but not yet at a frenzy. This structure is actually healthy—differences of opinion leave room for further upside.
Coins that rose too sharply before often saw funding rates explode, while IOST now looks more like it is just at the start of a move.
$IOST #山寨季 #32%涨幅
Click the small card below to quickly view the market 👇
42
·
--
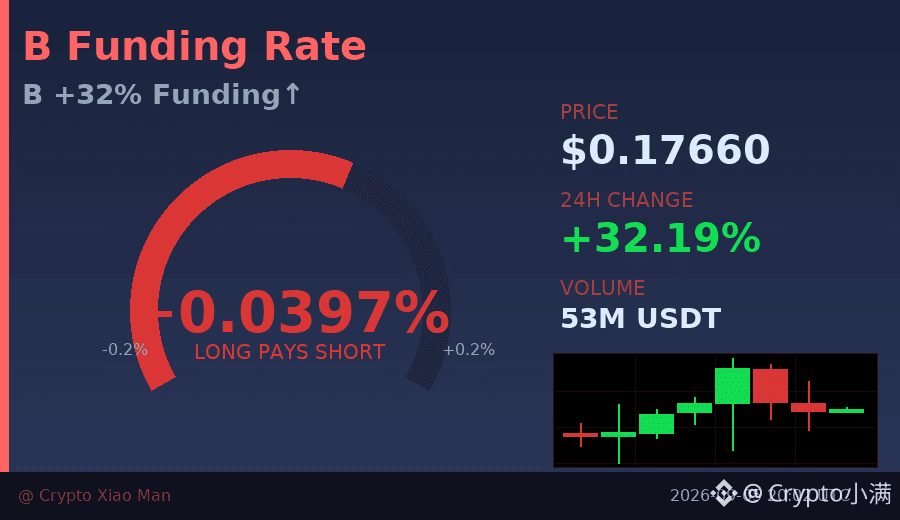
Behind the 32% surge, the funding rate has quietly risen to 0.04%.
B reached 0.228 before pulling back to 0.177, with trading volume at 52.6 million U and longs accounting for 65%. The price increase has attracted a large amount of leverage, and the rising funding rate means the cost of going long is increasing.
The candlestick chart shows the market has entered a short-term consolidation phase, so chasing longs at high levels requires caution. If the funding rate continues to climb, it may trigger a deleveraging pullback.
Watch the 0.17 support and 0.19 resistance, and wait for the market to choose a direction.
$B #资金费率警示 #32%涨幅
Click the small card below to quickly view the market👇
Behind the 32% surge, the funding rate has quietly risen to 0.04%.
B reached 0.228 before pulling back to 0.177, with trading volume at 52.6 million U and longs accounting for 65%. The price increase has attracted a large amount of leverage, and the rising funding rate means the cost of going long is increasing.
The candlestick chart shows the market has entered a short-term consolidation phase, so chasing longs at high levels requires caution. If the funding rate continues to climb, it may trigger a deleveraging pullback.
Watch the 0.17 support and 0.19 resistance, and wait for the market to choose a direction.
$B #资金费率警示 #32%涨幅
Click the small card below to quickly view the market👇
B reached 0.228 before pulling back to 0.177, with trading volume at 52.6 million U and longs accounting for 65%. The price increase has attracted a large amount of leverage, and the rising funding rate means the cost of going long is increasing.
The candlestick chart shows the market has entered a short-term consolidation phase, so chasing longs at high levels requires caution. If the funding rate continues to climb, it may trigger a deleveraging pullback.
Watch the 0.17 support and 0.19 resistance, and wait for the market to choose a direction.
$B #资金费率警示 #32%涨幅
Click the small card below to quickly view the market👇
10

·
--
Bearish
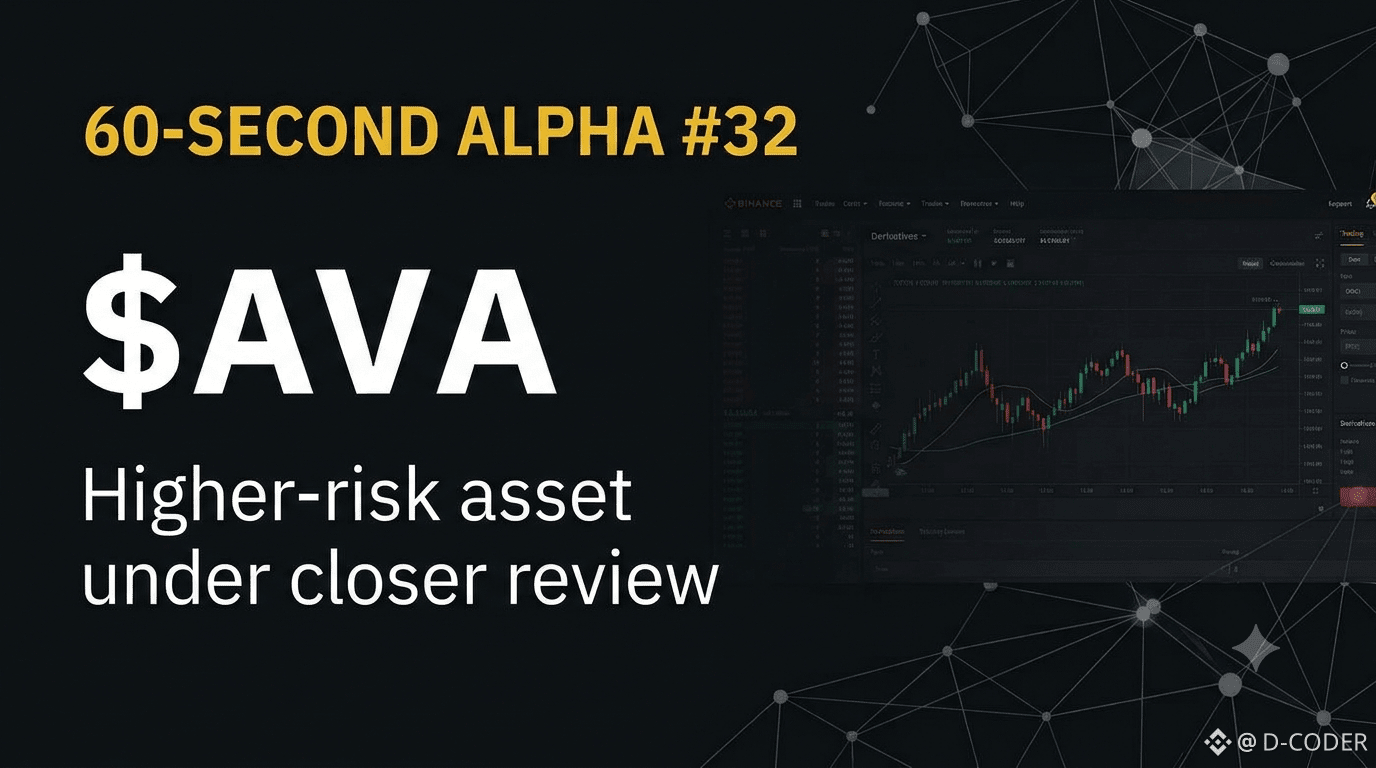
60-SECOND ALPHA #32 | $AVA
$AVA has just entered Binance’s Monitoring Tag list alongside GNS, SCR and TOWNS. Binance says these tokens are subject to closer review because of higher volatility and risk, with factors such as development activity, liquidity, network stability and project communication considered during reviews.
The lesson here is bigger than AVA: A Binance listing does not mean an asset is permanently safe or guaranteed to remain listed.
Alpha: Always separate “listed on Binance” from “low risk.” They are not the same thing.
{future}(AVAUSDT)
60-SECOND ALPHA #32 | $AVA
$AVA has just entered Binance’s Monitoring Tag list alongside GNS, SCR and TOWNS. Binance says these tokens are subject to closer review because of higher volatility and risk, with factors such as development activity, liquidity, network stability and project communication considered during reviews.
The lesson here is bigger than AVA: A Binance listing does not mean an asset is permanently safe or guaranteed to remain listed.
Alpha: Always separate “listed on Binance” from “low risk.” They are not the same thing.
$AVA has just entered Binance’s Monitoring Tag list alongside GNS, SCR and TOWNS. Binance says these tokens are subject to closer review because of higher volatility and risk, with factors such as development activity, liquidity, network stability and project communication considered during reviews.
The lesson here is bigger than AVA: A Binance listing does not mean an asset is permanently safe or guaranteed to remain listed.
Alpha: Always separate “listed on Binance” from “low risk.” They are not the same thing.
58
·
--
32% single-day increase, but what’s really worth noting isn’t the rise itself.
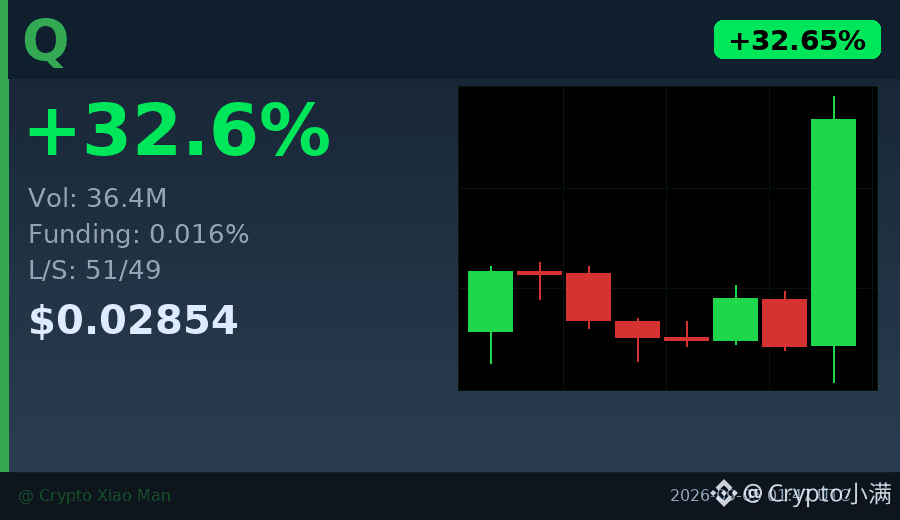
Q coin’s trading volume today surged to 36.4 million USDT, more than 3 times the average of the past few days. The price climbed from 0.021 all the way to 0.0285, and the most important part is the last candlestick — a clear volume-backed breakout.
The funding rate of 0.01588% isn’t extreme, and the long/short ratio of 51%/49% is also very balanced, which shows this rally wasn’t driven by excessive leverage.
Over the past 6 hours, it formed a classic "low-volume pullback → high-volume breakout" structure. It is now hovering around 0.029, and we need to see whether it can hold above this level.
$Q #放量突破 #32%
Click the small card below to quickly view the market👇
32% single-day increase, but what’s really worth noting isn’t the rise itself.
Q coin’s trading volume today surged to 36.4 million USDT, more than 3 times the average of the past few days. The price climbed from 0.021 all the way to 0.0285, and the most important part is the last candlestick — a clear volume-backed breakout.
The funding rate of 0.01588% isn’t extreme, and the long/short ratio of 51%/49% is also very balanced, which shows this rally wasn’t driven by excessive leverage.
Over the past 6 hours, it formed a classic "low-volume pullback → high-volume breakout" structure. It is now hovering around 0.029, and we need to see whether it can hold above this level.
$Q #放量突破 #32%
Click the small card below to quickly view the market👇
Q coin’s trading volume today surged to 36.4 million USDT, more than 3 times the average of the past few days. The price climbed from 0.021 all the way to 0.0285, and the most important part is the last candlestick — a clear volume-backed breakout.
The funding rate of 0.01588% isn’t extreme, and the long/short ratio of 51%/49% is also very balanced, which shows this rally wasn’t driven by excessive leverage.
Over the past 6 hours, it formed a classic "low-volume pullback → high-volume breakout" structure. It is now hovering around 0.029, and we need to see whether it can hold above this level.
$Q #放量突破 #32%
Click the small card below to quickly view the market👇
46
·
--
$MAGMA This breakout on expanding volume is something 🔥
In just 15 minutes, it surged +2.68%, with volume jumping to 5.86x the normal level. Price also pushed through the upper bound of the last ~20 five-minute candlesticks—technically, it’s undeniably a textbook-style relative breakout.
What’s even more noteworthy is the futures side: OI for both the 15-minute and 1-hour intervals is increasing in sync. The notional changes are +3.47% and +3.39% respectively—this looks like fresh leveraged long capital stepping in and taking over, not just a “fake” spike from short covering. The abnormality rank across the whole pool is #37, notional change rank is #32, and real money attention is evident.
But don’t get carried away. Passive vs. active execution difference is -7.8%, and the buy/sell ratio is 0.86, indicating that there’s actually substantial sell pressure during the move. The follow-through of the breakout still needs confirmation. Also, the OI abnormal percentile is already at 90.7%—at this point, chasing higher prices comes with questionable cost-effectiveness, so weigh it carefully.
In one sentence: the structure is pretty and the volume is strong, but there’s disagreement in the order book—don’t blindly go long. Watch whether the price can hold the breakout level on the 15-minute chart; only if the retest doesn’t break should there be a “second wave” story.
$MAGMA Short-term play—use proper stop-loss.
$MAGMA This breakout on expanding volume is something 🔥
In just 15 minutes, it surged +2.68%, with volume jumping to 5.86x the normal level. Price also pushed through the upper bound of the last ~20 five-minute candlesticks—technically, it’s undeniably a textbook-style relative breakout.
What’s even more noteworthy is the futures side: OI for both the 15-minute and 1-hour intervals is increasing in sync. The notional changes are +3.47% and +3.39% respectively—this looks like fresh leveraged long capital stepping in and taking over, not just a “fake” spike from short covering. The abnormality rank across the whole pool is #37, notional change rank is #32, and real money attention is evident.
But don’t get carried away. Passive vs. active execution difference is -7.8%, and the buy/sell ratio is 0.86, indicating that there’s actually substantial sell pressure during the move. The follow-through of the breakout still needs confirmation. Also, the OI abnormal percentile is already at 90.7%—at this point, chasing higher prices comes with questionable cost-effectiveness, so weigh it carefully.
In one sentence: the structure is pretty and the volume is strong, but there’s disagreement in the order book—don’t blindly go long. Watch whether the price can hold the breakout level on the 15-minute chart; only if the retest doesn’t break should there be a “second wave” story.
$MAGMA Short-term play—use proper stop-loss.
In just 15 minutes, it surged +2.68%, with volume jumping to 5.86x the normal level. Price also pushed through the upper bound of the last ~20 five-minute candlesticks—technically, it’s undeniably a textbook-style relative breakout.
What’s even more noteworthy is the futures side: OI for both the 15-minute and 1-hour intervals is increasing in sync. The notional changes are +3.47% and +3.39% respectively—this looks like fresh leveraged long capital stepping in and taking over, not just a “fake” spike from short covering. The abnormality rank across the whole pool is #37, notional change rank is #32, and real money attention is evident.
But don’t get carried away. Passive vs. active execution difference is -7.8%, and the buy/sell ratio is 0.86, indicating that there’s actually substantial sell pressure during the move. The follow-through of the breakout still needs confirmation. Also, the OI abnormal percentile is already at 90.7%—at this point, chasing higher prices comes with questionable cost-effectiveness, so weigh it carefully.
In one sentence: the structure is pretty and the volume is strong, but there’s disagreement in the order book—don’t blindly go long. Watch whether the price can hold the breakout level on the 15-minute chart; only if the retest doesn’t break should there be a “second wave” story.
$MAGMA Short-term play—use proper stop-loss.
11
·
--
The trading volume of a single candlestick topped the total of the previous seven.
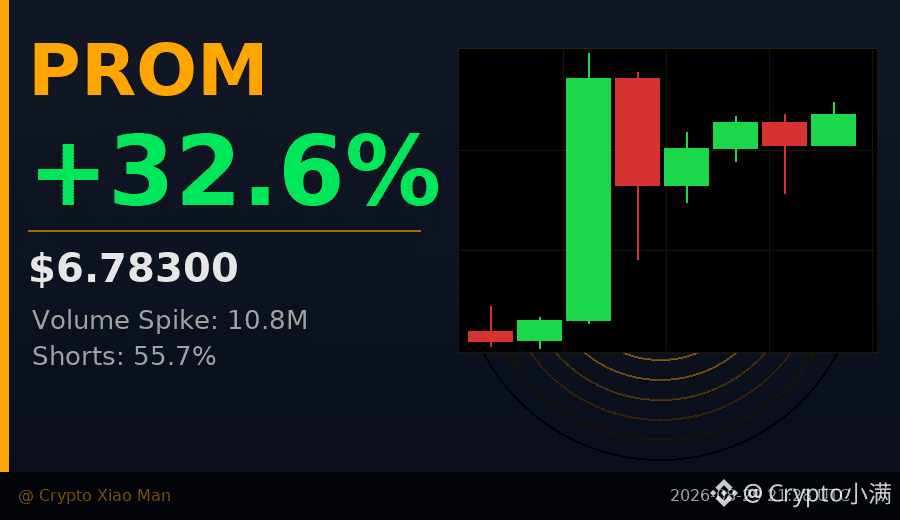
$PROM something happened today: within a single hour, the trading volume suddenly ballooned to 10.85 million, whereas before that each candlestick only had 6–10 million. With just that one candle, the price surged directly from 5.47 to a high of 7.16—an increase of more than 30%.
But then it didn’t continue—prices fell back to 6.33 and are now consolidating around 6.77.
This kind of move—"one strong candle, followed by a contraction in volume"—suggests it’s not a sustained wave of buying pressure. It looks more like a large order concentrated at one point triggered stop-losses and chasing longs, and then the momentum ran out.
Currently, shorts make up 55.7% and longs 44.3%—more people are shorting. The funding rate is close to zero, indicating the futures/contract market isn’t overheated yet.
The question now is: will the profit-taking orders left by that surge hold the price down here? Or will there be a second wave with matching volume?
Volume is the only answer; everything else is guessing.
$PROM #量能异动 #32%涨幅
Click the small card below to quickly view the行情👇
The trading volume of a single candlestick topped the total of the previous seven.
$PROM something happened today: within a single hour, the trading volume suddenly ballooned to 10.85 million, whereas before that each candlestick only had 6–10 million. With just that one candle, the price surged directly from 5.47 to a high of 7.16—an increase of more than 30%.
But then it didn’t continue—prices fell back to 6.33 and are now consolidating around 6.77.
This kind of move—"one strong candle, followed by a contraction in volume"—suggests it’s not a sustained wave of buying pressure. It looks more like a large order concentrated at one point triggered stop-losses and chasing longs, and then the momentum ran out.
Currently, shorts make up 55.7% and longs 44.3%—more people are shorting. The funding rate is close to zero, indicating the futures/contract market isn’t overheated yet.
The question now is: will the profit-taking orders left by that surge hold the price down here? Or will there be a second wave with matching volume?
Volume is the only answer; everything else is guessing.
$PROM #量能异动 #32%涨幅
Click the small card below to quickly view the行情👇
$PROM something happened today: within a single hour, the trading volume suddenly ballooned to 10.85 million, whereas before that each candlestick only had 6–10 million. With just that one candle, the price surged directly from 5.47 to a high of 7.16—an increase of more than 30%.
But then it didn’t continue—prices fell back to 6.33 and are now consolidating around 6.77.
This kind of move—"one strong candle, followed by a contraction in volume"—suggests it’s not a sustained wave of buying pressure. It looks more like a large order concentrated at one point triggered stop-losses and chasing longs, and then the momentum ran out.
Currently, shorts make up 55.7% and longs 44.3%—more people are shorting. The funding rate is close to zero, indicating the futures/contract market isn’t overheated yet.
The question now is: will the profit-taking orders left by that surge hold the price down here? Or will there be a second wave with matching volume?
Volume is the only answer; everything else is guessing.
$PROM #量能异动 #32%涨幅
Click the small card below to quickly view the行情👇
157
Log in to explore more content
Join global crypto users on Binance Square
⚡️ Get latest and useful information about crypto.
💬 Trusted by the world’s largest crypto exchange.
👍 Discover real insights from verified creators.
Email / Phone number
Trending Topics
1
#NEARRisesNearly80%InAWeek
8,586 views
515 Discussing
2
#MultiversXPlansHardForkRecovery
9,683 views
424 Discussing
3
#CircleLaunchesInstitutionalBTCBackedBorrowing
11,721 views
563 Discussing
4
#BitcoinHits$85K
15,395 views
238 Discussing
5
#ZetaChainVotesToMigrateZETAToSolana
10,133 views
347 Discussing
6
#ECBStartsBlockchainEuroSettlement
25,216 views
638 Discussing
7
#SouthAfricaProposesCryptoExchangeControls
37,128 views
819 Discussing
8
#SolanaCutsTargetSlotTimeTo250ms
39,782 views
733 Discussing
9
#EthereumSurpasses$2700
24,877 views
223 Discussing
10
#CanaryFilesSecondAmendmentForStakedSEIETF
54,742 views
1,066 Discussing