
#29
29
28,016 views
113 Discussing
Hot
Latest

·
--
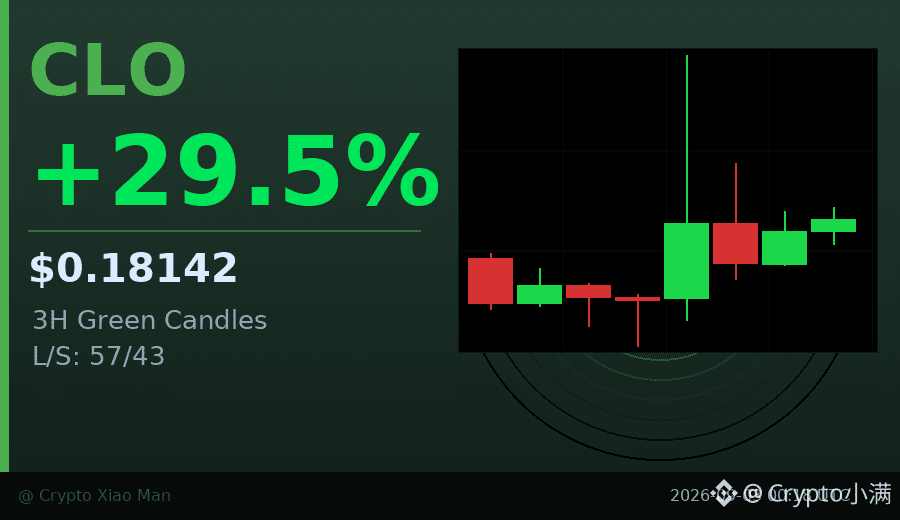
Behind the 29% surge, this trading volume is a bit interesting.
Today, CLO is up 29.48%, with the price reaching 0.18142. I noticed that the hourly chart has closed bullish for three consecutive candles, which suggests that the buying is not a one-time spike, but rather staged in waves.
Trading volume is 34.2 million USDT. Along with this price increase, it represents a healthy pattern of price and volume rising together. The funding rate is 0.072%, not particularly high. The long-to-short ratio is 57% vs 43%, meaning longs have the upper hand, but it’s not crowded yet.
The biggest risk with this kind of move is chasing at the high point. But if the pullback doesn’t break below the low of the previous bullish candle, there may still be opportunities.
$CLO #量价齐升 #29%
Click the small card below to quickly view the market trend👇
Behind the 29% surge, this trading volume is a bit interesting.
Today, CLO is up 29.48%, with the price reaching 0.18142. I noticed that the hourly chart has closed bullish for three consecutive candles, which suggests that the buying is not a one-time spike, but rather staged in waves.
Trading volume is 34.2 million USDT. Along with this price increase, it represents a healthy pattern of price and volume rising together. The funding rate is 0.072%, not particularly high. The long-to-short ratio is 57% vs 43%, meaning longs have the upper hand, but it’s not crowded yet.
The biggest risk with this kind of move is chasing at the high point. But if the pullback doesn’t break below the low of the previous bullish candle, there may still be opportunities.
$CLO #量价齐升 #29%
Click the small card below to quickly view the market trend👇
Today, CLO is up 29.48%, with the price reaching 0.18142. I noticed that the hourly chart has closed bullish for three consecutive candles, which suggests that the buying is not a one-time spike, but rather staged in waves.
Trading volume is 34.2 million USDT. Along with this price increase, it represents a healthy pattern of price and volume rising together. The funding rate is 0.072%, not particularly high. The long-to-short ratio is 57% vs 43%, meaning longs have the upper hand, but it’s not crowded yet.
The biggest risk with this kind of move is chasing at the high point. But if the pullback doesn’t break below the low of the previous bullish candle, there may still be opportunities.
$CLO #量价齐升 #29%
Click the small card below to quickly view the market trend👇
151

·
--
At Binance Square we keep a close eye on the market’s hottest movers. This week CoinGecko’s trending list spotlights a mix of established powerhouses and emerging projects. Here’s a quick snapshot of the tokens that captured our community’s attention. Bitcoin still leads at rank #1, while Avalanche sits at #29 and Zcash at #9, underscoring their staying power.
1️⃣ Bitcoin (BTC) – +2.3% 🚀
2️⃣ Avalanche (AVAX) – +5.1% 🌋
3️⃣ Zcash (ZEC) – +3.8% 🔒
4️⃣ Ethena (ENA) – +7.4%
5️⃣ Official Trump (TRUMP) – +4.0%
6️⃣ Zama (ZAMA) – +6.2%
7️⃣ Harmony (ONE) – +1.9%
These moves reflect strong momentum across both DeFi and privacy sectors.
We’re excited to see how these trends evolve, and our analytics team will keep you updated with real‑time insights. Whether you’re diversifying into high‑growth DeFi assets like Ethena or hedging with privacy‑focused coins such as Zcash, our platform offers the tools you need. Stay tuned, trade wisely, and let’s ride the next wave together! 😊
$CELR, $G, $CELR
At Binance Square we keep a close eye on the market’s hottest movers. This week CoinGecko’s trending list spotlights a mix of established powerhouses and emerging projects. Here’s a quick snapshot of the tokens that captured our community’s attention. Bitcoin still leads at rank #1, while Avalanche sits at #29 and Zcash at #9, underscoring their staying power.
1️⃣ Bitcoin (BTC) – +2.3% 🚀
2️⃣ Avalanche (AVAX) – +5.1% 🌋
3️⃣ Zcash (ZEC) – +3.8% 🔒
4️⃣ Ethena (ENA) – +7.4%
5️⃣ Official Trump (TRUMP) – +4.0%
6️⃣ Zama (ZAMA) – +6.2%
7️⃣ Harmony (ONE) – +1.9%
These moves reflect strong momentum across both DeFi and privacy sectors.
We’re excited to see how these trends evolve, and our analytics team will keep you updated with real‑time insights. Whether you’re diversifying into high‑growth DeFi assets like Ethena or hedging with privacy‑focused coins such as Zcash, our platform offers the tools you need. Stay tuned, trade wisely, and let’s ride the next wave together! 😊
$CELR , $G , $CELR
1️⃣ Bitcoin (BTC) – +2.3% 🚀
2️⃣ Avalanche (AVAX) – +5.1% 🌋
3️⃣ Zcash (ZEC) – +3.8% 🔒
4️⃣ Ethena (ENA) – +7.4%
5️⃣ Official Trump (TRUMP) – +4.0%
6️⃣ Zama (ZAMA) – +6.2%
7️⃣ Harmony (ONE) – +1.9%
These moves reflect strong momentum across both DeFi and privacy sectors.
We’re excited to see how these trends evolve, and our analytics team will keep you updated with real‑time insights. Whether you’re diversifying into high‑growth DeFi assets like Ethena or hedging with privacy‑focused coins such as Zcash, our platform offers the tools you need. Stay tuned, trade wisely, and let’s ride the next wave together! 😊
$CELR , $G , $CELR
299

·
--
$B2 This move is kind of interesting.
In the 15m timeframe, it directly surged 3.63%. Trading volume hit 5x the average, with a Z-score of 4.36—this isn’t just a random needle jab.
The closing price has just broken above the top of the recent 20 5m candles, which counts as a decent range breakout.
More importantly, OI is rising in sync—15m +0.95%, 1h +1.01%. The nominal increase sums to nearly 750k USDT. Price is up and open interest is up too. This is a classic incremental-leverage long entry, not that kind of “short covering” hype.
Active trade imbalance is +2.0%, with a buy/sell ratio of 1.04. Buys are slightly dominant but not extreme, suggesting we’re not at the FOMO stage yet.
The abnormal percentile is 86.7%, ranking #15 in the whole pool. Nominal change ranks #29, and the 24h trading value is 52.62M. The data isn’t wildly explosive, but the structure is clean: volume and price align, OI confirms, and the range boundaries are clear.
Next, there are two things to watch: first, whether it can hold above this breakout level; second, if OI keeps stacking, be careful of the flip-side “insert needle” after long crowding.
For now, we’ll observe.
$B2 This move is kind of interesting.
In the 15m timeframe, it directly surged 3.63%. Trading volume hit 5x the average, with a Z-score of 4.36—this isn’t just a random needle jab.
The closing price has just broken above the top of the recent 20 5m candles, which counts as a decent range breakout.
More importantly, OI is rising in sync—15m +0.95%, 1h +1.01%. The nominal increase sums to nearly 750k USDT. Price is up and open interest is up too. This is a classic incremental-leverage long entry, not that kind of “short covering” hype.
Active trade imbalance is +2.0%, with a buy/sell ratio of 1.04. Buys are slightly dominant but not extreme, suggesting we’re not at the FOMO stage yet.
The abnormal percentile is 86.7%, ranking #15 in the whole pool. Nominal change ranks #29, and the 24h trading value is 52.62M. The data isn’t wildly explosive, but the structure is clean: volume and price align, OI confirms, and the range boundaries are clear.
Next, there are two things to watch: first, whether it can hold above this breakout level; second, if OI keeps stacking, be careful of the flip-side “insert needle” after long crowding.
For now, we’ll observe.
In the 15m timeframe, it directly surged 3.63%. Trading volume hit 5x the average, with a Z-score of 4.36—this isn’t just a random needle jab.
The closing price has just broken above the top of the recent 20 5m candles, which counts as a decent range breakout.
More importantly, OI is rising in sync—15m +0.95%, 1h +1.01%. The nominal increase sums to nearly 750k USDT. Price is up and open interest is up too. This is a classic incremental-leverage long entry, not that kind of “short covering” hype.
Active trade imbalance is +2.0%, with a buy/sell ratio of 1.04. Buys are slightly dominant but not extreme, suggesting we’re not at the FOMO stage yet.
The abnormal percentile is 86.7%, ranking #15 in the whole pool. Nominal change ranks #29, and the 24h trading value is 52.62M. The data isn’t wildly explosive, but the structure is clean: volume and price align, OI confirms, and the range boundaries are clear.
Next, there are two things to watch: first, whether it can hold above this breakout level; second, if OI keeps stacking, be careful of the flip-side “insert needle” after long crowding.
For now, we’ll observe.
1

·
--
$BR This move is kind of interesting.
In 15m, it’s up +3.17% directly. Volume reached 2.07x, with aggressive buy/sell ratio at 1.34. It also closed by breaking above the upper band of the last ~20 consecutive 5m bars. On the surface it looks like a strong breakout, but OI is falling—15m -0.14%, 1h -0.38%.
Price is up, positions are down—this is a typical short-covering move, not a fresh wave of longs being pushed in.
In the whole pool, it’s ranked #29 for abnormality, with a nominal change of #8. Momentum really has picked up. But the rise driven by short covering—its sustainability is worth questioning. Before chasing, think it through: are you taking over from the short-covering wave, or are you waiting to be the one who picks up after the covering is done?
With 339M in 24h volume, this pool—$BR —isn’t shallow. If it really runs, it can go for a while too. But with the breakout not supported by OI, I usually only trade it short-term.
$BR This move is kind of interesting.
In 15m, it’s up +3.17% directly. Volume reached 2.07x, with aggressive buy/sell ratio at 1.34. It also closed by breaking above the upper band of the last ~20 consecutive 5m bars. On the surface it looks like a strong breakout, but OI is falling—15m -0.14%, 1h -0.38%.
Price is up, positions are down—this is a typical short-covering move, not a fresh wave of longs being pushed in.
In the whole pool, it’s ranked #29 for abnormality, with a nominal change of #8. Momentum really has picked up. But the rise driven by short covering—its sustainability is worth questioning. Before chasing, think it through: are you taking over from the short-covering wave, or are you waiting to be the one who picks up after the covering is done?
With 339M in 24h volume, this pool—$BR —isn’t shallow. If it really runs, it can go for a while too. But with the breakout not supported by OI, I usually only trade it short-term.
In 15m, it’s up +3.17% directly. Volume reached 2.07x, with aggressive buy/sell ratio at 1.34. It also closed by breaking above the upper band of the last ~20 consecutive 5m bars. On the surface it looks like a strong breakout, but OI is falling—15m -0.14%, 1h -0.38%.
Price is up, positions are down—this is a typical short-covering move, not a fresh wave of longs being pushed in.
In the whole pool, it’s ranked #29 for abnormality, with a nominal change of #8. Momentum really has picked up. But the rise driven by short covering—its sustainability is worth questioning. Before chasing, think it through: are you taking over from the short-covering wave, or are you waiting to be the one who picks up after the covering is done?
With 339M in 24h volume, this pool—$BR —isn’t shallow. If it really runs, it can go for a while too. But with the breakout not supported by OI, I usually only trade it short-term.
19

·
--
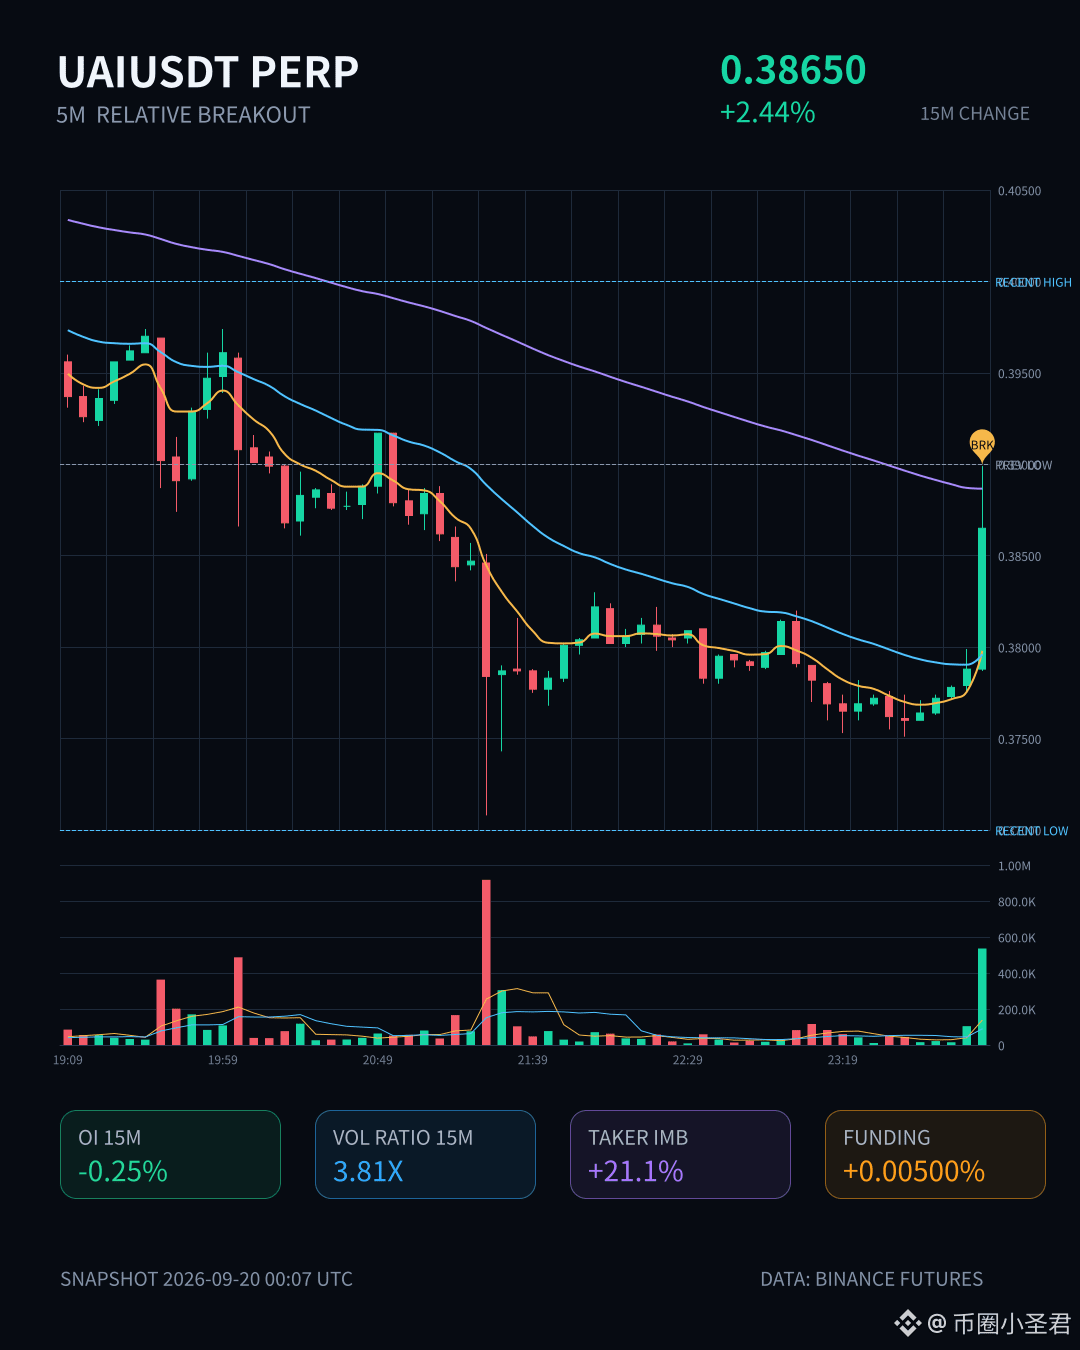
$UAI This 15m move is a bit interesting.
Price is up 2.44%, volume directly shot to 3.81x, volatility is Z 3.17, and the close even broke above the upper edge of the past ~20 5m candles. The buy/sell ratio is 1.53, and the active trade value is worse by 21.1%—the bids really are pushing in.
But what really made me take a closer look is OI—down 0.25% on 15m and down 0.22% on 1h. Price is rising while positions are shrinking. This doesn’t look like new longs entering; it looks more like shorts being forced to close and cover, or older positions rotating. The OI abnormal percentile is 95.4%; across the whole pool it ranks #4, with nominal change #29—so this signal is quite eye-catching within the pool.
The 24h turnover is only 11.89M, depth is just so-so. With this kind of volume amplified together with price pushing up to the boundary of the range, short-term it’s easy to see the direction break out and then reverse. The rally driven by short covering—its follow-through depends on whether the covering finishes and whether there’s real fresh buying underneath.
Keep watching first: is it a fake breakout, or has something actually started?
$UAI This 15m move is a bit interesting.
Price is up 2.44%, volume directly shot to 3.81x, volatility is Z 3.17, and the close even broke above the upper edge of the past ~20 5m candles. The buy/sell ratio is 1.53, and the active trade value is worse by 21.1%—the bids really are pushing in.
But what really made me take a closer look is OI—down 0.25% on 15m and down 0.22% on 1h. Price is rising while positions are shrinking. This doesn’t look like new longs entering; it looks more like shorts being forced to close and cover, or older positions rotating. The OI abnormal percentile is 95.4%; across the whole pool it ranks #4, with nominal change #29—so this signal is quite eye-catching within the pool.
The 24h turnover is only 11.89M, depth is just so-so. With this kind of volume amplified together with price pushing up to the boundary of the range, short-term it’s easy to see the direction break out and then reverse. The rally driven by short covering—its follow-through depends on whether the covering finishes and whether there’s real fresh buying underneath.
Keep watching first: is it a fake breakout, or has something actually started?
Price is up 2.44%, volume directly shot to 3.81x, volatility is Z 3.17, and the close even broke above the upper edge of the past ~20 5m candles. The buy/sell ratio is 1.53, and the active trade value is worse by 21.1%—the bids really are pushing in.
But what really made me take a closer look is OI—down 0.25% on 15m and down 0.22% on 1h. Price is rising while positions are shrinking. This doesn’t look like new longs entering; it looks more like shorts being forced to close and cover, or older positions rotating. The OI abnormal percentile is 95.4%; across the whole pool it ranks #4, with nominal change #29—so this signal is quite eye-catching within the pool.
The 24h turnover is only 11.89M, depth is just so-so. With this kind of volume amplified together with price pushing up to the boundary of the range, short-term it’s easy to see the direction break out and then reverse. The rally driven by short covering—its follow-through depends on whether the covering finishes and whether there’s real fresh buying underneath.
Keep watching first: is it a fake breakout, or has something actually started?
78

·
--
PENDLE, this wave is going down pretty decisively.
On the 15m chart, it’s down 0.73%, with volume hitting 1.63x, Z value at 1.75. It directly breaks below the lower band of the past 20 5m candles. The aggressive trade imbalance is -29.8%, buy/sell ratio is 0.54, and sell pressure is clearly dominant.
The key is that OI is dropping in sync—on the 15m contract -0.22%, on the 1h -0.64%, with notional down about 450k U in total. This doesn’t look like brand-new shorts entering; it’s more like longs are deleveraging—stopping out or passively shrinking positions. The abnormal percentile is 82.1%, ranking #29 in the whole pool, and the notional change ranks #32.
Over the last 24h, turnover is 27.9M, and the order-book depth confirms enough. With this kind of structure, it usually doesn’t V-reverse immediately. First, we’ll see whether the bearish momentum can stabilize.
PENDLE, this wave is going down pretty decisively.
On the 15m chart, it’s down 0.73%, with volume hitting 1.63x, Z value at 1.75. It directly breaks below the lower band of the past 20 5m candles. The aggressive trade imbalance is -29.8%, buy/sell ratio is 0.54, and sell pressure is clearly dominant.
The key is that OI is dropping in sync—on the 15m contract -0.22%, on the 1h -0.64%, with notional down about 450k U in total. This doesn’t look like brand-new shorts entering; it’s more like longs are deleveraging—stopping out or passively shrinking positions. The abnormal percentile is 82.1%, ranking #29 in the whole pool, and the notional change ranks #32.
Over the last 24h, turnover is 27.9M, and the order-book depth confirms enough. With this kind of structure, it usually doesn’t V-reverse immediately. First, we’ll see whether the bearish momentum can stabilize.
On the 15m chart, it’s down 0.73%, with volume hitting 1.63x, Z value at 1.75. It directly breaks below the lower band of the past 20 5m candles. The aggressive trade imbalance is -29.8%, buy/sell ratio is 0.54, and sell pressure is clearly dominant.
The key is that OI is dropping in sync—on the 15m contract -0.22%, on the 1h -0.64%, with notional down about 450k U in total. This doesn’t look like brand-new shorts entering; it’s more like longs are deleveraging—stopping out or passively shrinking positions. The abnormal percentile is 82.1%, ranking #29 in the whole pool, and the notional change ranks #32.
Over the last 24h, turnover is 27.9M, and the order-book depth confirms enough. With this kind of structure, it usually doesn’t V-reverse immediately. First, we’ll see whether the bearish momentum can stabilize.
5
·
--
$LSK This wave on the 15m saw a 4.47% rise, with volume directly reaching 4.17x. However, OI has been falling for both cycles—1h -3.33%, 15m -2.87%. Price is going up while open interest is going down: a classic short-covering structure, not fresh long positions entering.
The active trades gap is still negative at -6.6%, with a buy/sell ratio of 0.88. This suggests that active buy pressure hasn’t really kept up; it’s more like shorts being forced to close and pushed the price up. In the past 24h, trading value was 310 million U, and liquidity is sufficient. The nominal change is also ranked within the entire pool at #29.
With this kind of structure, chasing longs requires caution. Once the fuel for short covering burns out, if there’s no new long follow-through, it can easily pull back. Let’s first see whether it can hold steady.
$LSK This wave on the 15m saw a 4.47% rise, with volume directly reaching 4.17x. However, OI has been falling for both cycles—1h -3.33%, 15m -2.87%. Price is going up while open interest is going down: a classic short-covering structure, not fresh long positions entering.
The active trades gap is still negative at -6.6%, with a buy/sell ratio of 0.88. This suggests that active buy pressure hasn’t really kept up; it’s more like shorts being forced to close and pushed the price up. In the past 24h, trading value was 310 million U, and liquidity is sufficient. The nominal change is also ranked within the entire pool at #29.
With this kind of structure, chasing longs requires caution. Once the fuel for short covering burns out, if there’s no new long follow-through, it can easily pull back. Let’s first see whether it can hold steady.
The active trades gap is still negative at -6.6%, with a buy/sell ratio of 0.88. This suggests that active buy pressure hasn’t really kept up; it’s more like shorts being forced to close and pushed the price up. In the past 24h, trading value was 310 million U, and liquidity is sufficient. The nominal change is also ranked within the entire pool at #29.
With this kind of structure, chasing longs requires caution. Once the fuel for short covering burns out, if there’s no new long follow-through, it can easily pull back. Let’s first see whether it can hold steady.
11
·
--
$BTW This chart feels a bit uncomfortable.
On the 15m timeframe it dropped less than one point, but the volume immediately went straight up to 3x the usual. Price is also clinging to the lower band of nearly 20 of the 5m lows. More importantly, the OI hasn’t fallen—on the 1h nominal change is -3.28M. It’s not a very aggressive drop, but the leverage hasn’t backed off; it feels more like shorts are being added.
The entire pool’s anomalies have ranked at #29, nominal change is already in the top 10, and the volume confirms it too. This isn’t the kind of fake breakout that gets lightly swept—it’s real money participating.
Buy-sell ratio is 1.01, and the aggressive trades differential is 0.3%. The order book is still relatively balanced for now. But balance is one thing—if the price can’t reclaim the lower band on the close, this newly entered batch of shorts should press down accordingly.
Watch it: is this a fluke stumble, or is it really going to open and push lower for a stretch?
$BTW This chart feels a bit uncomfortable.
On the 15m timeframe it dropped less than one point, but the volume immediately went straight up to 3x the usual. Price is also clinging to the lower band of nearly 20 of the 5m lows. More importantly, the OI hasn’t fallen—on the 1h nominal change is -3.28M. It’s not a very aggressive drop, but the leverage hasn’t backed off; it feels more like shorts are being added.
The entire pool’s anomalies have ranked at #29, nominal change is already in the top 10, and the volume confirms it too. This isn’t the kind of fake breakout that gets lightly swept—it’s real money participating.
Buy-sell ratio is 1.01, and the aggressive trades differential is 0.3%. The order book is still relatively balanced for now. But balance is one thing—if the price can’t reclaim the lower band on the close, this newly entered batch of shorts should press down accordingly.
Watch it: is this a fluke stumble, or is it really going to open and push lower for a stretch?
On the 15m timeframe it dropped less than one point, but the volume immediately went straight up to 3x the usual. Price is also clinging to the lower band of nearly 20 of the 5m lows. More importantly, the OI hasn’t fallen—on the 1h nominal change is -3.28M. It’s not a very aggressive drop, but the leverage hasn’t backed off; it feels more like shorts are being added.
The entire pool’s anomalies have ranked at #29, nominal change is already in the top 10, and the volume confirms it too. This isn’t the kind of fake breakout that gets lightly swept—it’s real money participating.
Buy-sell ratio is 1.01, and the aggressive trades differential is 0.3%. The order book is still relatively balanced for now. But balance is one thing—if the price can’t reclaim the lower band on the close, this newly entered batch of shorts should press down accordingly.
Watch it: is this a fluke stumble, or is it really going to open and push lower for a stretch?
遇事春风:
还得拉爆一次😂
1
271
·
--
$MORPHO This 15m is kind of interesting.
The price surged by 1.13%, and volume directly jumped to 5.45x. The Z value is 3.23. The closing price broke through the upper edge of nearly 20 consecutive 5m candles. The aggressive trade volume difference is 49.5%, and the buy/sell ratio is 2.96—clearly, bids are pushing.
The key is OI: 15m +0.76%, 1h +0.81%. Nominal change isn’t big, but the extreme percentile is as high as 99.2%, in the whole pool #3. Multiple consecutive periods with abnormal OI continue, and volume is cooperating—this isn’t just a spot-price pump. It looks more like new leveraged longs are entering.
The 24h trading value is only 11.36M, and the pool isn’t deep. With this level of volume flowing in, price elasticity will be amplified. It’s getting close to its own historical extreme range. Also, overall pool nominal change #29 and anomaly #3—capital attention is clearly focusing here.
I won’t chase the first candle, but I’ll watch to see whether there’s acceptance on a pullback. If OI keeps rising and the price doesn’t give back the breakout level, that’s how a trend start plays out. If volume shrinks and OI drops, then it’s just a one-off wave. I’ll set an observation level first.
$MORPHO This 15m is kind of interesting.
The price surged by 1.13%, and volume directly jumped to 5.45x. The Z value is 3.23. The closing price broke through the upper edge of nearly 20 consecutive 5m candles. The aggressive trade volume difference is 49.5%, and the buy/sell ratio is 2.96—clearly, bids are pushing.
The key is OI: 15m +0.76%, 1h +0.81%. Nominal change isn’t big, but the extreme percentile is as high as 99.2%, in the whole pool #3. Multiple consecutive periods with abnormal OI continue, and volume is cooperating—this isn’t just a spot-price pump. It looks more like new leveraged longs are entering.
The 24h trading value is only 11.36M, and the pool isn’t deep. With this level of volume flowing in, price elasticity will be amplified. It’s getting close to its own historical extreme range. Also, overall pool nominal change #29 and anomaly #3—capital attention is clearly focusing here.
I won’t chase the first candle, but I’ll watch to see whether there’s acceptance on a pullback. If OI keeps rising and the price doesn’t give back the breakout level, that’s how a trend start plays out. If volume shrinks and OI drops, then it’s just a one-off wave. I’ll set an observation level first.
The price surged by 1.13%, and volume directly jumped to 5.45x. The Z value is 3.23. The closing price broke through the upper edge of nearly 20 consecutive 5m candles. The aggressive trade volume difference is 49.5%, and the buy/sell ratio is 2.96—clearly, bids are pushing.
The key is OI: 15m +0.76%, 1h +0.81%. Nominal change isn’t big, but the extreme percentile is as high as 99.2%, in the whole pool #3. Multiple consecutive periods with abnormal OI continue, and volume is cooperating—this isn’t just a spot-price pump. It looks more like new leveraged longs are entering.
The 24h trading value is only 11.36M, and the pool isn’t deep. With this level of volume flowing in, price elasticity will be amplified. It’s getting close to its own historical extreme range. Also, overall pool nominal change #29 and anomaly #3—capital attention is clearly focusing here.
I won’t chase the first candle, but I’ll watch to see whether there’s acceptance on a pullback. If OI keeps rising and the price doesn’t give back the breakout level, that’s how a trend start plays out. If volume shrinks and OI drops, then it’s just a one-off wave. I’ll set an observation level first.
2

·
--
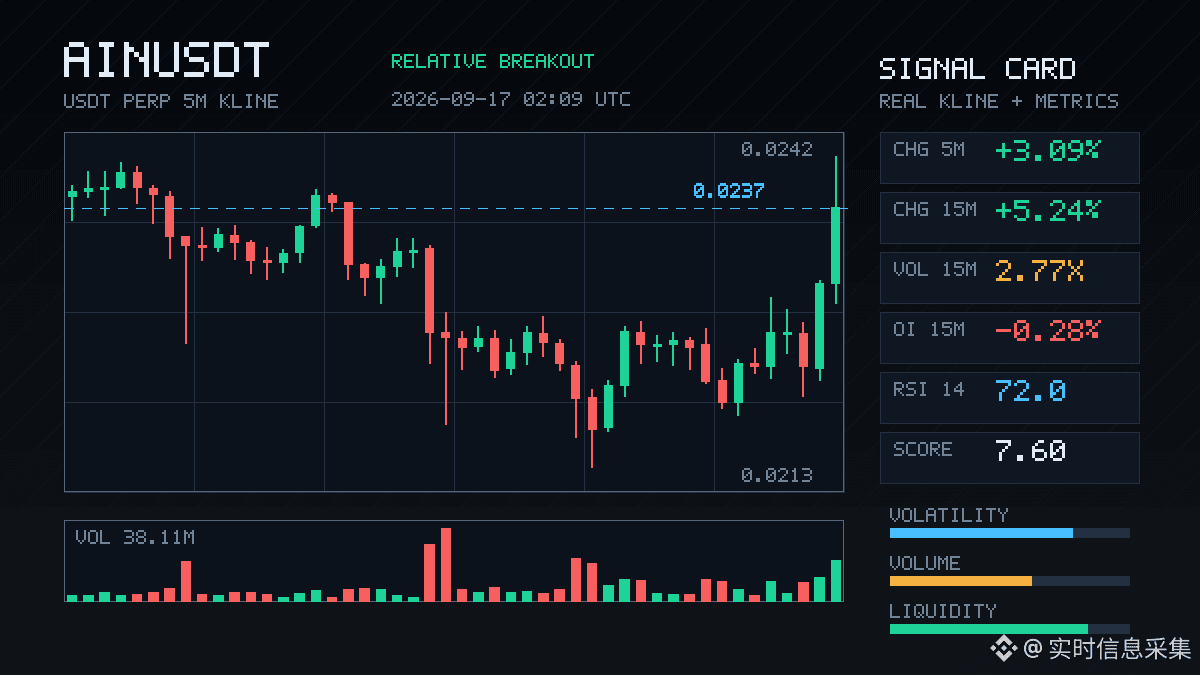
$AIN This move is pretty fast—within 15 minutes it’s up +5.24%. Volume reached 2.77x, and the closing price also broke through the upper edge of the last 20 five-minute candles. But OI didn’t follow—15m contract OI actually fell by -0.28%, and over 1 hour it only increased slightly by 0.41%; the notional change is only a bit over 500k U.
With price rising while OI falls, this structure looks more like short covering or position closing, not new long positions being pushed in. Funding rates are also in the high percentile recently. Active trade slippage is 8.3% and the buy/sell ratio is 1.18—short-term it leans toward buyers, but the durability is questionable.
In the past 24h, trading value is 290M and liquidity depth is sufficient; the overall pool’s notional change ranks around #29. Still, with an OI-divergent breakout, if you chase higher, be careful—whether it can hold up on a pullback is key.
$AIN This move is pretty fast—within 15 minutes it’s up +5.24%. Volume reached 2.77x, and the closing price also broke through the upper edge of the last 20 five-minute candles. But OI didn’t follow—15m contract OI actually fell by -0.28%, and over 1 hour it only increased slightly by 0.41%; the notional change is only a bit over 500k U.
With price rising while OI falls, this structure looks more like short covering or position closing, not new long positions being pushed in. Funding rates are also in the high percentile recently. Active trade slippage is 8.3% and the buy/sell ratio is 1.18—short-term it leans toward buyers, but the durability is questionable.
In the past 24h, trading value is 290M and liquidity depth is sufficient; the overall pool’s notional change ranks around #29. Still, with an OI-divergent breakout, if you chase higher, be careful—whether it can hold up on a pullback is key.
With price rising while OI falls, this structure looks more like short covering or position closing, not new long positions being pushed in. Funding rates are also in the high percentile recently. Active trade slippage is 8.3% and the buy/sell ratio is 1.18—short-term it leans toward buyers, but the durability is questionable.
In the past 24h, trading value is 290M and liquidity depth is sufficient; the overall pool’s notional change ranks around #29. Still, with an OI-divergent breakout, if you chase higher, be careful—whether it can hold up on a pullback is key.
30

·
--
** 12.5% NEAR Rally: Should You Buy Today or Wait?NEAR Protocol (NEARUSDT) is trending right now!
Rank: #29
** A 12.48% jump carried ’ to the $2.63 level in a single evening. Most traders say “NEAR is overheated now, take profit!” Here’s a surprising fact: Volume is 86M USDT—only 2.3% of the average volume in the previous 24 hours! This suggests buyers haven’t stepped away; instead, there is real liquidity behind the “pump.” 🚀 In my view, there are two main signals. First, as the price rose from $2.34 to $2.63, it settled around a weighted-average price of $2.48. This indicates that the buying pressure is not just a one-off “spike,” but a sustainable “bull flag” formation. Second, it surged to the $1.029 level with a 9.12% increase, with volume at 10.7M USDT. DOT’s performance implies that new parachain launches in the Polkadot ecosystem and the “cross-chain” liquidity flow could also spill over into NEAR. Counterpoint: “NEAR’s 12.5% rise could be a ‘pump-and-dump’; in the short term, rekt risk is high.” I think that view is incomplete because UniSwap (UNI) is also up 4.85% and reached $6.66, with volume at 62M USDT. The DeFi sector is still shifting toward “layer-2” solutions, and NEAR’s Aurora rollup creates real use cases by bridging with its ecosystem. This supports ’ on one hand, and brings additional volume through NEAR’s “bridge” tokens. Now I’m proposing a strategy: - **DCA**: Buy $0.02 per day starting from the $0.10 level. This distributes volatility and lowers the average entry price. - **Short-term swing**: If it breaks the $2.70 resistance, take the 5–10% “moon” f
** 12.5% NEAR Rally: Should You Buy Today or Wait?
NEAR Protocol (NEARUSDT) is trending right now!
Rank: #29
** A 12.48% jump carried ’ to the $2.63 level in a single evening. Most traders say “NEAR is overheated now, take profit!” Here’s a surprising fact: Volume is 86M USDT—only 2.3% of the average volume in the previous 24 hours! This suggests buyers haven’t stepped away; instead, there is real liquidity behind the “pump.” 🚀 In my view, there are two main signals. First, as the price rose from $2.34 to $2.63, it settled around a weighted-average price of $2.48. This indicates that the buying pressure is not just a one-off “spike,” but a sustainable “bull flag” formation. Second, it surged to the $1.029 level with a 9.12% increase, with volume at 10.7M USDT. DOT’s performance implies that new parachain launches in the Polkadot ecosystem and the “cross-chain” liquidity flow could also spill over into NEAR. Counterpoint: “NEAR’s 12.5% rise could be a ‘pump-and-dump’; in the short term, rekt risk is high.” I think that view is incomplete because UniSwap (UNI) is also up 4.85% and reached $6.66, with volume at 62M USDT. The DeFi sector is still shifting toward “layer-2” solutions, and NEAR’s Aurora rollup creates real use cases by bridging with its ecosystem. This supports ’ on one hand, and brings additional volume through NEAR’s “bridge” tokens. Now I’m proposing a strategy: - **DCA**: Buy $0.02 per day starting from the $0.10 level. This distributes volatility and lowers the average entry price. - **Short-term swing**: If it breaks the $2.70 resistance, take the 5–10% “moon” f
Rank: #29
** A 12.48% jump carried ’ to the $2.63 level in a single evening. Most traders say “NEAR is overheated now, take profit!” Here’s a surprising fact: Volume is 86M USDT—only 2.3% of the average volume in the previous 24 hours! This suggests buyers haven’t stepped away; instead, there is real liquidity behind the “pump.” 🚀 In my view, there are two main signals. First, as the price rose from $2.34 to $2.63, it settled around a weighted-average price of $2.48. This indicates that the buying pressure is not just a one-off “spike,” but a sustainable “bull flag” formation. Second, it surged to the $1.029 level with a 9.12% increase, with volume at 10.7M USDT. DOT’s performance implies that new parachain launches in the Polkadot ecosystem and the “cross-chain” liquidity flow could also spill over into NEAR. Counterpoint: “NEAR’s 12.5% rise could be a ‘pump-and-dump’; in the short term, rekt risk is high.” I think that view is incomplete because UniSwap (UNI) is also up 4.85% and reached $6.66, with volume at 62M USDT. The DeFi sector is still shifting toward “layer-2” solutions, and NEAR’s Aurora rollup creates real use cases by bridging with its ecosystem. This supports ’ on one hand, and brings additional volume through NEAR’s “bridge” tokens. Now I’m proposing a strategy: - **DCA**: Buy $0.02 per day starting from the $0.10 level. This distributes volatility and lowers the average entry price. - **Short-term swing**: If it breaks the $2.70 resistance, take the 5–10% “moon” f
79
·
--
$CAP This 15m drop is down 2.63%—volume directly spiked to 2.84x, Z-score 2.94, clearly not a normal fluctuation. The price has broken below the lower edge of the most recent ~20 5m candles; active trading volume is down -26.6% and the buy/sell ratio is 0.58. Sell-side pressure looks solid.
What’s interesting is the OI: the 15m contract is up +0.60%, 1h is +0.36%, yet the notional change is still negative (-1.97%/-2.20%). With price falling while OI rises, it looks more like new leveraged short positions are being added rather than longs being liquidated. The abnormal percentile is 72.8%; the whole-pool notional change is #29, and the depth has been confirmed.
In the last 24h, turnover is 82M—depth is sufficient, not a small-scale move. For this structure, first see whether it can hold near the lower bound of the range. If it continues to break down on increased volume, the shorts may have another leg.
$CAP This 15m drop is down 2.63%—volume directly spiked to 2.84x, Z-score 2.94, clearly not a normal fluctuation. The price has broken below the lower edge of the most recent ~20 5m candles; active trading volume is down -26.6% and the buy/sell ratio is 0.58. Sell-side pressure looks solid.
What’s interesting is the OI: the 15m contract is up +0.60%, 1h is +0.36%, yet the notional change is still negative (-1.97%/-2.20%). With price falling while OI rises, it looks more like new leveraged short positions are being added rather than longs being liquidated. The abnormal percentile is 72.8%; the whole-pool notional change is #29, and the depth has been confirmed.
In the last 24h, turnover is 82M—depth is sufficient, not a small-scale move. For this structure, first see whether it can hold near the lower bound of the range. If it continues to break down on increased volume, the shorts may have another leg.
What’s interesting is the OI: the 15m contract is up +0.60%, 1h is +0.36%, yet the notional change is still negative (-1.97%/-2.20%). With price falling while OI rises, it looks more like new leveraged short positions are being added rather than longs being liquidated. The abnormal percentile is 72.8%; the whole-pool notional change is #29, and the depth has been confirmed.
In the last 24h, turnover is 82M—depth is sufficient, not a small-scale move. For this structure, first see whether it can hold near the lower bound of the range. If it continues to break down on increased volume, the shorts may have another leg.
31
·
--
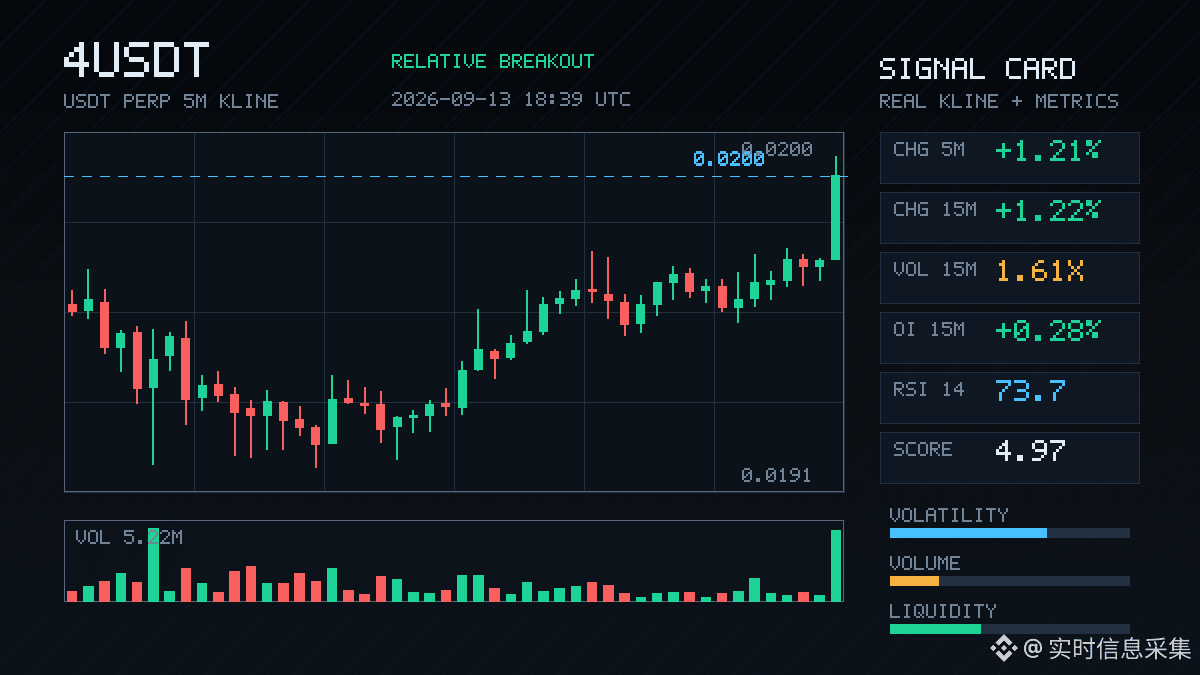
$4 This move is a bit interesting. In 15m it’s up 1.22%, with volume at 1.61x. The close directly broke above the upper edge of the recent 5m candles—about 20 of them. Active buy/sell ratio is 1.28. The bullish direction is pretty clear.
More importantly, OI moves along with the price—15m +0.28%, 1h +0.23%. The nominal increase isn’t exactly violent, but structurally it’s new leveraged long entries rather than a fake breakout driven by short covering.
The abnormal percentile is 71.2%, the full pool is #33, and the nominal change is #29. It’s not a top-leader level surge, but given the current pool with turnover around 13.5M, the depth confirmation is sufficient.
Watch whether it can hold above the breakout level. If it can stand firm, a pullback that doesn’t break is the opportunity; if it breaks, it’s a bull trap.
$4 This move is a bit interesting. In 15m it’s up 1.22%, with volume at 1.61x. The close directly broke above the upper edge of the recent 5m candles—about 20 of them. Active buy/sell ratio is 1.28. The bullish direction is pretty clear.
More importantly, OI moves along with the price—15m +0.28%, 1h +0.23%. The nominal increase isn’t exactly violent, but structurally it’s new leveraged long entries rather than a fake breakout driven by short covering.
The abnormal percentile is 71.2%, the full pool is #33, and the nominal change is #29. It’s not a top-leader level surge, but given the current pool with turnover around 13.5M, the depth confirmation is sufficient.
Watch whether it can hold above the breakout level. If it can stand firm, a pullback that doesn’t break is the opportunity; if it breaks, it’s a bull trap.
More importantly, OI moves along with the price—15m +0.28%, 1h +0.23%. The nominal increase isn’t exactly violent, but structurally it’s new leveraged long entries rather than a fake breakout driven by short covering.
The abnormal percentile is 71.2%, the full pool is #33, and the nominal change is #29. It’s not a top-leader level surge, but given the current pool with turnover around 13.5M, the depth confirmation is sufficient.
Watch whether it can hold above the breakout level. If it can stand firm, a pullback that doesn’t break is the opportunity; if it breaks, it’s a bull trap.
140

Article
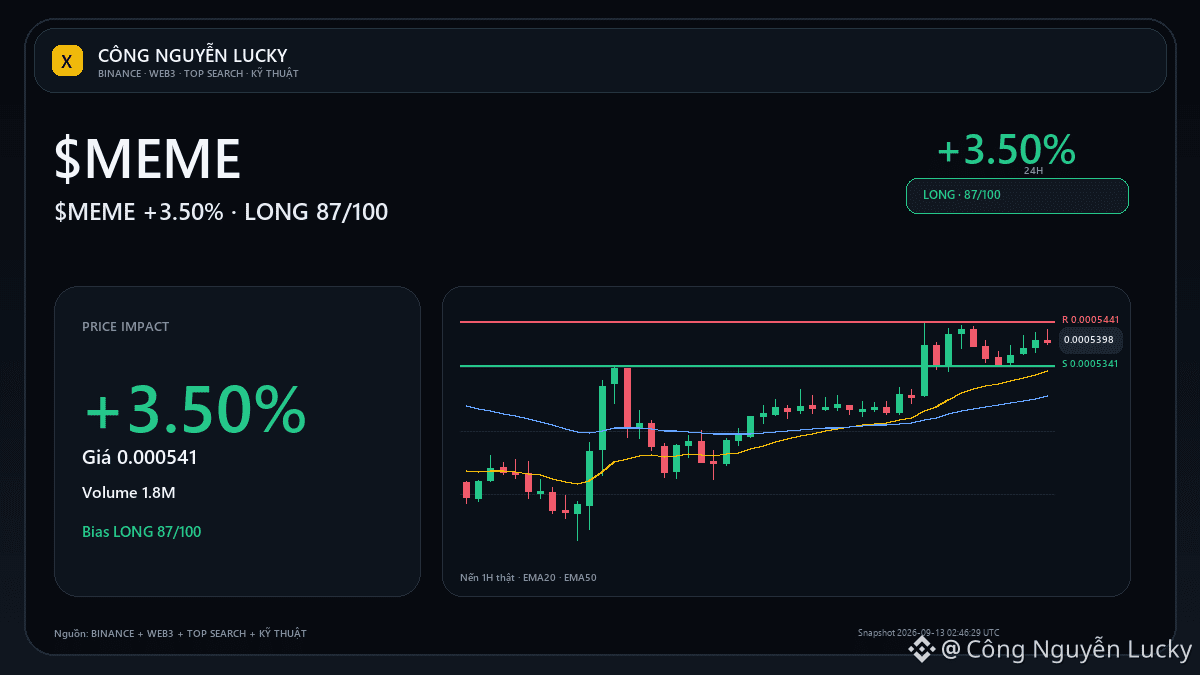
$MEME: what does your position within the daily range say?🔭 Look at $MEME instead of FOMO: the price is currently around 86% of the 24h range. Snapshot: 0.000541 · 24h +3.50% · volume ~1.8M USDT · 44,806 trades.
Distance to today’s top: ~0.6%. If it continues: breaking above 0.0005441 with increased open volume will make the continuation scenario more trustworthy.
If you miss the momentum: not being able to hold the high and falling back below the midpoint 0.00053305 will make the cooling-off scenario much clearer. 🧭 Current outlook: **LONG · STRONG · 87/100**.
$MEME: what does your position within the daily range say?
🔭 Look at $MEME instead of FOMO: the price is currently around 86% of the 24h range. Snapshot: 0.000541 · 24h +3.50% · volume ~1.8M USDT · 44,806 trades.
Distance to today’s top: ~0.6%. If it continues: breaking above 0.0005441 with increased open volume will make the continuation scenario more trustworthy.
If you miss the momentum: not being able to hold the high and falling back below the midpoint 0.00053305 will make the cooling-off scenario much clearer. 🧭 Current outlook: **LONG · STRONG · 87/100**.
Distance to today’s top: ~0.6%. If it continues: breaking above 0.0005441 with increased open volume will make the continuation scenario more trustworthy.
If you miss the momentum: not being able to hold the high and falling back below the midpoint 0.00053305 will make the cooling-off scenario much clearer. 🧭 Current outlook: **LONG · STRONG · 87/100**.
239
·
--
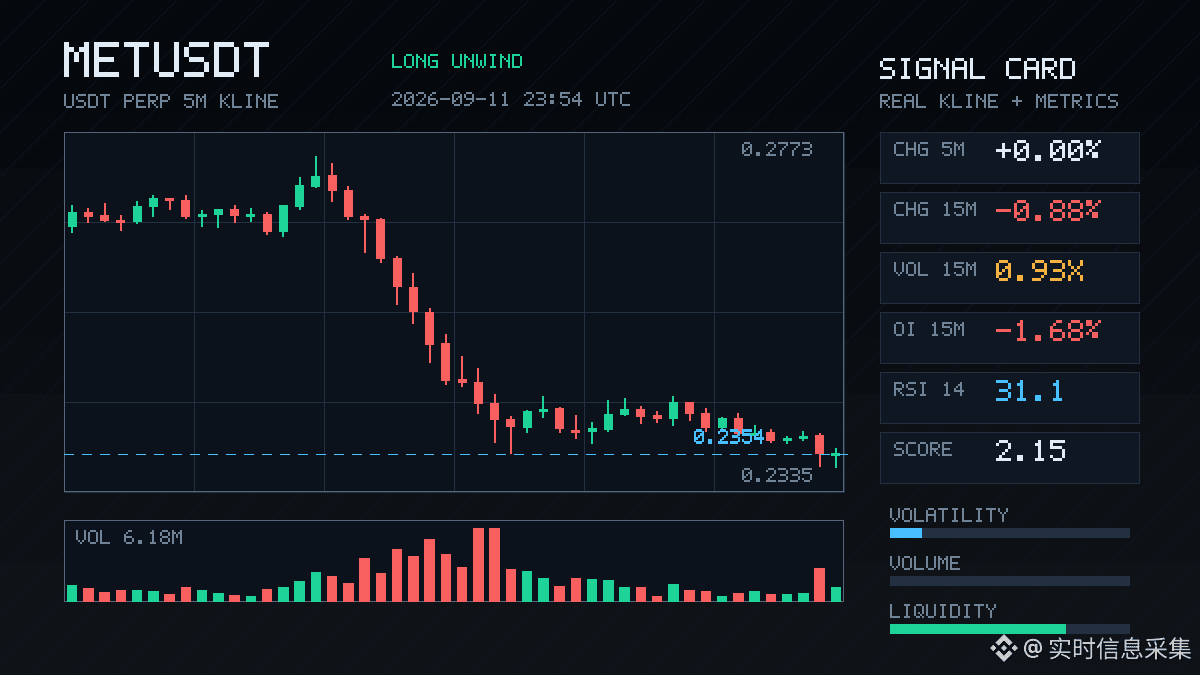
$MET This 15m drop isn’t that harsh, -0.88%, but the contract side moved much more than the price. OI over 1h dropped by 4.62% right away—its notional shrank by more than 420k U. Even on 15m it’s still decreasing, -1.68%. Price is falling + OI is dropping = typical longs are withdrawing: stop-losses or actively reducing positions, not a fresh short entry smashing it down.
Funding rates are still in the high percentile recently—interesting. If the rate is expensive and longs can’t hold, then after a small dip it’s easy to trigger deleveraging. Active trading is down about -4%, the buy/sell ratio is 0.92. Sell-side is slightly dominant, but not to the level of panic. Volume is 0.93x, basically normal, and volatility Z is only 0.52.
Abnormal percentile across the pool is 81.3%, ranking #20; notional change is #29. It’s not the most eye-catching, but combined with the funding rate being high, the long crowding really should get released a bit. 24h turnover is 156M—liquidity is still there, so there’s no need to worry too much about depth.
With this kind of structure, I generally wouldn’t rush to step in. I’d wait for OI to stabilize and for the funding rate to fall before looking again. The process of longs deleveraging often doesn’t end with just one needle-like move.
$MET This 15m drop isn’t that harsh, -0.88%, but the contract side moved much more than the price. OI over 1h dropped by 4.62% right away—its notional shrank by more than 420k U. Even on 15m it’s still decreasing, -1.68%. Price is falling + OI is dropping = typical longs are withdrawing: stop-losses or actively reducing positions, not a fresh short entry smashing it down.
Funding rates are still in the high percentile recently—interesting. If the rate is expensive and longs can’t hold, then after a small dip it’s easy to trigger deleveraging. Active trading is down about -4%, the buy/sell ratio is 0.92. Sell-side is slightly dominant, but not to the level of panic. Volume is 0.93x, basically normal, and volatility Z is only 0.52.
Abnormal percentile across the pool is 81.3%, ranking #20; notional change is #29. It’s not the most eye-catching, but combined with the funding rate being high, the long crowding really should get released a bit. 24h turnover is 156M—liquidity is still there, so there’s no need to worry too much about depth.
With this kind of structure, I generally wouldn’t rush to step in. I’d wait for OI to stabilize and for the funding rate to fall before looking again. The process of longs deleveraging often doesn’t end with just one needle-like move.
Funding rates are still in the high percentile recently—interesting. If the rate is expensive and longs can’t hold, then after a small dip it’s easy to trigger deleveraging. Active trading is down about -4%, the buy/sell ratio is 0.92. Sell-side is slightly dominant, but not to the level of panic. Volume is 0.93x, basically normal, and volatility Z is only 0.52.
Abnormal percentile across the pool is 81.3%, ranking #20; notional change is #29. It’s not the most eye-catching, but combined with the funding rate being high, the long crowding really should get released a bit. 24h turnover is 156M—liquidity is still there, so there’s no need to worry too much about depth.
With this kind of structure, I generally wouldn’t rush to step in. I’d wait for OI to stabilize and for the funding rate to fall before looking again. The process of longs deleveraging often doesn’t end with just one needle-like move.
16
·
--
ASTER This 15m move is kind of interesting.
The price dropped 0.74%, yet volume surged to 7.18x, and the close broke below the lower band of the past 20+ 5m candles. On the surface it looks like a breakdown, but the OI (open interest) is still rising. This shows a pattern of price falling while OI increases—more like new leveraged short positions being added to push it down, not just long liquidations.
Active trade imbalance is -6.8%, buy/sell ratio is 0.87, and sell-side pressure is there. However, the nominal change is negative: a bit over -300k U, and within 1h it's only about -390k U. The absolute volume isn’t that big. The abnormal percentile is 67.5%, ranking #29 in the whole pool and #22 nominally—front-runner, but not the most extreme tier.
With this kind of structure, I generally wouldn’t rush to chase shorts. Even though volume is expanding and there’s a breakdown, the OI increase isn’t aggressive enough—more like short-term leverage is probing. To really confirm, you need to see whether there will be continued active sell orders hammering it next. In the last 24h there’s $59.72m U in traded value; the pool is deep, so don’t get fooled into thinking a single 15m candle tells the whole story.
ASTER This 15m move is kind of interesting.
The price dropped 0.74%, yet volume surged to 7.18x, and the close broke below the lower band of the past 20+ 5m candles. On the surface it looks like a breakdown, but the OI (open interest) is still rising. This shows a pattern of price falling while OI increases—more like new leveraged short positions being added to push it down, not just long liquidations.
Active trade imbalance is -6.8%, buy/sell ratio is 0.87, and sell-side pressure is there. However, the nominal change is negative: a bit over -300k U, and within 1h it's only about -390k U. The absolute volume isn’t that big. The abnormal percentile is 67.5%, ranking #29 in the whole pool and #22 nominally—front-runner, but not the most extreme tier.
With this kind of structure, I generally wouldn’t rush to chase shorts. Even though volume is expanding and there’s a breakdown, the OI increase isn’t aggressive enough—more like short-term leverage is probing. To really confirm, you need to see whether there will be continued active sell orders hammering it next. In the last 24h there’s $59.72m U in traded value; the pool is deep, so don’t get fooled into thinking a single 15m candle tells the whole story.
The price dropped 0.74%, yet volume surged to 7.18x, and the close broke below the lower band of the past 20+ 5m candles. On the surface it looks like a breakdown, but the OI (open interest) is still rising. This shows a pattern of price falling while OI increases—more like new leveraged short positions being added to push it down, not just long liquidations.
Active trade imbalance is -6.8%, buy/sell ratio is 0.87, and sell-side pressure is there. However, the nominal change is negative: a bit over -300k U, and within 1h it's only about -390k U. The absolute volume isn’t that big. The abnormal percentile is 67.5%, ranking #29 in the whole pool and #22 nominally—front-runner, but not the most extreme tier.
With this kind of structure, I generally wouldn’t rush to chase shorts. Even though volume is expanding and there’s a breakdown, the OI increase isn’t aggressive enough—more like short-term leverage is probing. To really confirm, you need to see whether there will be continued active sell orders hammering it next. In the last 24h there’s $59.72m U in traded value; the pool is deep, so don’t get fooled into thinking a single 15m candle tells the whole story.
11
·
--
ATOM This move feels a bit off.
In the 15m, price dropped straight by 1.72%, volume surged to 2.90x, volatility (Z) reached 2.70, and the close also fell below the lower bound of the last 20 consecutive 5m candles. This isn’t the kind of low-volume, slow bearish drift—someone is actively smashing it down. Active trading shows a negative spread of -20.4%, buy-sell ratio at 0.66, with sell pressure clearly dominant.
But what really catches my attention is the OI. As price falls, OI is actually being slightly lifted: 15m +0.02%, 1h +0.08%. The nominal change is negative, which suggests it’s not simply long-liquidation clearing—more like new leveraged short positions entering. The abnormal percentile is 76%, in the full pool #29; nominal change ranks #38. It’s not extremely abnormal on its own, but combined with the breakout breakdown on heavy volume, this setup is worth watching.
Simply put: someone is betting on it continuing lower, using leverage.
After the breakdown, I’m watching two points now—first, whether the level that was broken can be reclaimed quickly; if it can’t be reclaimed, this lower bound will turn into resistance. Second, if OI keeps building up while price doesn’t bounce, the fuel for a short squeeze is also accumulating, so it wouldn’t be surprising to see a sharp reversal needle in the opposite direction.
With 24h turnover only 39M, liquidity isn’t thick. Don’t chase at this spot—wait for confirmation. $ATOM
ATOM This move feels a bit off.
In the 15m, price dropped straight by 1.72%, volume surged to 2.90x, volatility (Z) reached 2.70, and the close also fell below the lower bound of the last 20 consecutive 5m candles. This isn’t the kind of low-volume, slow bearish drift—someone is actively smashing it down. Active trading shows a negative spread of -20.4%, buy-sell ratio at 0.66, with sell pressure clearly dominant.
But what really catches my attention is the OI. As price falls, OI is actually being slightly lifted: 15m +0.02%, 1h +0.08%. The nominal change is negative, which suggests it’s not simply long-liquidation clearing—more like new leveraged short positions entering. The abnormal percentile is 76%, in the full pool #29; nominal change ranks #38. It’s not extremely abnormal on its own, but combined with the breakout breakdown on heavy volume, this setup is worth watching.
Simply put: someone is betting on it continuing lower, using leverage.
After the breakdown, I’m watching two points now—first, whether the level that was broken can be reclaimed quickly; if it can’t be reclaimed, this lower bound will turn into resistance. Second, if OI keeps building up while price doesn’t bounce, the fuel for a short squeeze is also accumulating, so it wouldn’t be surprising to see a sharp reversal needle in the opposite direction.
With 24h turnover only 39M, liquidity isn’t thick. Don’t chase at this spot—wait for confirmation. $ATOM
In the 15m, price dropped straight by 1.72%, volume surged to 2.90x, volatility (Z) reached 2.70, and the close also fell below the lower bound of the last 20 consecutive 5m candles. This isn’t the kind of low-volume, slow bearish drift—someone is actively smashing it down. Active trading shows a negative spread of -20.4%, buy-sell ratio at 0.66, with sell pressure clearly dominant.
But what really catches my attention is the OI. As price falls, OI is actually being slightly lifted: 15m +0.02%, 1h +0.08%. The nominal change is negative, which suggests it’s not simply long-liquidation clearing—more like new leveraged short positions entering. The abnormal percentile is 76%, in the full pool #29; nominal change ranks #38. It’s not extremely abnormal on its own, but combined with the breakout breakdown on heavy volume, this setup is worth watching.
Simply put: someone is betting on it continuing lower, using leverage.
After the breakdown, I’m watching two points now—first, whether the level that was broken can be reclaimed quickly; if it can’t be reclaimed, this lower bound will turn into resistance. Second, if OI keeps building up while price doesn’t bounce, the fuel for a short squeeze is also accumulating, so it wouldn’t be surprising to see a sharp reversal needle in the opposite direction.
With 24h turnover only 39M, liquidity isn’t thick. Don’t chase at this spot—wait for confirmation. $ATOM

9


·
--
ESPORTS Volatility AnalysisESPORTS 24h is still down -10.7%, but note that this data is from a rebound off the lows. In the last 1h, it has already surged +8.8%—the price has returned to $0.01206, and volume has expanded to 2.4x. After a typical dump, someone comes in to pick up cheap coins; the RR is set at 2.1, and the monitoring flags it as a reversal and triggers in the opposite direction, scaling in with 4 urgent orders—indicating this move isn’t just minor noise.
But there’s a key issue: the signal direction hasn’t been confirmed. Even the robot wrote it itself—wait for the next 1h candlestick to confirm direction. At times like this, jumping in is a gamble: if you’re right, you get a bite of profit; if you’re wrong, you’re catching a falling knife. The 24h is still stuck in the low zone, ranging from -10% to -30%, which suggests the larger timeframe trend hasn’t been repaired—what you’re seeing is just an oversold rebound, not a true reversal.
ESPORTS Volatility Analysis
ESPORTS 24h is still down -10.7%, but note that this data is from a rebound off the lows. In the last 1h, it has already surged +8.8%—the price has returned to $0.01206, and volume has expanded to 2.4x. After a typical dump, someone comes in to pick up cheap coins; the RR is set at 2.1, and the monitoring flags it as a reversal and triggers in the opposite direction, scaling in with 4 urgent orders—indicating this move isn’t just minor noise.
But there’s a key issue: the signal direction hasn’t been confirmed. Even the robot wrote it itself—wait for the next 1h candlestick to confirm direction. At times like this, jumping in is a gamble: if you’re right, you get a bite of profit; if you’re wrong, you’re catching a falling knife. The 24h is still stuck in the low zone, ranging from -10% to -30%, which suggests the larger timeframe trend hasn’t been repaired—what you’re seeing is just an oversold rebound, not a true reversal.
But there’s a key issue: the signal direction hasn’t been confirmed. Even the robot wrote it itself—wait for the next 1h candlestick to confirm direction. At times like this, jumping in is a gamble: if you’re right, you get a bite of profit; if you’re wrong, you’re catching a falling knife. The 24h is still stuck in the low zone, ranging from -10% to -30%, which suggests the larger timeframe trend hasn’t been repaired—what you’re seeing is just an oversold rebound, not a true reversal.
261
·
--
Behind a 29% surge, the funding rate is only 0.01%—what does that indicate?
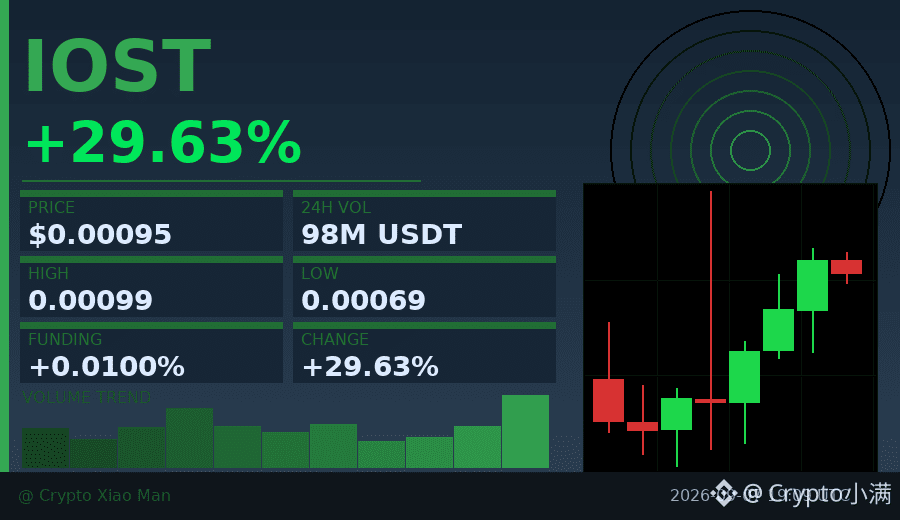
Today, IOST has moved very cleanly with rising volume and price in tandem. Within 8 hours, it climbed from 0.00069 to 0.000945, with trading volume building up to 98 million U. However, the long-to-short ratio of 56% to 44% isn’t extremely crowded.
The key was the breakout on the 4th candlestick—transaction volume reached 22.3 billion, lifting the price directly from 0.00086 to 0.00098. After that, the following candles consistently held above 0.0009, with no significant pullback. This kind of trend is more sustainable than simply pumping one large bullish candle.
The bulls are in control, but not to a疯狂 level; the funding rate is also still moderate. If it can continue to hold the 0.00092 support level as a platform, there should be more room ahead.
$IOST #量价齐升 #29.63%
Click the small card below to quickly check the行情👇
Behind a 29% surge, the funding rate is only 0.01%—what does that indicate?
Today, IOST has moved very cleanly with rising volume and price in tandem. Within 8 hours, it climbed from 0.00069 to 0.000945, with trading volume building up to 98 million U. However, the long-to-short ratio of 56% to 44% isn’t extremely crowded.
The key was the breakout on the 4th candlestick—transaction volume reached 22.3 billion, lifting the price directly from 0.00086 to 0.00098. After that, the following candles consistently held above 0.0009, with no significant pullback. This kind of trend is more sustainable than simply pumping one large bullish candle.
The bulls are in control, but not to a疯狂 level; the funding rate is also still moderate. If it can continue to hold the 0.00092 support level as a platform, there should be more room ahead.
$IOST #量价齐升 #29.63%
Click the small card below to quickly check the行情👇
Today, IOST has moved very cleanly with rising volume and price in tandem. Within 8 hours, it climbed from 0.00069 to 0.000945, with trading volume building up to 98 million U. However, the long-to-short ratio of 56% to 44% isn’t extremely crowded.
The key was the breakout on the 4th candlestick—transaction volume reached 22.3 billion, lifting the price directly from 0.00086 to 0.00098. After that, the following candles consistently held above 0.0009, with no significant pullback. This kind of trend is more sustainable than simply pumping one large bullish candle.
The bulls are in control, but not to a疯狂 level; the funding rate is also still moderate. If it can continue to hold the 0.00092 support level as a platform, there should be more room ahead.
$IOST #量价齐升 #29.63%
Click the small card below to quickly check the行情👇
90
·
--
Behind the 29% surge, the funding rate has already risen to 0.038% — longs are starting to pay a premium.
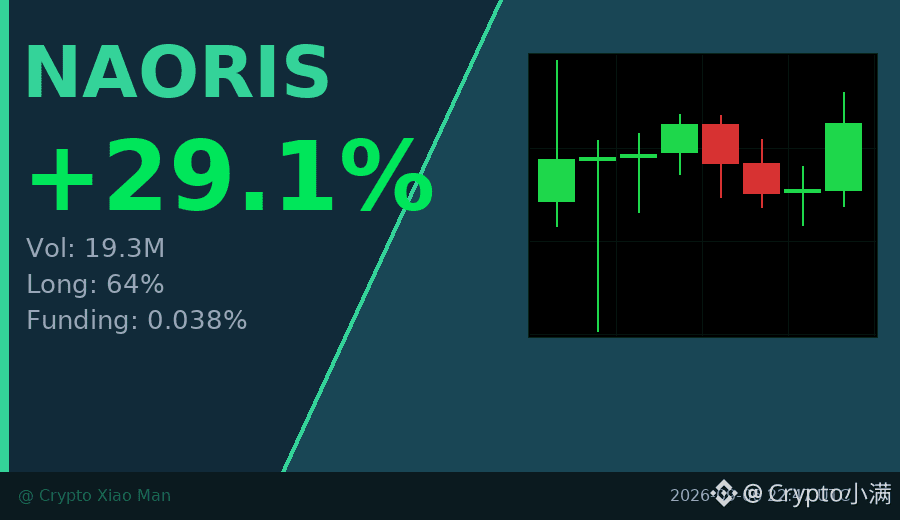
NAORIS trading volume jumped to 19.3 million USDT today, with 64% of people on the long side.
Three consecutive hourly candles closed green, showing the buying pressure isn’t just a one-off move; someone is continuously accumulating.
But don’t rush — the price is still some way below the intraday high of 0.0411.
If it can’t break through, some short-term traders may take profits.
I’ll watch whether there’s support around 0.038 before deciding whether to follow.
$NAORIS #资金费率飙升 #29%
Click the small card below to quickly check the market 👇
Behind the 29% surge, the funding rate has already risen to 0.038% — longs are starting to pay a premium.
NAORIS trading volume jumped to 19.3 million USDT today, with 64% of people on the long side.
Three consecutive hourly candles closed green, showing the buying pressure isn’t just a one-off move; someone is continuously accumulating.
But don’t rush — the price is still some way below the intraday high of 0.0411.
If it can’t break through, some short-term traders may take profits.
I’ll watch whether there’s support around 0.038 before deciding whether to follow.
$NAORIS #资金费率飙升 #29%
Click the small card below to quickly check the market 👇
NAORIS trading volume jumped to 19.3 million USDT today, with 64% of people on the long side.
Three consecutive hourly candles closed green, showing the buying pressure isn’t just a one-off move; someone is continuously accumulating.
But don’t rush — the price is still some way below the intraday high of 0.0411.
If it can’t break through, some short-term traders may take profits.
I’ll watch whether there’s support around 0.038 before deciding whether to follow.
$NAORIS #资金费率飙升 #29%
Click the small card below to quickly check the market 👇
35
Log in to explore more content
Join global crypto users on Binance Square
⚡️ Get latest and useful information about crypto.
💬 Trusted by the world’s largest crypto exchange.
👍 Discover real insights from verified creators.
Email / Phone number
Trending Topics
1
#NEARRisesNearly80%InAWeek
7,365 views
474 Discussing
2
#MultiversXPlansHardForkRecovery
8,575 views
405 Discussing
3
#CircleLaunchesInstitutionalBTCBackedBorrowing
11,248 views
543 Discussing
4
#BitcoinHits$85K
14,348 views
236 Discussing
5
#ZetaChainVotesToMigrateZETAToSolana
9,399 views
335 Discussing
6
#ECBStartsBlockchainEuroSettlement
23,803 views
629 Discussing
7
#SouthAfricaProposesCryptoExchangeControls
36,415 views
812 Discussing
8
#SolanaCutsTargetSlotTimeTo250ms
38,344 views
724 Discussing
9
#EthereumSurpasses$2700
24,638 views
223 Discussing
10
#CanaryFilesSecondAmendmentForStakedSEIETF
54,223 views
1,059 Discussing