Binance Square
#writetoearn2026

writetoearn2026

99,525 views
597 Discussing
320 WYATT
·
--
Bullish
Bitcoin Up or Down on September 22?

Bitcoin Up or Down on September 22?

99%Up1%Down
Volume $88,359.45
ابوالعز1123:
تحليل ممتاز يا Wyatt، وانت كنت دقيق جداً، $BTC فعلاً لمس 85,000 كحد أدنى زي ما قولت ودلوقتي راجع من 86 لـ 85,418 ودي حركة صحية لإعادة اختبار النمط. اتفق معاك ان اللمسة دي تعتبر نتيجة ضعيفة، والهدف الثابت اللي انت محدده 88,600 - 92,220 منطقي جداً كمنطقة سيولة، و 97,637 هدف ممتد لو كسرنا 92,220 بفوليوم. أنا شايف التصويت 68% Down ده معناه خوف زايد وده عادة إشارة انعكاس قريب. سؤال: هل شايف اننا هنعمل Higher Low عند 85,000 قبل الانطلاق لـ 88,600 ولا ممكن ننزل نختبر 84,200 الأول؟ متابعك.
·
--
Bullish
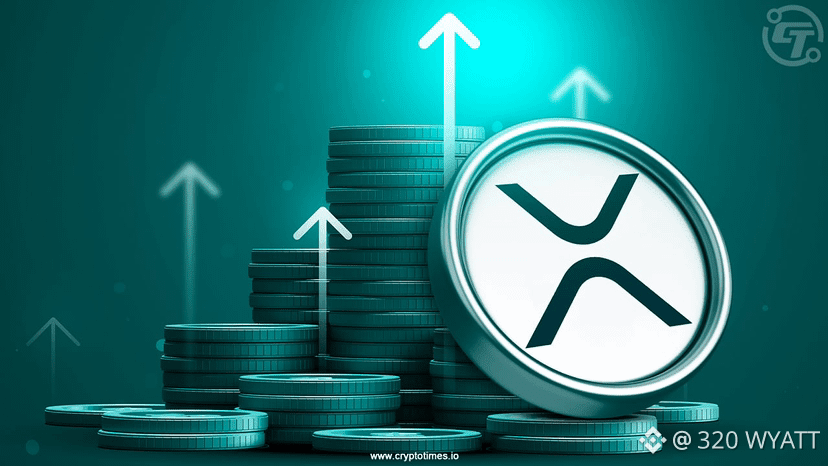
$XRP {spot}(XRPUSDT) XRP surged 7% to break the $1.50 mark, driven by broader crypto momentum, easing macroeconomic headwinds, and the upcoming Batch V1.1 ledger upgrade. However, sustained bullish continuation faces hurdles, including capital concentration in SEC-exempted sectors, zero net inflows for spot ETFs, and strong selling pressure near the $1.70 resistance level. Consequently, XRP remains confined within its broader consolidation pattern rather than entering a definitive one-sided upside trend. #xrp320 #Trendingissue #mr320 #WriteToEarn2026 #Trendingcoin320
$XRP
XRP surged 7% to break the $1.50 mark, driven by broader crypto momentum, easing macroeconomic headwinds, and the upcoming Batch V1.1 ledger upgrade. However, sustained bullish continuation faces hurdles, including capital concentration in SEC-exempted sectors, zero net inflows for spot ETFs, and strong selling pressure near the $1.70 resistance level. Consequently, XRP remains confined within its broader consolidation pattern rather than entering a definitive one-sided upside trend.

#xrp320 #Trendingissue #mr320 #WriteToEarn2026 #Trendingcoin320
Article
Bitcoin Price Prediction: BTC Soars Past $87,000, Will It Continue to Rise This Year?$BTC {spot}(BTCUSDT) Bitcoin strongly broke through the past month's resistance level of $82,000, surging over 5% intraday to briefly reach $87,000, setting an 8-month high. As of press time, Bitcoin price has pulled back, temporarily trading at $85,265. Following a rate hike by the U.S. Federal Reserve (Fed) on September 16 and the failure of the U.S. Congress to pass the cryptocurrency bill "CLARITY Act," the market experienced a brief decline. However, as the market quickly digested this negative news, improving macroeconomic conditions and a rebound in risk appetite provided new support for Bitcoin prices. Specifically, lower U.S. Treasury yields improved market liquidity conditions, while international crude oil prices fell noticeably by over 3%, lowering global inflation expectations and creating room for a rebound in risk assets. Yesterday, the three major U.S. stock indices rose across the board, with the Nasdaq Composite Index surging over 2%. As overall market risk appetite warmed up, capital simultaneously flooded into high-elasticity assets like Bitcoin, with U.S. spot Bitcoin ETFs recording a net inflow of approximately $1 billion yesterday, setting a single-day high since October 2025. Of course, after breaking out of the long-standing consolidation range and psychological barrier of $80,000–$82,000, Bitcoin presented strong bullish signals on technical charts. This not only triggered buying orders from numerous quantitative trading programs but also attracted FOMO buying from retail investors, further expanding gains. After Bitcoin briefly touched $87,000, Nansen analyst Nicolai Sondergaard believes the next key level is $90,000–$92,000, which coincides with the 0.5 Fibonacci resistance level. However, after surging higher, Bitcoin price quickly triggered selling pressure, leading to a significant pullback. From a technical analysis perspective, there is a need for Bitcoin price to retest $82,000, a former resistance level that has turned into support; thus, as long as it does not fall below this level, it remains a healthy correction. bitcoin-btc-price-d1c94f408f87414fa0462021611ab4acBitcoin price chart, Source: TradingView Currently, U.S. crypto regulation leans favorable, though macroeconomic uncertainty may tilt toward tightening; nevertheless, falling international crude oil prices have lowered global inflation expectations. If inflationary pressures ease further, macroeconomic policies will shift toward supporting risk assets, and it is not ruled out that Bitcoin prices could continue to rally toward $100,000 this year.


Bitcoin Price Prediction: BTC Soars Past $87,000, Will It Continue to Rise This Year?

$BTC
Bitcoin strongly broke through the past month's resistance level of $82,000, surging over 5% intraday to briefly reach $87,000, setting an 8-month high. As of press time, Bitcoin price has pulled back, temporarily trading at $85,265.
Following a rate hike by the U.S. Federal Reserve (Fed) on September 16 and the failure of the U.S. Congress to pass the cryptocurrency bill "CLARITY Act," the market experienced a brief decline. However, as the market quickly digested this negative news, improving macroeconomic conditions and a rebound in risk appetite provided new support for Bitcoin prices.
Specifically, lower U.S. Treasury yields improved market liquidity conditions, while international crude oil prices fell noticeably by over 3%, lowering global inflation expectations and creating room for a rebound in risk assets. Yesterday, the three major U.S. stock indices rose across the board, with the Nasdaq Composite Index surging over 2%. As overall market risk appetite warmed up, capital simultaneously flooded into high-elasticity assets like Bitcoin, with U.S. spot Bitcoin ETFs recording a net inflow of approximately $1 billion yesterday, setting a single-day high since October 2025.
Of course, after breaking out of the long-standing consolidation range and psychological barrier of $80,000–$82,000, Bitcoin presented strong bullish signals on technical charts. This not only triggered buying orders from numerous quantitative trading programs but also attracted FOMO buying from retail investors, further expanding gains.
After Bitcoin briefly touched $87,000, Nansen analyst Nicolai Sondergaard believes the next key level is $90,000–$92,000, which coincides with the 0.5 Fibonacci resistance level. However, after surging higher, Bitcoin price quickly triggered selling pressure, leading to a significant pullback. From a technical analysis perspective, there is a need for Bitcoin price to retest $82,000, a former resistance level that has turned into support; thus, as long as it does not fall below this level, it remains a healthy correction.
bitcoin-btc-price-d1c94f408f87414fa0462021611ab4acBitcoin price chart, Source: TradingView
Currently, U.S. crypto regulation leans favorable, though macroeconomic uncertainty may tilt toward tightening; nevertheless, falling international crude oil prices have lowered global inflation expectations. If inflationary pressures ease further, macroeconomic policies will shift toward supporting risk assets, and it is not ruled out that Bitcoin prices could continue to rally toward $100,000 this year.

·
--
Bullish
$ARB {spot}(ARBUSDT) Arbitrum is the strongest performer of the past four weeks. The ARB price stands at $0.246, a gain of around 17 percent within 24 hours, a good 82 percent over the week and around 151 percent across 30 days (CoinGecko, September 21, 2026, 13:12 UTC). No other asset in the top 60 has covered comparable ground over the same period. Many of this week's price jumps trace back to a single rumour. This one rests on a measurable shift in activity instead. Two developments carry it, and both come with a catch. #arb #Trendingissue #mr320 #WriteToEarn2026 #Trendingcoin320
$ARB
Arbitrum is the strongest performer of the past four weeks. The ARB price stands at $0.246, a gain of around 17 percent within 24 hours, a good 82 percent over the week and around 151 percent across 30 days (CoinGecko, September 21, 2026, 13:12 UTC). No other asset in the top 60 has covered comparable ground over the same period.
Many of this week's price jumps trace back to a single rumour. This one rests on a measurable shift in activity instead. Two developments carry it, and both come with a catch.

#arb #Trendingissue #mr320 #WriteToEarn2026 #Trendingcoin320
·
--
Bearish
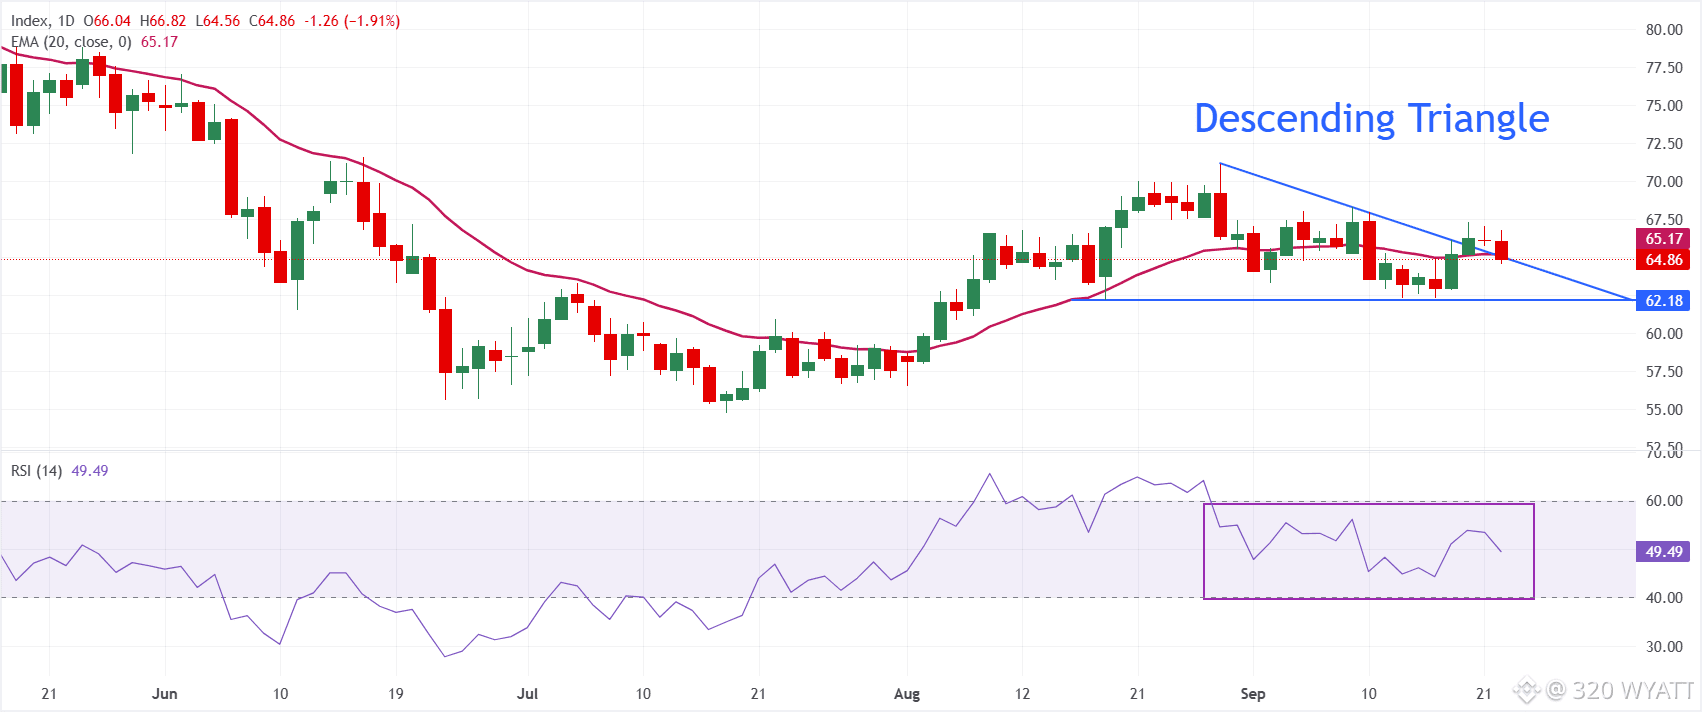
$XAG {future}(XAGUSDT) In the daily chart, XAG/USD trades at $64.90, keeping a bearish near-term tone as it remains capped by the 20-day Moving Average Exponential (EMA) at $65.18. Price trades close to the broken downward resistance trend line, while the Relative Strength Index (14) around 50 hints at neutral momentum that fails to offset the overhead technical barriers. On the topside, initial resistance is located at the 20-day EMA at $65.18, which continues to limit recovery attempts in the short term. On the downside, the former resistance trend line turning into support around $64.26 is the first level to watch, as a daily close below this area would likely expose XAG/USD to renewed selling pressure. #silver320 #mr320 #Trendingissue #Trendingcoin320 #WriteToEarn2026
$XAG
In the daily chart, XAG/USD trades at $64.90, keeping a bearish near-term tone as it remains capped by the 20-day Moving Average Exponential (EMA) at $65.18. Price trades close to the broken downward resistance trend line, while the Relative Strength Index (14) around 50 hints at neutral momentum that fails to offset the overhead technical barriers.
On the topside, initial resistance is located at the 20-day EMA at $65.18, which continues to limit recovery attempts in the short term. On the downside, the former resistance trend line turning into support around $64.26 is the first level to watch, as a daily close below this area would likely expose XAG/USD to renewed selling pressure.

#silver320 #mr320 #Trendingissue #Trendingcoin320 #WriteToEarn2026
·
--
Bullish
$XRP {spot}(XRPUSDT) XRP/USD is trading above all key moving averages: MA-20 at $1.3836, MA-50 at $1.2707, and MA-200 at $1.2733, signaling upward momentum across all major timeframes. The current market structure supports continued bullish confirmation, with next resistance at $1.7496 and near-term support at $1.5743. Momentum indicators show strong buyer control with MACD and ADX in buy mode, RSI at 63.795 just below overbought, Stochastic RSI at 100 and CCI at 159.5118 both indicating overbought conditions. Bull/Bear Power remains positive, and the Awesome Oscillator confirms further short-term strength. Trading activity shows XRP/USD climbing $0.096, or 6.44%, after opening with a 3.12% upside gap and holding near intraday highs amid 4.09% volatility. While momentum remains strong, overbought warnings from oscillators begin to emerge. #xrp320 #Trendingissue #Trendingcoin320 #WriteToEarn2026 #mr320
$XRP
XRP/USD is trading above all key moving averages: MA-20 at $1.3836, MA-50 at $1.2707, and MA-200 at $1.2733, signaling upward momentum across all major timeframes. The current market structure supports continued bullish confirmation, with next resistance at $1.7496 and near-term support at $1.5743. Momentum indicators show strong buyer control with MACD and ADX in buy mode, RSI at 63.795 just below overbought, Stochastic RSI at 100 and CCI at 159.5118 both indicating overbought conditions. Bull/Bear Power remains positive, and the Awesome Oscillator confirms further short-term strength. Trading activity shows XRP/USD climbing $0.096, or 6.44%, after opening with a 3.12% upside gap and holding near intraday highs amid 4.09% volatility. While momentum remains strong, overbought warnings from oscillators begin to emerge.

#xrp320 #Trendingissue #Trendingcoin320 #WriteToEarn2026 #mr320
·
--
Bullish
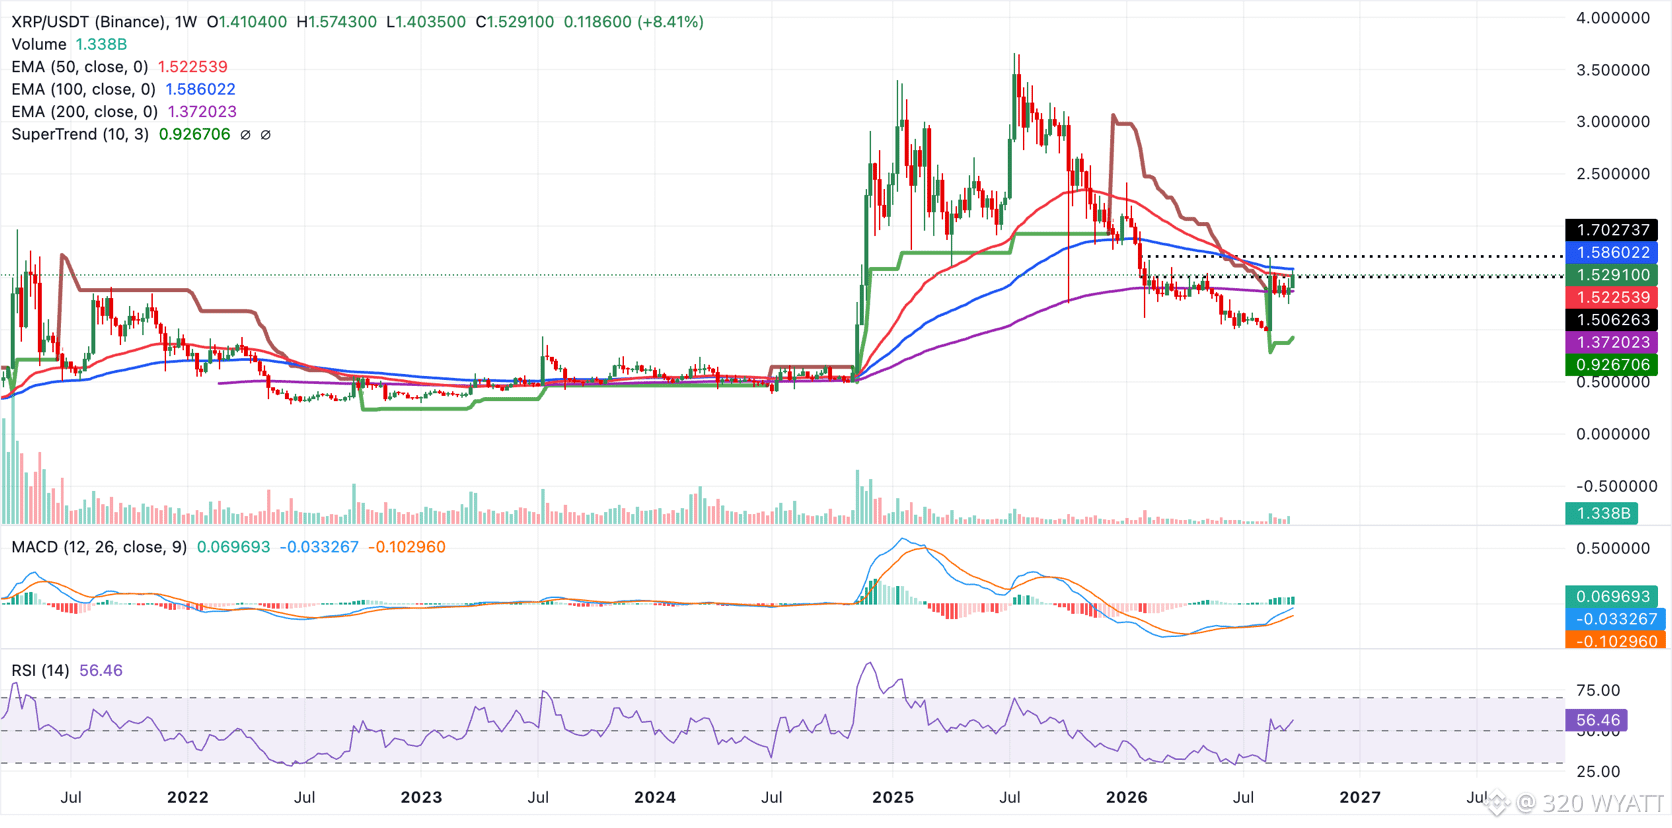
$XRP {spot}(XRPUSDT) 🚨Technical Analysis: XRP bulls broadly retain control🚨 XRP trades at $1.52, maintaining a bullish near-term bias as price holds well above the main Exponential Moving Averages (EMAs). The 50-day EMA at $1.32, the 100-day EMA at $1.28, and the 200-day EMA at $1.36 sit below spot, suggesting a constructive underlying trend, while the SuperTrend line at $1.26 adds structural support. Momentum remains positive, with the Moving Average Convergence Divergence (MACD) histogram above zero hinting at persistent bullish pressure. The Relative Strength Index (RSI) at 64 reinforces a strong but not yet overbought backdrop. Immediate support is seen at the 200-day EMA near $1.36, with the shorter 50-day EMA at $1.32 and the 100-day EMA at $1.28 forming a secondary demand band on deeper pullbacks. A more strategic floor emerges around the SuperTrend level at $1.26, where buyers would be expected to defend the broader uptrend. With no structural resistance levels shown on the daily chart, the pair appears technically free to probe higher ground in the near term, as long as daily closes remain above the immediate $1.40-$1.50 psychological demand. At the same time, the remittance token maintains a bullish near-term bias as price holds above the 50-week EMA at $1.52 and the longer-term 200-week EMA at $1.37. The SuperTrend line at $0.93 sits well below the market, reinforcing a supportive underlying structure, while RSI at 56 suggests constructive but not overextended momentum. On the topside, initial resistance is defined by the 100-week EMA at $1.59, which marks the next hurdle for bulls and a potential cap on the current advance if rejected. On the downside, immediate technical support sits at the 50-week EMA near $1.52, with a deeper protective layer at the 200-week EMA at $1.37, ahead of the more distant SuperTrend support zone around $0.93. #xrp320 #Trendingissue #mr320 #Trendingcoin320 #WriteToEarn2026
$XRP
🚨Technical Analysis: XRP bulls broadly retain control🚨

XRP trades at $1.52, maintaining a bullish near-term bias as price holds well above the main Exponential Moving Averages (EMAs). The 50-day EMA at $1.32, the 100-day EMA at $1.28, and the 200-day EMA at $1.36 sit below spot, suggesting a constructive underlying trend, while the SuperTrend line at $1.26 adds structural support.
Momentum remains positive, with the Moving Average Convergence Divergence (MACD) histogram above zero hinting at persistent bullish pressure. The Relative Strength Index (RSI) at 64 reinforces a strong but not yet overbought backdrop.
Immediate support is seen at the 200-day EMA near $1.36, with the shorter 50-day EMA at $1.32 and the 100-day EMA at $1.28 forming a secondary demand band on deeper pullbacks. A more strategic floor emerges around the SuperTrend level at $1.26, where buyers would be expected to defend the broader uptrend. With no structural resistance levels shown on the daily chart, the pair appears technically free to probe higher ground in the near term, as long as daily closes remain above the immediate $1.40-$1.50 psychological demand.
At the same time, the remittance token maintains a bullish near-term bias as price holds above the 50-week EMA at $1.52 and the longer-term 200-week EMA at $1.37. The SuperTrend line at $0.93 sits well below the market, reinforcing a supportive underlying structure, while RSI at 56 suggests constructive but not overextended momentum.
On the topside, initial resistance is defined by the 100-week EMA at $1.59, which marks the next hurdle for bulls and a potential cap on the current advance if rejected. On the downside, immediate technical support sits at the 50-week EMA near $1.52, with a deeper protective layer at the 200-week EMA at $1.37, ahead of the more distant SuperTrend support zone around $0.93.

#xrp320 #Trendingissue #mr320 #Trendingcoin320 #WriteToEarn2026
·
--
Bullish
$BTC {spot}(BTCUSDT) Bitcoin BTC price is currently trading at $85,126.8, sitting just below the swing high of $87,396 and well above the 200-day moving average at $70,703.56. The Bitcoin BTC price analysis and chart reveal a market that has recovered aggressively from the swing low of $57,808.4, and we are now testing the upper portion of the intermediate range. The distance from the swing high suggests there is still room for upside expansion, and the overall market structure remains intact. The weight of evidence across our 10 indicators points to a bullish lean with a cumulative score of 7.3 out of 10. Bitcoin price is aligned above all four major moving averages, the Bollinger Bands are expanding in an uptrend, and the MACD momentum is building strength. Bitcoin crypto price action is being confirmed by rising on-balance volume and a double bottom chart pattern that suggests accumulation. The dominant narrative is one of continuation higher, though some intermediate caution is warranted given recent consolidation. #BTC320 #Trendingissue #Trendingcoin320 #WriteToEarn2026 #mr320
$BTC
Bitcoin BTC price is currently trading at $85,126.8, sitting just below the swing high of $87,396 and well above the 200-day moving average at $70,703.56. The Bitcoin BTC price analysis and chart reveal a market that has recovered aggressively from the swing low of $57,808.4, and we are now testing the upper portion of the intermediate range. The distance from the swing high suggests there is still room for upside expansion, and the overall market structure remains intact.
The weight of evidence across our 10 indicators points to a bullish lean with a cumulative score of 7.3 out of 10. Bitcoin price is aligned above all four major moving averages, the Bollinger Bands are expanding in an uptrend, and the MACD momentum is building strength. Bitcoin crypto price action is being confirmed by rising on-balance volume and a double bottom chart pattern that suggests accumulation. The dominant narrative is one of continuation higher, though some intermediate caution is warranted given recent consolidation.

#BTC320 #Trendingissue #Trendingcoin320 #WriteToEarn2026 #mr320
·
--
Bullish
$ETH {spot}(ETHUSDT) ETF inflows give Ethereum regulated demand beyond crypto-native exchanges. One $143.8 million session does not guarantee a lasting trend, but institutions added exposure as ETH reclaimed higher levels. Continued buying could support $2,800 and then $3,000. Ethereum's broader investment case remains anchored in smart contracts, stablecoins, tokenized assets and decentralized finance. Its large developer base and settlement activity give ETH several long-term demand channels. However, buyers should watch whether inflows persist, because one strong session can be reversed if macro conditions or Treasury yields turn against risk assets. #ETH320 #writetoearn2026 #mr320 #Trendingissue #EthereumSurpasses$2700
$ETH
ETF inflows give Ethereum regulated demand beyond crypto-native exchanges. One $143.8 million session does not guarantee a lasting trend, but institutions added exposure as ETH reclaimed higher levels. Continued buying could support $2,800 and then $3,000.
Ethereum's broader investment case remains anchored in smart contracts, stablecoins, tokenized assets and decentralized finance. Its large developer base and settlement activity give ETH several long-term demand channels. However, buyers should watch whether inflows persist, because one strong session can be reversed if macro conditions or Treasury yields turn against risk assets.

#ETH320 #writetoearn2026 #mr320 #Trendingissue #EthereumSurpasses$2700
Ethereum Up or Down on September 22?

Ethereum Up or Down on September 22?

1%Up99%Down
Volume $29,135.69
·
--
Bullish
$PEPE {spot}(PEPEUSDT) Pepe (PEPE) cryptocurrency surged 23.3% in 24 hours to $0.000005 on September 22, 2026, outperforming the broader crypto market's 2.45% gain. This spike is driven mainly by speculative trading and a broad meme-coin sector rotation during an Extreme Greed market sentiment, with no confirmed project-specific news or upgrades. On-chain data shows high wash trading (79.1%), indicating much of the volume is not organic, and a significant outflow of tokens from exchanges suggests accumulation. The rally's continuation depends on sustained outflows, stable market sentiment, and absence of sell pressure from large holders, but risks remain high due to lack of intrinsic value and potential for sharp corrections. Pepe (PEPE) is showing strong momentum on Pluang, trading at Rp0.0884 with a 22.77% increase in the last day. The market cap stands at Rp36.93 trillion, while trading volume reached Rp20.08 trillion. These figures are current as of Sep 22, 2026 08:02 WIB. #pepe320 #mr320 #Trendingissue #WriteToEarn2026 #PEPE‏
$PEPE
Pepe (PEPE) cryptocurrency surged 23.3% in 24 hours to $0.000005 on September 22, 2026, outperforming the broader crypto market's 2.45% gain. This spike is driven mainly by speculative trading and a broad meme-coin sector rotation during an Extreme Greed market sentiment, with no confirmed project-specific news or upgrades. On-chain data shows high wash trading (79.1%), indicating much of the volume is not organic, and a significant outflow of tokens from exchanges suggests accumulation. The rally's continuation depends on sustained outflows, stable market sentiment, and absence of sell pressure from large holders, but risks remain high due to lack of intrinsic value and potential for sharp corrections.
Pepe (PEPE) is showing strong momentum on Pluang, trading at Rp0.0884 with a 22.77% increase in the last day. The market cap stands at Rp36.93 trillion, while trading volume reached Rp20.08 trillion. These figures are current as of Sep 22, 2026 08:02 WIB.

#pepe320 #mr320 #Trendingissue #WriteToEarn2026 #PEPE‏
·
--
Bullish
$SOL {spot}(SOLUSDT) Solana's price surged to $117, reaching a key target outlined by analysts, supported by $47.62 million in US spot ETF inflows and a 73.61% jump in derivatives trading volume. Analysts see potential for a pullback before a push toward $120 or higher levels at $141 and $176 if $117 holds as support. Increased open interest and corporate treasury accumulation signal growing investor confidence, making $117 and $120 critical levels to watch for future price moves. Following the analyst confirmation of Solana reaching the $117 level, SOL is trading at Rp2.099.658 on Pluang as of Sep 22, 2026 16:51 WIB. The platform shows a 1-day gain of 1.20%, with a market cap of Rp1.228,7 trillion and a 24-hour trading volume of Rp116,03 trillion. Pluang users currently have a balanced order activity with 54% selling and 46% buying, and the typical hold time is around 70 days, indicating steady investor engagement. #solana320 #mr320 #Trendingissue #writetoearn2026 #Trendingcoin320
$SOL
Solana's price surged to $117, reaching a key target outlined by analysts, supported by $47.62 million in US spot ETF inflows and a 73.61% jump in derivatives trading volume. Analysts see potential for a pullback before a push toward $120 or higher levels at $141 and $176 if $117 holds as support. Increased open interest and corporate treasury accumulation signal growing investor confidence, making $117 and $120 critical levels to watch for future price moves.
Following the analyst confirmation of Solana reaching the $117 level, SOL is trading at Rp2.099.658 on Pluang as of Sep 22, 2026 16:51 WIB. The platform shows a 1-day gain of 1.20%, with a market cap of Rp1.228,7 trillion and a 24-hour trading volume of Rp116,03 trillion. Pluang users currently have a balanced order activity with 54% selling and 46% buying, and the typical hold time is around 70 days, indicating steady investor engagement.

#solana320 #mr320 #Trendingissue #writetoearn2026 #Trendingcoin320
·
--
Bullish
Bitcoin Up or Down on September 22?

Bitcoin Up or Down on September 22?

99%Up1%Down
Volume $88,359.45
·
--
Bullish
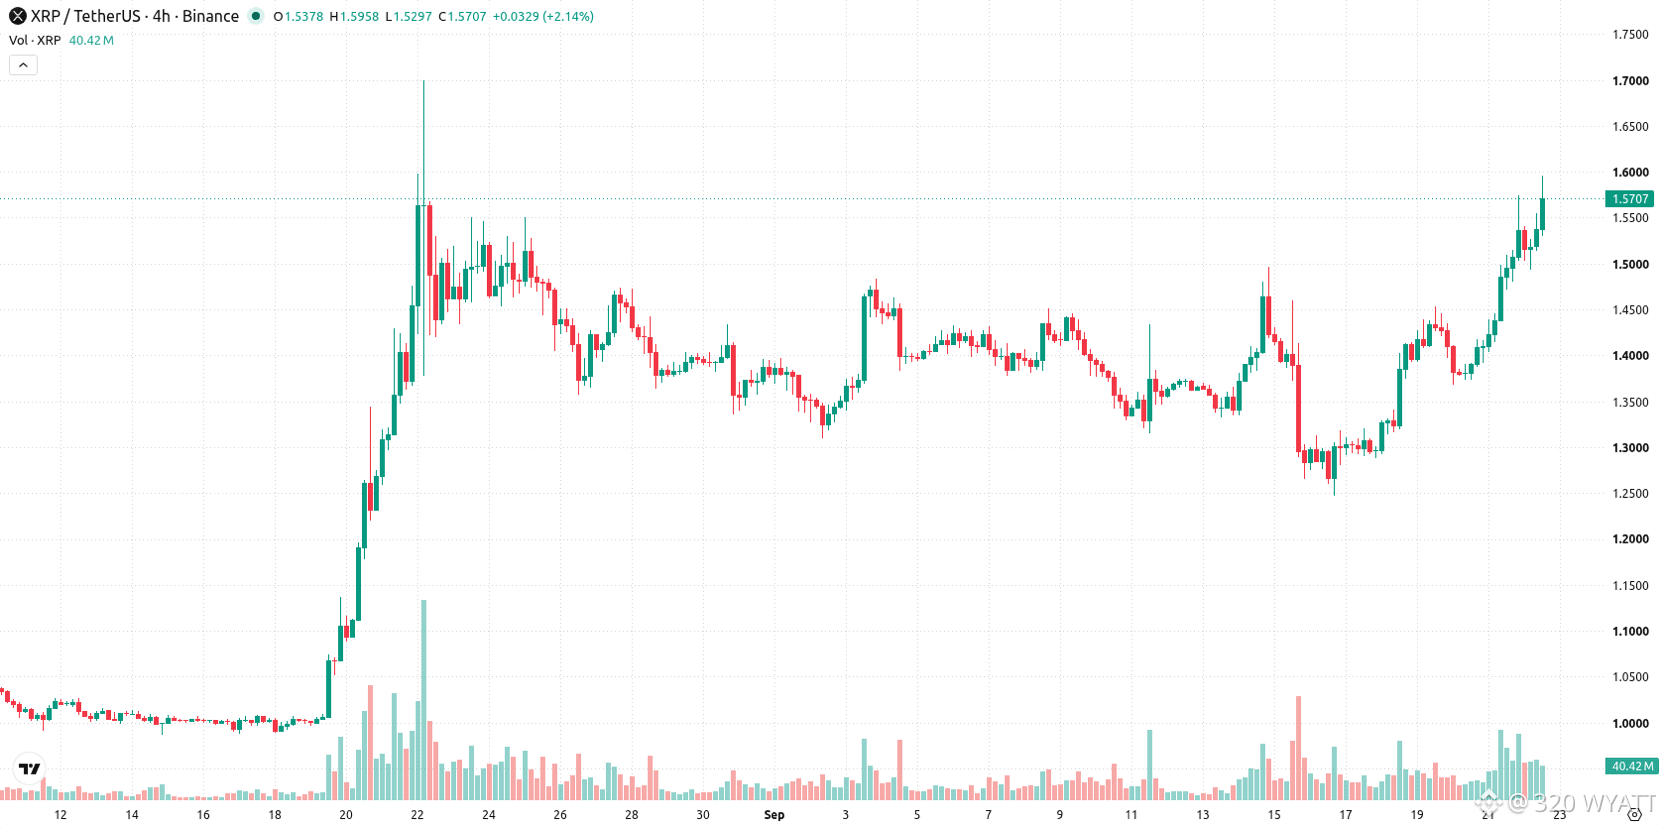
$XRP {spot}(XRPUSDT) 🚨XRP faces $1.50 breakout test🚨 The technical analysis in the report identifies a breakout from a descending flag pattern on XRP’s daily chart. The next test is $1.50: a sustained move above that level would strengthen the case for a rise toward $1.80. The analyst also projects a medium-term target of $2.10 based on the pattern’s measured move, implying roughly 41% upside from the price used in that forecast. Those targets remain conditional. After a sharp rally and substantial short liquidations, XRP will need continued buying interest to hold its breakout and advance through $1.50. #xrp320 #mr320 #Trendingissue #WriteToEarn2026 #Trendingcoin320
$XRP
🚨XRP faces $1.50 breakout test🚨

The technical analysis in the report identifies a breakout from a descending flag pattern on XRP’s daily chart.
The next test is $1.50: a sustained move above that level would strengthen the case for a rise toward $1.80.
The analyst also projects a medium-term target of $2.10 based on the pattern’s measured move, implying roughly 41% upside from the price used in that forecast.
Those targets remain conditional. After a sharp rally and substantial short liquidations, XRP will need continued buying interest to hold its breakout and advance through $1.50.

#xrp320 #mr320 #Trendingissue #WriteToEarn2026 #Trendingcoin320
·
--
Bullish
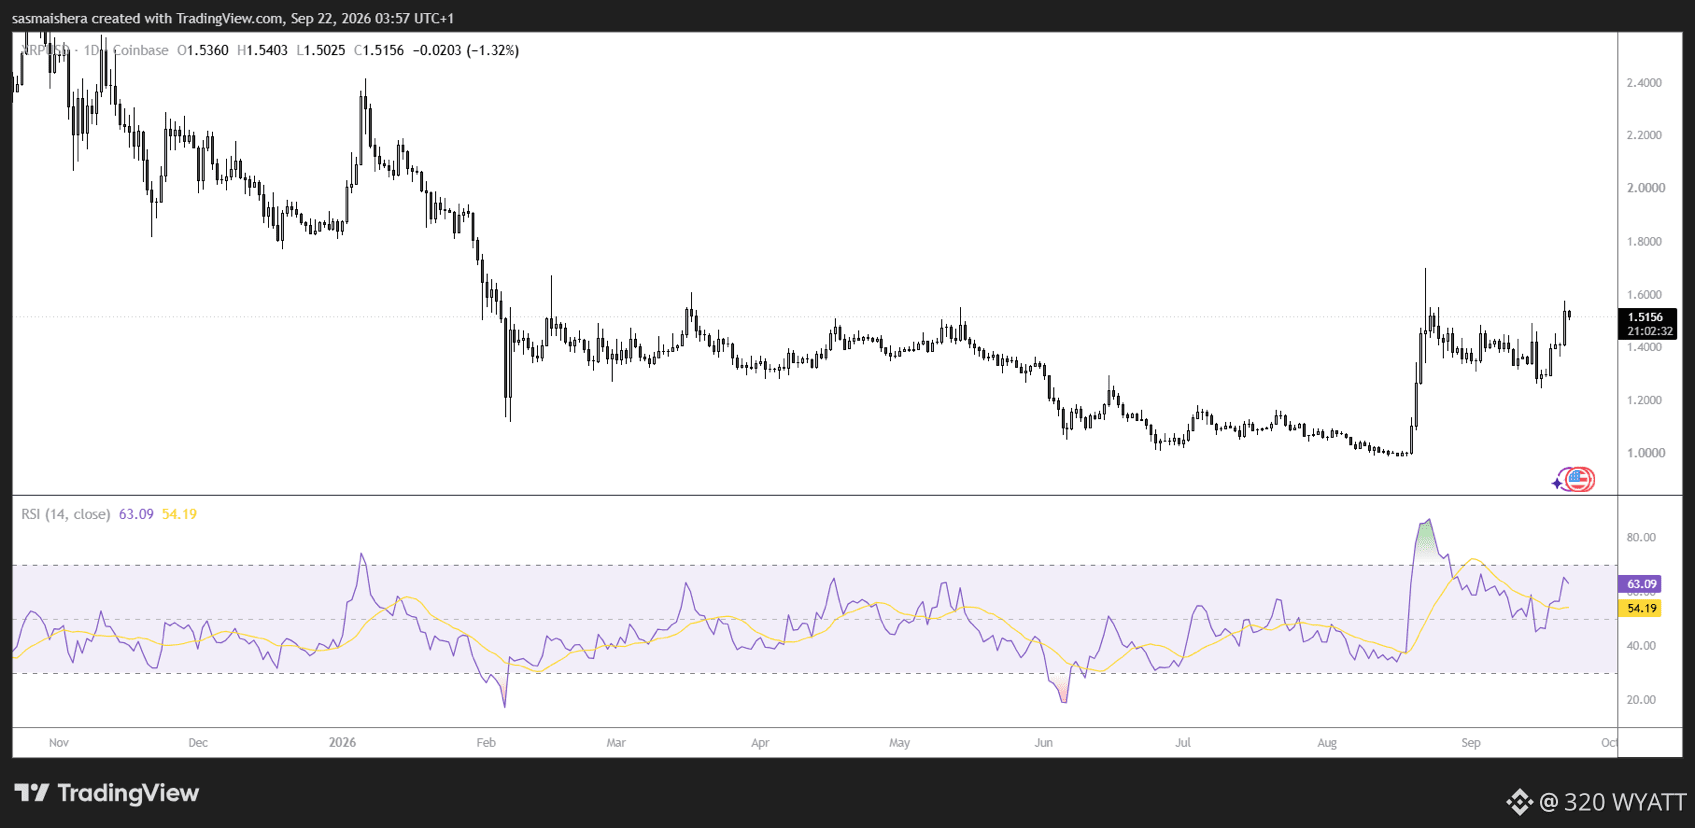
$XRP {spot}(XRPUSDT) XRP’s remaining 2026 price range is projected at $1.40-$1.82, with the upper end dependent on the market holding the 200-day EMA rather than flipping back beneath it. That line at $1.40 is the key bull/bear marker. Holding above it keeps the path toward $1.82 open, while losing it would return the market to the $1.26 to $1.30 band where the 50-day and 100-day averages sit. The RSI at 54.07 has crossed above its signal line, so the momentum picture has turned positive for the first time since August. #xrp320 #Trendingcoin320 #writetoearn320 #WriteToEarn2026 #mr320
$XRP
XRP’s remaining 2026 price range is projected at $1.40-$1.82, with the upper end dependent on the market holding the 200-day EMA rather than flipping back beneath it. That line at $1.40 is the key bull/bear marker. Holding above it keeps the path toward $1.82 open, while losing it would return the market to the $1.26 to $1.30 band where the 50-day and 100-day averages sit. The RSI at 54.07 has crossed above its signal line, so the momentum picture has turned positive for the first time since August.

#xrp320 #Trendingcoin320 #writetoearn320 #WriteToEarn2026 #mr320
·
--
Bullish
$PEPE {spot}(PEPEUSDT) Pepe has delivered a notable move in the supplied September 21 market data. The Pepe price reached approximately $0.00000450 after gaining 18.4% over the previous week. Strong trading activity and broader positive sentiment across crypto markets helped create the backdrop for the move. Recent Pepe news has also circulated around claims involving whale buying, a potential fund launch, and a token buyback. The supplied report states that those claims lack solid supporting evidence and appear largely promotional. That distinction matters because meme coin markets can move quickly when social narratives become louder than verified information. The recent Pepe price demonstrates how quickly sentiment can shift. A small change in demand can create a large percentage move when a token trades at a tiny unit price. For meme coin watchers, Pepe remains a useful example of how liquidity, community attention, and market mood can collide within a short period. #pepe320 #mr320 #Trendingissue #WriteToEarn2026 #Trendingcoin320
$PEPE
Pepe has delivered a notable move in the supplied September 21 market data. The Pepe price reached approximately $0.00000450 after gaining 18.4% over the previous week. Strong trading activity and broader positive sentiment across crypto markets helped create the backdrop for the move. Recent Pepe news has also circulated around claims involving whale buying, a potential fund launch, and a token buyback. The supplied report states that those claims lack solid supporting evidence and appear largely promotional.
That distinction matters because meme coin markets can move quickly when social narratives become louder than verified information. The recent Pepe price demonstrates how quickly sentiment can shift. A small change in demand can create a large percentage move when a token trades at a tiny unit price. For meme coin watchers, Pepe remains a useful example of how liquidity, community attention, and market mood can collide within a short period.

#pepe320 #mr320 #Trendingissue #WriteToEarn2026 #Trendingcoin320
ابوالعز1123:
مقال ممتاز عن $PEPE$ يا Wyatt، وفعلاً الحركة اللي حصلت من 0.00000450 لـ 0.00000501 +24.93% دي حركة حيتان واضحة بس زي ما قولت الإشاعات عن صندوق شراء محتمل لسه مفيش دليل قوي عليها. اتفق معاك في نقطة ان أسواق الميم بتتحرك بسرعة لما السعر وحدوي صغير، عشان كده أي تغيير بسيط في الطلب بيعمل قفزة كبيرة كنسبة مئوية. $PEPE$ يظل مفيد على كيفية اصطدام السيولة وانتباه المجتمع في فترة قصيرة. انت شايف الـ 24.93% دي هتكمل ولا هنشوف جني أرباح عند 0.00000550؟ متابعك.
Log in to explore more content
Join global crypto users on Binance Square
⚡️ Get latest and useful information about crypto.
💬 Trusted by the world’s largest crypto exchange.
👍 Discover real insights from verified creators.
Email / Phone number