
#eth
eth
4.5G views
27.4M Discussing
Hot
Latest

·
--
Bearish
🚨 $ETH
{future}(ETHUSDT)
BREAKS TRENDLINE SUPPORT — $2,000 NEXT?
Ethereum has broken below its key trendline support, which is a concerning signal for bulls.
📉 If bearish momentum continues, ETH could see another leg down toward the $2,000 level.
For now, sellers appear to have the upper hand. Bulls need to reclaim the broken trendline to improve the outlook.
👀 Keep an eye on ETH. More downside could be ahead!
#ETH #Ethereum #CryptoTrading #Bearis h
🚨 $ETH
BREAKS TRENDLINE SUPPORT — $2,000 NEXT?
Ethereum has broken below its key trendline support, which is a concerning signal for bulls.
📉 If bearish momentum continues, ETH could see another leg down toward the $2,000 level.
For now, sellers appear to have the upper hand. Bulls need to reclaim the broken trendline to improve the outlook.
👀 Keep an eye on ETH. More downside could be ahead!
#ETH #Ethereum #CryptoTrading #Bearis h
BREAKS TRENDLINE SUPPORT — $2,000 NEXT?
Ethereum has broken below its key trendline support, which is a concerning signal for bulls.
📉 If bearish momentum continues, ETH could see another leg down toward the $2,000 level.
For now, sellers appear to have the upper hand. Bulls need to reclaim the broken trendline to improve the outlook.
👀 Keep an eye on ETH. More downside could be ahead!
#ETH #Ethereum #CryptoTrading #Bearis h
377

·
--
$ETH next move may come down to one zone.
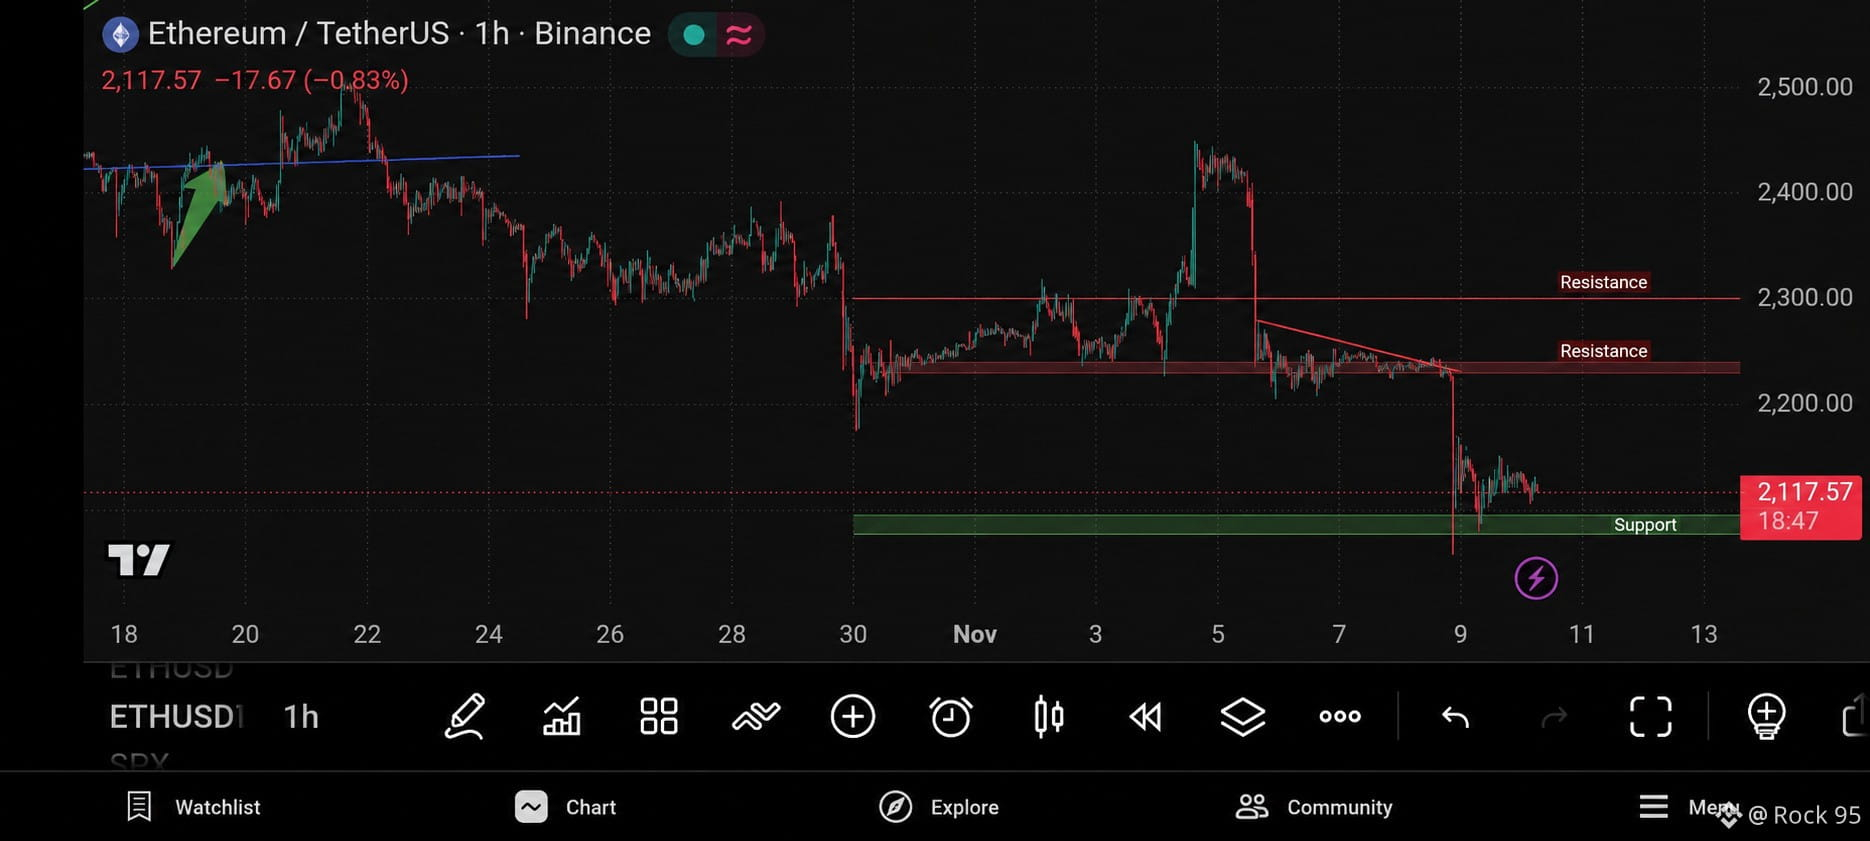
After losing $2,230–$2,250, price is hovering near $2,117. Buyers need to defend the $2,080–$2,100 support area. A reclaim of resistance could bring recovery momentum back; a clean break below support would put the setup under more pressure.
Watching the levels. Waiting for confirmation.
#Ethereum #ETH
$ETH next move may come down to one zone.
After losing $2,230–$2,250, price is hovering near $2,117. Buyers need to defend the $2,080–$2,100 support area. A reclaim of resistance could bring recovery momentum back; a clean break below support would put the setup under more pressure.
Watching the levels. Waiting for confirmation.
#Ethereum #ETH
After losing $2,230–$2,250, price is hovering near $2,117. Buyers need to defend the $2,080–$2,100 support area. A reclaim of resistance could bring recovery momentum back; a clean break below support would put the setup under more pressure.
Watching the levels. Waiting for confirmation.
#Ethereum #ETH
Karyn Marus dKN0:
Price action around $2,100 should be interesting.
13
13
3.4k

$ETH — Could Be Preparing for a Strong Comeback! 🚀
Ethereum is approaching an important decision zone. RSI is around 32, suggesting weak momentum and a potential recovery opportunity if buyers step in.
📊 Key Levels to Watch:
Support: $2,103
Resistance: $2,161
Next Target: $2,210 – $2,270
A strong daily close above $2,161, backed by increasing volume, could be the first sign of a bullish reversal.
The market may look weak now, but a confirmed recovery could change the momentum.
#ETH bulls, it's time to watch closely!
$ETH — Could Be Preparing for a Strong Comeback! 🚀
Ethereum is approaching an important decision zone. RSI is around 32, suggesting weak momentum and a potential recovery opportunity if buyers step in.
📊 Key Levels to Watch:
Support: $2,103
Resistance: $2,161
Next Target: $2,210 – $2,270
A strong daily close above $2,161, backed by increasing volume, could be the first sign of a bullish reversal.
The market may look weak now, but a confirmed recovery could change the momentum.
#ETH bulls, it's time to watch closely!
Ethereum is approaching an important decision zone. RSI is around 32, suggesting weak momentum and a potential recovery opportunity if buyers step in.
📊 Key Levels to Watch:
Support: $2,103
Resistance: $2,161
Next Target: $2,210 – $2,270
A strong daily close above $2,161, backed by increasing volume, could be the first sign of a bullish reversal.
The market may look weak now, but a confirmed recovery could change the momentum.
#ETH bulls, it's time to watch closely!

1
1.2k


·
--
Bearish
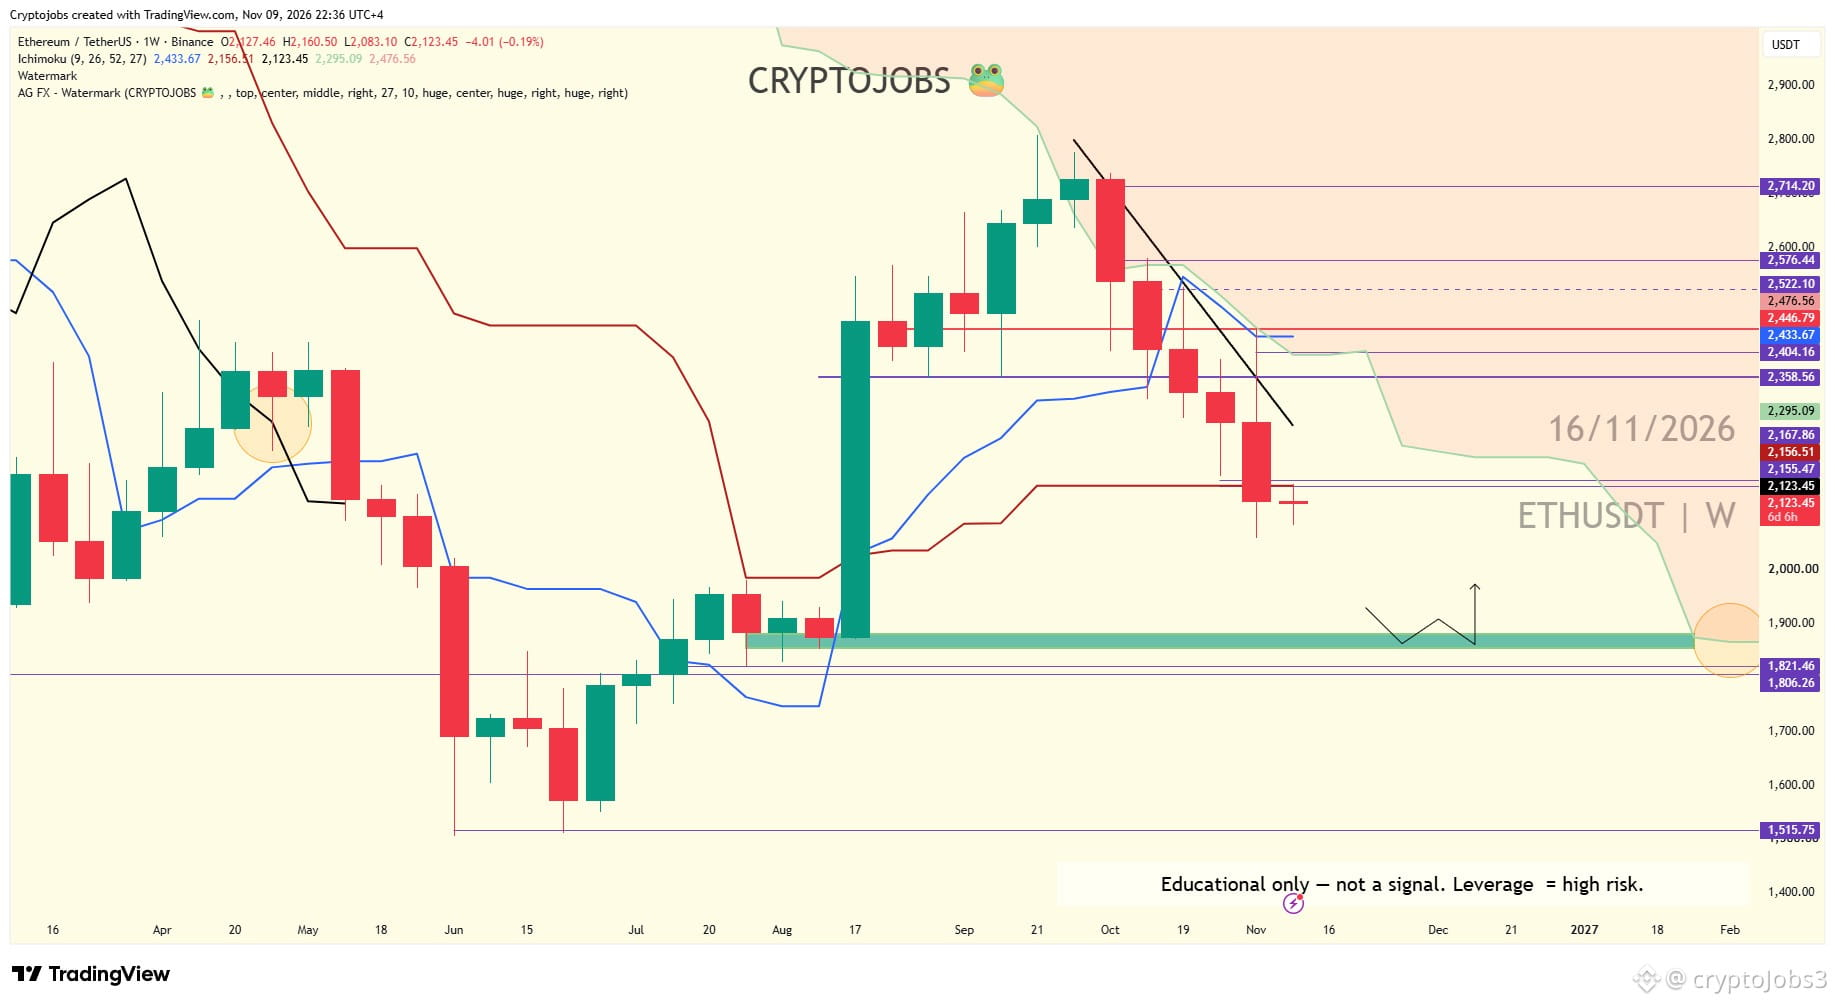
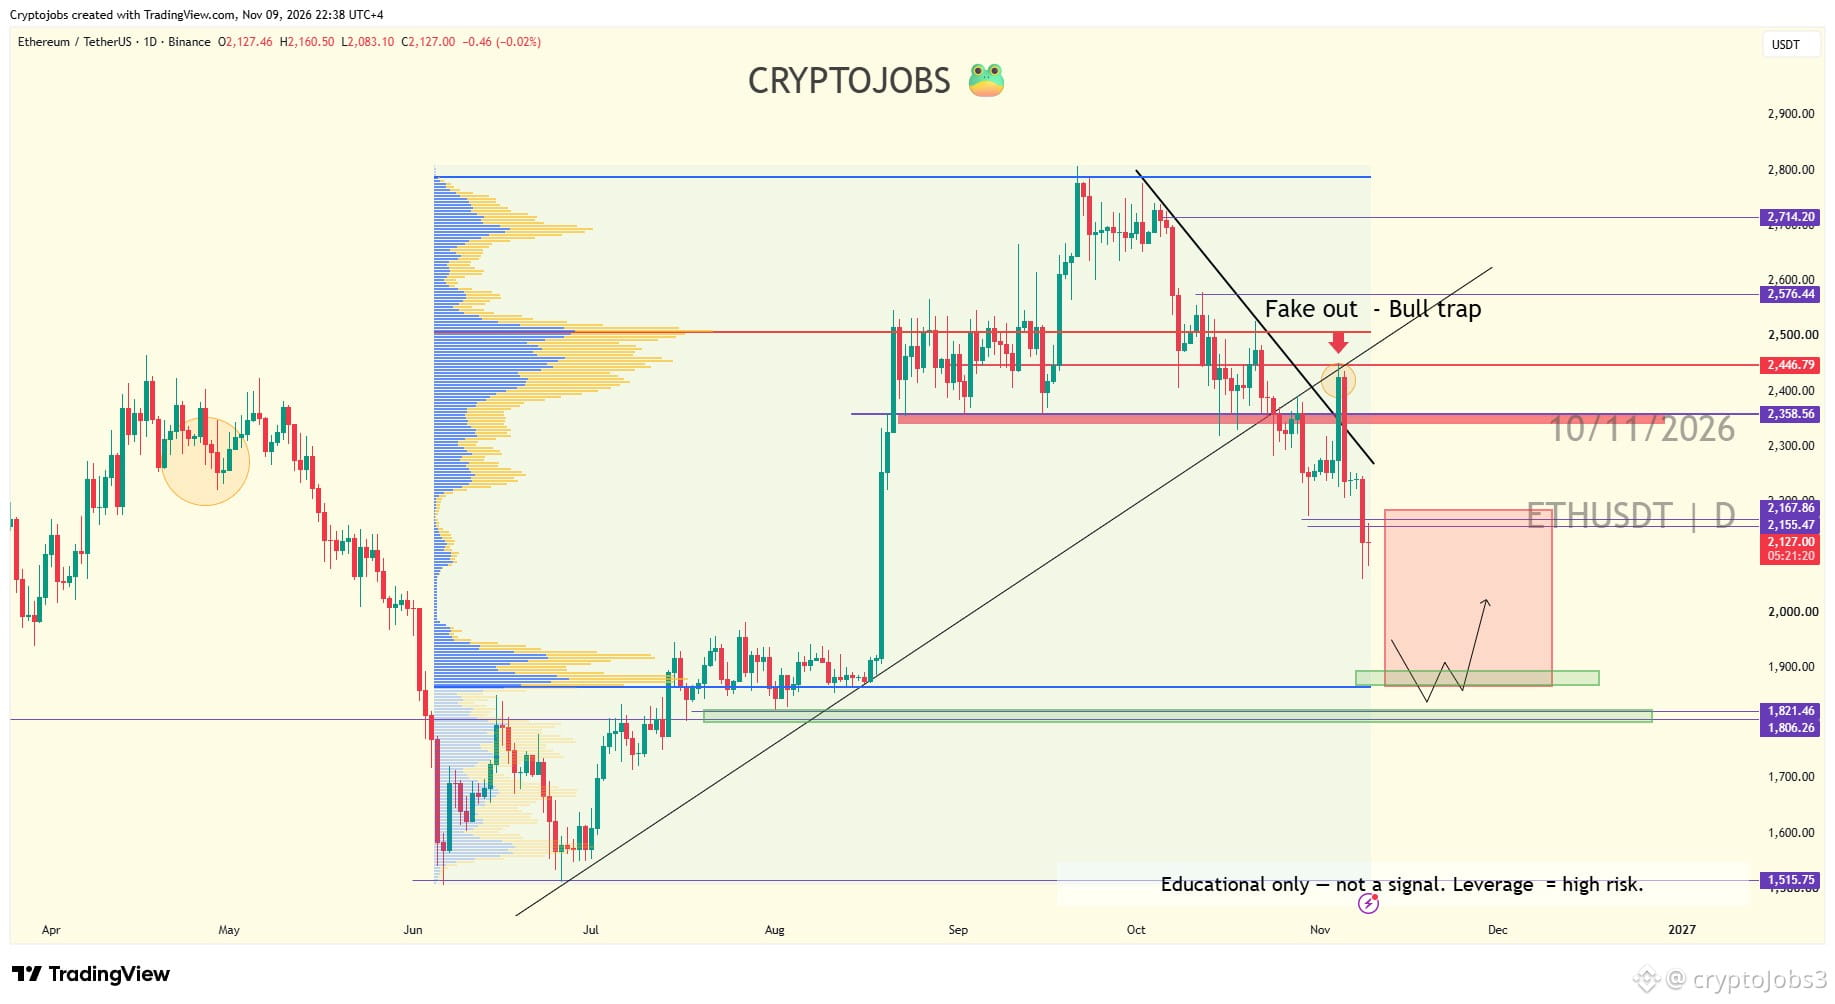
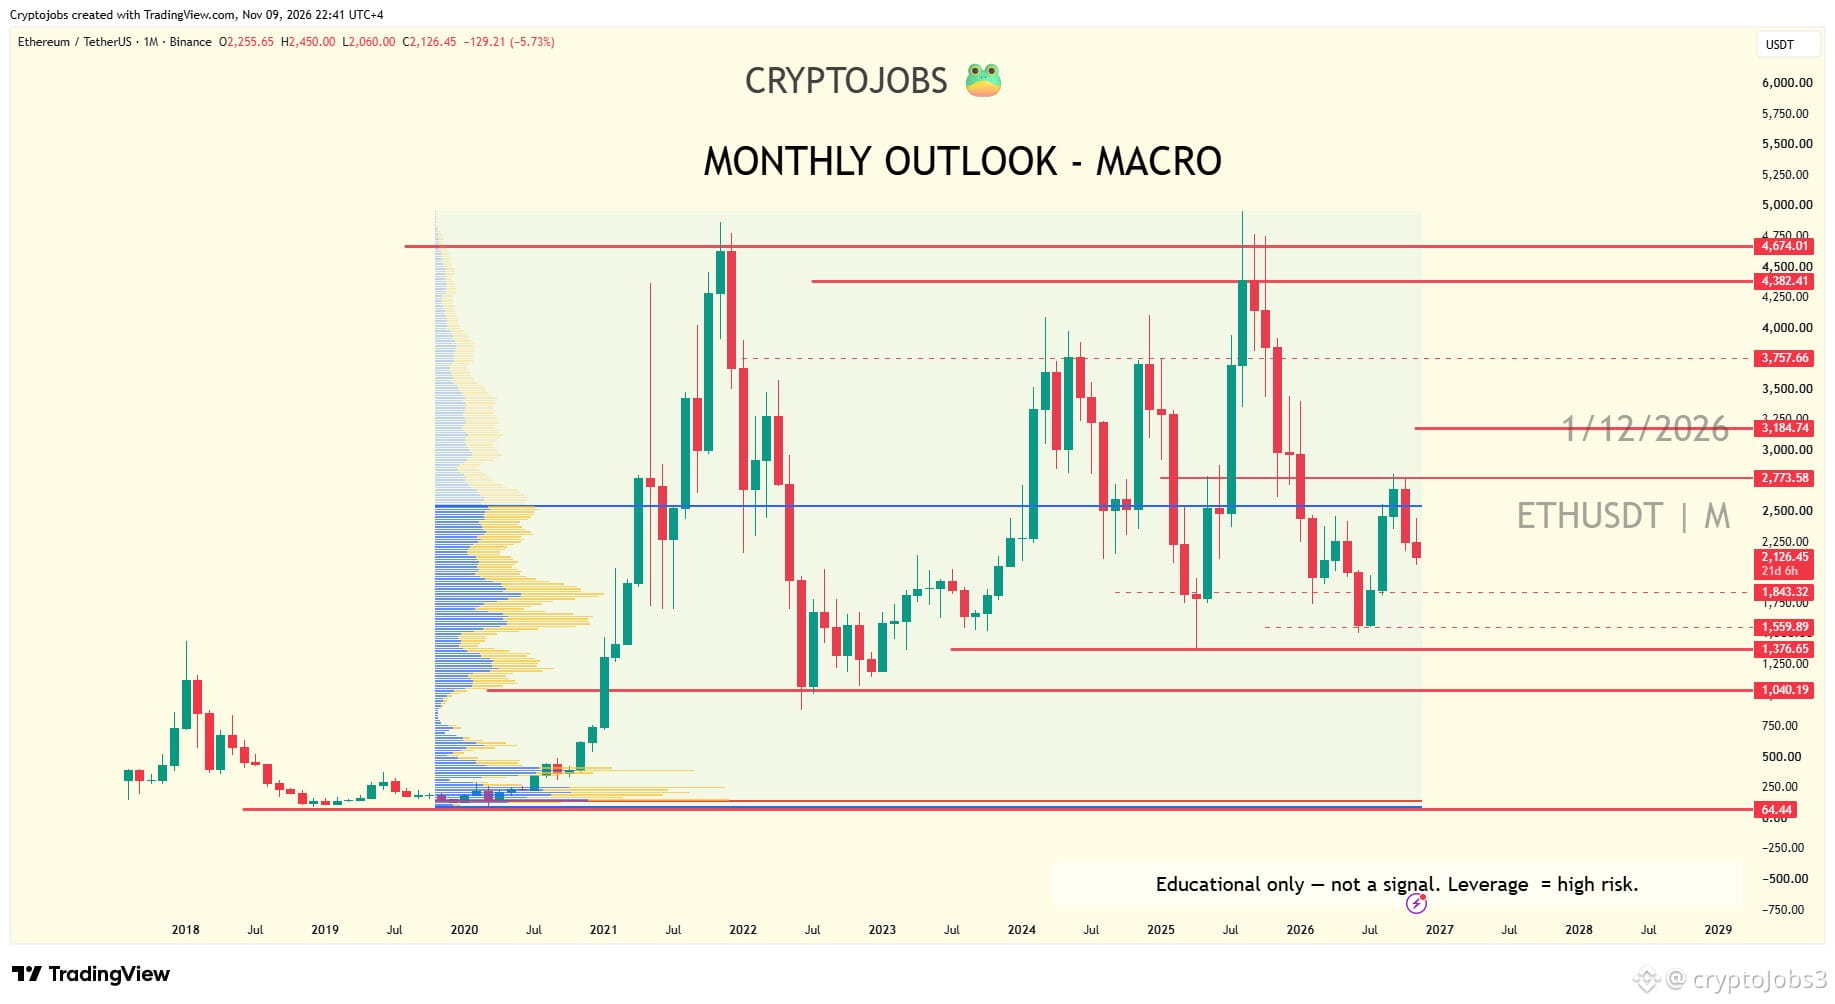
$ETH weekly outlook: bearish under $2,160 📉
Two dojis at once, on the daily and on the weekly. The weekly Kumo is still rejecting price.
Levels I'm watching: $1,920, $1,860, $1,820.
$1,870 lines up the daily VAL and the weekly SSA, a possible key bottom.
Bulls need $2,245 back. Macro flip level: $3,200 monthly.
Bullish, Bearish or Maybe?
Full outlook on CryptoJobs3.com · Analysis Hub
NFA
#ETH #etf
$ETH weekly outlook: bearish under $2,160 📉
Two dojis at once, on the daily and on the weekly. The weekly Kumo is still rejecting price.
Levels I'm watching: $1,920, $1,860, $1,820.
$1,870 lines up the daily VAL and the weekly SSA, a possible key bottom.
Bulls need $2,245 back. Macro flip level: $3,200 monthly.
Bullish, Bearish or Maybe?
Full outlook on CryptoJobs3.com · Analysis Hub
NFA
#ETH #etf
Two dojis at once, on the daily and on the weekly. The weekly Kumo is still rejecting price.
Levels I'm watching: $1,920, $1,860, $1,820.
$1,870 lines up the daily VAL and the weekly SSA, a possible key bottom.
Bulls need $2,245 back. Macro flip level: $3,200 monthly.
Bullish, Bearish or Maybe?
Full outlook on CryptoJobs3.com · Analysis Hub
NFA
#ETH #etf
5
2.1k

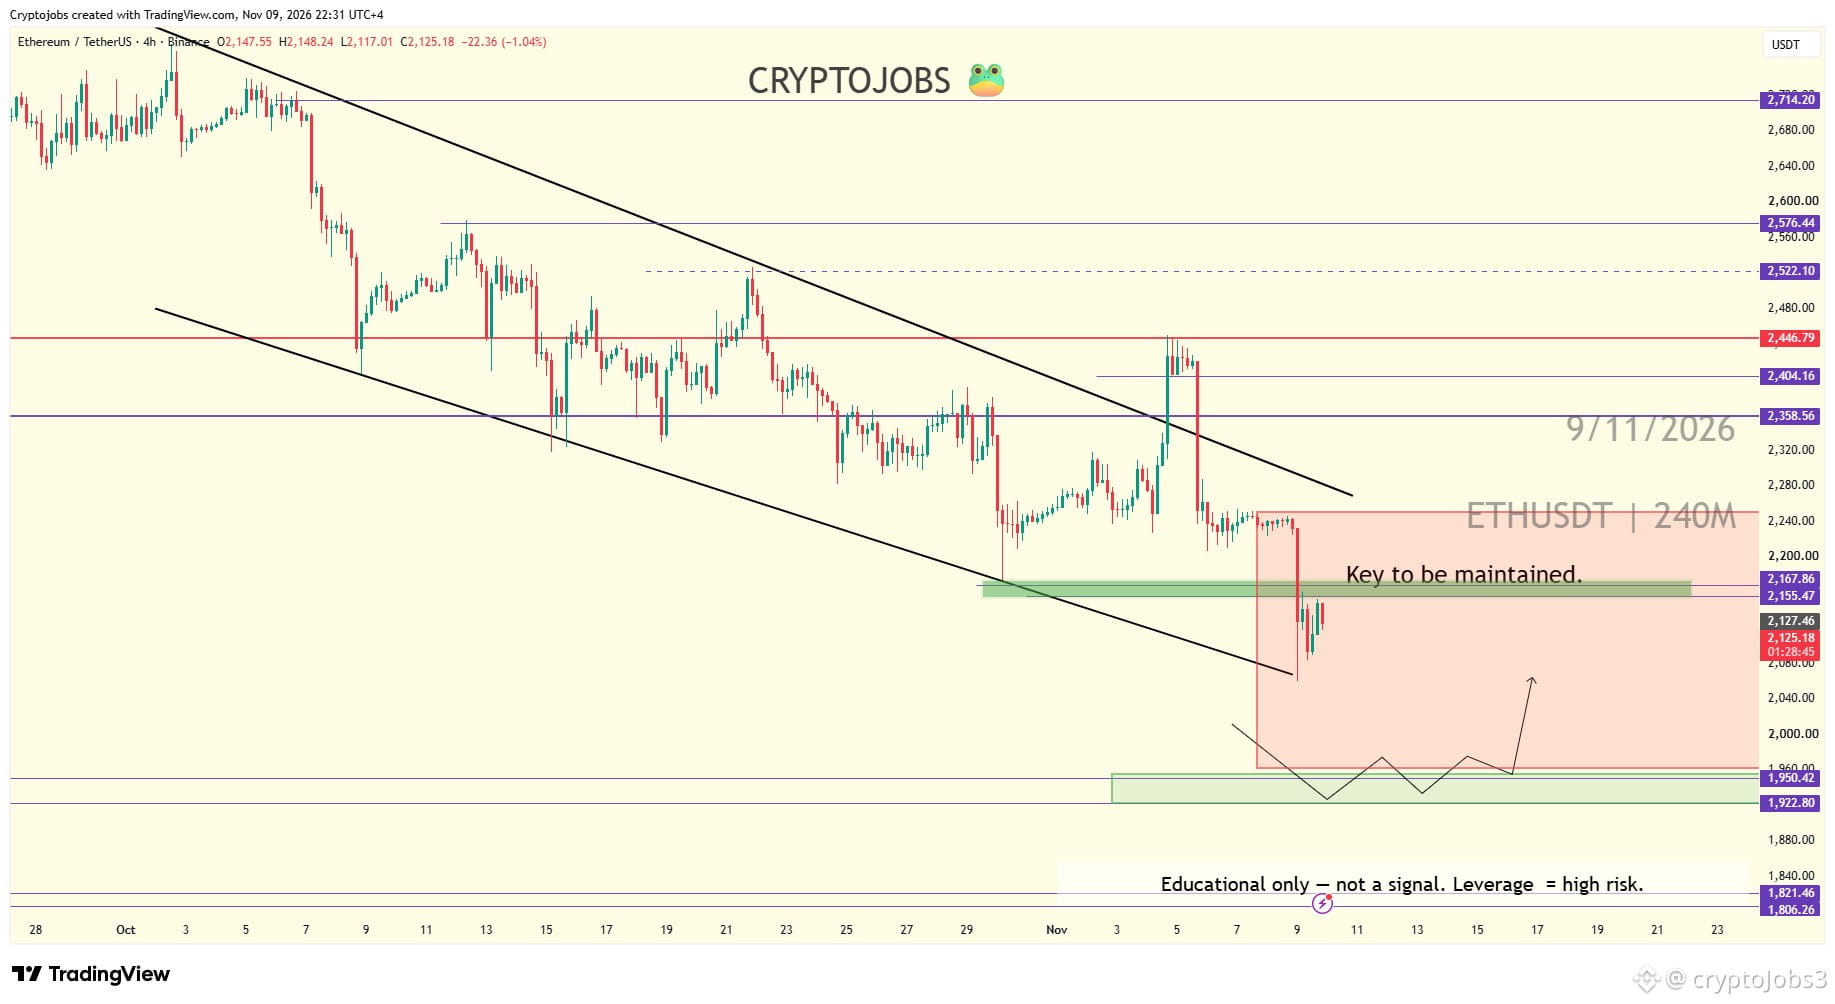
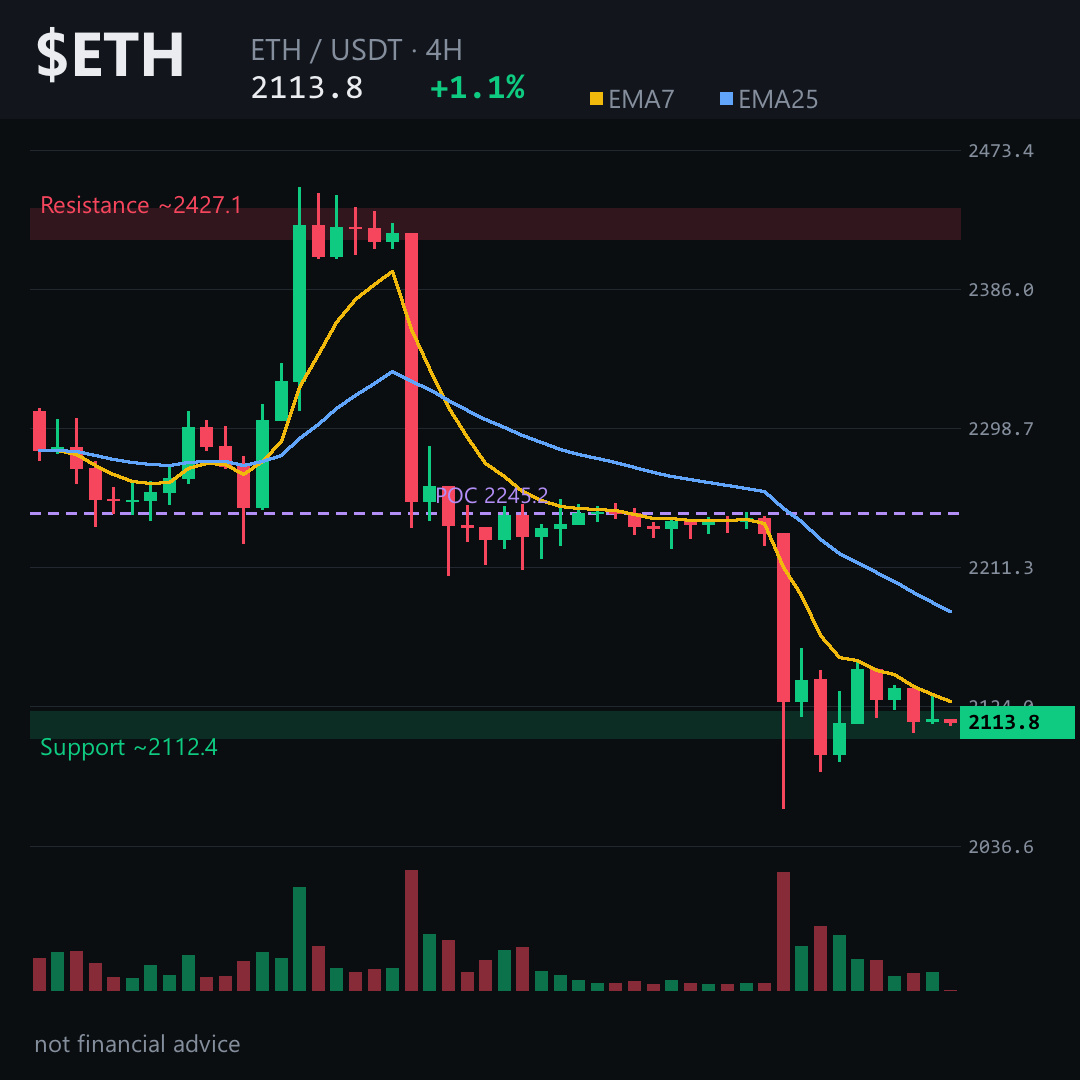
A 4.7% candle in one 4-hour window. That's not noise — that's a structure break.
$ETH slid under both key moving averages with weak momentum. The long/short ratio sits near 3.9 — leveraged longs are crowded, yet funding is barely positive. The crowd is leaning one way, but the fee structure isn't paying them to be there.
Price has been grinding lower since 2225 failed — that zone now acts as an unfilled bearish gap down to roughly 2160. Below that, 2127 is the current pivot. Lose it on a 4H close, and the path toward 2010 opens up. That's geometry, not a prediction. The invalidation sits around 2192. Reclaim that, and this bearish structure starts to crack.
Daily: 2160 is the line in the sand — lose it, and the objective stretches toward 1815. Weekly still leans bullish long-term, so I'm treating this as a 4H-to-daily correction, not a macro breakdown.
Short-term structure favors continued downside while price stays below 2190, but crowded longs make any bounce sharp and fast.
Tap $ETH to pull up the chart and check these zones yourself.
Which level are you watching more closely — the 2127 pivot or the 2160 daily floor? Drop your read on $ETH 👇
Not financial advice. DYOR.
Follow for the next read on this chart.
#ETH #Ethereum #Crypto #BinanceSquare
A 4.7% candle in one 4-hour window. That's not noise — that's a structure break.
$ETH slid under both key moving averages with weak momentum. The long/short ratio sits near 3.9 — leveraged longs are crowded, yet funding is barely positive. The crowd is leaning one way, but the fee structure isn't paying them to be there.
Price has been grinding lower since 2225 failed — that zone now acts as an unfilled bearish gap down to roughly 2160. Below that, 2127 is the current pivot. Lose it on a 4H close, and the path toward 2010 opens up. That's geometry, not a prediction. The invalidation sits around 2192. Reclaim that, and this bearish structure starts to crack.
Daily: 2160 is the line in the sand — lose it, and the objective stretches toward 1815. Weekly still leans bullish long-term, so I'm treating this as a 4H-to-daily correction, not a macro breakdown.
Short-term structure favors continued downside while price stays below 2190, but crowded longs make any bounce sharp and fast.
Tap $ETH to pull up the chart and check these zones yourself.
Which level are you watching more closely — the 2127 pivot or the 2160 daily floor? Drop your read on $ETH 👇
Not financial advice. DYOR.
Follow for the next read on this chart.
#ETH #Ethereum #Crypto #BinanceSquare
$ETH slid under both key moving averages with weak momentum. The long/short ratio sits near 3.9 — leveraged longs are crowded, yet funding is barely positive. The crowd is leaning one way, but the fee structure isn't paying them to be there.
Price has been grinding lower since 2225 failed — that zone now acts as an unfilled bearish gap down to roughly 2160. Below that, 2127 is the current pivot. Lose it on a 4H close, and the path toward 2010 opens up. That's geometry, not a prediction. The invalidation sits around 2192. Reclaim that, and this bearish structure starts to crack.
Daily: 2160 is the line in the sand — lose it, and the objective stretches toward 1815. Weekly still leans bullish long-term, so I'm treating this as a 4H-to-daily correction, not a macro breakdown.
Short-term structure favors continued downside while price stays below 2190, but crowded longs make any bounce sharp and fast.
Tap $ETH to pull up the chart and check these zones yourself.
Which level are you watching more closely — the 2127 pivot or the 2160 daily floor? Drop your read on $ETH 👇
Not financial advice. DYOR.
Follow for the next read on this chart.
#ETH #Ethereum #Crypto #BinanceSquare
350

·
--
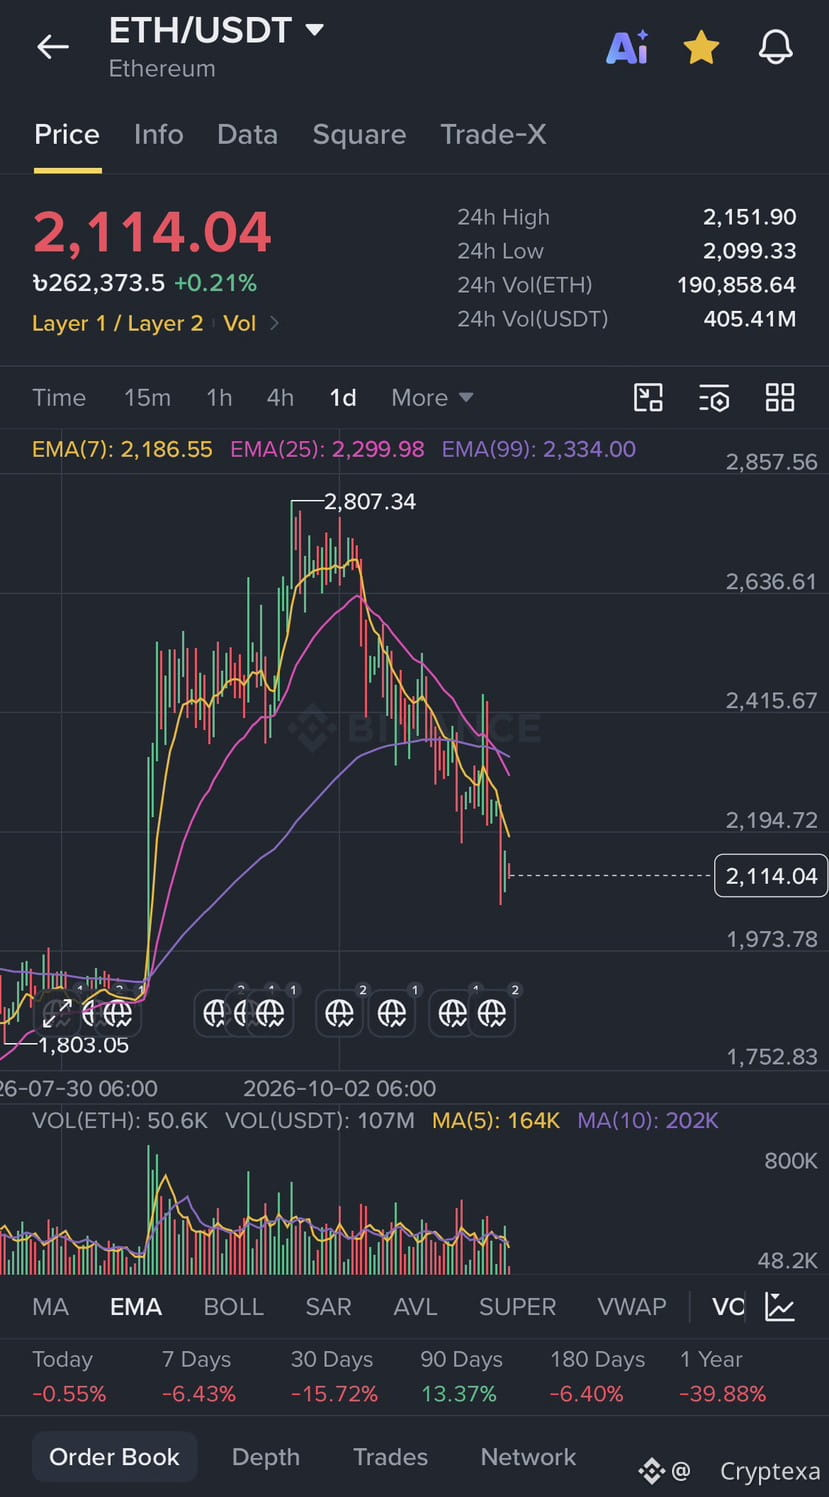
$ETH Technical Analysis: Corrective Trend
Ethereal is sitting at $2,114, struggling beneath the EMA 7 ($2,186) and EMA 25 ($2,299) resistance lines after rejecting from the $2,807 top.
$ETH
1. Rebound Targets: $2,186 / $2,300
2. Support / Buy Zone: $1,970 – $2,050
3. Stop-Loss: $1,790 (below local swing low of $1,803)
Market Outlook: Bearish momentum dominates short-term. Look for confirmation above $2,186 or solid bounce signals off support before taking long positions.
#ETH #BİNANCESQUARE #cryptotrading #TechnicalAnalysis
$ETH Technical Analysis: Corrective Trend
Ethereal is sitting at $2,114, struggling beneath the EMA 7 ($2,186) and EMA 25 ($2,299) resistance lines after rejecting from the $2,807 top.
$ETH
1. Rebound Targets: $2,186 / $2,300
2. Support / Buy Zone: $1,970 – $2,050
3. Stop-Loss: $1,790 (below local swing low of $1,803)
Market Outlook: Bearish momentum dominates short-term. Look for confirmation above $2,186 or solid bounce signals off support before taking long positions.
#ETH #BİNANCESQUARE #cryptotrading #TechnicalAnalysis
Ethereal is sitting at $2,114, struggling beneath the EMA 7 ($2,186) and EMA 25 ($2,299) resistance lines after rejecting from the $2,807 top.
$ETH
1. Rebound Targets: $2,186 / $2,300
2. Support / Buy Zone: $1,970 – $2,050
3. Stop-Loss: $1,790 (below local swing low of $1,803)
Market Outlook: Bearish momentum dominates short-term. Look for confirmation above $2,186 or solid bounce signals off support before taking long positions.
#ETH #BİNANCESQUARE #cryptotrading #TechnicalAnalysis
85

·
--
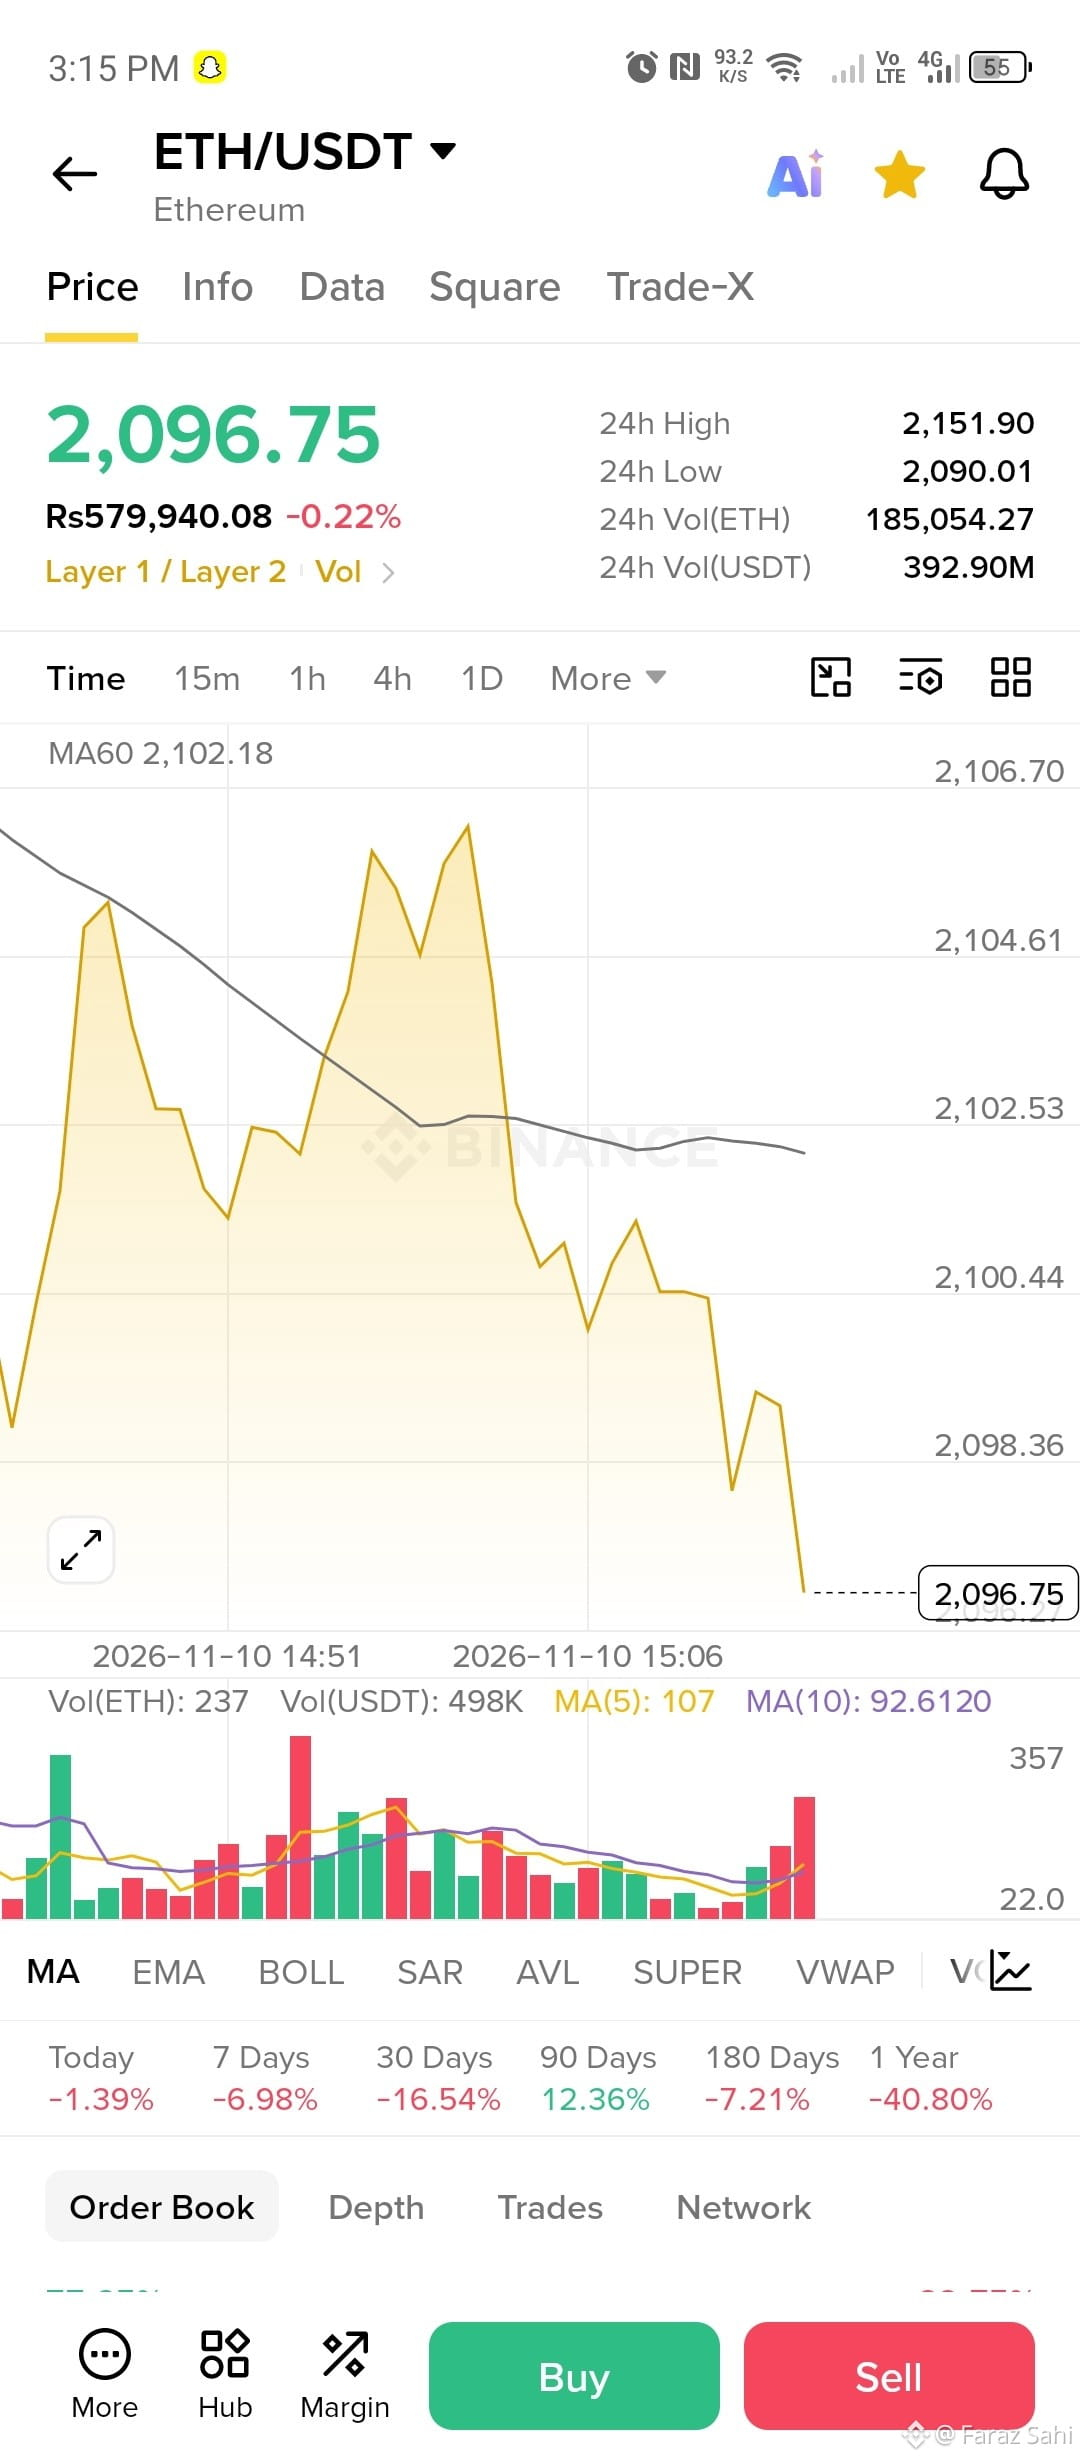
🚨 $ETH just slipped below $2,100, and the pressure is building. 👀
Here's what the chart shows right now:
📉 Price: ~$2,096 (-1.39% today)
📉 7D: -6.98% | 30D: -16.54%
🎯 24h low at $2,090 is the level to watch
🟢 $2,150 is the first resistance bulls need to reclaim
Every bounce today got sold quickly. If $2,090 breaks, the next move could get ugly. If it holds, shorts could get squeezed. ⚡
I'm not catching this knife blindly. I'm waiting for a clean hourly close above $2,150 before trusting any bounce.
Where do you see $ETH going next? 🟢 Bounce or 🔴 Breakdown? Comment below 👇
#ETH #Ethereum #crypto #BinanceSquare #trading
{future}(ETHUSDT)
🚨 $ETH just slipped below $2,100, and the pressure is building. 👀
Here's what the chart shows right now:
📉 Price: ~$2,096 (-1.39% today)
📉 7D: -6.98% | 30D: -16.54%
🎯 24h low at $2,090 is the level to watch
🟢 $2,150 is the first resistance bulls need to reclaim
Every bounce today got sold quickly. If $2,090 breaks, the next move could get ugly. If it holds, shorts could get squeezed. ⚡
I'm not catching this knife blindly. I'm waiting for a clean hourly close above $2,150 before trusting any bounce.
Where do you see $ETH going next? 🟢 Bounce or 🔴 Breakdown? Comment below 👇
#ETH #Ethereum #crypto #BinanceSquare #trading
Here's what the chart shows right now:
📉 Price: ~$2,096 (-1.39% today)
📉 7D: -6.98% | 30D: -16.54%
🎯 24h low at $2,090 is the level to watch
🟢 $2,150 is the first resistance bulls need to reclaim
Every bounce today got sold quickly. If $2,090 breaks, the next move could get ugly. If it holds, shorts could get squeezed. ⚡
I'm not catching this knife blindly. I'm waiting for a clean hourly close above $2,150 before trusting any bounce.
Where do you see $ETH going next? 🟢 Bounce or 🔴 Breakdown? Comment below 👇
#ETH #Ethereum #crypto #BinanceSquare #trading
109

·
--
Bullish
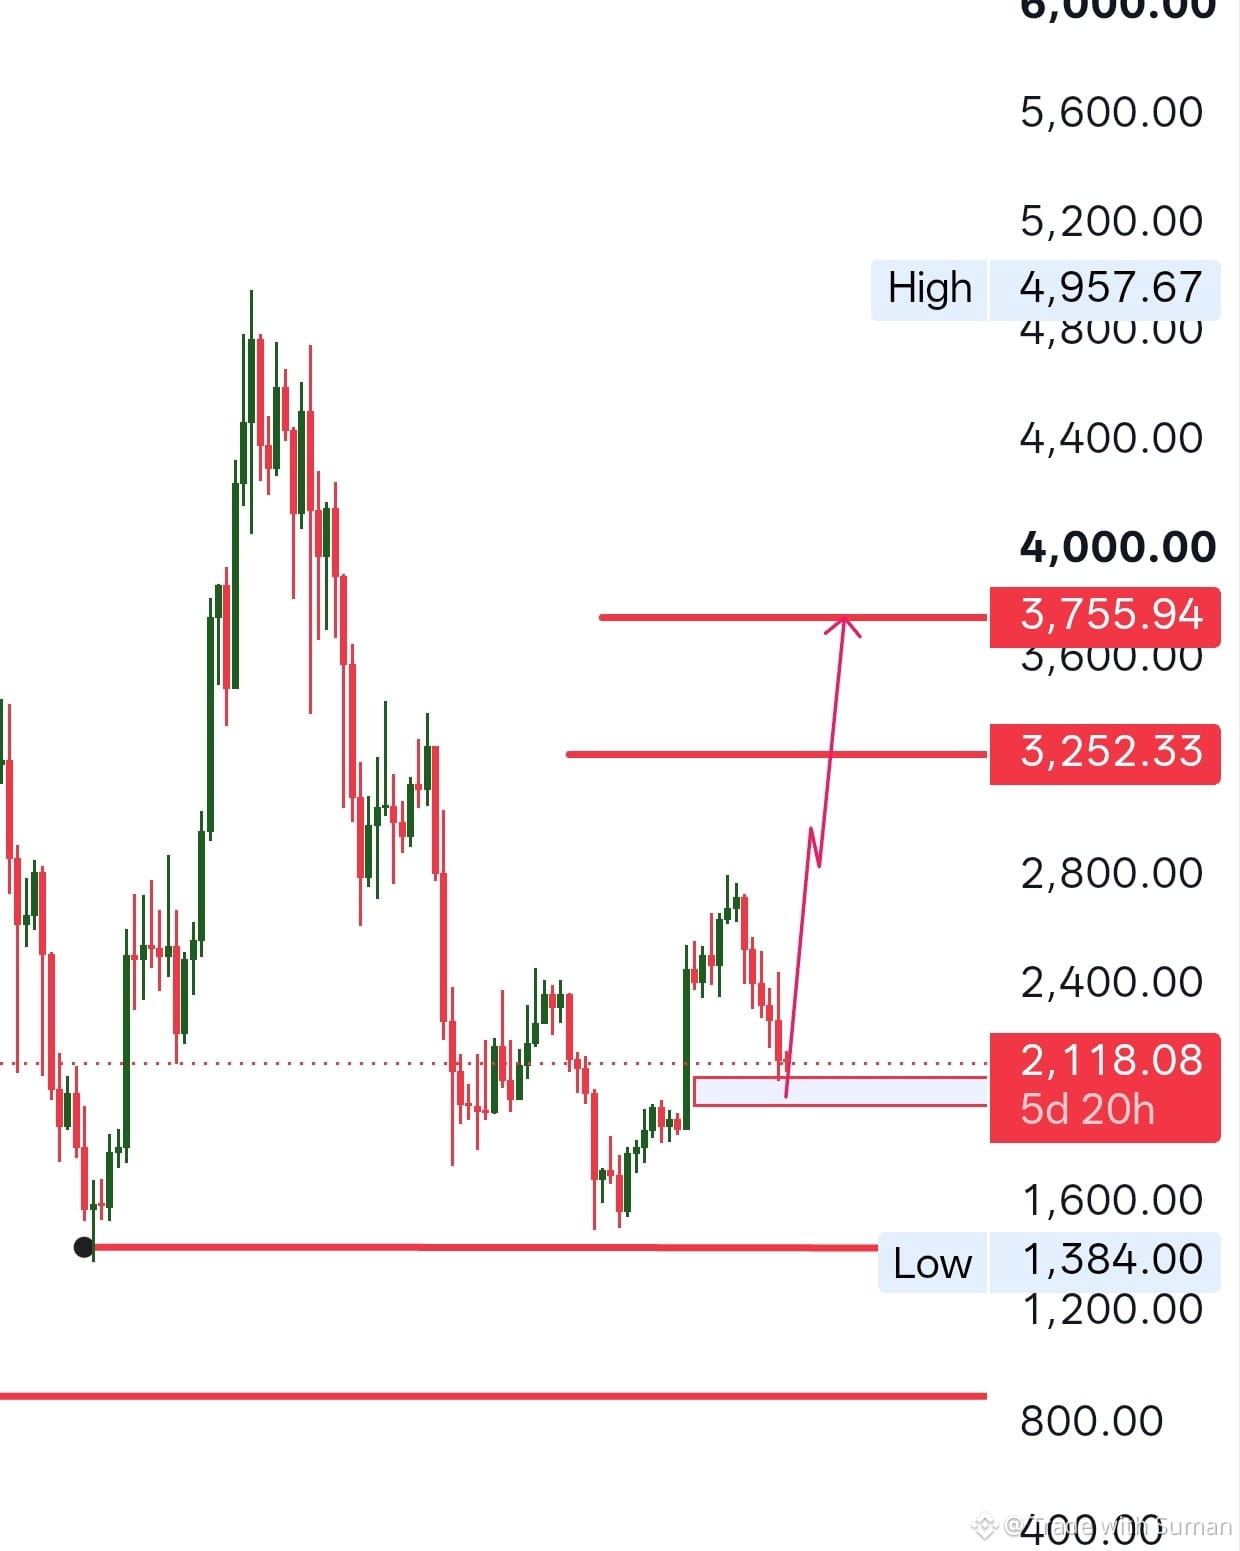
Holding $ETH 2.5 USDT
If your trading in $ETH here the anylisis massive pump is at Door .
currently #ETH is at entry range between 1.96k- 2.11k , it can fly 💸 like Dream of every investors what they are looking .
$Eth can dump upto 1.65k area but bonce will Major reversal and quickly gain !
Always remember in crypto no one can give you extly magic' you must also follow risk management and proper margin and leverage .
If your trading in $ETH here the anylisis massive pump is at Door .
currently #ETH is at entry range between 1.96k- 2.11k , it can fly 💸 like Dream of every investors what they are looking .
$Eth can dump upto 1.65k area but bonce will Major reversal and quickly gain !
Always remember in crypto no one can give you extly magic' you must also follow risk management and proper margin and leverage .
currently #ETH is at entry range between 1.96k- 2.11k , it can fly 💸 like Dream of every investors what they are looking .
$Eth can dump upto 1.65k area but bonce will Major reversal and quickly gain !
Always remember in crypto no one can give you extly magic' you must also follow risk management and proper margin and leverage .
1
679

·
--
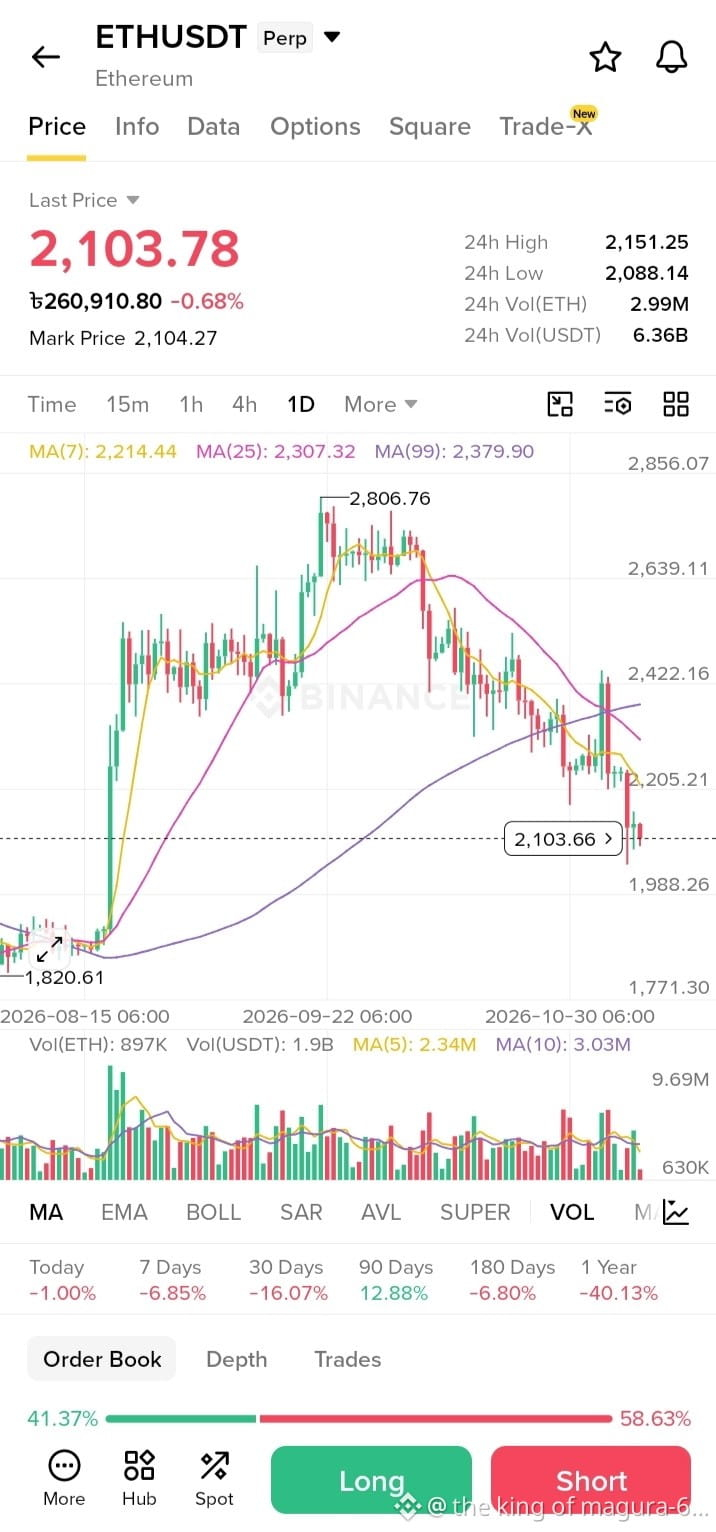
🔷 Will you need to buy $ETH or not?
🔹 Ethereum is the main smart contract network behind DeFi, stablecoins and tokenized assets.
📊 It is the second-largest crypto and hosts most stablecoins and DeFi activity.
🚀 Ongoing network upgrades aim to raise capacity and lower fees.
⚠️ Layer 2 competition is brutal, and some L2s have already shut down.
Buy: $ETH
#Ethereum #ETH #Binance
🔷 Will you need to buy $ETH or not?
🔹 Ethereum is the main smart contract network behind DeFi, stablecoins and tokenized assets.
📊 It is the second-largest crypto and hosts most stablecoins and DeFi activity.
🚀 Ongoing network upgrades aim to raise capacity and lower fees.
⚠️ Layer 2 competition is brutal, and some L2s have already shut down.
Buy: $ETH
#Ethereum #ETH #Binance
🔹 Ethereum is the main smart contract network behind DeFi, stablecoins and tokenized assets.
📊 It is the second-largest crypto and hosts most stablecoins and DeFi activity.
🚀 Ongoing network upgrades aim to raise capacity and lower fees.
⚠️ Layer 2 competition is brutal, and some L2s have already shut down.
Buy: $ETH
#Ethereum #ETH #Binance

1
164

·
--
Bearish
$ETH
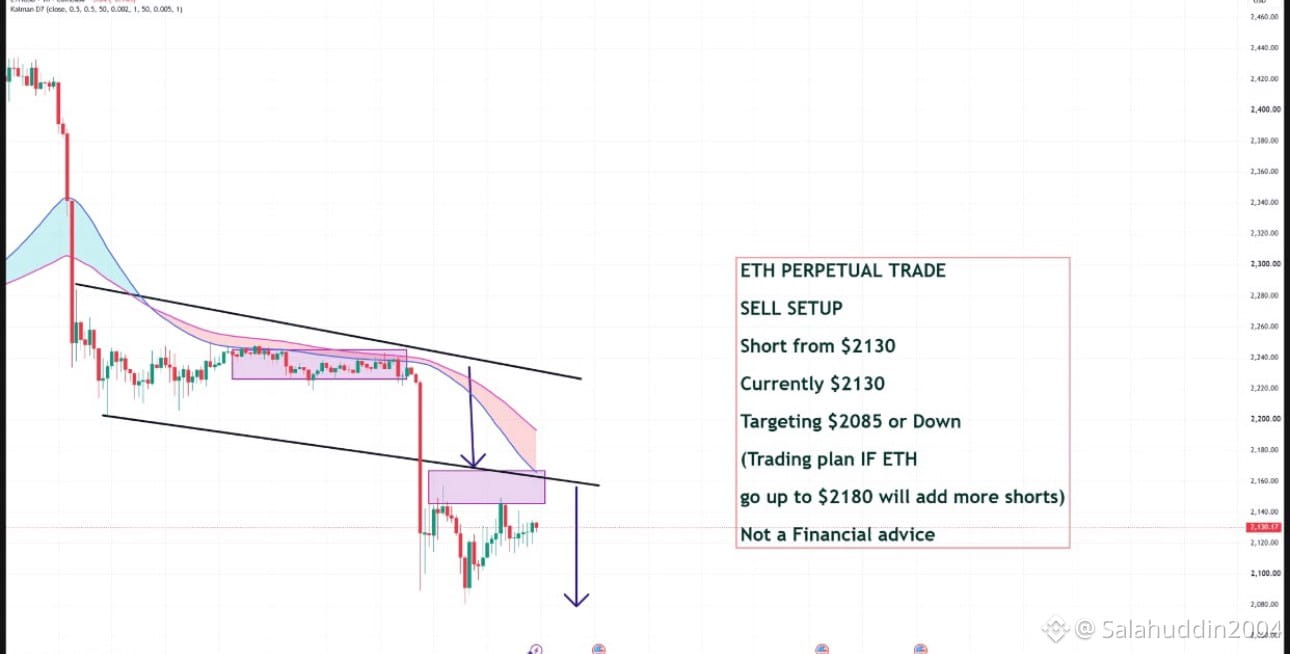
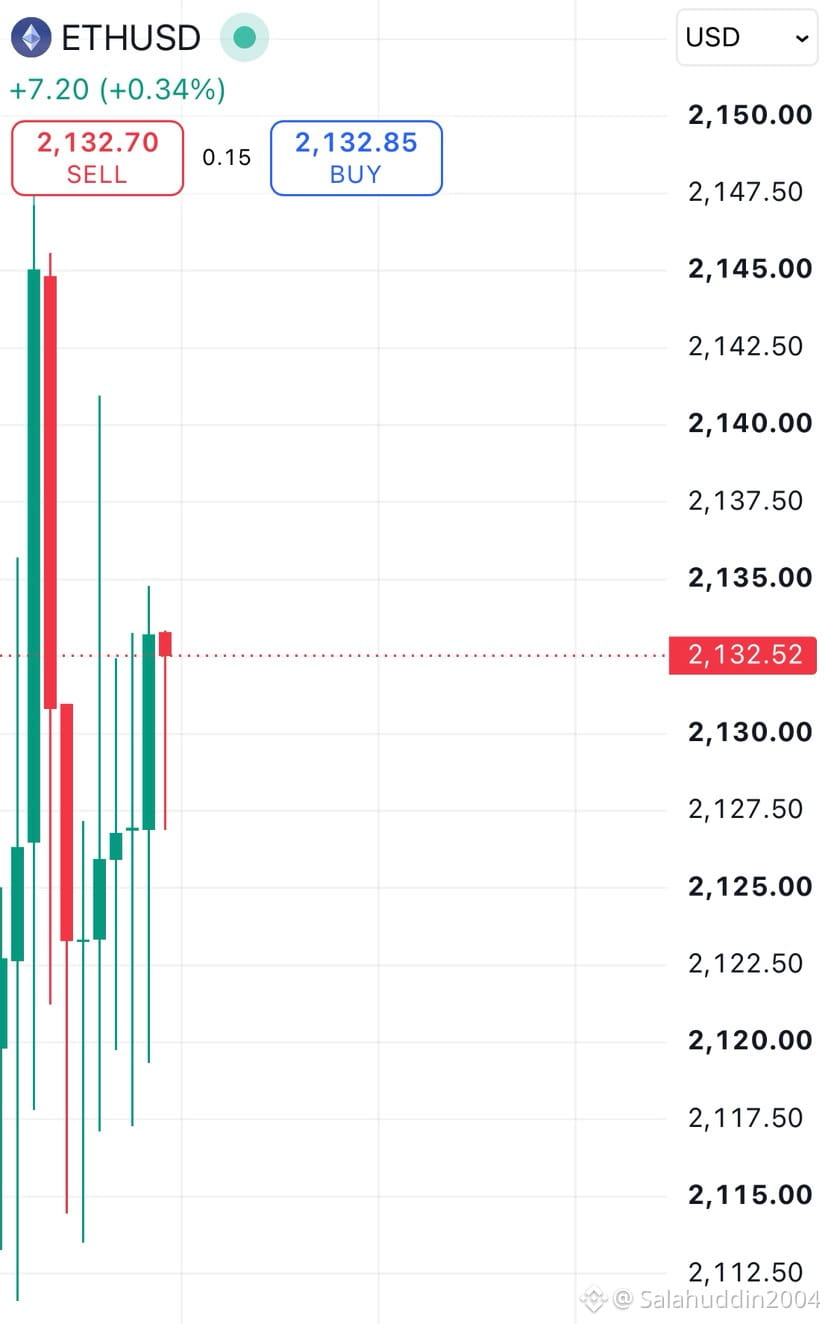
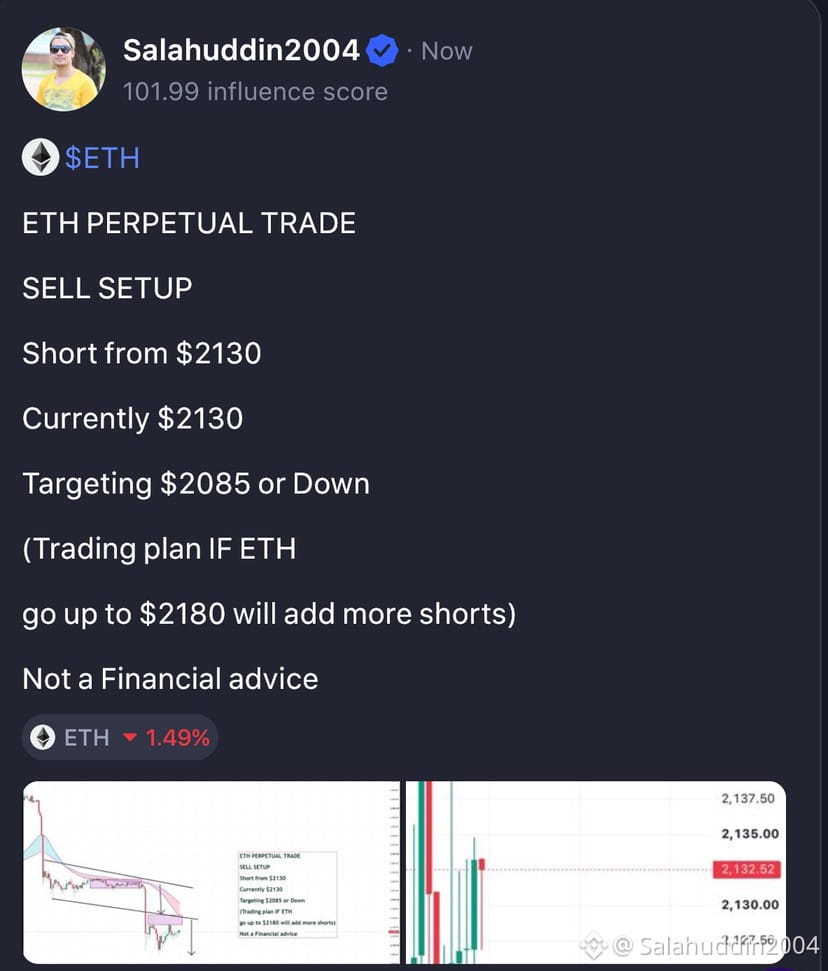
ETH PERPETUAL TRADE
SELL SETUP
Short from $2130
Currently $2130
Targeting $2085 or Down
(Trading plan IF ETH
go up to $2180 will add more shorts)
Not a Financial advice
#BitcoinFiveWeeklyLosses #eth
$ETH
ETH PERPETUAL TRADE
SELL SETUP
Short from $2130
Currently $2130
Targeting $2085 or Down
(Trading plan IF ETH
go up to $2180 will add more shorts)
Not a Financial advice
#BitcoinFiveWeeklyLosses #eth
ETH PERPETUAL TRADE
SELL SETUP
Short from $2130
Currently $2130
Targeting $2085 or Down
(Trading plan IF ETH
go up to $2180 will add more shorts)
Not a Financial advice
#BitcoinFiveWeeklyLosses #eth
2
296

·
--
Bearish
Day 4 on the $ETH short. Still here, still calm. 🧊
Quick update:
Entry: 2224.63
Now: 2122.24
ROI so far: +46.0% 📉
The stop hasn't moved. Still sitting at 2367.04.
Over the last 24h, $ETH is −1.1% and $BTC is −0.6%. Not a crash, just a slow drift, and that's fine by me.
I'm not touching anything. No adding, no fiddling, no celebrating early. Four days in, the position gets to keep doing its thing until it's done.
Green is nice. Patience is nicer. ☕
Be honest: when you're up on a trade, do you leave it alone or start messing with it?
#ETH #Ethereum #CryptoTrading #FuturesTrading
Day 4 on the $ETH short. Still here, still calm. 🧊
Quick update:
Entry: 2224.63
Now: 2122.24
ROI so far: +46.0% 📉
The stop hasn't moved. Still sitting at 2367.04.
Over the last 24h, $ETH is −1.1% and $BTC is −0.6%. Not a crash, just a slow drift, and that's fine by me.
I'm not touching anything. No adding, no fiddling, no celebrating early. Four days in, the position gets to keep doing its thing until it's done.
Green is nice. Patience is nicer. ☕
Be honest: when you're up on a trade, do you leave it alone or start messing with it?
#ETH #Ethereum #CryptoTrading #FuturesTrading
Quick update:
Entry: 2224.63
Now: 2122.24
ROI so far: +46.0% 📉
The stop hasn't moved. Still sitting at 2367.04.
Over the last 24h, $ETH is −1.1% and $BTC is −0.6%. Not a crash, just a slow drift, and that's fine by me.
I'm not touching anything. No adding, no fiddling, no celebrating early. Four days in, the position gets to keep doing its thing until it's done.
Green is nice. Patience is nicer. ☕
Be honest: when you're up on a trade, do you leave it alone or start messing with it?
#ETH #Ethereum #CryptoTrading #FuturesTrading
1
742

·
--
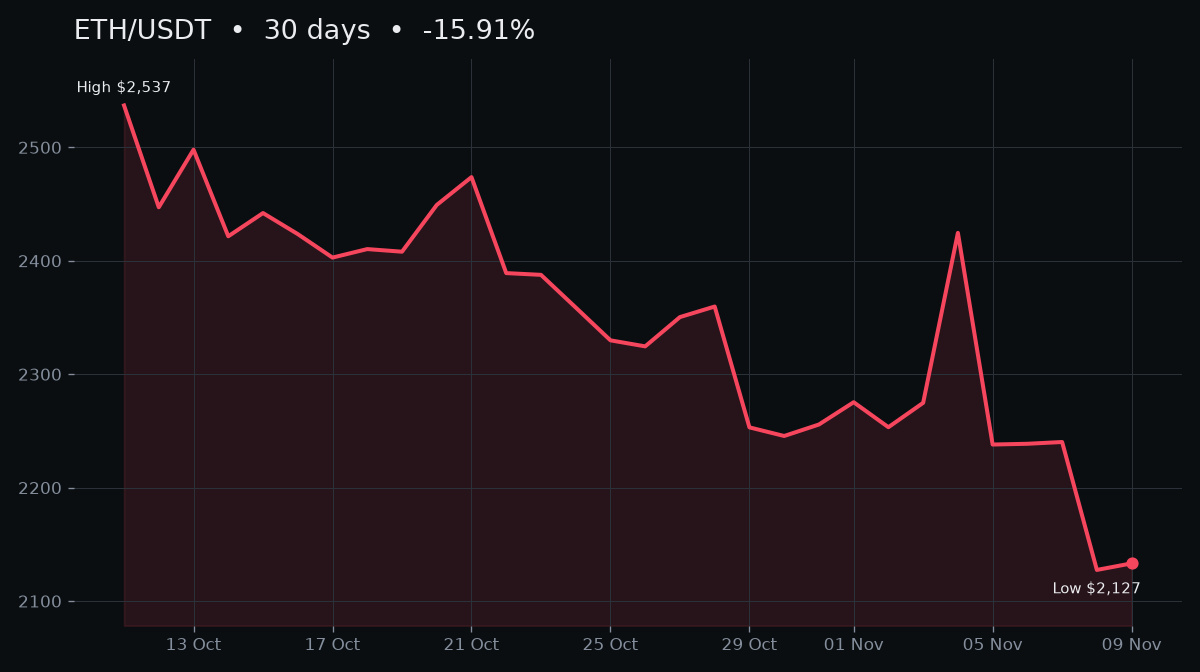
Seeing $ETH slide 15.91% over the past month, it's hovering just above $2,133 after hitting a high of $2,537 and a low of $2,127.
I'm wondering where the nearest support might sit - any thoughts?
not financial advice, DYOR
#ETH #Chart
Seeing $ETH slide 15.91% over the past month, it's hovering just above $2,133 after hitting a high of $2,537 and a low of $2,127.
I'm wondering where the nearest support might sit - any thoughts?
not financial advice, DYOR
#ETH #Chart
I'm wondering where the nearest support might sit - any thoughts?
not financial advice, DYOR
#ETH #Chart
435

🔥 ETHEREUM UNDER HEAVY SELLING PRESSURE! $462 MILLION IN ETH POSITIONS LIQUIDATED!
Ethereum ($ETH) is facing another major sell-off as institutional investors pull money out of ETH investment funds and leveraged traders suffer massive liquidations.
Here are the key developments:
📉 ETH Price: Dropped toward $2,100 on November 9.
⚠️ Liquidations: Approximately $462 million in ETH positions liquidated within 24 hours.
🏦 ETF Outflows: US spot Ethereum ETFs recorded approximately $365.2 million in withdrawals during November 2–6.
🐋 Whale Activity: Despite the sell-off, large Ethereum investors have continued accumulating millions of dollars worth of ETH.
WHY DOES THIS MATTER?
Heavy ETF outflows indicate weakening institutional demand, while leveraged liquidations can accelerate downward price movements.
However, whale accumulation suggests that some large investors are viewing the correction as a potential buying opportunity.
MY MARKET TAKE:
Watch these important levels:
Support: $2,100
Resistance: $2,200
Next upside level to watch: $2,300
A recovery above $2,200 could improve short-term sentiment, while losing $2,100 may expose ETH to further downside.
The big question: Are whales buying the dip while retail traders panic-sell?
#Ethereum #ETH #CryptoNews
🔥 ETHEREUM UNDER HEAVY SELLING PRESSURE! $462 MILLION IN ETH POSITIONS LIQUIDATED!
Ethereum ($ETH) is facing another major sell-off as institutional investors pull money out of ETH investment funds and leveraged traders suffer massive liquidations.
Here are the key developments:
📉 ETH Price: Dropped toward $2,100 on November 9.
⚠️ Liquidations: Approximately $462 million in ETH positions liquidated within 24 hours.
🏦 ETF Outflows: US spot Ethereum ETFs recorded approximately $365.2 million in withdrawals during November 2–6.
🐋 Whale Activity: Despite the sell-off, large Ethereum investors have continued accumulating millions of dollars worth of ETH.
WHY DOES THIS MATTER?
Heavy ETF outflows indicate weakening institutional demand, while leveraged liquidations can accelerate downward price movements.
However, whale accumulation suggests that some large investors are viewing the correction as a potential buying opportunity.
MY MARKET TAKE:
Watch these important levels:
Support: $2,100
Resistance: $2,200
Next upside level to watch: $2,300
A recovery above $2,200 could improve short-term sentiment, while losing $2,100 may expose ETH to further downside.
The big question: Are whales buying the dip while retail traders panic-sell?
#Ethereum #ETH #CryptoNews
Ethereum ($ETH) is facing another major sell-off as institutional investors pull money out of ETH investment funds and leveraged traders suffer massive liquidations.
Here are the key developments:
📉 ETH Price: Dropped toward $2,100 on November 9.
⚠️ Liquidations: Approximately $462 million in ETH positions liquidated within 24 hours.
🏦 ETF Outflows: US spot Ethereum ETFs recorded approximately $365.2 million in withdrawals during November 2–6.
🐋 Whale Activity: Despite the sell-off, large Ethereum investors have continued accumulating millions of dollars worth of ETH.
WHY DOES THIS MATTER?
Heavy ETF outflows indicate weakening institutional demand, while leveraged liquidations can accelerate downward price movements.
However, whale accumulation suggests that some large investors are viewing the correction as a potential buying opportunity.
MY MARKET TAKE:
Watch these important levels:
Support: $2,100
Resistance: $2,200
Next upside level to watch: $2,300
A recovery above $2,200 could improve short-term sentiment, while losing $2,100 may expose ETH to further downside.
The big question: Are whales buying the dip while retail traders panic-sell?
#Ethereum #ETH #CryptoNews

72

·
--
Bullish
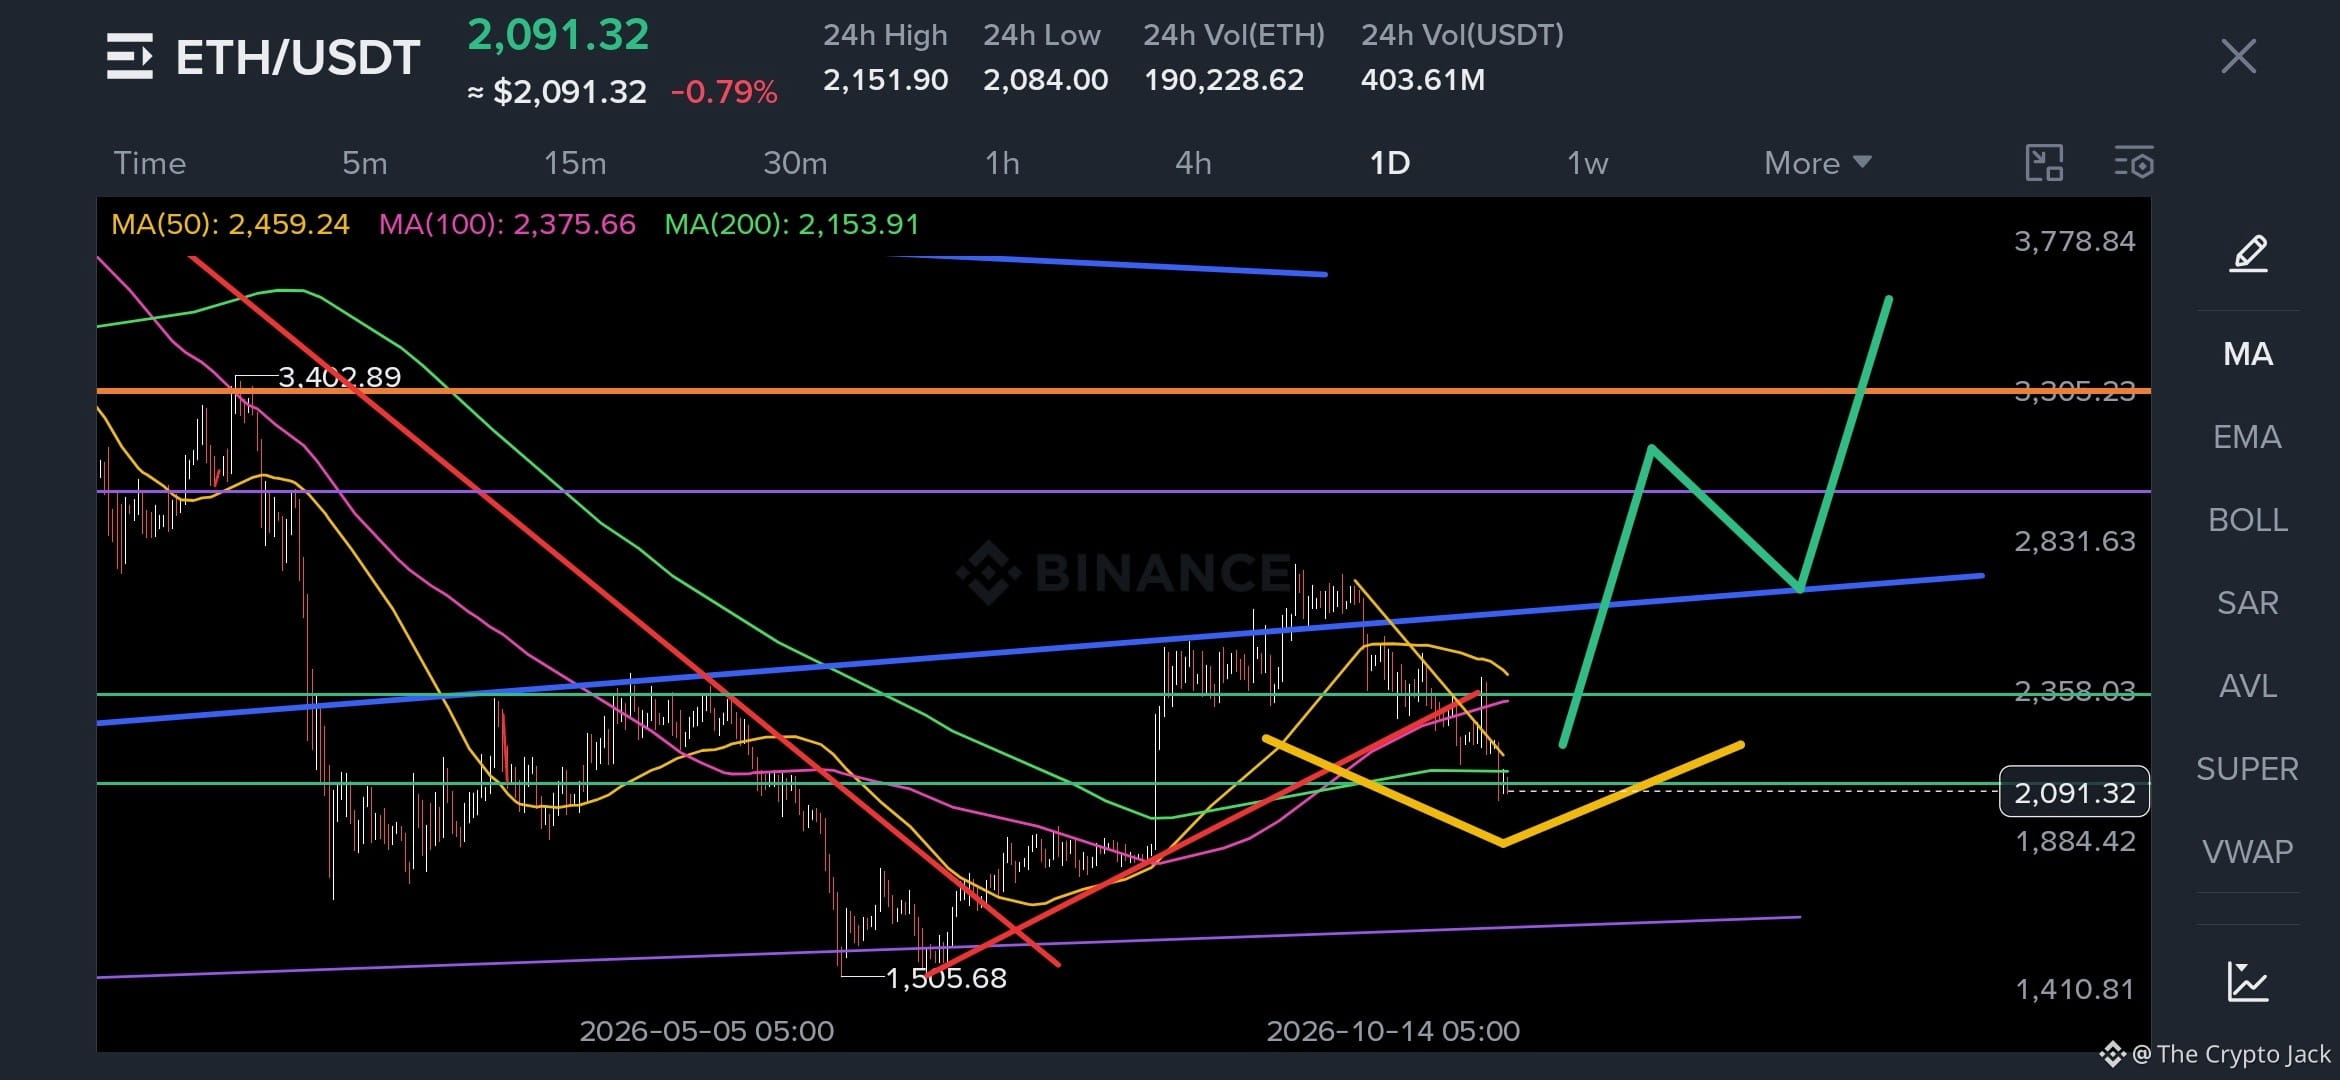
$ETH Is LOSING MA 200 ON DAILY ⚠️
MA200 IS CURRENTLY AT 2150
ETHEREUM NEEDS TO RECOVER IT ON WEEKLY.
WEEKLY CLOSE NEEDS TO BE ABOVE 2150 NOW.
LOSING IT WEEKLY MEANS WE ARE GOING FOR A LOWER LOW.
THAT WILL BE NOT GOOD FOR ETH AND ALTCOINS
I BELIEVE IT WILL RECOVER THE MA200 ON WEEKLY and A HIGHER HIGH WILL COME.
$3000 IS PROGRAMMED ANY TIME SOON.
.
.
.
.
$INIT $AIN
#Binance #CZ #BTC #ETH #bnb
$ETH Is LOSING MA 200 ON DAILY ⚠️
MA200 IS CURRENTLY AT 2150
ETHEREUM NEEDS TO RECOVER IT ON WEEKLY.
WEEKLY CLOSE NEEDS TO BE ABOVE 2150 NOW.
LOSING IT WEEKLY MEANS WE ARE GOING FOR A LOWER LOW.
THAT WILL BE NOT GOOD FOR ETH AND ALTCOINS
I BELIEVE IT WILL RECOVER THE MA200 ON WEEKLY and A HIGHER HIGH WILL COME.
$3000 IS PROGRAMMED ANY TIME SOON.
.
.
.
.
$INIT $AIN
#Binance #CZ #BTC #ETH #bnb
MA200 IS CURRENTLY AT 2150
ETHEREUM NEEDS TO RECOVER IT ON WEEKLY.
WEEKLY CLOSE NEEDS TO BE ABOVE 2150 NOW.
LOSING IT WEEKLY MEANS WE ARE GOING FOR A LOWER LOW.
THAT WILL BE NOT GOOD FOR ETH AND ALTCOINS
I BELIEVE IT WILL RECOVER THE MA200 ON WEEKLY and A HIGHER HIGH WILL COME.
$3000 IS PROGRAMMED ANY TIME SOON.
.
.
.
.
$INIT $AIN
#Binance #CZ #BTC #ETH #bnb
4
1
863

·
--
Bullish
#CPITestsDecemberRateOutlook
🔥 ETHEREUM: THE NEXT BIG MOVE?
Ethereum is more than just a cryptocurrency — it's the backbone of a growing digital ecosystem. 🌍
⚡ Smart contracts
🚀 DeFi innovation
💎 Long-term potential
The crypto journey is full of opportunities, but smart research always comes first.
Are you bullish on ETH?
@mdx1688 @Square-Creator-621db672484e @Square-Creator-c7c3887b7d50
💬 Share your thoughts below & follow me for more crypto insights, market updates, and trending opportunities!
#ETH #Ethereum #Crypto #BinanceSquare
#CPITestsDecemberRateOutlook
🔥 ETHEREUM: THE NEXT BIG MOVE?
Ethereum is more than just a cryptocurrency — it's the backbone of a growing digital ecosystem. 🌍
⚡ Smart contracts
🚀 DeFi innovation
💎 Long-term potential
The crypto journey is full of opportunities, but smart research always comes first.
Are you bullish on ETH?
@Hawk自由哥 @Valene Schmith AUOI @Doretta Stauffer wpq6
💬 Share your thoughts below & follow me for more crypto insights, market updates, and trending opportunities!
#ETH #Ethereum #Crypto #BinanceSquare
🔥 ETHEREUM: THE NEXT BIG MOVE?
Ethereum is more than just a cryptocurrency — it's the backbone of a growing digital ecosystem. 🌍
⚡ Smart contracts
🚀 DeFi innovation
💎 Long-term potential
The crypto journey is full of opportunities, but smart research always comes first.
Are you bullish on ETH?
@Hawk自由哥 @Valene Schmith AUOI @Doretta Stauffer wpq6
💬 Share your thoughts below & follow me for more crypto insights, market updates, and trending opportunities!
#ETH #Ethereum #Crypto #BinanceSquare
1
101

·
--
Does History Rhyme for $ETH? 11 Past Cases Analysed 🔍
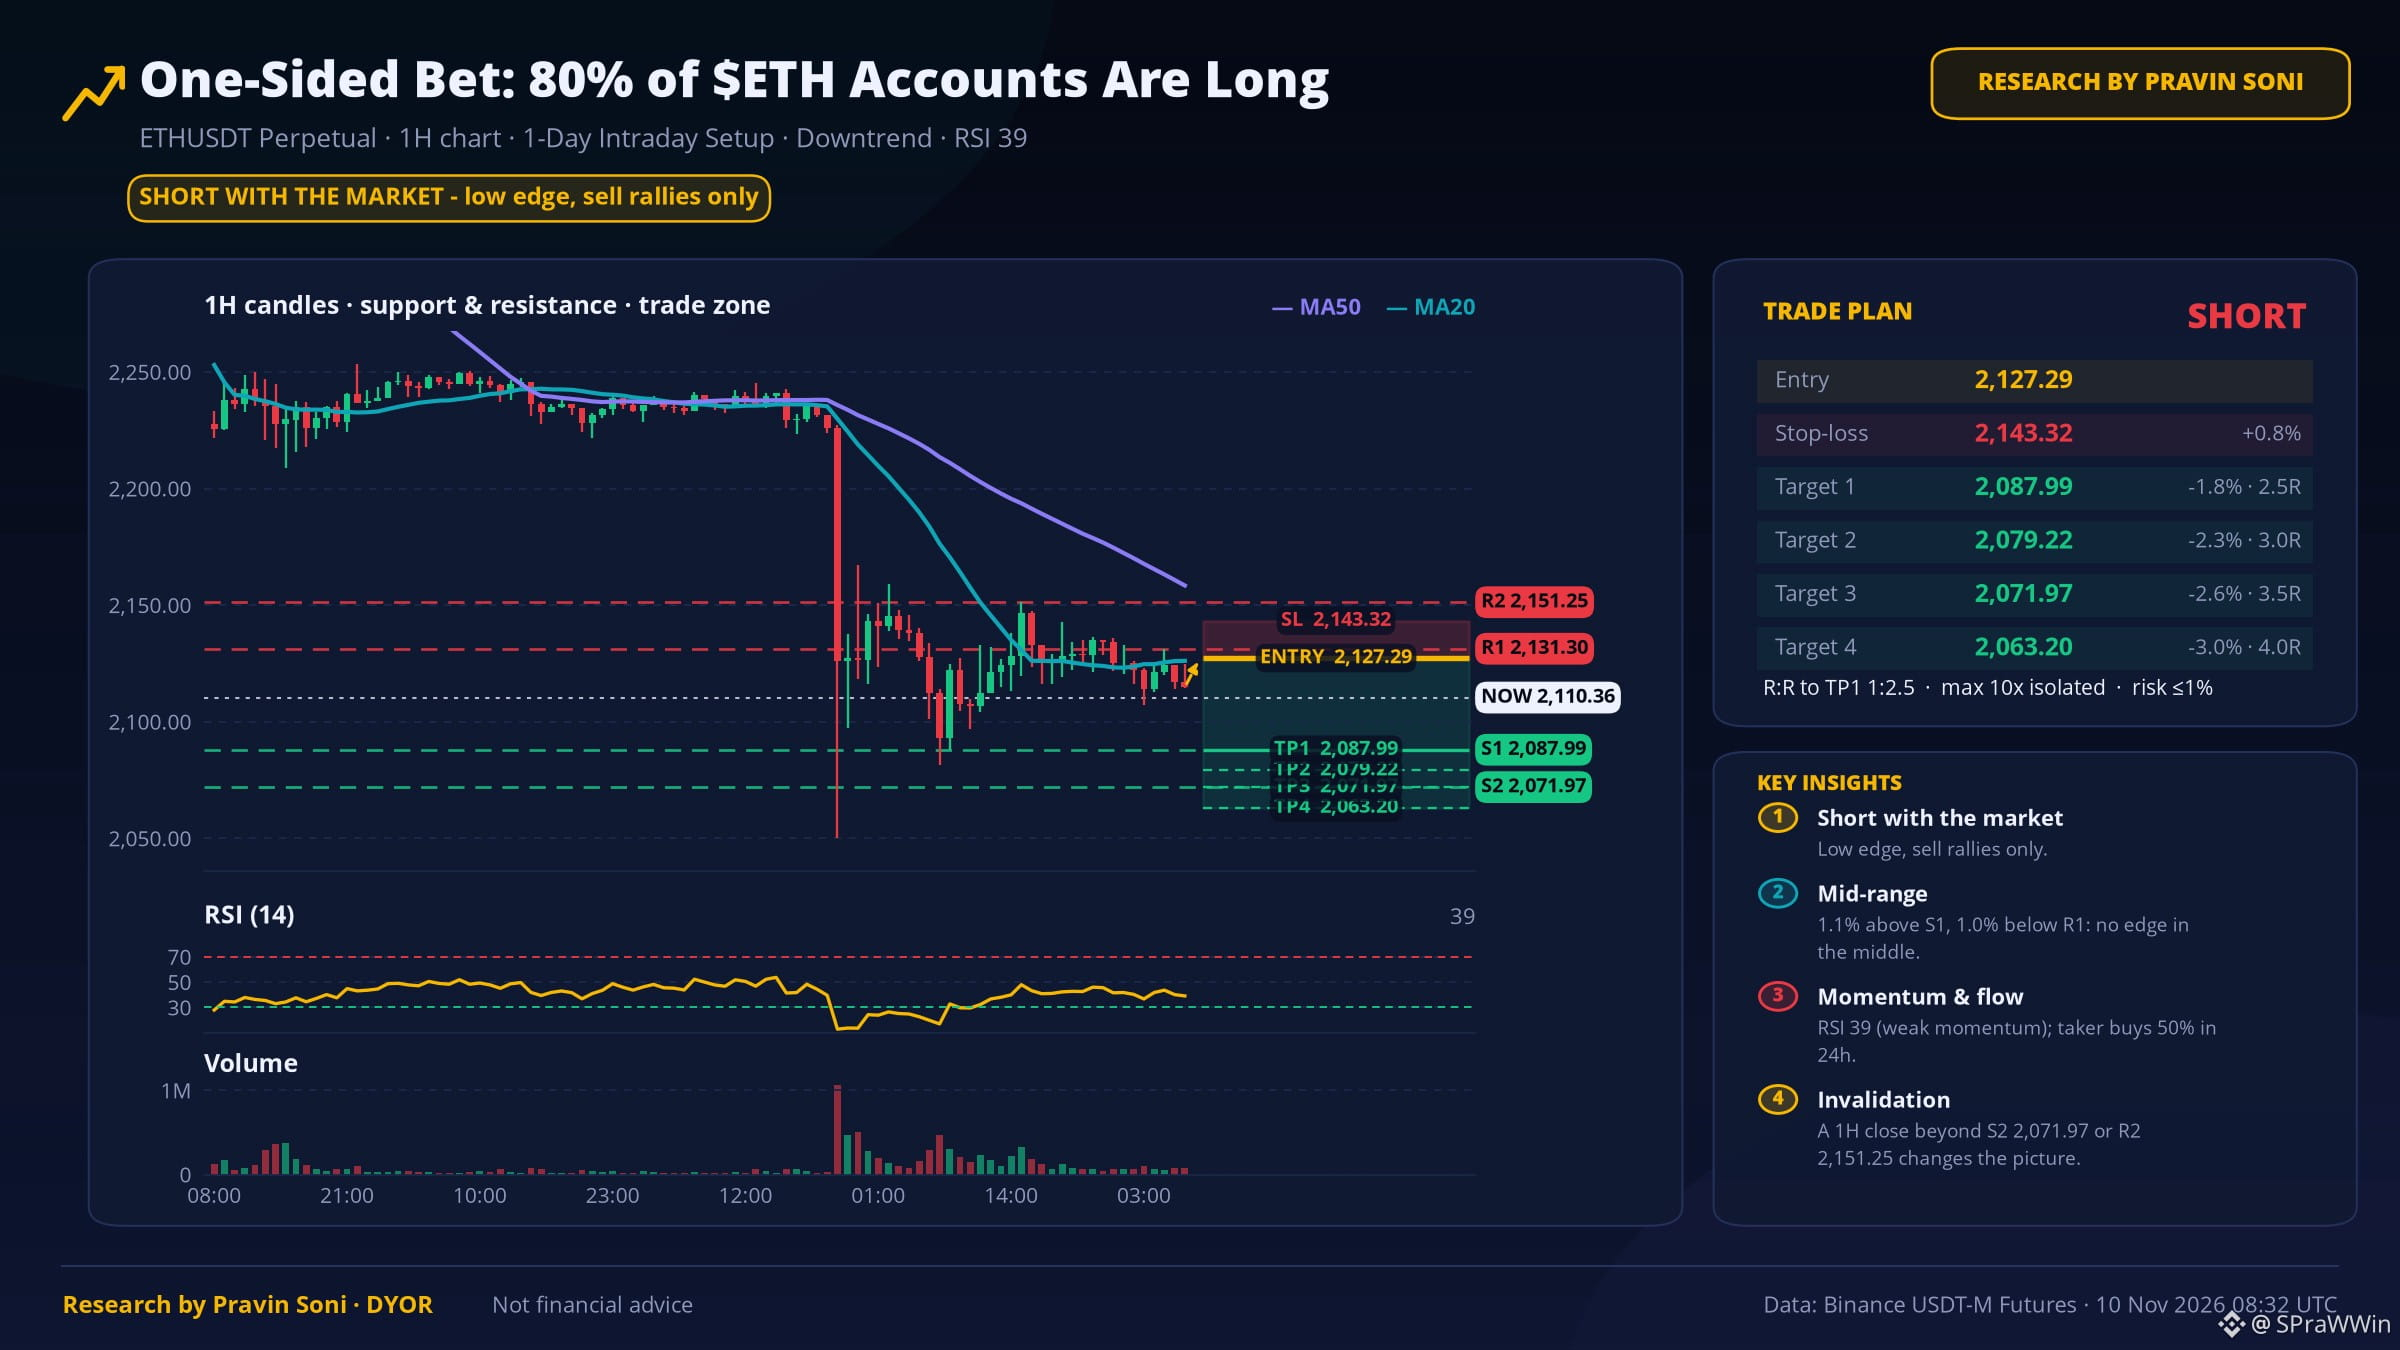
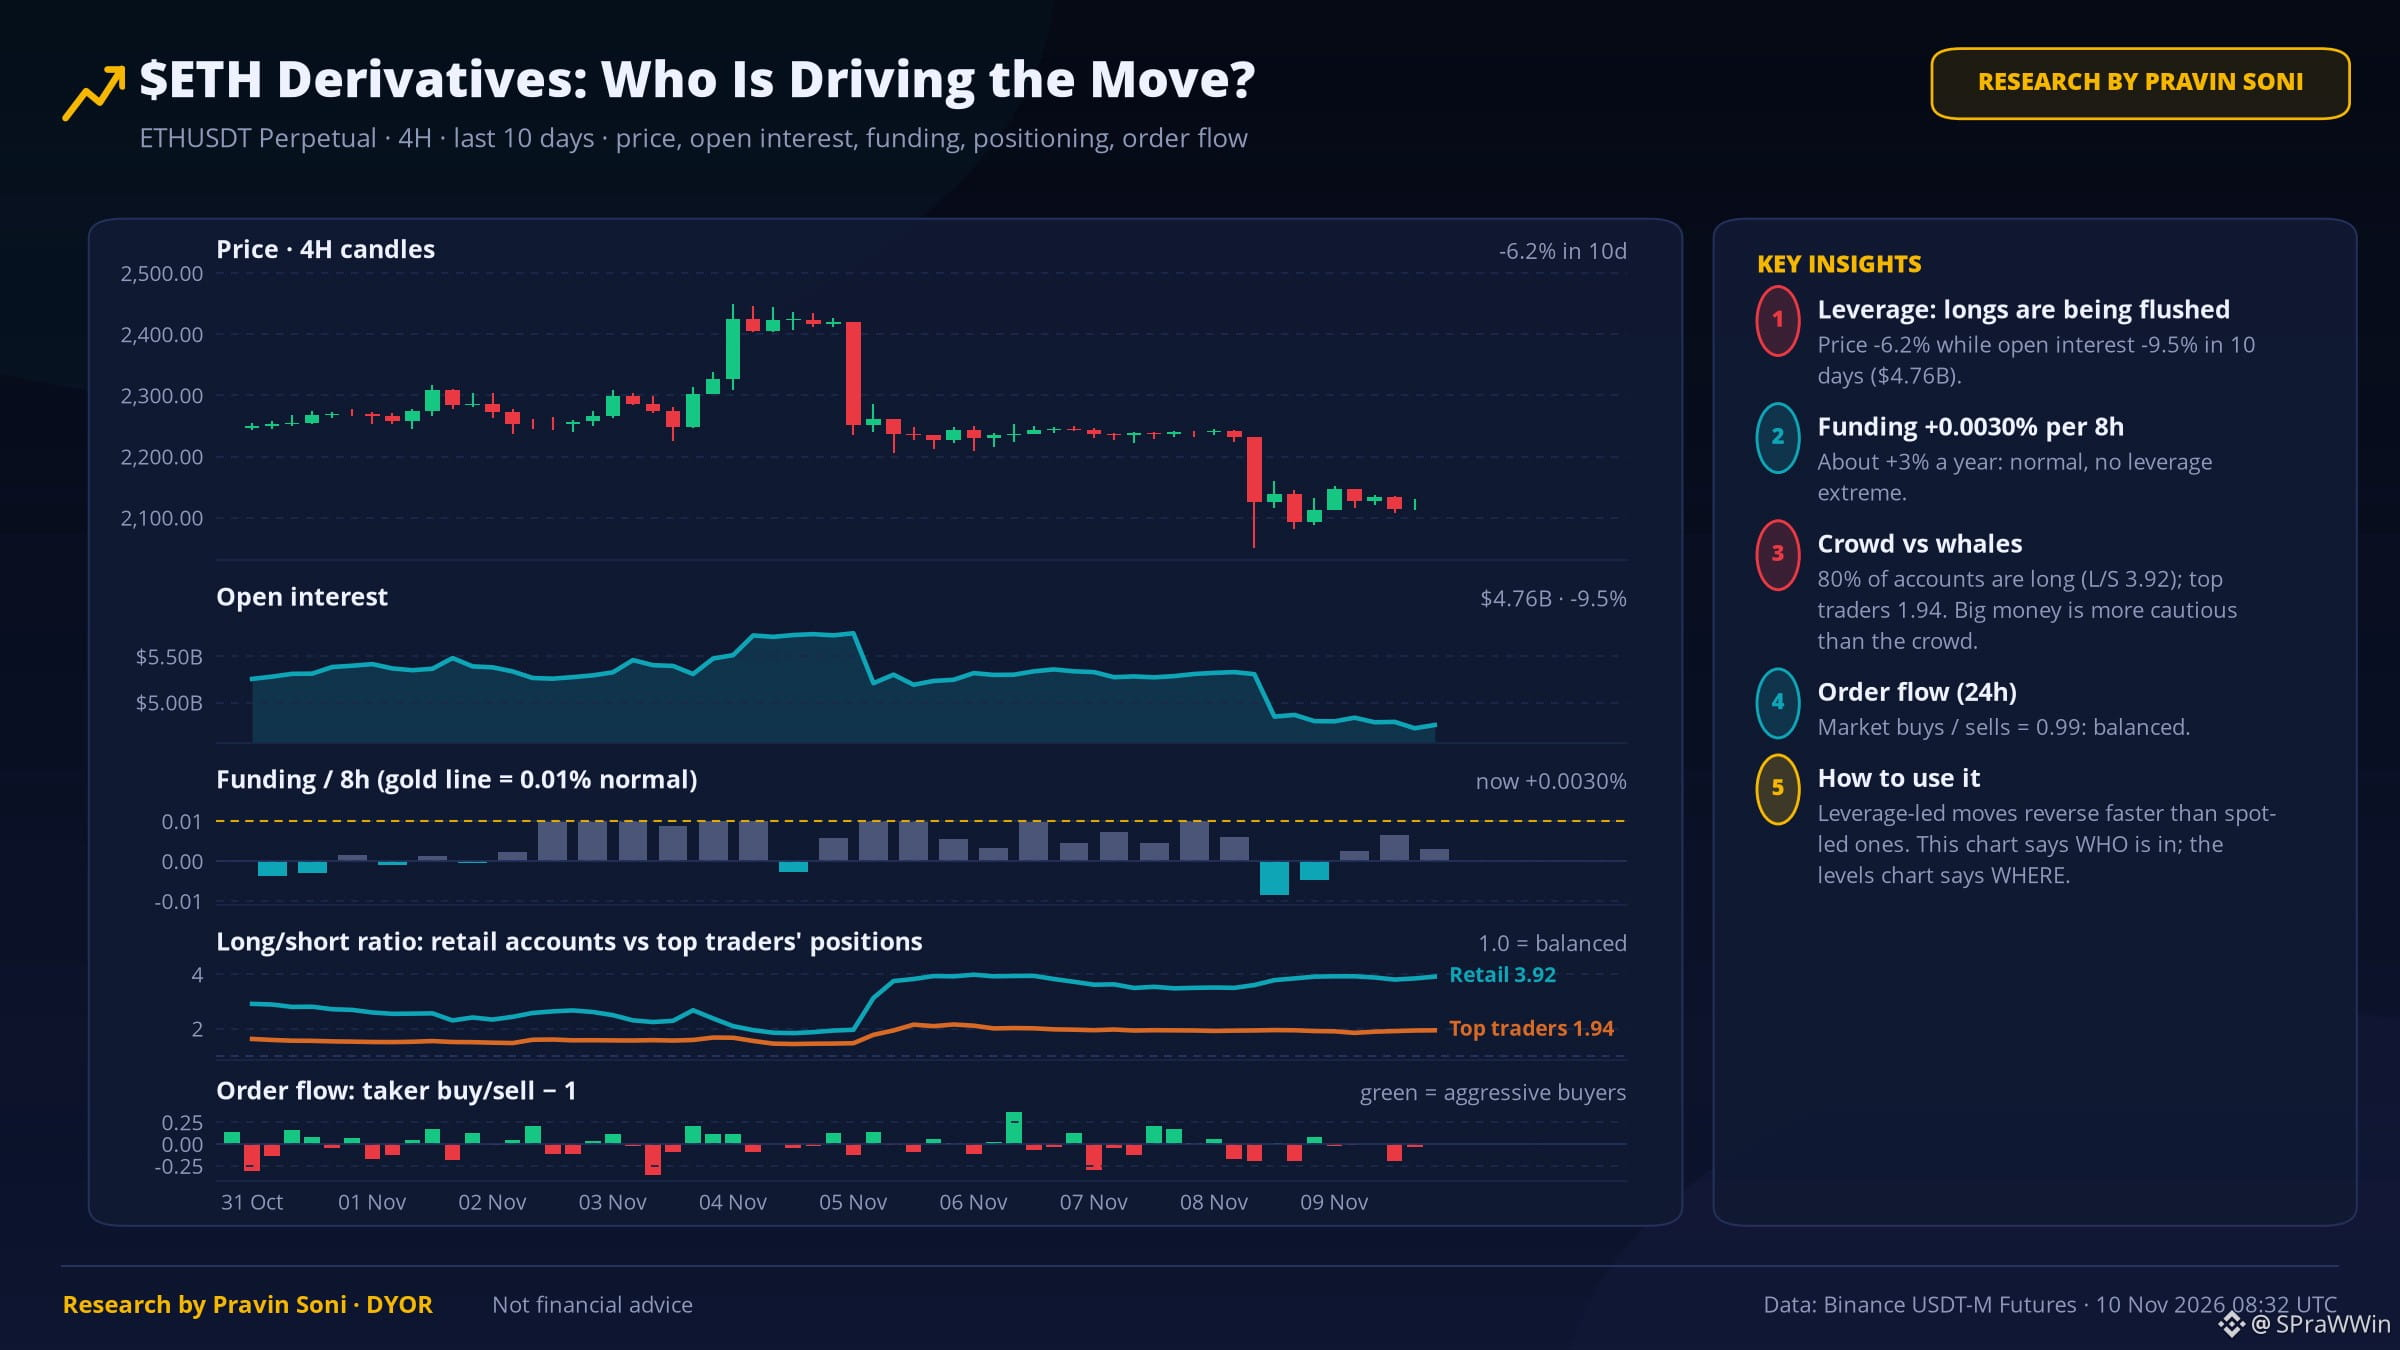
TL;DR: 80% of accounts are long; top traders more bearish than the crowd. History leans down (5/11). Price 2,110.67, daily RSI 34.
📊 2 things the data says
1️⃣ 80% of Binance accounts are long (L/S 3.92) — the crowd is one-sided, a contrarian warning.
2️⃣ Top traders' position ratio is 1.94 vs their account ratio 4.24 — big money is leaning short.
📜 History check
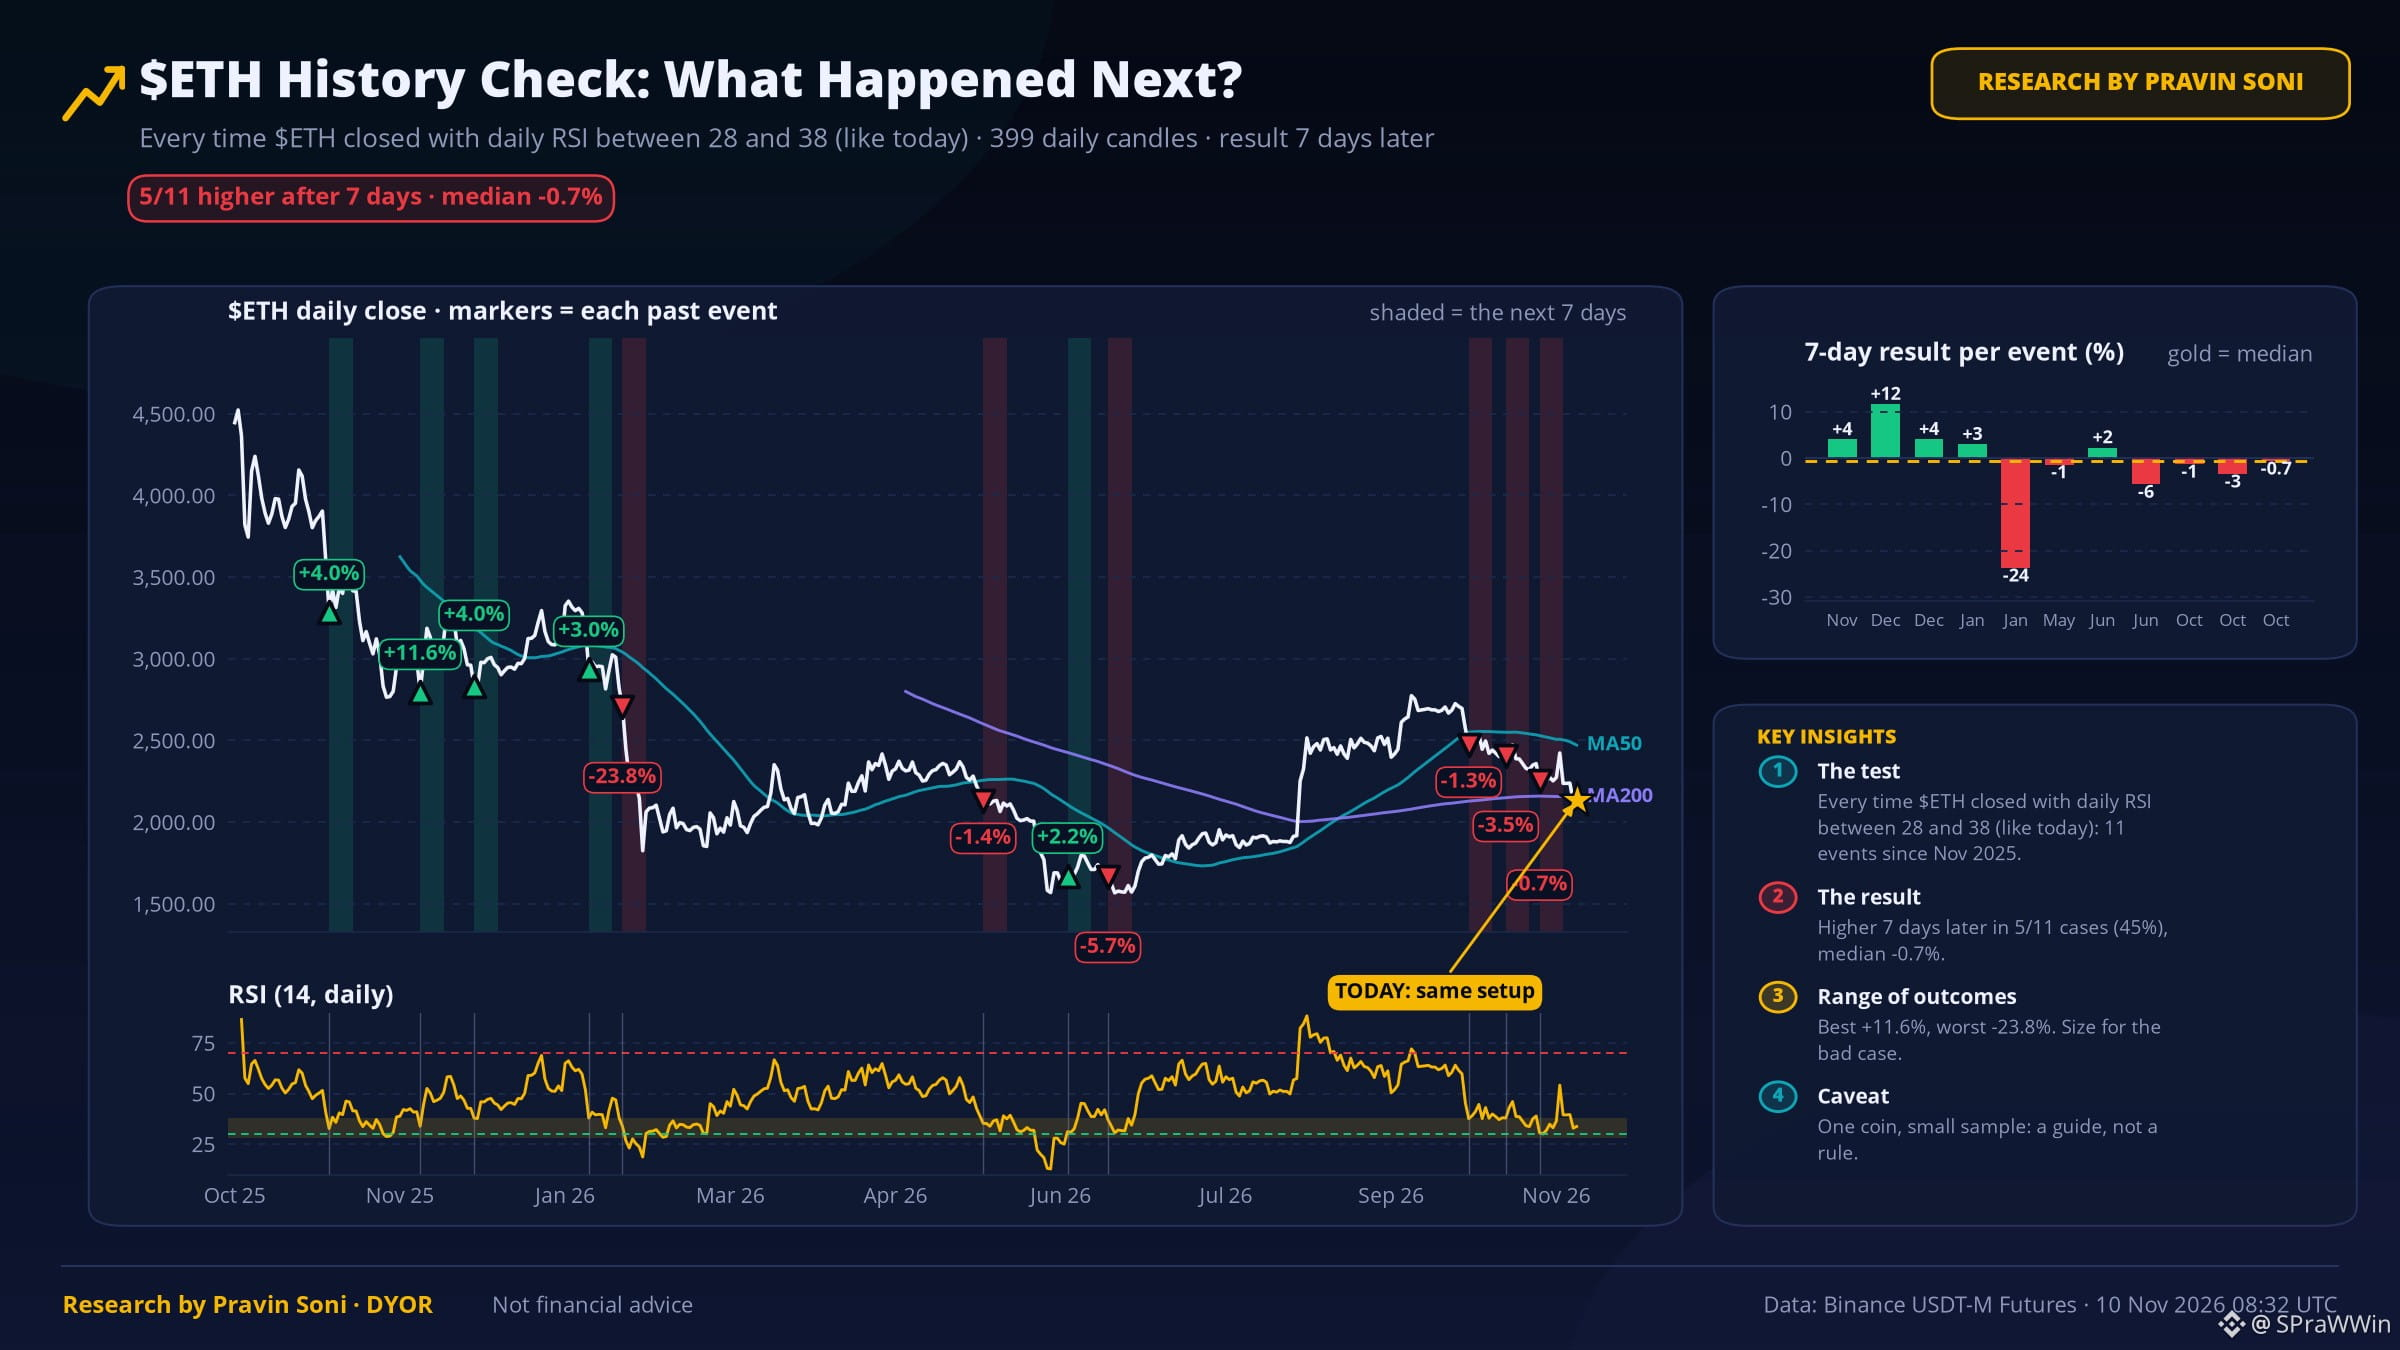
The last 11 times $ETH closed with daily RSI between 28 and 38 (like today), it was higher 7 days later in 5 of 11 cases (median -0.7%). Small sample, so a guide, not a rule.
📏 Expected range (7 days)
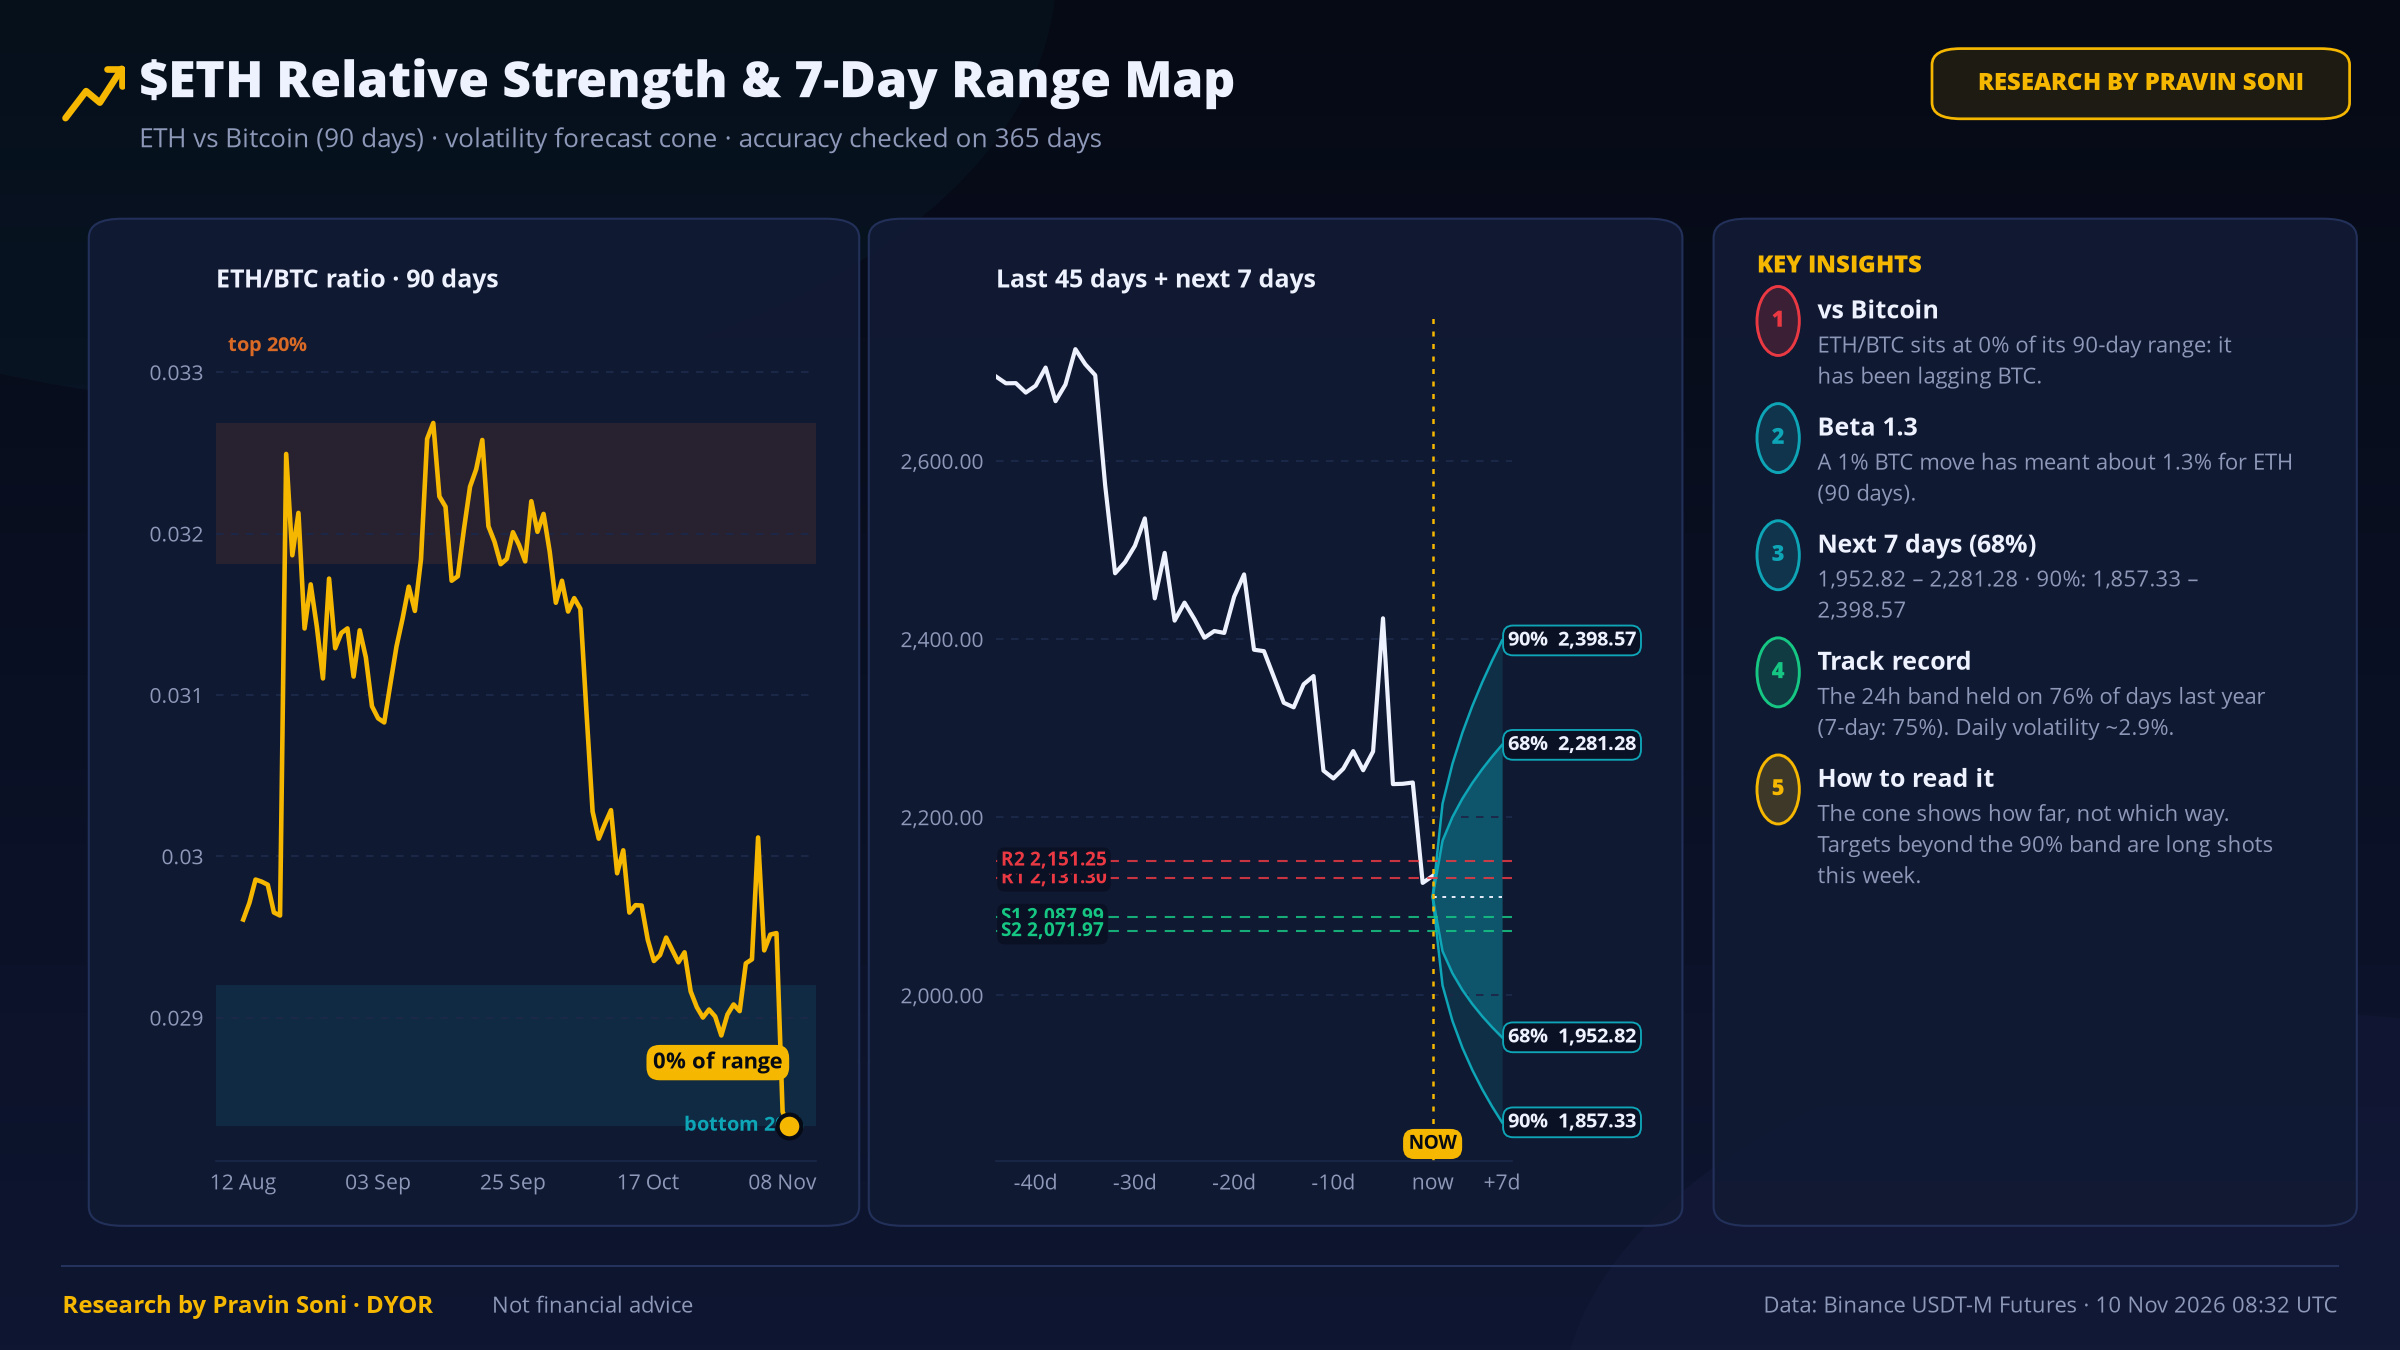
68% band: 1,952.82 – 2,281.28 · 90% band: 1,857.33 – 2,398.57
This band held on 76% of days last year. It shows how far, not which way.
vs $BTC: ETH/BTC sits at 0% of its 90-day range, beta 1.3.
🧭 What decides the next move
🟢 Bull case: daily close above 2,131.30 → 2,151.25
🔴 Bear case: daily close below 2,087.99 → 2,071.97
💡 My take: The data leans bearish. A daily close below 2,087.99 confirms it; reclaiming 2,131.30 proves me wrong.
📰 Cointelegraph, 3h ago: ⚡️ NEW: Vitalik Buterin and Ethereum Foundation hit with lawsuit by former employee Kayleen Fulton. She alleges she was fired 13 days after she disclo…
💬 Would you fade the crowd here, or follow it?
Not financial advice · Data: Binance Futures
$ETH #ETH #Sentiment #CryptoAnalysis
⚠️ Research by Pravin Soni - DYOR
Does History Rhyme for $ETH ? 11 Past Cases Analysed 🔍
TL;DR: 80% of accounts are long; top traders more bearish than the crowd. History leans down (5/11). Price 2,110.67, daily RSI 34.
📊 2 things the data says
1️⃣ 80% of Binance accounts are long (L/S 3.92) — the crowd is one-sided, a contrarian warning.
2️⃣ Top traders' position ratio is 1.94 vs their account ratio 4.24 — big money is leaning short.
📜 History check
The last 11 times $ETH closed with daily RSI between 28 and 38 (like today), it was higher 7 days later in 5 of 11 cases (median -0.7%). Small sample, so a guide, not a rule.
📏 Expected range (7 days)
68% band: 1,952.82 – 2,281.28 · 90% band: 1,857.33 – 2,398.57
This band held on 76% of days last year. It shows how far, not which way.
vs $BTC : ETH/BTC sits at 0% of its 90-day range, beta 1.3.
🧭 What decides the next move
🟢 Bull case: daily close above 2,131.30 → 2,151.25
🔴 Bear case: daily close below 2,087.99 → 2,071.97
💡 My take: The data leans bearish. A daily close below 2,087.99 confirms it; reclaiming 2,131.30 proves me wrong.
📰 Cointelegraph, 3h ago: ⚡️ NEW: Vitalik Buterin and Ethereum Foundation hit with lawsuit by former employee Kayleen Fulton. She alleges she was fired 13 days after she disclo…
💬 Would you fade the crowd here, or follow it?
Not financial advice · Data: Binance Futures
$ETH #ETH #Sentiment #CryptoAnalysis
⚠️ Research by Pravin Soni - DYOR
TL;DR: 80% of accounts are long; top traders more bearish than the crowd. History leans down (5/11). Price 2,110.67, daily RSI 34.
📊 2 things the data says
1️⃣ 80% of Binance accounts are long (L/S 3.92) — the crowd is one-sided, a contrarian warning.
2️⃣ Top traders' position ratio is 1.94 vs their account ratio 4.24 — big money is leaning short.
📜 History check
The last 11 times $ETH closed with daily RSI between 28 and 38 (like today), it was higher 7 days later in 5 of 11 cases (median -0.7%). Small sample, so a guide, not a rule.
📏 Expected range (7 days)
68% band: 1,952.82 – 2,281.28 · 90% band: 1,857.33 – 2,398.57
This band held on 76% of days last year. It shows how far, not which way.
vs $BTC : ETH/BTC sits at 0% of its 90-day range, beta 1.3.
🧭 What decides the next move
🟢 Bull case: daily close above 2,131.30 → 2,151.25
🔴 Bear case: daily close below 2,087.99 → 2,071.97
💡 My take: The data leans bearish. A daily close below 2,087.99 confirms it; reclaiming 2,131.30 proves me wrong.
📰 Cointelegraph, 3h ago: ⚡️ NEW: Vitalik Buterin and Ethereum Foundation hit with lawsuit by former employee Kayleen Fulton. She alleges she was fired 13 days after she disclo…
💬 Would you fade the crowd here, or follow it?
Not financial advice · Data: Binance Futures
$ETH #ETH #Sentiment #CryptoAnalysis
⚠️ Research by Pravin Soni - DYOR
93

🚨 $ETH /USDT — MARKET UPDATE 📊
{future}(ETHUSDT)
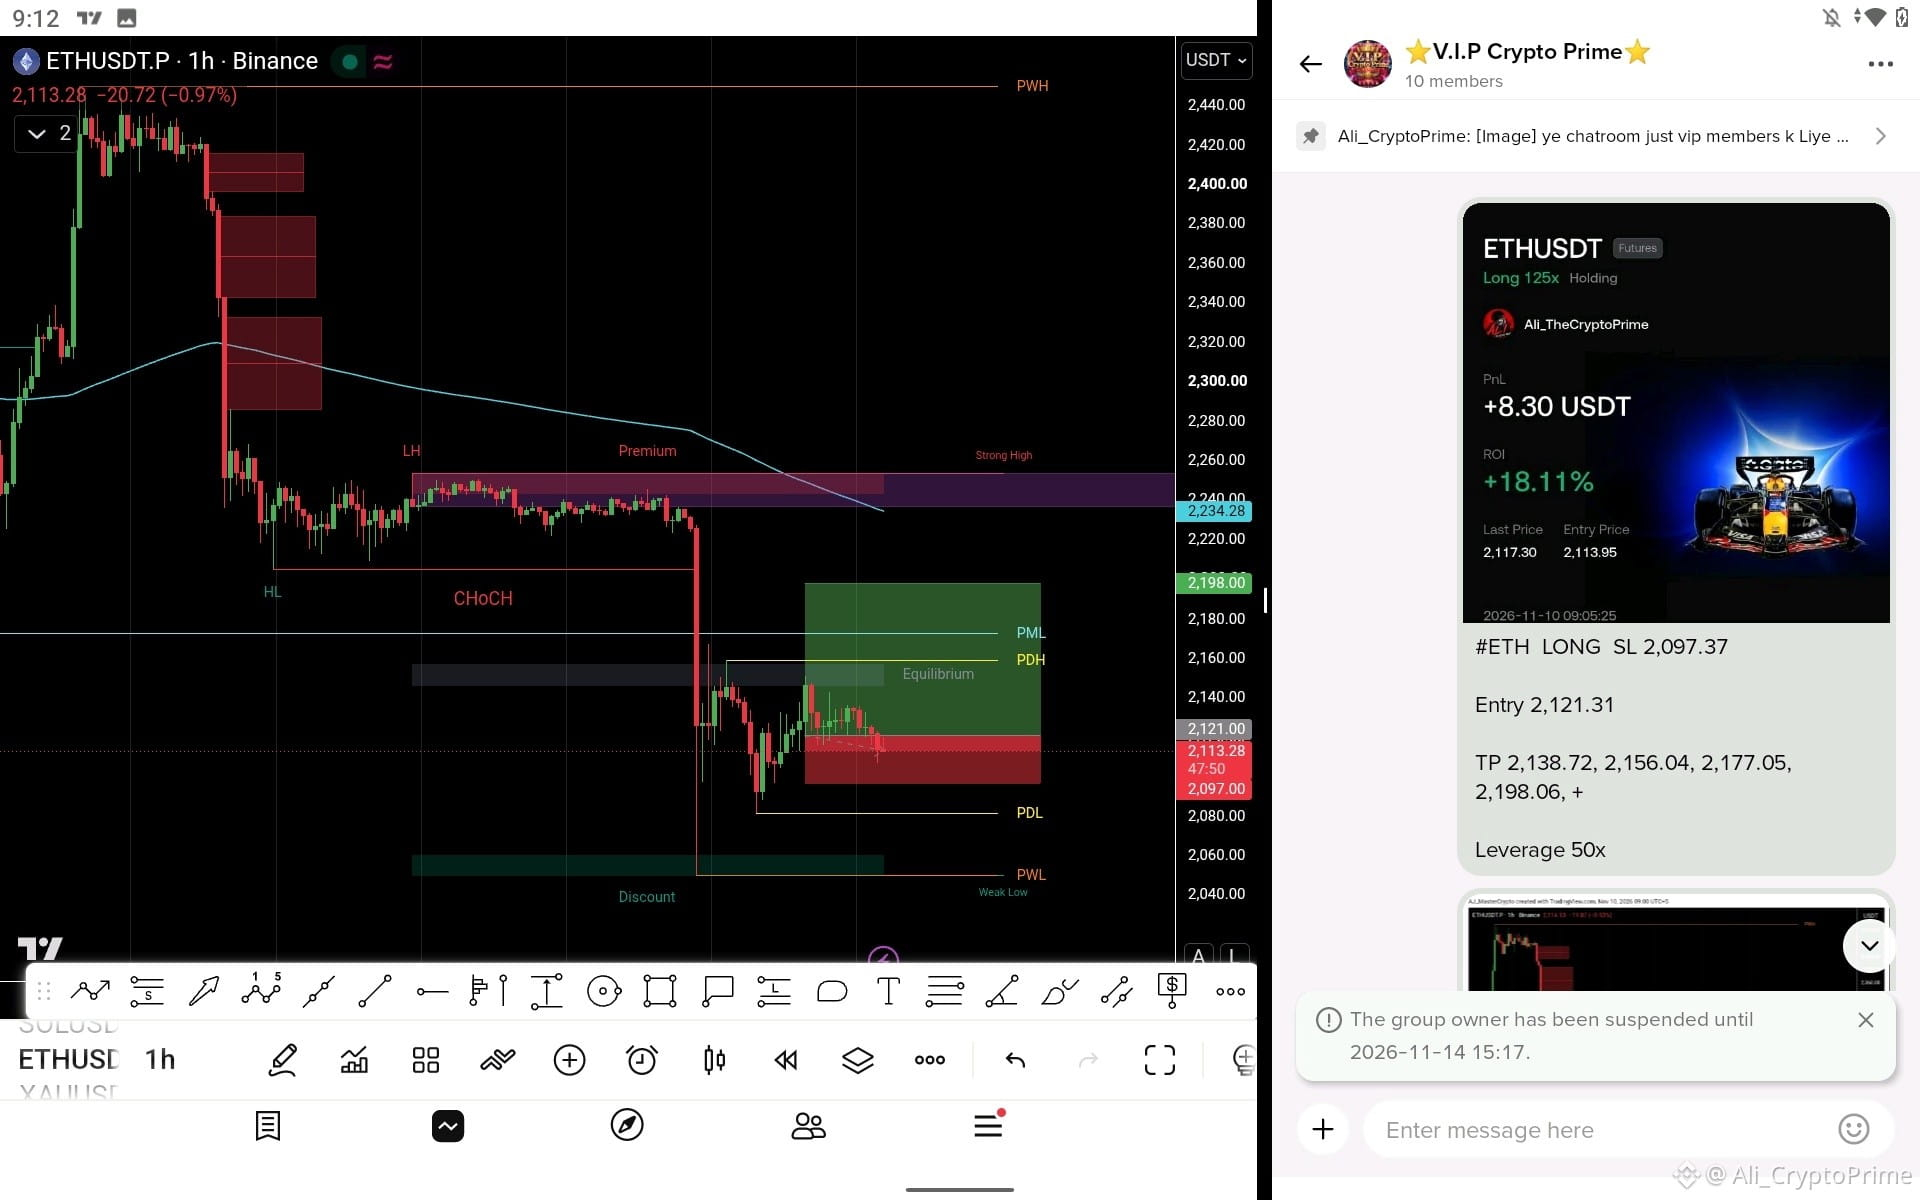
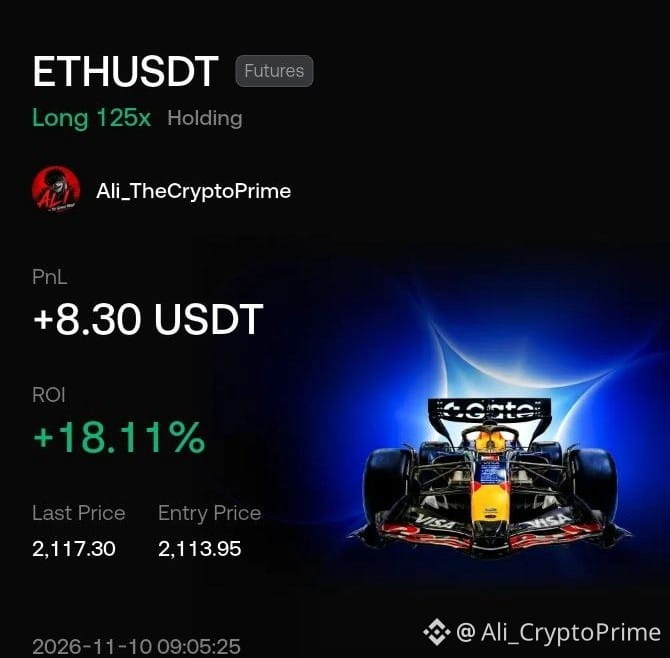
ETH ka LONG setup apne private trading chatroom mein share kar diya hai. 📈
Ab nazar market ke next move par hai. Let's see how this setup plays out! 👀🔥
Smart trading is all about patience, timing and discipline. 💎
What’s your view on ETH? Bullish or Bearish? 👇
@ArtistAli
#ETH #Ethereum #CryptoTrading #Binance
🚨 $ETH /USDT — MARKET UPDATE 📊
ETH ka LONG setup apne private trading chatroom mein share kar diya hai. 📈
Ab nazar market ke next move par hai. Let's see how this setup plays out! 👀🔥
Smart trading is all about patience, timing and discipline. 💎
What’s your view on ETH? Bullish or Bearish? 👇
@Ali_TheCryptoPrime
#ETH #Ethereum #CryptoTrading #Binance
ETH ka LONG setup apne private trading chatroom mein share kar diya hai. 📈
Ab nazar market ke next move par hai. Let's see how this setup plays out! 👀🔥
Smart trading is all about patience, timing and discipline. 💎
What’s your view on ETH? Bullish or Bearish? 👇
@Ali_TheCryptoPrime
#ETH #Ethereum #CryptoTrading #Binance
55

·
--
Bullish
30D trade $ETH 27.2 USDT
$ETH
{future}(ETHUSDT)
ETHUSDT — LONG WATCH
$2,131.70
24H change: -4.16% · Reference price
Margin: Isolated
Timeframe: 4H
Entry: $2,105–$2,130
Confirmation: Bullish engulfing candle and support reclaim.
Stop-loss: $2,075
TP1: $2,160
TP2: $2,195
TP3: $2,240
Invalidation: 4H close below $2,075.
Trade logic: Counter-trend bounce; wait for confirmation.
#ETH #BTC #xrp #LUNA #BNB_Market_Update
$ETH
ETHUSDT — LONG WATCH
$2,131.70
24H change: -4.16% · Reference price
Margin: Isolated
Timeframe: 4H
Entry: $2,105–$2,130
Confirmation: Bullish engulfing candle and support reclaim.
Stop-loss: $2,075
TP1: $2,160
TP2: $2,195
TP3: $2,240
Invalidation: 4H close below $2,075.
Trade logic: Counter-trend bounce; wait for confirmation.
#ETH #BTC #xrp #LUNA #BNB_Market_Update
ETHUSDT — LONG WATCH
$2,131.70
24H change: -4.16% · Reference price
Margin: Isolated
Timeframe: 4H
Entry: $2,105–$2,130
Confirmation: Bullish engulfing candle and support reclaim.
Stop-loss: $2,075
TP1: $2,160
TP2: $2,195
TP3: $2,240
Invalidation: 4H close below $2,075.
Trade logic: Counter-trend bounce; wait for confirmation.
#ETH #BTC #xrp #LUNA #BNB_Market_Update
52

🚨 $ETH ECOSYSTEM ON RED ALERT AFTER A SUPPLY CHAIN BREACH ⚠️
Smart money always watches the plumbing when structural friction hits the tape. A complex supply chain vector just rattled the Ethereum ecosystem, flagged sharply by security auditors tracking Ethersphere infrastructure. 🔍
When vulnerabilities ripple through core dependencies, volatility spikes as liquidity re-evaluates risk parameters. This is where reactive retail panics while disciplined participants inspect the collateral damage and wait for clear confirmation. 📊
💡 Are you tightening your defensive posture across layer networks or treating this as isolated noise? 👇
⚠️ Not financial advice. Always manage your risk. 🛡️
🏷️ #ETH #Ethereum #Security #Crypto
🛡️ ⚡
🚨 $ETH ECOSYSTEM ON RED ALERT AFTER A SUPPLY CHAIN BREACH ⚠️
Smart money always watches the plumbing when structural friction hits the tape. A complex supply chain vector just rattled the Ethereum ecosystem, flagged sharply by security auditors tracking Ethersphere infrastructure. 🔍
When vulnerabilities ripple through core dependencies, volatility spikes as liquidity re-evaluates risk parameters. This is where reactive retail panics while disciplined participants inspect the collateral damage and wait for clear confirmation. 📊
💡 Are you tightening your defensive posture across layer networks or treating this as isolated noise? 👇
⚠️ Not financial advice. Always manage your risk. 🛡️
🏷️ #ETH #Ethereum #Security #Crypto
🛡️ ⚡
Smart money always watches the plumbing when structural friction hits the tape. A complex supply chain vector just rattled the Ethereum ecosystem, flagged sharply by security auditors tracking Ethersphere infrastructure. 🔍
When vulnerabilities ripple through core dependencies, volatility spikes as liquidity re-evaluates risk parameters. This is where reactive retail panics while disciplined participants inspect the collateral damage and wait for clear confirmation. 📊
💡 Are you tightening your defensive posture across layer networks or treating this as isolated noise? 👇
⚠️ Not financial advice. Always manage your risk. 🛡️
🏷️ #ETH #Ethereum #Security #Crypto
🛡️ ⚡

·
--
Ex-employee sues Ethereum Foundation and Vitalik Buterin over firing
🔍 Executive Brief:
Kayleen Fulton, a former Ethereum Foundation employee, has filed a lawsuit alleging wrongful termination after disclosing a cancer diagnosis and participating in a staff letter opposing the foundation’s new mandate. The suit targets both the foundation and co‑founder Vitalik Buterin, claiming retaliation for her health disclosure and dissent.
📊 Trader Lens & Market Flow:
The lawsuit injects uncertainty into Ethereum’s institutional ecosystem, potentially tightening liquidity as firms reassess exposure to foundation‑linked governance risks. Futures open interest may see a modest dip as traders hedge against heightened volatility, while overall market structure could experience a brief tightening as liquidity providers recalibrate risk models around the Foundation’s governance narrative.
⚡ 24H Futures Momentum Leaders:
• $INIT (+48.5%) — Price: 0.1953
• $ARIA (+32.7%) — Price: 0.2062
• $ONE (+22.1%) — Price: 0.001878
#TrendingTopic #Write2Earn #ETH
Ex-employee sues Ethereum Foundation and Vitalik Buterin over firing
🔍 Executive Brief:
Kayleen Fulton, a former Ethereum Foundation employee, has filed a lawsuit alleging wrongful termination after disclosing a cancer diagnosis and participating in a staff letter opposing the foundation’s new mandate. The suit targets both the foundation and co‑founder Vitalik Buterin, claiming retaliation for her health disclosure and dissent.
📊 Trader Lens & Market Flow:
The lawsuit injects uncertainty into Ethereum’s institutional ecosystem, potentially tightening liquidity as firms reassess exposure to foundation‑linked governance risks. Futures open interest may see a modest dip as traders hedge against heightened volatility, while overall market structure could experience a brief tightening as liquidity providers recalibrate risk models around the Foundation’s governance narrative.
⚡ 24H Futures Momentum Leaders:
• $INIT (+48.5%) — Price: 0.1953
• $ARIA (+32.7%) — Price: 0.2062
• $ONE (+22.1%) — Price: 0.001878
#TrendingTopic #Write2Earn #ETH
🔍 Executive Brief:
Kayleen Fulton, a former Ethereum Foundation employee, has filed a lawsuit alleging wrongful termination after disclosing a cancer diagnosis and participating in a staff letter opposing the foundation’s new mandate. The suit targets both the foundation and co‑founder Vitalik Buterin, claiming retaliation for her health disclosure and dissent.
📊 Trader Lens & Market Flow:
The lawsuit injects uncertainty into Ethereum’s institutional ecosystem, potentially tightening liquidity as firms reassess exposure to foundation‑linked governance risks. Futures open interest may see a modest dip as traders hedge against heightened volatility, while overall market structure could experience a brief tightening as liquidity providers recalibrate risk models around the Foundation’s governance narrative.
⚡ 24H Futures Momentum Leaders:
• $INIT (+48.5%) — Price: 0.1953
• $ARIA (+32.7%) — Price: 0.2062
• $ONE (+22.1%) — Price: 0.001878
#TrendingTopic #Write2Earn #ETH

7
Log in to explore more content
Join global crypto users on Binance Square
⚡️ Get latest and useful information about crypto.
💬 Trusted by the world’s largest crypto exchange.
👍 Discover real insights from verified creators.
Email / Phone number
Trending Topics
1
#CPITestsDecemberRateOutlook
765,362 views
3,818 Discussing
2
#AnthropicRejectsIPODelayValuationinQuestion
91,353 views
865 Discussing
3
#NvidiaInvestigatesAfterHuang’sAffairApology
319,237 views
2,404 Discussing
4
#CanNvidiaEarningsEaseMarketConcerns?
1,888 views
75 Discussing
5
#US-IranTalksFuelStrongStockMarketRebound
30,901 views
305 Discussing
6
#BitcoinFiveWeeklyLosses
341,473 views
2,734 Discussing
7
#AIChipSlumpNasdaq
194,170 views
1,623 Discussing
8
#BitcoinSpotETFsPost$201MNetOutflowForThirdStraightDay
600 views
10 Discussing
9
#CryptoLiquidationsReach$1.16BIn24Hours
37,478 views
65 Discussing
10
#TradFiForBeginners
402,206 views
2,746 Discussing