
#trendingcoin320
trendingcoin320
843,614 views
1,551 Discussing
Hot
Latest

·
--
Top trending coins today:
1. LAB - $13.84, up 27.6% in 24h, 211% this week
2. Humanity $H - $0.63, up 20.5% today, 150% this week
3. Ondo $ONDO - $0.42, up 18.6% today
4. Venice Token $VVV - $19.66, up 10.2% today
5. MemeCore $M - $3.30, up 1.5% today 9fc9
Big caps also moving:
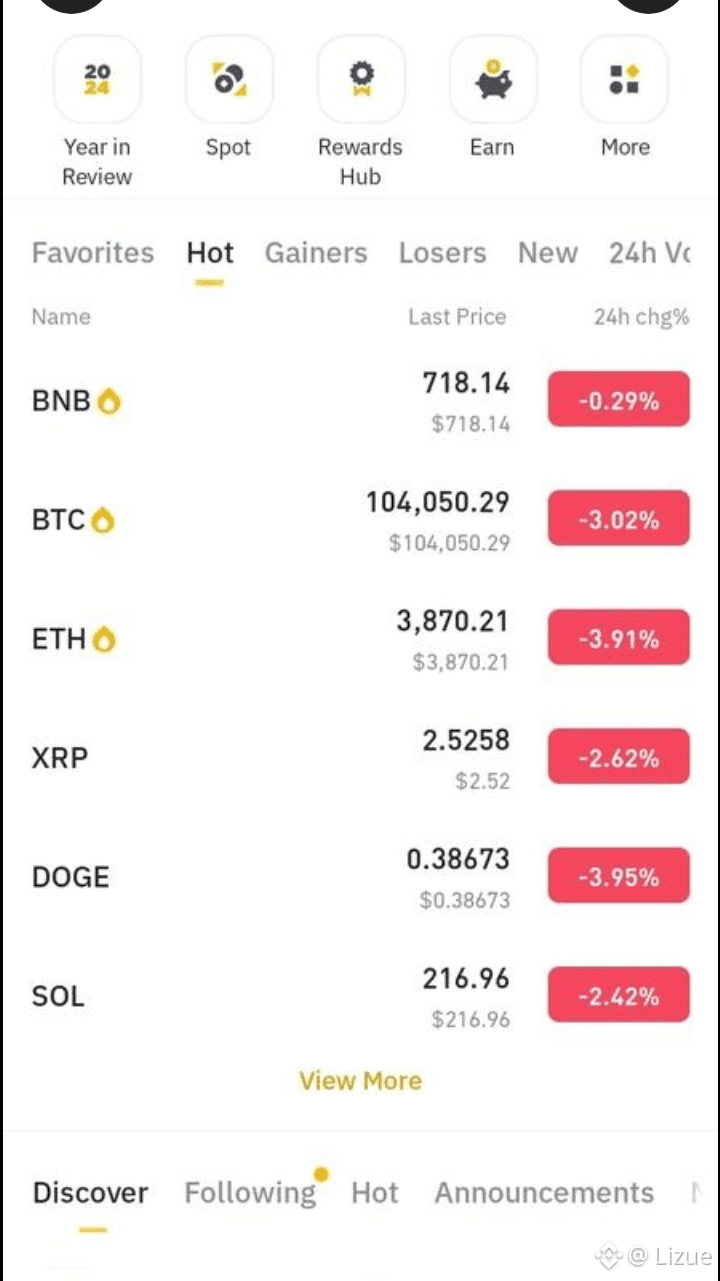
BTC $62,803, up 2.69% today
BNB $599.20, up 2.68% today
SOL $65.30, up 2.88% today 5783
Most searched on Binance: DexCheck $AIDCK, Epic Chain $EPIC, Qubic $QUBIC 6113
$LAB $BTC #Trendingcoin320
Top trending coins today:
1. LAB - $13.84, up 27.6% in 24h, 211% this week
2. Humanity $H - $0.63, up 20.5% today, 150% this week
3. Ondo $ONDO - $0.42, up 18.6% today
4. Venice Token $VVV - $19.66, up 10.2% today
5. MemeCore $M - $3.30, up 1.5% today 9fc9
Big caps also moving:
BTC $62,803, up 2.69% today
BNB $599.20, up 2.68% today
SOL $65.30, up 2.88% today 5783
Most searched on Binance: DexCheck $AIDCK, Epic Chain $EPIC, Qubic $QUBIC 6113
$LAB $BTC #Trendingcoin320
1. LAB - $13.84, up 27.6% in 24h, 211% this week
2. Humanity $H - $0.63, up 20.5% today, 150% this week
3. Ondo $ONDO - $0.42, up 18.6% today
4. Venice Token $VVV - $19.66, up 10.2% today
5. MemeCore $M - $3.30, up 1.5% today 9fc9
Big caps also moving:
BTC $62,803, up 2.69% today
BNB $599.20, up 2.68% today
SOL $65.30, up 2.88% today 5783
Most searched on Binance: DexCheck $AIDCK, Epic Chain $EPIC, Qubic $QUBIC 6113
$LAB $BTC #Trendingcoin320
1
2
508

·
--
👀 If you had money to invest in ONE crypto coin today, which would you choose?
I'm researching before making my first purchase, and I'd love to hear from experienced crypto investors!
My shortlist:
₿ $BTC
💎 $ETH
{future}(SOLUSDT)
☀️ $SOL
🐸 $PEPE
Tell me why you'd choose it, what makes it worth researching, and what risk I should watch out for.
Let's hear some genuine opinions! ❤️👇
#BinanceSquare #CryptoMarket #bitcoin #Trendingcoin320 #CryptoCommunity
👀 If you had money to invest in ONE crypto coin today, which would you choose?
I'm researching before making my first purchase, and I'd love to hear from experienced crypto investors!
My shortlist:
₿ $BTC
💎 $ETH
☀️ $SOL
🐸 $PEPE
Tell me why you'd choose it, what makes it worth researching, and what risk I should watch out for.
Let's hear some genuine opinions! ❤️👇
#BinanceSquare #CryptoMarket #bitcoin #Trendingcoin320 #CryptoCommunity
I'm researching before making my first purchase, and I'd love to hear from experienced crypto investors!
My shortlist:
₿ $BTC
💎 $ETH
☀️ $SOL
🐸 $PEPE
Tell me why you'd choose it, what makes it worth researching, and what risk I should watch out for.
Let's hear some genuine opinions! ❤️👇
#BinanceSquare #CryptoMarket #bitcoin #Trendingcoin320 #CryptoCommunity
BTC
ETH
SOL
PEPE
3 day(s) left
1
3
641
·
--
Bullish
$XRP
{spot}(XRPUSDT)
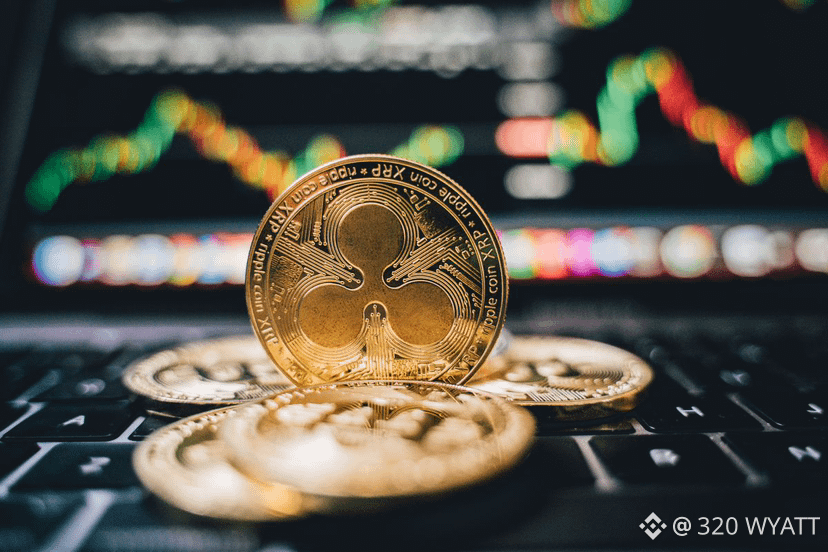
XRP is currently trading at $1.253, maintaining a bearish outlook as it stays below its key 50, 100, and 200-day EMAs. A low RSI of 37 and a negative MACD confirm that sellers still control the market momentum.
To reverse this downward trend and push toward $1.900, XRP must first break past initial resistance at $1.300 and clear the critical $1.540 level. Without immediate support, falling below $1.250 could trigger deeper losses before finding fresh buyer demand.
#xrp320 #mr320 #Trendingissue #writetoearn320 #Trendingcoin320
$XRP
XRP is currently trading at $1.253, maintaining a bearish outlook as it stays below its key 50, 100, and 200-day EMAs. A low RSI of 37 and a negative MACD confirm that sellers still control the market momentum.
To reverse this downward trend and push toward $1.900, XRP must first break past initial resistance at $1.300 and clear the critical $1.540 level. Without immediate support, falling below $1.250 could trigger deeper losses before finding fresh buyer demand.
#xrp320 #mr320 #Trendingissue #writetoearn320 #Trendingcoin320
XRP is currently trading at $1.253, maintaining a bearish outlook as it stays below its key 50, 100, and 200-day EMAs. A low RSI of 37 and a negative MACD confirm that sellers still control the market momentum.
To reverse this downward trend and push toward $1.900, XRP must first break past initial resistance at $1.300 and clear the critical $1.540 level. Without immediate support, falling below $1.250 could trigger deeper losses before finding fresh buyer demand.
#xrp320 #mr320 #Trendingissue #writetoearn320 #Trendingcoin320
563
·
--
Bullish
$ETH
{spot}(ETHUSDT)
Ethereum is currently trading at $2,295, maintaining a short-term bearish bias as it holds below key Exponential Moving Averages (EMAs). If the price attempts a recovery, it faces immediate overhead resistance at the 200-day EMA near $2,313, followed by the 100-day EMA at $2,353, and a broken ascending trendline pivot at $2,385. Higher horizontal and moving average barriers stand at $2,400 and $2,417 respectively, with a major cap further off at $2,770. On the downside, if the current pullback extends, the next critical structural support sits near $1,823, where buyers are expected to step in and defend the broader uptrend. This bearish outlook is supported by technical indicators, as the RSI remains weak at 37 and the MACD is negative, suggesting that any upward bounces will likely trigger selling pressure into nearby resistance.
#ETH320 #Trendingissue #Trendingcoin320 #mr320 #writetoearn320
$ETH
Ethereum is currently trading at $2,295, maintaining a short-term bearish bias as it holds below key Exponential Moving Averages (EMAs). If the price attempts a recovery, it faces immediate overhead resistance at the 200-day EMA near $2,313, followed by the 100-day EMA at $2,353, and a broken ascending trendline pivot at $2,385. Higher horizontal and moving average barriers stand at $2,400 and $2,417 respectively, with a major cap further off at $2,770. On the downside, if the current pullback extends, the next critical structural support sits near $1,823, where buyers are expected to step in and defend the broader uptrend. This bearish outlook is supported by technical indicators, as the RSI remains weak at 37 and the MACD is negative, suggesting that any upward bounces will likely trigger selling pressure into nearby resistance.
#ETH320 #Trendingissue #Trendingcoin320 #mr320 #writetoearn320
Ethereum is currently trading at $2,295, maintaining a short-term bearish bias as it holds below key Exponential Moving Averages (EMAs). If the price attempts a recovery, it faces immediate overhead resistance at the 200-day EMA near $2,313, followed by the 100-day EMA at $2,353, and a broken ascending trendline pivot at $2,385. Higher horizontal and moving average barriers stand at $2,400 and $2,417 respectively, with a major cap further off at $2,770. On the downside, if the current pullback extends, the next critical structural support sits near $1,823, where buyers are expected to step in and defend the broader uptrend. This bearish outlook is supported by technical indicators, as the RSI remains weak at 37 and the MACD is negative, suggesting that any upward bounces will likely trigger selling pressure into nearby resistance.
#ETH320 #Trendingissue #Trendingcoin320 #mr320 #writetoearn320

144
·
--
Bullish
$BTC
{spot}(BTCUSDT)
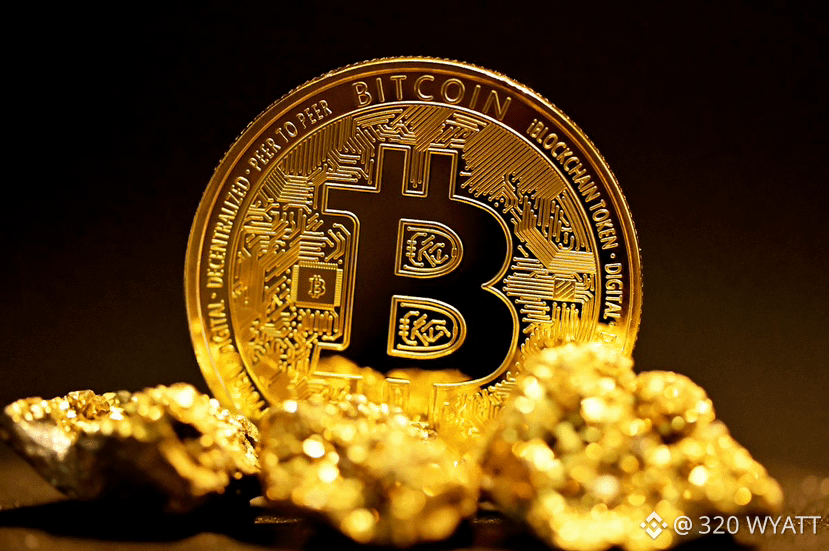
Bitcoin is currently consolidating at $78,462 as short-term momentum shifts bearish, wedged tightly between key Exponential Moving Averages (EMAs). While the 50-day EMA at $80,307 presents strong overhead resistance and caps bullish recovery, the 100-day and 200-day EMAs at $77,831 and $76,471 provide solid underlying support that keeps the macro structure intact. Momentum indicators are weak—with the RSI near 40 and a negative MACD—reflecting exhausted buying pressure rather than market panic.
Ultimately, Bitcoin remains locked in a range-bound phase until a decisive breakout occurs. Bulls must reclaim the 50-day EMA at $80,307 to target the next major resistance at $85,000. Conversely, immediate downside protection sits at $77,831, but a daily close below the critical $76,471 floor would break the macro structure and trigger a much deeper market correction.
#BTC320 #Trendingissue #Trendingcoin320 #writetoearn320 #mr320
$BTC
Bitcoin is currently consolidating at $78,462 as short-term momentum shifts bearish, wedged tightly between key Exponential Moving Averages (EMAs). While the 50-day EMA at $80,307 presents strong overhead resistance and caps bullish recovery, the 100-day and 200-day EMAs at $77,831 and $76,471 provide solid underlying support that keeps the macro structure intact. Momentum indicators are weak—with the RSI near 40 and a negative MACD—reflecting exhausted buying pressure rather than market panic.
Ultimately, Bitcoin remains locked in a range-bound phase until a decisive breakout occurs. Bulls must reclaim the 50-day EMA at $80,307 to target the next major resistance at $85,000. Conversely, immediate downside protection sits at $77,831, but a daily close below the critical $76,471 floor would break the macro structure and trigger a much deeper market correction.
#BTC320 #Trendingissue #Trendingcoin320 #writetoearn320 #mr320
Bitcoin is currently consolidating at $78,462 as short-term momentum shifts bearish, wedged tightly between key Exponential Moving Averages (EMAs). While the 50-day EMA at $80,307 presents strong overhead resistance and caps bullish recovery, the 100-day and 200-day EMAs at $77,831 and $76,471 provide solid underlying support that keeps the macro structure intact. Momentum indicators are weak—with the RSI near 40 and a negative MACD—reflecting exhausted buying pressure rather than market panic.
Ultimately, Bitcoin remains locked in a range-bound phase until a decisive breakout occurs. Bulls must reclaim the 50-day EMA at $80,307 to target the next major resistance at $85,000. Conversely, immediate downside protection sits at $77,831, but a daily close below the critical $76,471 floor would break the macro structure and trigger a much deeper market correction.
#BTC320 #Trendingissue #Trendingcoin320 #writetoearn320 #mr320
212
·
--
Bullish
$XRP
{spot}(XRPUSDT)
XRP is in a strong bullish trend but shows some short-term caution.
• Bullish Signals: The price is trading above key moving averages (hourly MA-20, MA-50, and daily MA-200), indicating strong upward momentum. Main indicators like MACD, ADX, RSI, and Stoch RSI all confirm firm buyer control and strong buying conditions.
• Support Level: The Ichimoku Kijun provides immediate support at $1.3184.
• Caution: Despite the overall bullish setup, XRP is currently trading near its session low with low volatility, suggesting a slow or cautious intraday outlook.
#xrp320 #Trendingissue #Trendingcoin320 #writetoearn320 #mr320
$XRP
XRP is in a strong bullish trend but shows some short-term caution.
• Bullish Signals: The price is trading above key moving averages (hourly MA-20, MA-50, and daily MA-200), indicating strong upward momentum. Main indicators like MACD, ADX, RSI, and Stoch RSI all confirm firm buyer control and strong buying conditions.
• Support Level: The Ichimoku Kijun provides immediate support at $1.3184.
• Caution: Despite the overall bullish setup, XRP is currently trading near its session low with low volatility, suggesting a slow or cautious intraday outlook.
#xrp320 #Trendingissue #Trendingcoin320 #writetoearn320 #mr320
XRP is in a strong bullish trend but shows some short-term caution.
• Bullish Signals: The price is trading above key moving averages (hourly MA-20, MA-50, and daily MA-200), indicating strong upward momentum. Main indicators like MACD, ADX, RSI, and Stoch RSI all confirm firm buyer control and strong buying conditions.
• Support Level: The Ichimoku Kijun provides immediate support at $1.3184.
• Caution: Despite the overall bullish setup, XRP is currently trading near its session low with low volatility, suggesting a slow or cautious intraday outlook.
#xrp320 #Trendingissue #Trendingcoin320 #writetoearn320 #mr320
1
284
·
--
Bullish
$NIL
🚀 Nillion ($NIL) x Binance Campaign is LIVE! 🚀
The era of Blind Computing is officially here, and the Nillion Network ($NIL) is taking over! Binance Launchpool has brought one of the most revolutionary privacy-focused data networks directly to the community.
Want to be part of the decentralized data privacy revolution? Now is your absolute best chance to get involved, share the project, and secure your spot in the ecosystem! 💎
How to support and enter the campaign:
• Like and Share this post to spread the word!
• Drop a comment with your thoughts on
$NIL and its multi-party computation (MPC) tech.
• Follow for more real-time project updates and reward events.
Don’t miss out on the next big phase of decentralized infrastructure (DePIN). Let's power the network together! 🌐🔥
#nillion #nillion320 #Trendingissue #Trendingcoin320 #mr320
{spot}(NILUSDT)
$NIL
🚀 Nillion ($NIL ) x Binance Campaign is LIVE! 🚀
The era of Blind Computing is officially here, and the Nillion Network ($NIL ) is taking over! Binance Launchpool has brought one of the most revolutionary privacy-focused data networks directly to the community.
Want to be part of the decentralized data privacy revolution? Now is your absolute best chance to get involved, share the project, and secure your spot in the ecosystem! 💎
How to support and enter the campaign:
• Like and Share this post to spread the word!
• Drop a comment with your thoughts on
$NIL and its multi-party computation (MPC) tech.
• Follow for more real-time project updates and reward events.
Don’t miss out on the next big phase of decentralized infrastructure (DePIN). Let's power the network together! 🌐🔥
#nillion #nillion320 #Trendingissue #Trendingcoin320 #mr320
🚀 Nillion ($NIL ) x Binance Campaign is LIVE! 🚀
The era of Blind Computing is officially here, and the Nillion Network ($NIL ) is taking over! Binance Launchpool has brought one of the most revolutionary privacy-focused data networks directly to the community.
Want to be part of the decentralized data privacy revolution? Now is your absolute best chance to get involved, share the project, and secure your spot in the ecosystem! 💎
How to support and enter the campaign:
• Like and Share this post to spread the word!
• Drop a comment with your thoughts on
$NIL and its multi-party computation (MPC) tech.
• Follow for more real-time project updates and reward events.
Don’t miss out on the next big phase of decentralized infrastructure (DePIN). Let's power the network together! 🌐🔥
#nillion #nillion320 #Trendingissue #Trendingcoin320 #mr320

1
374
·
--
Bearish
$XRP
{spot}(XRPUSDT)
XRP experienced a sharp, short-term liquidity flush on October 14, plunging 2.16% within a single hour from $1.36 to $1.33. This swift depreciation extended its 24-hour losses to 2.92%, triggering a wave of long capitulation.
#xrp320 #Trendingissue #Trendingcoin320 #mr320 #writetoearn320
$XRP
XRP experienced a sharp, short-term liquidity flush on October 14, plunging 2.16% within a single hour from $1.36 to $1.33. This swift depreciation extended its 24-hour losses to 2.92%, triggering a wave of long capitulation.
#xrp320 #Trendingissue #Trendingcoin320 #mr320 #writetoearn320
XRP experienced a sharp, short-term liquidity flush on October 14, plunging 2.16% within a single hour from $1.36 to $1.33. This swift depreciation extended its 24-hour losses to 2.92%, triggering a wave of long capitulation.
#xrp320 #Trendingissue #Trendingcoin320 #mr320 #writetoearn320
1
278
·
--
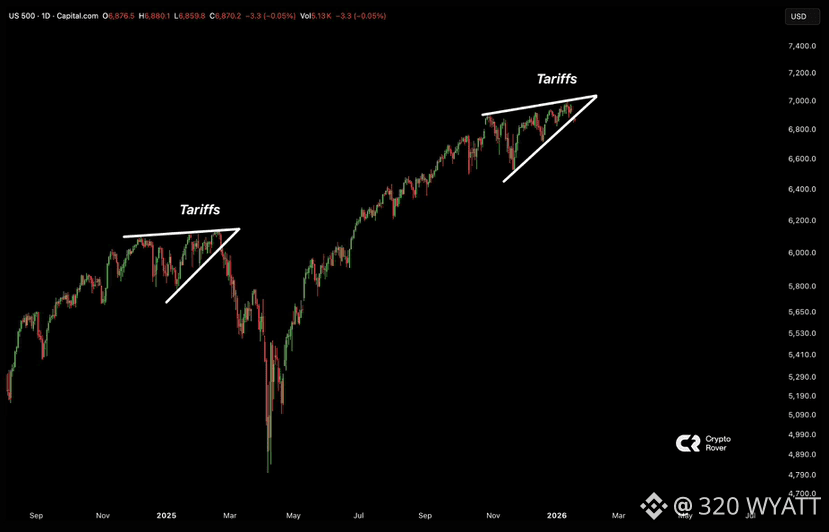
🚨🚨The US stock market is setting up for another tariffs CRASH.
Eyes on the US market open today.
This would be a disaster for Bitcoin.
#Trendingissue #mr320 #Trendingcoin320 #Binance320 #WriteToEarn2026
🚨🚨The US stock market is setting up for another tariffs CRASH.
Eyes on the US market open today.
This would be a disaster for Bitcoin.
#Trendingissue #mr320 #Trendingcoin320 #Binance320 #WriteToEarn2026
Eyes on the US market open today.
This would be a disaster for Bitcoin.
#Trendingissue #mr320 #Trendingcoin320 #Binance320 #WriteToEarn2026
1
2
1.6k
·
--
Bullish
Gold Price (XAU/USD) jumps to near $4,600 during the early Asian session on Tuesday. The precious metal extends the rally after retreating from a fresh record high of $4,630 in the previous session amid uncertainty and geopolitical risks. The US Consumer Price Index (CPI) inflation data for December will take center stage later on Tuesday.
#gold320 #Trendingissue #mr320 #Trendingcoin320 #Binance320 $BTC
{spot}(BTCUSDT)
Gold Price (XAU/USD) jumps to near $4,600 during the early Asian session on Tuesday. The precious metal extends the rally after retreating from a fresh record high of $4,630 in the previous session amid uncertainty and geopolitical risks. The US Consumer Price Index (CPI) inflation data for December will take center stage later on Tuesday.
#gold320 #Trendingissue #mr320 #Trendingcoin320 #Binance320 $BTC
#gold320 #Trendingissue #mr320 #Trendingcoin320 #Binance320 $BTC

4
1.1k
·
--
"Cheers to 9000 of you! Thrilled with the support and excited for what's next. ❤️
#mr320 #Trendingissue #mr320 #Trendingcoin320 #WriteToEarn2026
"Cheers to 9000 of you! Thrilled with the support and excited for what's next. ❤️
#mr320 #Trendingissue #mr320 #Trendingcoin320 #WriteToEarn2026
#mr320 #Trendingissue #mr320 #Trendingcoin320 #WriteToEarn2026

1
1
151
·
--
Bullish
$XRP
{spot}(XRPUSDT)
🚨Long-term momentum faces near-term oscillator-driven uncertainty🚨
On the technical front, XRP is holding above the MA-50 on the hourly chart but trades below the MA-20, with price levels showing firm support from the MA-200 on the daily timeframe. Ichimoku Kijun resistance is found at $1.5745, establishing a critical barrier on the upside. Momentum indicators show a divided picture: MACD and ADX continue to favor further gains, while RSI sits at a neutral 51. Stochastic RSI is deeply oversold, CCI points to increased selling, and Bull/Bear Power reflects intraday seller dominance, highlighting ongoing uncertainty between strong longer-term momentum and near-term bearish oscillator signals.
#xrp320 #Trendingcoin320 #Trendingissue #writetoearn320 #mr320
$XRP
🚨Long-term momentum faces near-term oscillator-driven uncertainty🚨
On the technical front, XRP is holding above the MA-50 on the hourly chart but trades below the MA-20, with price levels showing firm support from the MA-200 on the daily timeframe. Ichimoku Kijun resistance is found at $1.5745, establishing a critical barrier on the upside. Momentum indicators show a divided picture: MACD and ADX continue to favor further gains, while RSI sits at a neutral 51. Stochastic RSI is deeply oversold, CCI points to increased selling, and Bull/Bear Power reflects intraday seller dominance, highlighting ongoing uncertainty between strong longer-term momentum and near-term bearish oscillator signals.
#xrp320 #Trendingcoin320 #Trendingissue #writetoearn320 #mr320
🚨Long-term momentum faces near-term oscillator-driven uncertainty🚨
On the technical front, XRP is holding above the MA-50 on the hourly chart but trades below the MA-20, with price levels showing firm support from the MA-200 on the daily timeframe. Ichimoku Kijun resistance is found at $1.5745, establishing a critical barrier on the upside. Momentum indicators show a divided picture: MACD and ADX continue to favor further gains, while RSI sits at a neutral 51. Stochastic RSI is deeply oversold, CCI points to increased selling, and Bull/Bear Power reflects intraday seller dominance, highlighting ongoing uncertainty between strong longer-term momentum and near-term bearish oscillator signals.
#xrp320 #Trendingcoin320 #Trendingissue #writetoearn320 #mr320
34
·
--
Bullish
$SOL
{spot}(SOLUSDT)
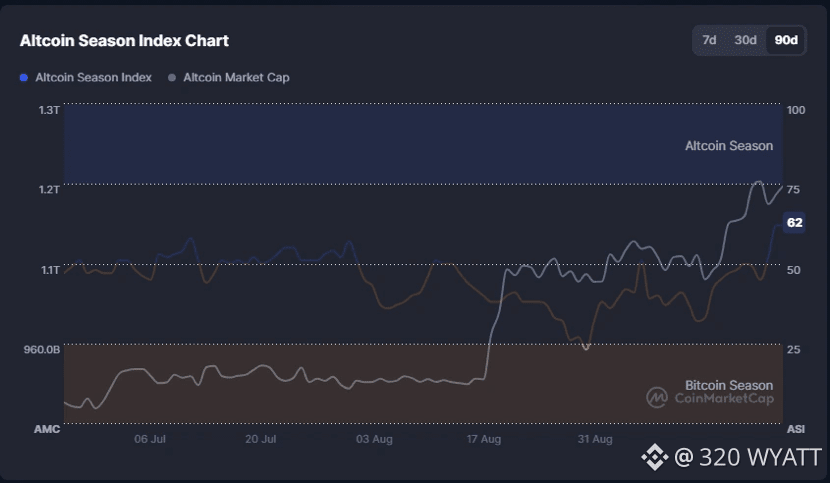
At a current price of $122.01 Solana (SOL) is up 3.11% on the day and 26.38% this last month. The rally is the result of persistent institutional endorsement and rising on-chain activity. More importantly, it has been brought on by a market-wide rotation into altcoins, with the Altcoin Season Index steadily climbing over the past month.
#sol320 #mr320 #Trendingissue #Trendingcoin320 #solana
$SOL
At a current price of $122.01 Solana (SOL) is up 3.11% on the day and 26.38% this last month. The rally is the result of persistent institutional endorsement and rising on-chain activity. More importantly, it has been brought on by a market-wide rotation into altcoins, with the Altcoin Season Index steadily climbing over the past month.
#sol320 #mr320 #Trendingissue #Trendingcoin320 #solana
At a current price of $122.01 Solana (SOL) is up 3.11% on the day and 26.38% this last month. The rally is the result of persistent institutional endorsement and rising on-chain activity. More importantly, it has been brought on by a market-wide rotation into altcoins, with the Altcoin Season Index steadily climbing over the past month.
#sol320 #mr320 #Trendingissue #Trendingcoin320 #solana
68
·
--
Bullish
$XRP
{spot}(XRPUSDT)
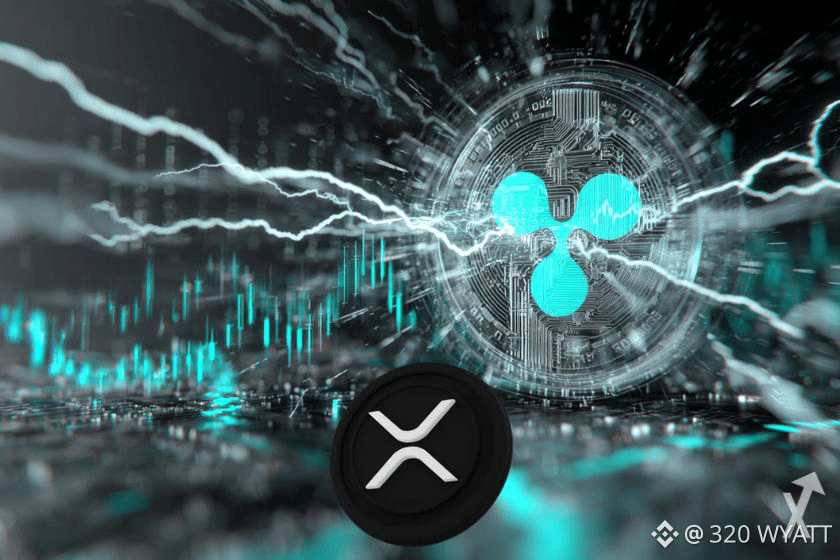
🚨What XRP Would Need to Do to Reach $30🚨
The $30 target is not Egrag's next stop for XRP. It sits at the far end of a long-term bullish roadmap and would require a rise of roughly 2,620%, or more than 27 times, from the chart's $1.47 region.
First, XRP would need to avoid a loss of $1.47 and then decisively break above $1.65, near its 33-month moving average.
From there, Egrag's chart maps several major hurdles: $3 and $5.50 appear before the bigger targets of $7.50, $13, and $30.
#xrp320 #mr320 #Trendingissue #WriteToEarn2026 #Trendingcoin320
$XRP
🚨What XRP Would Need to Do to Reach $30🚨
The $30 target is not Egrag's next stop for XRP. It sits at the far end of a long-term bullish roadmap and would require a rise of roughly 2,620%, or more than 27 times, from the chart's $1.47 region.
First, XRP would need to avoid a loss of $1.47 and then decisively break above $1.65, near its 33-month moving average.
From there, Egrag's chart maps several major hurdles: $3 and $5.50 appear before the bigger targets of $7.50, $13, and $30.
#xrp320 #mr320 #Trendingissue #WriteToEarn2026 #Trendingcoin320
🚨What XRP Would Need to Do to Reach $30🚨
The $30 target is not Egrag's next stop for XRP. It sits at the far end of a long-term bullish roadmap and would require a rise of roughly 2,620%, or more than 27 times, from the chart's $1.47 region.
First, XRP would need to avoid a loss of $1.47 and then decisively break above $1.65, near its 33-month moving average.
From there, Egrag's chart maps several major hurdles: $3 and $5.50 appear before the bigger targets of $7.50, $13, and $30.
#xrp320 #mr320 #Trendingissue #WriteToEarn2026 #Trendingcoin320
68
·
--
Bullish
$BTC
{spot}(BTCUSDT)
🚨Whale Activity Shows Heavy Buying and Selling🚨
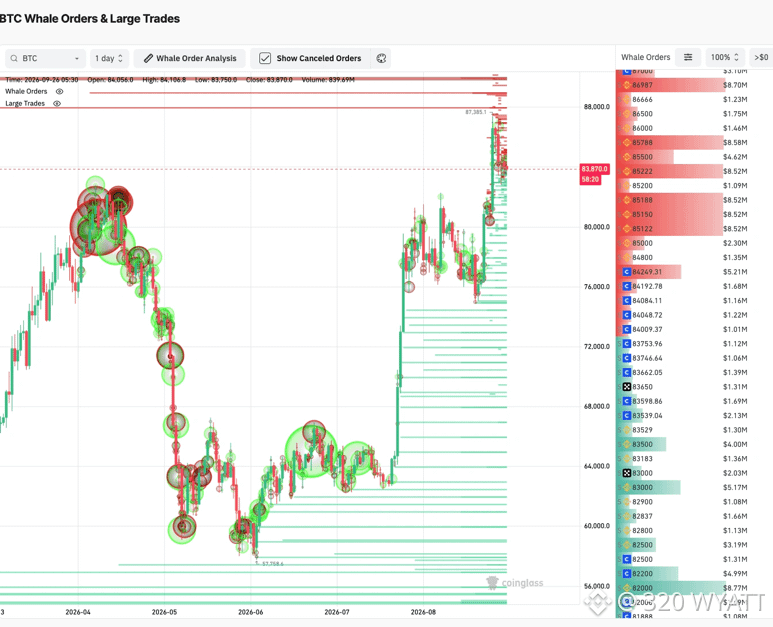
BTC is trading around $83,970, after recently pushing toward the $87,385 area. The important point is that whales are placing large orders on both sides of the market, creating a clear battle zone.
Between $85,122 and $87,000, large sell orders totaling around $37 million are placed. This creates a strong sell wall that could make it harder for Bitcoin to move above the $85K – $87K range.
At the same time, around $21.1 million in buy orders are placed between $82,000 and $83,500.
This makes the $82K–$83K area an important support zone, while $85K – $87K remains a major selling area.
#BTC320 #Trendingissue #writetoearn320 #Trendingcoin320 #mr320
$BTC
🚨Whale Activity Shows Heavy Buying and Selling🚨
BTC is trading around $83,970, after recently pushing toward the $87,385 area. The important point is that whales are placing large orders on both sides of the market, creating a clear battle zone.
Between $85,122 and $87,000, large sell orders totaling around $37 million are placed. This creates a strong sell wall that could make it harder for Bitcoin to move above the $85K – $87K range.
At the same time, around $21.1 million in buy orders are placed between $82,000 and $83,500.
This makes the $82K–$83K area an important support zone, while $85K – $87K remains a major selling area.
#BTC320 #Trendingissue #writetoearn320 #Trendingcoin320 #mr320
🚨Whale Activity Shows Heavy Buying and Selling🚨
BTC is trading around $83,970, after recently pushing toward the $87,385 area. The important point is that whales are placing large orders on both sides of the market, creating a clear battle zone.
Between $85,122 and $87,000, large sell orders totaling around $37 million are placed. This creates a strong sell wall that could make it harder for Bitcoin to move above the $85K – $87K range.
At the same time, around $21.1 million in buy orders are placed between $82,000 and $83,500.
This makes the $82K–$83K area an important support zone, while $85K – $87K remains a major selling area.
#BTC320 #Trendingissue #writetoearn320 #Trendingcoin320 #mr320
28
·
--
Bullish
$BTC
{spot}(BTCUSDT)
Crypto is about to MELT FACES.
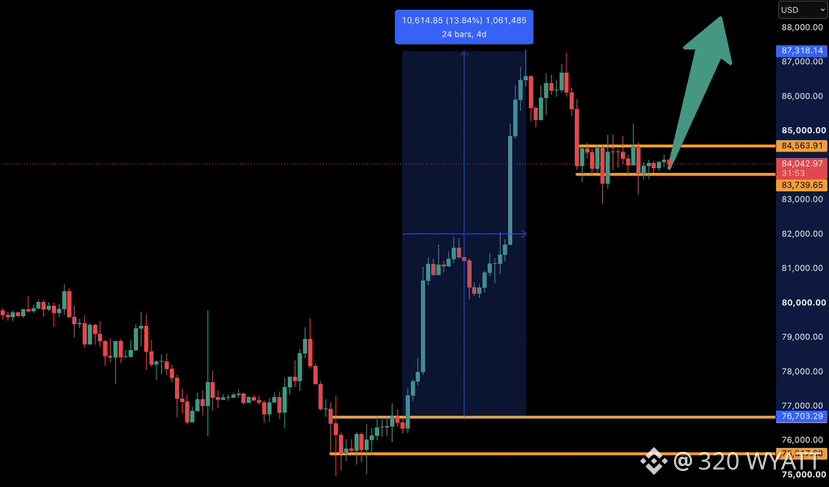
The last time $BTC stayed in a multi-day $1000 range we pumped 15%.
They just keep repeating the patterns and low IQ people fall for it.
Everyone who knows exactly what's about to happen is buying more and staying patient.
DO NOT let them shake you out before the God candles happen.
#BTC320 #Trendingcoin320 #Trendingissue #mr320 #btc
$BTC
Crypto is about to MELT FACES.
The last time $BTC stayed in a multi-day $1000 range we pumped 15%.
They just keep repeating the patterns and low IQ people fall for it.
Everyone who knows exactly what's about to happen is buying more and staying patient.
DO NOT let them shake you out before the God candles happen.
#BTC320 #Trendingcoin320 #Trendingissue #mr320 #btc
Crypto is about to MELT FACES.
The last time $BTC stayed in a multi-day $1000 range we pumped 15%.
They just keep repeating the patterns and low IQ people fall for it.
Everyone who knows exactly what's about to happen is buying more and staying patient.
DO NOT let them shake you out before the God candles happen.
#BTC320 #Trendingcoin320 #Trendingissue #mr320 #btc
48
·
--
Bullish
$XRP
{spot}(XRPUSDT)
A symmetric triangle occurs when each rally peaks lower than the previous one and each decline bottoms higher, creating two trendlines that squeeze the price toward a point. The upper trendline acts as resistance, where sellers halt rallies, while the lower line serves as support, where buyers prevent price drops. A breakout occurs when price moves past one of these lines, and a retest follows, testing whether old resistance now serves as support.
XRP’s triangle formation began at its January 2018 peak of $3.31. The rally in April 2021 peaked at $1.96, hitting the upper trendline before XRP broke above it in November 2024, still below $1. After that breakout, XRP soared to a high of $3.65 in July 2025. However, a bear market that started in August 2025 pushed the price down to $0.98 by August 2026, where it touched the old trendline and bounced back.
This sequence of breakout, subsequent rally, pullback to the line, and recovery is the classic pattern. The move up to $1.60 on September 22 completed this sequence. The slight dip to $1.55 raises concerns, as closing back inside the triangle would suggest a false breakout and could trap late buyers
#xrp320 #mr320 #Trendingissue #Trendingcoin320 #writetoearn320
$XRP
A symmetric triangle occurs when each rally peaks lower than the previous one and each decline bottoms higher, creating two trendlines that squeeze the price toward a point. The upper trendline acts as resistance, where sellers halt rallies, while the lower line serves as support, where buyers prevent price drops. A breakout occurs when price moves past one of these lines, and a retest follows, testing whether old resistance now serves as support.
XRP’s triangle formation began at its January 2018 peak of $3.31. The rally in April 2021 peaked at $1.96, hitting the upper trendline before XRP broke above it in November 2024, still below $1. After that breakout, XRP soared to a high of $3.65 in July 2025. However, a bear market that started in August 2025 pushed the price down to $0.98 by August 2026, where it touched the old trendline and bounced back.
This sequence of breakout, subsequent rally, pullback to the line, and recovery is the classic pattern. The move up to $1.60 on September 22 completed this sequence. The slight dip to $1.55 raises concerns, as closing back inside the triangle would suggest a false breakout and could trap late buyers
#xrp320 #mr320 #Trendingissue #Trendingcoin320 #writetoearn320
A symmetric triangle occurs when each rally peaks lower than the previous one and each decline bottoms higher, creating two trendlines that squeeze the price toward a point. The upper trendline acts as resistance, where sellers halt rallies, while the lower line serves as support, where buyers prevent price drops. A breakout occurs when price moves past one of these lines, and a retest follows, testing whether old resistance now serves as support.
XRP’s triangle formation began at its January 2018 peak of $3.31. The rally in April 2021 peaked at $1.96, hitting the upper trendline before XRP broke above it in November 2024, still below $1. After that breakout, XRP soared to a high of $3.65 in July 2025. However, a bear market that started in August 2025 pushed the price down to $0.98 by August 2026, where it touched the old trendline and bounced back.
This sequence of breakout, subsequent rally, pullback to the line, and recovery is the classic pattern. The move up to $1.60 on September 22 completed this sequence. The slight dip to $1.55 raises concerns, as closing back inside the triangle would suggest a false breakout and could trap late buyers
#xrp320 #mr320 #Trendingissue #Trendingcoin320 #writetoearn320
1
119
·
--
Bullish
$ADA
{spot}(ADAUSDT)
ADA traded at $0.25 on September 23, up 8.67% in 24 hours, per CoinDesk. The x402 news pushed it past its 200 day average near $0.239 for the first time this year. Support sits at $0.218, per CoinGape. In the near term, a close above $0.258 could lead to $0.288 and then $0.313 if buyers hold.
For 2026 as a whole, ADA needs to break above $0.30 with volume to signal a lasting turn. The gains are real, but ADA's $9 billion market cap means a 2x from here needs $9 billion in new money. That math is why smaller entries matter.
#Ada320 #mr320 #Trendingissue #WriteToEarn2026 #Trendingcoin320
$ADA
ADA traded at $0.25 on September 23, up 8.67% in 24 hours, per CoinDesk. The x402 news pushed it past its 200 day average near $0.239 for the first time this year. Support sits at $0.218, per CoinGape. In the near term, a close above $0.258 could lead to $0.288 and then $0.313 if buyers hold.
For 2026 as a whole, ADA needs to break above $0.30 with volume to signal a lasting turn. The gains are real, but ADA's $9 billion market cap means a 2x from here needs $9 billion in new money. That math is why smaller entries matter.
#Ada320 #mr320 #Trendingissue #WriteToEarn2026 #Trendingcoin320
ADA traded at $0.25 on September 23, up 8.67% in 24 hours, per CoinDesk. The x402 news pushed it past its 200 day average near $0.239 for the first time this year. Support sits at $0.218, per CoinGape. In the near term, a close above $0.258 could lead to $0.288 and then $0.313 if buyers hold.
For 2026 as a whole, ADA needs to break above $0.30 with volume to signal a lasting turn. The gains are real, but ADA's $9 billion market cap means a 2x from here needs $9 billion in new money. That math is why smaller entries matter.
#Ada320 #mr320 #Trendingissue #WriteToEarn2026 #Trendingcoin320

194
·
--
Bullish
$BTC
{spot}(BTCUSDT)
Bitcoin BTC price is currently trading at $85,126.8, sitting just below the swing high of $87,396 and well above the 200-day moving average at $70,703.56. The Bitcoin BTC price analysis and chart reveal a market that has recovered aggressively from the swing low of $57,808.4, and we are now testing the upper portion of the intermediate range. The distance from the swing high suggests there is still room for upside expansion, and the overall market structure remains intact.
The weight of evidence across our 10 indicators points to a bullish lean with a cumulative score of 7.3 out of 10. Bitcoin price is aligned above all four major moving averages, the Bollinger Bands are expanding in an uptrend, and the MACD momentum is building strength. Bitcoin crypto price action is being confirmed by rising on-balance volume and a double bottom chart pattern that suggests accumulation. The dominant narrative is one of continuation higher, though some intermediate caution is warranted given recent consolidation.
#BTC320 #Trendingissue #Trendingcoin320 #WriteToEarn2026 #mr320
$BTC
Bitcoin BTC price is currently trading at $85,126.8, sitting just below the swing high of $87,396 and well above the 200-day moving average at $70,703.56. The Bitcoin BTC price analysis and chart reveal a market that has recovered aggressively from the swing low of $57,808.4, and we are now testing the upper portion of the intermediate range. The distance from the swing high suggests there is still room for upside expansion, and the overall market structure remains intact.
The weight of evidence across our 10 indicators points to a bullish lean with a cumulative score of 7.3 out of 10. Bitcoin price is aligned above all four major moving averages, the Bollinger Bands are expanding in an uptrend, and the MACD momentum is building strength. Bitcoin crypto price action is being confirmed by rising on-balance volume and a double bottom chart pattern that suggests accumulation. The dominant narrative is one of continuation higher, though some intermediate caution is warranted given recent consolidation.
#BTC320 #Trendingissue #Trendingcoin320 #WriteToEarn2026 #mr320
Bitcoin BTC price is currently trading at $85,126.8, sitting just below the swing high of $87,396 and well above the 200-day moving average at $70,703.56. The Bitcoin BTC price analysis and chart reveal a market that has recovered aggressively from the swing low of $57,808.4, and we are now testing the upper portion of the intermediate range. The distance from the swing high suggests there is still room for upside expansion, and the overall market structure remains intact.
The weight of evidence across our 10 indicators points to a bullish lean with a cumulative score of 7.3 out of 10. Bitcoin price is aligned above all four major moving averages, the Bollinger Bands are expanding in an uptrend, and the MACD momentum is building strength. Bitcoin crypto price action is being confirmed by rising on-balance volume and a double bottom chart pattern that suggests accumulation. The dominant narrative is one of continuation higher, though some intermediate caution is warranted given recent consolidation.
#BTC320 #Trendingissue #Trendingcoin320 #WriteToEarn2026 #mr320

100
·
--
Bullish
$XRP
{spot}(XRPUSDT)
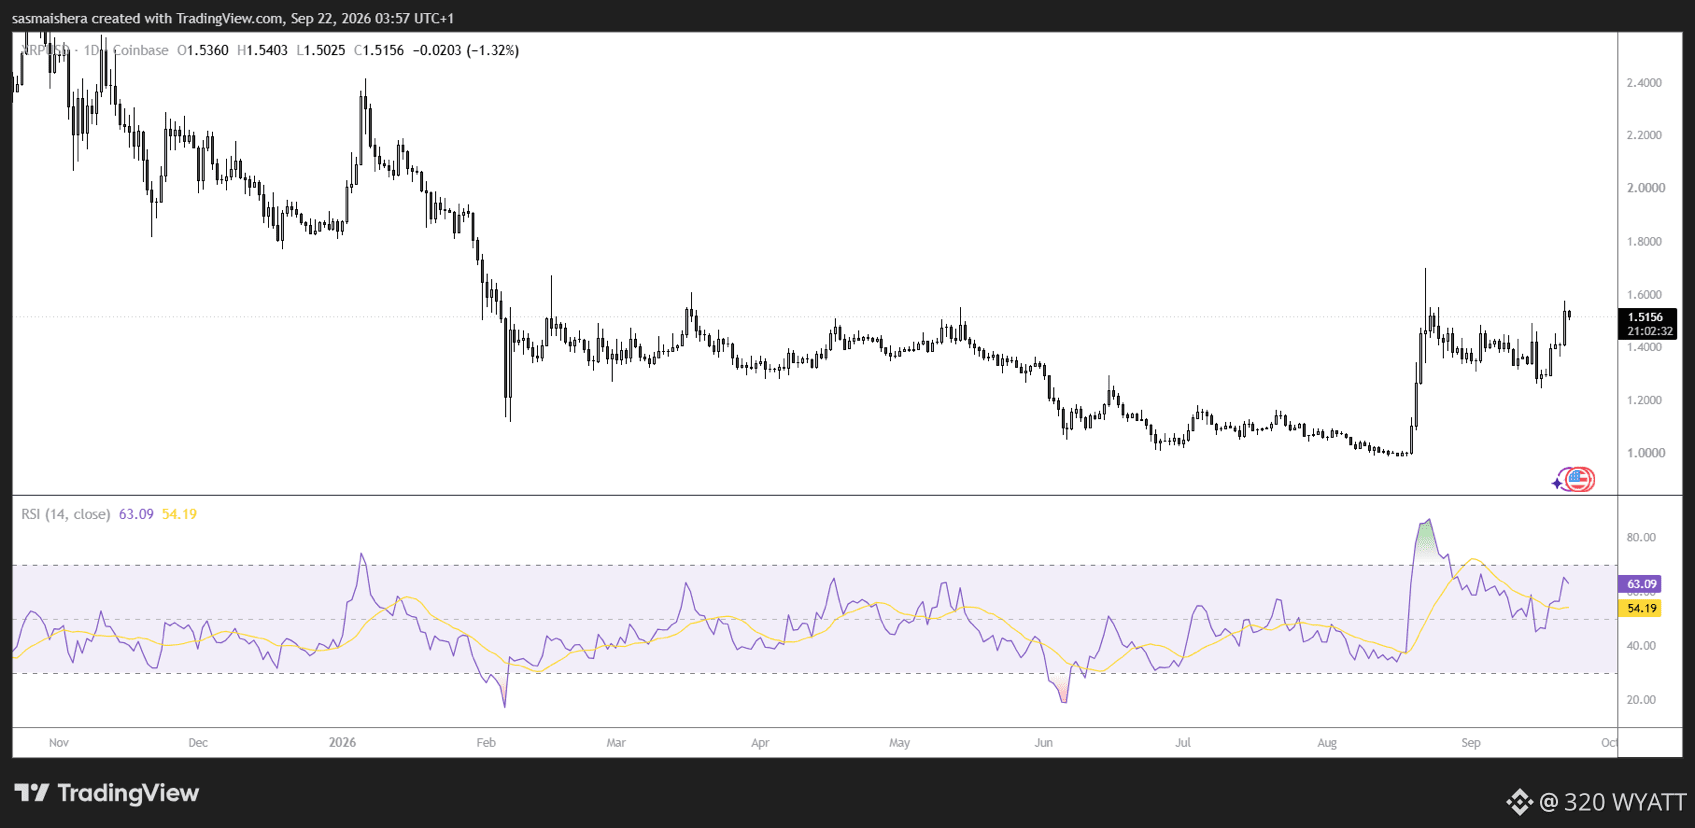
🚨XRP faces $1.50 breakout test🚨
The technical analysis in the report identifies a breakout from a descending flag pattern on XRP’s daily chart.
The next test is $1.50: a sustained move above that level would strengthen the case for a rise toward $1.80.
The analyst also projects a medium-term target of $2.10 based on the pattern’s measured move, implying roughly 41% upside from the price used in that forecast.
Those targets remain conditional. After a sharp rally and substantial short liquidations, XRP will need continued buying interest to hold its breakout and advance through $1.50.
#xrp320 #mr320 #Trendingissue #WriteToEarn2026 #Trendingcoin320
$XRP
🚨XRP faces $1.50 breakout test🚨
The technical analysis in the report identifies a breakout from a descending flag pattern on XRP’s daily chart.
The next test is $1.50: a sustained move above that level would strengthen the case for a rise toward $1.80.
The analyst also projects a medium-term target of $2.10 based on the pattern’s measured move, implying roughly 41% upside from the price used in that forecast.
Those targets remain conditional. After a sharp rally and substantial short liquidations, XRP will need continued buying interest to hold its breakout and advance through $1.50.
#xrp320 #mr320 #Trendingissue #WriteToEarn2026 #Trendingcoin320
🚨XRP faces $1.50 breakout test🚨
The technical analysis in the report identifies a breakout from a descending flag pattern on XRP’s daily chart.
The next test is $1.50: a sustained move above that level would strengthen the case for a rise toward $1.80.
The analyst also projects a medium-term target of $2.10 based on the pattern’s measured move, implying roughly 41% upside from the price used in that forecast.
Those targets remain conditional. After a sharp rally and substantial short liquidations, XRP will need continued buying interest to hold its breakout and advance through $1.50.
#xrp320 #mr320 #Trendingissue #WriteToEarn2026 #Trendingcoin320
1
39
Log in to explore more content
Join global crypto users on Binance Square
⚡️ Get latest and useful information about crypto.
💬 Trusted by the world’s largest crypto exchange.
👍 Discover real insights from verified creators.
Email / Phone number
Trending Topics
1
#CryptoSelloffTriggersMultipleWhaleLiquidations
9,586 views
204 Discussing
2
#USSpotXRPETFsSeeLargestWeeklyOutflowIn8Months
49,897 views
587 Discussing
3
#WillFOMCMinutesReinforceRateHikeExpectations?
2,106 views
66 Discussing
4
#BitcoinActiveSupplyInProfitDropsBelow45%
111,406 views
996 Discussing
5
#TONStrategyReports$23.97MQ3NetLoss
13,090 views
71 Discussing
6
#KavaSaysAbnormalActivityLimitedToKavaLend
72,093 views
554 Discussing
7
#WORPTLetsTouristsConvertCryptoToThaiBaht
15,112 views
169 Discussing
8
#WhoWillSucceedJensenHuangatNvidia?
229,606 views
1,877 Discussing
9
#WhatWillDriveCryptoandStocks’NextRebound?
674,558 views
3,693 Discussing
10
#TradFiForBeginners
767,537 views
4,664 Discussing