Binance Square
#btc320

btc320

30,675 views
247 Discussing
320 WYATT
·
--
Bullish
·
--
Bullish
Verified
$BTC {spot}(BTCUSDT) Bitcoin ETF demand is still looking strong. BlackRock and the other spot Bitcoin ETF issuers just recorded a combined $714.75M in net inflows. Institutional demand is clearly picking up again, and with Bitcoin holding around $86K, these flows are becoming increasingly important. I’m watching to see if this continues. #BTC320 #Trendingissue #writetoearn2026 #Trendingcoin320 #mr320
$BTC
Bitcoin ETF demand is still looking strong.

BlackRock and the other spot Bitcoin ETF issuers just recorded a combined $714.75M in net inflows.

Institutional demand is clearly picking up again, and with Bitcoin holding around $86K, these flows are becoming increasingly important.

I’m watching to see if this continues.

#BTC320 #Trendingissue #writetoearn2026 #Trendingcoin320 #mr320
·
--
Bullish
$BTC {spot}(BTCUSDT) Bitcoin briefly moved above $85,000 as more than $750 million in crypto positions were liquidated over 24 hours, with most coming from shorts. The move lifted BTC to an eight month high and extended a recovery that began near $75,000 only days earlier. Institutional demand is also improving. US spot Bitcoin ETFs pulled in $433 million on September 18, their strongest daily inflow since September 3, with Fidelity and BlackRock leading the buying. The technical picture has strengthened too. A daily bull flag breakout has produced a technical target near $98,000, placing the psychological $100,000 mark directly above the current breakout path. #BTC320 #Trendingcoin320 #WriteToEarn2026 #mr320 #Trendingissue
$BTC
Bitcoin briefly moved above $85,000 as more than $750 million in crypto positions were liquidated over 24 hours, with most coming from shorts. The move lifted BTC to an eight month high and extended a recovery that began near $75,000 only days earlier.
Institutional demand is also improving. US spot Bitcoin ETFs pulled in $433 million on September 18, their strongest daily inflow since September 3, with Fidelity and BlackRock leading the buying. The technical picture has strengthened too. A daily bull flag breakout has produced a technical target near $98,000, placing the psychological $100,000 mark directly above the current breakout path.

#BTC320 #Trendingcoin320 #WriteToEarn2026 #mr320 #Trendingissue
·
--
Bullish
$BTC {spot}(BTCUSDT) On the shorter timeframe, Bitcoin has completed a smaller five-part rally starting from its September 15 low. The key level to watch is $80,120. As long as that holds, the short-term uptrend stays intact. A confirmed break below it would be the first real sign Bitcoin has topped out for now. Support also sits between $80,566 and $82,985, with $82,800 a level Bitcoin may retest soon. If it holds that zone and pushes higher again, $88,900 becomes the next realistic target. #BTC320 #mr320 #Trendingcoin320 #Trendingissue #BTC
$BTC
On the shorter timeframe, Bitcoin has completed a smaller five-part rally starting from its September 15 low. The key level to watch is $80,120. As long as that holds, the short-term uptrend stays intact. A confirmed break below it would be the first real sign Bitcoin has topped out for now.

Support also sits between $80,566 and $82,985, with $82,800 a level Bitcoin may retest soon. If it holds that zone and pushes higher again, $88,900 becomes the next realistic target.

#BTC320 #mr320 #Trendingcoin320 #Trendingissue #BTC
·
--
Bullish
$BTC {spot}(BTCUSDT) The price of bitcoin this morning, Wednesday, September 23, 2026, was flat compared to Tuesday's opening price. Here's a look at how the opening bitcoin price has changed versus last week, month, and year: One week ago: +14% One month ago: +11.8% One year ago: -23.6% #BTC320 #mr320 #Trendingissue #Trendingcoin320 #WriteToEarn2026
$BTC
The price of bitcoin this morning, Wednesday, September 23, 2026, was flat compared to Tuesday's opening price. Here's a look at how the opening bitcoin price has changed versus last week, month, and year:

One week ago: +14%

One month ago: +11.8%

One year ago: -23.6%

#BTC320 #mr320 #Trendingissue #Trendingcoin320 #WriteToEarn2026
·
--
Bearish
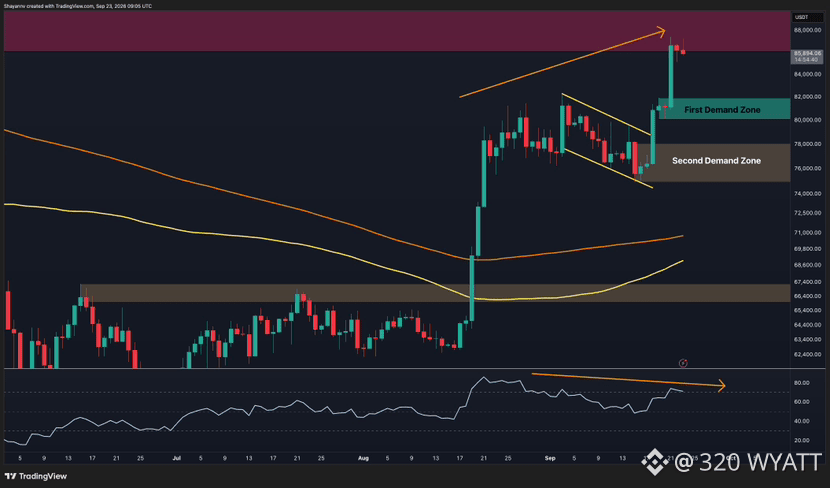
$BTC {spot}(BTCUSDT) Bitcoin has pushed into a major overhead supply region, trading around $86K and entering the $86K-$89K resistance zone within the broader crypto market. Momentum remains constructive after breaking out of the prior corrective structure, but the reaction here will determine whether the rally extends into another bullish leg or pauses for a deeper retest. #BTC320 #btc #Trendingcoin320 #BitcoinBreaksAboveMayHighNears$86K #mr320
$BTC
Bitcoin has pushed into a major overhead supply region, trading around $86K and entering the $86K-$89K resistance zone within the broader crypto market. Momentum remains constructive after breaking out of the prior corrective structure, but the reaction here will determine whether the rally extends into another bullish leg or pauses for a deeper retest.

#BTC320 #btc #Trendingcoin320 #BitcoinBreaksAboveMayHighNears$86K #mr320
AngelOfCrypto_-:
nice
·
--
Bullish
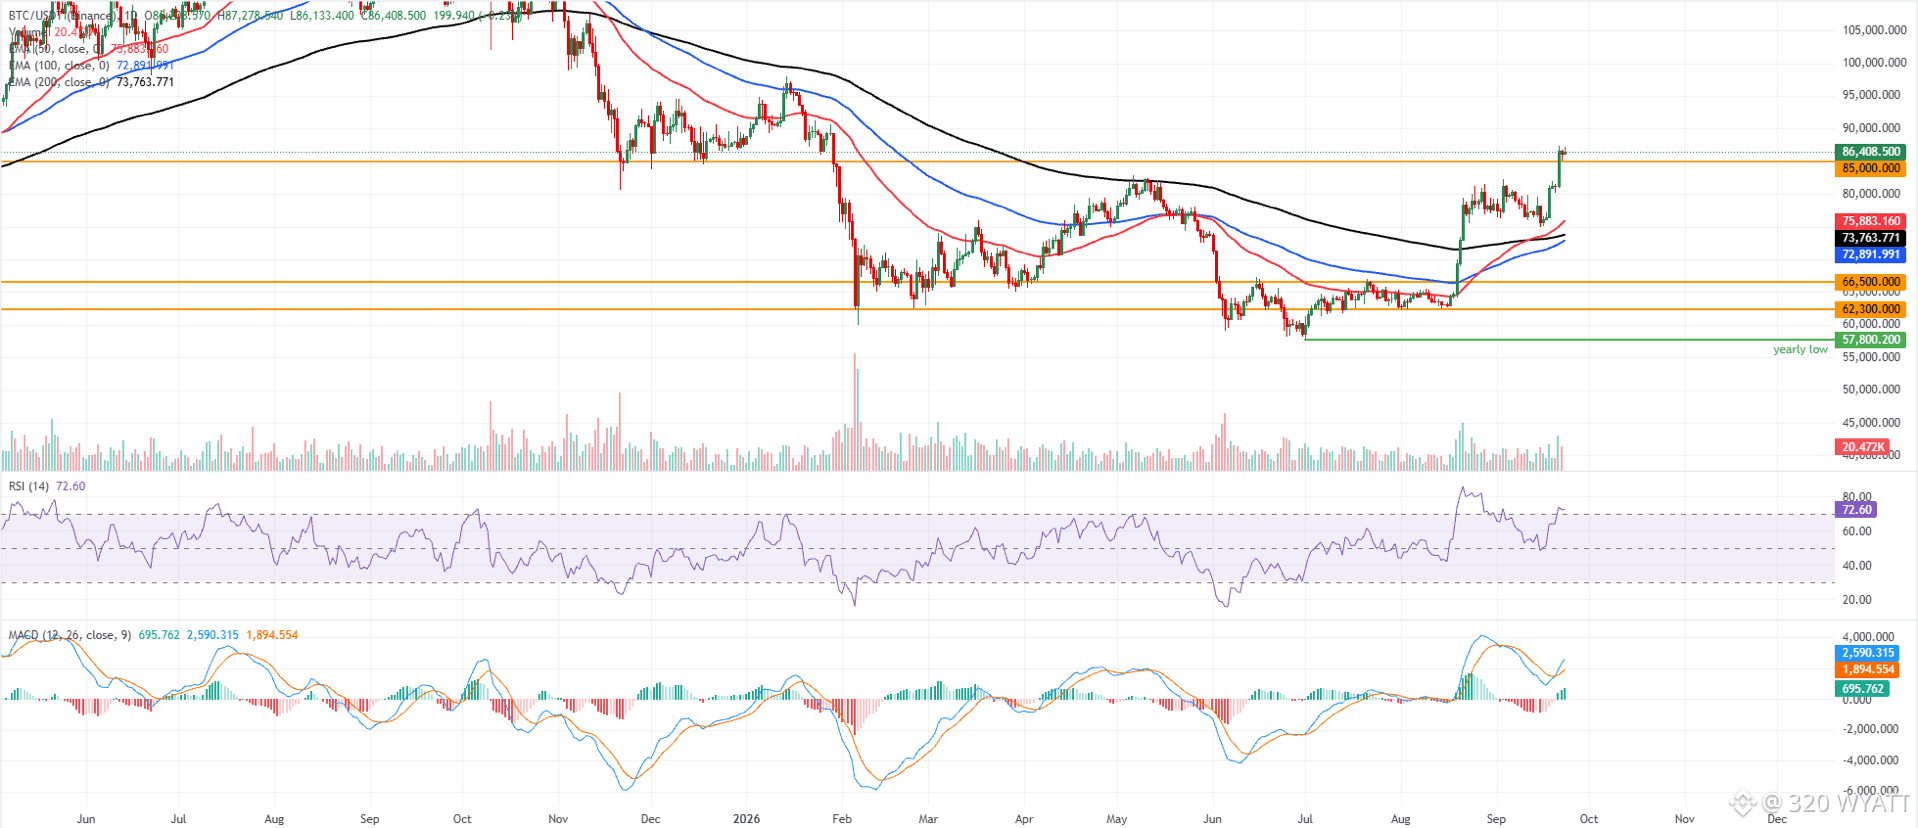
$BTC {spot}(BTCUSDT) Bitcoin price trades at $86,408 on Wednesday after surging over 6% so far this week. The Crypto King is extending its advance firmly above the key Exponential Moving Averages (EMAs). The 50-day EMA at $75,883, the 100-day EMA at $72,891, and the 200-day EMA at $73,763 all sit well below spot, suggesting a strong bullish backdrop, with the recent breakout finding immediate support at the former horizontal barrier near $85,000. The Relative Strength Index (14) around 72 flags overbought conditions, while the Moving Average Convergence Divergence (MACD) remains positive, hinting that upside momentum is robust but increasingly stretched. On the downside, initial support is at $85,000, followed by the clustered dynamic floor of the 50-day EMA at $75,883 and broader trend support from the 200-day EMA at $73,763 and the 100-day EMA at $72,891. Deeper pullbacks would likely attract buyers toward the prior structural levels at $66,500 and $62,300. At the same time, the absence of nearby overhead resistance on this chart suggests that any fresh highs above the current price would leave BTC to sustain further gains toward the $100,000 mark. #BTC320 #mr320 #Trendingissue #WriteToEarn2026 #Trendingcoin320
$BTC
Bitcoin price trades at $86,408 on Wednesday after surging over 6% so far this week. The Crypto King is extending its advance firmly above the key Exponential Moving Averages (EMAs). The 50-day EMA at $75,883, the 100-day EMA at $72,891, and the 200-day EMA at $73,763 all sit well below spot, suggesting a strong bullish backdrop, with the recent breakout finding immediate support at the former horizontal barrier near $85,000.

The Relative Strength Index (14) around 72 flags overbought conditions, while the Moving Average Convergence Divergence (MACD) remains positive, hinting that upside momentum is robust but increasingly stretched.
On the downside, initial support is at $85,000, followed by the clustered dynamic floor of the 50-day EMA at $75,883 and broader trend support from the 200-day EMA at $73,763 and the 100-day EMA at $72,891.
Deeper pullbacks would likely attract buyers toward the prior structural levels at $66,500 and $62,300. At the same time, the absence of nearby overhead resistance on this chart suggests that any fresh highs above the current price would leave BTC to sustain further gains toward the $100,000 mark.

#BTC320 #mr320 #Trendingissue #WriteToEarn2026 #Trendingcoin320
·
--
Bullish
$BTC {spot}(BTCUSDT) Bitcoin maintains strong momentum, trading near $86,500 amid a rebound exceeding 13% from recent lows. The rally is primarily driven by continuous institutional capital inflows into US spot Bitcoin ETFs, totaling nearly $1.8 billion over three days, alongside improving macroeconomic risk appetite fueled by declining oil prices and retreating Treasury yields. Technically, Bitcoin has broken above its long-term resistance range, targeting $90,000 to $92,000. However, persistent Federal Reserve rate hike expectations and inflation concerns remain key downside risks, with crucial support identified at $81,000 to $83,000. #BTC320 #Trendingissue #Trendingcoin320 #mr320 #WriteToEarn2026
$BTC
Bitcoin maintains strong momentum, trading near $86,500 amid a rebound exceeding 13% from recent lows. The rally is primarily driven by continuous institutional capital inflows into US spot Bitcoin ETFs, totaling nearly $1.8 billion over three days, alongside improving macroeconomic risk appetite fueled by declining oil prices and retreating Treasury yields. Technically, Bitcoin has broken above its long-term resistance range, targeting $90,000 to $92,000. However, persistent Federal Reserve rate hike expectations and inflation concerns remain key downside risks, with crucial support identified at $81,000 to $83,000.

#BTC320 #Trendingissue #Trendingcoin320 #mr320 #WriteToEarn2026
·
--
Bullish
Bitcoin Up or Down on September 22?

Bitcoin Up or Down on September 22?

99%Up1%Down
Volume $88,359.45
ابوالعز1123:
تحليل ممتاز يا Wyatt، وانت كنت دقيق جداً، $BTC فعلاً لمس 85,000 كحد أدنى زي ما قولت ودلوقتي راجع من 86 لـ 85,418 ودي حركة صحية لإعادة اختبار النمط. اتفق معاك ان اللمسة دي تعتبر نتيجة ضعيفة، والهدف الثابت اللي انت محدده 88,600 - 92,220 منطقي جداً كمنطقة سيولة، و 97,637 هدف ممتد لو كسرنا 92,220 بفوليوم. أنا شايف التصويت 68% Down ده معناه خوف زايد وده عادة إشارة انعكاس قريب. سؤال: هل شايف اننا هنعمل Higher Low عند 85,000 قبل الانطلاق لـ 88,600 ولا ممكن ننزل نختبر 84,200 الأول؟ متابعك.
Article
Bitcoin Price Prediction: BTC Soars Past $87,000, Will It Continue to Rise This Year?$BTC {spot}(BTCUSDT) Bitcoin strongly broke through the past month's resistance level of $82,000, surging over 5% intraday to briefly reach $87,000, setting an 8-month high. As of press time, Bitcoin price has pulled back, temporarily trading at $85,265. Following a rate hike by the U.S. Federal Reserve (Fed) on September 16 and the failure of the U.S. Congress to pass the cryptocurrency bill "CLARITY Act," the market experienced a brief decline. However, as the market quickly digested this negative news, improving macroeconomic conditions and a rebound in risk appetite provided new support for Bitcoin prices. Specifically, lower U.S. Treasury yields improved market liquidity conditions, while international crude oil prices fell noticeably by over 3%, lowering global inflation expectations and creating room for a rebound in risk assets. Yesterday, the three major U.S. stock indices rose across the board, with the Nasdaq Composite Index surging over 2%. As overall market risk appetite warmed up, capital simultaneously flooded into high-elasticity assets like Bitcoin, with U.S. spot Bitcoin ETFs recording a net inflow of approximately $1 billion yesterday, setting a single-day high since October 2025. Of course, after breaking out of the long-standing consolidation range and psychological barrier of $80,000–$82,000, Bitcoin presented strong bullish signals on technical charts. This not only triggered buying orders from numerous quantitative trading programs but also attracted FOMO buying from retail investors, further expanding gains. After Bitcoin briefly touched $87,000, Nansen analyst Nicolai Sondergaard believes the next key level is $90,000–$92,000, which coincides with the 0.5 Fibonacci resistance level. However, after surging higher, Bitcoin price quickly triggered selling pressure, leading to a significant pullback. From a technical analysis perspective, there is a need for Bitcoin price to retest $82,000, a former resistance level that has turned into support; thus, as long as it does not fall below this level, it remains a healthy correction. bitcoin-btc-price-d1c94f408f87414fa0462021611ab4acBitcoin price chart, Source: TradingView Currently, U.S. crypto regulation leans favorable, though macroeconomic uncertainty may tilt toward tightening; nevertheless, falling international crude oil prices have lowered global inflation expectations. If inflationary pressures ease further, macroeconomic policies will shift toward supporting risk assets, and it is not ruled out that Bitcoin prices could continue to rally toward $100,000 this year.

Bitcoin Price Prediction: BTC Soars Past $87,000, Will It Continue to Rise This Year?

$BTC
Bitcoin strongly broke through the past month's resistance level of $82,000, surging over 5% intraday to briefly reach $87,000, setting an 8-month high. As of press time, Bitcoin price has pulled back, temporarily trading at $85,265.
Following a rate hike by the U.S. Federal Reserve (Fed) on September 16 and the failure of the U.S. Congress to pass the cryptocurrency bill "CLARITY Act," the market experienced a brief decline. However, as the market quickly digested this negative news, improving macroeconomic conditions and a rebound in risk appetite provided new support for Bitcoin prices.
Specifically, lower U.S. Treasury yields improved market liquidity conditions, while international crude oil prices fell noticeably by over 3%, lowering global inflation expectations and creating room for a rebound in risk assets. Yesterday, the three major U.S. stock indices rose across the board, with the Nasdaq Composite Index surging over 2%. As overall market risk appetite warmed up, capital simultaneously flooded into high-elasticity assets like Bitcoin, with U.S. spot Bitcoin ETFs recording a net inflow of approximately $1 billion yesterday, setting a single-day high since October 2025.
Of course, after breaking out of the long-standing consolidation range and psychological barrier of $80,000–$82,000, Bitcoin presented strong bullish signals on technical charts. This not only triggered buying orders from numerous quantitative trading programs but also attracted FOMO buying from retail investors, further expanding gains.
After Bitcoin briefly touched $87,000, Nansen analyst Nicolai Sondergaard believes the next key level is $90,000–$92,000, which coincides with the 0.5 Fibonacci resistance level. However, after surging higher, Bitcoin price quickly triggered selling pressure, leading to a significant pullback. From a technical analysis perspective, there is a need for Bitcoin price to retest $82,000, a former resistance level that has turned into support; thus, as long as it does not fall below this level, it remains a healthy correction.
bitcoin-btc-price-d1c94f408f87414fa0462021611ab4acBitcoin price chart, Source: TradingView
Currently, U.S. crypto regulation leans favorable, though macroeconomic uncertainty may tilt toward tightening; nevertheless, falling international crude oil prices have lowered global inflation expectations. If inflationary pressures ease further, macroeconomic policies will shift toward supporting risk assets, and it is not ruled out that Bitcoin prices could continue to rally toward $100,000 this year.

·
--
Bullish
$BTC {spot}(BTCUSDT) Bitcoin BTC price is currently trading at $85,126.8, sitting just below the swing high of $87,396 and well above the 200-day moving average at $70,703.56. The Bitcoin BTC price analysis and chart reveal a market that has recovered aggressively from the swing low of $57,808.4, and we are now testing the upper portion of the intermediate range. The distance from the swing high suggests there is still room for upside expansion, and the overall market structure remains intact. The weight of evidence across our 10 indicators points to a bullish lean with a cumulative score of 7.3 out of 10. Bitcoin price is aligned above all four major moving averages, the Bollinger Bands are expanding in an uptrend, and the MACD momentum is building strength. Bitcoin crypto price action is being confirmed by rising on-balance volume and a double bottom chart pattern that suggests accumulation. The dominant narrative is one of continuation higher, though some intermediate caution is warranted given recent consolidation. #BTC320 #Trendingissue #Trendingcoin320 #WriteToEarn2026 #mr320
$BTC
Bitcoin BTC price is currently trading at $85,126.8, sitting just below the swing high of $87,396 and well above the 200-day moving average at $70,703.56. The Bitcoin BTC price analysis and chart reveal a market that has recovered aggressively from the swing low of $57,808.4, and we are now testing the upper portion of the intermediate range. The distance from the swing high suggests there is still room for upside expansion, and the overall market structure remains intact.
The weight of evidence across our 10 indicators points to a bullish lean with a cumulative score of 7.3 out of 10. Bitcoin price is aligned above all four major moving averages, the Bollinger Bands are expanding in an uptrend, and the MACD momentum is building strength. Bitcoin crypto price action is being confirmed by rising on-balance volume and a double bottom chart pattern that suggests accumulation. The dominant narrative is one of continuation higher, though some intermediate caution is warranted given recent consolidation.

#BTC320 #Trendingissue #Trendingcoin320 #WriteToEarn2026 #mr320
·
--
Bullish
Bitcoin Up or Down on September 22?

Bitcoin Up or Down on September 22?

99%Up1%Down
Volume $88,359.45
·
--
Bullish
$BTC {spot}(BTCUSDT) 🚨Bitcoin Price Analysis: BTC Eyes $90K After Breaking Above $84K🚨 Bitcoin’s price chart shows a breakout above the $84,000–$84,500 resistance zone, supported by increased trading activity. The region now becomes an important area to monitor for support. Bitcoin’s recovery above $80,061, its reported one-year moving average, marks an important development in the broader chart structure. The reclaim suggests that BTC has moved back above a key trend reference after facing pressure during previous sessions. Holding above it would preserve the current bullish structure, while a sustained move back below $84,000 could signal a failed breakout and expose BTC to renewed consolidation. On the upside, the $88,761 two-year moving average is the next major technical reference, followed by the psychological $90,000 resistance. A decisive daily close above this zone could strengthen the recovery structure. Conversely, rejection near the higher resistance area may trigger profit-taking and a retest of the $80,000 region, where the one-year moving average could provide initial support. #BTC320 #Trendingissue #WriteToEarn2026 #Btchit85k #mr320
$BTC
🚨Bitcoin Price Analysis: BTC Eyes $90K After Breaking Above $84K🚨

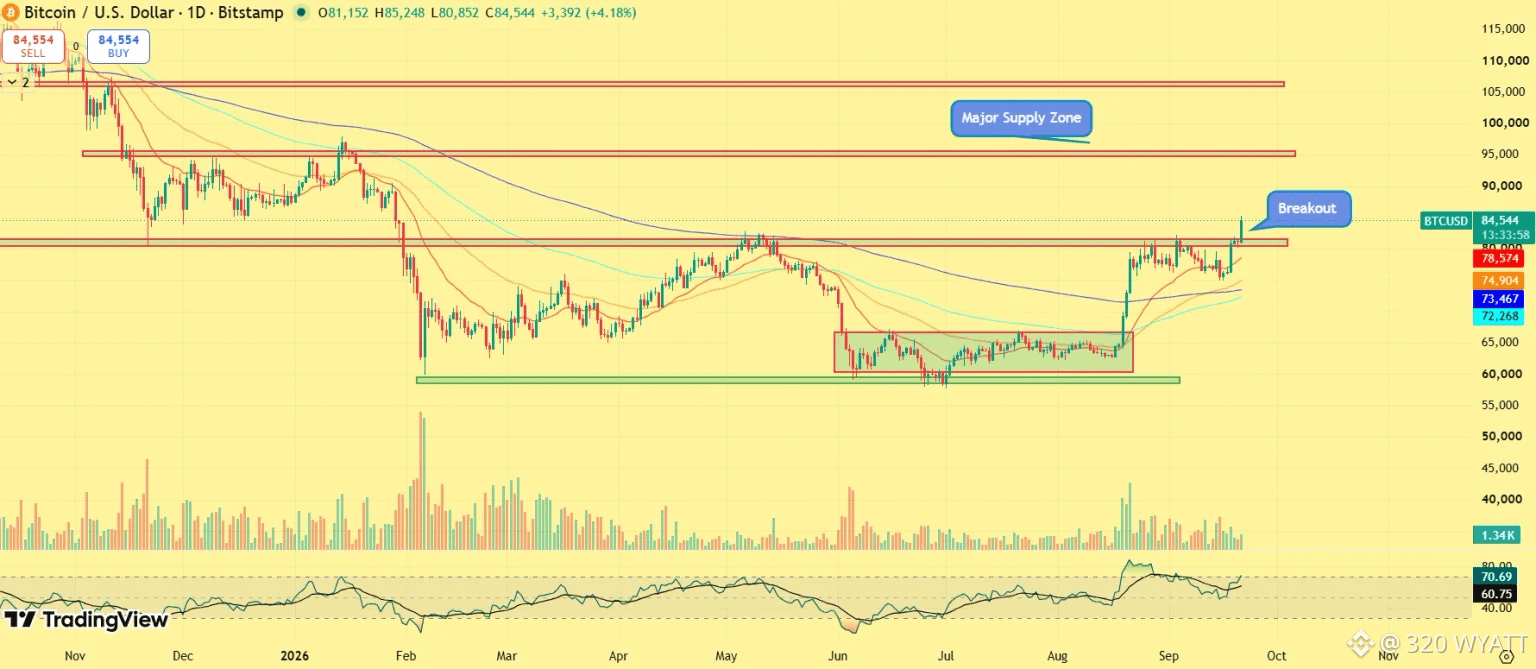
Bitcoin’s price chart shows a breakout above the $84,000–$84,500 resistance zone, supported by increased trading activity. The region now becomes an important area to monitor for support. Bitcoin’s recovery above $80,061, its reported one-year moving average, marks an important development in the broader chart structure. The reclaim suggests that BTC has moved back above a key trend reference after facing pressure during previous sessions.
Holding above it would preserve the current bullish structure, while a sustained move back below $84,000 could signal a failed breakout and expose BTC to renewed consolidation. On the upside, the $88,761 two-year moving average is the next major technical reference, followed by the psychological $90,000 resistance.
A decisive daily close above this zone could strengthen the recovery structure. Conversely, rejection near the higher resistance area may trigger profit-taking and a retest of the $80,000 region, where the one-year moving average could provide initial support.

#BTC320 #Trendingissue #WriteToEarn2026 #Btchit85k #mr320
AngelOfCrypto_-:
nice
·
--
Bullish
$BTC {spot}(BTCUSDT) The 4-hour chart provides a clearer picture of the recent breakout. BTC had been trading inside a descending channel, with both the upper and lower boundaries gradually moving lower. The price eventually broke above the channel and reclaimed the $80K-$82K resistance zone. The breakout has since accelerated, with BTC reaching approximately $85K. The immediate focus is now on the $88K area, which is a visible order block on the higher-timeframe chart. Momentum is particularly strong, with the 4-hour RSI around 80. While elevated RSI readings do not necessarily invalidate a breakout, they do increase the possibility of short-term consolidation or a retest after sharp advance. The $80K-$82K zone is therefore likely to be the key near-term support. Holding this area would keep the recent breakout structure intact, while a sustained move back below it could indicate that BTC needs a deeper correction before attempting another move higher. #BTC320 #btc #Btchit85k #mr320 #writetoearn2026
$BTC
The 4-hour chart provides a clearer picture of the recent breakout. BTC had been trading inside a descending channel, with both the upper and lower boundaries gradually moving lower. The price eventually broke above the channel and reclaimed the $80K-$82K resistance zone.

The breakout has since accelerated, with BTC reaching approximately $85K. The immediate focus is now on the $88K area, which is a visible order block on the higher-timeframe chart.
Momentum is particularly strong, with the 4-hour RSI around 80. While elevated RSI readings do not necessarily invalidate a breakout, they do increase the possibility of short-term consolidation or a retest after sharp advance.
The $80K-$82K zone is therefore likely to be the key near-term support. Holding this area would keep the recent breakout structure intact, while a sustained move back below it could indicate that BTC needs a deeper correction before attempting another move higher.

#BTC320 #btc #Btchit85k #mr320 #writetoearn2026
AngelOfCrypto_-:
nice
·
--
Bullish
$BTC {spot}(BTCUSDT) 🚨Bitcoin (BTC) Price Prediction for September 2026🚨 Bitcoin’s September rally has now pushed above the $85,000 resistance zone, following a strong recovery from the prolonged consolidation range. BTC is trading around $84,600, with the latest breakout bringing the $85,000–$88,000 region into focus as the next area of potential selling pressure. A sustained move above $88,000 could strengthen the recovery structure and open the path toward $90,000–$95,000, followed by the $97,000–$100,000 supply zone. Meanwhile, $80,000–$82,000 has become the key breakout-support area. Holding this zone would keep buyers in control, while a move below it could trigger a deeper retracement toward $75,000–$78,000. #BTC320 #Trendingissue #mr320 #writetoearn2026 #Btchit85k
$BTC
🚨Bitcoin (BTC) Price Prediction for September 2026🚨

Bitcoin’s September rally has now pushed above the $85,000 resistance zone, following a strong recovery from the prolonged consolidation range. BTC is trading around $84,600, with the latest breakout bringing the $85,000–$88,000 region into focus as the next area of potential selling pressure. A sustained move above $88,000 could strengthen the recovery structure and open the path toward $90,000–$95,000, followed by the $97,000–$100,000 supply zone. Meanwhile, $80,000–$82,000 has become the key breakout-support area. Holding this zone would keep buyers in control, while a move below it could trigger a deeper retracement toward $75,000–$78,000.

#BTC320 #Trendingissue #mr320 #writetoearn2026 #Btchit85k
Log in to explore more content
Join global crypto users on Binance Square
⚡️ Get latest and useful information about crypto.
💬 Trusted by the world’s largest crypto exchange.
👍 Discover real insights from verified creators.
Email / Phone number