
#usstocks
usstocks
192,380 views
771 Discussing
Hot
Latest


Article
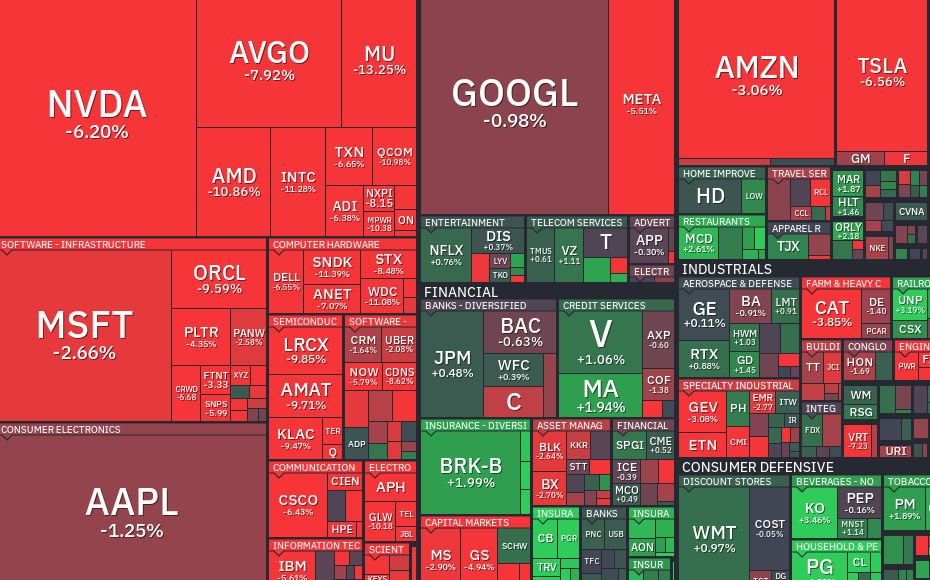
Why US Stocks Can Suddenly Get “Hammered”When people say US stocks are getting “hammered,” they usually mean prices are falling sharply across major indices, individual stocks, or both. The most important first question is: is this a broad market decline, or are only a few large sectors falling?
I’m unable to confirm the latest live index moves in this response, so this article explains the mechanics behind a sharp US equity selloff rather than attributing it to a specific headline. The most recent completed US trading session should be used as the reference point, since pre-market, after-hours, and intraday moves can look very different.
1. What a Stock-Market Selloff Actually Means
A selloff happens when more investors want to reduce exposure than add it at current prices. Sellers accept lower prices to find buyers, and that process can accelerate quickly.
This does not necessarily mean every company has suddenly become weaker. Stock prices reflect expectations about future profits, interest rates, economic conditions, and investor risk appetite. When those expectations change, prices can reset before company fundamentals visibly change.
A sharp decline can show up in several ways:
Major indices fall together, suggesting broad risk aversion.Growth stocks decline more than defensive sectors, often reflecting higher-rate or valuation concerns.Small-cap stocks fall more than mega-cap companies, which can signal worries about financing conditions or economic growth.A handful of very large technology stocks fall, pulling index levels lower because of their heavy index weight.Volatility rises as investors pay more for downside protection and reduce leveraged positions.
2. Interest Rates: Often the Biggest Immediate Pressure Point
For equities, interest rates matter because they affect both company finances and how investors value future earnings.
When bond yields rise, borrowing can become more expensive for companies and consumers. Higher rates may slow spending, reduce housing activity, raise refinancing costs, and pressure profit margins. They also make safer assets such as government bonds relatively more attractive compared with stocks.
Rates are especially important for growth-oriented companies. Their valuations often rely more heavily on profits expected several years into the future. When investors use a higher discount rate to value those future profits, the present value of those earnings falls.
That is why a rise in yields can sometimes cause technology, software, semiconductor, and other high-growth shares to fall more sharply than slower-growing sectors.
3. Inflation Can Change the Entire Market Narrative
Inflation data can trigger a selloff when it suggests price pressures are not easing as expected.
If inflation is hotter than markets anticipated, investors may conclude that central banks will keep rates higher for longer. In some cases, they may also reduce expectations for future rate cuts. That can lead to a rapid repricing across stocks, bonds, currencies, and crypto markets.
The chain reaction often looks like this:
Inflation data surprises upward.Bond yields rise as markets adjust rate expectations.Equity valuations come under pressure.Rate-sensitive sectors fall more sharply.Volatility increases as traders reduce risk.
The reverse can also happen when inflation cools: yields may fall, and rate-sensitive assets may recover. Neither outcome is guaranteed, because markets also consider growth, earnings, and positioning.
4. Earnings Matter More Than Headlines Over Time
A company’s stock price ultimately depends heavily on what investors expect it can earn in the future.
A disappointing earnings report can hurt a stock even if the company remains profitable. Markets often react most strongly to forward guidance: projected revenue growth, margins, demand conditions, capital expenditure, and management commentary.
A stock can decline when:
Revenue growth slows.Profit margins narrow.Management lowers future guidance.Costs rise faster than sales.Demand weakens in a key product category.Capital spending rises without a clear near-term payoff.Expectations had become too optimistic before the report.
This is why “good earnings” do not always produce a higher stock price. If investors expected exceptional results and received merely solid results, the share price can still fall.
5. Valuation Pressure: Great Companies Can Still Decline
A business can be high quality and still see its share price fall sharply if investors decide the valuation had become too expensive.
Valuation is essentially the price investors are willing to pay for a stream of future earnings. During optimistic periods, investors may pay a premium for companies with strong growth stories. If sentiment shifts, that premium can shrink quickly.
This is particularly visible in companies with:
High price-to-earnings multiples.High price-to-sales multiples.Aggressive future-growth assumptions.Heavy dependence on low interest rates.Large exposure to a fashionable theme, such as artificial intelligence or a fast-growing new technology cycle.
A valuation reset does not automatically mean the underlying business is failing. It means the market is reassessing how much it is willing to pay today for future potential.
6. Economic-Growth Fears Can Spread Across the Market
Stocks can fall if investors become concerned that economic growth will slow materially.
Slower growth can reduce consumer spending, business investment, advertising budgets, travel demand, industrial activity, and corporate profits. Companies with cyclical revenue—such as manufacturers, banks, retailers, transport firms, and commodity-linked businesses—can be particularly sensitive.
Markets often respond before official economic data confirms a slowdown. Investors watch forward-looking indicators such as:
New orders and manufacturing surveys.Consumer confidence.Hiring trends and unemployment claims.Retail-sales trends.Housing activity.Credit conditions.Corporate guidance.
A difficult part of market interpretation is that the same data can point in two directions. Weak economic data may raise recession concerns, but it may also increase hopes for lower interest rates. Which force dominates depends on the broader market backdrop.
7. Sector Concentration Can Make Index Declines Look Worse
US stock indices are not equally weighted collections of companies. Large companies can have an outsized influence on index performance.
If a small group of mega-cap technology or semiconductor companies falls sharply, an index can decline even when many smaller stocks are holding up relatively well. Conversely, an index can appear resilient even if a large number of companies are declining beneath the surface.
This is why market breadth matters.
Useful breadth questions include:
Are most stocks declining, or only the largest names?Are defensive sectors outperforming?Are small-cap stocks weaker than large-cap stocks?Are banks, industrials, and consumer stocks also falling?Are new 52-week lows expanding?Is volatility rising alongside the decline?
Broad weakness suggests a more widespread reduction in risk appetite. Narrow weakness may point more toward a sector-specific earnings, valuation, or positioning issue.
8. Positioning and Leverage Can Turn a Decline Into a Faster Drop
Markets do not move only because of new information. They also move because of where investors are already positioned.
When many traders have similar bullish positions, a negative surprise can lead to rapid selling. Leveraged investors may need to reduce positions if prices fall, which adds further downward pressure. Options hedging can also amplify moves in either direction.
This is often described as a “risk-off” move. It can involve:
Investors taking profits after a strong rally.Funds reducing exposure ahead of major data releases.Leveraged positions being cut.Option dealers hedging changing market exposure.Systematic strategies reducing equity exposure as volatility rises.Investors shifting toward cash, bonds, or defensive sectors.
Positioning can explain why a seemingly modest headline produces an outsized market move. The headline may be the trigger, but crowded positioning can be the amplifier.
9. Geopolitical and Policy Shocks Can Raise Uncertainty
Markets dislike uncertainty because it makes future cash flows harder to estimate.
Trade restrictions, tariff announcements, geopolitical escalation, election-policy uncertainty, fiscal disputes, regulatory changes, or sudden changes in government policy can all affect stocks. The impact varies by sector.
For example:
Trade disruptions can pressure manufacturers, exporters, retailers, and semiconductor supply chains.Higher tariffs can raise costs and potentially increase inflation pressure.Energy-market disruptions can affect transport, industrial, and consumer sectors.Regulatory shifts can have an outsized effect on banks, healthcare companies, technology platforms, or defense-related industries.
The key is to separate a confirmed policy action from speculation about possible policy changes. Markets may react to both, but the certainty level is very different.
10. Why a Selloff Can Feel More Violent Than the Numbers Suggest
Sharp red screens create a strong emotional impression. Investors tend to notice falling prices more intensely than rising prices, especially when large, familiar companies are moving quickly.
Several factors make declines feel especially severe:
News coverage focuses on the largest percentage moves.Social media amplifies dramatic narratives.Large individual-stock declines can overshadow mixed index performance.Intraday reversals can create stress even if the closing decline is smaller.Leveraged products and options can move much more than the underlying index.Investors may focus on portfolio losses rather than the longer market context.
That does not mean the risk is imaginary. It means that price action should be interpreted using breadth, volume, volatility, rates, earnings expectations, and economic data—not only headlines or a single trading session.
11. How to Read the Selloff Without Overreacting
A practical way to understand a sharp decline is to ask five questions:
First: How broad is the weakness?
Check whether major indices, small caps, sector ETFs, and most individual stocks are all declining.
Second: What are bond yields doing?
Rising yields often point toward rate and valuation pressure. Falling yields alongside falling stocks can point more toward growth or recession concerns.
Third: Is there a confirmed catalyst?
Look for dated economic releases, central-bank developments, earnings reports, policy announcements, or clearly identified geopolitical events.
Fourth: Are earnings expectations changing?
A short-term selloff can become more significant if analysts begin cutting revenue or profit forecasts.
Fifth: Is volatility rising?
Higher volatility can indicate that investors are paying more to protect portfolios and that market conditions are becoming less stable.
12. What Would Strengthen or Weaken the “Broad Risk-Off” Explanation
The broad risk-off interpretation becomes more convincing if several signals occur together:
Major US indices decline at the same time.Small-cap shares weaken alongside large caps.High-valuation growth shares underperform.Volatility rises.Credit-sensitive sectors such as banks weaken.Market breadth deteriorates.Investors move toward safer assets.
That interpretation becomes less convincing if the weakness is narrowly concentrated in one industry, one earnings theme, or a few heavily weighted companies while the broader market remains relatively stable.
The above is market analysis and does not constitute investment advice.
#USStocks #UsStocksMarket
Why US Stocks Can Suddenly Get “Hammered”
When people say US stocks are getting “hammered,” they usually mean prices are falling sharply across major indices, individual stocks, or both. The most important first question is: is this a broad market decline, or are only a few large sectors falling?
I’m unable to confirm the latest live index moves in this response, so this article explains the mechanics behind a sharp US equity selloff rather than attributing it to a specific headline. The most recent completed US trading session should be used as the reference point, since pre-market, after-hours, and intraday moves can look very different.
1. What a Stock-Market Selloff Actually Means
A selloff happens when more investors want to reduce exposure than add it at current prices. Sellers accept lower prices to find buyers, and that process can accelerate quickly.
This does not necessarily mean every company has suddenly become weaker. Stock prices reflect expectations about future profits, interest rates, economic conditions, and investor risk appetite. When those expectations change, prices can reset before company fundamentals visibly change.
A sharp decline can show up in several ways:
Major indices fall together, suggesting broad risk aversion.Growth stocks decline more than defensive sectors, often reflecting higher-rate or valuation concerns.Small-cap stocks fall more than mega-cap companies, which can signal worries about financing conditions or economic growth.A handful of very large technology stocks fall, pulling index levels lower because of their heavy index weight.Volatility rises as investors pay more for downside protection and reduce leveraged positions.
2. Interest Rates: Often the Biggest Immediate Pressure Point
For equities, interest rates matter because they affect both company finances and how investors value future earnings.
When bond yields rise, borrowing can become more expensive for companies and consumers. Higher rates may slow spending, reduce housing activity, raise refinancing costs, and pressure profit margins. They also make safer assets such as government bonds relatively more attractive compared with stocks.
Rates are especially important for growth-oriented companies. Their valuations often rely more heavily on profits expected several years into the future. When investors use a higher discount rate to value those future profits, the present value of those earnings falls.
That is why a rise in yields can sometimes cause technology, software, semiconductor, and other high-growth shares to fall more sharply than slower-growing sectors.
3. Inflation Can Change the Entire Market Narrative
Inflation data can trigger a selloff when it suggests price pressures are not easing as expected.
If inflation is hotter than markets anticipated, investors may conclude that central banks will keep rates higher for longer. In some cases, they may also reduce expectations for future rate cuts. That can lead to a rapid repricing across stocks, bonds, currencies, and crypto markets.
The chain reaction often looks like this:
Inflation data surprises upward.Bond yields rise as markets adjust rate expectations.Equity valuations come under pressure.Rate-sensitive sectors fall more sharply.Volatility increases as traders reduce risk.
The reverse can also happen when inflation cools: yields may fall, and rate-sensitive assets may recover. Neither outcome is guaranteed, because markets also consider growth, earnings, and positioning.
4. Earnings Matter More Than Headlines Over Time
A company’s stock price ultimately depends heavily on what investors expect it can earn in the future.
A disappointing earnings report can hurt a stock even if the company remains profitable. Markets often react most strongly to forward guidance: projected revenue growth, margins, demand conditions, capital expenditure, and management commentary.
A stock can decline when:
Revenue growth slows.Profit margins narrow.Management lowers future guidance.Costs rise faster than sales.Demand weakens in a key product category.Capital spending rises without a clear near-term payoff.Expectations had become too optimistic before the report.
This is why “good earnings” do not always produce a higher stock price. If investors expected exceptional results and received merely solid results, the share price can still fall.
5. Valuation Pressure: Great Companies Can Still Decline
A business can be high quality and still see its share price fall sharply if investors decide the valuation had become too expensive.
Valuation is essentially the price investors are willing to pay for a stream of future earnings. During optimistic periods, investors may pay a premium for companies with strong growth stories. If sentiment shifts, that premium can shrink quickly.
This is particularly visible in companies with:
High price-to-earnings multiples.High price-to-sales multiples.Aggressive future-growth assumptions.Heavy dependence on low interest rates.Large exposure to a fashionable theme, such as artificial intelligence or a fast-growing new technology cycle.
A valuation reset does not automatically mean the underlying business is failing. It means the market is reassessing how much it is willing to pay today for future potential.
6. Economic-Growth Fears Can Spread Across the Market
Stocks can fall if investors become concerned that economic growth will slow materially.
Slower growth can reduce consumer spending, business investment, advertising budgets, travel demand, industrial activity, and corporate profits. Companies with cyclical revenue—such as manufacturers, banks, retailers, transport firms, and commodity-linked businesses—can be particularly sensitive.
Markets often respond before official economic data confirms a slowdown. Investors watch forward-looking indicators such as:
New orders and manufacturing surveys.Consumer confidence.Hiring trends and unemployment claims.Retail-sales trends.Housing activity.Credit conditions.Corporate guidance.
A difficult part of market interpretation is that the same data can point in two directions. Weak economic data may raise recession concerns, but it may also increase hopes for lower interest rates. Which force dominates depends on the broader market backdrop.
7. Sector Concentration Can Make Index Declines Look Worse
US stock indices are not equally weighted collections of companies. Large companies can have an outsized influence on index performance.
If a small group of mega-cap technology or semiconductor companies falls sharply, an index can decline even when many smaller stocks are holding up relatively well. Conversely, an index can appear resilient even if a large number of companies are declining beneath the surface.
This is why market breadth matters.
Useful breadth questions include:
Are most stocks declining, or only the largest names?Are defensive sectors outperforming?Are small-cap stocks weaker than large-cap stocks?Are banks, industrials, and consumer stocks also falling?Are new 52-week lows expanding?Is volatility rising alongside the decline?
Broad weakness suggests a more widespread reduction in risk appetite. Narrow weakness may point more toward a sector-specific earnings, valuation, or positioning issue.
8. Positioning and Leverage Can Turn a Decline Into a Faster Drop
Markets do not move only because of new information. They also move because of where investors are already positioned.
When many traders have similar bullish positions, a negative surprise can lead to rapid selling. Leveraged investors may need to reduce positions if prices fall, which adds further downward pressure. Options hedging can also amplify moves in either direction.
This is often described as a “risk-off” move. It can involve:
Investors taking profits after a strong rally.Funds reducing exposure ahead of major data releases.Leveraged positions being cut.Option dealers hedging changing market exposure.Systematic strategies reducing equity exposure as volatility rises.Investors shifting toward cash, bonds, or defensive sectors.
Positioning can explain why a seemingly modest headline produces an outsized market move. The headline may be the trigger, but crowded positioning can be the amplifier.
9. Geopolitical and Policy Shocks Can Raise Uncertainty
Markets dislike uncertainty because it makes future cash flows harder to estimate.
Trade restrictions, tariff announcements, geopolitical escalation, election-policy uncertainty, fiscal disputes, regulatory changes, or sudden changes in government policy can all affect stocks. The impact varies by sector.
For example:
Trade disruptions can pressure manufacturers, exporters, retailers, and semiconductor supply chains.Higher tariffs can raise costs and potentially increase inflation pressure.Energy-market disruptions can affect transport, industrial, and consumer sectors.Regulatory shifts can have an outsized effect on banks, healthcare companies, technology platforms, or defense-related industries.
The key is to separate a confirmed policy action from speculation about possible policy changes. Markets may react to both, but the certainty level is very different.
10. Why a Selloff Can Feel More Violent Than the Numbers Suggest
Sharp red screens create a strong emotional impression. Investors tend to notice falling prices more intensely than rising prices, especially when large, familiar companies are moving quickly.
Several factors make declines feel especially severe:
News coverage focuses on the largest percentage moves.Social media amplifies dramatic narratives.Large individual-stock declines can overshadow mixed index performance.Intraday reversals can create stress even if the closing decline is smaller.Leveraged products and options can move much more than the underlying index.Investors may focus on portfolio losses rather than the longer market context.
That does not mean the risk is imaginary. It means that price action should be interpreted using breadth, volume, volatility, rates, earnings expectations, and economic data—not only headlines or a single trading session.
11. How to Read the Selloff Without Overreacting
A practical way to understand a sharp decline is to ask five questions:
First: How broad is the weakness?
Check whether major indices, small caps, sector ETFs, and most individual stocks are all declining.
Second: What are bond yields doing?
Rising yields often point toward rate and valuation pressure. Falling yields alongside falling stocks can point more toward growth or recession concerns.
Third: Is there a confirmed catalyst?
Look for dated economic releases, central-bank developments, earnings reports, policy announcements, or clearly identified geopolitical events.
Fourth: Are earnings expectations changing?
A short-term selloff can become more significant if analysts begin cutting revenue or profit forecasts.
Fifth: Is volatility rising?
Higher volatility can indicate that investors are paying more to protect portfolios and that market conditions are becoming less stable.
12. What Would Strengthen or Weaken the “Broad Risk-Off” Explanation
The broad risk-off interpretation becomes more convincing if several signals occur together:
Major US indices decline at the same time.Small-cap shares weaken alongside large caps.High-valuation growth shares underperform.Volatility rises.Credit-sensitive sectors such as banks weaken.Market breadth deteriorates.Investors move toward safer assets.
That interpretation becomes less convincing if the weakness is narrowly concentrated in one industry, one earnings theme, or a few heavily weighted companies while the broader market remains relatively stable.
The above is market analysis and does not constitute investment advice.
#USStocks #UsStocksMarket
I’m unable to confirm the latest live index moves in this response, so this article explains the mechanics behind a sharp US equity selloff rather than attributing it to a specific headline. The most recent completed US trading session should be used as the reference point, since pre-market, after-hours, and intraday moves can look very different.
1. What a Stock-Market Selloff Actually Means
A selloff happens when more investors want to reduce exposure than add it at current prices. Sellers accept lower prices to find buyers, and that process can accelerate quickly.
This does not necessarily mean every company has suddenly become weaker. Stock prices reflect expectations about future profits, interest rates, economic conditions, and investor risk appetite. When those expectations change, prices can reset before company fundamentals visibly change.
A sharp decline can show up in several ways:
Major indices fall together, suggesting broad risk aversion.Growth stocks decline more than defensive sectors, often reflecting higher-rate or valuation concerns.Small-cap stocks fall more than mega-cap companies, which can signal worries about financing conditions or economic growth.A handful of very large technology stocks fall, pulling index levels lower because of their heavy index weight.Volatility rises as investors pay more for downside protection and reduce leveraged positions.
2. Interest Rates: Often the Biggest Immediate Pressure Point
For equities, interest rates matter because they affect both company finances and how investors value future earnings.
When bond yields rise, borrowing can become more expensive for companies and consumers. Higher rates may slow spending, reduce housing activity, raise refinancing costs, and pressure profit margins. They also make safer assets such as government bonds relatively more attractive compared with stocks.
Rates are especially important for growth-oriented companies. Their valuations often rely more heavily on profits expected several years into the future. When investors use a higher discount rate to value those future profits, the present value of those earnings falls.
That is why a rise in yields can sometimes cause technology, software, semiconductor, and other high-growth shares to fall more sharply than slower-growing sectors.
3. Inflation Can Change the Entire Market Narrative
Inflation data can trigger a selloff when it suggests price pressures are not easing as expected.
If inflation is hotter than markets anticipated, investors may conclude that central banks will keep rates higher for longer. In some cases, they may also reduce expectations for future rate cuts. That can lead to a rapid repricing across stocks, bonds, currencies, and crypto markets.
The chain reaction often looks like this:
Inflation data surprises upward.Bond yields rise as markets adjust rate expectations.Equity valuations come under pressure.Rate-sensitive sectors fall more sharply.Volatility increases as traders reduce risk.
The reverse can also happen when inflation cools: yields may fall, and rate-sensitive assets may recover. Neither outcome is guaranteed, because markets also consider growth, earnings, and positioning.
4. Earnings Matter More Than Headlines Over Time
A company’s stock price ultimately depends heavily on what investors expect it can earn in the future.
A disappointing earnings report can hurt a stock even if the company remains profitable. Markets often react most strongly to forward guidance: projected revenue growth, margins, demand conditions, capital expenditure, and management commentary.
A stock can decline when:
Revenue growth slows.Profit margins narrow.Management lowers future guidance.Costs rise faster than sales.Demand weakens in a key product category.Capital spending rises without a clear near-term payoff.Expectations had become too optimistic before the report.
This is why “good earnings” do not always produce a higher stock price. If investors expected exceptional results and received merely solid results, the share price can still fall.
5. Valuation Pressure: Great Companies Can Still Decline
A business can be high quality and still see its share price fall sharply if investors decide the valuation had become too expensive.
Valuation is essentially the price investors are willing to pay for a stream of future earnings. During optimistic periods, investors may pay a premium for companies with strong growth stories. If sentiment shifts, that premium can shrink quickly.
This is particularly visible in companies with:
High price-to-earnings multiples.High price-to-sales multiples.Aggressive future-growth assumptions.Heavy dependence on low interest rates.Large exposure to a fashionable theme, such as artificial intelligence or a fast-growing new technology cycle.
A valuation reset does not automatically mean the underlying business is failing. It means the market is reassessing how much it is willing to pay today for future potential.
6. Economic-Growth Fears Can Spread Across the Market
Stocks can fall if investors become concerned that economic growth will slow materially.
Slower growth can reduce consumer spending, business investment, advertising budgets, travel demand, industrial activity, and corporate profits. Companies with cyclical revenue—such as manufacturers, banks, retailers, transport firms, and commodity-linked businesses—can be particularly sensitive.
Markets often respond before official economic data confirms a slowdown. Investors watch forward-looking indicators such as:
New orders and manufacturing surveys.Consumer confidence.Hiring trends and unemployment claims.Retail-sales trends.Housing activity.Credit conditions.Corporate guidance.
A difficult part of market interpretation is that the same data can point in two directions. Weak economic data may raise recession concerns, but it may also increase hopes for lower interest rates. Which force dominates depends on the broader market backdrop.
7. Sector Concentration Can Make Index Declines Look Worse
US stock indices are not equally weighted collections of companies. Large companies can have an outsized influence on index performance.
If a small group of mega-cap technology or semiconductor companies falls sharply, an index can decline even when many smaller stocks are holding up relatively well. Conversely, an index can appear resilient even if a large number of companies are declining beneath the surface.
This is why market breadth matters.
Useful breadth questions include:
Are most stocks declining, or only the largest names?Are defensive sectors outperforming?Are small-cap stocks weaker than large-cap stocks?Are banks, industrials, and consumer stocks also falling?Are new 52-week lows expanding?Is volatility rising alongside the decline?
Broad weakness suggests a more widespread reduction in risk appetite. Narrow weakness may point more toward a sector-specific earnings, valuation, or positioning issue.
8. Positioning and Leverage Can Turn a Decline Into a Faster Drop
Markets do not move only because of new information. They also move because of where investors are already positioned.
When many traders have similar bullish positions, a negative surprise can lead to rapid selling. Leveraged investors may need to reduce positions if prices fall, which adds further downward pressure. Options hedging can also amplify moves in either direction.
This is often described as a “risk-off” move. It can involve:
Investors taking profits after a strong rally.Funds reducing exposure ahead of major data releases.Leveraged positions being cut.Option dealers hedging changing market exposure.Systematic strategies reducing equity exposure as volatility rises.Investors shifting toward cash, bonds, or defensive sectors.
Positioning can explain why a seemingly modest headline produces an outsized market move. The headline may be the trigger, but crowded positioning can be the amplifier.
9. Geopolitical and Policy Shocks Can Raise Uncertainty
Markets dislike uncertainty because it makes future cash flows harder to estimate.
Trade restrictions, tariff announcements, geopolitical escalation, election-policy uncertainty, fiscal disputes, regulatory changes, or sudden changes in government policy can all affect stocks. The impact varies by sector.
For example:
Trade disruptions can pressure manufacturers, exporters, retailers, and semiconductor supply chains.Higher tariffs can raise costs and potentially increase inflation pressure.Energy-market disruptions can affect transport, industrial, and consumer sectors.Regulatory shifts can have an outsized effect on banks, healthcare companies, technology platforms, or defense-related industries.
The key is to separate a confirmed policy action from speculation about possible policy changes. Markets may react to both, but the certainty level is very different.
10. Why a Selloff Can Feel More Violent Than the Numbers Suggest
Sharp red screens create a strong emotional impression. Investors tend to notice falling prices more intensely than rising prices, especially when large, familiar companies are moving quickly.
Several factors make declines feel especially severe:
News coverage focuses on the largest percentage moves.Social media amplifies dramatic narratives.Large individual-stock declines can overshadow mixed index performance.Intraday reversals can create stress even if the closing decline is smaller.Leveraged products and options can move much more than the underlying index.Investors may focus on portfolio losses rather than the longer market context.
That does not mean the risk is imaginary. It means that price action should be interpreted using breadth, volume, volatility, rates, earnings expectations, and economic data—not only headlines or a single trading session.
11. How to Read the Selloff Without Overreacting
A practical way to understand a sharp decline is to ask five questions:
First: How broad is the weakness?
Check whether major indices, small caps, sector ETFs, and most individual stocks are all declining.
Second: What are bond yields doing?
Rising yields often point toward rate and valuation pressure. Falling yields alongside falling stocks can point more toward growth or recession concerns.
Third: Is there a confirmed catalyst?
Look for dated economic releases, central-bank developments, earnings reports, policy announcements, or clearly identified geopolitical events.
Fourth: Are earnings expectations changing?
A short-term selloff can become more significant if analysts begin cutting revenue or profit forecasts.
Fifth: Is volatility rising?
Higher volatility can indicate that investors are paying more to protect portfolios and that market conditions are becoming less stable.
12. What Would Strengthen or Weaken the “Broad Risk-Off” Explanation
The broad risk-off interpretation becomes more convincing if several signals occur together:
Major US indices decline at the same time.Small-cap shares weaken alongside large caps.High-valuation growth shares underperform.Volatility rises.Credit-sensitive sectors such as banks weaken.Market breadth deteriorates.Investors move toward safer assets.
That interpretation becomes less convincing if the weakness is narrowly concentrated in one industry, one earnings theme, or a few heavily weighted companies while the broader market remains relatively stable.
The above is market analysis and does not constitute investment advice.
#USStocks #UsStocksMarket
54

·
--
#CanUSStocksReboundAfterNonfarmPayrolls?
The latest US Nonfarm Payrolls report has delivered a stronger-than-expected surprise, adding a new dimension to market expectations.
October Jobs Report:
• Nonfarm Payrolls: +165,000 (vs. 65,000 expected)
• Unemployment Rate: 4.1% (down from 4.2%)
• September job gains were also revised higher.
At first glance, stronger employment signals economic resilience. However, there's another side to consider.
A stronger labor market could reduce the Federal Reserve's urgency to ease monetary policy or increase expectations of tighter policy. Higher interest-rate expectations can put pressure on growth stocks, particularly technology shares.
What happens next?
A stable economic outlook could help restore investor confidence.
Changing Fed rate expectations may keep volatility elevated.
Technology stocks and Treasury yields will remain important indicators to watch.
The key question is whether investors interpret stronger employment as economic strength or a reason to worry about interest rates.
What's your outlook for US equities?
1. Strong recovery
2. Sideways consolidation
3. Further correction
Share your market perspective below!
#USStocks #NonfarmPayrolls #FederalReserve #BinanceSquareTalks #CryptoMarket
#CanUSStocksReboundAfterNonfarmPayrolls?
The latest US Nonfarm Payrolls report has delivered a stronger-than-expected surprise, adding a new dimension to market expectations.
October Jobs Report:
• Nonfarm Payrolls: +165,000 (vs. 65,000 expected)
• Unemployment Rate: 4.1% (down from 4.2%)
• September job gains were also revised higher.
At first glance, stronger employment signals economic resilience. However, there's another side to consider.
A stronger labor market could reduce the Federal Reserve's urgency to ease monetary policy or increase expectations of tighter policy. Higher interest-rate expectations can put pressure on growth stocks, particularly technology shares.
What happens next?
A stable economic outlook could help restore investor confidence.
Changing Fed rate expectations may keep volatility elevated.
Technology stocks and Treasury yields will remain important indicators to watch.
The key question is whether investors interpret stronger employment as economic strength or a reason to worry about interest rates.
What's your outlook for US equities?
1. Strong recovery
2. Sideways consolidation
3. Further correction
Share your market perspective below!
#USStocks #NonfarmPayrolls #FederalReserve #BinanceSquareTalks #CryptoMarket
The latest US Nonfarm Payrolls report has delivered a stronger-than-expected surprise, adding a new dimension to market expectations.
October Jobs Report:
• Nonfarm Payrolls: +165,000 (vs. 65,000 expected)
• Unemployment Rate: 4.1% (down from 4.2%)
• September job gains were also revised higher.
At first glance, stronger employment signals economic resilience. However, there's another side to consider.
A stronger labor market could reduce the Federal Reserve's urgency to ease monetary policy or increase expectations of tighter policy. Higher interest-rate expectations can put pressure on growth stocks, particularly technology shares.
What happens next?
A stable economic outlook could help restore investor confidence.
Changing Fed rate expectations may keep volatility elevated.
Technology stocks and Treasury yields will remain important indicators to watch.
The key question is whether investors interpret stronger employment as economic strength or a reason to worry about interest rates.
What's your outlook for US equities?
1. Strong recovery
2. Sideways consolidation
3. Further correction
Share your market perspective below!
#USStocks #NonfarmPayrolls #FederalReserve #BinanceSquareTalks #CryptoMarket
55

·
--
Bullish
#crytoma🚨 US Stocks Slip as Crypto Market Faces Broad Pressure!
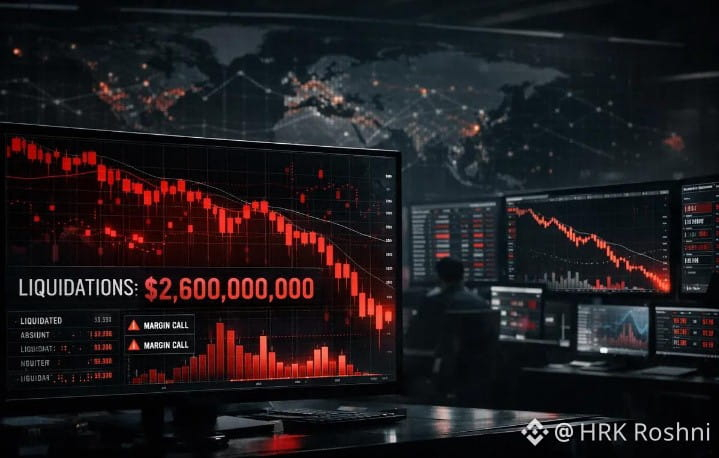
The global financial market is experiencing a major sell-off.
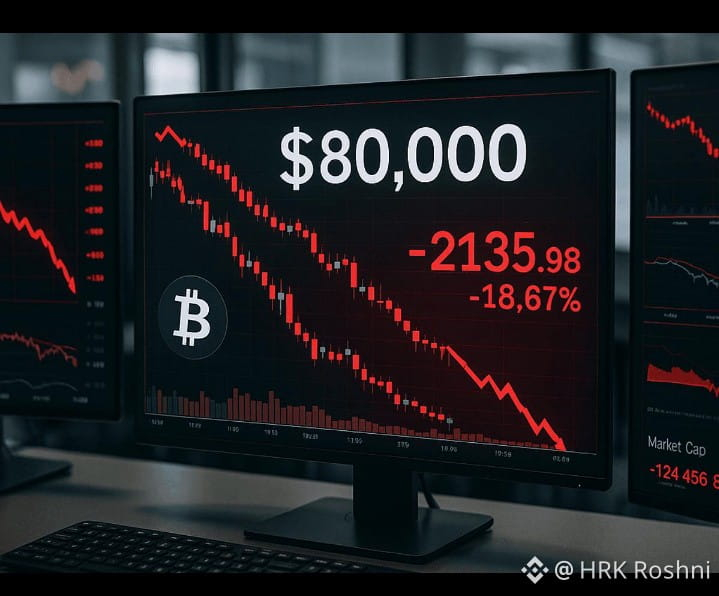
US stocks declined sharply, while $BITCOIN , Ethereum and other major cryptocurrencies also faced heavy selling pressure.
What's happening?
📉 Nasdaq dropped 5.5%.
📉 S&P 500 fell around 4.4%.
📉 $BITCOIN moved towards $76,000.
📉$ETH lost around 7.7%.
Main Reasons:
- Growing concerns about AI regulations.
- Heavy selling in technology stocks.
- Weak investor confidence.
- Massive crypto liquidations.
What's Next?
Investors are watching Bitcoin's recovery and the US economic data for the next market direction.
Will crypto recover, or is more downside ahead?
Share your thoughts! 👇
#CrytoMarketWatch #USStocks #BTC #ETH #BinanceSquare
{spot}(BTCUSDT)
{spot}(ETHUSDT)
{spot}(DOGEUSDT)
#crytoma🚨 US Stocks Slip as Crypto Market Faces Broad Pressure!
The global financial market is experiencing a major sell-off.
US stocks declined sharply, while $BITCOIN , Ethereum and other major cryptocurrencies also faced heavy selling pressure.
What's happening?
📉 Nasdaq dropped 5.5%.
📉 S&P 500 fell around 4.4%.
📉 $BITCOIN moved towards $76,000.
📉$ETH lost around 7.7%.
Main Reasons:
- Growing concerns about AI regulations.
- Heavy selling in technology stocks.
- Weak investor confidence.
- Massive crypto liquidations.
What's Next?
Investors are watching Bitcoin's recovery and the US economic data for the next market direction.
Will crypto recover, or is more downside ahead?
Share your thoughts! 👇
#CrytoMarketWatch #USStocks #BTC #ETH #BinanceSquare
The global financial market is experiencing a major sell-off.
US stocks declined sharply, while $BITCOIN , Ethereum and other major cryptocurrencies also faced heavy selling pressure.
What's happening?
📉 Nasdaq dropped 5.5%.
📉 S&P 500 fell around 4.4%.
📉 $BITCOIN moved towards $76,000.
📉$ETH lost around 7.7%.
Main Reasons:
- Growing concerns about AI regulations.
- Heavy selling in technology stocks.
- Weak investor confidence.
- Massive crypto liquidations.
What's Next?
Investors are watching Bitcoin's recovery and the US economic data for the next market direction.
Will crypto recover, or is more downside ahead?
Share your thoughts! 👇
#CrytoMarketWatch #USStocks #BTC #ETH #BinanceSquare


1
62

·
--
#canusstocksreboundafternonfarmpayrolls?
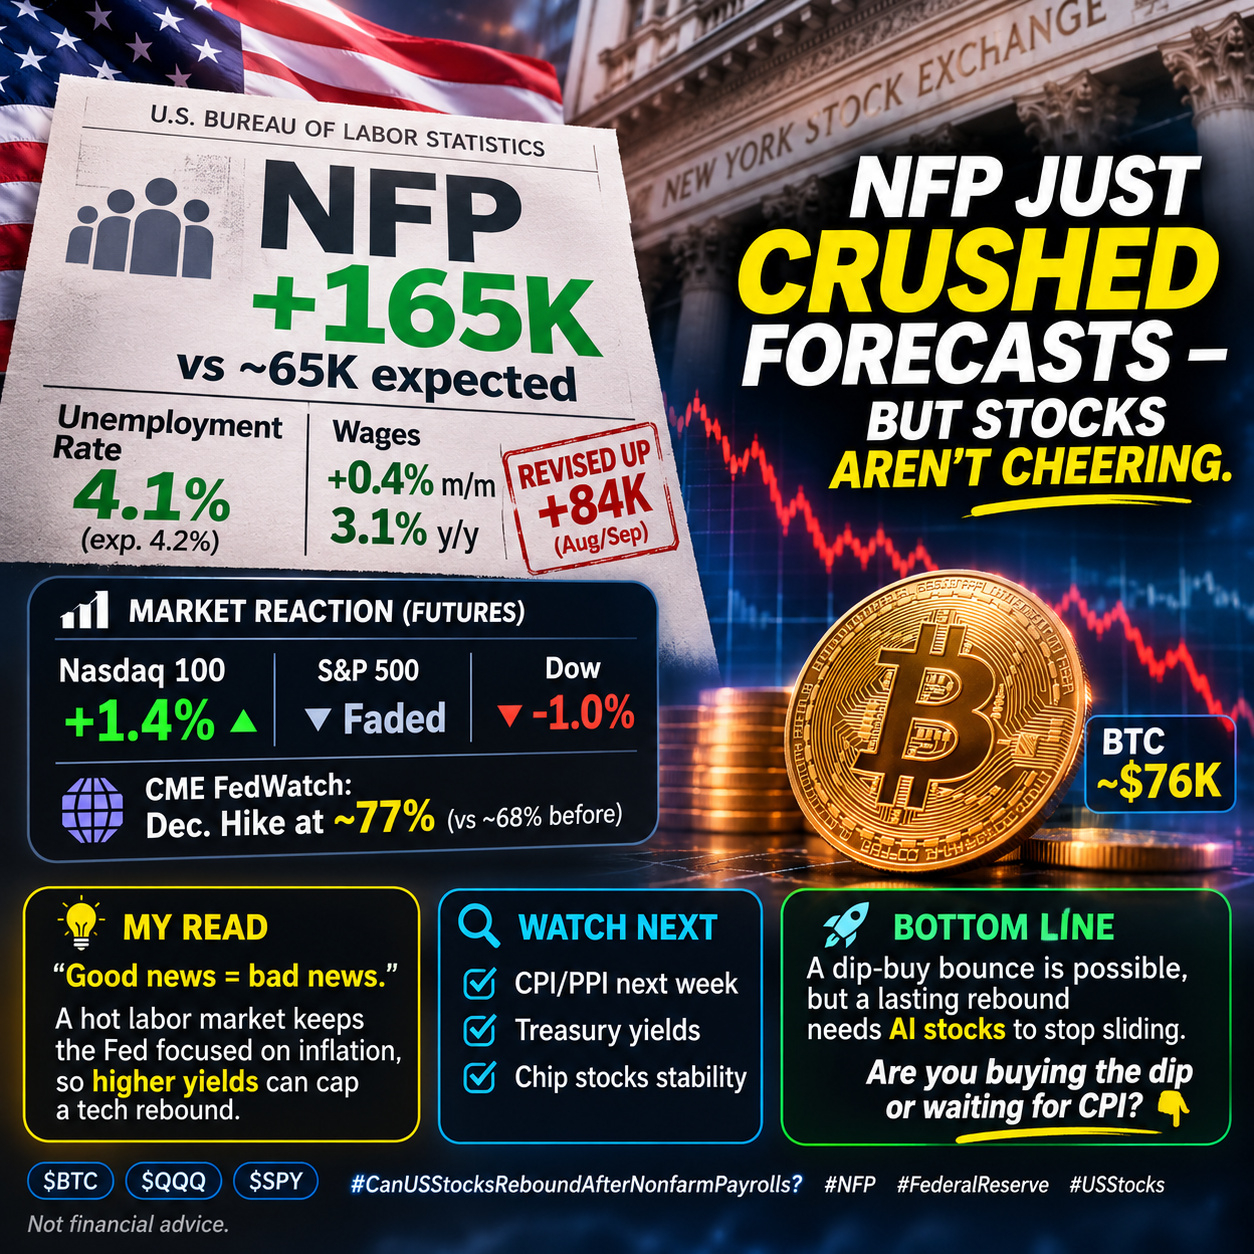
📊 NFP just crushed forecasts — but stocks aren't cheering.
October payrolls: +165K vs ~65K expected (Reuters poll). Unemployment fell to 4.1% (exp. 4.2%). Wages +0.4% m/m, 3.1% y/y. Aug/Sep were revised up by a combined 84K.
⚡ Market reaction: Nasdaq 100 futures held a ~1.4% gain, S&P futures faded, Dow futures fell ~1%. CME FedWatch put a December hike at ~77%, up from ~68% before the data.
🧠 My read: it's "good news = bad news." Thursday's Nasdaq -5.5% rout was about AI/data-center fears, not jobs. A hot labor market keeps the Fed focused on inflation, so higher yields can cap a tech rebound.
₿ For crypto: BTC hovered near $76K after the print, so macro still drives the tape.
🔎 Watch next: CPI/PPI next week, Treasury yields, and whether chip stocks stabilize.
Bottom line: a dip-buy bounce is possible, but a lasting rebound needs AI stocks to stop sliding. Are you buying the dip or waiting for CPI? 👇
$BTC
{future}(BTCUSDT)
$QQQ
{spot}(QQQBUSDT)
$SPYB
{spot}(SPYBUSDT)
#NFP #FederalReserve #USStocks
Not financial advice.
#canusstocksreboundafternonfarmpayrolls?
📊 NFP just crushed forecasts — but stocks aren't cheering.
October payrolls: +165K vs ~65K expected (Reuters poll). Unemployment fell to 4.1% (exp. 4.2%). Wages +0.4% m/m, 3.1% y/y. Aug/Sep were revised up by a combined 84K.
⚡ Market reaction: Nasdaq 100 futures held a ~1.4% gain, S&P futures faded, Dow futures fell ~1%. CME FedWatch put a December hike at ~77%, up from ~68% before the data.
🧠 My read: it's "good news = bad news." Thursday's Nasdaq -5.5% rout was about AI/data-center fears, not jobs. A hot labor market keeps the Fed focused on inflation, so higher yields can cap a tech rebound.
₿ For crypto: BTC hovered near $76K after the print, so macro still drives the tape.
🔎 Watch next: CPI/PPI next week, Treasury yields, and whether chip stocks stabilize.
Bottom line: a dip-buy bounce is possible, but a lasting rebound needs AI stocks to stop sliding. Are you buying the dip or waiting for CPI? 👇
$BTC
$QQQ
$SPYB
#NFP #FederalReserve #USStocks
Not financial advice.
📊 NFP just crushed forecasts — but stocks aren't cheering.
October payrolls: +165K vs ~65K expected (Reuters poll). Unemployment fell to 4.1% (exp. 4.2%). Wages +0.4% m/m, 3.1% y/y. Aug/Sep were revised up by a combined 84K.
⚡ Market reaction: Nasdaq 100 futures held a ~1.4% gain, S&P futures faded, Dow futures fell ~1%. CME FedWatch put a December hike at ~77%, up from ~68% before the data.
🧠 My read: it's "good news = bad news." Thursday's Nasdaq -5.5% rout was about AI/data-center fears, not jobs. A hot labor market keeps the Fed focused on inflation, so higher yields can cap a tech rebound.
₿ For crypto: BTC hovered near $76K after the print, so macro still drives the tape.
🔎 Watch next: CPI/PPI next week, Treasury yields, and whether chip stocks stabilize.
Bottom line: a dip-buy bounce is possible, but a lasting rebound needs AI stocks to stop sliding. Are you buying the dip or waiting for CPI? 👇
$BTC
$QQQ
$SPYB
#NFP #FederalReserve #USStocks
Not financial advice.
340

·
--
Bullish
🚨 BREAKING: MASSIVE MONEY FLOWS INTO FINANCIAL MARKETS! 📈🔥
💰 **$1.3 TRILLION** added to the U.S. stock market today!
₿ **$134 BILLION** added to the crypto market since the midterm election results!
📊 Both traditional and crypto markets are attracting massive attention as investor sentiment shifts.
🚀 Is this the beginning of another major bull run, or just a temporary market rally?
#CryptoMarket #Bitcoin #BTC #USStocks #BullRun #Market_Update #USMidterms-WhatAreMarketsExpecting? #Write2Earn
I can also help turn these market updates into a consistent Binance Square breaking-news series.
🚨 BREAKING: MASSIVE MONEY FLOWS INTO FINANCIAL MARKETS! 📈🔥
💰 **$1.3 TRILLION** added to the U.S. stock market today!
₿ **$134 BILLION** added to the crypto market since the midterm election results!
📊 Both traditional and crypto markets are attracting massive attention as investor sentiment shifts.
🚀 Is this the beginning of another major bull run, or just a temporary market rally?
#CryptoMarket #Bitcoin #BTC #USStocks #BullRun #Market_Update #USMidterms-WhatAreMarketsExpecting? #Write2Earn
I can also help turn these market updates into a consistent Binance Square breaking-news series.
💰 **$1.3 TRILLION** added to the U.S. stock market today!
₿ **$134 BILLION** added to the crypto market since the midterm election results!
📊 Both traditional and crypto markets are attracting massive attention as investor sentiment shifts.
🚀 Is this the beginning of another major bull run, or just a temporary market rally?
#CryptoMarket #Bitcoin #BTC #USStocks #BullRun #Market_Update #USMidterms-WhatAreMarketsExpecting? #Write2Earn
I can also help turn these market updates into a consistent Binance Square breaking-news series.

1
15

·
--
Bearish
🚨 🇺🇸 WALL STREET SHOCK
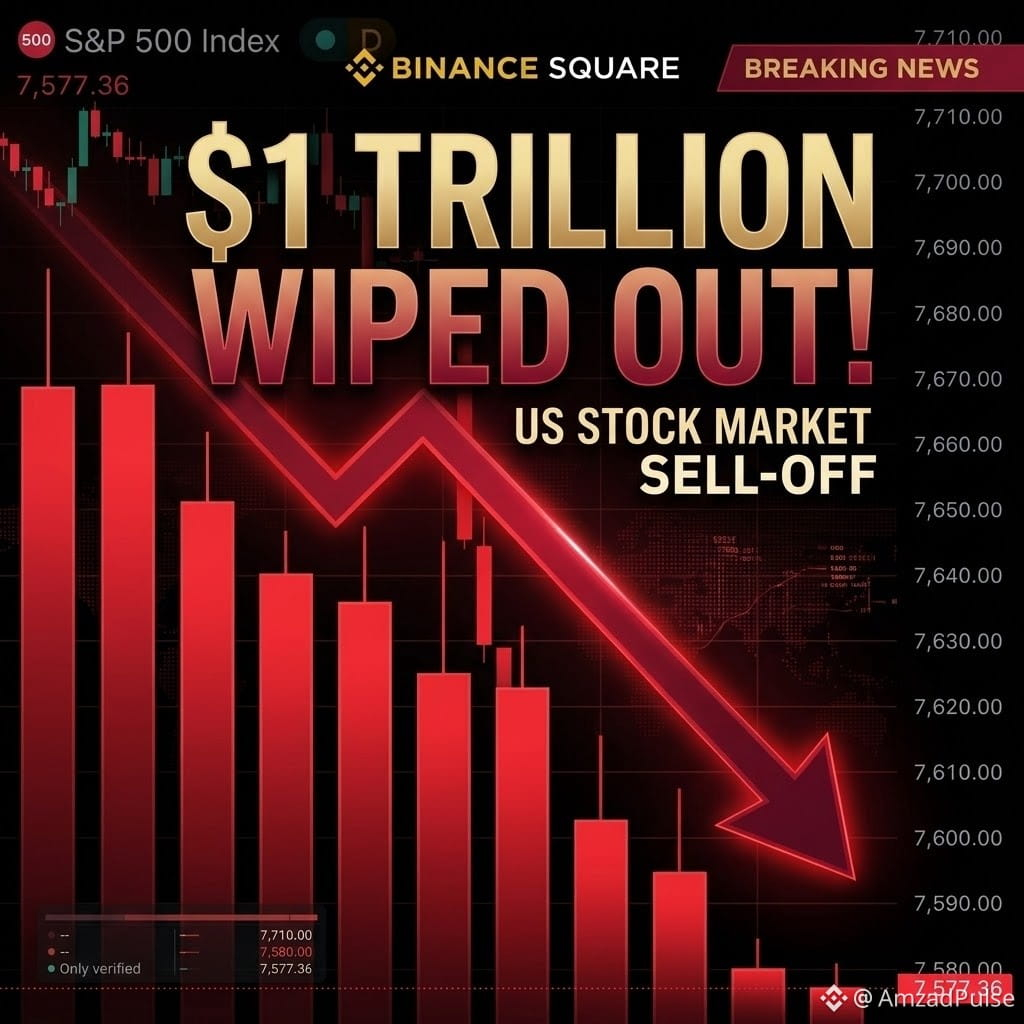
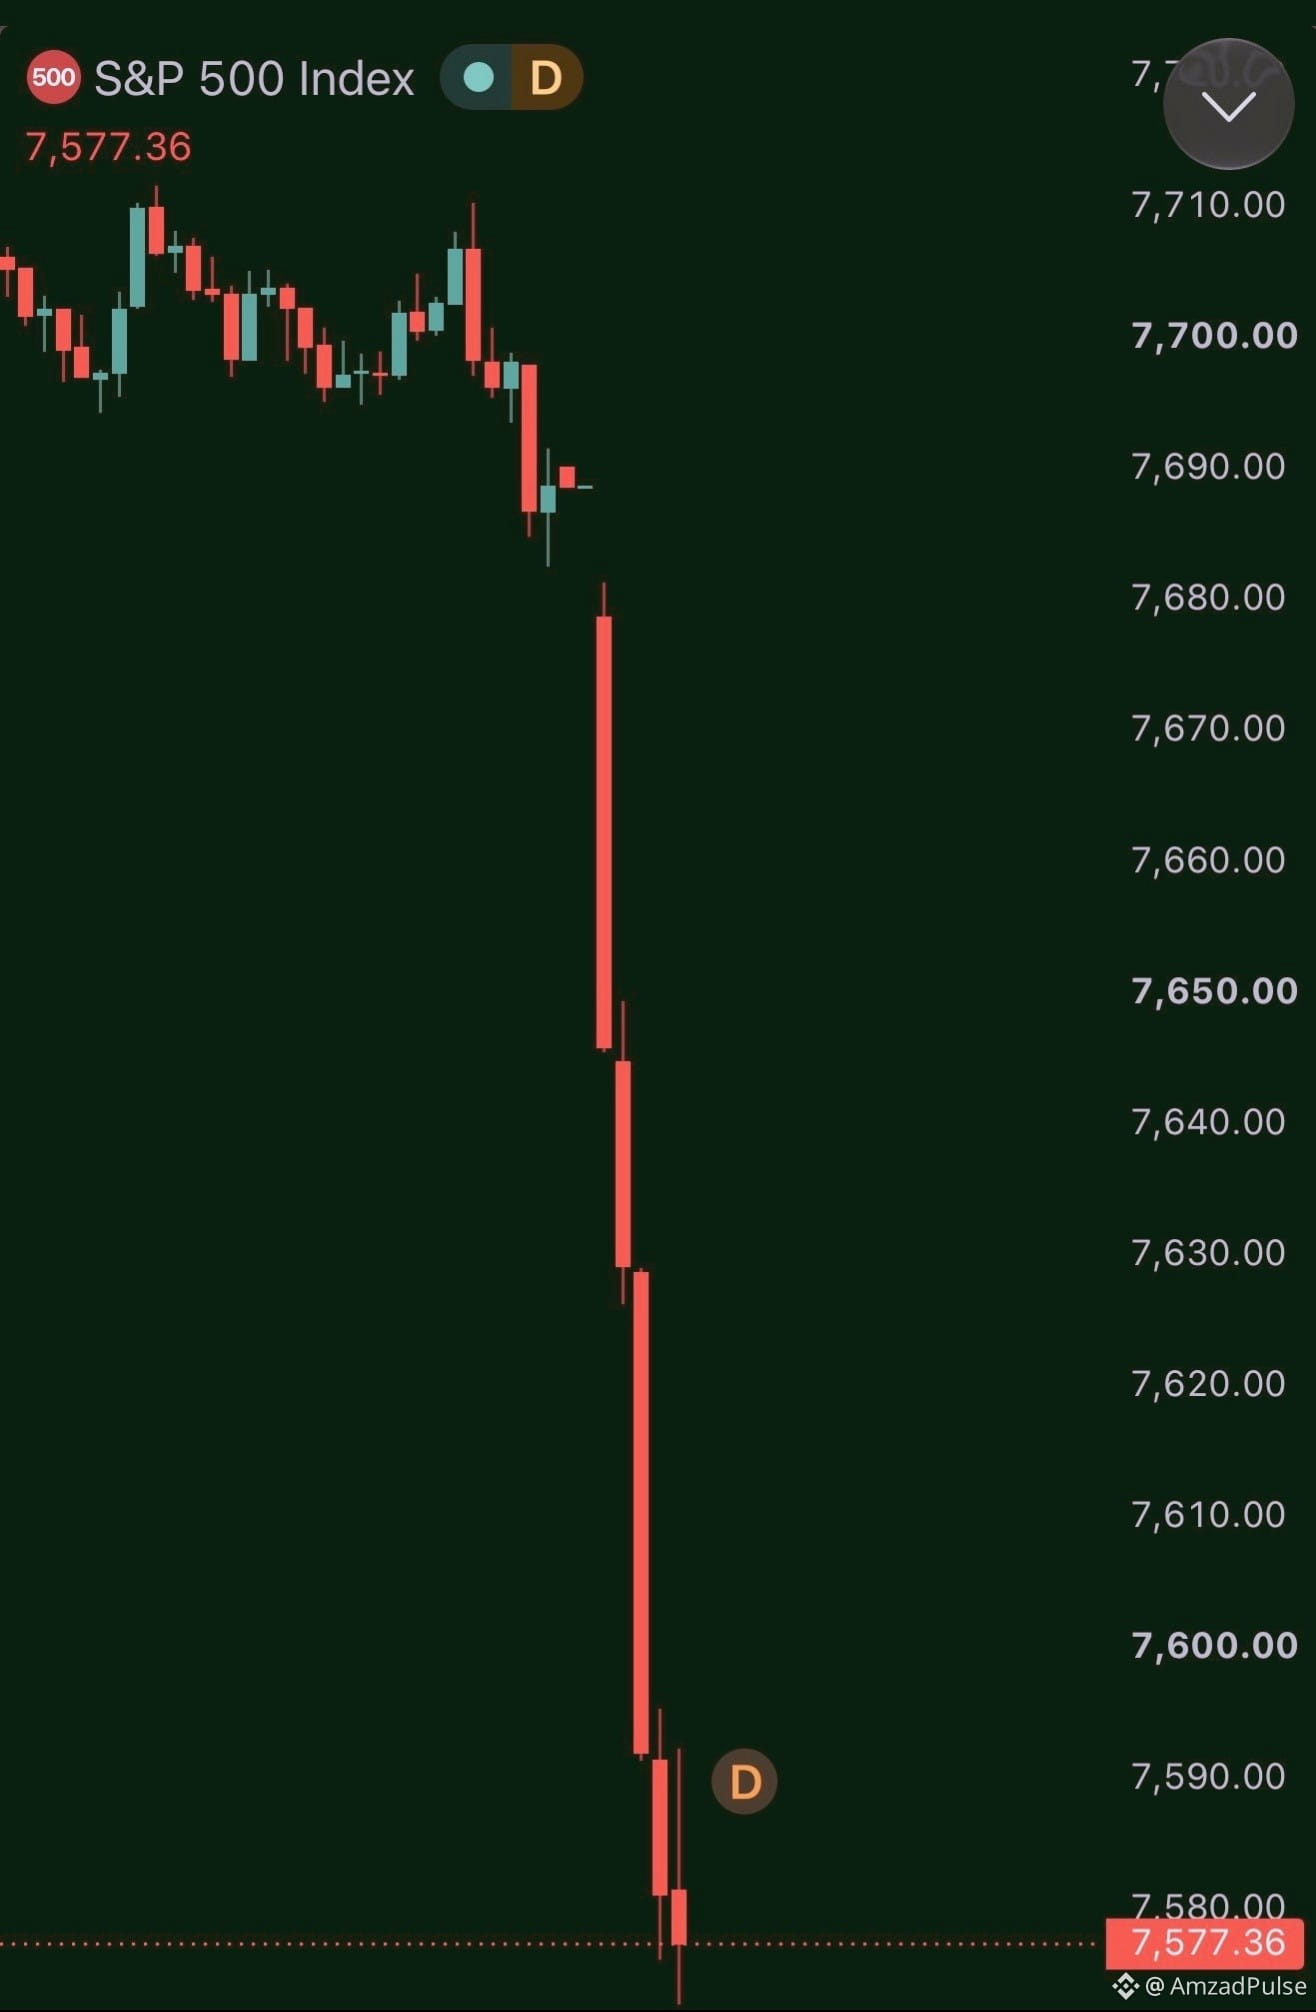
Over $1 TRILLION in market value reportedly wiped out from US stocks at the opening bell 📉
Is a bigger market sell off coming? 👀
#USStocks #WallStreet #Bitcoin #crypto
🚨 🇺🇸 WALL STREET SHOCK
Over $1 TRILLION in market value reportedly wiped out from US stocks at the opening bell 📉
Is a bigger market sell off coming? 👀
#USStocks #WallStreet #Bitcoin #crypto
Over $1 TRILLION in market value reportedly wiped out from US stocks at the opening bell 📉
Is a bigger market sell off coming? 👀
#USStocks #WallStreet #Bitcoin #crypto
1
60

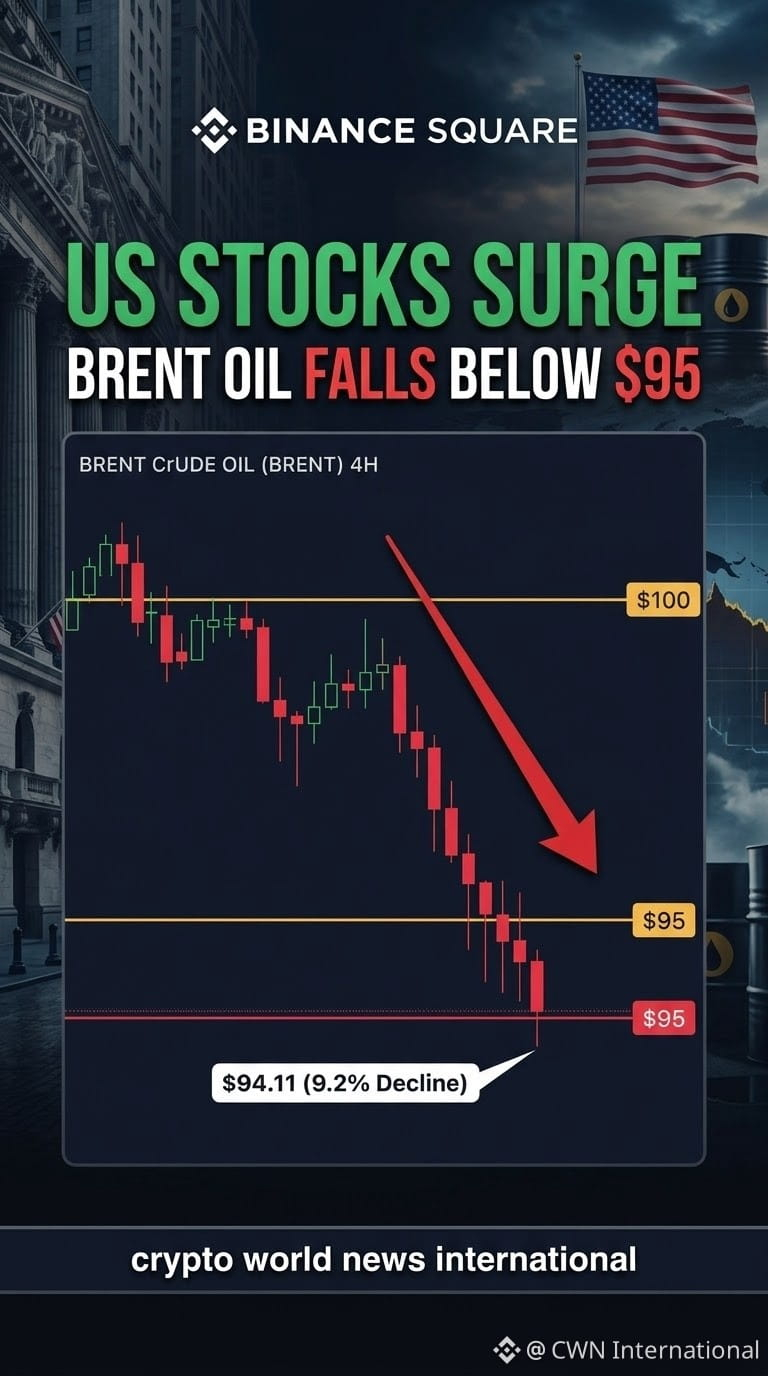
Headline: US Stocks Surge as Brent Oil Falls Below $95
Summary
U.S. stocks rallied after Democrats secured control of both chambers of Congress in the 2026 midterm elections. Meanwhile, Brent crude fell below $95 per barrel, as rising gasoline prices and declining approval ratings put pressure on President Donald Trump.
Key Points
- Stocks Surge: The S&P 500 gained 1.8%, Nasdaq rose 2.1%, and Dow Jones jumped 1,524 points, or 2.9%.
- Oil Drops: Brent crude fell 9.2% to $94.11 per barrel, its first move below $100 in nearly a month.
- Political Shift: Democrats won control of the Senate and House, raising expectations of legislative gridlock.
- Economic Pressure: High gasoline prices linked to the Iran conflict have weighed on Trump's approval ratings.
- Market Reaction: Solar, healthcare and discount retail stocks advanced, while oil and defense shares declined.
Market Insight
Investors are watching how the new political landscape will affect economic policy, energy prices and inflation. Lower oil prices could ease inflationary pressure, but sustained market gains will depend on corporate earnings, geopolitical developments and Federal Reserve decisions.
Conclusion
The 2026 midterm elections have reshaped Washington and triggered a strong initial market reaction. Investors are now watching whether political change and lower oil prices can support lasting economic stability.
#USStocks #BrentOil #USMidterms #WallStreet #CryptoMarket $CL $BZ
{future}(BZUSDT)
{future}(CLUSDT)
Headline: US Stocks Surge as Brent Oil Falls Below $95
Summary
U.S. stocks rallied after Democrats secured control of both chambers of Congress in the 2026 midterm elections. Meanwhile, Brent crude fell below $95 per barrel, as rising gasoline prices and declining approval ratings put pressure on President Donald Trump.
Key Points
- Stocks Surge: The S&P 500 gained 1.8%, Nasdaq rose 2.1%, and Dow Jones jumped 1,524 points, or 2.9%.
- Oil Drops: Brent crude fell 9.2% to $94.11 per barrel, its first move below $100 in nearly a month.
- Political Shift: Democrats won control of the Senate and House, raising expectations of legislative gridlock.
- Economic Pressure: High gasoline prices linked to the Iran conflict have weighed on Trump's approval ratings.
- Market Reaction: Solar, healthcare and discount retail stocks advanced, while oil and defense shares declined.
Market Insight
Investors are watching how the new political landscape will affect economic policy, energy prices and inflation. Lower oil prices could ease inflationary pressure, but sustained market gains will depend on corporate earnings, geopolitical developments and Federal Reserve decisions.
Conclusion
The 2026 midterm elections have reshaped Washington and triggered a strong initial market reaction. Investors are now watching whether political change and lower oil prices can support lasting economic stability.
#USStocks #BrentOil #USMidterms #WallStreet #CryptoMarket $CL $BZ
Summary
U.S. stocks rallied after Democrats secured control of both chambers of Congress in the 2026 midterm elections. Meanwhile, Brent crude fell below $95 per barrel, as rising gasoline prices and declining approval ratings put pressure on President Donald Trump.
Key Points
- Stocks Surge: The S&P 500 gained 1.8%, Nasdaq rose 2.1%, and Dow Jones jumped 1,524 points, or 2.9%.
- Oil Drops: Brent crude fell 9.2% to $94.11 per barrel, its first move below $100 in nearly a month.
- Political Shift: Democrats won control of the Senate and House, raising expectations of legislative gridlock.
- Economic Pressure: High gasoline prices linked to the Iran conflict have weighed on Trump's approval ratings.
- Market Reaction: Solar, healthcare and discount retail stocks advanced, while oil and defense shares declined.
Market Insight
Investors are watching how the new political landscape will affect economic policy, energy prices and inflation. Lower oil prices could ease inflationary pressure, but sustained market gains will depend on corporate earnings, geopolitical developments and Federal Reserve decisions.
Conclusion
The 2026 midterm elections have reshaped Washington and triggered a strong initial market reaction. Investors are now watching whether political change and lower oil prices can support lasting economic stability.
#USStocks #BrentOil #USMidterms #WallStreet #CryptoMarket $CL $BZ
565


·
--
Bullish
Partly True
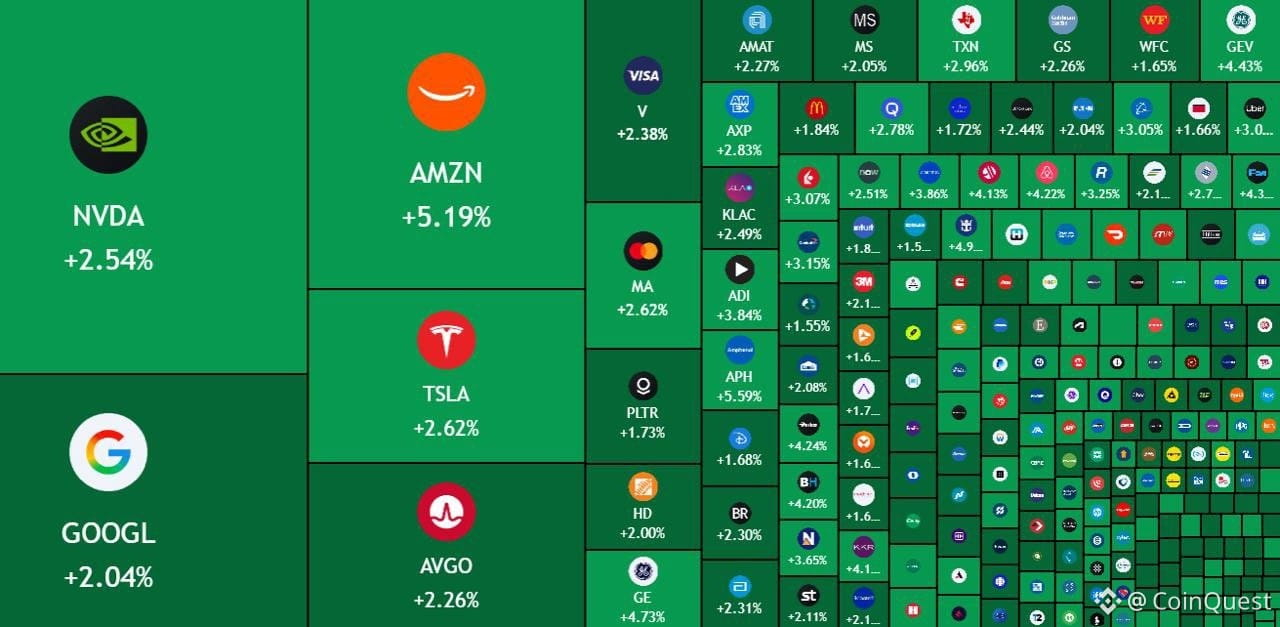
🚨 $820 BILLION BACK INTO US STOCKS… WALL STREET IS STARTING TO BOUNCE BACK! 📈
After Friday's brutal selloff, investors are suddenly feeling more confident.Are they buying opportunity ?
US-Iran deal hopes are pushing oil lower, but what if this deal got confirmation ? US Stocks will do bounce back asap.
MY Picks to accumulate :
- $NVDA – AI infrastructure
- $GOOGL – AI + cloud growth
- $AMZN – AWS & AI expansion
- $SNDK – AI storage demand
Are you buying this recovery or waiting for another dip?
#USStocks
🚨 $820 BILLION BACK INTO US STOCKS… WALL STREET IS STARTING TO BOUNCE BACK! 📈
After Friday's brutal selloff, investors are suddenly feeling more confident.Are they buying opportunity ?
US-Iran deal hopes are pushing oil lower, but what if this deal got confirmation ? US Stocks will do bounce back asap.
MY Picks to accumulate :
- $NVDA – AI infrastructure
- $GOOGL – AI + cloud growth
- $AMZN – AWS & AI expansion
- $SNDK – AI storage demand
Are you buying this recovery or waiting for another dip?
#USStocks
After Friday's brutal selloff, investors are suddenly feeling more confident.Are they buying opportunity ?
US-Iran deal hopes are pushing oil lower, but what if this deal got confirmation ? US Stocks will do bounce back asap.
MY Picks to accumulate :
- $NVDA – AI infrastructure
- $GOOGL – AI + cloud growth
- $AMZN – AWS & AI expansion
- $SNDK – AI storage demand
Are you buying this recovery or waiting for another dip?
#USStocks
Red Zone 07:
Follow me 🙏
1
8
7.1k

·
--
Bearish
Verified
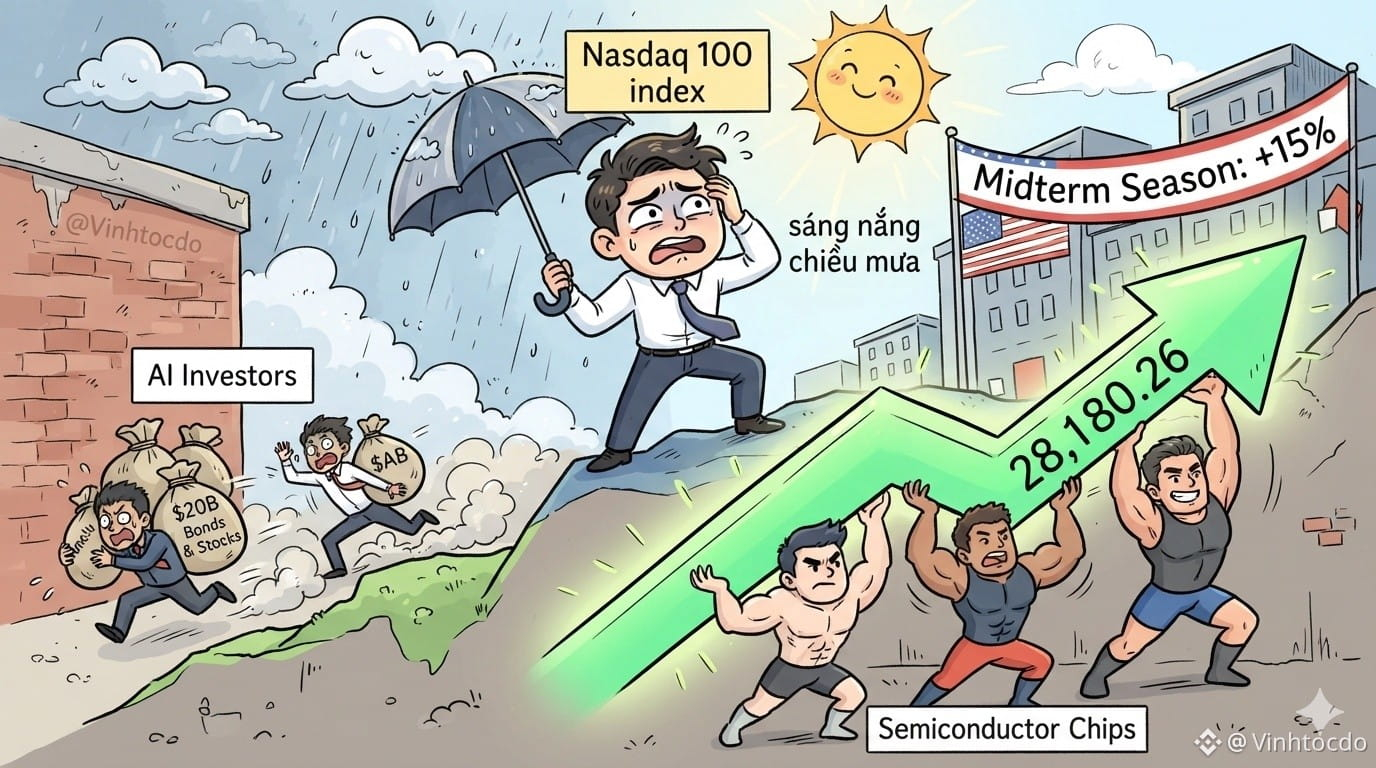
Nasdaq 100 has been a real "sunny in the morning, rainy in the afternoon" lately: it gave the whole tech sector a scare with a sharp drop, then turned slightly green the next day as semiconductor stocks shouldered the burden and lifted the index back to 28,180.26 points.
AI investors hear that Oracle plans to sell $20 billion worth of stocks and bonds to fund infrastructure, and they run for the hills—dragging chip stocks down with them. Funny thing is, every time the U.S. holds midterm elections, historical S&P 500 data shows an average gain of 15–16% over the following six months. Politics may make your blood pressure drop, but seasonal trends come to a trader's rescue!
What should traders do? Don't rush for the exits. Get ready to take a small position and wait for a year-end rebound, folks.
This is not financial advice. Sign up for a new account: [cf-workers-proxy-cyt.pages.dev/register?ref=VINHTOCDO](https://www.binance.com/register?ref=VINHTOCDO) (Code: VINHTOCDO).
Click the trades below to support me:
$BTC
{spot}(BTCUSDT)
$ETH
{spot}(ETHUSDT)
$BNB
{spot}(BNBUSDT)
#Nasdaq100EntersCorrection #USStocks #TechStocks #StockMarket #Trading #VINHTOCDO
Nasdaq 100 has been a real "sunny in the morning, rainy in the afternoon" lately: it gave the whole tech sector a scare with a sharp drop, then turned slightly green the next day as semiconductor stocks shouldered the burden and lifted the index back to 28,180.26 points.
AI investors hear that Oracle plans to sell $20 billion worth of stocks and bonds to fund infrastructure, and they run for the hills—dragging chip stocks down with them. Funny thing is, every time the U.S. holds midterm elections, historical S&P 500 data shows an average gain of 15–16% over the following six months. Politics may make your blood pressure drop, but seasonal trends come to a trader's rescue!
What should traders do? Don't rush for the exits. Get ready to take a small position and wait for a year-end rebound, folks.
This is not financial advice. Sign up for a new account: cf-workers-proxy-cyt.pages.dev/register?ref=VINHTOCDO (Code: VINHTOCDO).
Click the trades below to support me:
$BTC
$ETH
$BNB
#Nasdaq100EntersCorrection #USStocks #TechStocks #StockMarket #Trading #VINHTOCDO
AI investors hear that Oracle plans to sell $20 billion worth of stocks and bonds to fund infrastructure, and they run for the hills—dragging chip stocks down with them. Funny thing is, every time the U.S. holds midterm elections, historical S&P 500 data shows an average gain of 15–16% over the following six months. Politics may make your blood pressure drop, but seasonal trends come to a trader's rescue!
What should traders do? Don't rush for the exits. Get ready to take a small position and wait for a year-end rebound, folks.
This is not financial advice. Sign up for a new account: cf-workers-proxy-cyt.pages.dev/register?ref=VINHTOCDO (Code: VINHTOCDO).
Click the trades below to support me:
$BTC
$ETH
$BNB
#Nasdaq100EntersCorrection #USStocks #TechStocks #StockMarket #Trading #VINHTOCDO
1
299

·
--
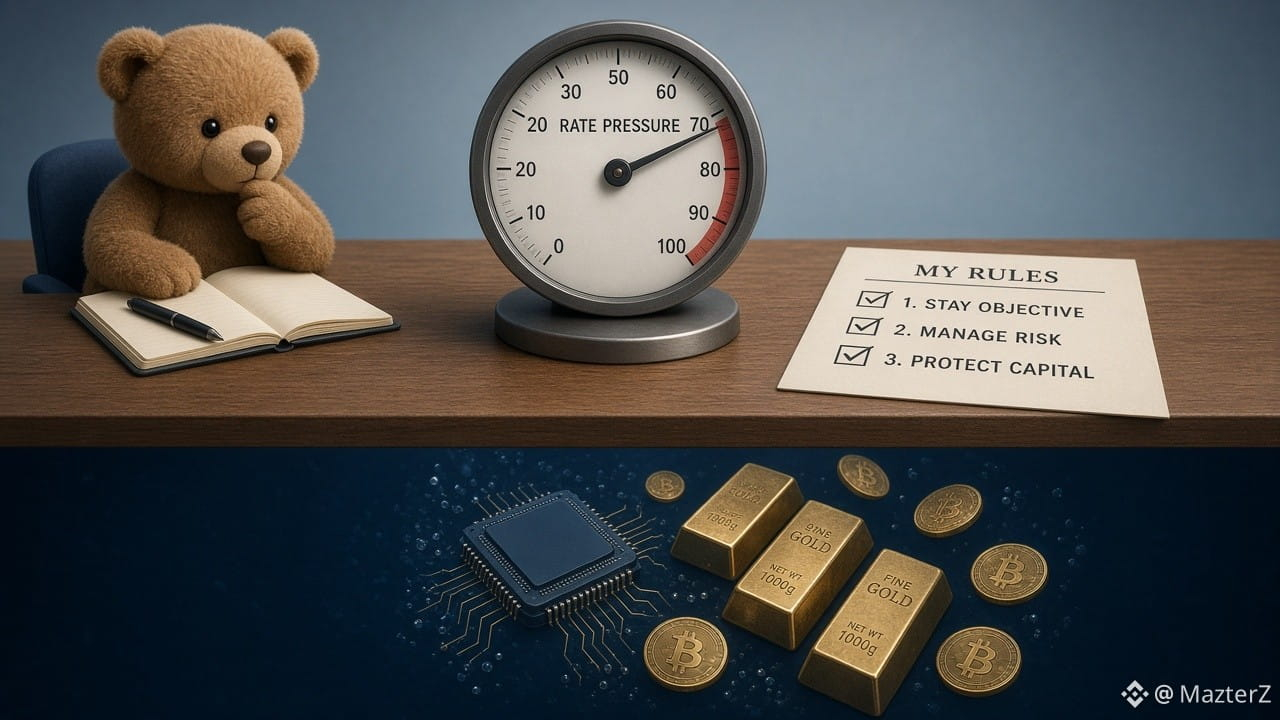
Tech stocks, gold and BTC sold off together: AI earnings lit the fuse, rates are the pressure
On 10/30 (US Eastern), three "hedges" fell at once. Nasdaq Composite -2.9% to 25,437, Nasdaq 100 -3.5%, S&P 500 -1.8%. The Composite lost 5.3% in October, its worst month since March 2025.
Chips were hit hardest. Intel guided Q4 revenue to $15–16B, below expectations, and fell 28.58% to $65.76. AMD -10.9%, SOXX -8%+.
Safe havens didn't catch it. Spot gold briefly hit ~$3,881, lowest since October 2025. BTC sat near $77,000, also weighed by Binance's $6.3B security incident, down ~7%–8% in October, its worst October since 2014. As of 10/30 evening, crypto 24h liquidations were ~$1.5B.
To me this is deleveraging and raising cash, not a verdict on one sector. AI earnings were the trigger; rates are the backdrop. CME FedWatch: December hike odds ~72% (10/30 close). 10/29 close: WTI ~$102, Brent ~$114.88. US 10Y yield near 5%. Assets priced on future stories get repriced.
Watching:
1. December hike odds
2. WTI back below $100?
3. Chip guidance after Intel
This week: ISM PMI 11/2, US midterms 11/3, NFP 11/6. DST ends 11/1, so US hours become 22:30–05:00 Taipei time.
Instead of guessing the AI bottom, write public rules. E.g. re-evaluate chips or BTC only after December hike odds drop below 50% and WTI breaks $95.
OWL (@OfficialOwl_AI) is a decentralized portfolio strategy platform covering US stocks, ETFs, crypto assets and commodities, built on ERC-4626 vaults. Creators turn their allocation views into public, trackable on-chain strategies: under what conditions to add and under what conditions to trim can all be checked after the fact. You can Follow creators you're interested in and Star their strategies before deciding whether to Subscribe.
OWL website 👉 https://dapp.owlowl.ai/
V2 Demo 👉 https://teny.ai/
Rates first, or AI earnings?
#USStocks #AI #Macro
Tech stocks, gold and BTC sold off together: AI earnings lit the fuse, rates are the pressure
On 10/30 (US Eastern), three "hedges" fell at once. Nasdaq Composite -2.9% to 25,437, Nasdaq 100 -3.5%, S&P 500 -1.8%. The Composite lost 5.3% in October, its worst month since March 2025.
Chips were hit hardest. Intel guided Q4 revenue to $15–16B, below expectations, and fell 28.58% to $65.76. AMD -10.9%, SOXX -8%+.
Safe havens didn't catch it. Spot gold briefly hit ~$3,881, lowest since October 2025. BTC sat near $77,000, also weighed by Binance's $6.3B security incident, down ~7%–8% in October, its worst October since 2014. As of 10/30 evening, crypto 24h liquidations were ~$1.5B.
To me this is deleveraging and raising cash, not a verdict on one sector. AI earnings were the trigger; rates are the backdrop. CME FedWatch: December hike odds ~72% (10/30 close). 10/29 close: WTI ~$102, Brent ~$114.88. US 10Y yield near 5%. Assets priced on future stories get repriced.
Watching:
1. December hike odds
2. WTI back below $100?
3. Chip guidance after Intel
This week: ISM PMI 11/2, US midterms 11/3, NFP 11/6. DST ends 11/1, so US hours become 22:30–05:00 Taipei time.
Instead of guessing the AI bottom, write public rules. E.g. re-evaluate chips or BTC only after December hike odds drop below 50% and WTI breaks $95.
OWL (@OfficialOwl_AI) is a decentralized portfolio strategy platform covering US stocks, ETFs, crypto assets and commodities, built on ERC-4626 vaults. Creators turn their allocation views into public, trackable on-chain strategies: under what conditions to add and under what conditions to trim can all be checked after the fact. You can Follow creators you're interested in and Star their strategies before deciding whether to Subscribe.
OWL website 👉 https://dapp.owlowl.ai/
V2 Demo 👉 https://teny.ai/
Rates first, or AI earnings?
#USStocks #AI #Macro
On 10/30 (US Eastern), three "hedges" fell at once. Nasdaq Composite -2.9% to 25,437, Nasdaq 100 -3.5%, S&P 500 -1.8%. The Composite lost 5.3% in October, its worst month since March 2025.
Chips were hit hardest. Intel guided Q4 revenue to $15–16B, below expectations, and fell 28.58% to $65.76. AMD -10.9%, SOXX -8%+.
Safe havens didn't catch it. Spot gold briefly hit ~$3,881, lowest since October 2025. BTC sat near $77,000, also weighed by Binance's $6.3B security incident, down ~7%–8% in October, its worst October since 2014. As of 10/30 evening, crypto 24h liquidations were ~$1.5B.
To me this is deleveraging and raising cash, not a verdict on one sector. AI earnings were the trigger; rates are the backdrop. CME FedWatch: December hike odds ~72% (10/30 close). 10/29 close: WTI ~$102, Brent ~$114.88. US 10Y yield near 5%. Assets priced on future stories get repriced.
Watching:
1. December hike odds
2. WTI back below $100?
3. Chip guidance after Intel
This week: ISM PMI 11/2, US midterms 11/3, NFP 11/6. DST ends 11/1, so US hours become 22:30–05:00 Taipei time.
Instead of guessing the AI bottom, write public rules. E.g. re-evaluate chips or BTC only after December hike odds drop below 50% and WTI breaks $95.
OWL (@OfficialOwl_AI) is a decentralized portfolio strategy platform covering US stocks, ETFs, crypto assets and commodities, built on ERC-4626 vaults. Creators turn their allocation views into public, trackable on-chain strategies: under what conditions to add and under what conditions to trim can all be checked after the fact. You can Follow creators you're interested in and Star their strategies before deciding whether to Subscribe.
OWL website 👉 https://dapp.owlowl.ai/
V2 Demo 👉 https://teny.ai/
Rates first, or AI earnings?
#USStocks #AI #Macro
277

·
--
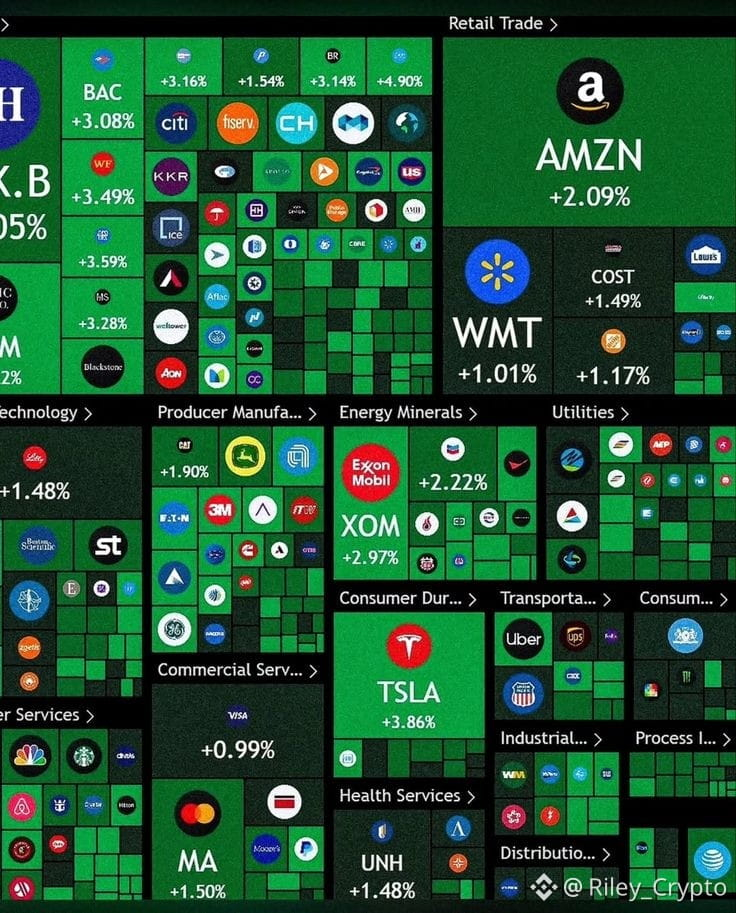
🚨 VIP MARKET ALERT: WALL STREET UNDER HEAVY PRESSURE! 🇺🇸
U.S. stocks faced a sharp premarket selloff, with technology shares leading the decline.
📉 What's driving the pressure?
- Amazon shares slide amid concerns over AI spending.
- Intel suffers a major decline after disappointing outlook.
- Nasdaq ad S&P 500 futures move lower.
🔍 Crypto Impact:
Weakness in U.S. equities could reduce risk appetite and put additional pressure on Bitcoin and altcoins.
💡 Masterclass Insight: Markets are shifting from AI excitement to demanding real profits and sustainable growth Is this a temporary correction or the start of a deeper market downturn?
$SPCXB $SNDKB $INTCB
{spot}(INTCBUSDT)
#WallStreet #USStocks #Bitcoin #CryptoMarket #AI
🚨 VIP MARKET ALERT: WALL STREET UNDER HEAVY PRESSURE! 🇺🇸
U.S. stocks faced a sharp premarket selloff, with technology shares leading the decline.
📉 What's driving the pressure?
- Amazon shares slide amid concerns over AI spending.
- Intel suffers a major decline after disappointing outlook.
- Nasdaq ad S&P 500 futures move lower.
🔍 Crypto Impact:
Weakness in U.S. equities could reduce risk appetite and put additional pressure on Bitcoin and altcoins.
💡 Masterclass Insight: Markets are shifting from AI excitement to demanding real profits and sustainable growth Is this a temporary correction or the start of a deeper market downturn?
$SPCXB $SNDKB $INTCB
#WallStreet #USStocks #Bitcoin #CryptoMarket #AI
U.S. stocks faced a sharp premarket selloff, with technology shares leading the decline.
📉 What's driving the pressure?
- Amazon shares slide amid concerns over AI spending.
- Intel suffers a major decline after disappointing outlook.
- Nasdaq ad S&P 500 futures move lower.
🔍 Crypto Impact:
Weakness in U.S. equities could reduce risk appetite and put additional pressure on Bitcoin and altcoins.
💡 Masterclass Insight: Markets are shifting from AI excitement to demanding real profits and sustainable growth Is this a temporary correction or the start of a deeper market downturn?
$SPCXB $SNDKB $INTCB
#WallStreet #USStocks #Bitcoin #CryptoMarket #AI
321

🚨 BARCLAYS TURNS MORE BULLISH ON TESLA! 🚗⚡
📈 $TSLA — Wall Street Gets More Optimistic!
Barclays has upgraded its outlook on Tesla, raising its price target by $80.
🟢 Rating: Equal Weight → Overweight
🎯 New Price Target: $450
💰 Previous Target: $370
📊 Target Increase: 21.6%
🔥 What’s driving the bullish outlook?
🔋 1. Vehicle Demand: Improving demand could support Tesla’s growth.
⚡ 2. Energy Business: Stronger momentum in Tesla’s energy sector adds another potential growth driver.
🚕 3. Robotaxi Expansion: Faster adoption of autonomous ride-hailing technology could open new opportunities.
🚀 4. The SpaceX Surprise: Potential benefits from a Tesla–SpaceX merger have also been raised as a speculative scenario, but no such merger has been officially announced.
👀 The big question: Can Tesla deliver on these growth expectations and justify the higher valuation?
📌 Follow for more stock market updates!
#TSLA #Tesla #USStocks #stockmarket #USmarket
🚨 BARCLAYS TURNS MORE BULLISH ON TESLA! 🚗⚡
📈 $TSLA — Wall Street Gets More Optimistic!
Barclays has upgraded its outlook on Tesla, raising its price target by $80.
🟢 Rating: Equal Weight → Overweight
🎯 New Price Target: $450
💰 Previous Target: $370
📊 Target Increase: 21.6%
🔥 What’s driving the bullish outlook?
🔋 1. Vehicle Demand: Improving demand could support Tesla’s growth.
⚡ 2. Energy Business: Stronger momentum in Tesla’s energy sector adds another potential growth driver.
🚕 3. Robotaxi Expansion: Faster adoption of autonomous ride-hailing technology could open new opportunities.
🚀 4. The SpaceX Surprise: Potential benefits from a Tesla–SpaceX merger have also been raised as a speculative scenario, but no such merger has been officially announced.
👀 The big question: Can Tesla deliver on these growth expectations and justify the higher valuation?
📌 Follow for more stock market updates!
#TSLA #Tesla #USStocks #stockmarket #USmarket
📈 $TSLA — Wall Street Gets More Optimistic!
Barclays has upgraded its outlook on Tesla, raising its price target by $80.
🟢 Rating: Equal Weight → Overweight
🎯 New Price Target: $450
💰 Previous Target: $370
📊 Target Increase: 21.6%
🔥 What’s driving the bullish outlook?
🔋 1. Vehicle Demand: Improving demand could support Tesla’s growth.
⚡ 2. Energy Business: Stronger momentum in Tesla’s energy sector adds another potential growth driver.
🚕 3. Robotaxi Expansion: Faster adoption of autonomous ride-hailing technology could open new opportunities.
🚀 4. The SpaceX Surprise: Potential benefits from a Tesla–SpaceX merger have also been raised as a speculative scenario, but no such merger has been officially announced.
👀 The big question: Can Tesla deliver on these growth expectations and justify the higher valuation?
📌 Follow for more stock market updates!
#TSLA #Tesla #USStocks #stockmarket #USmarket

157

⏫️🇺🇸 A Wall Street surprise!
U.S. stocks outside the AI sector have outperformed the S&P 500 since the start of the year.
😮 As of Thursday’s close:
📈 Index excluding AI stocks: +12.4%
📊 Main S&P 500 index: +12%
Has AI stocks’ dominance temporarily ended, with capital starting to rotate into other sectors?
Keep an eye on traditional stocks.
$SPCXB
#SP500
#USStocks #AIStocks #WallStreet $SPX
⏫️🇺🇸 A Wall Street surprise!
U.S. stocks outside the AI sector have outperformed the S&P 500 since the start of the year.
😮 As of Thursday’s close:
📈 Index excluding AI stocks: +12.4%
📊 Main S&P 500 index: +12%
Has AI stocks’ dominance temporarily ended, with capital starting to rotate into other sectors?
Keep an eye on traditional stocks.
$SPCXB
#SP500
#USStocks #AIStocks #WallStreet $SPX
U.S. stocks outside the AI sector have outperformed the S&P 500 since the start of the year.
😮 As of Thursday’s close:
📈 Index excluding AI stocks: +12.4%
📊 Main S&P 500 index: +12%
Has AI stocks’ dominance temporarily ended, with capital starting to rotate into other sectors?
Keep an eye on traditional stocks.
$SPCXB
#SP500
#USStocks #AIStocks #WallStreet $SPX
27

📉🔥 GLOBAL MARKETS UNDER PRESSURE
$XAU
$BTC
Global markets are facing a sharp sell-off, with more than $750 billion in market value wiped from U.S. stocks at the opening bell.
Technology stocks, AI companies, and major market players are taking significant losses, increasing investor concerns and market uncertainty.
⚠️ Volatility is rising as investor sentiment weakens. Traders are closely watching the next market moves.
📊 Stay informed. Manage risk carefully. Market conditions can change rapidly.
#StockMarket #USStocks #Nasdaq #TechStocks #AIStocks #MarketUpdate #Trading #Investing #MarketVolatility #Finance #Forex
📉🔥 GLOBAL MARKETS UNDER PRESSURE
$XAU
$BTC
Global markets are facing a sharp sell-off, with more than $750 billion in market value wiped from U.S. stocks at the opening bell.
Technology stocks, AI companies, and major market players are taking significant losses, increasing investor concerns and market uncertainty.
⚠️ Volatility is rising as investor sentiment weakens. Traders are closely watching the next market moves.
📊 Stay informed. Manage risk carefully. Market conditions can change rapidly.
#StockMarket #USStocks #Nasdaq #TechStocks #AIStocks #MarketUpdate #Trading #Investing #MarketVolatility #Finance #Forex
$XAU
$BTC
Global markets are facing a sharp sell-off, with more than $750 billion in market value wiped from U.S. stocks at the opening bell.
Technology stocks, AI companies, and major market players are taking significant losses, increasing investor concerns and market uncertainty.
⚠️ Volatility is rising as investor sentiment weakens. Traders are closely watching the next market moves.
📊 Stay informed. Manage risk carefully. Market conditions can change rapidly.
#StockMarket #USStocks #Nasdaq #TechStocks #AIStocks #MarketUpdate #Trading #Investing #MarketVolatility #Finance #Forex
176
·
--
Bearish
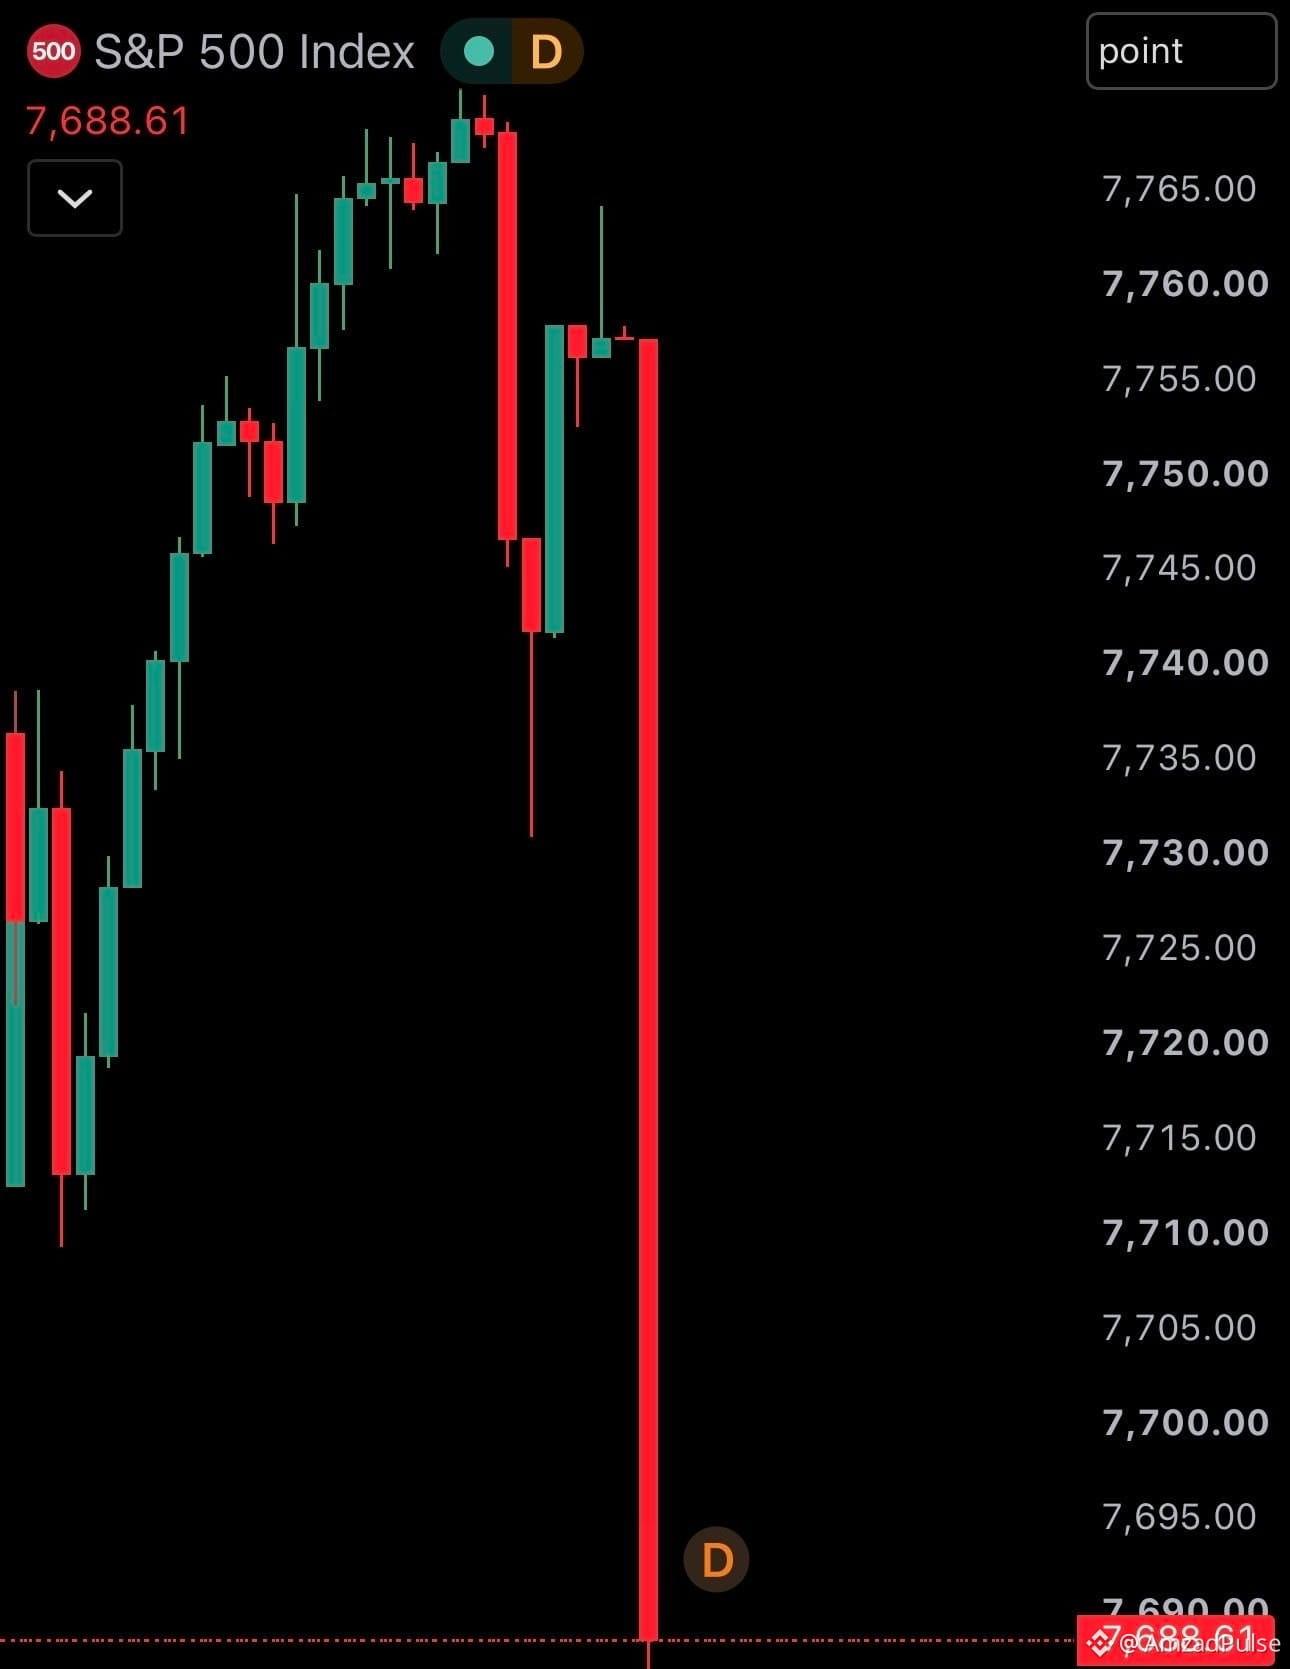
🇺🇸 $750B+ WIPED OUT FROM U.S. STOCK MARKET
Wall Street opened sharply lower as investors rushed to cut risk sending a major shock through U.S. equities.
#USStocks #WallStreet #Nasdaq #SP500 #MarketUpdate
🇺🇸 $750B+ WIPED OUT FROM U.S. STOCK MARKET
Wall Street opened sharply lower as investors rushed to cut risk sending a major shock through U.S. equities.
#USStocks #WallStreet #Nasdaq #SP500 #MarketUpdate
Wall Street opened sharply lower as investors rushed to cut risk sending a major shock through U.S. equities.
#USStocks #WallStreet #Nasdaq #SP500 #MarketUpdate
70

·
--
Bearish
*$SOXL SHORT SETUP - BIG WIN INCOMING! 📉🔥*
Guys listen carefully, this is it!
$SOXL is showing major weakness on top. Reversal is confirmed. I'm taking a big SHORT here, huge win is coming soon!
*My $SOXL Plan 👇*
🔴 *SHORT NOW*
🛑 *Stoploss: $99*
🎯 *Take Profit: $81*
Risk is small, reward is HUGE! Don't miss this move.
Who is shorting with me?
#SOXL #USStocks #TradingSetup
*$SOXL SHORT SETUP - BIG WIN INCOMING! 📉🔥*
Guys listen carefully, this is it!
$SOXL is showing major weakness on top. Reversal is confirmed. I'm taking a big SHORT here, huge win is coming soon!
*My $SOXL Plan 👇*
🔴 *SHORT NOW*
🛑 *Stoploss: $99*
🎯 *Take Profit: $81*
Risk is small, reward is HUGE! Don't miss this move.
Who is shorting with me?
#SOXL #USStocks #TradingSetup
Guys listen carefully, this is it!
$SOXL is showing major weakness on top. Reversal is confirmed. I'm taking a big SHORT here, huge win is coming soon!
*My $SOXL Plan 👇*
🔴 *SHORT NOW*
🛑 *Stoploss: $99*
🎯 *Take Profit: $81*
Risk is small, reward is HUGE! Don't miss this move.
Who is shorting with me?
#SOXL #USStocks #TradingSetup
50
Verified
#EarningsSeason
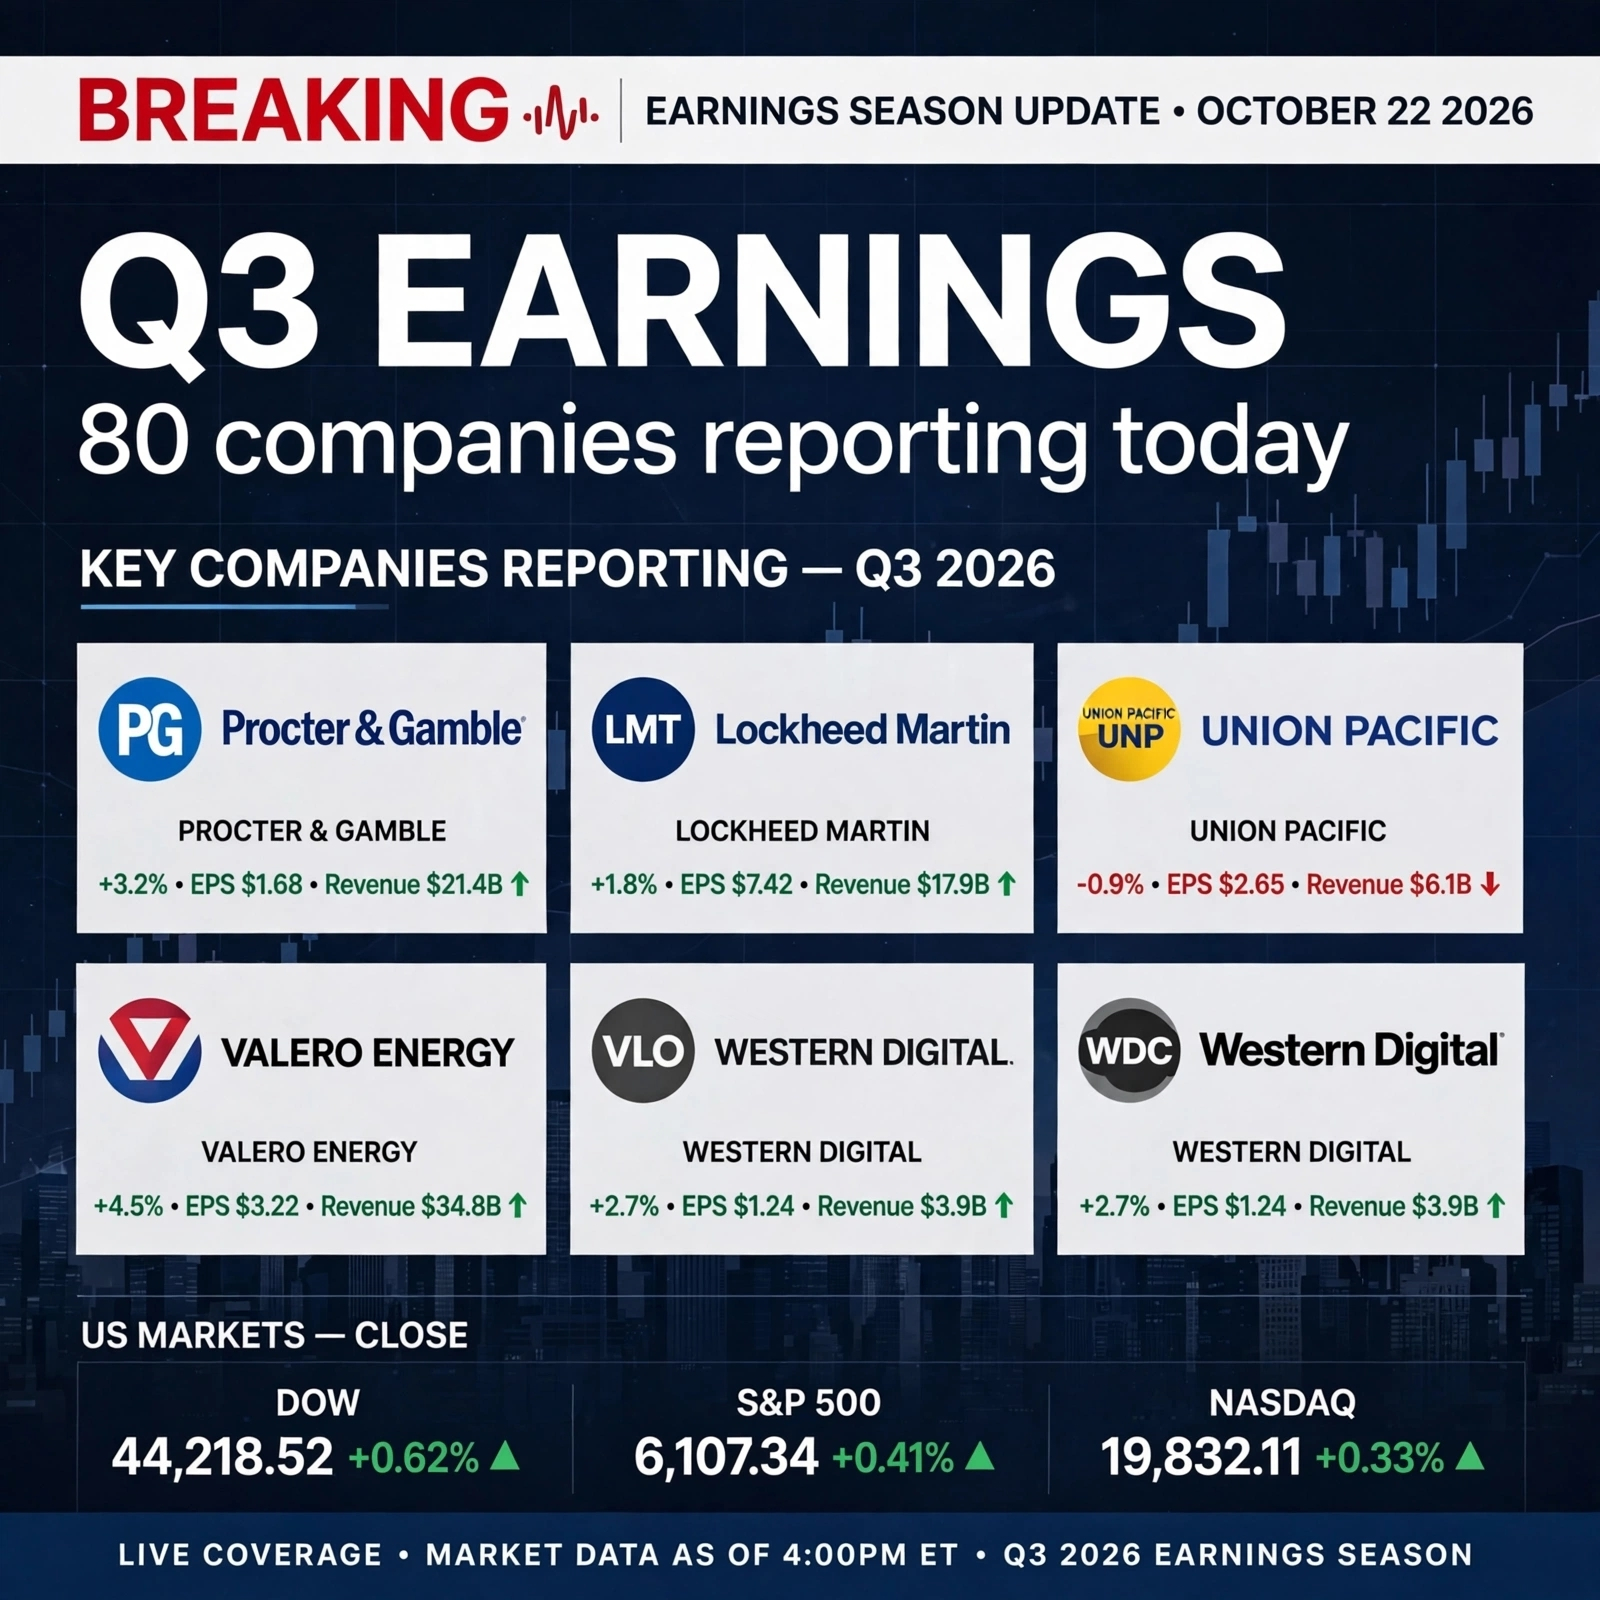
🚨 EARNINGS SEASON UPDATE: OCTOBER 22, 2026📊
🇺🇸 U.S. Q3 earnings season continues with around 80 companies scheduled to report today.
🔥 **Key companies to watch:**
• $PG — Procter & Gamble
• $LMT — Lockheed Martin
• $UNP — Union Pacific
• $VLO — Valero Energy
• $WDC — Western Digital
📈 Investors are watching corporate profits, revenue growth, and forward guidance to assess the strength of the U.S. economy.
🤖 AI-related growth, inflation pressures, and rising energy costs remain key themes this earnings season.
Market impact: Strong results and optimistic guidance could support equities, while earnings disappointments may increase volatility across risk assets, including crypto.
#EarningsSeason #StockMarket #USStocks
#Bitcoin
{stock_us}(PG.US)
{stock_us}(LMT.US)
#EarningsSeason
🚨 EARNINGS SEASON UPDATE: OCTOBER 22, 2026📊
🇺🇸 U.S. Q3 earnings season continues with around 80 companies scheduled to report today.
🔥 **Key companies to watch:**
• $PG — Procter & Gamble
• $LMT — Lockheed Martin
• $UNP — Union Pacific
• $VLO — Valero Energy
• $WDC — Western Digital
📈 Investors are watching corporate profits, revenue growth, and forward guidance to assess the strength of the U.S. economy.
🤖 AI-related growth, inflation pressures, and rising energy costs remain key themes this earnings season.
Market impact: Strong results and optimistic guidance could support equities, while earnings disappointments may increase volatility across risk assets, including crypto.
#EarningsSeason #StockMarket #USStocks
#Bitcoin
🚨 EARNINGS SEASON UPDATE: OCTOBER 22, 2026📊
🇺🇸 U.S. Q3 earnings season continues with around 80 companies scheduled to report today.
🔥 **Key companies to watch:**
• $PG — Procter & Gamble
• $LMT — Lockheed Martin
• $UNP — Union Pacific
• $VLO — Valero Energy
• $WDC — Western Digital
📈 Investors are watching corporate profits, revenue growth, and forward guidance to assess the strength of the U.S. economy.
🤖 AI-related growth, inflation pressures, and rising energy costs remain key themes this earnings season.
Market impact: Strong results and optimistic guidance could support equities, while earnings disappointments may increase volatility across risk assets, including crypto.
#EarningsSeason #StockMarket #USStocks
#Bitcoin
LMTUS-1.15%
PGUS-0.57%
1
785

·
--
$BTC | Square is trending EarningsSeason, and on the desk the real risk was never the headline number, it was the clock. US earnings land after the closing bell, outside the 11:30pm-6am AEST window an Australian CFD trader can watch live. A single stock gapping on its own report can move further than a scheduled macro print.
SatoshiMacro's US stock guide puts share CFD leverage at 5:1 for retail (20 percent margin) under the ASIC Product Intervention Order, built for overnight gaps like this. My read: the cap limits the damage. It does not remove the risk. 70 to 85 percent of retail CFD accounts still lose money.
https://satoshimacro.com/guides/forex/trade-us-stocks-australia/?utm_source=binance_square&utm_medium=social&utm_campaign=autopilot_short-1
#SatoshiMacro #EarningsSeason #USStocks #Bitcoin
$BTC | Square is trending EarningsSeason, and on the desk the real risk was never the headline number, it was the clock. US earnings land after the closing bell, outside the 11:30pm-6am AEST window an Australian CFD trader can watch live. A single stock gapping on its own report can move further than a scheduled macro print.
SatoshiMacro's US stock guide puts share CFD leverage at 5:1 for retail (20 percent margin) under the ASIC Product Intervention Order, built for overnight gaps like this. My read: the cap limits the damage. It does not remove the risk. 70 to 85 percent of retail CFD accounts still lose money.
https://satoshimacro.com/guides/forex/trade-us-stocks-australia/?utm_source=binance_square&utm_medium=social&utm_campaign=autopilot_short-1
#SatoshiMacro #EarningsSeason #USStocks #Bitcoin
SatoshiMacro's US stock guide puts share CFD leverage at 5:1 for retail (20 percent margin) under the ASIC Product Intervention Order, built for overnight gaps like this. My read: the cap limits the damage. It does not remove the risk. 70 to 85 percent of retail CFD accounts still lose money.
https://satoshimacro.com/guides/forex/trade-us-stocks-australia/?utm_source=binance_square&utm_medium=social&utm_campaign=autopilot_short-1
#SatoshiMacro #EarningsSeason #USStocks #Bitcoin
117

·
--
Bullish
🌐 The Ultimate Investment Blend: Crypto's Top 9 Meets US Stock Market Powerhouses! 📊✨
Just like a refreshing juice blend packs a variety of unique flavors, the financial world thrives on diversification across different asset classes. Today, let’s look at an exciting mix of 9 standout crypto assets and how they complement the corporate strength of US stocks!
🪙 The Top 9 Crypto Icons:
Bitcoin (BTC) – The undisputed king of digital gold and a trusted store of value.
BNB – Powering one of the world's largest and most active blockchain ecosystems.
Pepe ($PEPE) – The viral meme coin representing community-driven internet culture.
XRP – Facilitating lightning-fast and efficient cross-border global payments.
ARY – A specialized digital token capturing unique project utilities.
Ethereum (ETH) – The global backbone of decentralized finance (DeFi) and smart contracts.
Solana (SOL) – Renowned for ultra-fast transaction speeds and scalable blockchain infrastructure.
Dogecoin (DOGE) – The pioneering meme coin backed by a passionate global community.
Zcash (ZEC) – Focused on advanced user privacy and zero-knowledge security features.
📈 Bridging to US Stocks (US Market Highlights):
While crypto offers high-growth potential and decentralized innovation, the US stock market—anchored by the S&P 500 and major tech giants like NVIDIA (NVDA), Microsoft (MSFT), and Amazon (AMZN)—provides institutional stability, consistent corporate earnings, and strong shareholder returns. Driven significantly by artificial intelligence (AI) infrastructure investments and record corporate buybacks, US equities remain a foundational pillar of global wealth generation.
💡 Key Takeaway:
Balancing high-energy digital assets with robust US equities creates a well-rounded, diversified portfolio tailored for the modern economy!
#Crypto #USStocks #Bitcoin #Ethereum #solana
🌐 The Ultimate Investment Blend: Crypto's Top 9 Meets US Stock Market Powerhouses! 📊✨
Just like a refreshing juice blend packs a variety of unique flavors, the financial world thrives on diversification across different asset classes. Today, let’s look at an exciting mix of 9 standout crypto assets and how they complement the corporate strength of US stocks!
🪙 The Top 9 Crypto Icons:
Bitcoin (BTC) – The undisputed king of digital gold and a trusted store of value.
BNB – Powering one of the world's largest and most active blockchain ecosystems.
Pepe ($PEPE) – The viral meme coin representing community-driven internet culture.
XRP – Facilitating lightning-fast and efficient cross-border global payments.
ARY – A specialized digital token capturing unique project utilities.
Ethereum (ETH) – The global backbone of decentralized finance (DeFi) and smart contracts.
Solana (SOL) – Renowned for ultra-fast transaction speeds and scalable blockchain infrastructure.
Dogecoin (DOGE) – The pioneering meme coin backed by a passionate global community.
Zcash (ZEC) – Focused on advanced user privacy and zero-knowledge security features.
📈 Bridging to US Stocks (US Market Highlights):
While crypto offers high-growth potential and decentralized innovation, the US stock market—anchored by the S&P 500 and major tech giants like NVIDIA (NVDA), Microsoft (MSFT), and Amazon (AMZN)—provides institutional stability, consistent corporate earnings, and strong shareholder returns. Driven significantly by artificial intelligence (AI) infrastructure investments and record corporate buybacks, US equities remain a foundational pillar of global wealth generation.
💡 Key Takeaway:
Balancing high-energy digital assets with robust US equities creates a well-rounded, diversified portfolio tailored for the modern economy!
#Crypto #USStocks #Bitcoin #Ethereum #solana
Just like a refreshing juice blend packs a variety of unique flavors, the financial world thrives on diversification across different asset classes. Today, let’s look at an exciting mix of 9 standout crypto assets and how they complement the corporate strength of US stocks!
🪙 The Top 9 Crypto Icons:
Bitcoin (BTC) – The undisputed king of digital gold and a trusted store of value.
BNB – Powering one of the world's largest and most active blockchain ecosystems.
Pepe ($PEPE) – The viral meme coin representing community-driven internet culture.
XRP – Facilitating lightning-fast and efficient cross-border global payments.
ARY – A specialized digital token capturing unique project utilities.
Ethereum (ETH) – The global backbone of decentralized finance (DeFi) and smart contracts.
Solana (SOL) – Renowned for ultra-fast transaction speeds and scalable blockchain infrastructure.
Dogecoin (DOGE) – The pioneering meme coin backed by a passionate global community.
Zcash (ZEC) – Focused on advanced user privacy and zero-knowledge security features.
📈 Bridging to US Stocks (US Market Highlights):
While crypto offers high-growth potential and decentralized innovation, the US stock market—anchored by the S&P 500 and major tech giants like NVIDIA (NVDA), Microsoft (MSFT), and Amazon (AMZN)—provides institutional stability, consistent corporate earnings, and strong shareholder returns. Driven significantly by artificial intelligence (AI) infrastructure investments and record corporate buybacks, US equities remain a foundational pillar of global wealth generation.
💡 Key Takeaway:
Balancing high-energy digital assets with robust US equities creates a well-rounded, diversified portfolio tailored for the modern economy!
#Crypto #USStocks #Bitcoin #Ethereum #solana

46
Log in to explore more content
Join global crypto users on Binance Square
⚡️ Get latest and useful information about crypto.
💬 Trusted by the world’s largest crypto exchange.
👍 Discover real insights from verified creators.
Email / Phone number
Trending Topics
1
#BitcoinRebounds$75KAsChipsLead
425 views
22 Discussing
2
#JobsReportRaisesHikeOdds
33,033 views
525 Discussing
3
#US Data Center Rules May Constrain AI Expansion
4,838 views
61 Discussing
4
#$2TWipedOutHedgeFundsFaceLiquidation
8,528 views
71 Discussing
5
#WillAnthropicListOnTime
485 views
48 Discussing
6
#USNovemberMichiganExpectationsIndexPrelimAt50.9
5,222 views
160 Discussing
7
#OilPlungesBelow$100
8,015 views
29 Discussing
8
#TradFiForBeginners
1,732 views
76 Discussing
9
#USMidtermsCouldShakeUpUS-IranTies
20,683 views
350 Discussing
10
#RussianCentralBankNamesBTCETHUSDTForNonQualifiedInvestors
316 views
3 Discussing