

#tradingview
tradingview
3.3M views
8,053 Discussing
Hot
Latest
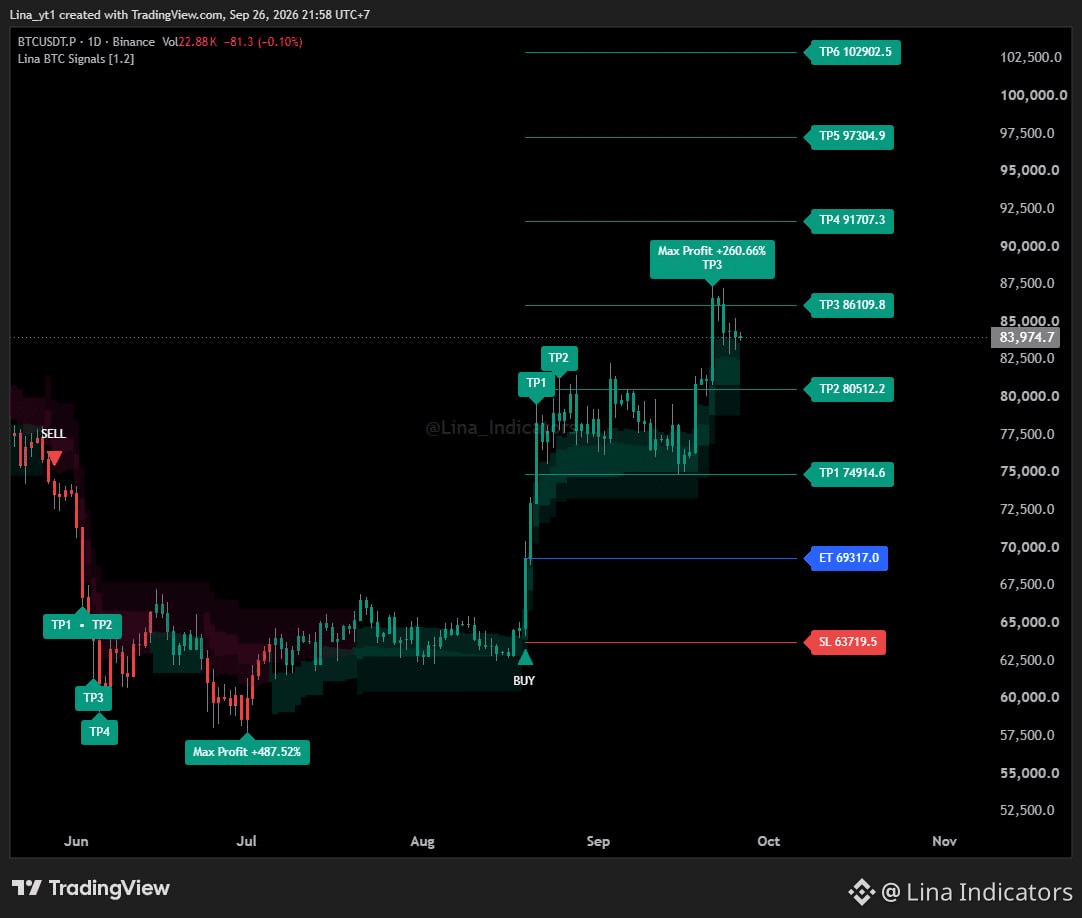
BTC Multi-Timeframe Structure
A new BTC-focused TradingView setup I’ve been developing.
The chart combines directional signals with reference entry, risk and multiple target levels to make the structure easier to read.
On the 1D chart, price has already moved through several projected levels while the higher targets remain visible.
The next step is observing how the structure behaves across different BTC market conditions.
What timeframe do you use most for BTC — 1D, 12H or 4H?
For analysis and educational purposes only.
#BTC #bitcoin #tradingview
BTC Multi-Timeframe Structure
A new BTC-focused TradingView setup I’ve been developing.
The chart combines directional signals with reference entry, risk and multiple target levels to make the structure easier to read.
On the 1D chart, price has already moved through several projected levels while the higher targets remain visible.
The next step is observing how the structure behaves across different BTC market conditions.
What timeframe do you use most for BTC — 1D, 12H or 4H?
For analysis and educational purposes only.
#BTC #bitcoin #tradingview
A new BTC-focused TradingView setup I’ve been developing.
The chart combines directional signals with reference entry, risk and multiple target levels to make the structure easier to read.
On the 1D chart, price has already moved through several projected levels while the higher targets remain visible.
The next step is observing how the structure behaves across different BTC market conditions.
What timeframe do you use most for BTC — 1D, 12H or 4H?
For analysis and educational purposes only.
#BTC #bitcoin #tradingview
K3NTR3LL:
connect back?
3
1
72
·
--
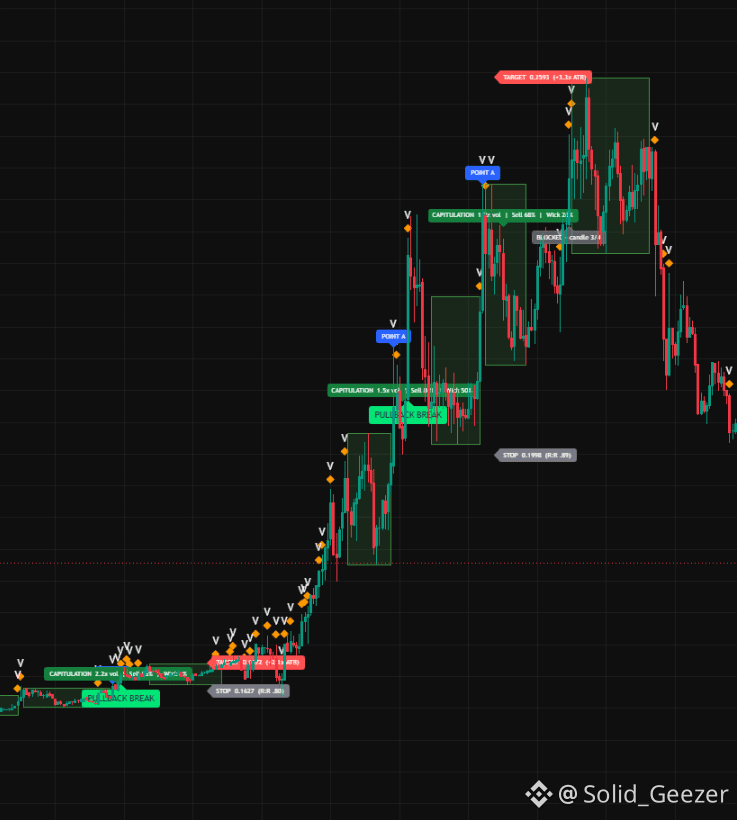
😍99% SUCCESS RATE😍😍 YES I FOUND A STRETEGY WITH 99% SUCCESS RATE 😍 AFTER SO MANY FAILED ATTEMPTS… 👀
I’ve spent a long time building, testing, breaking, and rebuilding Pine Scripts.
Some looked great.
Some completely failed. 😂
But I kept going.
And finally, I found a script that gave me around a 90% backtested win rate.
Is it perfect? No.
Is it guaranteed? No.
But after the journey so far…
I finally have something I’m proud of. 🚀
More soon. 👀
Comment any coin name i will show you exaclty where breakout happened
⚠️ Not financial advice. Backtested results do not guarantee future performance. Trade responsibly.
#PineScript #TradingView #CryptoTrading #BinanceSquare
😍99% SUCCESS RATE😍😍 YES I FOUND A STRETEGY WITH 99% SUCCESS RATE 😍 AFTER SO MANY FAILED ATTEMPTS… 👀
I’ve spent a long time building, testing, breaking, and rebuilding Pine Scripts.
Some looked great.
Some completely failed. 😂
But I kept going.
And finally, I found a script that gave me around a 90% backtested win rate.
Is it perfect? No.
Is it guaranteed? No.
But after the journey so far…
I finally have something I’m proud of. 🚀
More soon. 👀
Comment any coin name i will show you exaclty where breakout happened
⚠️ Not financial advice. Backtested results do not guarantee future performance. Trade responsibly.
#PineScript #TradingView #CryptoTrading #BinanceSquare
I’ve spent a long time building, testing, breaking, and rebuilding Pine Scripts.
Some looked great.
Some completely failed. 😂
But I kept going.
And finally, I found a script that gave me around a 90% backtested win rate.
Is it perfect? No.
Is it guaranteed? No.
But after the journey so far…
I finally have something I’m proud of. 🚀
More soon. 👀
Comment any coin name i will show you exaclty where breakout happened
⚠️ Not financial advice. Backtested results do not guarantee future performance. Trade responsibly.
#PineScript #TradingView #CryptoTrading #BinanceSquare
125

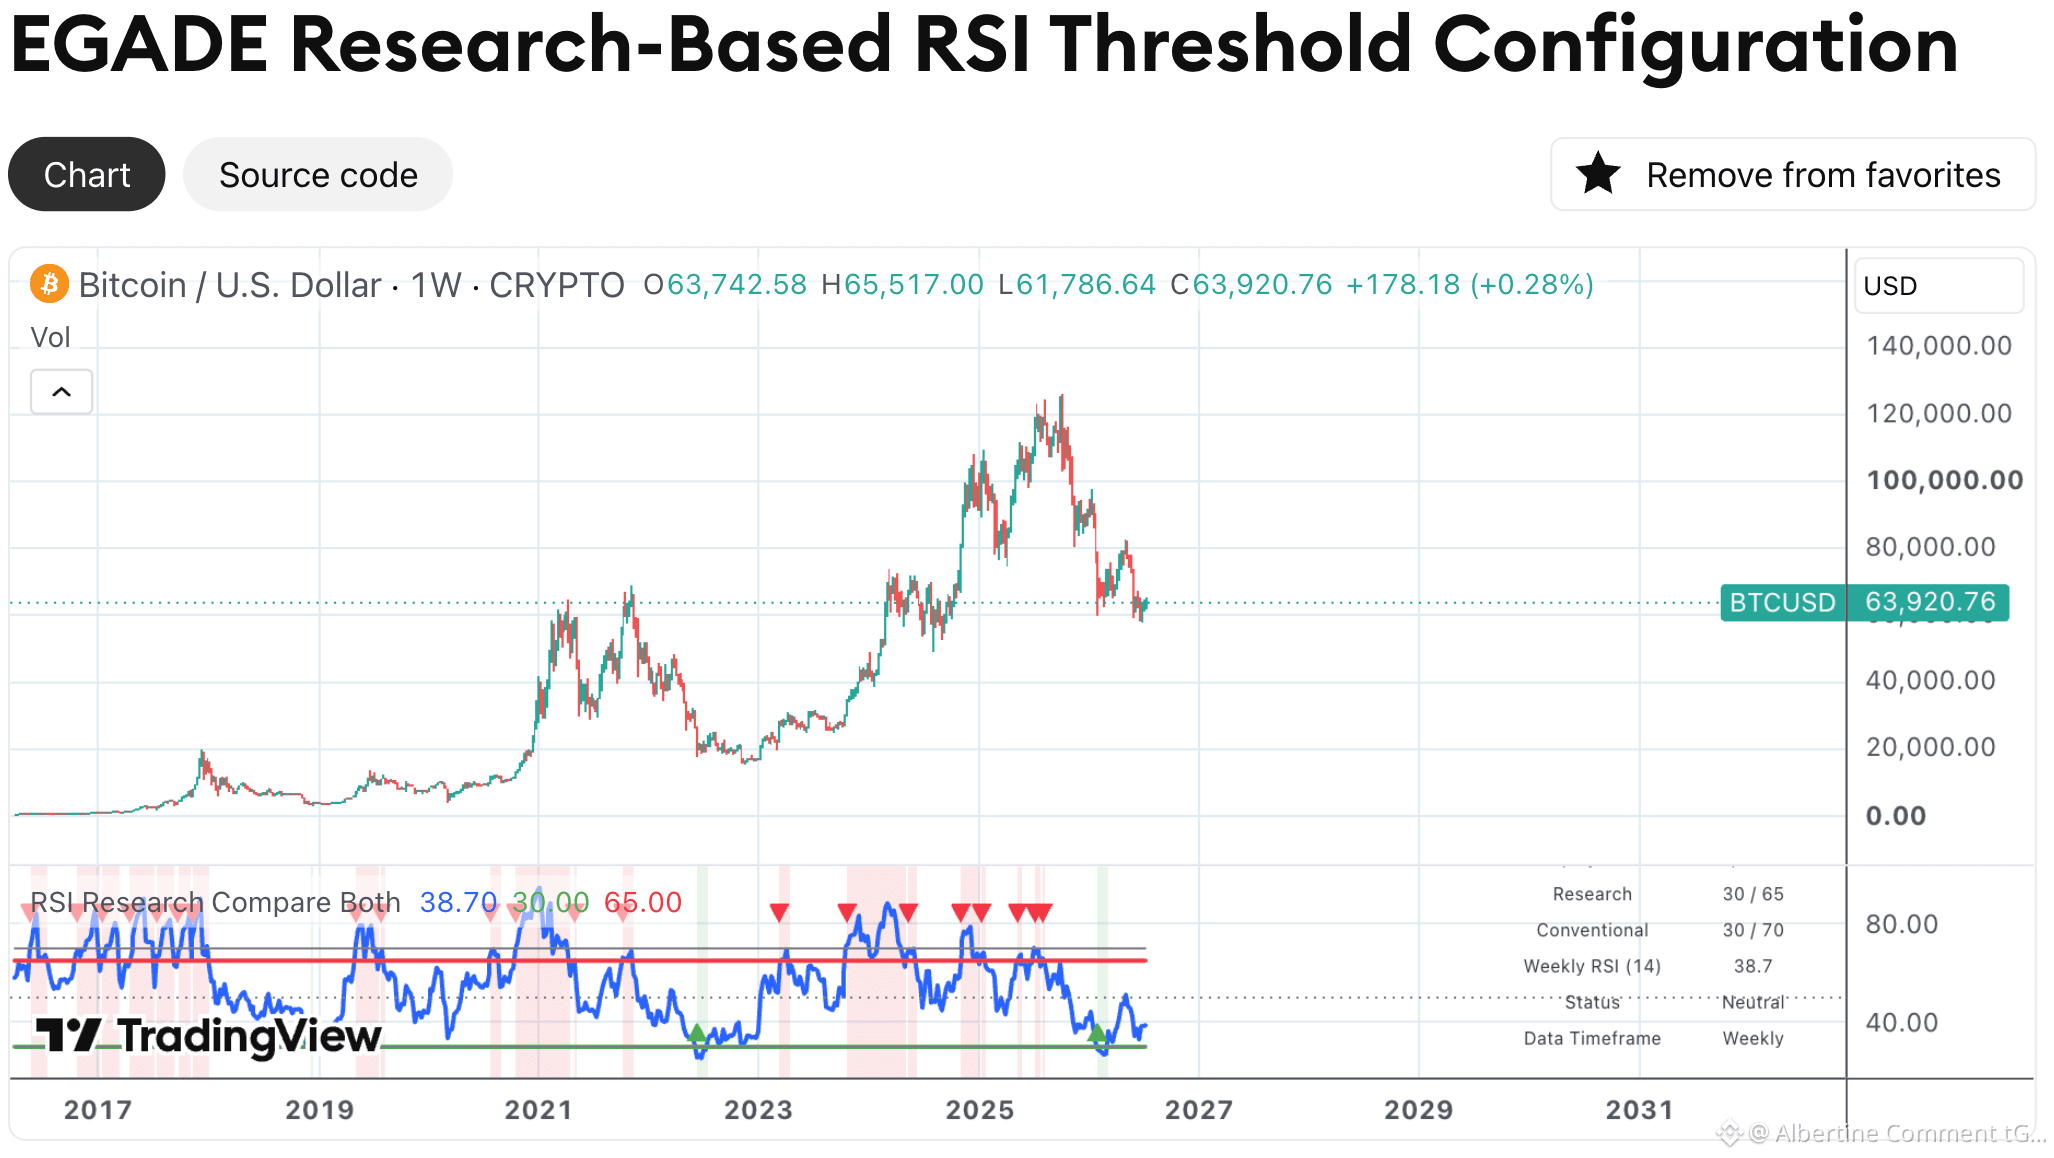
The EGADE Research-Based RSI Threshold Configuration, a new open-source TradingView indicator developed as a practical extension of our research:
“RSI Threshold Configurations and Signal Behaviour in Cryptocurrency and Traditional Markets: An Empirical Analysis on Weekly Data”
Co-authored with Dr. Federico Trigos and Francisco Valderrey, the research was presented at the 33rd International Conference on Transdisciplinary Engineering (TE2026) in Taiwan, and the paper is expected to be published in the conference proceedings in October 2026.
Our study systematically examines RSI threshold configurations across nine major cryptocurrencies and the S&P 500, challenging the assumption that the conventional 30/70 RSI configuration is universally dominant. The findings show that RSI threshold behaviour varies considerably across assets and that alternative configurations can outperform the conventional setting within the historical samples examined.
The EGADE Research-Based RSI Threshold Configuration translates these empirical findings into an accessible decision-support indicator on TradingView. Users can display the research-based configuration for each studied asset, compare it directly with the conventional 30/70 thresholds, and visually explore how the findings operate on weekly market data.
Access the indicator here:
https://www.tradingview.com/script/4pwHBqyZ-EGADE-Research-Based-RSI-Threshold-Configuration/
The indicator and its underlying findings are intended exclusively for academic, research, educational, and decision-support purposes. They do not constitute financial advice, investment recommendations, or a solicitation to buy or sell any financial instrument.
#TradingView #RSI #TechnicalAnalysis #HatemMabrouk #RelativeStrengthIndex
The EGADE Research-Based RSI Threshold Configuration, a new open-source TradingView indicator developed as a practical extension of our research:
“RSI Threshold Configurations and Signal Behaviour in Cryptocurrency and Traditional Markets: An Empirical Analysis on Weekly Data”
Co-authored with Dr. Federico Trigos and Francisco Valderrey, the research was presented at the 33rd International Conference on Transdisciplinary Engineering (TE2026) in Taiwan, and the paper is expected to be published in the conference proceedings in October 2026.
Our study systematically examines RSI threshold configurations across nine major cryptocurrencies and the S&P 500, challenging the assumption that the conventional 30/70 RSI configuration is universally dominant. The findings show that RSI threshold behaviour varies considerably across assets and that alternative configurations can outperform the conventional setting within the historical samples examined.
The EGADE Research-Based RSI Threshold Configuration translates these empirical findings into an accessible decision-support indicator on TradingView. Users can display the research-based configuration for each studied asset, compare it directly with the conventional 30/70 thresholds, and visually explore how the findings operate on weekly market data.
Access the indicator here:
https://www.tradingview.com/script/4pwHBqyZ-EGADE-Research-Based-RSI-Threshold-Configuration/
The indicator and its underlying findings are intended exclusively for academic, research, educational, and decision-support purposes. They do not constitute financial advice, investment recommendations, or a solicitation to buy or sell any financial instrument.
#TradingView #RSI #TechnicalAnalysis #HatemMabrouk #RelativeStrengthIndex
“RSI Threshold Configurations and Signal Behaviour in Cryptocurrency and Traditional Markets: An Empirical Analysis on Weekly Data”
Co-authored with Dr. Federico Trigos and Francisco Valderrey, the research was presented at the 33rd International Conference on Transdisciplinary Engineering (TE2026) in Taiwan, and the paper is expected to be published in the conference proceedings in October 2026.
Our study systematically examines RSI threshold configurations across nine major cryptocurrencies and the S&P 500, challenging the assumption that the conventional 30/70 RSI configuration is universally dominant. The findings show that RSI threshold behaviour varies considerably across assets and that alternative configurations can outperform the conventional setting within the historical samples examined.
The EGADE Research-Based RSI Threshold Configuration translates these empirical findings into an accessible decision-support indicator on TradingView. Users can display the research-based configuration for each studied asset, compare it directly with the conventional 30/70 thresholds, and visually explore how the findings operate on weekly market data.
Access the indicator here:
https://www.tradingview.com/script/4pwHBqyZ-EGADE-Research-Based-RSI-Threshold-Configuration/
The indicator and its underlying findings are intended exclusively for academic, research, educational, and decision-support purposes. They do not constitute financial advice, investment recommendations, or a solicitation to buy or sell any financial instrument.
#TradingView #RSI #TechnicalAnalysis #HatemMabrouk #RelativeStrengthIndex
100

@ all followers
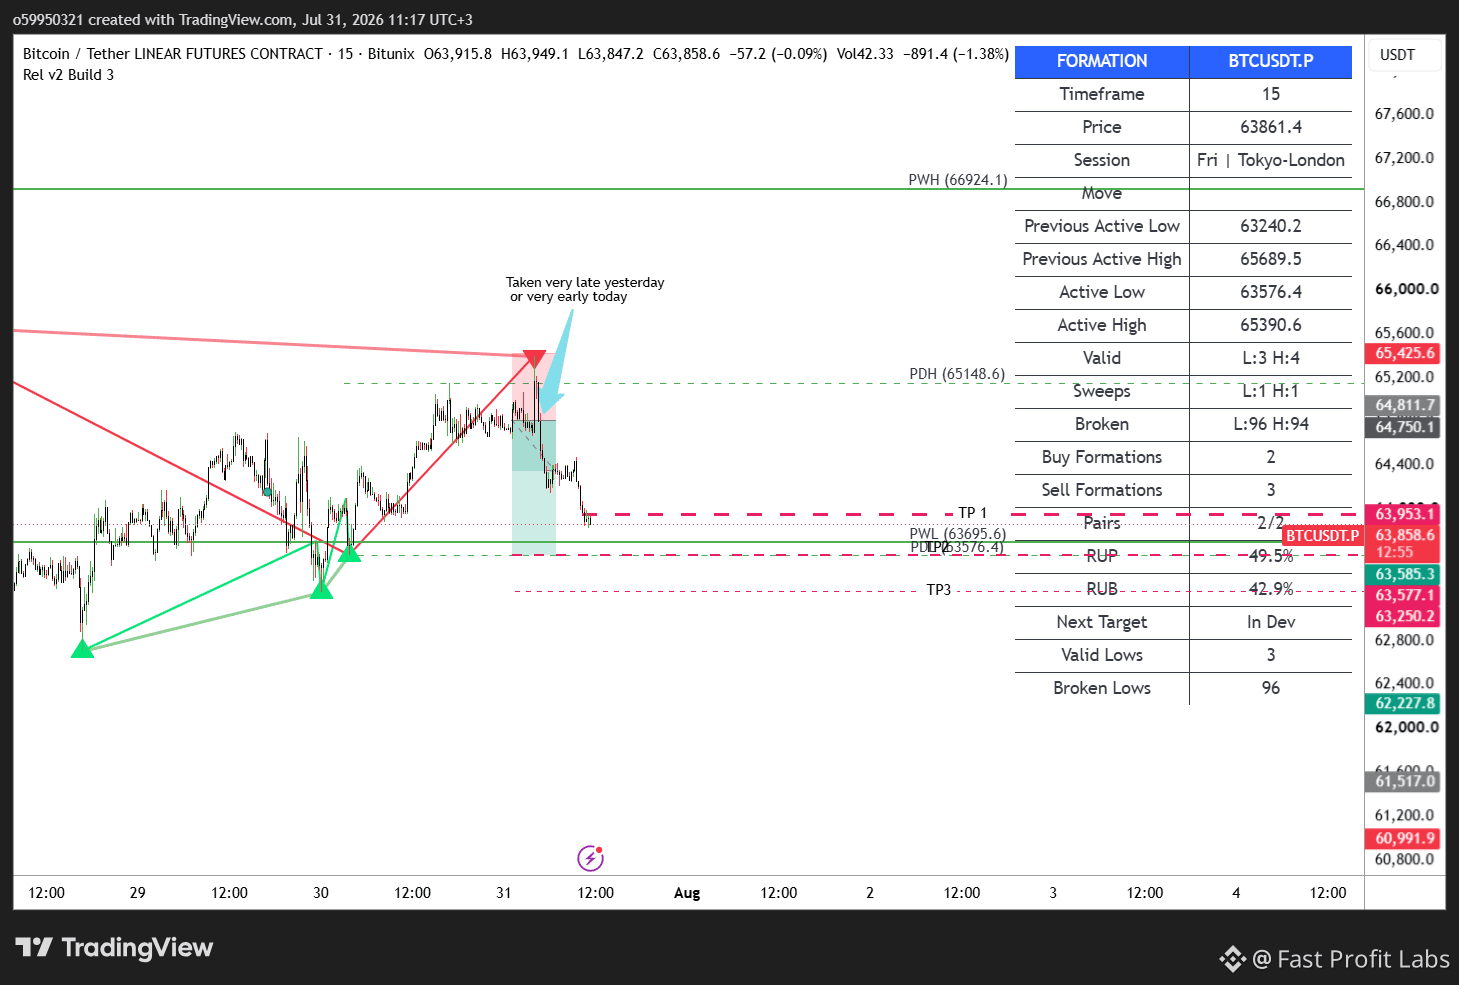
I have not been posting because I was working on a custom trading assistant script on TradingView called Rel. Trading should be done with minimal emotion as possible to mitigate revenge trading, FOMO, or blind entries. So I am working on the signal engine now that will generate signals using fractals, formations, and liquidity levels. For example, the red triangles are sell formations and green ones are buy formations, that tells traders to enter shorts and longs respectively i.e. give you directional bias.
These triangles touch highs and lows marked by those smaller triangles which identify fractals. Fractals are used as targets where price could revisit. For example, the short forecast already hit TP 1 and now price may hit TP 2 and TP 3 where you can see fractals marked by green small triangles.
Moreover, Rel also uses previous day and weekly highs and lows to know where to take profit or where price will have a reaction. It will use 3-5* ATR to set SL. All these will be in signal engine, I am currently working on.
That's what I have been up to trading fam. I am ecstatic about my achievements as it took blood, sweat, tears, months, trial and error to get it working correctly. Now I want to gather trading outcome data from anyone new or seasoned traders. I will be giving free access on TradingView for 2 weeks so I can get feedback for anyone interested to use it. Just DM REL in comments and I will send the first 50 commentors the link and manual for you to start your 2 weeks free trial.
I only ask you share your PnLs, testimonies, etc. on Binance Square and credit REL.
NOTE: Rel is an assistant not a replacement for your trading decisions.
For a SCALP trade, Rel printed a sell formation on 15 min BTCUSDT.P and my first TP 1 was hit. Now I am waiting for TP 2 and 3.
$BTC
{future}(BTCUSDT)
Thank you for reading fam. Good trading guys.
As always DYOR and this is for educational purposes not financial advice.
#WAGMI #TradingView #TradingScripts
@ all followers
I have not been posting because I was working on a custom trading assistant script on TradingView called Rel. Trading should be done with minimal emotion as possible to mitigate revenge trading, FOMO, or blind entries. So I am working on the signal engine now that will generate signals using fractals, formations, and liquidity levels. For example, the red triangles are sell formations and green ones are buy formations, that tells traders to enter shorts and longs respectively i.e. give you directional bias.
These triangles touch highs and lows marked by those smaller triangles which identify fractals. Fractals are used as targets where price could revisit. For example, the short forecast already hit TP 1 and now price may hit TP 2 and TP 3 where you can see fractals marked by green small triangles.
Moreover, Rel also uses previous day and weekly highs and lows to know where to take profit or where price will have a reaction. It will use 3-5* ATR to set SL. All these will be in signal engine, I am currently working on.
That's what I have been up to trading fam. I am ecstatic about my achievements as it took blood, sweat, tears, months, trial and error to get it working correctly. Now I want to gather trading outcome data from anyone new or seasoned traders. I will be giving free access on TradingView for 2 weeks so I can get feedback for anyone interested to use it. Just DM REL in comments and I will send the first 50 commentors the link and manual for you to start your 2 weeks free trial.
I only ask you share your PnLs, testimonies, etc. on Binance Square and credit REL.
NOTE: Rel is an assistant not a replacement for your trading decisions.
For a SCALP trade, Rel printed a sell formation on 15 min BTCUSDT.P and my first TP 1 was hit. Now I am waiting for TP 2 and 3.
$BTC
Thank you for reading fam. Good trading guys.
As always DYOR and this is for educational purposes not financial advice.
#WAGMI #TradingView #TradingScripts
I have not been posting because I was working on a custom trading assistant script on TradingView called Rel. Trading should be done with minimal emotion as possible to mitigate revenge trading, FOMO, or blind entries. So I am working on the signal engine now that will generate signals using fractals, formations, and liquidity levels. For example, the red triangles are sell formations and green ones are buy formations, that tells traders to enter shorts and longs respectively i.e. give you directional bias.
These triangles touch highs and lows marked by those smaller triangles which identify fractals. Fractals are used as targets where price could revisit. For example, the short forecast already hit TP 1 and now price may hit TP 2 and TP 3 where you can see fractals marked by green small triangles.
Moreover, Rel also uses previous day and weekly highs and lows to know where to take profit or where price will have a reaction. It will use 3-5* ATR to set SL. All these will be in signal engine, I am currently working on.
That's what I have been up to trading fam. I am ecstatic about my achievements as it took blood, sweat, tears, months, trial and error to get it working correctly. Now I want to gather trading outcome data from anyone new or seasoned traders. I will be giving free access on TradingView for 2 weeks so I can get feedback for anyone interested to use it. Just DM REL in comments and I will send the first 50 commentors the link and manual for you to start your 2 weeks free trial.
I only ask you share your PnLs, testimonies, etc. on Binance Square and credit REL.
NOTE: Rel is an assistant not a replacement for your trading decisions.
For a SCALP trade, Rel printed a sell formation on 15 min BTCUSDT.P and my first TP 1 was hit. Now I am waiting for TP 2 and 3.
$BTC
Thank you for reading fam. Good trading guys.
As always DYOR and this is for educational purposes not financial advice.
#WAGMI #TradingView #TradingScripts
1
1
140

·
--
👀 Traders, show me your setup.
I’ve been using TradingView’s Long/Short Position tool to plan my entries before I take a trade.
Instead of just saying:
“ETH looks bullish.” 😅
I want to know:
Where is the entry?
Where is the stop?
Where is the TP?
How much are you risking?
What I like most is that I can visualize the entire trade before entering instead of making decisions after I'm already in.
But now I'm curious…
🔥 What does YOUR TradingView setup look like?
Drop your screenshot below.
Long, short, scalping, swing — I want to see them all.
Maybe we can steal some ideas from each other. 👀
#tradingview #cryptotrading #ETH #BNB #TradingStrategy
👀 Traders, show me your setup.
I’ve been using TradingView’s Long/Short Position tool to plan my entries before I take a trade.
Instead of just saying:
“ETH looks bullish.” 😅
I want to know:
Where is the entry?
Where is the stop?
Where is the TP?
How much are you risking?
What I like most is that I can visualize the entire trade before entering instead of making decisions after I'm already in.
But now I'm curious…
🔥 What does YOUR TradingView setup look like?
Drop your screenshot below.
Long, short, scalping, swing — I want to see them all.
Maybe we can steal some ideas from each other. 👀
#tradingview #cryptotrading #ETH #BNB #TradingStrategy
I’ve been using TradingView’s Long/Short Position tool to plan my entries before I take a trade.
Instead of just saying:
“ETH looks bullish.” 😅
I want to know:
Where is the entry?
Where is the stop?
Where is the TP?
How much are you risking?
What I like most is that I can visualize the entire trade before entering instead of making decisions after I'm already in.
But now I'm curious…
🔥 What does YOUR TradingView setup look like?
Drop your screenshot below.
Long, short, scalping, swing — I want to see them all.
Maybe we can steal some ideas from each other. 👀
#tradingview #cryptotrading #ETH #BNB #TradingStrategy
21

·
--
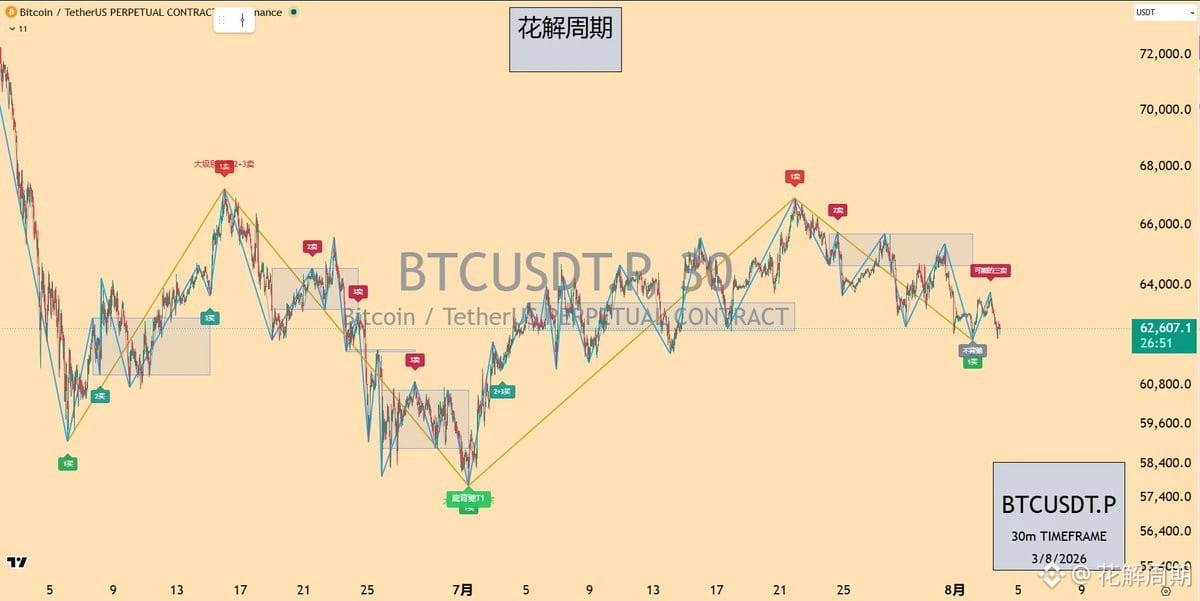
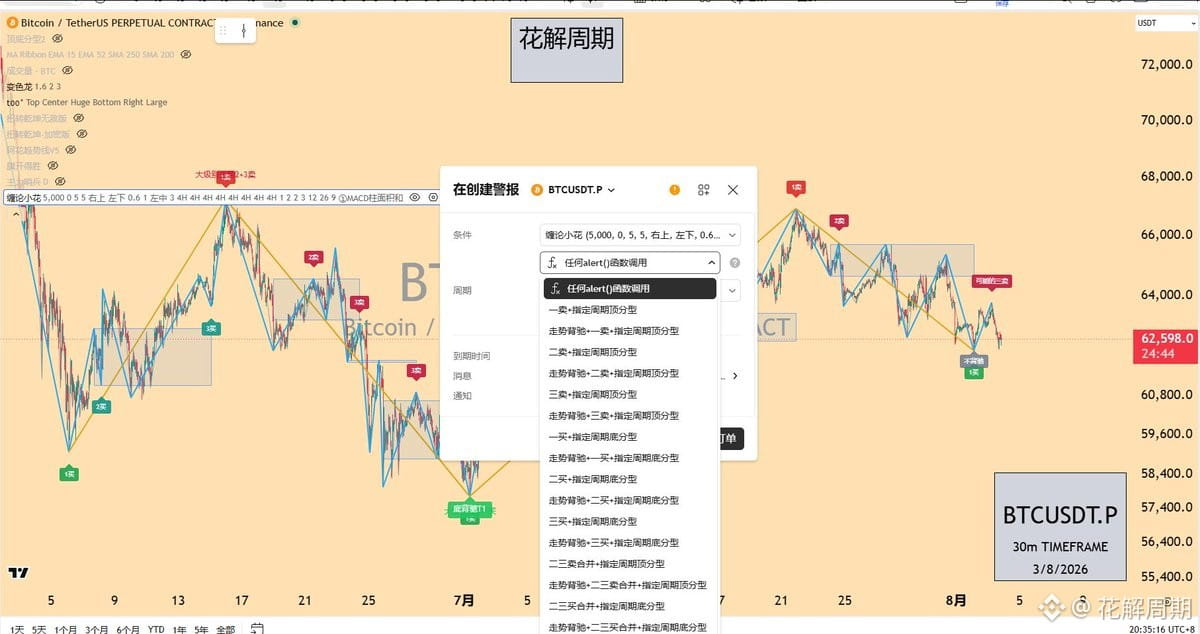
I built a Chan Theory system. Last month, I tinkered with it again and ported it over to TradingView. After testing it for a few weeks, I can finally release it.
🎯 Core features:
✅ Automatically draw pen-stroke style segments and centers
✅ Instant marking of three types of buy/sell points (1st buy/2nd buy/3rd buy)
✅ Divergence detection (trend divergence + consolidation divergence)
✅ Real-time multi-timeframe linkage alerts
✅ Multiple possible developments of the price action are hinted at at the same time
Unlike Chan Theory indicators that pursue strict, standardized definitions, the core idea of this script is: prioritize real-time. Mark potential signals (possible buy/sell points) as early as possible—because in live trading, nobody waits for confirmation before placing an order.
But it’s important to emphasize: this script is not a mechanical entry/exit signal. It helps you see how the price action is growing, whether the trend is diverging, whether the center is expanding, and whether the smaller-level structure is upgrading. In the end, how you act depends on your own trading timeframe and risk appetite.
A small issue for now: the updates for the “type 2 buy/sell” will be completed by around August 15.
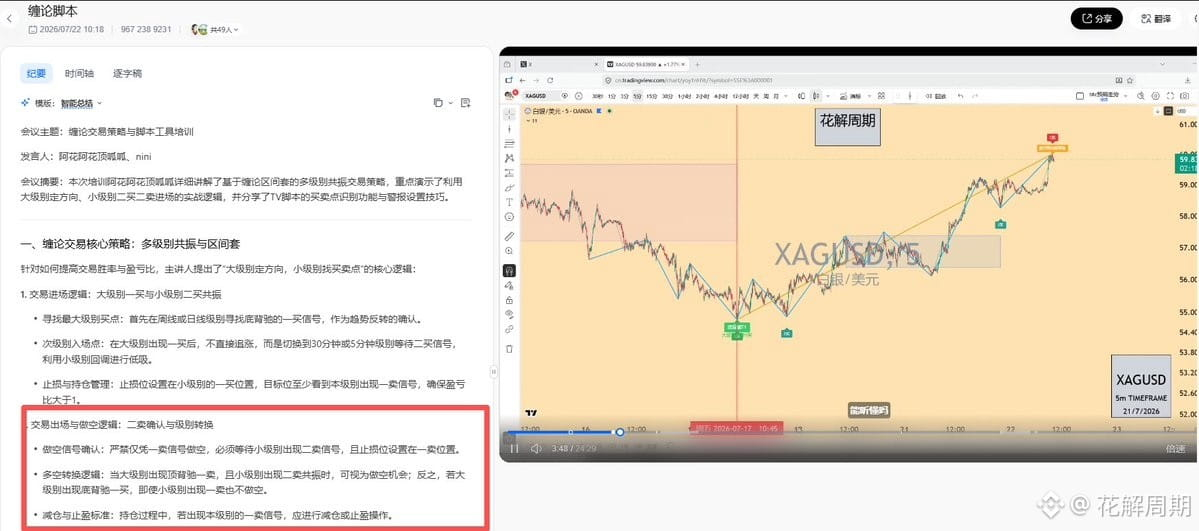
Use the SOP—see the video:
Recording: Chan Theory Script
Date: 2026-07-22 10:18:53
Recording file:
📌 Recommended usage: The 2nd buy/2nd sell in the dual-range setup, combined with divergence signals and multi-timeframe resonance confirmation.
🎁 Release bonus: Comment a blessing message + share → DM to get 7 days free trial
💡 During the trial, if you provide constructive feedback → extra time granted
⚠️ Disclaimer: This indicator is for structural analysis and exchange only and does not constitute any investment advice. The indicator is based on personal understanding; trade-offs were made between real-time performance and accuracy, and it may mislead—please use it rationally.
#TradingView #缠论 #缠论指标 #技术分析 #quant tools
Source: @Cycle_King1913 on X
I built a Chan Theory system. Last month, I tinkered with it again and ported it over to TradingView. After testing it for a few weeks, I can finally release it.
🎯 Core features:
✅ Automatically draw pen-stroke style segments and centers
✅ Instant marking of three types of buy/sell points (1st buy/2nd buy/3rd buy)
✅ Divergence detection (trend divergence + consolidation divergence)
✅ Real-time multi-timeframe linkage alerts
✅ Multiple possible developments of the price action are hinted at at the same time
Unlike Chan Theory indicators that pursue strict, standardized definitions, the core idea of this script is: prioritize real-time. Mark potential signals (possible buy/sell points) as early as possible—because in live trading, nobody waits for confirmation before placing an order.
But it’s important to emphasize: this script is not a mechanical entry/exit signal. It helps you see how the price action is growing, whether the trend is diverging, whether the center is expanding, and whether the smaller-level structure is upgrading. In the end, how you act depends on your own trading timeframe and risk appetite.
A small issue for now: the updates for the “type 2 buy/sell” will be completed by around August 15.
Use the SOP—see the video:
Recording: Chan Theory Script
Date: 2026-07-22 10:18:53
Recording file:
📌 Recommended usage: The 2nd buy/2nd sell in the dual-range setup, combined with divergence signals and multi-timeframe resonance confirmation.
🎁 Release bonus: Comment a blessing message + share → DM to get 7 days free trial
💡 During the trial, if you provide constructive feedback → extra time granted
⚠️ Disclaimer: This indicator is for structural analysis and exchange only and does not constitute any investment advice. The indicator is based on personal understanding; trade-offs were made between real-time performance and accuracy, and it may mislead—please use it rationally.
#TradingView #缠论 #缠论指标 #技术分析 #quant tools
Source: @Cycle_King1913 on X
🎯 Core features:
✅ Automatically draw pen-stroke style segments and centers
✅ Instant marking of three types of buy/sell points (1st buy/2nd buy/3rd buy)
✅ Divergence detection (trend divergence + consolidation divergence)
✅ Real-time multi-timeframe linkage alerts
✅ Multiple possible developments of the price action are hinted at at the same time
Unlike Chan Theory indicators that pursue strict, standardized definitions, the core idea of this script is: prioritize real-time. Mark potential signals (possible buy/sell points) as early as possible—because in live trading, nobody waits for confirmation before placing an order.
But it’s important to emphasize: this script is not a mechanical entry/exit signal. It helps you see how the price action is growing, whether the trend is diverging, whether the center is expanding, and whether the smaller-level structure is upgrading. In the end, how you act depends on your own trading timeframe and risk appetite.
A small issue for now: the updates for the “type 2 buy/sell” will be completed by around August 15.
Use the SOP—see the video:
Recording: Chan Theory Script
Date: 2026-07-22 10:18:53
Recording file:
📌 Recommended usage: The 2nd buy/2nd sell in the dual-range setup, combined with divergence signals and multi-timeframe resonance confirmation.
🎁 Release bonus: Comment a blessing message + share → DM to get 7 days free trial
💡 During the trial, if you provide constructive feedback → extra time granted
⚠️ Disclaimer: This indicator is for structural analysis and exchange only and does not constitute any investment advice. The indicator is based on personal understanding; trade-offs were made between real-time performance and accuracy, and it may mislead—please use it rationally.
#TradingView #缠论 #缠论指标 #技术分析 #quant tools
Source: @Cycle_King1913 on X
2
375

📈 The same market.
📊 The same chart.
🎯 The same opportunities.
💡 The difference isn't luck — it's strategy.
🟢 For traders with a strategy, the market is full of opportunities.
🎲 Without one, it's just gambling.
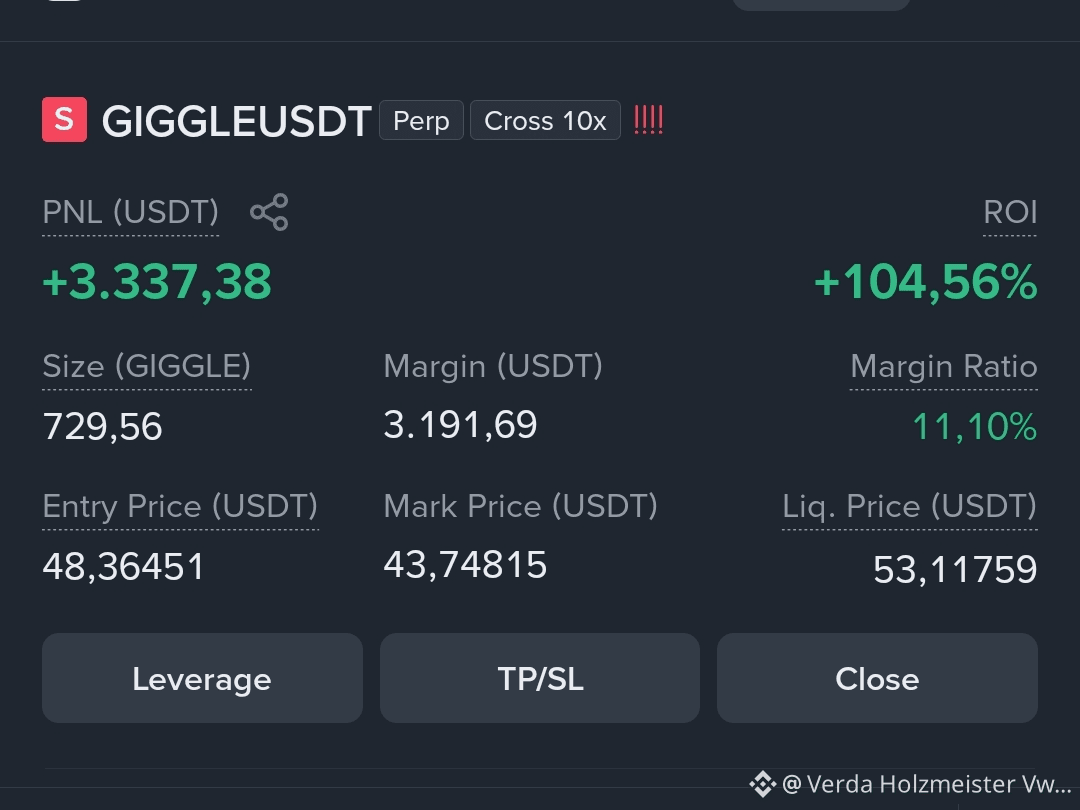
📍 GIGGLEUSDT — SHORT
💰 PNL: +3,308.19 USDT
📈 ROI: +103.65% 🚀
🔥 This trade was executed using my private TradingView indicator.
🎁 Want to try it FREE for 2 days?
Simply send your TradingView username through the link in my bio, and I'll activate your access personally. ✅
💙 Confidence comes from strategy, not luck.
⚠️ Risk Disclaimer: Trading involves substantial risk. Past performance does not guarantee future results.
#tradingview #crypto #BİNANCE #BTC #giggle
📈 The same market.
📊 The same chart.
🎯 The same opportunities.
💡 The difference isn't luck — it's strategy.
🟢 For traders with a strategy, the market is full of opportunities.
🎲 Without one, it's just gambling.
📍 GIGGLEUSDT — SHORT
💰 PNL: +3,308.19 USDT
📈 ROI: +103.65% 🚀
🔥 This trade was executed using my private TradingView indicator.
🎁 Want to try it FREE for 2 days?
Simply send your TradingView username through the link in my bio, and I'll activate your access personally. ✅
💙 Confidence comes from strategy, not luck.
⚠️ Risk Disclaimer: Trading involves substantial risk. Past performance does not guarantee future results.
#tradingview #crypto #BİNANCE #BTC #giggle
📊 The same chart.
🎯 The same opportunities.
💡 The difference isn't luck — it's strategy.
🟢 For traders with a strategy, the market is full of opportunities.
🎲 Without one, it's just gambling.
📍 GIGGLEUSDT — SHORT
💰 PNL: +3,308.19 USDT
📈 ROI: +103.65% 🚀
🔥 This trade was executed using my private TradingView indicator.
🎁 Want to try it FREE for 2 days?
Simply send your TradingView username through the link in my bio, and I'll activate your access personally. ✅
💙 Confidence comes from strategy, not luck.
⚠️ Risk Disclaimer: Trading involves substantial risk. Past performance does not guarantee future results.
#tradingview #crypto #BİNANCE #BTC #giggle
97

·
--
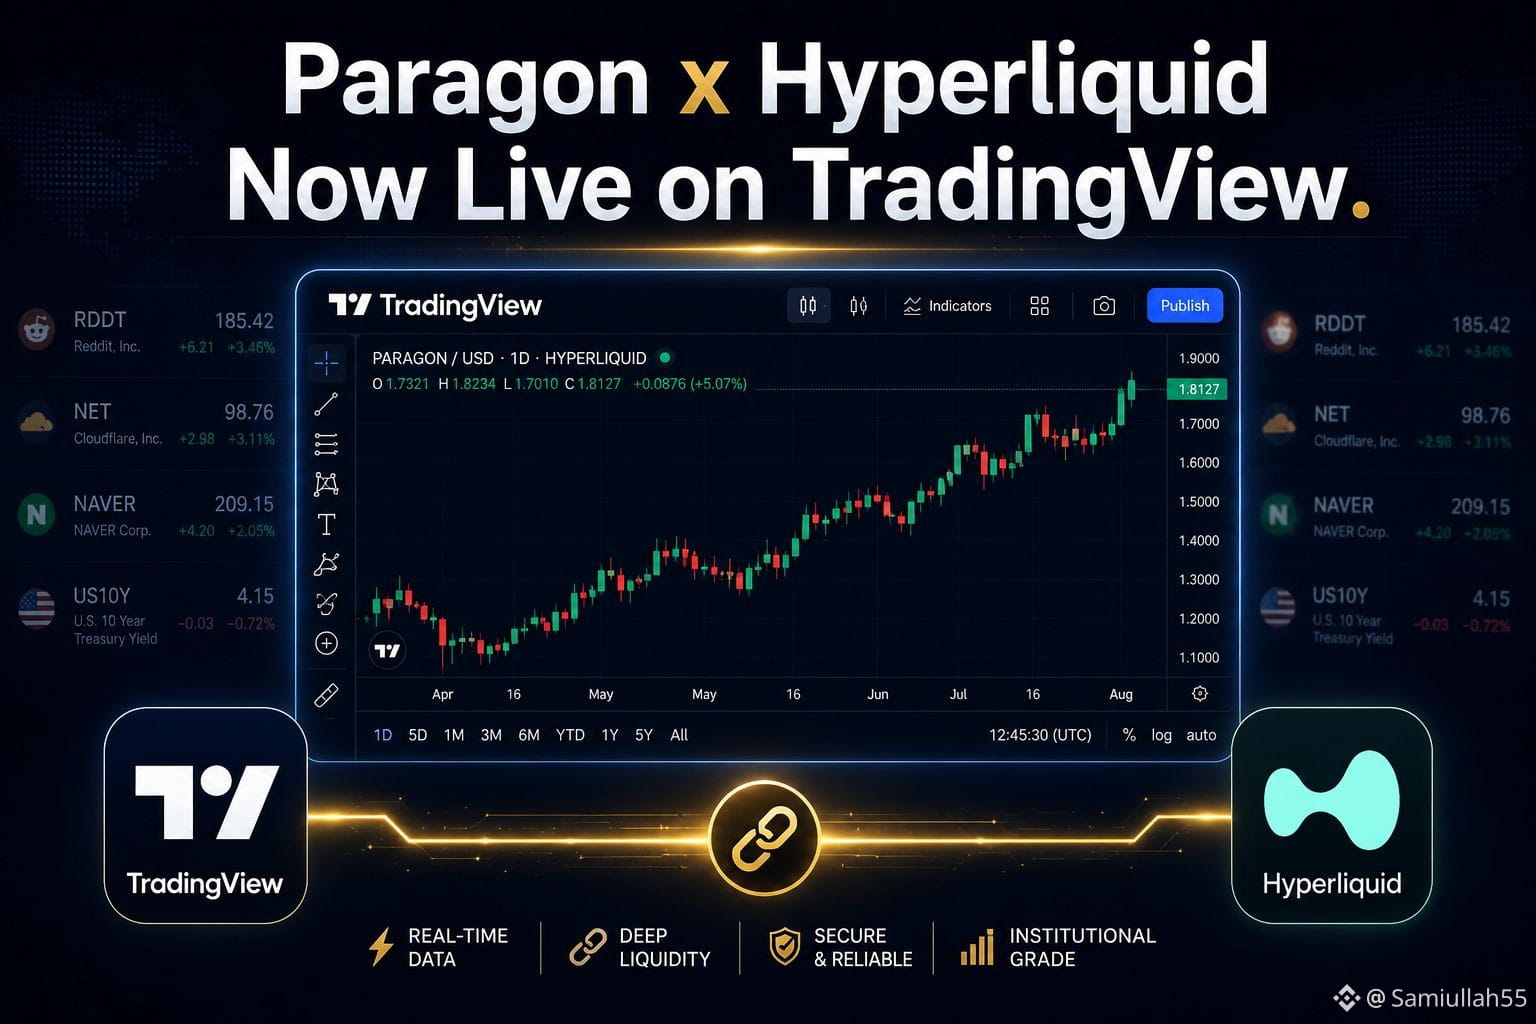
TradingView just added Paragon's HIP-3 perpetual markets from Hyperliquid to its Supercharts. Traders can now chart and access equity- and theme-linked perps — think Reddit, Cloudflare, NAVER, Unitree, and even the US 10-year Treasury yield — all settled on Hyperliquid with continuous market-maker liquidity. Just search "HIP3PARA:" to explore. Crypto-native trading is expanding well beyond coins now.
Onchain markets just got a lot more interesting 📈 Paragon's Hyperliquid perps are now live on TradingView.
#Hyperliquid #Paragon #TradingView #DeFi
$HYPE
{future}(HYPEUSDT)
TradingView just added Paragon's HIP-3 perpetual markets from Hyperliquid to its Supercharts. Traders can now chart and access equity- and theme-linked perps — think Reddit, Cloudflare, NAVER, Unitree, and even the US 10-year Treasury yield — all settled on Hyperliquid with continuous market-maker liquidity. Just search "HIP3PARA:" to explore. Crypto-native trading is expanding well beyond coins now.
Onchain markets just got a lot more interesting 📈 Paragon's Hyperliquid perps are now live on TradingView.
#Hyperliquid #Paragon #TradingView #DeFi
$HYPE
Onchain markets just got a lot more interesting 📈 Paragon's Hyperliquid perps are now live on TradingView.
#Hyperliquid #Paragon #TradingView #DeFi
$HYPE
64

·
--
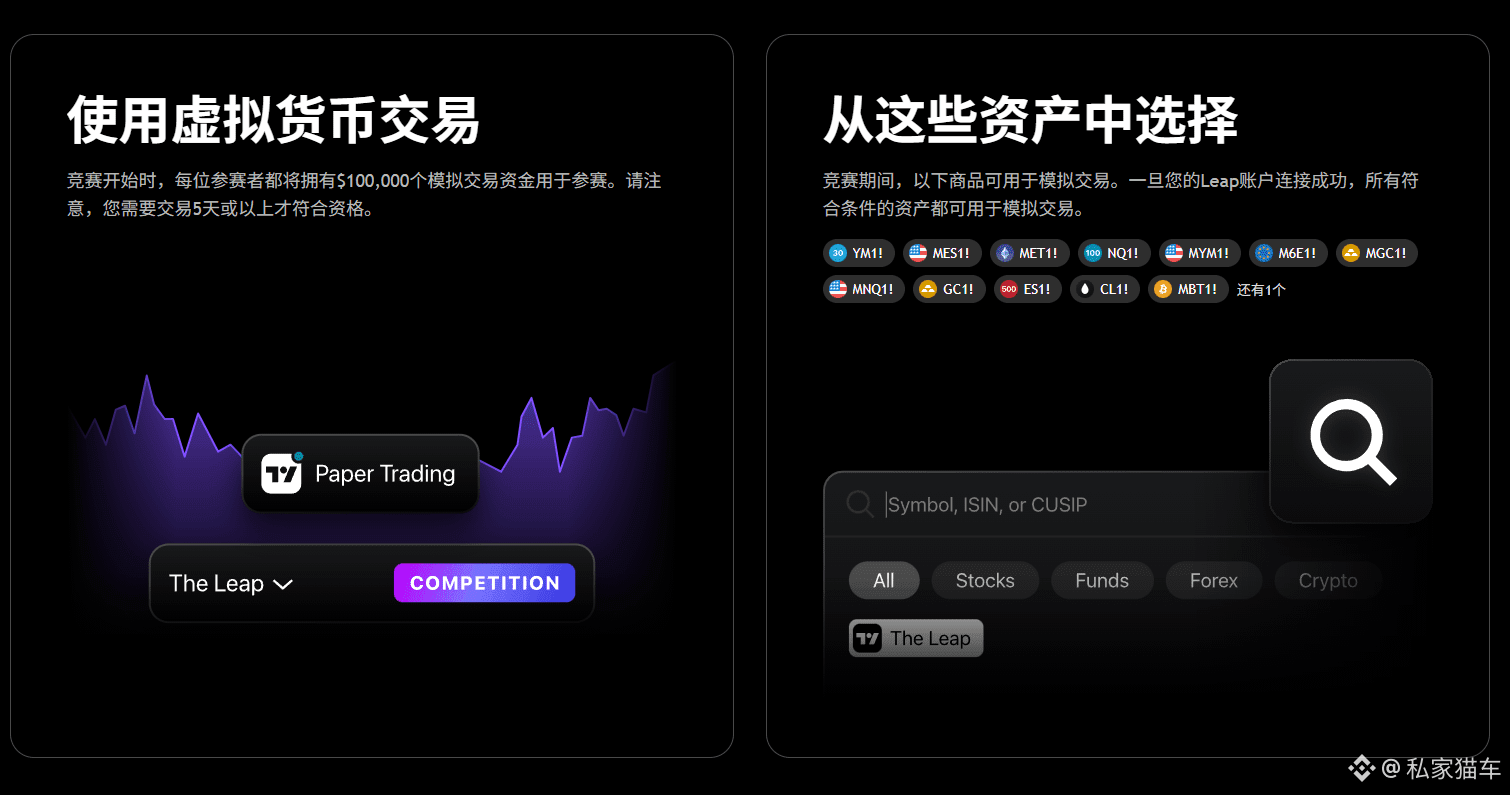
I recently discovered a pretty interesting simulated trading competition on TradingView: The Leap. It feels like most people don’t really monitor TradingView all the time—so I haven’t seen many people notice this competition, and I haven’t heard much discussion about it.
It’s not live trading, so there’s no need to deposit money. Everyone gets $100,000 in virtual funds, and you can trade micro BTC, ETH, the NASDAQ 100, the S&P 500, gold, and crude oil—CME futures products. For anyone looking to practice, or test their trading system, I think this is a great opportunity—there are leaderboards, rules, and real prize money, but losses don’t translate into real live trading losses.
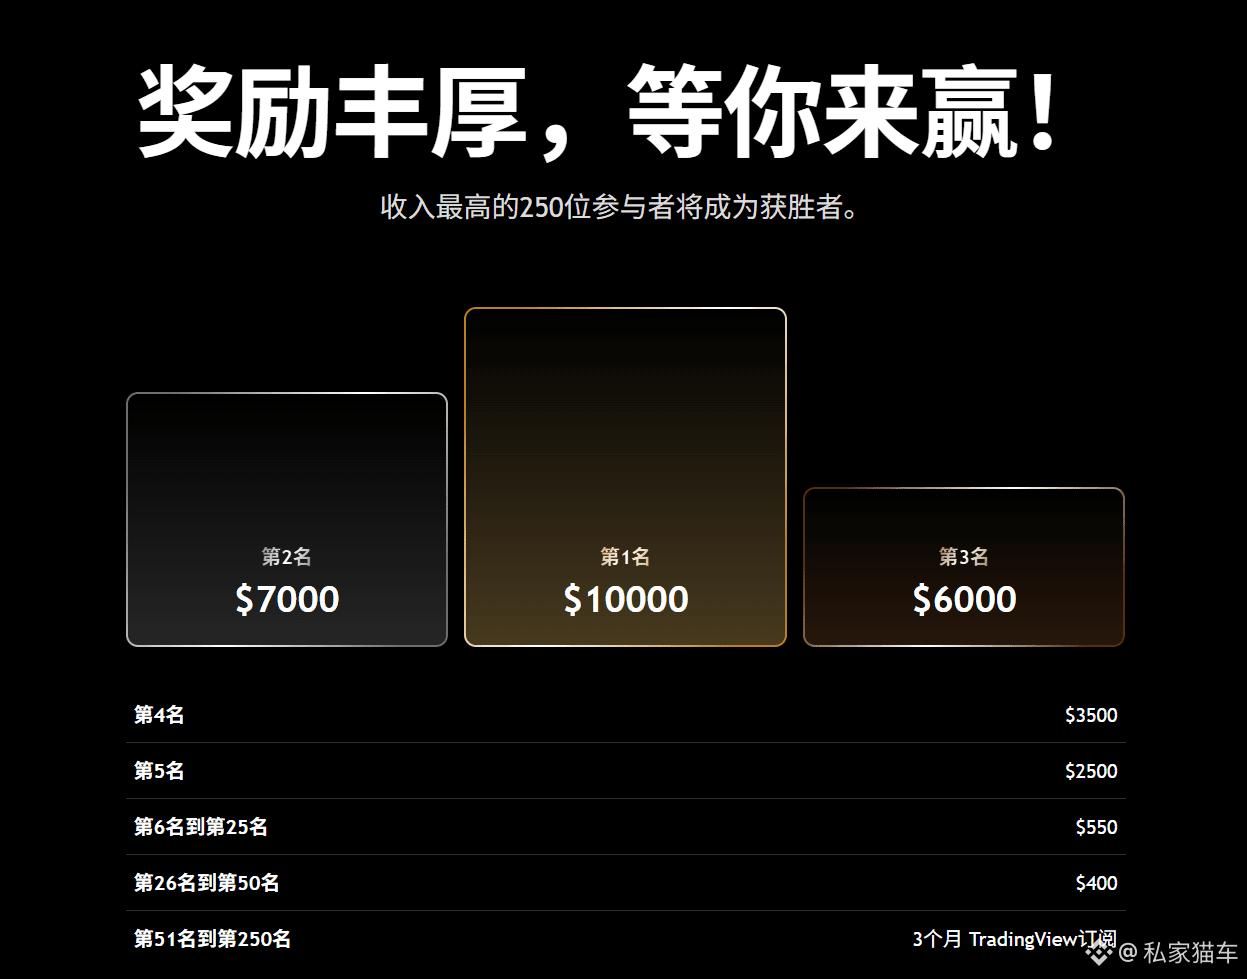
This year’s competition ends at 4:00 PM Beijing time on August 14. Registration closes at 7:59 AM on August 10. Prizes are awarded based on realized profit rankings. The top 50 receive cash prizes, with the champion getting $10,000. Positions ranked 51–250 also receive a 3-month TradingView subscription.
A few rules I think are worth knowing in advance:
The ranking is based on profit and loss from positions that have been closed. Any positions that are still open when the competition ends will be automatically closed and counted. To be eligible for prizes, you must have at least real open or close trades on 5 trading days. Each instrument has a maximum position limit—you can’t add positions indefinitely. Starting balance is $100,000, leverage is 10x, and the fee is $0.85 per contract per side. Regular free accounts can register too; but if you want access to CME real-time quotes during the competition, it’s best to have a TradingView membership or trial.
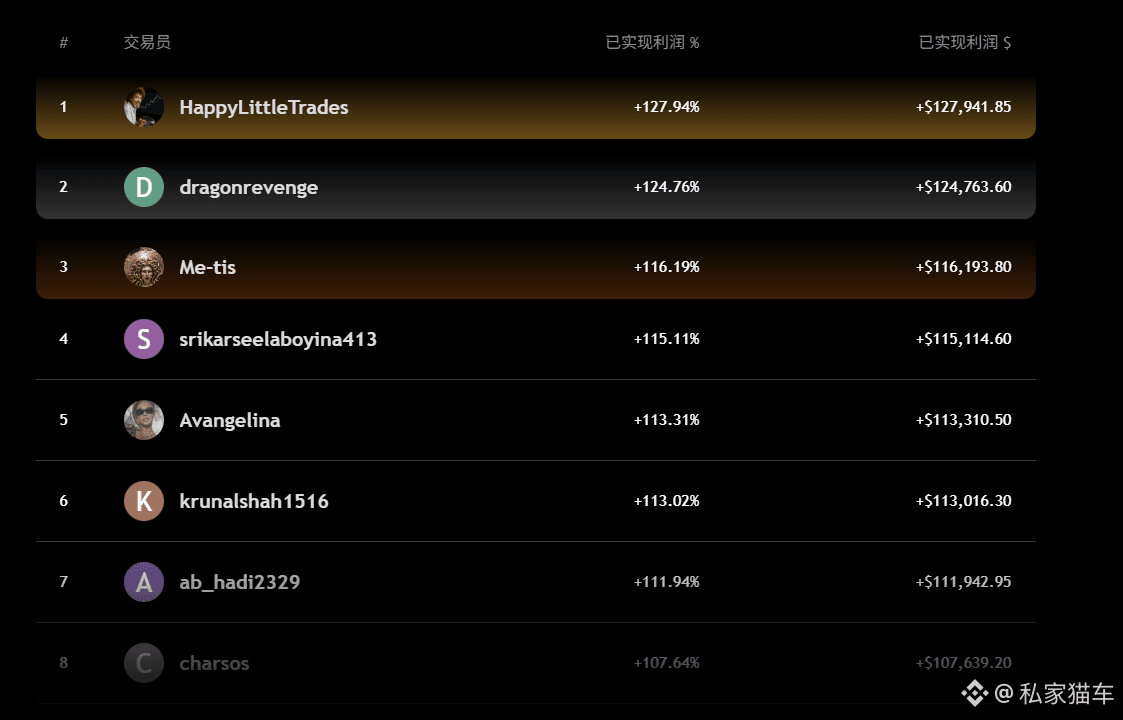
When I found this competition, it was a bit late—there are only about 10 days left now. The current #1 on the leaderboard is already up 127%. In my view, the point of the competition isn’t just to chase prize money; it’s also a good way to see whether you can stick to your trading plan under position limits, trading fees, and the pressure of a leaderboard. If you’re interested, check it out and participate within your means—don’t randomly increase leverage just to chase rankings.
Official registration and rules:
https://cn.tradingview.com/the-leap/tradestation-july-2026/
#TradingView #模拟交易 #交易比赛 #BTC #ETH
I recently discovered a pretty interesting simulated trading competition on TradingView: The Leap. It feels like most people don’t really monitor TradingView all the time—so I haven’t seen many people notice this competition, and I haven’t heard much discussion about it.
It’s not live trading, so there’s no need to deposit money. Everyone gets $100,000 in virtual funds, and you can trade micro BTC, ETH, the NASDAQ 100, the S&P 500, gold, and crude oil—CME futures products. For anyone looking to practice, or test their trading system, I think this is a great opportunity—there are leaderboards, rules, and real prize money, but losses don’t translate into real live trading losses.
This year’s competition ends at 4:00 PM Beijing time on August 14. Registration closes at 7:59 AM on August 10. Prizes are awarded based on realized profit rankings. The top 50 receive cash prizes, with the champion getting $10,000. Positions ranked 51–250 also receive a 3-month TradingView subscription.
A few rules I think are worth knowing in advance:
The ranking is based on profit and loss from positions that have been closed. Any positions that are still open when the competition ends will be automatically closed and counted. To be eligible for prizes, you must have at least real open or close trades on 5 trading days. Each instrument has a maximum position limit—you can’t add positions indefinitely. Starting balance is $100,000, leverage is 10x, and the fee is $0.85 per contract per side. Regular free accounts can register too; but if you want access to CME real-time quotes during the competition, it’s best to have a TradingView membership or trial.
When I found this competition, it was a bit late—there are only about 10 days left now. The current #1 on the leaderboard is already up 127%. In my view, the point of the competition isn’t just to chase prize money; it’s also a good way to see whether you can stick to your trading plan under position limits, trading fees, and the pressure of a leaderboard. If you’re interested, check it out and participate within your means—don’t randomly increase leverage just to chase rankings.
Official registration and rules:
https://cn.tradingview.com/the-leap/tradestation-july-2026/
#TradingView #模拟交易 #交易比赛 #BTC #ETH
It’s not live trading, so there’s no need to deposit money. Everyone gets $100,000 in virtual funds, and you can trade micro BTC, ETH, the NASDAQ 100, the S&P 500, gold, and crude oil—CME futures products. For anyone looking to practice, or test their trading system, I think this is a great opportunity—there are leaderboards, rules, and real prize money, but losses don’t translate into real live trading losses.
This year’s competition ends at 4:00 PM Beijing time on August 14. Registration closes at 7:59 AM on August 10. Prizes are awarded based on realized profit rankings. The top 50 receive cash prizes, with the champion getting $10,000. Positions ranked 51–250 also receive a 3-month TradingView subscription.
A few rules I think are worth knowing in advance:
The ranking is based on profit and loss from positions that have been closed. Any positions that are still open when the competition ends will be automatically closed and counted. To be eligible for prizes, you must have at least real open or close trades on 5 trading days. Each instrument has a maximum position limit—you can’t add positions indefinitely. Starting balance is $100,000, leverage is 10x, and the fee is $0.85 per contract per side. Regular free accounts can register too; but if you want access to CME real-time quotes during the competition, it’s best to have a TradingView membership or trial.
When I found this competition, it was a bit late—there are only about 10 days left now. The current #1 on the leaderboard is already up 127%. In my view, the point of the competition isn’t just to chase prize money; it’s also a good way to see whether you can stick to your trading plan under position limits, trading fees, and the pressure of a leaderboard. If you’re interested, check it out and participate within your means—don’t randomly increase leverage just to chase rankings.
Official registration and rules:
https://cn.tradingview.com/the-leap/tradestation-july-2026/
#TradingView #模拟交易 #交易比赛 #BTC #ETH
1
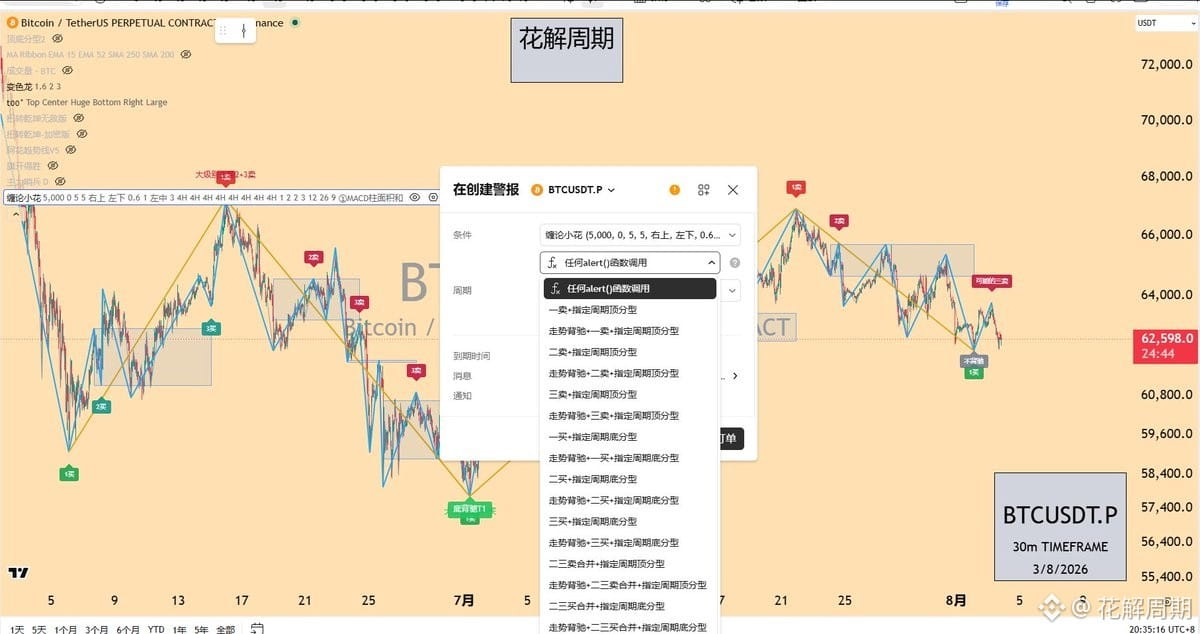
376
·
--
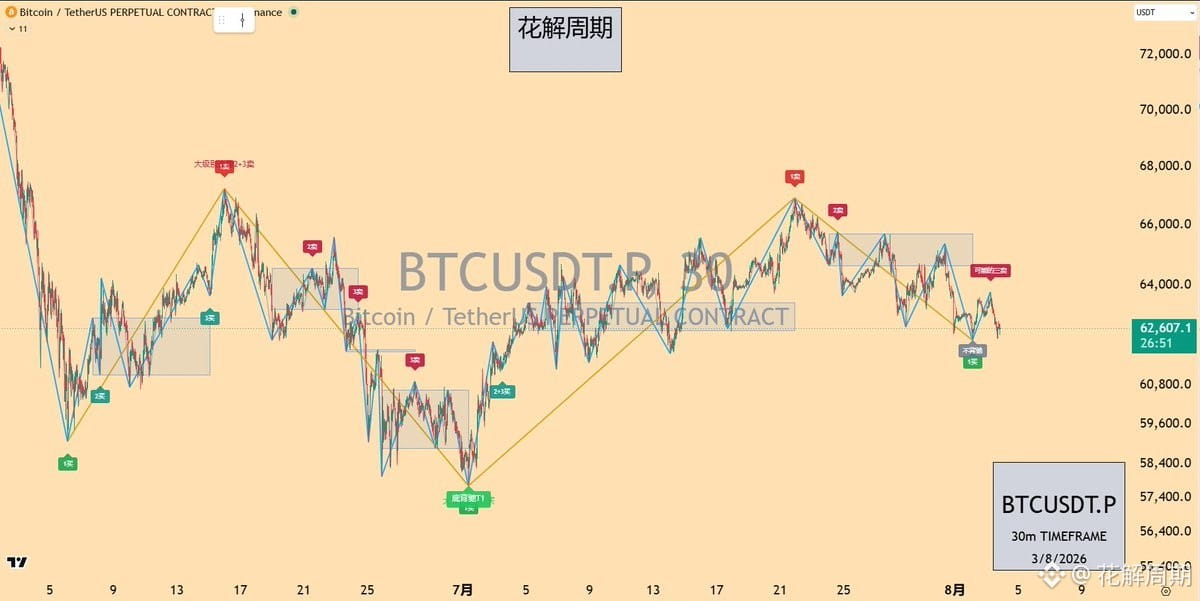
I built a Chan theory system (缠论). Last month I tinkered with it again and ported it to TradingView—after testing for a few weeks, I’m finally able to release it.
🎯 Core Features:
✅ Automatically draws笔画 (strokes) segment-wise centers
✅ Instant marking of three types of buy/sell points (first buy/second buy/third buy)
✅ Divergence detection (trend divergence + range/consolidation divergence)
✅ Real-time alerts with multi-timeframe linkage
✅ Simultaneously indicates multiple possible future developments of the price action
Unlike Chan theory indicators that pursue strict standard definitions, the core idea of this script is: prioritize real-time performance. Mark potential signals (possible buy/sell points) as early as possible—because in live trading, no one waits for you to confirm everything before placing an order.
But it’s important to emphasize: this script is not a mechanical entry signal. It helps you see how the price action is growing—whether the trend shows divergence, whether the central structure is expanding, whether the structure on the smaller timeframe is upgrading. Ultimately, how you trade depends on your own trading horizon and risk preference.
A small issue right now: the “type-2 buy/sell” update is scheduled to be completed before about August 15.
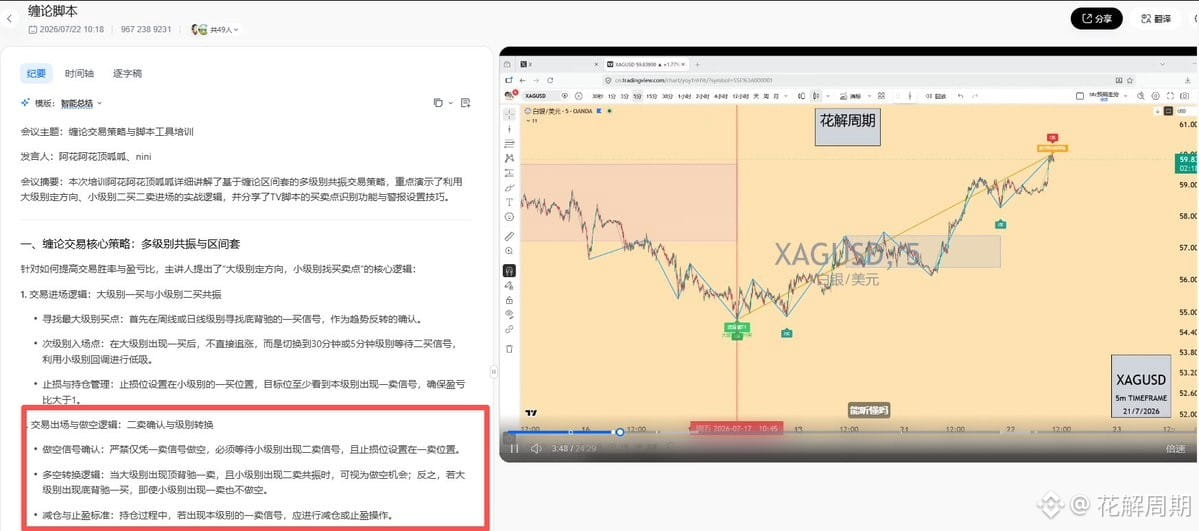
Use SOP, see the video:
Recording: Chan theory script
Date: 2026-07-22 10:18:53
Recording file:
📌 Recommended use: Type-2 buy/sell with the “dual zone” setup, combined with divergence signals and multi-timeframe resonance confirmation.
🎁 Release bonus: Comment a blessing message + share → DM to get 7 days of free trial
💡 During the trial period, provide constructive feedback → extra additional trial time
⚠️ Disclaimer: This indicator is for structural analysis and exchange only and does not constitute any investment advice. The indicator is based on personal understanding and makes trade-offs between real-time performance and accuracy; it may lead to misunderstandings—please use it rationally.
#TradingView #缠论 #缠论指标 #技术分析 #quant tool
Source: @Cycle_King1913 on X
I built a Chan theory system (缠论). Last month I tinkered with it again and ported it to TradingView—after testing for a few weeks, I’m finally able to release it.
🎯 Core Features:
✅ Automatically draws笔画 (strokes) segment-wise centers
✅ Instant marking of three types of buy/sell points (first buy/second buy/third buy)
✅ Divergence detection (trend divergence + range/consolidation divergence)
✅ Real-time alerts with multi-timeframe linkage
✅ Simultaneously indicates multiple possible future developments of the price action
Unlike Chan theory indicators that pursue strict standard definitions, the core idea of this script is: prioritize real-time performance. Mark potential signals (possible buy/sell points) as early as possible—because in live trading, no one waits for you to confirm everything before placing an order.
But it’s important to emphasize: this script is not a mechanical entry signal. It helps you see how the price action is growing—whether the trend shows divergence, whether the central structure is expanding, whether the structure on the smaller timeframe is upgrading. Ultimately, how you trade depends on your own trading horizon and risk preference.
A small issue right now: the “type-2 buy/sell” update is scheduled to be completed before about August 15.
Use SOP, see the video:
Recording: Chan theory script
Date: 2026-07-22 10:18:53
Recording file:
📌 Recommended use: Type-2 buy/sell with the “dual zone” setup, combined with divergence signals and multi-timeframe resonance confirmation.
🎁 Release bonus: Comment a blessing message + share → DM to get 7 days of free trial
💡 During the trial period, provide constructive feedback → extra additional trial time
⚠️ Disclaimer: This indicator is for structural analysis and exchange only and does not constitute any investment advice. The indicator is based on personal understanding and makes trade-offs between real-time performance and accuracy; it may lead to misunderstandings—please use it rationally.
#TradingView #缠论 #缠论指标 #技术分析 #quant tool
Source: @Cycle_King1913 on X
🎯 Core Features:
✅ Automatically draws笔画 (strokes) segment-wise centers
✅ Instant marking of three types of buy/sell points (first buy/second buy/third buy)
✅ Divergence detection (trend divergence + range/consolidation divergence)
✅ Real-time alerts with multi-timeframe linkage
✅ Simultaneously indicates multiple possible future developments of the price action
Unlike Chan theory indicators that pursue strict standard definitions, the core idea of this script is: prioritize real-time performance. Mark potential signals (possible buy/sell points) as early as possible—because in live trading, no one waits for you to confirm everything before placing an order.
But it’s important to emphasize: this script is not a mechanical entry signal. It helps you see how the price action is growing—whether the trend shows divergence, whether the central structure is expanding, whether the structure on the smaller timeframe is upgrading. Ultimately, how you trade depends on your own trading horizon and risk preference.
A small issue right now: the “type-2 buy/sell” update is scheduled to be completed before about August 15.
Use SOP, see the video:
Recording: Chan theory script
Date: 2026-07-22 10:18:53
Recording file:
📌 Recommended use: Type-2 buy/sell with the “dual zone” setup, combined with divergence signals and multi-timeframe resonance confirmation.
🎁 Release bonus: Comment a blessing message + share → DM to get 7 days of free trial
💡 During the trial period, provide constructive feedback → extra additional trial time
⚠️ Disclaimer: This indicator is for structural analysis and exchange only and does not constitute any investment advice. The indicator is based on personal understanding and makes trade-offs between real-time performance and accuracy; it may lead to misunderstandings—please use it rationally.
#TradingView #缠论 #缠论指标 #技术分析 #quant tool
Source: @Cycle_King1913 on X
10
3
5
694

It took me a few months to build three BTC futures quant signal sets with AI assistance.
The three strategies each have their own role:
· SYS03 EMA triple impulse — tracking the main mid-term trend wave; 54 trades over the past year, profit factor 1.46
· SYS05 Volatility Energy Breakout — dual compression of Bollinger Bands + Keltner Channel to capture energy surges; profit factor 1.49
· SYS06 RSI divergence reversal — only 15 trades over the past year; win rate 66.67%, profit factor 3.57, maximum drawdown 0.25%
All of them are backtested on TradingView. You can reproduce the numbers yourself—you don’t have to trust what I say.
If you’re interested, DM me directly on X (Twitter). Limited spots—first come, first served.
#量化交易 #TradingView #quant signal
$BTC $XAUT $HYPE
It took me a few months to build three BTC futures quant signal sets with AI assistance.
The three strategies each have their own role:
· SYS03 EMA triple impulse — tracking the main mid-term trend wave; 54 trades over the past year, profit factor 1.46
· SYS05 Volatility Energy Breakout — dual compression of Bollinger Bands + Keltner Channel to capture energy surges; profit factor 1.49
· SYS06 RSI divergence reversal — only 15 trades over the past year; win rate 66.67%, profit factor 3.57, maximum drawdown 0.25%
All of them are backtested on TradingView. You can reproduce the numbers yourself—you don’t have to trust what I say.
If you’re interested, DM me directly on X (Twitter). Limited spots—first come, first served.
#量化交易 #TradingView #quant signal
$BTC $XAUT $HYPE
The three strategies each have their own role:
· SYS03 EMA triple impulse — tracking the main mid-term trend wave; 54 trades over the past year, profit factor 1.46
· SYS05 Volatility Energy Breakout — dual compression of Bollinger Bands + Keltner Channel to capture energy surges; profit factor 1.49
· SYS06 RSI divergence reversal — only 15 trades over the past year; win rate 66.67%, profit factor 3.57, maximum drawdown 0.25%
All of them are backtested on TradingView. You can reproduce the numbers yourself—you don’t have to trust what I say.
If you’re interested, DM me directly on X (Twitter). Limited spots—first come, first served.
#量化交易 #TradingView #quant signal
$BTC $XAUT $HYPE
80
SYS03’s core logic—in one sentence:
All three EMA moving averages must be aligned in the same direction, and the momentum indicators must be confirmed in sync; only then does the signal trigger.
Why be this strict?
Because I’ve seen too many people enter when they “feel like it’s going up,”
then watch the direction reverse,
but they hold on because there’s “no clear stop-loss point,” until it’s over.
SYS03’s strict conditions are designed to filter out these “looks-like-it” fake signals.
Do less, but every time with a reason.
Search for SYS03 on TradingView and you can run your own backtest.
#TradingView #量化交易 #BTC
$BTC $XAUT $HYPE
SYS03’s core logic—in one sentence:
All three EMA moving averages must be aligned in the same direction, and the momentum indicators must be confirmed in sync; only then does the signal trigger.
Why be this strict?
Because I’ve seen too many people enter when they “feel like it’s going up,”
then watch the direction reverse,
but they hold on because there’s “no clear stop-loss point,” until it’s over.
SYS03’s strict conditions are designed to filter out these “looks-like-it” fake signals.
Do less, but every time with a reason.
Search for SYS03 on TradingView and you can run your own backtest.
#TradingView #量化交易 #BTC
$BTC $XAUT $HYPE
All three EMA moving averages must be aligned in the same direction, and the momentum indicators must be confirmed in sync; only then does the signal trigger.
Why be this strict?
Because I’ve seen too many people enter when they “feel like it’s going up,”
then watch the direction reverse,
but they hold on because there’s “no clear stop-loss point,” until it’s over.
SYS03’s strict conditions are designed to filter out these “looks-like-it” fake signals.
Do less, but every time with a reason.
Search for SYS03 on TradingView and you can run your own backtest.
#TradingView #量化交易 #BTC
$BTC $XAUT $HYPE
149
It took several months to use AI assistance to build 3 sets of BTC futures quantitative signals.
The three strategies each have their own role:
· SYS03 EMA Triple Pulse — tracks the main mid-term trend; 54 trades in the past year, profit factor 1.46
· SYS05 Volatility Energy Breakout — Bollinger Bands + Keltner double squeeze, captures energy explosions, profit factor 1.49
· SYS06 RSI Divergence Reversal — only 15 trades in the past year, win rate 66.67%, profit factor 3.57, maximum drawdown 0.25%
All backtested in TradingView; you can reproduce the numbers yourself, no need to take my word for it.
If you're interested, DM me directly on X (Twitter). Spots are limited, first come, first served.
#量化交易 #TradingView #quantitative signals
$BTC $XAUT $HYPE
It took several months to use AI assistance to build 3 sets of BTC futures quantitative signals.
The three strategies each have their own role:
· SYS03 EMA Triple Pulse — tracks the main mid-term trend; 54 trades in the past year, profit factor 1.46
· SYS05 Volatility Energy Breakout — Bollinger Bands + Keltner double squeeze, captures energy explosions, profit factor 1.49
· SYS06 RSI Divergence Reversal — only 15 trades in the past year, win rate 66.67%, profit factor 3.57, maximum drawdown 0.25%
All backtested in TradingView; you can reproduce the numbers yourself, no need to take my word for it.
If you're interested, DM me directly on X (Twitter). Spots are limited, first come, first served.
#量化交易 #TradingView #quantitative signals
$BTC $XAUT $HYPE
The three strategies each have their own role:
· SYS03 EMA Triple Pulse — tracks the main mid-term trend; 54 trades in the past year, profit factor 1.46
· SYS05 Volatility Energy Breakout — Bollinger Bands + Keltner double squeeze, captures energy explosions, profit factor 1.49
· SYS06 RSI Divergence Reversal — only 15 trades in the past year, win rate 66.67%, profit factor 3.57, maximum drawdown 0.25%
All backtested in TradingView; you can reproduce the numbers yourself, no need to take my word for it.
If you're interested, DM me directly on X (Twitter). Spots are limited, first come, first served.
#量化交易 #TradingView #quantitative signals
$BTC $XAUT $HYPE
142
It took me several months to use AI to build 3 BTC futures quantitative trading signal systems.
Each of the three strategies has its own role:
· SYS03 EMA Triple Pulse — tracks the main wave of the mid-term trend; 54 trades in the past year; profit factor 1.46
· SYS05 Volatility Energy Breakout — double compression with Bollinger Bands + Keltner Channels to capture bursts of energy; profit factor 1.49
· SYS06 RSI Divergence Reversal — only 15 trades in the past year; win rate 66.67%, profit factor 3.57, maximum drawdown 0.25%
All of them are backtested on TradingView. You can reproduce the numbers yourself—no need to trust what I’m saying.
If you’re interested, DM me directly on X (Twitter). Limited spots—first come, first served.
#量化交易 #TradingView #quant signals
$BTC $XAUT $HYPE
It took me several months to use AI to build 3 BTC futures quantitative trading signal systems.
Each of the three strategies has its own role:
· SYS03 EMA Triple Pulse — tracks the main wave of the mid-term trend; 54 trades in the past year; profit factor 1.46
· SYS05 Volatility Energy Breakout — double compression with Bollinger Bands + Keltner Channels to capture bursts of energy; profit factor 1.49
· SYS06 RSI Divergence Reversal — only 15 trades in the past year; win rate 66.67%, profit factor 3.57, maximum drawdown 0.25%
All of them are backtested on TradingView. You can reproduce the numbers yourself—no need to trust what I’m saying.
If you’re interested, DM me directly on X (Twitter). Limited spots—first come, first served.
#量化交易 #TradingView #quant signals
$BTC $XAUT $HYPE
Each of the three strategies has its own role:
· SYS03 EMA Triple Pulse — tracks the main wave of the mid-term trend; 54 trades in the past year; profit factor 1.46
· SYS05 Volatility Energy Breakout — double compression with Bollinger Bands + Keltner Channels to capture bursts of energy; profit factor 1.49
· SYS06 RSI Divergence Reversal — only 15 trades in the past year; win rate 66.67%, profit factor 3.57, maximum drawdown 0.25%
All of them are backtested on TradingView. You can reproduce the numbers yourself—no need to trust what I’m saying.
If you’re interested, DM me directly on X (Twitter). Limited spots—first come, first served.
#量化交易 #TradingView #quant signals
$BTC $XAUT $HYPE
129
Spent a few months using AI to help build 3 BTC futures quantitative signal sets.
Each of the three strategies has its own job:
· SYS03 EMA triple impulse — tracks the main wave of the mid-term trend, 54 trades in the past year, profit factor 1.46
· SYS05 Volatility Energy breakout — double squeeze with Bollinger Bands + Keltner Channels, capturing energy bursts, profit factor 1.49
· SYS06 RSI divergence reversal — only 15 trades in the past year, win rate 66.67%, profit factor 3.57, max drawdown 0.25%
All backtested on TradingView. You can reproduce the numbers yourself—no need to believe me.
If you’re interested, DM me directly on X (Twitter). Limited spots, first come first served.
#量化交易 #TradingView #quant signals
$BTC $XAUT $HYPE
Spent a few months using AI to help build 3 BTC futures quantitative signal sets.
Each of the three strategies has its own job:
· SYS03 EMA triple impulse — tracks the main wave of the mid-term trend, 54 trades in the past year, profit factor 1.46
· SYS05 Volatility Energy breakout — double squeeze with Bollinger Bands + Keltner Channels, capturing energy bursts, profit factor 1.49
· SYS06 RSI divergence reversal — only 15 trades in the past year, win rate 66.67%, profit factor 3.57, max drawdown 0.25%
All backtested on TradingView. You can reproduce the numbers yourself—no need to believe me.
If you’re interested, DM me directly on X (Twitter). Limited spots, first come first served.
#量化交易 #TradingView #quant signals
$BTC $XAUT $HYPE
Each of the three strategies has its own job:
· SYS03 EMA triple impulse — tracks the main wave of the mid-term trend, 54 trades in the past year, profit factor 1.46
· SYS05 Volatility Energy breakout — double squeeze with Bollinger Bands + Keltner Channels, capturing energy bursts, profit factor 1.49
· SYS06 RSI divergence reversal — only 15 trades in the past year, win rate 66.67%, profit factor 3.57, max drawdown 0.25%
All backtested on TradingView. You can reproduce the numbers yourself—no need to believe me.
If you’re interested, DM me directly on X (Twitter). Limited spots, first come first served.
#量化交易 #TradingView #quant signals
$BTC $XAUT $HYPE
98
It took me a few months to use AI to build three BTC futures quantitative trading signal sets.
Each of the three strategies has its own role:
· SYS03 EMA triple impulse — tracking the main wave of the intermediate trend; 54 trades in the past year; profit factor 1.46
· SYS05 Volatility energy breakout — dual squeeze of the Bollinger Bands + Keltner Channels to capture energy surges; profit factor 1.49
· SYS06 RSI divergence reversal — only 15 trades in the past year; win rate 66.67%; profit factor 3.57; maximum drawdown 0.25%
All of them are backtested on TradingView. You can reproduce the numbers yourself—no need to trust what I say.
If you’re interested, DM me directly on X (Twitter). Limited spots—first come, first served.
#量化交易 #TradingView #quant signals
$BTC $XAUT $HYPE
It took me a few months to use AI to build three BTC futures quantitative trading signal sets.
Each of the three strategies has its own role:
· SYS03 EMA triple impulse — tracking the main wave of the intermediate trend; 54 trades in the past year; profit factor 1.46
· SYS05 Volatility energy breakout — dual squeeze of the Bollinger Bands + Keltner Channels to capture energy surges; profit factor 1.49
· SYS06 RSI divergence reversal — only 15 trades in the past year; win rate 66.67%; profit factor 3.57; maximum drawdown 0.25%
All of them are backtested on TradingView. You can reproduce the numbers yourself—no need to trust what I say.
If you’re interested, DM me directly on X (Twitter). Limited spots—first come, first served.
#量化交易 #TradingView #quant signals
$BTC $XAUT $HYPE
Each of the three strategies has its own role:
· SYS03 EMA triple impulse — tracking the main wave of the intermediate trend; 54 trades in the past year; profit factor 1.46
· SYS05 Volatility energy breakout — dual squeeze of the Bollinger Bands + Keltner Channels to capture energy surges; profit factor 1.49
· SYS06 RSI divergence reversal — only 15 trades in the past year; win rate 66.67%; profit factor 3.57; maximum drawdown 0.25%
All of them are backtested on TradingView. You can reproduce the numbers yourself—no need to trust what I say.
If you’re interested, DM me directly on X (Twitter). Limited spots—first come, first served.
#量化交易 #TradingView #quant signals
$BTC $XAUT $HYPE
1
3
2.9k
The core logic of SYS03—explain it in one sentence:
Only when all three EMA moving averages are aligned in the same direction and the momentum indicator confirms at the same time, will a signal be triggered.
Why so strict?
Because I’ve seen too many people enter when they “feel like it’s going up,”
then watch the direction reverse,
but end up holding on because there’s “no clear stop-loss level,” and get wiped out.
SYS03’s strict conditions are designed to filter out those “signals that look like” they’re real.
Do less, but every single time has a reason.
Search for SYS03 on TradingView and run your own backtest.
#TradingView #量化交易 #BTC
$BTC $XAUT $HYPE
The core logic of SYS03—explain it in one sentence:
Only when all three EMA moving averages are aligned in the same direction and the momentum indicator confirms at the same time, will a signal be triggered.
Why so strict?
Because I’ve seen too many people enter when they “feel like it’s going up,”
then watch the direction reverse,
but end up holding on because there’s “no clear stop-loss level,” and get wiped out.
SYS03’s strict conditions are designed to filter out those “signals that look like” they’re real.
Do less, but every single time has a reason.
Search for SYS03 on TradingView and run your own backtest.
#TradingView #量化交易 #BTC
$BTC $XAUT $HYPE
Only when all three EMA moving averages are aligned in the same direction and the momentum indicator confirms at the same time, will a signal be triggered.
Why so strict?
Because I’ve seen too many people enter when they “feel like it’s going up,”
then watch the direction reverse,
but end up holding on because there’s “no clear stop-loss level,” and get wiped out.
SYS03’s strict conditions are designed to filter out those “signals that look like” they’re real.
Do less, but every single time has a reason.
Search for SYS03 on TradingView and run your own backtest.
#TradingView #量化交易 #BTC
$BTC $XAUT $HYPE
1
5.8k
SYS03’s core logic, explained in one sentence:
All three EMA moving averages must be aligned in the same direction, and the momentum indicators must confirm at the same time—only then does a signal trigger.
Why be this strict?
Because I’ve seen too many people enter when they “feel it’s about to go up,”
then watch the direction reverse,
but end up stubbornly holding on because they “don’t have a clear stop-loss point,”
thus getting wiped out.
SYS03’s strict conditions are designed to filter out these “looks-like” fake signals.
Do less, but every trade has a reason.
Search for SYS03 on TradingView and run your own backtest.
#TradingView #量化交易 #BTC
$BTC $XAUT $HYPE
SYS03’s core logic, explained in one sentence:
All three EMA moving averages must be aligned in the same direction, and the momentum indicators must confirm at the same time—only then does a signal trigger.
Why be this strict?
Because I’ve seen too many people enter when they “feel it’s about to go up,”
then watch the direction reverse,
but end up stubbornly holding on because they “don’t have a clear stop-loss point,”
thus getting wiped out.
SYS03’s strict conditions are designed to filter out these “looks-like” fake signals.
Do less, but every trade has a reason.
Search for SYS03 on TradingView and run your own backtest.
#TradingView #量化交易 #BTC
$BTC $XAUT $HYPE
All three EMA moving averages must be aligned in the same direction, and the momentum indicators must confirm at the same time—only then does a signal trigger.
Why be this strict?
Because I’ve seen too many people enter when they “feel it’s about to go up,”
then watch the direction reverse,
but end up stubbornly holding on because they “don’t have a clear stop-loss point,”
thus getting wiped out.
SYS03’s strict conditions are designed to filter out these “looks-like” fake signals.
Do less, but every trade has a reason.
Search for SYS03 on TradingView and run your own backtest.
#TradingView #量化交易 #BTC
$BTC $XAUT $HYPE
2
1.1k
The core logic of SYS03, explained in one sentence:
All three EMA moving averages must be aligned in the same direction, and the momentum indicators must confirm at the same time—only then will a signal be triggered.
Why be so strict?
Because I’ve seen too many people enter when they “feel it’s going up,”
only to watch the direction reverse, and then hold on because they “don’t have a clear stop-loss point” and end up getting wiped out.
SYS03’s strict conditions are designed to filter out those “looks-like” false signals.
Do less, but every time has a reason.
On TradingView, search for SYS03 and you can run your own backtest.
#TradingView #量化交易 #BTC
$BTC $XAUT $HYPE
The core logic of SYS03, explained in one sentence:
All three EMA moving averages must be aligned in the same direction, and the momentum indicators must confirm at the same time—only then will a signal be triggered.
Why be so strict?
Because I’ve seen too many people enter when they “feel it’s going up,”
only to watch the direction reverse, and then hold on because they “don’t have a clear stop-loss point” and end up getting wiped out.
SYS03’s strict conditions are designed to filter out those “looks-like” false signals.
Do less, but every time has a reason.
On TradingView, search for SYS03 and you can run your own backtest.
#TradingView #量化交易 #BTC
$BTC $XAUT $HYPE
All three EMA moving averages must be aligned in the same direction, and the momentum indicators must confirm at the same time—only then will a signal be triggered.
Why be so strict?
Because I’ve seen too many people enter when they “feel it’s going up,”
only to watch the direction reverse, and then hold on because they “don’t have a clear stop-loss point” and end up getting wiped out.
SYS03’s strict conditions are designed to filter out those “looks-like” false signals.
Do less, but every time has a reason.
On TradingView, search for SYS03 and you can run your own backtest.
#TradingView #量化交易 #BTC
$BTC $XAUT $HYPE
93

·
--
"Is $NEAR really just consolidating, or is there more to this 30% range?"
Right now, $NEAR is trading in a 30% range, with the last sitting 30% of the way up from the low. The 24h change is minimal, suggesting traders are hesitant to commit to a direction. This could signal a consolidation phase, but it might also hint at a potential breakout if the bulls regain momentum.
The next level to watch is the 30% resistance, where a breakout could signal stronger upward momentum. Traders should keep an eye on volume and order flow to gauge the strength of any potential move.
What are you watching on $NEAR right now?
$NEAR — on my screen today.
#near #cryptotrading #altcoins #tradingview
"Is $NEAR really just consolidating, or is there more to this 30% range?"
Right now, $NEAR is trading in a 30% range, with the last sitting 30% of the way up from the low. The 24h change is minimal, suggesting traders are hesitant to commit to a direction. This could signal a consolidation phase, but it might also hint at a potential breakout if the bulls regain momentum.
The next level to watch is the 30% resistance, where a breakout could signal stronger upward momentum. Traders should keep an eye on volume and order flow to gauge the strength of any potential move.
What are you watching on $NEAR right now?
$NEAR — on my screen today.
#near #cryptotrading #altcoins #tradingview
Right now, $NEAR is trading in a 30% range, with the last sitting 30% of the way up from the low. The 24h change is minimal, suggesting traders are hesitant to commit to a direction. This could signal a consolidation phase, but it might also hint at a potential breakout if the bulls regain momentum.
The next level to watch is the 30% resistance, where a breakout could signal stronger upward momentum. Traders should keep an eye on volume and order flow to gauge the strength of any potential move.
What are you watching on $NEAR right now?
$NEAR — on my screen today.
#near #cryptotrading #altcoins #tradingview
26
Log in to explore more content
Join global crypto users on Binance Square
⚡️ Get latest and useful information about crypto.
💬 Trusted by the world’s largest crypto exchange.
👍 Discover real insights from verified creators.
Email / Phone number
Trending Topics
1
#CircleMints500MUSDCOnSolana
133,514 views
2,516 Discussing
2
#PolymarketBankFailureBetsDrawFDICConcern
120,040 views
2,080 Discussing
3
#BlackRockBuildsTokenizedPortfoliosForOndo
116,194 views
1,492 Discussing
4
#BitwiseFilesToListNEARETFOnNYSEArca
82,530 views
1,185 Discussing
5
#SECCommissionerPeirceToLeaveOct2
89,273 views
971 Discussing
6
#SECSaysBuybacksUpgradesDontMakeTokenSecurity
67,190 views
687 Discussing
7
#StrategyProposesDailyDividendsForPreferreds
18,196 views
259 Discussing
8
#CircleTetherFreezeBitgetHackerWallet
16,445 views
151 Discussing
9
#CoinMarketCapCompletesCoinglassAcquisition
18,706 views
212 Discussing
10
#QNTRises39%
133,340 views
1,762 Discussing