
#relativestrengthindex
relativestrengthindex
1,856 views
13 Discussing
Hot
Latest

📊 RSI: OVERBOUGHT DOESN'T MEAN SELL. OVERSOLD DOESN'T MEAN BUY.
.
One of the most misunderstood indicators in crypto trading is the Relative Strength Index (RSI).
.
Many traders see RSI above 70 and immediately look for a short. Others see it below 30 and rush to buy the dip.
.
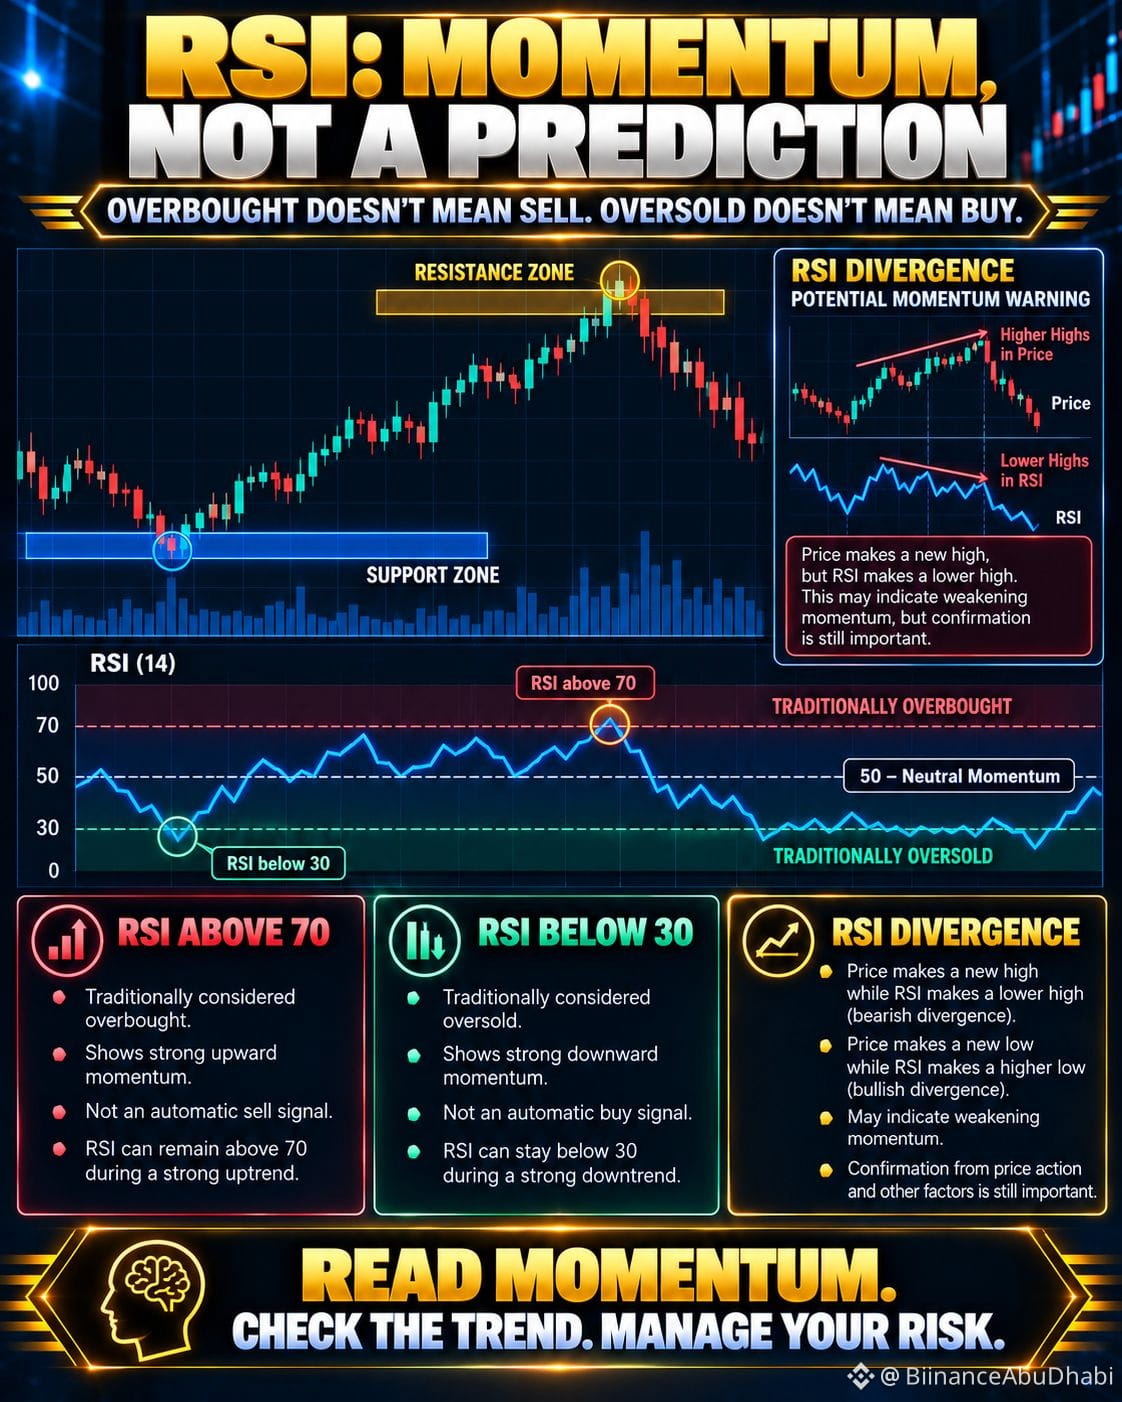
⚠️ But here's the catch: RSI measures momentum, not the market's next destination.
.
🧠 HOW TO READ RSI
.
🔹 RSI above 70 — Traditionally overbought
* Buying momentum has been strong. But in a powerful uptrend, RSI can remain elevated while price continues climbing.
.
🔹 RSI below 30 — Traditionally oversold
* Selling momentum has been strong. But during a strong downtrend, RSI can stay low while price continues falling.
.
🔹 RSI around 50 — A momentum reference
* Holding above 50 can support a bullish momentum interpretation, while staying below 50 may suggest weaker momentum. Always consider the wider chart structure.
.
🔹 RSI divergence — A warning, not a guarantee
* If price makes a new high while RSI makes a lower high, bullish momentum may be weakening. The same principle applies in reverse during declines. Divergence alone does not confirm a reversal.
.
📈 HOW EXPERIENCED TRADERS USE IT
.
Don't isolate RSI from the rest of your analysis.
.
Combine it with:
✅ Support and resistance
✅ Price structure and trend direction
✅ Volume and other relevant indicators
✅ A clear entry plan and risk management
.
💡 THE BIG LESSON
.
An indicator can describe what the market is doing without telling you exactly what it will do next.
.
Use RSI to ask better questions—not to make automatic trading decisions.
.
💬 When analyzing Bitcoin, do you prefer RSI 14, shorter-period RSI for faster signals, or RSI combined with price action? What's your reasoning?
.
#BTC $BTC #BinanceSquare #RelativeStrengthIndex
📊 RSI: OVERBOUGHT DOESN'T MEAN SELL. OVERSOLD DOESN'T MEAN BUY.
.
One of the most misunderstood indicators in crypto trading is the Relative Strength Index (RSI).
.
Many traders see RSI above 70 and immediately look for a short. Others see it below 30 and rush to buy the dip.
.
⚠️ But here's the catch: RSI measures momentum, not the market's next destination.
.
🧠 HOW TO READ RSI
.
🔹 RSI above 70 — Traditionally overbought
* Buying momentum has been strong. But in a powerful uptrend, RSI can remain elevated while price continues climbing.
.
🔹 RSI below 30 — Traditionally oversold
* Selling momentum has been strong. But during a strong downtrend, RSI can stay low while price continues falling.
.
🔹 RSI around 50 — A momentum reference
* Holding above 50 can support a bullish momentum interpretation, while staying below 50 may suggest weaker momentum. Always consider the wider chart structure.
.
🔹 RSI divergence — A warning, not a guarantee
* If price makes a new high while RSI makes a lower high, bullish momentum may be weakening. The same principle applies in reverse during declines. Divergence alone does not confirm a reversal.
.
📈 HOW EXPERIENCED TRADERS USE IT
.
Don't isolate RSI from the rest of your analysis.
.
Combine it with:
✅ Support and resistance
✅ Price structure and trend direction
✅ Volume and other relevant indicators
✅ A clear entry plan and risk management
.
💡 THE BIG LESSON
.
An indicator can describe what the market is doing without telling you exactly what it will do next.
.
Use RSI to ask better questions—not to make automatic trading decisions.
.
💬 When analyzing Bitcoin, do you prefer RSI 14, shorter-period RSI for faster signals, or RSI combined with price action? What's your reasoning?
.
#BTC $BTC #BinanceSquare #RelativeStrengthIndex
.
One of the most misunderstood indicators in crypto trading is the Relative Strength Index (RSI).
.
Many traders see RSI above 70 and immediately look for a short. Others see it below 30 and rush to buy the dip.
.
⚠️ But here's the catch: RSI measures momentum, not the market's next destination.
.
🧠 HOW TO READ RSI
.
🔹 RSI above 70 — Traditionally overbought
* Buying momentum has been strong. But in a powerful uptrend, RSI can remain elevated while price continues climbing.
.
🔹 RSI below 30 — Traditionally oversold
* Selling momentum has been strong. But during a strong downtrend, RSI can stay low while price continues falling.
.
🔹 RSI around 50 — A momentum reference
* Holding above 50 can support a bullish momentum interpretation, while staying below 50 may suggest weaker momentum. Always consider the wider chart structure.
.
🔹 RSI divergence — A warning, not a guarantee
* If price makes a new high while RSI makes a lower high, bullish momentum may be weakening. The same principle applies in reverse during declines. Divergence alone does not confirm a reversal.
.
📈 HOW EXPERIENCED TRADERS USE IT
.
Don't isolate RSI from the rest of your analysis.
.
Combine it with:
✅ Support and resistance
✅ Price structure and trend direction
✅ Volume and other relevant indicators
✅ A clear entry plan and risk management
.
💡 THE BIG LESSON
.
An indicator can describe what the market is doing without telling you exactly what it will do next.
.
Use RSI to ask better questions—not to make automatic trading decisions.
.
💬 When analyzing Bitcoin, do you prefer RSI 14, shorter-period RSI for faster signals, or RSI combined with price action? What's your reasoning?
.
#BTC $BTC #BinanceSquare #RelativeStrengthIndex
56


·
--

Article
Understanding the Relative Strength Index: RSIWelcome to the thirteenth day of our educational series. Yesterday we unlocked the power of moving averages to track dynamic trends. Today we are introducing a legendary momentum indicator that helps you answer one of the most critical questions in trading: is an asset currently too expensive to buy, or is it priced at a steep discount? This tool is known as the Relative Strength Index, or RSI.
What is the Relative Strength Index?
The Relative Strength Index is a popular technical oscillator that measures the speed and change of price movements. Unlike moving averages that sit directly on top of your candlesticks, the RSI is displayed in a separate panel below your main price chart. It features a single line that fluctuates back and forth within a fixed mathematical boundary from 0 to 100.
By analyzing where this line sits, you can instantly gauge the internal velocity of a market trend. The standard setting for this indicator tracks the last 14 candlesticks of data. The absolute core of mastering the RSI lies in understanding two critical zones: the overbought boundary and the oversold boundary.
The Two Critical Boundaries: Overbought vs Oversold
To read the indicator effectively, you only need to focus on two key horizontal lines typically drawn at the 70 and 30 levels:
The Overbought Zone (Above 70): When the indicator line climbs above 70, it signals that buying momentum has been exceptionally aggressive and the price has likely extended too far upward. The asset is considered overbought, warning you that the current rally is getting exhausted and a market pullback or correction is highly probable.
* The Oversold Zone (Below 30): When the indicator line drops below 30, it signals that intense selling pressure has pushed the price down rapidly. The asset is considered oversold, indicating that the selling momentum is overextended and a potential upward bounce or trend reversal is right around the corner.
How to Use RSI for Strategic Entries and Exits
The simplest way to integrate this tool into your daily routine is using it as a confirmation shield before executing a trade.
If you are looking to buy an asset because it hit a support floor, check the RSI panel. If the line is sitting deeply in the oversold zone below 30, it provides powerful confirmation that sellers are exhausted, making it a highly calculated, safer entry point. Conversely, if you are tempted to chase a parabolic green rally, but you glance down and see the RSI screaming above 80, it tells you to hold back. Buying at extreme overbought levels often means you are purchasing right before the market reverses.
Creator's Advice: Avoid the Constant Oversold Trap
A frequent mistake made by beginner analysts is assuming an asset must instantly rally the exact second the RSI touches 29. During an incredibly powerful, macro bear market or sudden panic dump, an asset can remain deeply pinned in the oversold zone for days or weeks at a time while the price continues to slide downward. Never rely on the RSI blindly by itself. Always pair it with the support zones and moving averages we practiced earlier to confirm a true structural reversal before deploying your capital.
Tomorrow we will conclude our intensive technical analysis week by looking at Volume and Market Liquidity, teaching you how to spot fake market moves from genuine institutional breakouts. For today, your practical task is to go to your charting panel, find the RSI indicator, ensure the parameters are set to 14, and locate an asset that is currently overextended on the 4-hour timeframe.
#TechnicalAnalysis #Relativestrengthindex #RSIIndicator #CryptoTrading.
Understanding the Relative Strength Index: RSI
Welcome to the thirteenth day of our educational series. Yesterday we unlocked the power of moving averages to track dynamic trends. Today we are introducing a legendary momentum indicator that helps you answer one of the most critical questions in trading: is an asset currently too expensive to buy, or is it priced at a steep discount? This tool is known as the Relative Strength Index, or RSI.
What is the Relative Strength Index?
The Relative Strength Index is a popular technical oscillator that measures the speed and change of price movements. Unlike moving averages that sit directly on top of your candlesticks, the RSI is displayed in a separate panel below your main price chart. It features a single line that fluctuates back and forth within a fixed mathematical boundary from 0 to 100.
By analyzing where this line sits, you can instantly gauge the internal velocity of a market trend. The standard setting for this indicator tracks the last 14 candlesticks of data. The absolute core of mastering the RSI lies in understanding two critical zones: the overbought boundary and the oversold boundary.
The Two Critical Boundaries: Overbought vs Oversold
To read the indicator effectively, you only need to focus on two key horizontal lines typically drawn at the 70 and 30 levels:
The Overbought Zone (Above 70): When the indicator line climbs above 70, it signals that buying momentum has been exceptionally aggressive and the price has likely extended too far upward. The asset is considered overbought, warning you that the current rally is getting exhausted and a market pullback or correction is highly probable.
* The Oversold Zone (Below 30): When the indicator line drops below 30, it signals that intense selling pressure has pushed the price down rapidly. The asset is considered oversold, indicating that the selling momentum is overextended and a potential upward bounce or trend reversal is right around the corner.
How to Use RSI for Strategic Entries and Exits
The simplest way to integrate this tool into your daily routine is using it as a confirmation shield before executing a trade.
If you are looking to buy an asset because it hit a support floor, check the RSI panel. If the line is sitting deeply in the oversold zone below 30, it provides powerful confirmation that sellers are exhausted, making it a highly calculated, safer entry point. Conversely, if you are tempted to chase a parabolic green rally, but you glance down and see the RSI screaming above 80, it tells you to hold back. Buying at extreme overbought levels often means you are purchasing right before the market reverses.
Creator's Advice: Avoid the Constant Oversold Trap
A frequent mistake made by beginner analysts is assuming an asset must instantly rally the exact second the RSI touches 29. During an incredibly powerful, macro bear market or sudden panic dump, an asset can remain deeply pinned in the oversold zone for days or weeks at a time while the price continues to slide downward. Never rely on the RSI blindly by itself. Always pair it with the support zones and moving averages we practiced earlier to confirm a true structural reversal before deploying your capital.
Tomorrow we will conclude our intensive technical analysis week by looking at Volume and Market Liquidity, teaching you how to spot fake market moves from genuine institutional breakouts. For today, your practical task is to go to your charting panel, find the RSI indicator, ensure the parameters are set to 14, and locate an asset that is currently overextended on the 4-hour timeframe.
#TechnicalAnalysis #Relativestrengthindex #RSIIndicator #CryptoTrading.
What is the Relative Strength Index?
The Relative Strength Index is a popular technical oscillator that measures the speed and change of price movements. Unlike moving averages that sit directly on top of your candlesticks, the RSI is displayed in a separate panel below your main price chart. It features a single line that fluctuates back and forth within a fixed mathematical boundary from 0 to 100.
By analyzing where this line sits, you can instantly gauge the internal velocity of a market trend. The standard setting for this indicator tracks the last 14 candlesticks of data. The absolute core of mastering the RSI lies in understanding two critical zones: the overbought boundary and the oversold boundary.
The Two Critical Boundaries: Overbought vs Oversold
To read the indicator effectively, you only need to focus on two key horizontal lines typically drawn at the 70 and 30 levels:
The Overbought Zone (Above 70): When the indicator line climbs above 70, it signals that buying momentum has been exceptionally aggressive and the price has likely extended too far upward. The asset is considered overbought, warning you that the current rally is getting exhausted and a market pullback or correction is highly probable.
* The Oversold Zone (Below 30): When the indicator line drops below 30, it signals that intense selling pressure has pushed the price down rapidly. The asset is considered oversold, indicating that the selling momentum is overextended and a potential upward bounce or trend reversal is right around the corner.
How to Use RSI for Strategic Entries and Exits
The simplest way to integrate this tool into your daily routine is using it as a confirmation shield before executing a trade.
If you are looking to buy an asset because it hit a support floor, check the RSI panel. If the line is sitting deeply in the oversold zone below 30, it provides powerful confirmation that sellers are exhausted, making it a highly calculated, safer entry point. Conversely, if you are tempted to chase a parabolic green rally, but you glance down and see the RSI screaming above 80, it tells you to hold back. Buying at extreme overbought levels often means you are purchasing right before the market reverses.
Creator's Advice: Avoid the Constant Oversold Trap
A frequent mistake made by beginner analysts is assuming an asset must instantly rally the exact second the RSI touches 29. During an incredibly powerful, macro bear market or sudden panic dump, an asset can remain deeply pinned in the oversold zone for days or weeks at a time while the price continues to slide downward. Never rely on the RSI blindly by itself. Always pair it with the support zones and moving averages we practiced earlier to confirm a true structural reversal before deploying your capital.
Tomorrow we will conclude our intensive technical analysis week by looking at Volume and Market Liquidity, teaching you how to spot fake market moves from genuine institutional breakouts. For today, your practical task is to go to your charting panel, find the RSI indicator, ensure the parameters are set to 14, and locate an asset that is currently overextended on the 4-hour timeframe.
#TechnicalAnalysis #Relativestrengthindex #RSIIndicator #CryptoTrading.
14
9
724

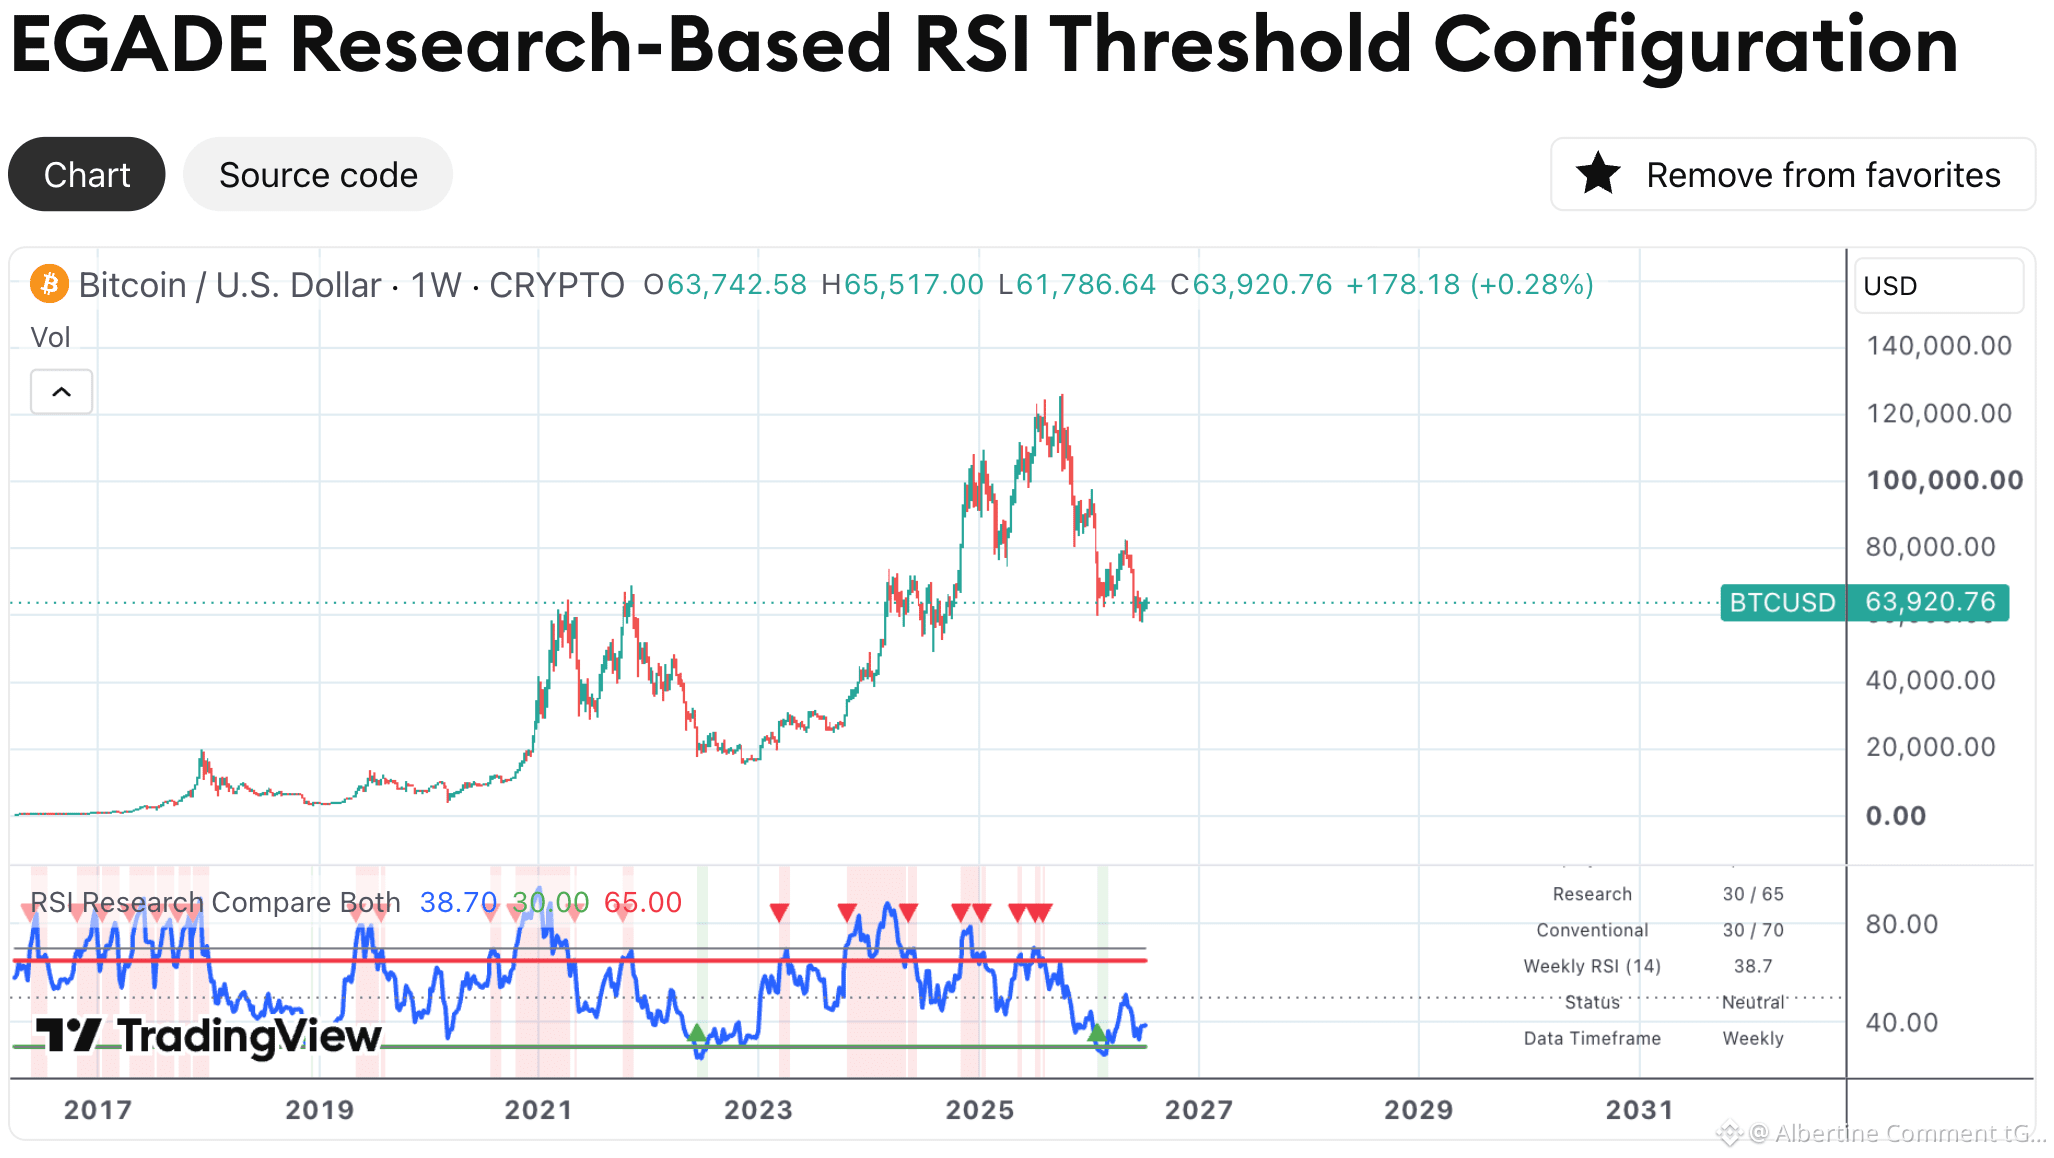
The EGADE Research-Based RSI Threshold Configuration, a new open-source TradingView indicator developed as a practical extension of our research:
“RSI Threshold Configurations and Signal Behaviour in Cryptocurrency and Traditional Markets: An Empirical Analysis on Weekly Data”
Co-authored with Dr. Federico Trigos and Francisco Valderrey, the research was presented at the 33rd International Conference on Transdisciplinary Engineering (TE2026) in Taiwan, and the paper is expected to be published in the conference proceedings in October 2026.
Our study systematically examines RSI threshold configurations across nine major cryptocurrencies and the S&P 500, challenging the assumption that the conventional 30/70 RSI configuration is universally dominant. The findings show that RSI threshold behaviour varies considerably across assets and that alternative configurations can outperform the conventional setting within the historical samples examined.
The EGADE Research-Based RSI Threshold Configuration translates these empirical findings into an accessible decision-support indicator on TradingView. Users can display the research-based configuration for each studied asset, compare it directly with the conventional 30/70 thresholds, and visually explore how the findings operate on weekly market data.
Access the indicator here:
https://www.tradingview.com/script/4pwHBqyZ-EGADE-Research-Based-RSI-Threshold-Configuration/
The indicator and its underlying findings are intended exclusively for academic, research, educational, and decision-support purposes. They do not constitute financial advice, investment recommendations, or a solicitation to buy or sell any financial instrument.
#TradingView #RSI #TechnicalAnalysis #HatemMabrouk #RelativeStrengthIndex
The EGADE Research-Based RSI Threshold Configuration, a new open-source TradingView indicator developed as a practical extension of our research:
“RSI Threshold Configurations and Signal Behaviour in Cryptocurrency and Traditional Markets: An Empirical Analysis on Weekly Data”
Co-authored with Dr. Federico Trigos and Francisco Valderrey, the research was presented at the 33rd International Conference on Transdisciplinary Engineering (TE2026) in Taiwan, and the paper is expected to be published in the conference proceedings in October 2026.
Our study systematically examines RSI threshold configurations across nine major cryptocurrencies and the S&P 500, challenging the assumption that the conventional 30/70 RSI configuration is universally dominant. The findings show that RSI threshold behaviour varies considerably across assets and that alternative configurations can outperform the conventional setting within the historical samples examined.
The EGADE Research-Based RSI Threshold Configuration translates these empirical findings into an accessible decision-support indicator on TradingView. Users can display the research-based configuration for each studied asset, compare it directly with the conventional 30/70 thresholds, and visually explore how the findings operate on weekly market data.
Access the indicator here:
https://www.tradingview.com/script/4pwHBqyZ-EGADE-Research-Based-RSI-Threshold-Configuration/
The indicator and its underlying findings are intended exclusively for academic, research, educational, and decision-support purposes. They do not constitute financial advice, investment recommendations, or a solicitation to buy or sell any financial instrument.
#TradingView #RSI #TechnicalAnalysis #HatemMabrouk #RelativeStrengthIndex
“RSI Threshold Configurations and Signal Behaviour in Cryptocurrency and Traditional Markets: An Empirical Analysis on Weekly Data”
Co-authored with Dr. Federico Trigos and Francisco Valderrey, the research was presented at the 33rd International Conference on Transdisciplinary Engineering (TE2026) in Taiwan, and the paper is expected to be published in the conference proceedings in October 2026.
Our study systematically examines RSI threshold configurations across nine major cryptocurrencies and the S&P 500, challenging the assumption that the conventional 30/70 RSI configuration is universally dominant. The findings show that RSI threshold behaviour varies considerably across assets and that alternative configurations can outperform the conventional setting within the historical samples examined.
The EGADE Research-Based RSI Threshold Configuration translates these empirical findings into an accessible decision-support indicator on TradingView. Users can display the research-based configuration for each studied asset, compare it directly with the conventional 30/70 thresholds, and visually explore how the findings operate on weekly market data.
Access the indicator here:
https://www.tradingview.com/script/4pwHBqyZ-EGADE-Research-Based-RSI-Threshold-Configuration/
The indicator and its underlying findings are intended exclusively for academic, research, educational, and decision-support purposes. They do not constitute financial advice, investment recommendations, or a solicitation to buy or sell any financial instrument.
#TradingView #RSI #TechnicalAnalysis #HatemMabrouk #RelativeStrengthIndex
122
Log in to explore more content
Join global crypto users on Binance Square
⚡️ Get latest and useful information about crypto.
💬 Trusted by the world’s largest crypto exchange.
👍 Discover real insights from verified creators.
Email / Phone number
Trending Topics
1
#BinanceReopensWithdrawalsForMoreAssets
34,741 views
800 Discussing
2
#AppleReportsMixedResults
21,697 views
578 Discussing
3
#BinanceHourlyDepositsExceedWithdrawals
8,007 views
240 Discussing
4
#PalantirSlides3PercentOn$2BRevenue
570 views
12 Discussing
5
#USMidtermElections
734,544 views
3,993 Discussing
6
#ThailandSECProposesDerivativesLicensesForDigitalAssetOperators
2 views
1 Discussing
7
#Nasdaq100EntersCorrection
305 views
20 Discussing
8
#USOctoberNFP-AreRateCutsStillPossible
121,087 views
1,007 Discussing
9
#Verify1to1BinanceReserves
110,727 views
747 Discussing
10
#YuanbiTechnologyAnnouncesUSDollarRDUSDPlan
45 views
7 Discussing