
Lina Indicators
517 Posts
Lina Indicators
Report
Block User
Data-driven crypto research | Market structure • Momentum • Risk education | Personal views, not financial advice | X: @Lina_Indicator
270 Following
538 Followers
2.4K+ Liked
Posts
All
Quotes
Videos
PINNED
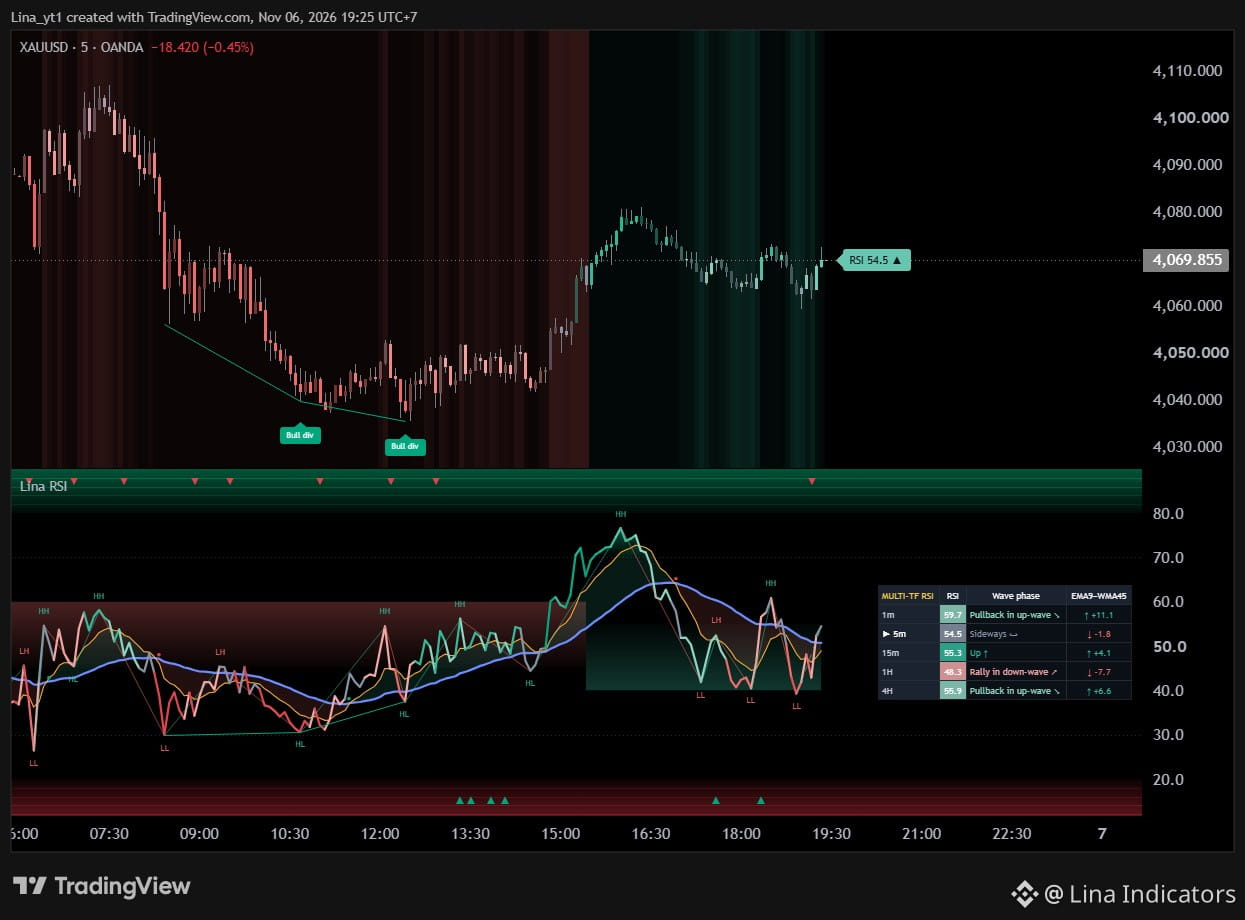
**Free indicator: Lina RSI is now on TradingView**
Most traders use RSI only for overbought / oversold. Lina RSI reads it as waves, so trend, pullbacks and exhaustion are visible at a glance.
What you get:
• 7-phase RSI line, from strong up to strong down
• Trend pullback band where with-trend entries usually form
• Smooth extreme-zone fill
• RSI zigzag with HH / HL / LH / LL labels
• Regular divergence on RSI and price
• Pullback completed / failed marks
• Candle colors and trend background on the price chart
• Auto 5-timeframe RSI table
• 6 alerts
How to use it: green candles = look for longs, red = look for shorts. Wait for RSI to pull back into the band and complete before joining the trend. Don't chase in the extreme zone.
100% free. No sign-up, no conditions.
→ tradingview.com/script/qFbYduhk-Lina-RSI-Wave-Phase-RSI-with-Trend-Pullback-Zones/
$BTC $ETH #Gold #TradingView #RSI #TechnicalAnalysis
Not financial advice. Always manage your risk.
**Free indicator: Lina RSI is now on TradingView**
Most traders use RSI only for overbought / oversold. Lina RSI reads it as waves, so trend, pullbacks and exhaustion are visible at a glance.
What you get:
• 7-phase RSI line, from strong up to strong down
• Trend pullback band where with-trend entries usually form
• Smooth extreme-zone fill
• RSI zigzag with HH / HL / LH / LL labels
• Regular divergence on RSI and price
• Pullback completed / failed marks
• Candle colors and trend background on the price chart
• Auto 5-timeframe RSI table
• 6 alerts
How to use it: green candles = look for longs, red = look for shorts. Wait for RSI to pull back into the band and complete before joining the trend. Don't chase in the extreme zone.
100% free. No sign-up, no conditions.
→ tradingview.com/script/qFbYduhk-Lina-RSI-Wave-Phase-RSI-with-Trend-Pullback-Zones/
$BTC $ETH #Gold #TradingView #RSI #TechnicalAnalysis
Not financial advice. Always manage your risk.
Most traders use RSI only for overbought / oversold. Lina RSI reads it as waves, so trend, pullbacks and exhaustion are visible at a glance.
What you get:
• 7-phase RSI line, from strong up to strong down
• Trend pullback band where with-trend entries usually form
• Smooth extreme-zone fill
• RSI zigzag with HH / HL / LH / LL labels
• Regular divergence on RSI and price
• Pullback completed / failed marks
• Candle colors and trend background on the price chart
• Auto 5-timeframe RSI table
• 6 alerts
How to use it: green candles = look for longs, red = look for shorts. Wait for RSI to pull back into the band and complete before joining the trend. Don't chase in the extreme zone.
100% free. No sign-up, no conditions.
→ tradingview.com/script/qFbYduhk-Lina-RSI-Wave-Phase-RSI-with-Trend-Pullback-Zones/
$BTC $ETH #Gold #TradingView #RSI #TechnicalAnalysis
Not financial advice. Always manage your risk.
3
1
3
393
PINNED
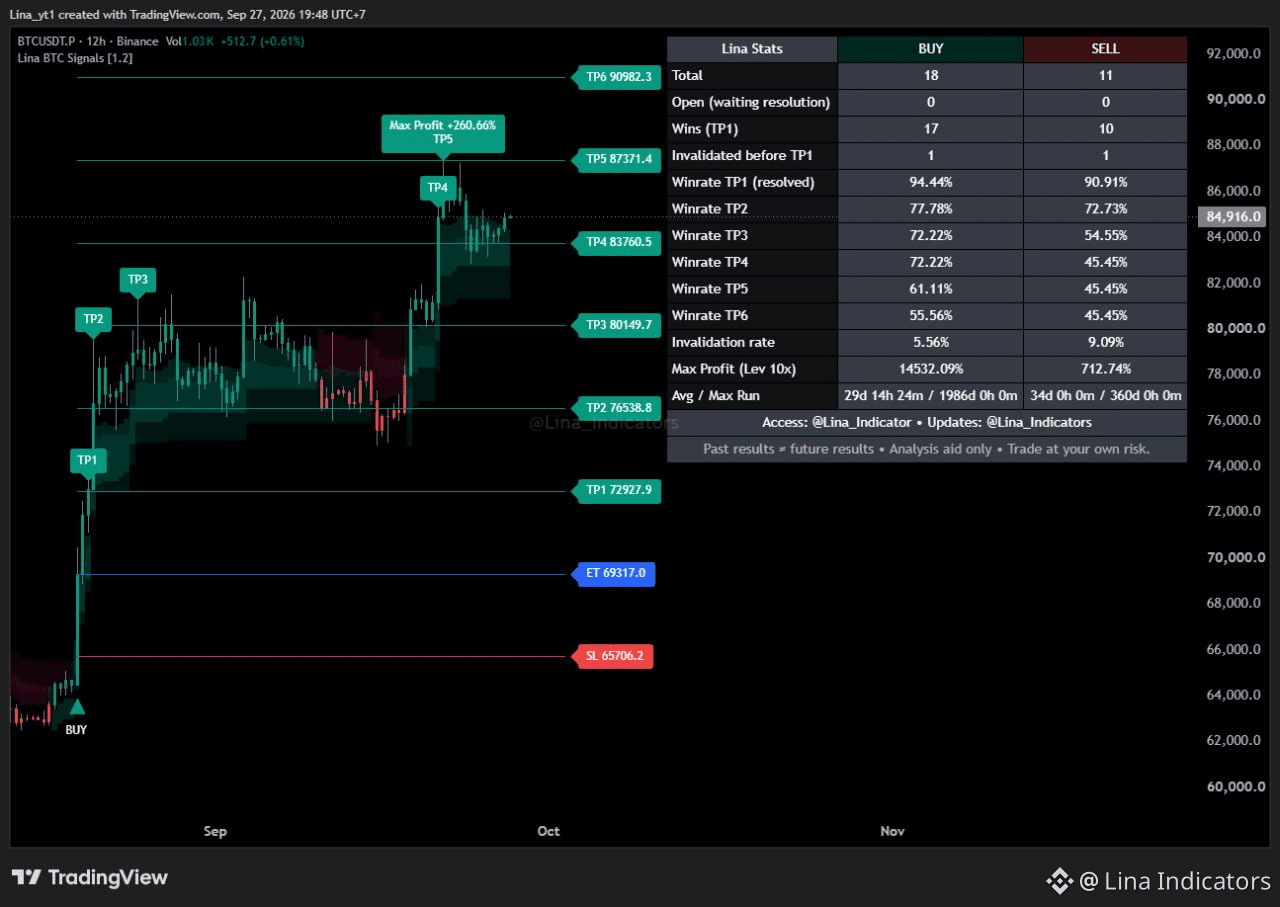
🔥 LINA BTC SIGNALS
A private TradingView indicator built specifically for $BTC.
• BUY / SELL
• Entry & Stop Loss
• TP1 → TP6
• Multi-timeframe structure
• Historical performance tracking
Each timeframe can have its own setup, allowing BTC market structure to be followed from multiple perspectives.
Private access:
1 Year • 3 Years • Lifetime
Lina BTC Signals
Built for BTC.
For analysis and educational purposes only. Past results do not guarantee future results.
$BTC #bitcoin #tradingview
🔥 LINA BTC SIGNALS
A private TradingView indicator built specifically for $BTC .
• BUY / SELL
• Entry & Stop Loss
• TP1 → TP6
• Multi-timeframe structure
• Historical performance tracking
Each timeframe can have its own setup, allowing BTC market structure to be followed from multiple perspectives.
Private access:
1 Year • 3 Years • Lifetime
Lina BTC Signals
Built for BTC.
For analysis and educational purposes only. Past results do not guarantee future results.
$BTC #bitcoin #tradingview
A private TradingView indicator built specifically for $BTC .
• BUY / SELL
• Entry & Stop Loss
• TP1 → TP6
• Multi-timeframe structure
• Historical performance tracking
Each timeframe can have its own setup, allowing BTC market structure to be followed from multiple perspectives.
Private access:
1 Year • 3 Years • Lifetime
Lina BTC Signals
Built for BTC.
For analysis and educational purposes only. Past results do not guarantee future results.
$BTC #bitcoin #tradingview
2
118
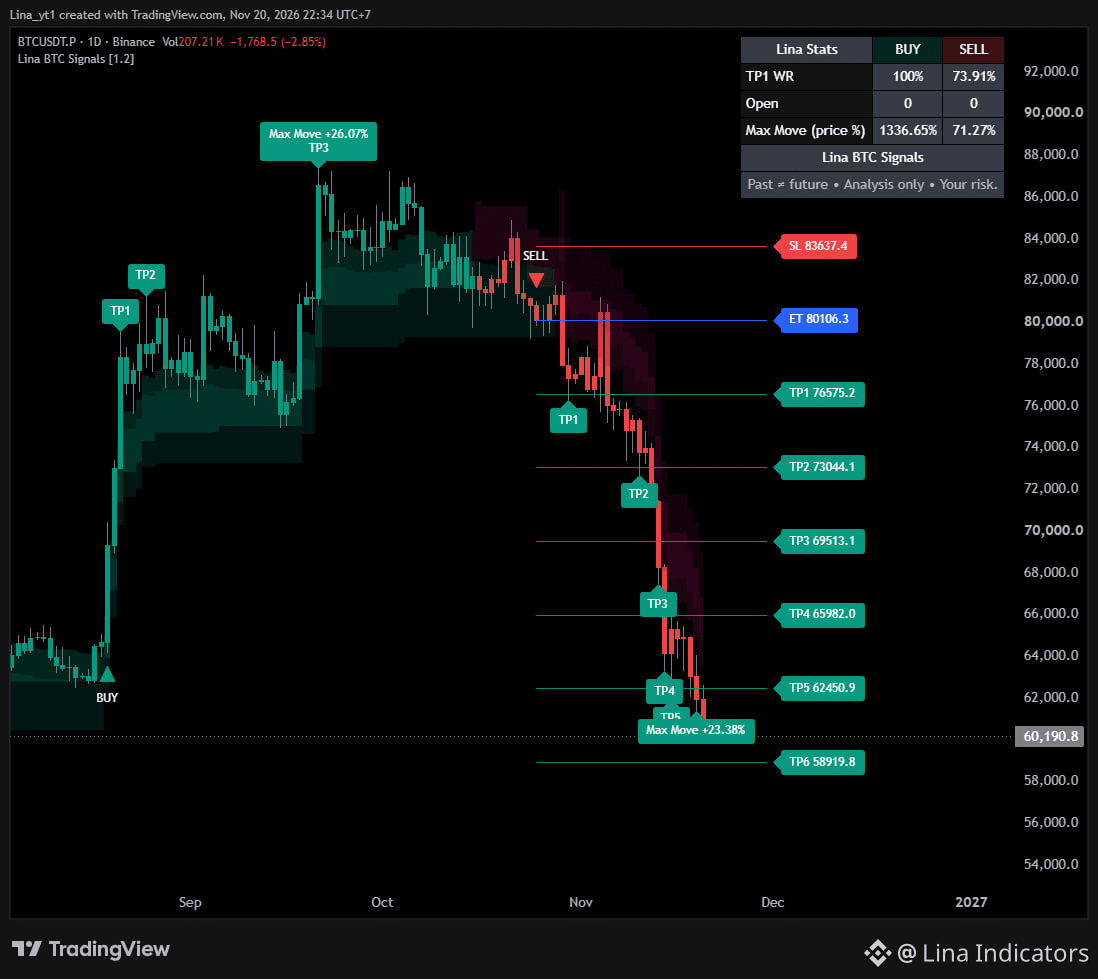
BTC | 1D Market Update
BTC has extended its decline toward the $60K area.
Several previously marked downside levels have now been reached, while the next major area on the chart sits near $58.9K.
After such a deep decline, trying to predict the exact bottom becomes increasingly difficult.
The more important signal will be whether market structure begins to stabilize and momentum starts to recover.
Until then, patience may be more useful than forcing a reversal call.
For market analysis and educational purposes only.
BTC | 1D Market Update
BTC has extended its decline toward the $60K area.
Several previously marked downside levels have now been reached, while the next major area on the chart sits near $58.9K.
After such a deep decline, trying to predict the exact bottom becomes increasingly difficult.
The more important signal will be whether market structure begins to stabilize and momentum starts to recover.
Until then, patience may be more useful than forcing a reversal call.
For market analysis and educational purposes only.
BTC has extended its decline toward the $60K area.
Several previously marked downside levels have now been reached, while the next major area on the chart sits near $58.9K.
After such a deep decline, trying to predict the exact bottom becomes increasingly difficult.
The more important signal will be whether market structure begins to stabilize and momentum starts to recover.
Until then, patience may be more useful than forcing a reversal call.
For market analysis and educational purposes only.
1
1
107
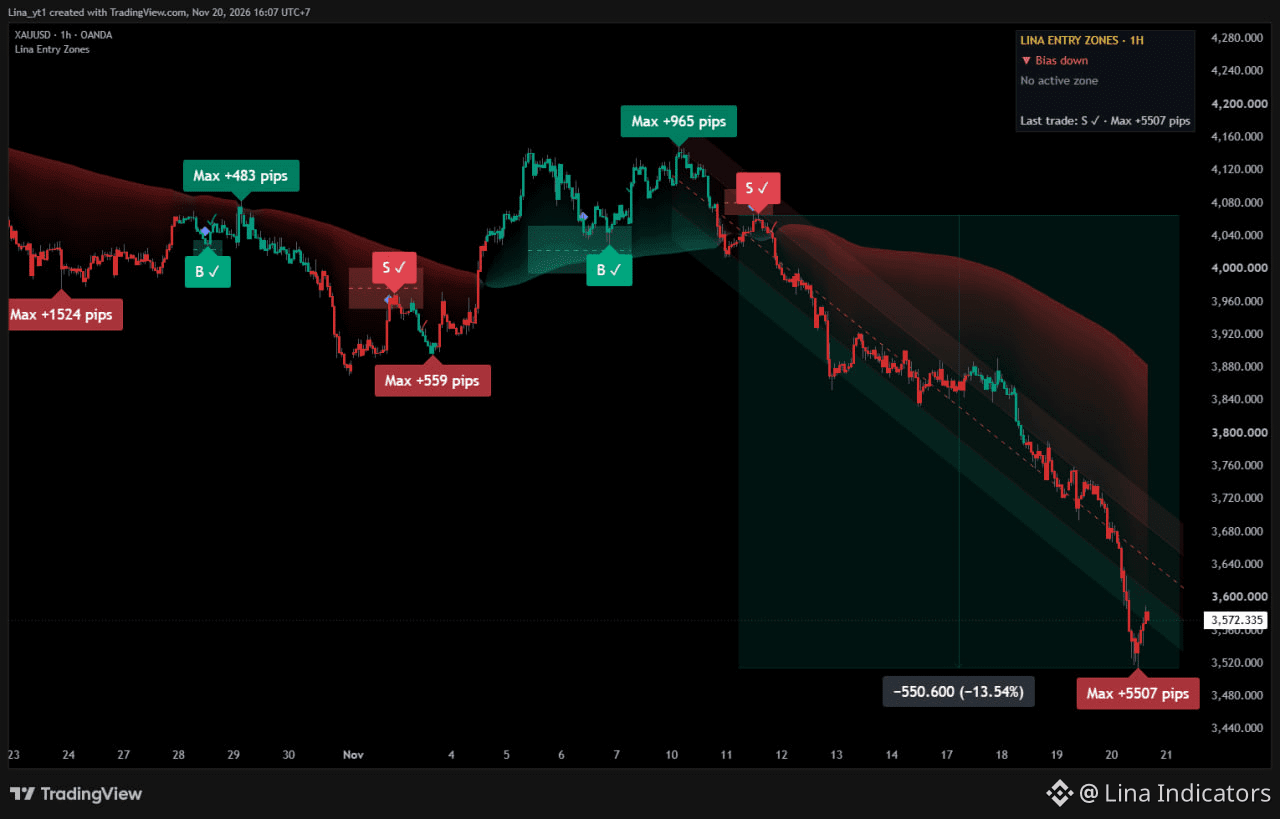
XAUUSD | H1
Gold remains in a strong bearish structure.
The latest downside move has extended significantly, with price declining around 13.5% from the recent higher area.
Current structure:
▼ Bias Down
No active zone
The trend remains bearish, but after such a large move, chasing downside becomes increasingly risky.
The focus now is on whether Gold stabilizes and forms a recovery structure or continues to establish new lows.
For market analysis and educational purposes only.
XAUUSD | H1
Gold remains in a strong bearish structure.
The latest downside move has extended significantly, with price declining around 13.5% from the recent higher area.
Current structure:
▼ Bias Down
No active zone
The trend remains bearish, but after such a large move, chasing downside becomes increasingly risky.
The focus now is on whether Gold stabilizes and forms a recovery structure or continues to establish new lows.
For market analysis and educational purposes only.
Gold remains in a strong bearish structure.
The latest downside move has extended significantly, with price declining around 13.5% from the recent higher area.
Current structure:
▼ Bias Down
No active zone
The trend remains bearish, but after such a large move, chasing downside becomes increasingly risky.
The focus now is on whether Gold stabilizes and forms a recovery structure or continues to establish new lows.
For market analysis and educational purposes only.
1
1
288
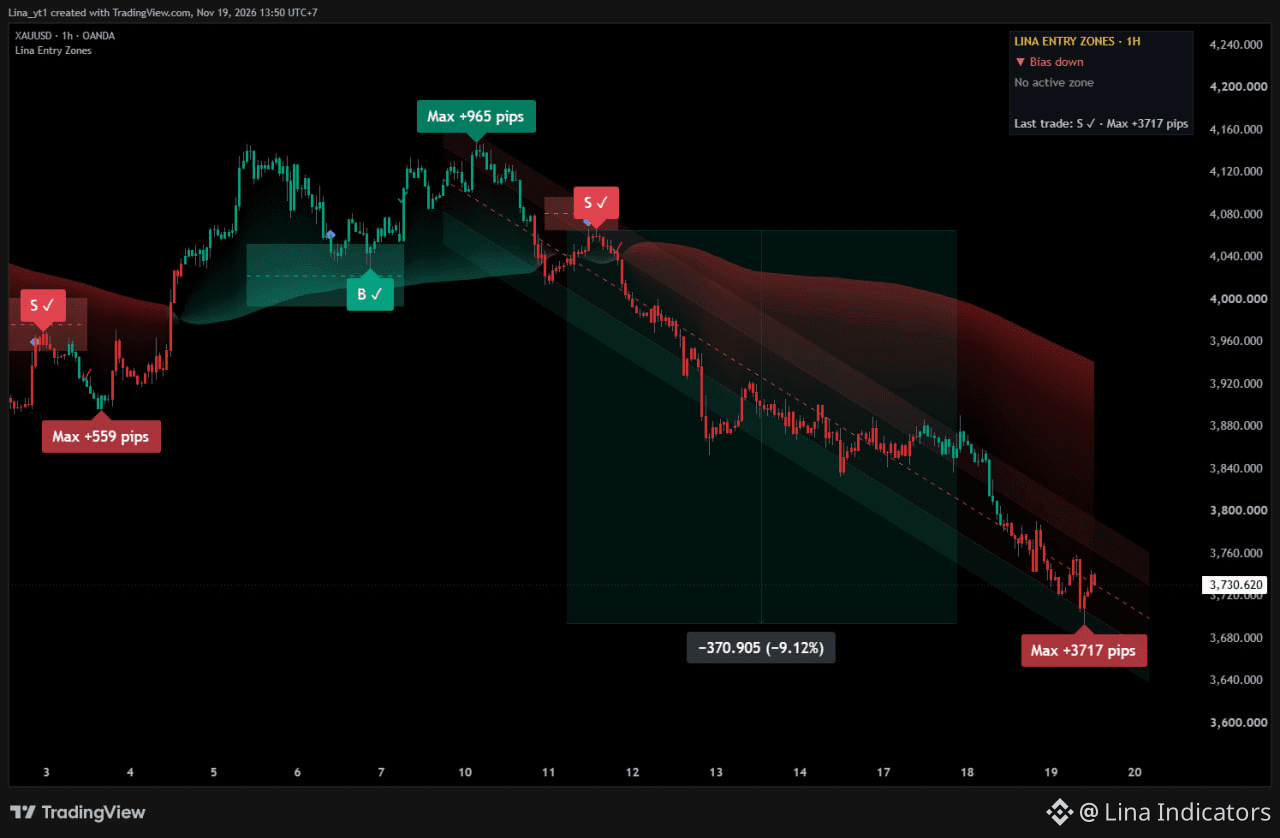
XAUUSD | H1 Trend Follow-up
The latest SELL displayed by Lina Entry Zones has extended to:
✅ Max Move +3717 pips
Approximate move from the signal area: -9.12%
Current status:
▼ Bias Down
No active zone
The key lesson is not to chase an already extended move, but to manage risk well enough to stay with a strong trend when one develops.
Max Move is an indicator-based chart measurement, not an actual account return.
For market analysis and educational purposes only.
XAUUSD | H1 Trend Follow-up
The latest SELL displayed by Lina Entry Zones has extended to:
✅ Max Move +3717 pips
Approximate move from the signal area: -9.12%
Current status:
▼ Bias Down
No active zone
The key lesson is not to chase an already extended move, but to manage risk well enough to stay with a strong trend when one develops.
Max Move is an indicator-based chart measurement, not an actual account return.
For market analysis and educational purposes only.
The latest SELL displayed by Lina Entry Zones has extended to:
✅ Max Move +3717 pips
Approximate move from the signal area: -9.12%
Current status:
▼ Bias Down
No active zone
The key lesson is not to chase an already extended move, but to manage risk well enough to stay with a strong trend when one develops.
Max Move is an indicator-based chart measurement, not an actual account return.
For market analysis and educational purposes only.
Lina Indicators
·
--
XAUUSD | H1
Lina Entry Zones has tracked several recent trend phases, with the latest SELL showing a Max Move of +2127 pips on the chart.
Current status:
▼ Bias Down
No active zone
Rather than chasing an extended move, the focus is on waiting for the next structured entry zone.
Max Move values are chart measurements, not actual account returns.
For market analysis and educational purposes only.
Lina Entry Zones has tracked several recent trend phases, with the latest SELL showing a Max Move of +2127 pips on the chart.
Current status:
▼ Bias Down
No active zone
Rather than chasing an extended move, the focus is on waiting for the next structured entry zone.
Max Move values are chart measurements, not actual account returns.
For market analysis and educational purposes only.
1
1
242
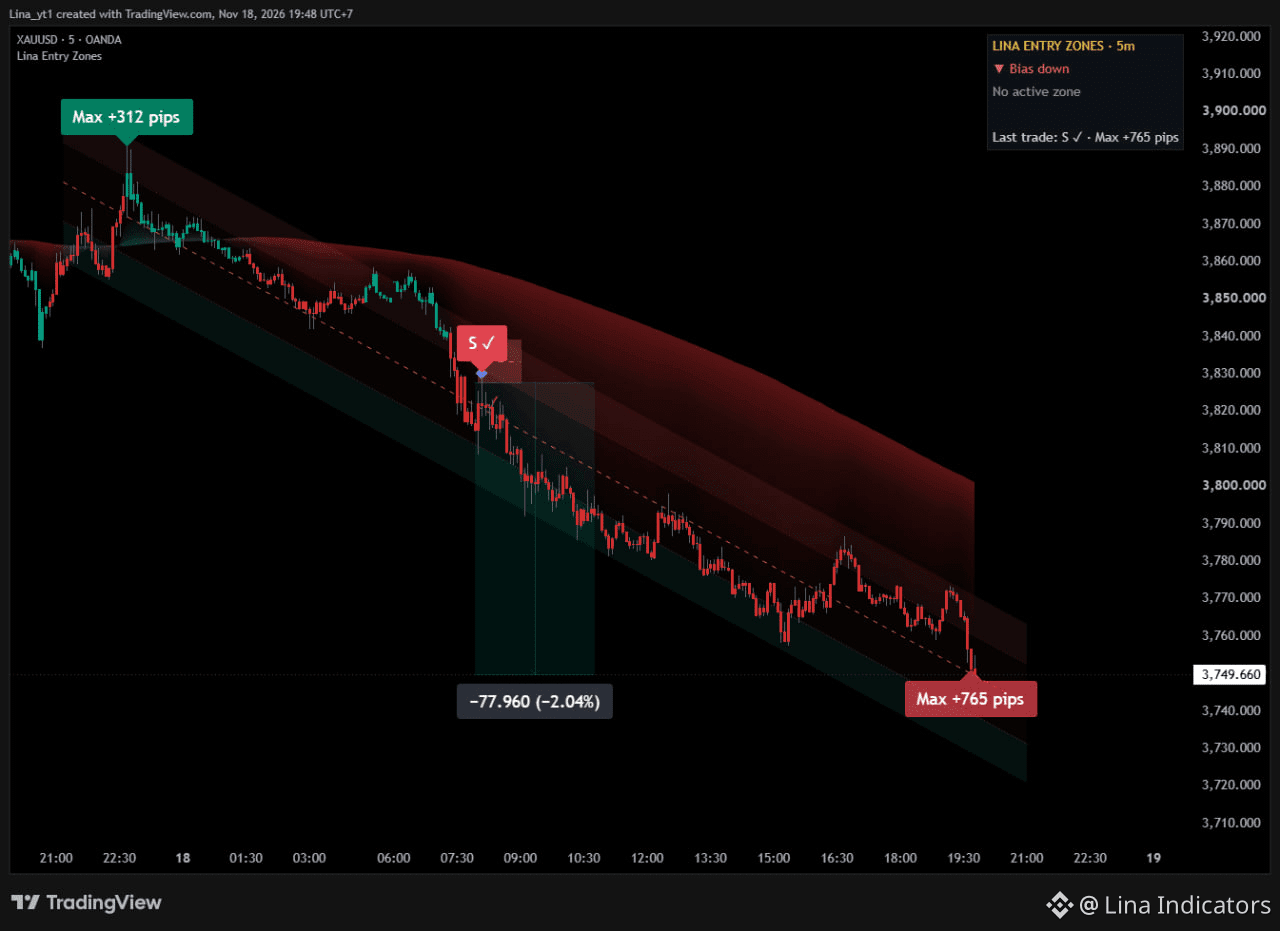
XAUUSD | M5 Follow-up
The latest SELL on Lina Entry Zones has extended from +355 pips to:
✅ Max Move +765 pips
The total downside move shown on the chart is approximately 2.04%.
Current status:
▼ Bias Down
No active zone
The bearish structure remains intact, but price is already significantly extended.
The focus now shifts to waiting for the next structured entry zone rather than chasing the move.
For market analysis and educational purposes only.
XAUUSD | M5 Follow-up
The latest SELL on Lina Entry Zones has extended from +355 pips to:
✅ Max Move +765 pips
The total downside move shown on the chart is approximately 2.04%.
Current status:
▼ Bias Down
No active zone
The bearish structure remains intact, but price is already significantly extended.
The focus now shifts to waiting for the next structured entry zone rather than chasing the move.
For market analysis and educational purposes only.
The latest SELL on Lina Entry Zones has extended from +355 pips to:
✅ Max Move +765 pips
The total downside move shown on the chart is approximately 2.04%.
Current status:
▼ Bias Down
No active zone
The bearish structure remains intact, but price is already significantly extended.
The focus now shifts to waiting for the next structured entry zone rather than chasing the move.
For market analysis and educational purposes only.
Lina Indicators
·
--
XAUUSD | M5
The latest SELL on Lina Entry Zones reached:
✅ Max Move +355 pips
Current status:
▼ Bias Down
No active zone
The bearish structure remains intact, but price has already extended significantly.
R
ather than chasing the move, the focus shifts to the next structured entry zone.
Max Move is an indicator-based chart measurement, not an actual account return.
For market analysis and educational purposes only.
The latest SELL on Lina Entry Zones reached:
✅ Max Move +355 pips
Current status:
▼ Bias Down
No active zone
The bearish structure remains intact, but price has already extended significantly.
R
ather than chasing the move, the focus shifts to the next structured entry zone.
Max Move is an indicator-based chart measurement, not an actual account return.
For market analysis and educational purposes only.
1
1
171
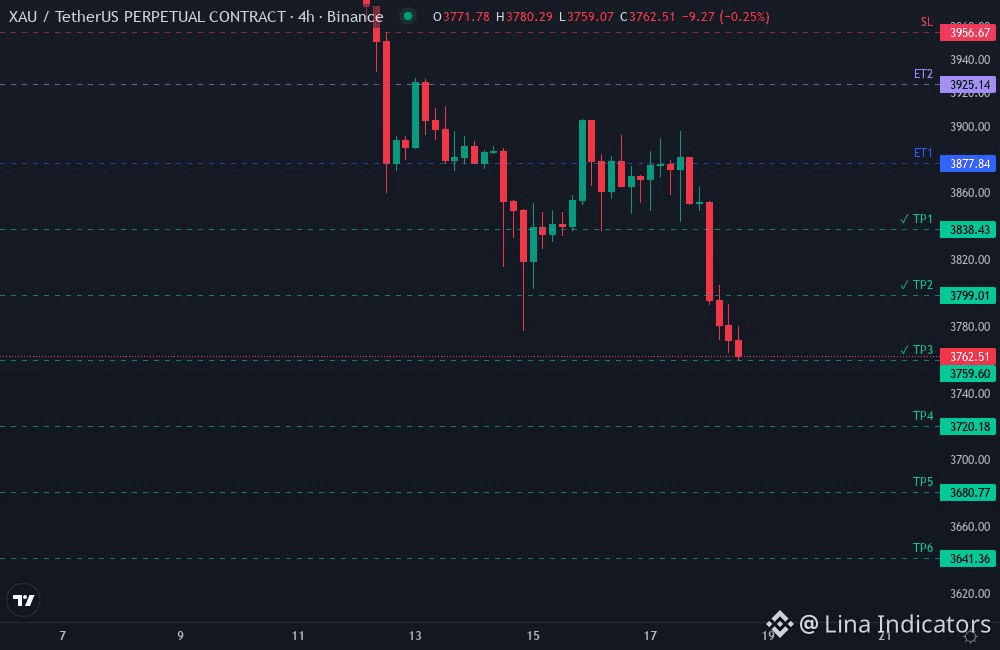
✅ TP3 HIT · +30% (10x) · +1.5R
#XAU0001 · XAUUSDT.P · SHORT
Entry 3877.84 → 3759.60
Duration: 5d 20h
Time 19:39 · 18/11/2026
✅ TP3 HIT · +30% (10x) · +1.5R
#XAU0001 · XAUUSDT.P · SHORT
Entry 3877.84 → 3759.60
Duration: 5d 20h
Time 19:39 · 18/11/2026
#XAU0001 · XAUUSDT.P · SHORT
Entry 3877.84 → 3759.60
Duration: 5d 20h
Time 19:39 · 18/11/2026
1
338
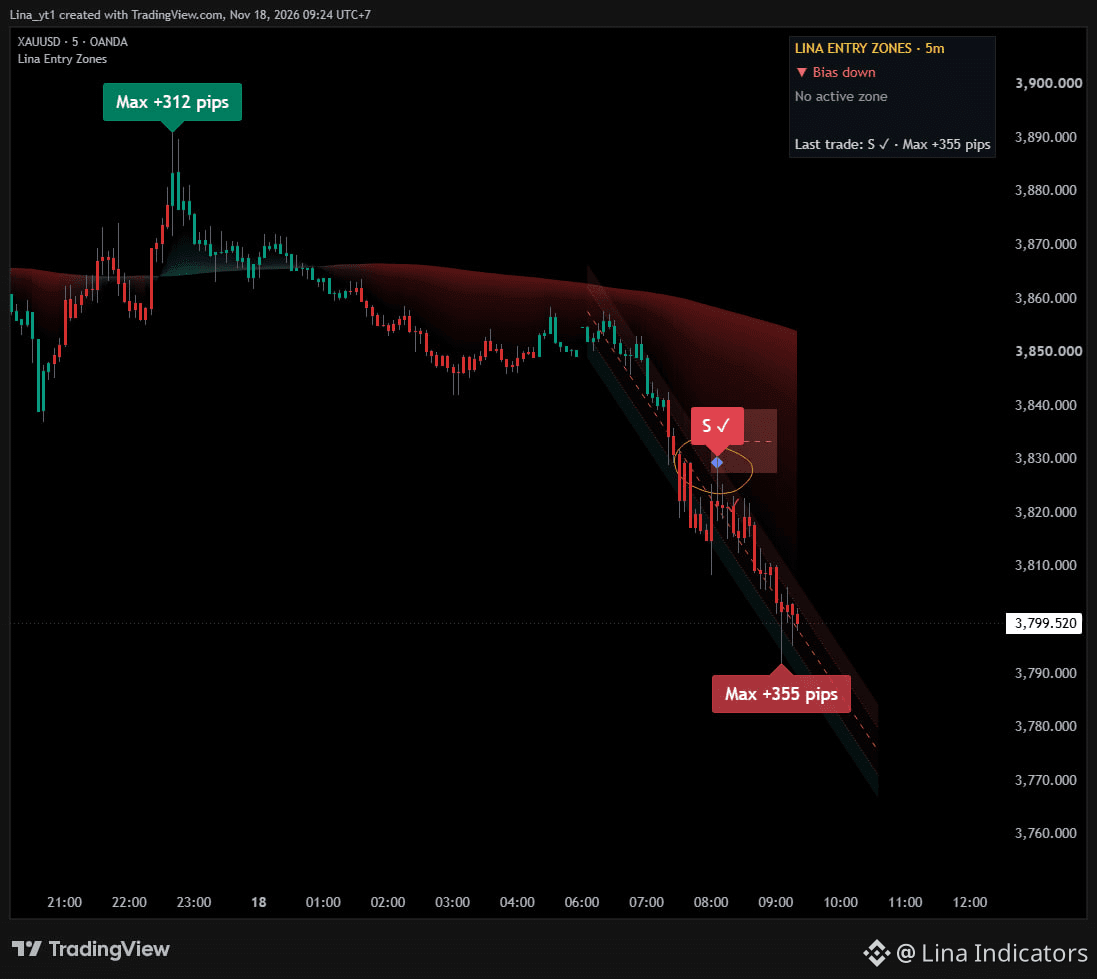
XAUUSD | M5
The latest SELL on Lina Entry Zones reached:
✅ Max Move +355 pips
Current status:
▼ Bias Down
No active zone
The bearish structure remains intact, but price has already extended significantly.
R
ather than chasing the move, the focus shifts to the next structured entry zone.
Max Move is an indicator-based chart measurement, not an actual account return.
For market analysis and educational purposes only.
XAUUSD | M5
The latest SELL on Lina Entry Zones reached:
✅ Max Move +355 pips
Current status:
▼ Bias Down
No active zone
The bearish structure remains intact, but price has already extended significantly.
R
ather than chasing the move, the focus shifts to the next structured entry zone.
Max Move is an indicator-based chart measurement, not an actual account return.
For market analysis and educational purposes only.
The latest SELL on Lina Entry Zones reached:
✅ Max Move +355 pips
Current status:
▼ Bias Down
No active zone
The bearish structure remains intact, but price has already extended significantly.
R
ather than chasing the move, the focus shifts to the next structured entry zone.
Max Move is an indicator-based chart measurement, not an actual account return.
For market analysis and educational purposes only.
1
1
144
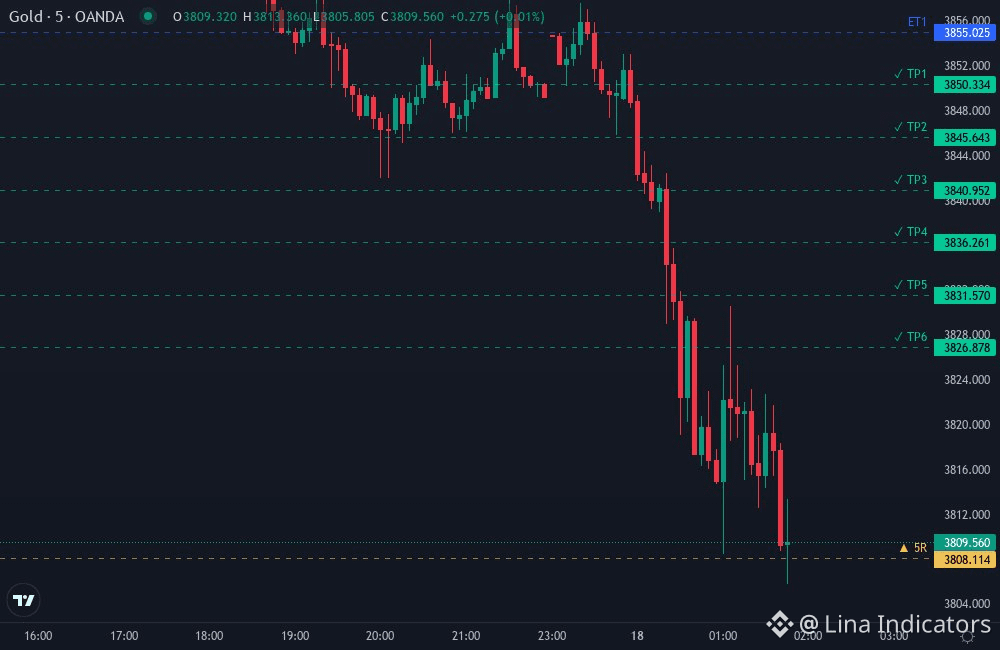
🚀 STILL RUNNING · +469 pips · +5R
#XAU0154 · XAUUSD · SELL · 5M
Entry 3855.025 → 3808.114
Duration: 6h 54m
Time 08:49 · 18/11/2026
🚀 STILL RUNNING · +469 pips · +5R
#XAU0154 · XAUUSD · SELL · 5M
Entry 3855.025 → 3808.114
Duration: 6h 54m
Time 08:49 · 18/11/2026
#XAU0154 · XAUUSD · SELL · 5M
Entry 3855.025 → 3808.114
Duration: 6h 54m
Time 08:49 · 18/11/2026
316
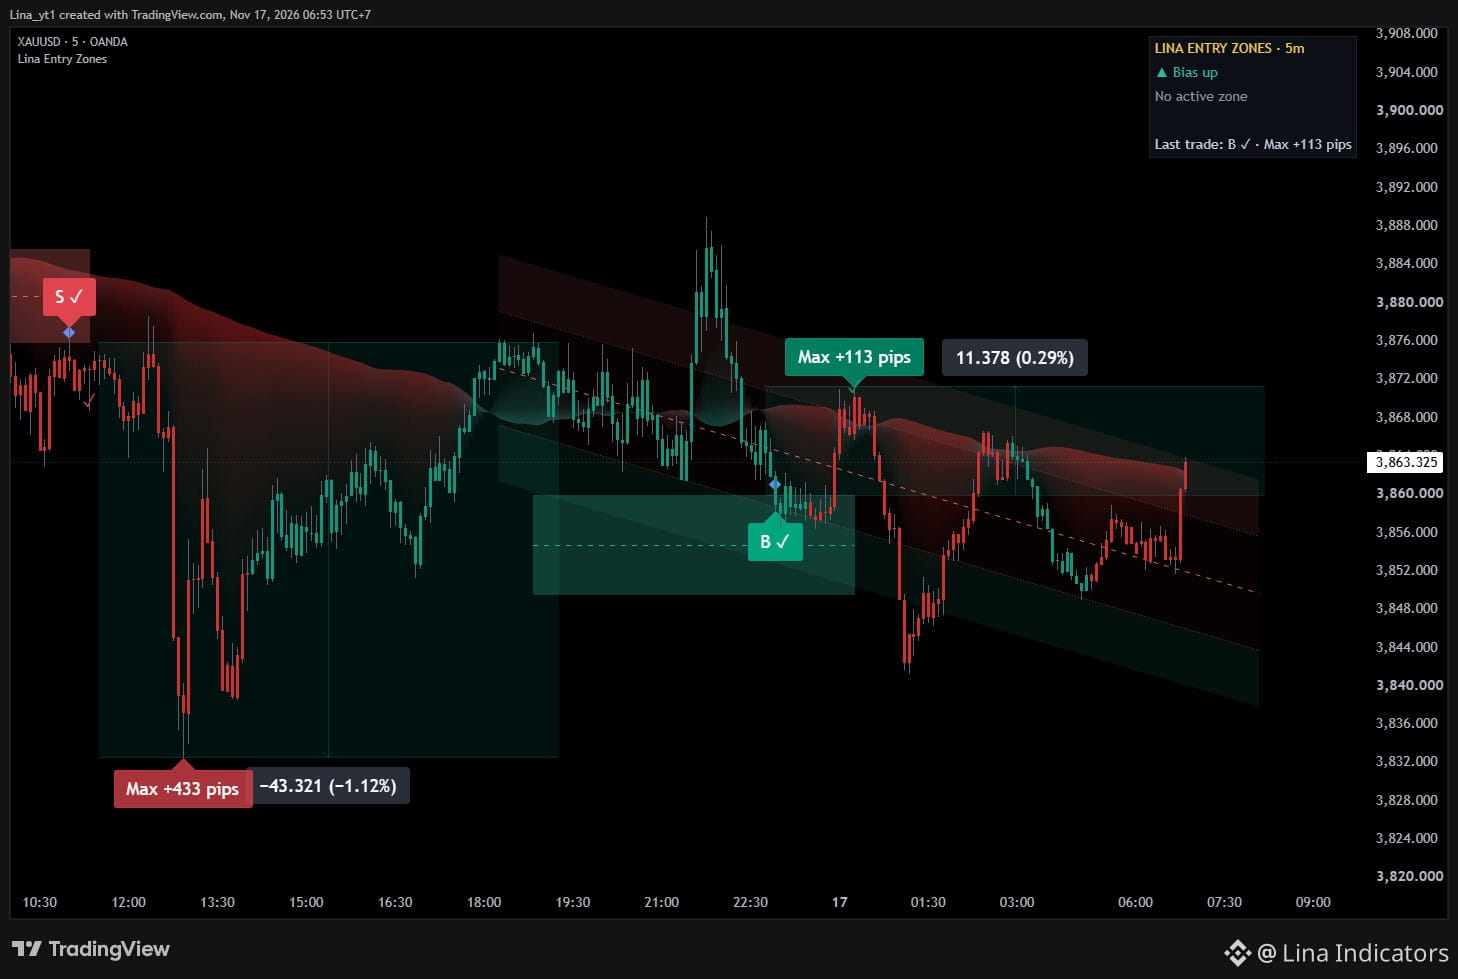
XAUUSD | M5 Follow-up
The previously highlighted BUY zone was tested and produced a positive reaction.
Latest BUY:
Max Move +113 pips
Current status:
▲ Bias Up
No active zone
The zone has already played out, so the focus now shifts to waiting for the next structured entry area rather than chasing price.
Max Move is an indicator-based chart measurement, not an actual account return.
For market analysis and educational purposes only.
XAUUSD | M5 Follow-up
The previously highlighted BUY zone was tested and produced a positive reaction.
Latest BUY:
Max Move +113 pips
Current status:
▲ Bias Up
No active zone
The zone has already played out, so the focus now shifts to waiting for the next structured entry area rather than chasing price.
Max Move is an indicator-based chart measurement, not an actual account return.
For market analysis and educational purposes only.
The previously highlighted BUY zone was tested and produced a positive reaction.
Latest BUY:
Max Move +113 pips
Current status:
▲ Bias Up
No active zone
The zone has already played out, so the focus now shifts to waiting for the next structured entry area rather than chasing price.
Max Move is an indicator-based chart measurement, not an actual account return.
For market analysis and educational purposes only.
Lina Indicators
·
--
XAUUSD | M5 Entry Zone Test
Lina Entry Zones currently shows:
▲ Bias Up
Buy zone: 3,849–3,860
Key level: ~3,855
Invalidation: ~3,832
Current price is around 3,868, so the zone has not been tested yet.
This is being posted in advance to track how price reacts if the area is revisited.
For market analysis and educational purposes only.
Lina Entry Zones currently shows:
▲ Bias Up
Buy zone: 3,849–3,860
Key level: ~3,855
Invalidation: ~3,832
Current price is around 3,868, so the zone has not been tested yet.
This is being posted in advance to track how price reacts if the area is revisited.
For market analysis and educational purposes only.
1
1
105
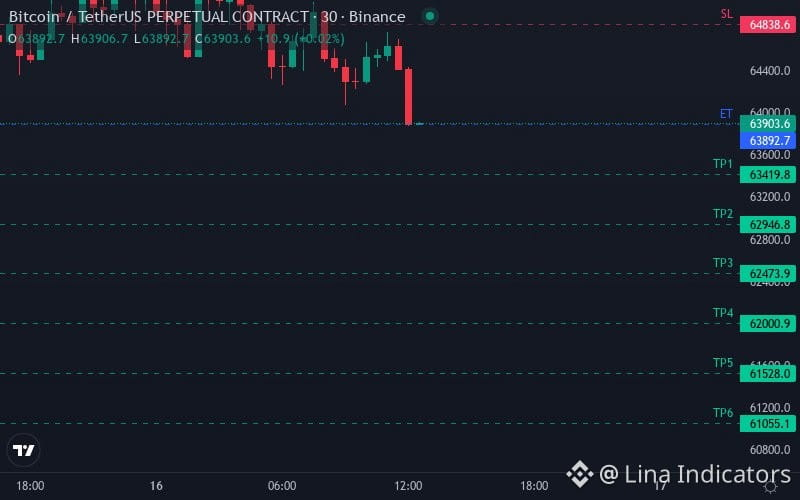
🔴 SELL BTCUSDT.P · 30m
#BTC0010 · #BTCUSDTP · L01
🧭 30m▼ 1H– 2H– 4H▼ 8H– 12H– 1D–
✅ With trend
Entry: 63892.7
Stop Loss: 64838.6 (−1.5%)
TP1: 63419.8 (+0.7%)
TP2: 62946.8 (+1.5%)
TP3: 62473.9 (+2.2%)
TP4: 62000.9 (+3.0%)
TP5: 61528.0 (+3.7%)
TP6: 61055.1 (+4.4%)
Win rate: 74.0%
Time 19:30 · 16/11/2026
Risk max 0.5–1% of capital per trade.
For informational purposes only. Not financial advice.
🔴 SELL BTCUSDT.P · 30m
#BTC0010 · #BTCUSDTP · L01
🧭 30m▼ 1H– 2H– 4H▼ 8H– 12H– 1D–
✅ With trend
Entry: 63892.7
Stop Loss: 64838.6 (−1.5%)
TP1: 63419.8 (+0.7%)
TP2: 62946.8 (+1.5%)
TP3: 62473.9 (+2.2%)
TP4: 62000.9 (+3.0%)
TP5: 61528.0 (+3.7%)
TP6: 61055.1 (+4.4%)
Win rate: 74.0%
Time 19:30 · 16/11/2026
Risk max 0.5–1% of capital per trade.
For informational purposes only. Not financial advice.
#BTC0010 · #BTCUSDTP · L01
🧭 30m▼ 1H– 2H– 4H▼ 8H– 12H– 1D–
✅ With trend
Entry: 63892.7
Stop Loss: 64838.6 (−1.5%)
TP1: 63419.8 (+0.7%)
TP2: 62946.8 (+1.5%)
TP3: 62473.9 (+2.2%)
TP4: 62000.9 (+3.0%)
TP5: 61528.0 (+3.7%)
TP6: 61055.1 (+4.4%)
Win rate: 74.0%
Time 19:30 · 16/11/2026
Risk max 0.5–1% of capital per trade.
For informational purposes only. Not financial advice.
1
1
30
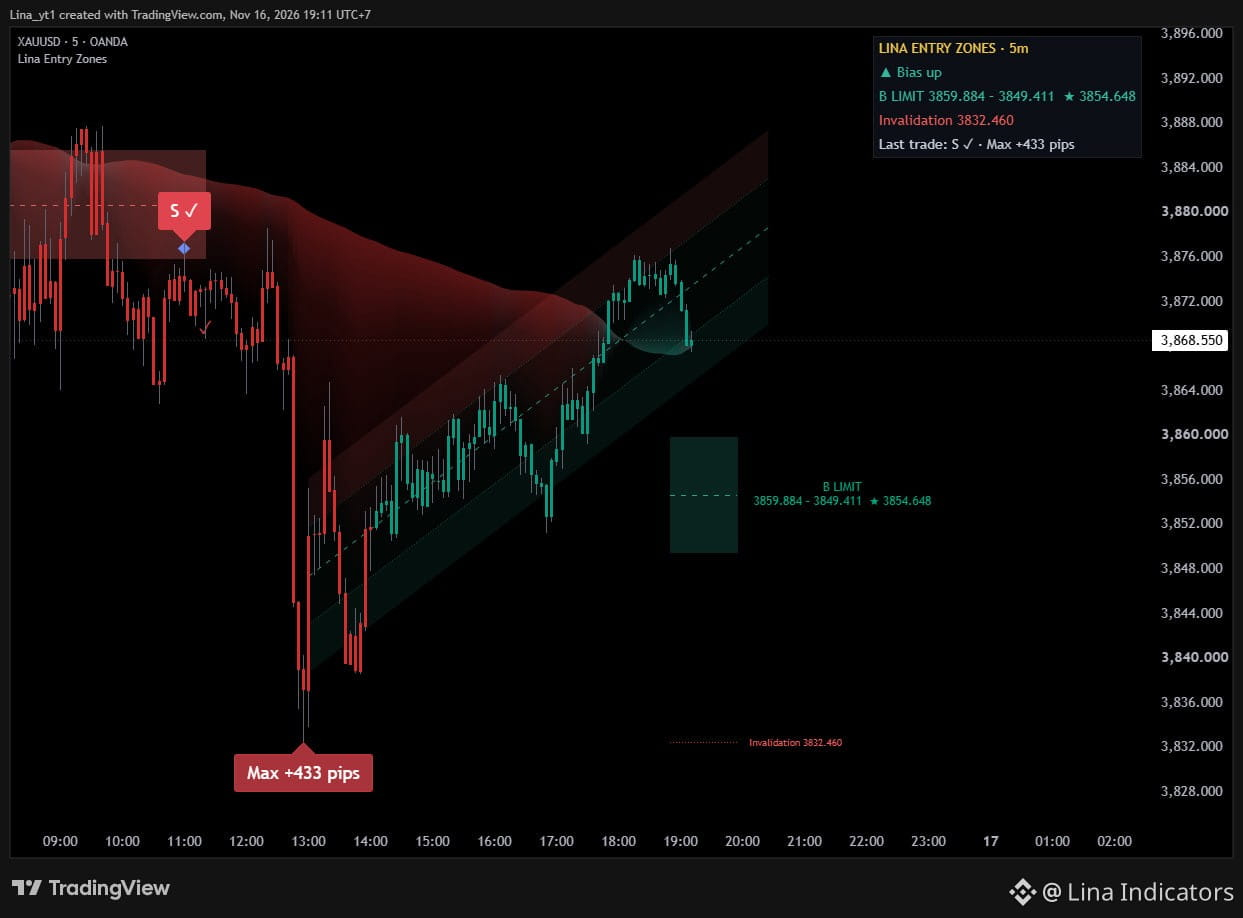
XAUUSD | M5 Entry Zone Test
Lina Entry Zones currently shows:
▲ Bias Up
Buy zone: 3,849–3,860
Key level: ~3,855
Invalidation: ~3,832
Current price is around 3,868, so the zone has not been tested yet.
This is being posted in advance to track how price reacts if the area is revisited.
For market analysis and educational purposes only.
XAUUSD | M5 Entry Zone Test
Lina Entry Zones currently shows:
▲ Bias Up
Buy zone: 3,849–3,860
Key level: ~3,855
Invalidation: ~3,832
Current price is around 3,868, so the zone has not been tested yet.
This is being posted in advance to track how price reacts if the area is revisited.
For market analysis and educational purposes only.
Lina Entry Zones currently shows:
▲ Bias Up
Buy zone: 3,849–3,860
Key level: ~3,855
Invalidation: ~3,832
Current price is around 3,868, so the zone has not been tested yet.
This is being posted in advance to track how price reacts if the area is revisited.
For market analysis and educational purposes only.
1
1
1
160
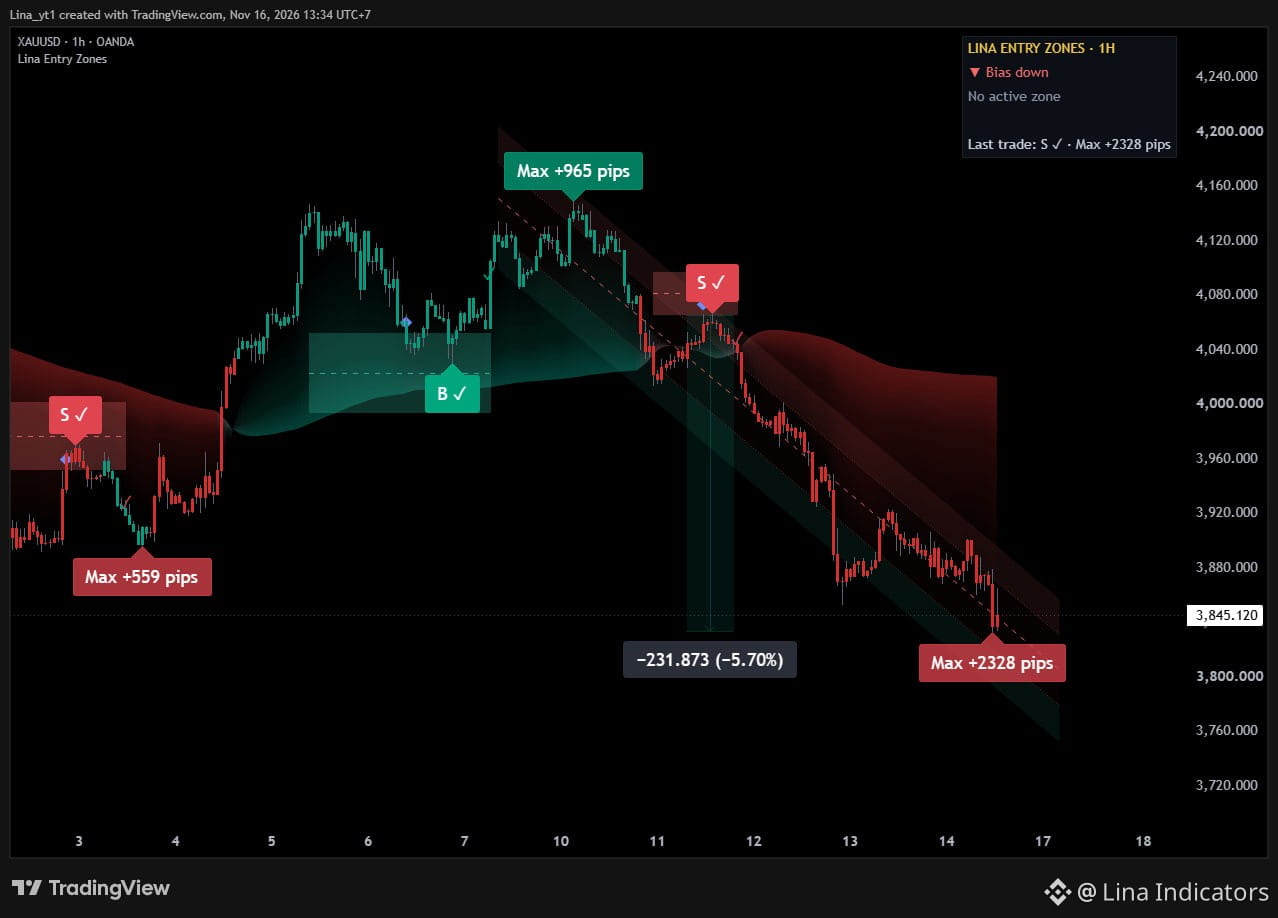
XAUUSD | H1
The latest SELL on Lina Entry Zones currently shows a Max Move of +2328 pips.
Price has declined roughly 5.70% from the signal area.
Current status:
▼ Bias Down
No active zone
There is an important difference between holding a winning trend and chasing an already extended move.
With no active zone currently available, patience matters more than forcing a new entry.
Max Move is an indicator-based chart measurement, not actual account return.
For market analysis and educational purposes only.
XAUUSD | H1
The latest SELL on Lina Entry Zones currently shows a Max Move of +2328 pips.
Price has declined roughly 5.70% from the signal area.
Current status:
▼ Bias Down
No active zone
There is an important difference between holding a winning trend and chasing an already extended move.
With no active zone currently available, patience matters more than forcing a new entry.
Max Move is an indicator-based chart measurement, not actual account return.
For market analysis and educational purposes only.
The latest SELL on Lina Entry Zones currently shows a Max Move of +2328 pips.
Price has declined roughly 5.70% from the signal area.
Current status:
▼ Bias Down
No active zone
There is an important difference between holding a winning trend and chasing an already extended move.
With no active zone currently available, patience matters more than forcing a new entry.
Max Move is an indicator-based chart measurement, not actual account return.
For market analysis and educational purposes only.
1
1
261
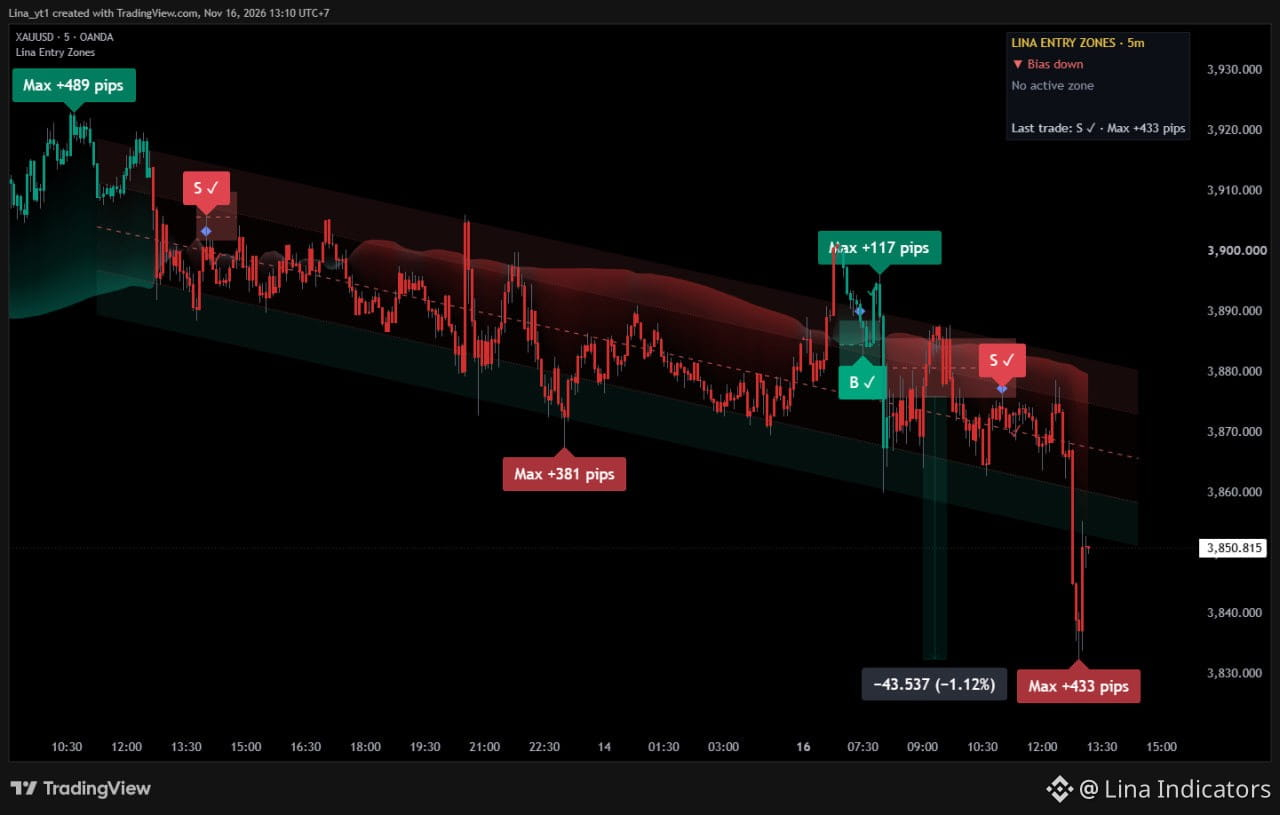
XAUUSD | M5
Lina Entry Zones continues to show a bearish structure.
Latest SELL:
Max Move +433 pips
Current status:
▼ Bias Down
No active zone
After the latest downside extension, the focus is on waiting for the next structured entry zone rather than chasing price.
Max Move is an indicator-based chart measurement, not actual account return.
For market analysis and educational purposes only.
XAUUSD | M5
Lina Entry Zones continues to show a bearish structure.
Latest SELL:
Max Move +433 pips
Current status:
▼ Bias Down
No active zone
After the latest downside extension, the focus is on waiting for the next structured entry zone rather than chasing price.
Max Move is an indicator-based chart measurement, not actual account return.
For market analysis and educational purposes only.
Lina Entry Zones continues to show a bearish structure.
Latest SELL:
Max Move +433 pips
Current status:
▼ Bias Down
No active zone
After the latest downside extension, the focus is on waiting for the next structured entry zone rather than chasing price.
Max Move is an indicator-based chart measurement, not actual account return.
For market analysis and educational purposes only.
1
2
464
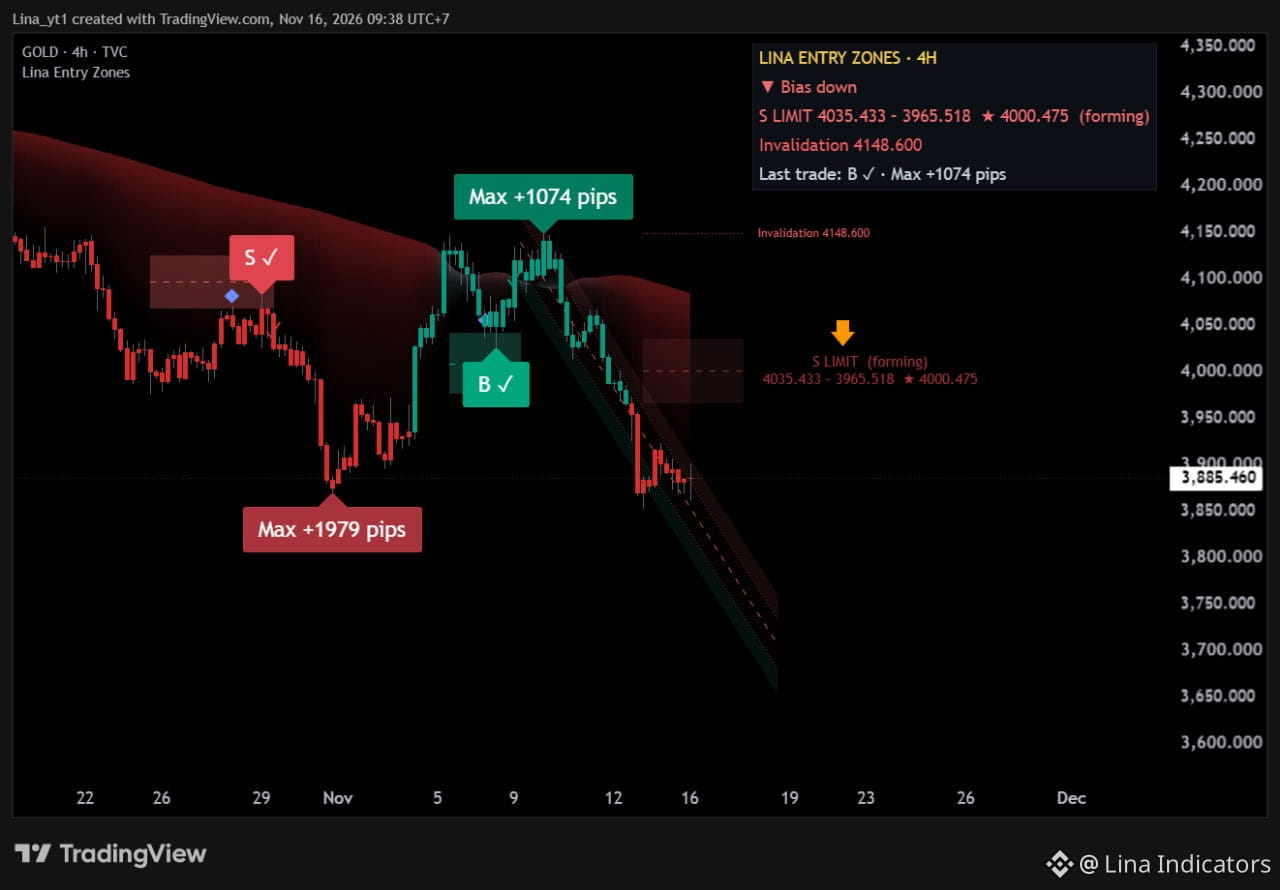
XAUUSD | H4
Current structure:
▼ Bias Down
Sell Zone forming: 3,965–4,035
Key level: ~4,000
Invalidation: 4,148
Price has already moved significantly lower, so the focus is not on chasing the current move.
The more useful scenario is to wait for price to revisit the structured entry zone and evaluate the reaction there.
Clear bias. Clear zone. Clear invalidation.
For market analysis and educational purposes only.
XAUUSD | H4
Current structure:
▼ Bias Down
Sell Zone forming: 3,965–4,035
Key level: ~4,000
Invalidation: 4,148
Price has already moved significantly lower, so the focus is not on chasing the current move.
The more useful scenario is to wait for price to revisit the structured entry zone and evaluate the reaction there.
Clear bias. Clear zone. Clear invalidation.
For market analysis and educational purposes only.
Current structure:
▼ Bias Down
Sell Zone forming: 3,965–4,035
Key level: ~4,000
Invalidation: 4,148
Price has already moved significantly lower, so the focus is not on chasing the current move.
The more useful scenario is to wait for price to revisit the structured entry zone and evaluate the reaction there.
Clear bias. Clear zone. Clear invalidation.
For market analysis and educational purposes only.
1
243
🇬🇧 ECONOMIC CALENDAR WEEK · Nov 16, 2026
• Tuesday 00:00 · Federal Reserve Chair Speech
• Tuesday 20:30 · Retail Sales — Forecast: 0.4% · Previous: 0.9%
• Tuesday 20:30 · Retail Sales — Forecast: 0.2% · Previous: 0.8%
• Thursday 02:00 · FOMC Meeting Minutes
#EconomicCalendar #Fed #Economy
🇬🇧 ECONOMIC CALENDAR WEEK · Nov 16, 2026
• Tuesday 00:00 · Federal Reserve Chair Speech
• Tuesday 20:30 · Retail Sales — Forecast: 0.4% · Previous: 0.9%
• Tuesday 20:30 · Retail Sales — Forecast: 0.2% · Previous: 0.8%
• Thursday 02:00 · FOMC Meeting Minutes
#EconomicCalendar #Fed #Economy
• Tuesday 00:00 · Federal Reserve Chair Speech
• Tuesday 20:30 · Retail Sales — Forecast: 0.4% · Previous: 0.9%
• Tuesday 20:30 · Retail Sales — Forecast: 0.2% · Previous: 0.8%
• Thursday 02:00 · FOMC Meeting Minutes
#EconomicCalendar #Fed #Economy

1
127
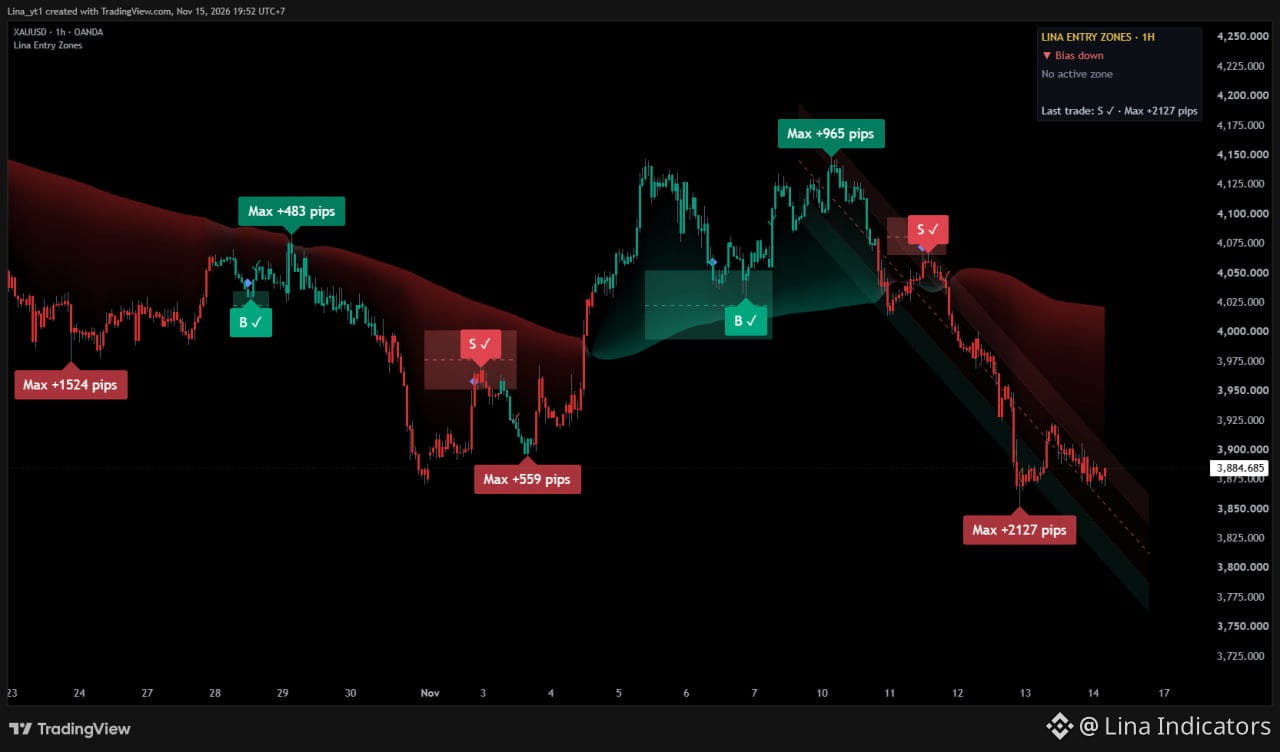
XAUUSD | H1
Lina Entry Zones has tracked several recent trend phases, with the latest SELL showing a Max Move of +2127 pips on the chart.
Current status:
▼ Bias Down
No active zone
Rather than chasing an extended move, the focus is on waiting for the next structured entry zone.
Max Move values are chart measurements, not actual account returns.
For market analysis and educational purposes only.
XAUUSD | H1
Lina Entry Zones has tracked several recent trend phases, with the latest SELL showing a Max Move of +2127 pips on the chart.
Current status:
▼ Bias Down
No active zone
Rather than chasing an extended move, the focus is on waiting for the next structured entry zone.
Max Move values are chart measurements, not actual account returns.
For market analysis and educational purposes only.
Lina Entry Zones has tracked several recent trend phases, with the latest SELL showing a Max Move of +2127 pips on the chart.
Current status:
▼ Bias Down
No active zone
Rather than chasing an extended move, the focus is on waiting for the next structured entry zone.
Max Move values are chart measurements, not actual account returns.
For market analysis and educational purposes only.
2
1
1
405
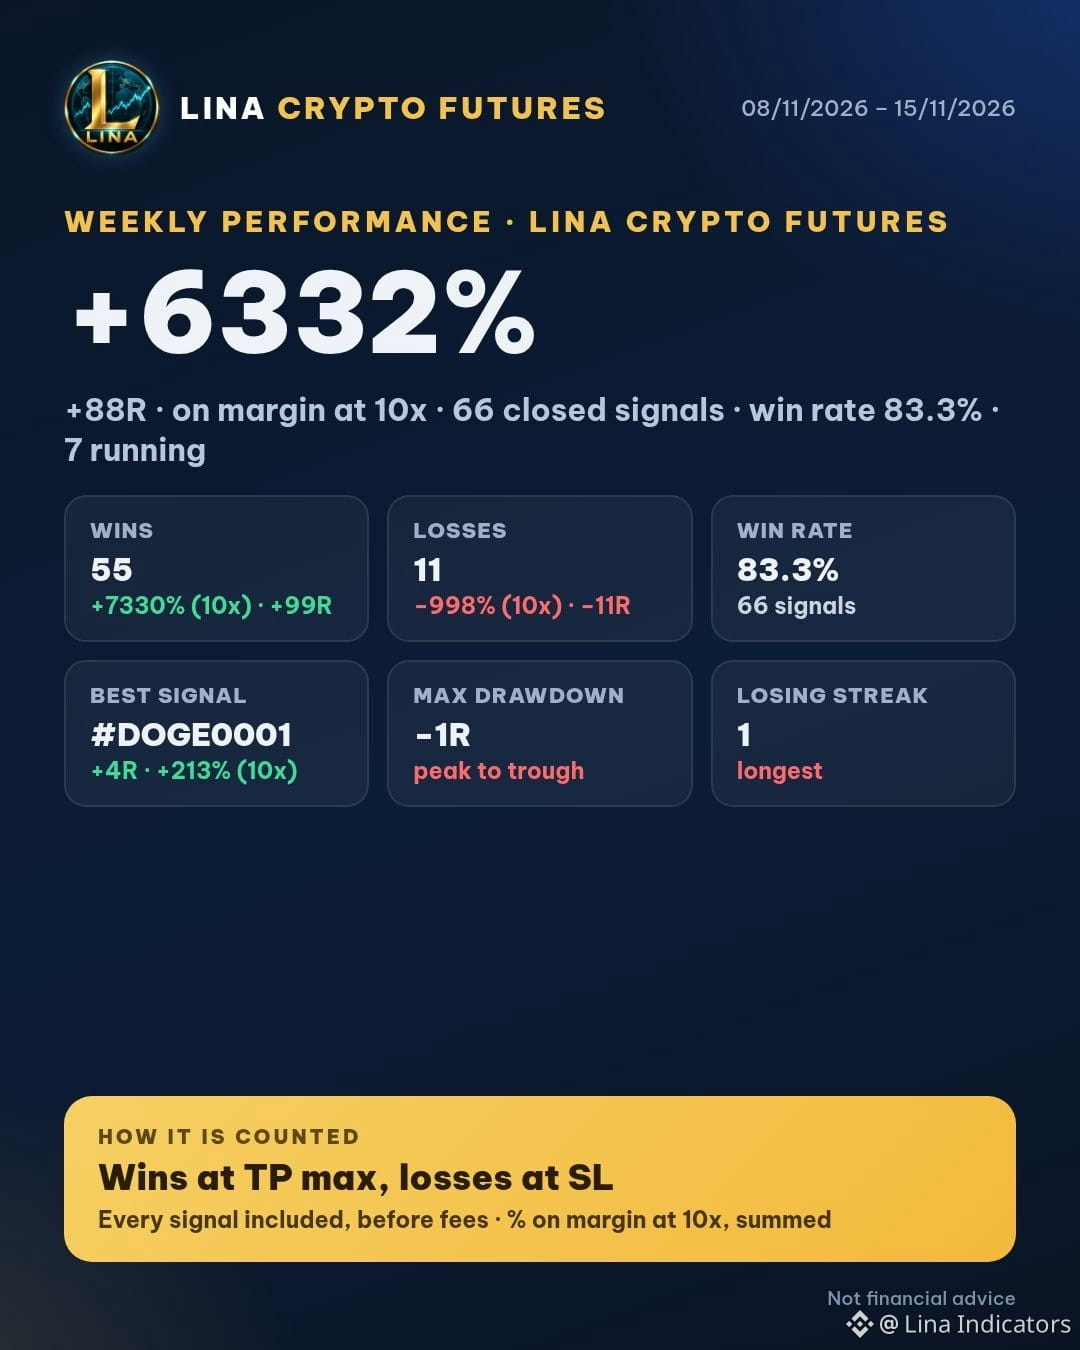
📊 WEEKLY PERFORMANCE
08/11/2026 – 15/11/2026 · Lina Crypto Futures
Total signals: 73
✅ Wins: 55 · +7330% (10x) · +99R
❌ Losses: 11 · −998% (10x) · −11R
⏳ Running: 7
💰 Net profit: +6332% (10x) · +88R
🎯 Win rate: 83.3%
📉 Max drawdown: −1R · Longest losing streak: 1
🏆 Best signal: #DOGE0001 SHORT · +4R · +213% (10x) · TP max
🧾 66 closed signals: 55 wins, 11 losses. Net +6332% (10x) · +88R after stop losses.
Wins counted at TP max (highest point reached), before fees. % = return on margin at 10x per signal, summed (not compounded). Not financial advice.
📊 WEEKLY PERFORMANCE
08/11/2026 – 15/11/2026 · Lina Crypto Futures
Total signals: 73
✅ Wins: 55 · +7330% (10x) · +99R
❌ Losses: 11 · −998% (10x) · −11R
⏳ Running: 7
💰 Net profit: +6332% (10x) · +88R
🎯 Win rate: 83.3%
📉 Max drawdown: −1R · Longest losing streak: 1
🏆 Best signal: #DOGE0001 SHORT · +4R · +213% (10x) · TP max
🧾 66 closed signals: 55 wins, 11 losses. Net +6332% (10x) · +88R after stop losses.
Wins counted at TP max (highest point reached), before fees. % = return on margin at 10x per signal, summed (not compounded). Not financial advice.
08/11/2026 – 15/11/2026 · Lina Crypto Futures
Total signals: 73
✅ Wins: 55 · +7330% (10x) · +99R
❌ Losses: 11 · −998% (10x) · −11R
⏳ Running: 7
💰 Net profit: +6332% (10x) · +88R
🎯 Win rate: 83.3%
📉 Max drawdown: −1R · Longest losing streak: 1
🏆 Best signal: #DOGE0001 SHORT · +4R · +213% (10x) · TP max
🧾 66 closed signals: 55 wins, 11 losses. Net +6332% (10x) · +88R after stop losses.
Wins counted at TP max (highest point reached), before fees. % = return on margin at 10x per signal, summed (not compounded). Not financial advice.
1
375
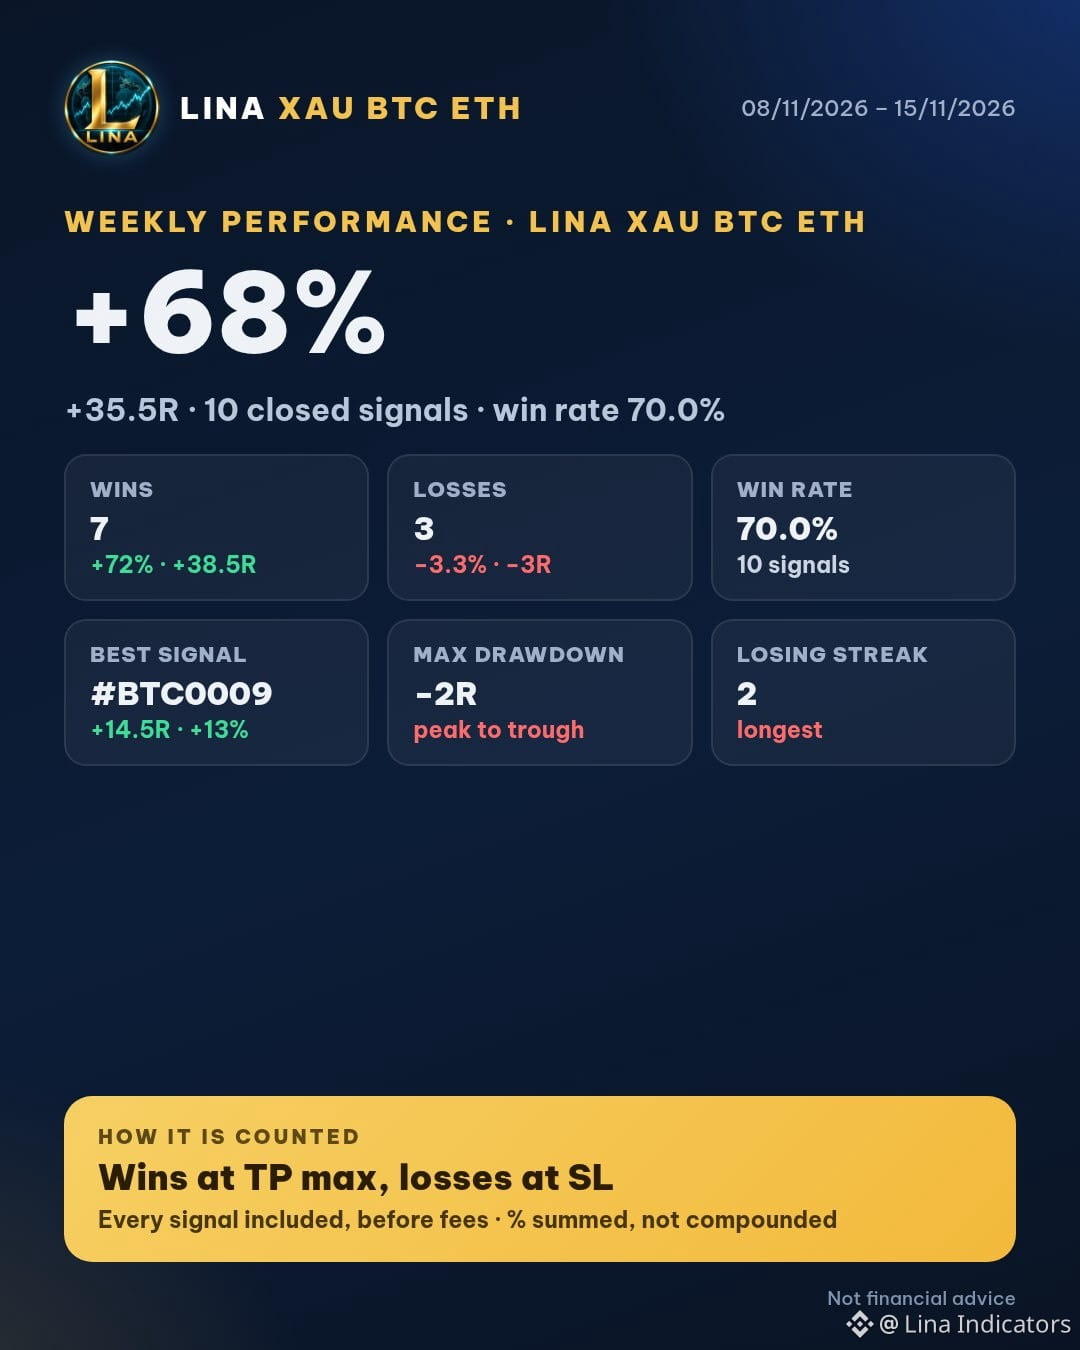
📊 WEEKLY PERFORMANCE
08/11/2026 – 15/11/2026 · Lina XAU BTC ETH
Total signals: 10
✅ Wins: 7 · +72% · +38.5R
❌ Losses: 3 · −3.3% · −3R
⏳ Running: 0
💰 Net profit: +68% · +35.5R
🎯 Win rate: 70.0%
📉 Max drawdown: −2R · Longest losing streak: 2
🏆 Best signal: #BTC0009 SELL · +14.5R · +13% · TP max
🧾 10 closed signals: 7 wins, 3 losses. Net +68% · +35.5R after stop losses.
Wins counted at TP max (highest point reached), before fees. % = price move per signal, summed (not compounded). Not financial advice.
📊 WEEKLY PERFORMANCE
08/11/2026 – 15/11/2026 · Lina XAU BTC ETH
Total signals: 10
✅ Wins: 7 · +72% · +38.5R
❌ Losses: 3 · −3.3% · −3R
⏳ Running: 0
💰 Net profit: +68% · +35.5R
🎯 Win rate: 70.0%
📉 Max drawdown: −2R · Longest losing streak: 2
🏆 Best signal: #BTC0009 SELL · +14.5R · +13% · TP max
🧾 10 closed signals: 7 wins, 3 losses. Net +68% · +35.5R after stop losses.
Wins counted at TP max (highest point reached), before fees. % = price move per signal, summed (not compounded). Not financial advice.
08/11/2026 – 15/11/2026 · Lina XAU BTC ETH
Total signals: 10
✅ Wins: 7 · +72% · +38.5R
❌ Losses: 3 · −3.3% · −3R
⏳ Running: 0
💰 Net profit: +68% · +35.5R
🎯 Win rate: 70.0%
📉 Max drawdown: −2R · Longest losing streak: 2
🏆 Best signal: #BTC0009 SELL · +14.5R · +13% · TP max
🧾 10 closed signals: 7 wins, 3 losses. Net +68% · +35.5R after stop losses.
Wins counted at TP max (highest point reached), before fees. % = price move per signal, summed (not compounded). Not financial advice.
1
1
185
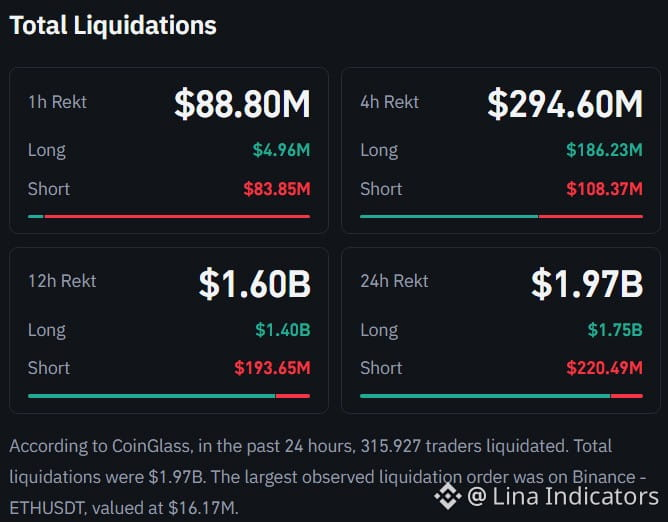
Crypto Liquidations | 24H
Total liquidations: $1.97B
• Long: $1.75B
• Short: $220.49M
• Traders liquidated: 315,927
Nearly 89% of the 24-hour liquidations came from long positions.
However, the latest 1-hour snapshot shows the opposite:
• Short liquidations: $83.85M
• Long liquidations: $4.96M
This suggests a sharp leverage reset followed by a short-term squeeze in the opposite direction.
The largest observed liquidation order in the snapshot was approximately $16.17M on Binance ETHUSDT.
High leverage is being punished on both sides.
For market analysis and educational purposes only.
Crypto Liquidations | 24H
Total liquidations: $1.97B
• Long: $1.75B
• Short: $220.49M
• Traders liquidated: 315,927
Nearly 89% of the 24-hour liquidations came from long positions.
However, the latest 1-hour snapshot shows the opposite:
• Short liquidations: $83.85M
• Long liquidations: $4.96M
This suggests a sharp leverage reset followed by a short-term squeeze in the opposite direction.
The largest observed liquidation order in the snapshot was approximately $16.17M on Binance ETHUSDT.
High leverage is being punished on both sides.
For market analysis and educational purposes only.
Total liquidations: $1.97B
• Long: $1.75B
• Short: $220.49M
• Traders liquidated: 315,927
Nearly 89% of the 24-hour liquidations came from long positions.
However, the latest 1-hour snapshot shows the opposite:
• Short liquidations: $83.85M
• Long liquidations: $4.96M
This suggests a sharp leverage reset followed by a short-term squeeze in the opposite direction.
The largest observed liquidation order in the snapshot was approximately $16.17M on Binance ETHUSDT.
High leverage is being punished on both sides.
For market analysis and educational purposes only.
1
1
194
Log in to explore more content
Join global crypto users on Binance Square
⚡️ Get latest and useful information about crypto.
💬 Trusted by the world’s largest crypto exchange.
👍 Discover real insights from verified creators.
Email / Phone number
Trending Topics
CanBTCReboundAfterFallingBelow60K?
0 views
386 Discussing
Bitcoin News | Bitcoin Falls Below $60,000 for the First Time Since July as IBIT Posts Record $541 Million Outflow
Binance News
·32 Likes
·54.5k views
GlobalStocksFaceLongestLosingStreakSince2023
0 views
434 Discussing
AnthropicPlungesTowardIPOPriceonDay2
0 views
142 Discussing