
#stockanalysis
stockanalysis
39,224 views
214 Discussing
Hot
Latest

·
--
Bullish
$🚨 AXON ENTERPRISE STOCK: BIG DRONE BET, STRONG GROWTH & A SURPRISING MARKET REACTION!
NASDAQ: AXON | Q3 2026 Earnings Analysis
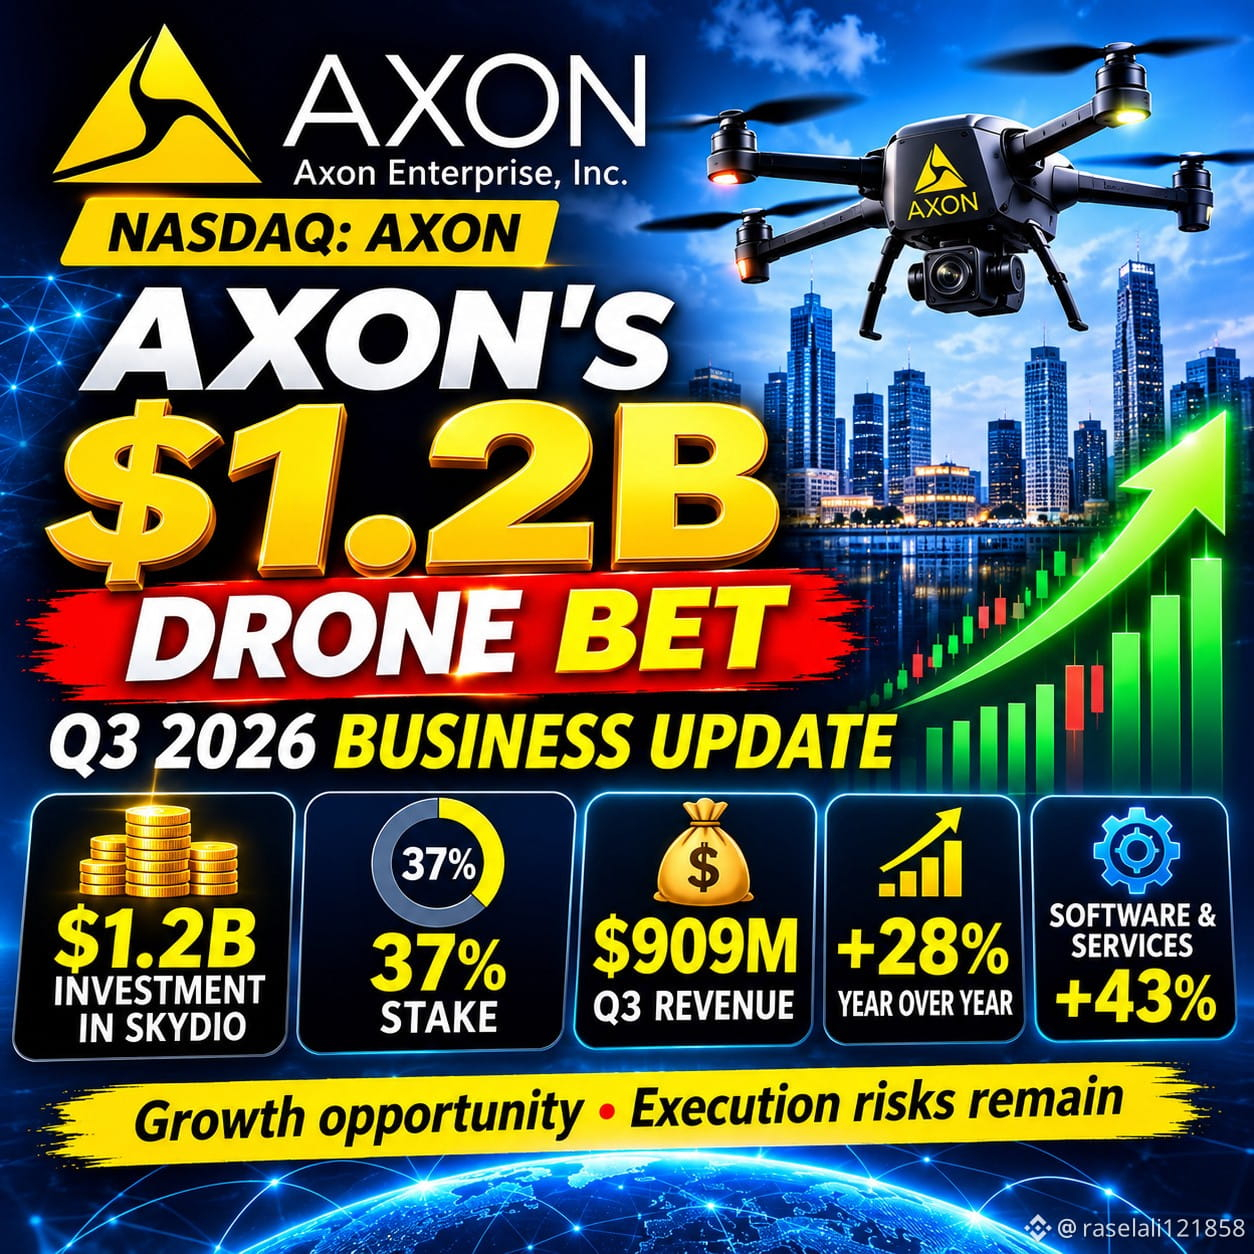
Axon Enterprise has made headlines after releasing its third-quarter 2026 financial results. The company is expanding its technology business while making a major move into the drone industry.
📊 Key Financial Highlights:
🔹 Revenue: $909 million, up 28% year over year.
🔹 Software & Services: Revenue increased 43% to $437 million.
🔹 AI Growth: Annual recurring revenue from AI surpassed $100 million.
🔹 Drone Investment: Axon announced an additional $1.2 billion investment in Skydio, increasing its ownership stake to 37%.
🔹 2026 Outlook: Axon now expects approximately 30% full-year revenue growth, compared with its previous forecast of 32%–34%.
⚠️ Why Is the Market Concerned?
Despite strong revenue growth, Axon missed analysts' earnings and revenue expectations.
The company also lowered its annual revenue outlook because of delays in three major federal Dedrone deployments worth approximately $130 million.
These developments contributed to a sharp decline in AXON shares.
🚀 What Could Be Important Going Forward?
1. Expansion of AI-powered public safety technology.
2. Growing demand for software and cloud services.
3. The long-term potential of drone technology.
4. Successful execution of the Skydio partnership.
5. Recovery in revenue growth and profit margins.
💬 THE BIG QUESTION
Is the recent decline in AXON stock a temporary market reaction, or does it signal deeper challenges for the company?
What do you think about Axon's long-term business strategy?
Share your thoughts in the comments! 👇
Disclaimer: This is an educational market discussion, not financial advice. Always research the risks before making investment decisions.
#AXON #AxonEnterprise #StockMarket #NASDAQ #EarningsReport #AIStocks #DroneTechnology #StockAnalysis
$🚨 AXON ENTERPRISE STOCK: BIG DRONE BET, STRONG GROWTH & A SURPRISING MARKET REACTION!
NASDAQ: AXON | Q3 2026 Earnings Analysis
Axon Enterprise has made headlines after releasing its third-quarter 2026 financial results. The company is expanding its technology business while making a major move into the drone industry.
📊 Key Financial Highlights:
🔹 Revenue: $909 million, up 28% year over year.
🔹 Software & Services: Revenue increased 43% to $437 million.
🔹 AI Growth: Annual recurring revenue from AI surpassed $100 million.
🔹 Drone Investment: Axon announced an additional $1.2 billion investment in Skydio, increasing its ownership stake to 37%.
🔹 2026 Outlook: Axon now expects approximately 30% full-year revenue growth, compared with its previous forecast of 32%–34%.
⚠️ Why Is the Market Concerned?
Despite strong revenue growth, Axon missed analysts' earnings and revenue expectations.
The company also lowered its annual revenue outlook because of delays in three major federal Dedrone deployments worth approximately $130 million.
These developments contributed to a sharp decline in AXON shares.
🚀 What Could Be Important Going Forward?
1. Expansion of AI-powered public safety technology.
2. Growing demand for software and cloud services.
3. The long-term potential of drone technology.
4. Successful execution of the Skydio partnership.
5. Recovery in revenue growth and profit margins.
💬 THE BIG QUESTION
Is the recent decline in AXON stock a temporary market reaction, or does it signal deeper challenges for the company?
What do you think about Axon's long-term business strategy?
Share your thoughts in the comments! 👇
Disclaimer: This is an educational market discussion, not financial advice. Always research the risks before making investment decisions.
#AXON #AxonEnterprise #StockMarket #NASDAQ #EarningsReport #AIStocks #DroneTechnology #StockAnalysis
NASDAQ: AXON | Q3 2026 Earnings Analysis
Axon Enterprise has made headlines after releasing its third-quarter 2026 financial results. The company is expanding its technology business while making a major move into the drone industry.
📊 Key Financial Highlights:
🔹 Revenue: $909 million, up 28% year over year.
🔹 Software & Services: Revenue increased 43% to $437 million.
🔹 AI Growth: Annual recurring revenue from AI surpassed $100 million.
🔹 Drone Investment: Axon announced an additional $1.2 billion investment in Skydio, increasing its ownership stake to 37%.
🔹 2026 Outlook: Axon now expects approximately 30% full-year revenue growth, compared with its previous forecast of 32%–34%.
⚠️ Why Is the Market Concerned?
Despite strong revenue growth, Axon missed analysts' earnings and revenue expectations.
The company also lowered its annual revenue outlook because of delays in three major federal Dedrone deployments worth approximately $130 million.
These developments contributed to a sharp decline in AXON shares.
🚀 What Could Be Important Going Forward?
1. Expansion of AI-powered public safety technology.
2. Growing demand for software and cloud services.
3. The long-term potential of drone technology.
4. Successful execution of the Skydio partnership.
5. Recovery in revenue growth and profit margins.
💬 THE BIG QUESTION
Is the recent decline in AXON stock a temporary market reaction, or does it signal deeper challenges for the company?
What do you think about Axon's long-term business strategy?
Share your thoughts in the comments! 👇
Disclaimer: This is an educational market discussion, not financial advice. Always research the risks before making investment decisions.
#AXON #AxonEnterprise #StockMarket #NASDAQ #EarningsReport #AIStocks #DroneTechnology #StockAnalysis
AXONUS-15.45%
103

·
--
NuScale Power reports Q3 2026 earnings on November 5. SMR stock trades near $5.60 after losing more than 60% from its 52-week high of $45.54. Revenue is the wrong thing to focus on here. Q2 came in at roughly $0.1 million, and Q3 will not look much different.
What I watch instead: total liquidity, which stood at $1.9 billion as of Q2, giving the company roughly four to five years of runway. If that number holds above $1.7 billion, the thesis stays intact. The Doosan manufacturing contract signed in late October moves the program from material procurement into first-unit production. That is progress, but it is supply-chain progress, not a binding customer order.
The real catalyst is a definitive agreement with TVA through the ENTRA1 partnership, targeting up to 6 gigawatts. Until that converts from negotiation to contract, SMR stock stays in wait-and-see territory. Not a guaranteed outcome either way.
#SMR #NuScale #NuclearEnergy #EarningsCall #StockAnalysis
NuScale Power reports Q3 2026 earnings on November 5. SMR stock trades near $5.60 after losing more than 60% from its 52-week high of $45.54. Revenue is the wrong thing to focus on here. Q2 came in at roughly $0.1 million, and Q3 will not look much different.
What I watch instead: total liquidity, which stood at $1.9 billion as of Q2, giving the company roughly four to five years of runway. If that number holds above $1.7 billion, the thesis stays intact. The Doosan manufacturing contract signed in late October moves the program from material procurement into first-unit production. That is progress, but it is supply-chain progress, not a binding customer order.
The real catalyst is a definitive agreement with TVA through the ENTRA1 partnership, targeting up to 6 gigawatts. Until that converts from negotiation to contract, SMR stock stays in wait-and-see territory. Not a guaranteed outcome either way.
#SMR #NuScale #NuclearEnergy #EarningsCall #StockAnalysis
What I watch instead: total liquidity, which stood at $1.9 billion as of Q2, giving the company roughly four to five years of runway. If that number holds above $1.7 billion, the thesis stays intact. The Doosan manufacturing contract signed in late October moves the program from material procurement into first-unit production. That is progress, but it is supply-chain progress, not a binding customer order.
The real catalyst is a definitive agreement with TVA through the ENTRA1 partnership, targeting up to 6 gigawatts. Until that converts from negotiation to contract, SMR stock stays in wait-and-see territory. Not a guaranteed outcome either way.
#SMR #NuScale #NuclearEnergy #EarningsCall #StockAnalysis
165

·
--
Article
🔥 FANG 1D Analysis: Pullback or Next Move Toward $212.54? 📈FANG (Diamondback Energy) 1D Technical Analysis: Pullback After Testing $212.54
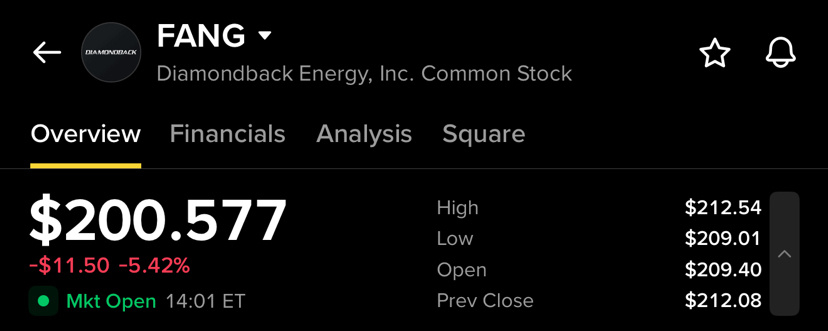
Diamondback Energy (FANG) is currently trading around $200.57, down approximately 5.42% on the session. The 1D chart shows an interesting setup: FANG recently pushed to a new short-term high near $212.54, but the latest session produced a strong bearish candle, bringing the price back toward the $200 area.
After a strong recovery from the $181.85 low, the stock has established a sequence of higher prices and moved above its major moving averages. The current pullback therefore deserves attention because it is testing an important technical area.
📈 Strong Recovery From $181.85
The recent structure started with FANG finding support around $181.85.
From that level, buyers gradually took control and pushed the stock higher. The recovery carried FANG through the $187, $193, and $200 areas before eventually reaching $212.54.
This was a significant improvement in the short-term structure because the stock moved from a lower range into a much stronger upward trend.
However, the latest candle shows that sellers became aggressive near the recent high.
🔴 Current Pullback Is Important
FANG is now trading around $200.57, after falling sharply from the $212.54 high.
The $200 level is psychologically important and also sits close to the recent price structure. Holding this region could allow buyers to stabilize the stock and potentially attempt another recovery.
A sustained move back above $207 would be an early indication that buyers are regaining momentum.
On the other hand, continued selling below $200 could bring the lower moving-average zones into focus.
📊 Moving Averages Show a Positive Background
The chart displays:
MA(7): $206.10
MA(25): $196.47
MA(99): $194.80
The short-term MA(7) is currently above the MA(25) and MA(99), which reflects the strength of the recent recovery.
More importantly, the price is still around and above the longer-term moving-average area despite today’s sharp decline.
The $194–$197 region therefore becomes an important technical zone.
If FANG finds support around this area and begins forming higher lows again, the broader recovery structure could remain intact.
🟢 Key Support Levels
The first level to watch is $200.
A successful defense of this psychological level could result in consolidation followed by another attempt toward the recent high.
Below $200, the next important area is approximately $193.80–$196.50, where the MA(25), MA(99), and previous price structure are located.
This zone could become particularly important if the current pullback continues.
A deeper decline would bring the $187 area into focus, while the previous swing low around $181.85 remains the major support visible on the chart.
🔥 Resistance Levels
On the upside, the first resistance zone is around $207–$208.
This area has recently acted as a trading zone before FANG moved toward its latest high.
The major resistance is the recent high at $212.54.
A decisive breakout above $212.54 would put FANG into a fresh price-discovery phase on this chart and could attract additional attention from momentum traders.
The market would need strong buying volume to make such a breakout more convincing.
📉 Volume Needs Attention
The latest decline occurred with noticeable selling activity, while the recent rally also showed periods of increased volume.
Volume will therefore be an important confirmation tool from here.
If FANG stabilizes around $200 or the $194–$197 zone while selling volume decreases, it could indicate that the pullback is losing momentum.
Conversely, increasing volume during further downside movement would suggest that sellers remain in control.
🧠 Bullish vs Bearish Scenario
🟢 Bullish Scenario
If FANG holds the $200 area and quickly reclaims $206–$207, buyers could attempt another move toward $212.54.
A clean breakout above $212.54, especially with stronger volume, would improve the daily structure and could signal continuation of the recent uptrend.
🔴 Bearish Scenario
If FANG fails to hold $200 and continues moving lower, attention could shift toward $196–$194, where the MA(25) and MA(99) are positioned.
A sustained breakdown below this area would weaken the recent bullish structure and could expose the stock to deeper support levels around $187.
📌 Key Levels to Watch
🟢 Immediate support: $200
🟢 Major support zone: $194–$197
🟡 Lower support: $187
🔴 First resistance: $206–$208
🔥 Major resistance: $212.54
📈 Breakout trigger: Above $212.54 with strong volume
🚀 Final Outlook
FANG has delivered a strong recovery from the $181.85 area and recently reached $212.54, but the latest 5%+ decline shows that sellers are actively defending the higher levels.
The most important question now is whether the current move is simply a healthy pullback after a strong rally or the beginning of a deeper correction.
For the bulls, holding $200 and reclaiming $206–$208 would be an encouraging development. A break above $212.54 could then become the next major technical signal.
For the bears, a decisive loss of the $194–$197 support zone would significantly weaken the current recovery structure.
🔥 FANG is now at a key decision zone.
Do you think FANG will bounce from $200 and retest $212.54, or will sellers push it toward the $194–$197 support zone?
Drop your FANG target in the comments 👇
Like ❤️ if you want more 1D stock analysis.
Follow for more technical setups and key market levels.
FANG article ke liye ye hashtags best rahenge:
#FANG #DiamondbackEnergy #Stocks #StockMarket #StockAnalysis #TechnicalAnalysis #BinanceSquare
Agar short & clean rakhna hai:
#StockAnalysis #TechnicalAnalysis #stockmarket #BinanceSquare
$FANG.US
{stock_us}(FANG.US)
🔥 FANG 1D Analysis: Pullback or Next Move Toward $212.54? 📈
FANG (Diamondback Energy) 1D Technical Analysis: Pullback After Testing $212.54
Diamondback Energy (FANG) is currently trading around $200.57, down approximately 5.42% on the session. The 1D chart shows an interesting setup: FANG recently pushed to a new short-term high near $212.54, but the latest session produced a strong bearish candle, bringing the price back toward the $200 area.
After a strong recovery from the $181.85 low, the stock has established a sequence of higher prices and moved above its major moving averages. The current pullback therefore deserves attention because it is testing an important technical area.
📈 Strong Recovery From $181.85
The recent structure started with FANG finding support around $181.85.
From that level, buyers gradually took control and pushed the stock higher. The recovery carried FANG through the $187, $193, and $200 areas before eventually reaching $212.54.
This was a significant improvement in the short-term structure because the stock moved from a lower range into a much stronger upward trend.
However, the latest candle shows that sellers became aggressive near the recent high.
🔴 Current Pullback Is Important
FANG is now trading around $200.57, after falling sharply from the $212.54 high.
The $200 level is psychologically important and also sits close to the recent price structure. Holding this region could allow buyers to stabilize the stock and potentially attempt another recovery.
A sustained move back above $207 would be an early indication that buyers are regaining momentum.
On the other hand, continued selling below $200 could bring the lower moving-average zones into focus.
📊 Moving Averages Show a Positive Background
The chart displays:
MA(7): $206.10
MA(25): $196.47
MA(99): $194.80
The short-term MA(7) is currently above the MA(25) and MA(99), which reflects the strength of the recent recovery.
More importantly, the price is still around and above the longer-term moving-average area despite today’s sharp decline.
The $194–$197 region therefore becomes an important technical zone.
If FANG finds support around this area and begins forming higher lows again, the broader recovery structure could remain intact.
🟢 Key Support Levels
The first level to watch is $200.
A successful defense of this psychological level could result in consolidation followed by another attempt toward the recent high.
Below $200, the next important area is approximately $193.80–$196.50, where the MA(25), MA(99), and previous price structure are located.
This zone could become particularly important if the current pullback continues.
A deeper decline would bring the $187 area into focus, while the previous swing low around $181.85 remains the major support visible on the chart.
🔥 Resistance Levels
On the upside, the first resistance zone is around $207–$208.
This area has recently acted as a trading zone before FANG moved toward its latest high.
The major resistance is the recent high at $212.54.
A decisive breakout above $212.54 would put FANG into a fresh price-discovery phase on this chart and could attract additional attention from momentum traders.
The market would need strong buying volume to make such a breakout more convincing.
📉 Volume Needs Attention
The latest decline occurred with noticeable selling activity, while the recent rally also showed periods of increased volume.
Volume will therefore be an important confirmation tool from here.
If FANG stabilizes around $200 or the $194–$197 zone while selling volume decreases, it could indicate that the pullback is losing momentum.
Conversely, increasing volume during further downside movement would suggest that sellers remain in control.
🧠 Bullish vs Bearish Scenario
🟢 Bullish Scenario
If FANG holds the $200 area and quickly reclaims $206–$207, buyers could attempt another move toward $212.54.
A clean breakout above $212.54, especially with stronger volume, would improve the daily structure and could signal continuation of the recent uptrend.
🔴 Bearish Scenario
If FANG fails to hold $200 and continues moving lower, attention could shift toward $196–$194, where the MA(25) and MA(99) are positioned.
A sustained breakdown below this area would weaken the recent bullish structure and could expose the stock to deeper support levels around $187.
📌 Key Levels to Watch
🟢 Immediate support: $200
🟢 Major support zone: $194–$197
🟡 Lower support: $187
🔴 First resistance: $206–$208
🔥 Major resistance: $212.54
📈 Breakout trigger: Above $212.54 with strong volume
🚀 Final Outlook
FANG has delivered a strong recovery from the $181.85 area and recently reached $212.54, but the latest 5%+ decline shows that sellers are actively defending the higher levels.
The most important question now is whether the current move is simply a healthy pullback after a strong rally or the beginning of a deeper correction.
For the bulls, holding $200 and reclaiming $206–$208 would be an encouraging development. A break above $212.54 could then become the next major technical signal.
For the bears, a decisive loss of the $194–$197 support zone would significantly weaken the current recovery structure.
🔥 FANG is now at a key decision zone.
Do you think FANG will bounce from $200 and retest $212.54, or will sellers push it toward the $194–$197 support zone?
Drop your FANG target in the comments 👇
Like ❤️ if you want more 1D stock analysis.
Follow for more technical setups and key market levels.
FANG article ke liye ye hashtags best rahenge:
#FANG #DiamondbackEnergy #Stocks #StockMarket #StockAnalysis #TechnicalAnalysis #BinanceSquare
Agar short & clean rakhna hai:
#StockAnalysis #TechnicalAnalysis #stockmarket #BinanceSquare
$FANG.US
Diamondback Energy (FANG) is currently trading around $200.57, down approximately 5.42% on the session. The 1D chart shows an interesting setup: FANG recently pushed to a new short-term high near $212.54, but the latest session produced a strong bearish candle, bringing the price back toward the $200 area.
After a strong recovery from the $181.85 low, the stock has established a sequence of higher prices and moved above its major moving averages. The current pullback therefore deserves attention because it is testing an important technical area.
📈 Strong Recovery From $181.85
The recent structure started with FANG finding support around $181.85.
From that level, buyers gradually took control and pushed the stock higher. The recovery carried FANG through the $187, $193, and $200 areas before eventually reaching $212.54.
This was a significant improvement in the short-term structure because the stock moved from a lower range into a much stronger upward trend.
However, the latest candle shows that sellers became aggressive near the recent high.
🔴 Current Pullback Is Important
FANG is now trading around $200.57, after falling sharply from the $212.54 high.
The $200 level is psychologically important and also sits close to the recent price structure. Holding this region could allow buyers to stabilize the stock and potentially attempt another recovery.
A sustained move back above $207 would be an early indication that buyers are regaining momentum.
On the other hand, continued selling below $200 could bring the lower moving-average zones into focus.
📊 Moving Averages Show a Positive Background
The chart displays:
MA(7): $206.10
MA(25): $196.47
MA(99): $194.80
The short-term MA(7) is currently above the MA(25) and MA(99), which reflects the strength of the recent recovery.
More importantly, the price is still around and above the longer-term moving-average area despite today’s sharp decline.
The $194–$197 region therefore becomes an important technical zone.
If FANG finds support around this area and begins forming higher lows again, the broader recovery structure could remain intact.
🟢 Key Support Levels
The first level to watch is $200.
A successful defense of this psychological level could result in consolidation followed by another attempt toward the recent high.
Below $200, the next important area is approximately $193.80–$196.50, where the MA(25), MA(99), and previous price structure are located.
This zone could become particularly important if the current pullback continues.
A deeper decline would bring the $187 area into focus, while the previous swing low around $181.85 remains the major support visible on the chart.
🔥 Resistance Levels
On the upside, the first resistance zone is around $207–$208.
This area has recently acted as a trading zone before FANG moved toward its latest high.
The major resistance is the recent high at $212.54.
A decisive breakout above $212.54 would put FANG into a fresh price-discovery phase on this chart and could attract additional attention from momentum traders.
The market would need strong buying volume to make such a breakout more convincing.
📉 Volume Needs Attention
The latest decline occurred with noticeable selling activity, while the recent rally also showed periods of increased volume.
Volume will therefore be an important confirmation tool from here.
If FANG stabilizes around $200 or the $194–$197 zone while selling volume decreases, it could indicate that the pullback is losing momentum.
Conversely, increasing volume during further downside movement would suggest that sellers remain in control.
🧠 Bullish vs Bearish Scenario
🟢 Bullish Scenario
If FANG holds the $200 area and quickly reclaims $206–$207, buyers could attempt another move toward $212.54.
A clean breakout above $212.54, especially with stronger volume, would improve the daily structure and could signal continuation of the recent uptrend.
🔴 Bearish Scenario
If FANG fails to hold $200 and continues moving lower, attention could shift toward $196–$194, where the MA(25) and MA(99) are positioned.
A sustained breakdown below this area would weaken the recent bullish structure and could expose the stock to deeper support levels around $187.
📌 Key Levels to Watch
🟢 Immediate support: $200
🟢 Major support zone: $194–$197
🟡 Lower support: $187
🔴 First resistance: $206–$208
🔥 Major resistance: $212.54
📈 Breakout trigger: Above $212.54 with strong volume
🚀 Final Outlook
FANG has delivered a strong recovery from the $181.85 area and recently reached $212.54, but the latest 5%+ decline shows that sellers are actively defending the higher levels.
The most important question now is whether the current move is simply a healthy pullback after a strong rally or the beginning of a deeper correction.
For the bulls, holding $200 and reclaiming $206–$208 would be an encouraging development. A break above $212.54 could then become the next major technical signal.
For the bears, a decisive loss of the $194–$197 support zone would significantly weaken the current recovery structure.
🔥 FANG is now at a key decision zone.
Do you think FANG will bounce from $200 and retest $212.54, or will sellers push it toward the $194–$197 support zone?
Drop your FANG target in the comments 👇
Like ❤️ if you want more 1D stock analysis.
Follow for more technical setups and key market levels.
FANG article ke liye ye hashtags best rahenge:
#FANG #DiamondbackEnergy #Stocks #StockMarket #StockAnalysis #TechnicalAnalysis #BinanceSquare
Agar short & clean rakhna hai:
#StockAnalysis #TechnicalAnalysis #stockmarket #BinanceSquare
$FANG.US
FANGUS+1.96%
33

Verified

Article
📊 Eli Lilly (NYSE: LLY) | Strong Business, Attractive Valuation?📊 Eli Lilly (NYSE: LLY) | Strong Business, Attractive Valuation?
Eli Lilly's promising Retatrutide results reinforce its competitive position in the rapidly expanding obesity and diabetes treatment markets. However, strong fundamentals don't automatically justify a premium stock valuation.
🔹 Fundamentals: Robust revenue growth, high profit margins, and a promising drug pipeline support long-term growth potential.
🔹 Valuation: Analysts' average price target is approximately $1,334, while Morningstar estimates fair value at $980, highlighting significant differences in growth and risk assumptions.
🔹 Key Risks: Increasing competition, drug pricing pressures, regulatory uncertainty, and potential P/E multiple compression.
🎯 My Investment Approach:
1. Avoid chasing positive headlines or short-term momentum.
2. Review Q3 earnings and updated management guidance before making investment decisions.
3. Consider gradual accumulation at more attractive valuations, with $1,000–$1,100 as a preliminary area of interest, provided fundamentals remain intact.
4. Maintain a 5–10 year investment horizon, monitoring earnings growth, free cash flow, and market share.
⚠️ Important: With Q3 earnings scheduled for October 29, valuation assumptions and potential entry levels should be reassessed following the announcement.
💡 Bottom Line: A great company isn't necessarily a great investment at any price. Long-term returns depend not only on business growth but also on the valuation investors pay today.
Disciplined investing begins with valuation, not excitement.
For educational discussion only. Not financial advice (DYOR)
#EliLilly #StockAnalysis #ValueInvesting
$LLY
📊 Eli Lilly (NYSE: LLY) | Strong Business, Attractive Valuation?
📊 Eli Lilly (NYSE: LLY) | Strong Business, Attractive Valuation?
Eli Lilly's promising Retatrutide results reinforce its competitive position in the rapidly expanding obesity and diabetes treatment markets. However, strong fundamentals don't automatically justify a premium stock valuation.
🔹 Fundamentals: Robust revenue growth, high profit margins, and a promising drug pipeline support long-term growth potential.
🔹 Valuation: Analysts' average price target is approximately $1,334, while Morningstar estimates fair value at $980, highlighting significant differences in growth and risk assumptions.
🔹 Key Risks: Increasing competition, drug pricing pressures, regulatory uncertainty, and potential P/E multiple compression.
🎯 My Investment Approach:
1. Avoid chasing positive headlines or short-term momentum.
2. Review Q3 earnings and updated management guidance before making investment decisions.
3. Consider gradual accumulation at more attractive valuations, with $1,000–$1,100 as a preliminary area of interest, provided fundamentals remain intact.
4. Maintain a 5–10 year investment horizon, monitoring earnings growth, free cash flow, and market share.
⚠️ Important: With Q3 earnings scheduled for October 29, valuation assumptions and potential entry levels should be reassessed following the announcement.
💡 Bottom Line: A great company isn't necessarily a great investment at any price. Long-term returns depend not only on business growth but also on the valuation investors pay today.
Disciplined investing begins with valuation, not excitement.
For educational discussion only. Not financial advice (DYOR)
#EliLilly #StockAnalysis #ValueInvesting
$LLY
Eli Lilly's promising Retatrutide results reinforce its competitive position in the rapidly expanding obesity and diabetes treatment markets. However, strong fundamentals don't automatically justify a premium stock valuation.
🔹 Fundamentals: Robust revenue growth, high profit margins, and a promising drug pipeline support long-term growth potential.
🔹 Valuation: Analysts' average price target is approximately $1,334, while Morningstar estimates fair value at $980, highlighting significant differences in growth and risk assumptions.
🔹 Key Risks: Increasing competition, drug pricing pressures, regulatory uncertainty, and potential P/E multiple compression.
🎯 My Investment Approach:
1. Avoid chasing positive headlines or short-term momentum.
2. Review Q3 earnings and updated management guidance before making investment decisions.
3. Consider gradual accumulation at more attractive valuations, with $1,000–$1,100 as a preliminary area of interest, provided fundamentals remain intact.
4. Maintain a 5–10 year investment horizon, monitoring earnings growth, free cash flow, and market share.
⚠️ Important: With Q3 earnings scheduled for October 29, valuation assumptions and potential entry levels should be reassessed following the announcement.
💡 Bottom Line: A great company isn't necessarily a great investment at any price. Long-term returns depend not only on business growth but also on the valuation investors pay today.
Disciplined investing begins with valuation, not excitement.
For educational discussion only. Not financial advice (DYOR)
#EliLilly #StockAnalysis #ValueInvesting
$LLY
401

·
--
Weekly stock outlook: October 26–30, 2026
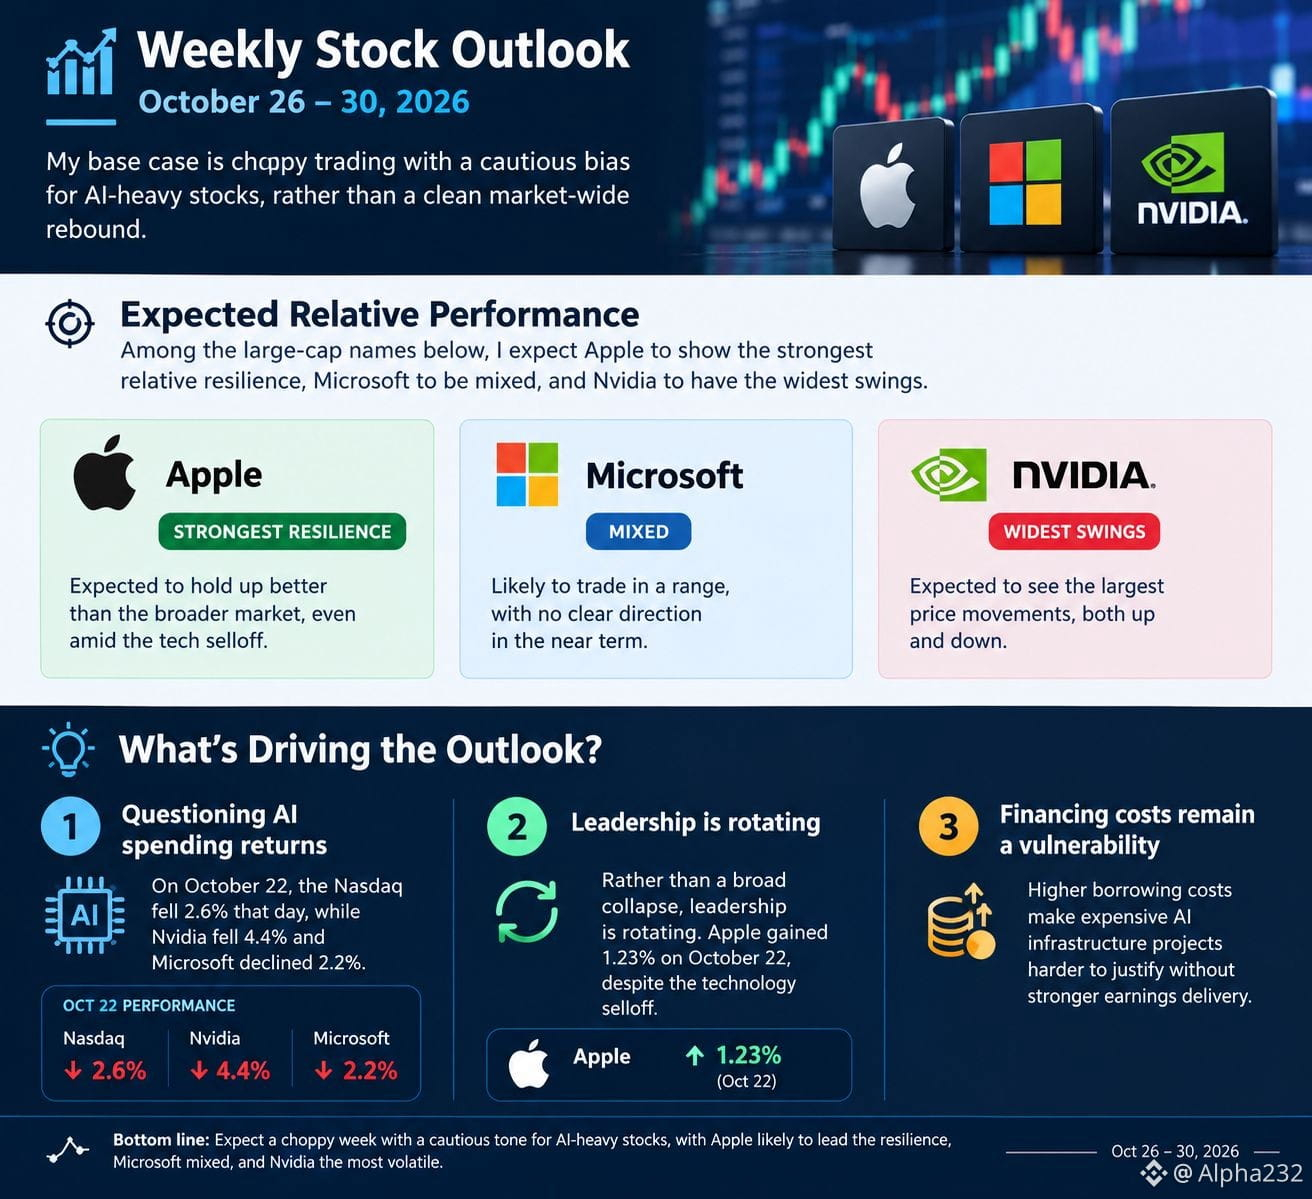
My base case is choppy trading with a cautious bias for AI-heavy stocks, rather than a clean market-wide rebound. Among the large-cap names below, I expect Apple to show the strongest relative resilience, Microsoft to be mixed, and Nvidia to have the widest swings.
What’s driving the outlook?
1. Investors are questioning the near-term returns on AI spending. On October 22, the Nasdaq fell 2.6% that day, while Nvidia fell 4.4% and Microsoft declined 2.2%.
2. Leadership is rotating rather than uniformly collapsing. Apple gained 1.23% on October 22, despite the technology selloff.
3. Financing costs remain a vulnerability. Higher borrowing costs make expensive AI infrastructure projects harder to justify without stronger earnings delivery.
Based on the above post, create a professional matching image that shows this analysis.
#StockAnalysis
{spot}(AAPLBUSDT)
{spot}(NVDABUSDT)
{spot}(MSFTBUSDT)
Weekly stock outlook: October 26–30, 2026
My base case is choppy trading with a cautious bias for AI-heavy stocks, rather than a clean market-wide rebound. Among the large-cap names below, I expect Apple to show the strongest relative resilience, Microsoft to be mixed, and Nvidia to have the widest swings.
What’s driving the outlook?
1. Investors are questioning the near-term returns on AI spending. On October 22, the Nasdaq fell 2.6% that day, while Nvidia fell 4.4% and Microsoft declined 2.2%.
2. Leadership is rotating rather than uniformly collapsing. Apple gained 1.23% on October 22, despite the technology selloff.
3. Financing costs remain a vulnerability. Higher borrowing costs make expensive AI infrastructure projects harder to justify without stronger earnings delivery.
Based on the above post, create a professional matching image that shows this analysis.
#StockAnalysis
My base case is choppy trading with a cautious bias for AI-heavy stocks, rather than a clean market-wide rebound. Among the large-cap names below, I expect Apple to show the strongest relative resilience, Microsoft to be mixed, and Nvidia to have the widest swings.
What’s driving the outlook?
1. Investors are questioning the near-term returns on AI spending. On October 22, the Nasdaq fell 2.6% that day, while Nvidia fell 4.4% and Microsoft declined 2.2%.
2. Leadership is rotating rather than uniformly collapsing. Apple gained 1.23% on October 22, despite the technology selloff.
3. Financing costs remain a vulnerability. Higher borrowing costs make expensive AI infrastructure projects harder to justify without stronger earnings delivery.
Based on the above post, create a professional matching image that shows this analysis.
#StockAnalysis
320
Verified
#EarningsSeason
🚨 $NOK NOKIA BEATS Q3 2026 EARNINGS ESTIMATES! 🔥
Nokia is pushing deeper into the AI infrastructure race! 🤖📈
🟢 Revenue: €5.15B vs. €5.04B expected
🟢 Adjusted EPS: €0.09 vs. €0.06 expected
🟢 Operating Profit: €605M vs. €442M expected
🟢 AI & Cloud Sales: +123% YoY
🟢 AI & Cloud Orders: €1.5B
🚀 The bigger story? Optical networks, IP networking and AI infrastructure are driving growth as Nokia expands its position in the AI boom.
📊 FY2026 operating profit outlook: €2.1B–€2.6B.
👀 Can $NOK become a major AI infrastructure winner, or is the growth already priced in?
Follow for more earnings and market updates.
#NOK #EarningsSeason #StockAnalysis #AI
$NOK
{future}(NOKUSDT)
#EarningsSeason
🚨 $NOK NOKIA BEATS Q3 2026 EARNINGS ESTIMATES! 🔥
Nokia is pushing deeper into the AI infrastructure race! 🤖📈
🟢 Revenue: €5.15B vs. €5.04B expected
🟢 Adjusted EPS: €0.09 vs. €0.06 expected
🟢 Operating Profit: €605M vs. €442M expected
🟢 AI & Cloud Sales: +123% YoY
🟢 AI & Cloud Orders: €1.5B
🚀 The bigger story? Optical networks, IP networking and AI infrastructure are driving growth as Nokia expands its position in the AI boom.
📊 FY2026 operating profit outlook: €2.1B–€2.6B.
👀 Can $NOK become a major AI infrastructure winner, or is the growth already priced in?
Follow for more earnings and market updates.
#NOK #EarningsSeason #StockAnalysis #AI
$NOK
🚨 $NOK NOKIA BEATS Q3 2026 EARNINGS ESTIMATES! 🔥
Nokia is pushing deeper into the AI infrastructure race! 🤖📈
🟢 Revenue: €5.15B vs. €5.04B expected
🟢 Adjusted EPS: €0.09 vs. €0.06 expected
🟢 Operating Profit: €605M vs. €442M expected
🟢 AI & Cloud Sales: +123% YoY
🟢 AI & Cloud Orders: €1.5B
🚀 The bigger story? Optical networks, IP networking and AI infrastructure are driving growth as Nokia expands its position in the AI boom.
📊 FY2026 operating profit outlook: €2.1B–€2.6B.
👀 Can $NOK become a major AI infrastructure winner, or is the growth already priced in?
Follow for more earnings and market updates.
#NOK #EarningsSeason #StockAnalysis #AI
$NOK
2
819

💡 Microsoft's AI Opportunity Is Huge — But There's One Detail Investors Shouldn't Ignore!
$MSFTB combines enterprise software, cloud computing, productivity tools, and AI-related services into a broad technology business.
Its long-term outlook depends not just on AI adoption but also on cloud growth, operating margins, capital expenditure, and how effectively new tools generate revenue.
More spending on AI infrastructure can create opportunities, but investors still need to evaluate the financial return on that investment.
📈 The question isn't simply whether AI will grow. It's whether companies can turn that growth into sustainable profits.
💬 Which matters more for Microsoft's future: Azure growth, AI monetization, or enterprise software?
$MSFTB
{spot}(MSFTBUSDT)
#Microsoft #MSFT #CloudComputing #StockAnalysis #BinanceSquare
💡 Microsoft's AI Opportunity Is Huge — But There's One Detail Investors Shouldn't Ignore!
$MSFTB combines enterprise software, cloud computing, productivity tools, and AI-related services into a broad technology business.
Its long-term outlook depends not just on AI adoption but also on cloud growth, operating margins, capital expenditure, and how effectively new tools generate revenue.
More spending on AI infrastructure can create opportunities, but investors still need to evaluate the financial return on that investment.
📈 The question isn't simply whether AI will grow. It's whether companies can turn that growth into sustainable profits.
💬 Which matters more for Microsoft's future: Azure growth, AI monetization, or enterprise software?
$MSFTB
#Microsoft #MSFT #CloudComputing #StockAnalysis #BinanceSquare
$MSFTB combines enterprise software, cloud computing, productivity tools, and AI-related services into a broad technology business.
Its long-term outlook depends not just on AI adoption but also on cloud growth, operating margins, capital expenditure, and how effectively new tools generate revenue.
More spending on AI infrastructure can create opportunities, but investors still need to evaluate the financial return on that investment.
📈 The question isn't simply whether AI will grow. It's whether companies can turn that growth into sustainable profits.
💬 Which matters more for Microsoft's future: Azure growth, AI monetization, or enterprise software?
$MSFTB
#Microsoft #MSFT #CloudComputing #StockAnalysis #BinanceSquare
41

·
--
$AMZN.US Today’s Market Update 📊 | October 16, 2026
📉 Price: Around $253–$254 per share during Friday’s trading session. AMZN is facing mild selling pressure as technology stocks weaken. �
Yahoo Finance +1
☁️ Market Outlook: Watch the $252 support zone and $255 resistance area. Amazon’s Q3 2026 earnings report is scheduled for October 29, which could influence the next major move. �
Amazon News +1
Trading View: Short-term momentum looks cautious; watch for a confirmed breakout before entering a
#amzon #Market_Update #StockAnalysis
{future}(AMZNUSDT)
{stock_us}(AMZN.US)
$AMZN.US Today’s Market Update 📊 | October 16, 2026
📉 Price: Around $253–$254 per share during Friday’s trading session. AMZN is facing mild selling pressure as technology stocks weaken. �
Yahoo Finance +1
☁️ Market Outlook: Watch the $252 support zone and $255 resistance area. Amazon’s Q3 2026 earnings report is scheduled for October 29, which could influence the next major move. �
Amazon News +1
Trading View: Short-term momentum looks cautious; watch for a confirmed breakout before entering a
#amzon #Market_Update #StockAnalysis
📉 Price: Around $253–$254 per share during Friday’s trading session. AMZN is facing mild selling pressure as technology stocks weaken. �
Yahoo Finance +1
☁️ Market Outlook: Watch the $252 support zone and $255 resistance area. Amazon’s Q3 2026 earnings report is scheduled for October 29, which could influence the next major move. �
Amazon News +1
Trading View: Short-term momentum looks cautious; watch for a confirmed breakout before entering a
#amzon #Market_Update #StockAnalysis

AMZNUS-0.02%
253

·
--
Bullish
💻 $MSFT
{future}(MSFTUSDT)
: WATCH THE NUMBERS, NOT JUST THE AI HYPE!
Microsoft's cloud ecosystem and AI products give investors important growth drivers to evaluate. But the biggest question is whether AI investment translates into sustainable profits. 🔍 Watch these factors: • Azure and cloud revenue growth. • AI product adoption and monetization. • Capital expenditure versus cash flow. • Earnings guidance and valuation. 📈 Potential opportunity: Strong results combined with a confirmed price breakout. ⚠️ Main risk: Spending rises faster than the revenue and profits it generates. My rule: Follow business performance first, then evaluate the stock price. What is your long-term view on $MSFT? #MSFTUSDT #Microsoft #AIInvesting #StockAnalysis
💻 $MSFT
: WATCH THE NUMBERS, NOT JUST THE AI HYPE!
Microsoft's cloud ecosystem and AI products give investors important growth drivers to evaluate. But the biggest question is whether AI investment translates into sustainable profits. 🔍 Watch these factors: • Azure and cloud revenue growth. • AI product adoption and monetization. • Capital expenditure versus cash flow. • Earnings guidance and valuation. 📈 Potential opportunity: Strong results combined with a confirmed price breakout. ⚠️ Main risk: Spending rises faster than the revenue and profits it generates. My rule: Follow business performance first, then evaluate the stock price. What is your long-term view on $MSFT ? #MSFTUSDT #Microsoft #AIInvesting #StockAnalysis
: WATCH THE NUMBERS, NOT JUST THE AI HYPE!
Microsoft's cloud ecosystem and AI products give investors important growth drivers to evaluate. But the biggest question is whether AI investment translates into sustainable profits. 🔍 Watch these factors: • Azure and cloud revenue growth. • AI product adoption and monetization. • Capital expenditure versus cash flow. • Earnings guidance and valuation. 📈 Potential opportunity: Strong results combined with a confirmed price breakout. ⚠️ Main risk: Spending rises faster than the revenue and profits it generates. My rule: Follow business performance first, then evaluate the stock price. What is your long-term view on $MSFT ? #MSFTUSDT #Microsoft #AIInvesting #StockAnalysis
1
108

·
--
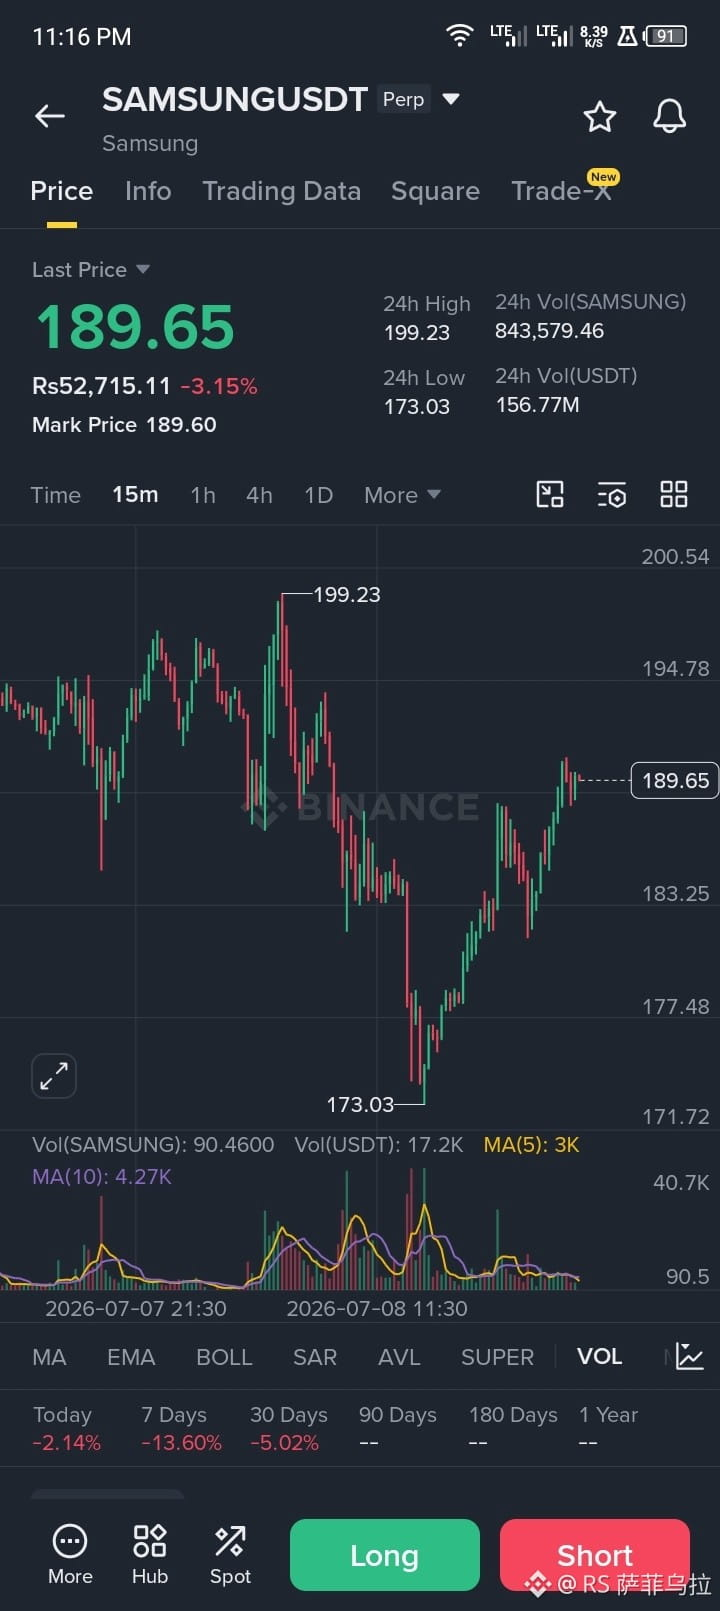
SAMSUNGUSDT Perpetual Contract tracks the stock price of Samsung Electronics Co., Ltd. Samsung Electronics is a global technology leader with businesses spanning semiconductors, smartphones, consumer electronics, and display panels, holding strong positions in memory chips, mobile devices, and home appliances.$SAMSUNG
{future}(SAMSUNGUSDT)
#rssafi #Samsung #StockAnalysis
SAMSUNGUSDT Perpetual Contract tracks the stock price of Samsung Electronics Co., Ltd. Samsung Electronics is a global technology leader with businesses spanning semiconductors, smartphones, consumer electronics, and display panels, holding strong positions in memory chips, mobile devices, and home appliances.$SAMSUNG
#rssafi #Samsung #StockAnalysis
#rssafi #Samsung #StockAnalysis
113

·
--
💾 SanDisk (SNDK) down -3.68% today — the storage sector is getting hammered alongside its chip peers. Is this a buying opportunity?
$1,212.21 with RSI at 41.6 — leaning bearish. Price is well below SMA20 ($1,393) and SMA50 ($1,688), confirming the strong downtrend. But volume at 1.15x average shows conviction behind the selling.
📊 Technical Snapshot:
• Price: $1,212.21 | Trend: Strong Downtrend
• RSI: 41.6 (bearish, approaching oversold)
• MACD: Negative and expanding
• 48.1% below 3-month high
• Volume: Slightly above average (1.15x)
🧠 Key Logic:
SanDisk benefits from the same AI/data center tail as Micron and SK Hynix, but it's getting caught in the sector-wide rotation out of semiconductors. The elevated volume suggests institutional selling, not just retail panic. When institutions sell into strength, it usually means they see a longer correction ahead.
📍 Key Levels:
• Support: $1,280 (SMA20 — broken, now resistance)
• Actual support: $1,016 (3-month low)
• Resistance: $1,307 (SMA5) → $1,393 (SMA20)
The memory chip sector is in pain. Temporary shakeout or structural shift? 👇
#SanDisk #Storage #StockAnalysis
⚠️ Disclaimer: Not financial advice. Always DYOR before investing. Sector rotations can last longer than expected.
💾 SanDisk (SNDK) down -3.68% today — the storage sector is getting hammered alongside its chip peers. Is this a buying opportunity?
$1,212.21 with RSI at 41.6 — leaning bearish. Price is well below SMA20 ($1,393) and SMA50 ($1,688), confirming the strong downtrend. But volume at 1.15x average shows conviction behind the selling.
📊 Technical Snapshot:
• Price: $1,212.21 | Trend: Strong Downtrend
• RSI: 41.6 (bearish, approaching oversold)
• MACD: Negative and expanding
• 48.1% below 3-month high
• Volume: Slightly above average (1.15x)
🧠 Key Logic:
SanDisk benefits from the same AI/data center tail as Micron and SK Hynix, but it's getting caught in the sector-wide rotation out of semiconductors. The elevated volume suggests institutional selling, not just retail panic. When institutions sell into strength, it usually means they see a longer correction ahead.
📍 Key Levels:
• Support: $1,280 (SMA20 — broken, now resistance)
• Actual support: $1,016 (3-month low)
• Resistance: $1,307 (SMA5) → $1,393 (SMA20)
The memory chip sector is in pain. Temporary shakeout or structural shift? 👇
#SanDisk #Storage #StockAnalysis
⚠️ Disclaimer: Not financial advice. Always DYOR before investing. Sector rotations can last longer than expected.
$1,212.21 with RSI at 41.6 — leaning bearish. Price is well below SMA20 ($1,393) and SMA50 ($1,688), confirming the strong downtrend. But volume at 1.15x average shows conviction behind the selling.
📊 Technical Snapshot:
• Price: $1,212.21 | Trend: Strong Downtrend
• RSI: 41.6 (bearish, approaching oversold)
• MACD: Negative and expanding
• 48.1% below 3-month high
• Volume: Slightly above average (1.15x)
🧠 Key Logic:
SanDisk benefits from the same AI/data center tail as Micron and SK Hynix, but it's getting caught in the sector-wide rotation out of semiconductors. The elevated volume suggests institutional selling, not just retail panic. When institutions sell into strength, it usually means they see a longer correction ahead.
📍 Key Levels:
• Support: $1,280 (SMA20 — broken, now resistance)
• Actual support: $1,016 (3-month low)
• Resistance: $1,307 (SMA5) → $1,393 (SMA20)
The memory chip sector is in pain. Temporary shakeout or structural shift? 👇
#SanDisk #Storage #StockAnalysis
⚠️ Disclaimer: Not financial advice. Always DYOR before investing. Sector rotations can last longer than expected.
32
·
--
Memory stocks are WAKING UP 💾 Micron (MU) just ripped +7.6% — and this isn't random.
The semiconductor cycle is turning, and memory chips are leading the charge. AI data centers don't build themselves.
📊 Technical Snapshot:
• Price: $892.67 (+7.62%)
• RSI: 48.8 (neutral — plenty of room to run)
• Price above SMA5 ($832) and SMA10 ($875) ✅
• MACD improving — momentum shifting bullish
• Volume: 37.3M shares (normal — could be stronger)
Still -26.4% from 3-month high ($1,214). If the memory recovery thesis plays out, there's significant upside from here.
📌 Key Levels:
Support: $830 (recent low) → then $732 (3-month floor)
Resistance: $901 (SMA20) → then $1,088
Why This Matters:
HBM (High Bandwidth Memory) demand for AI training is insatiable. Every new AI data center = more MU chips. The cycle is early.
MU breaking above $900 (SMA20) would be a major bullish confirmation. Watch for it.
Are memory stocks the smartest semiconductor play right now? 🤔
#Micron #Semiconductors #StockAnalysis
⚠️ This is not financial advice. Always do your own research. Past performance does not guarantee future results.
Memory stocks are WAKING UP 💾 Micron (MU) just ripped +7.6% — and this isn't random.
The semiconductor cycle is turning, and memory chips are leading the charge. AI data centers don't build themselves.
📊 Technical Snapshot:
• Price: $892.67 (+7.62%)
• RSI: 48.8 (neutral — plenty of room to run)
• Price above SMA5 ($832) and SMA10 ($875) ✅
• MACD improving — momentum shifting bullish
• Volume: 37.3M shares (normal — could be stronger)
Still -26.4% from 3-month high ($1,214). If the memory recovery thesis plays out, there's significant upside from here.
📌 Key Levels:
Support: $830 (recent low) → then $732 (3-month floor)
Resistance: $901 (SMA20) → then $1,088
Why This Matters:
HBM (High Bandwidth Memory) demand for AI training is insatiable. Every new AI data center = more MU chips. The cycle is early.
MU breaking above $900 (SMA20) would be a major bullish confirmation. Watch for it.
Are memory stocks the smartest semiconductor play right now? 🤔
#Micron #Semiconductors #StockAnalysis
⚠️ This is not financial advice. Always do your own research. Past performance does not guarantee future results.
The semiconductor cycle is turning, and memory chips are leading the charge. AI data centers don't build themselves.
📊 Technical Snapshot:
• Price: $892.67 (+7.62%)
• RSI: 48.8 (neutral — plenty of room to run)
• Price above SMA5 ($832) and SMA10 ($875) ✅
• MACD improving — momentum shifting bullish
• Volume: 37.3M shares (normal — could be stronger)
Still -26.4% from 3-month high ($1,214). If the memory recovery thesis plays out, there's significant upside from here.
📌 Key Levels:
Support: $830 (recent low) → then $732 (3-month floor)
Resistance: $901 (SMA20) → then $1,088
Why This Matters:
HBM (High Bandwidth Memory) demand for AI training is insatiable. Every new AI data center = more MU chips. The cycle is early.
MU breaking above $900 (SMA20) would be a major bullish confirmation. Watch for it.
Are memory stocks the smartest semiconductor play right now? 🤔
#Micron #Semiconductors #StockAnalysis
⚠️ This is not financial advice. Always do your own research. Past performance does not guarantee future results.
29
·
--
SanDisk: Down 45% from highs but volume just surged 60% above average. Someone's buying 👀
SNDK at $1,288 (+0.63%) — barely green on the day, but the volume story is what caught my attention. 14.3M shares traded vs 8.9M average. That's institutional activity.
🔬 Technical Snapshot:
• Trend: Downtrend
• RSI: 40.7 (bearish but approaching oversold)
• MACD: -161.74 (negative)
• Volume: 14.3M (1.6x normal — significant!)
📊 Key Levels:
• Support: $1,333 (immediate floor)
• Resistance: $2,050 (the comeback target)
• 3-month low: $1,015.89
High volume on a small green day after a massive selloff? That's the pattern smart money leaves behind when they're quietly accumulating.
The storage sector is cyclical. We might be early in the bottoming process.
Storage sector: bottom is in or more pain ahead? 📦
#SanDisk #Storage #StockAnalysis #DYOR
⚠️ Disclaimer: This is not financial advice. Always do your own research.
SanDisk: Down 45% from highs but volume just surged 60% above average. Someone's buying 👀
SNDK at $1,288 (+0.63%) — barely green on the day, but the volume story is what caught my attention. 14.3M shares traded vs 8.9M average. That's institutional activity.
🔬 Technical Snapshot:
• Trend: Downtrend
• RSI: 40.7 (bearish but approaching oversold)
• MACD: -161.74 (negative)
• Volume: 14.3M (1.6x normal — significant!)
📊 Key Levels:
• Support: $1,333 (immediate floor)
• Resistance: $2,050 (the comeback target)
• 3-month low: $1,015.89
High volume on a small green day after a massive selloff? That's the pattern smart money leaves behind when they're quietly accumulating.
The storage sector is cyclical. We might be early in the bottoming process.
Storage sector: bottom is in or more pain ahead? 📦
#SanDisk #Storage #StockAnalysis #DYOR
⚠️ Disclaimer: This is not financial advice. Always do your own research.
SNDK at $1,288 (+0.63%) — barely green on the day, but the volume story is what caught my attention. 14.3M shares traded vs 8.9M average. That's institutional activity.
🔬 Technical Snapshot:
• Trend: Downtrend
• RSI: 40.7 (bearish but approaching oversold)
• MACD: -161.74 (negative)
• Volume: 14.3M (1.6x normal — significant!)
📊 Key Levels:
• Support: $1,333 (immediate floor)
• Resistance: $2,050 (the comeback target)
• 3-month low: $1,015.89
High volume on a small green day after a massive selloff? That's the pattern smart money leaves behind when they're quietly accumulating.
The storage sector is cyclical. We might be early in the bottoming process.
Storage sector: bottom is in or more pain ahead? 📦
#SanDisk #Storage #StockAnalysis #DYOR
⚠️ Disclaimer: This is not financial advice. Always do your own research.
26
·
--
🔻 SK Hynix just dropped -4.88% and is now 51% below its 3-month high. The world's #2 memory maker is in freefall — is this a buying opportunity or a falling knife?
Technical Snapshot:
→ Price: ₩1,422,000
→ RSI: 39 — approaching oversold
→ Trend: Strong downtrend (price < SMA5 < SMA10 < SMA20 < SMA50)
→ Volume: 83% of average — no panic selling, but no conviction buying either
→ 3-month range: ₩1,322,000 (low) to ₩2,919,000 (high)
📊 Why This Is A Watchlist Stock:
SK Hynix is the purest play on HBM for AI chips. Nvidia's demand for HBM3e is growing, and Hynix is the primary supplier. Yet the stock is down 51% from its peak — a massive disconnect between fundamentals and price action.
The chart is ugly: all moving averages are stacked bearishly. But RSI at 39 is approaching the zone where mean-reversion trades start working.
Key levels:
→ Support: ₩1,322,000 (3-month low — THIS is the line)
→ Resistance: ₩1,577,000 (SMA5 area) → ₩2,124,500 (SMA50)
💬 Would you catch this knife at ₩1.42M, or wait for it to test the 3-month low? The AI thesis is intact, but the chart is brutal. 👇
#SKHynix #Memory #StockAnalysis
⚠️ Disclaimer: This is analysis, not financial advice. Always do your own research and manage risk accordingly.
🔻 SK Hynix just dropped -4.88% and is now 51% below its 3-month high. The world's #2 memory maker is in freefall — is this a buying opportunity or a falling knife?
Technical Snapshot:
→ Price: ₩1,422,000
→ RSI: 39 — approaching oversold
→ Trend: Strong downtrend (price < SMA5 < SMA10 < SMA20 < SMA50)
→ Volume: 83% of average — no panic selling, but no conviction buying either
→ 3-month range: ₩1,322,000 (low) to ₩2,919,000 (high)
📊 Why This Is A Watchlist Stock:
SK Hynix is the purest play on HBM for AI chips. Nvidia's demand for HBM3e is growing, and Hynix is the primary supplier. Yet the stock is down 51% from its peak — a massive disconnect between fundamentals and price action.
The chart is ugly: all moving averages are stacked bearishly. But RSI at 39 is approaching the zone where mean-reversion trades start working.
Key levels:
→ Support: ₩1,322,000 (3-month low — THIS is the line)
→ Resistance: ₩1,577,000 (SMA5 area) → ₩2,124,500 (SMA50)
💬 Would you catch this knife at ₩1.42M, or wait for it to test the 3-month low? The AI thesis is intact, but the chart is brutal. 👇
#SKHynix #Memory #StockAnalysis
⚠️ Disclaimer: This is analysis, not financial advice. Always do your own research and manage risk accordingly.
Technical Snapshot:
→ Price: ₩1,422,000
→ RSI: 39 — approaching oversold
→ Trend: Strong downtrend (price < SMA5 < SMA10 < SMA20 < SMA50)
→ Volume: 83% of average — no panic selling, but no conviction buying either
→ 3-month range: ₩1,322,000 (low) to ₩2,919,000 (high)
📊 Why This Is A Watchlist Stock:
SK Hynix is the purest play on HBM for AI chips. Nvidia's demand for HBM3e is growing, and Hynix is the primary supplier. Yet the stock is down 51% from its peak — a massive disconnect between fundamentals and price action.
The chart is ugly: all moving averages are stacked bearishly. But RSI at 39 is approaching the zone where mean-reversion trades start working.
Key levels:
→ Support: ₩1,322,000 (3-month low — THIS is the line)
→ Resistance: ₩1,577,000 (SMA5 area) → ₩2,124,500 (SMA50)
💬 Would you catch this knife at ₩1.42M, or wait for it to test the 3-month low? The AI thesis is intact, but the chart is brutal. 👇
#SKHynix #Memory #StockAnalysis
⚠️ Disclaimer: This is analysis, not financial advice. Always do your own research and manage risk accordingly.
56
·
--
🔬 Micron (MU) at $877.57 — the semiconductor sector is under pressure, but here's why this chipmaker might be setting up for a reversal.
MU is down just -0.44% today, consolidating after a brutal run from its 3-month high of $1,213. RSI at 47.5 is neutral, and price is sitting right at its 5-day SMA ($874.88).
📊 Technical Snapshot:
• Price: $877.57 | Trend: Consolidation
• RSI: 47.5 (neutral — room in both directions)
• SMA5: $874.88 (price just above — bullish micro-signal)
• SMA50: $970.95 (27% below — shows the downtrend severity)
• Volume: Declining at 71% of average
🧠 Key Logic:
MU has dropped 27.7% from its 3-month high. The semiconductor cycle is turning — HBM demand for AI is accelerating, and Micron is a primary beneficiary. The consolidation near $877 with declining volume suggests sellers are exhausting. A break above SMA20 ($888) would confirm the reversal.
📍 Key Levels:
• Support: $751 (major)
• Resistance: $888 (SMA20) → $971 (SMA50)
• Entry zone: $853-875 (current consolidation)
Is the semiconductor selloff overdone or just beginning? 🤔
#Micron #Semiconductors #StockAnalysis
⚠️ Disclaimer: Not financial advice. Always do your own research before investing. Past performance ≠ future results.
🔬 Micron (MU) at $877.57 — the semiconductor sector is under pressure, but here's why this chipmaker might be setting up for a reversal.
MU is down just -0.44% today, consolidating after a brutal run from its 3-month high of $1,213. RSI at 47.5 is neutral, and price is sitting right at its 5-day SMA ($874.88).
📊 Technical Snapshot:
• Price: $877.57 | Trend: Consolidation
• RSI: 47.5 (neutral — room in both directions)
• SMA5: $874.88 (price just above — bullish micro-signal)
• SMA50: $970.95 (27% below — shows the downtrend severity)
• Volume: Declining at 71% of average
🧠 Key Logic:
MU has dropped 27.7% from its 3-month high. The semiconductor cycle is turning — HBM demand for AI is accelerating, and Micron is a primary beneficiary. The consolidation near $877 with declining volume suggests sellers are exhausting. A break above SMA20 ($888) would confirm the reversal.
📍 Key Levels:
• Support: $751 (major)
• Resistance: $888 (SMA20) → $971 (SMA50)
• Entry zone: $853-875 (current consolidation)
Is the semiconductor selloff overdone or just beginning? 🤔
#Micron #Semiconductors #StockAnalysis
⚠️ Disclaimer: Not financial advice. Always do your own research before investing. Past performance ≠ future results.
MU is down just -0.44% today, consolidating after a brutal run from its 3-month high of $1,213. RSI at 47.5 is neutral, and price is sitting right at its 5-day SMA ($874.88).
📊 Technical Snapshot:
• Price: $877.57 | Trend: Consolidation
• RSI: 47.5 (neutral — room in both directions)
• SMA5: $874.88 (price just above — bullish micro-signal)
• SMA50: $970.95 (27% below — shows the downtrend severity)
• Volume: Declining at 71% of average
🧠 Key Logic:
MU has dropped 27.7% from its 3-month high. The semiconductor cycle is turning — HBM demand for AI is accelerating, and Micron is a primary beneficiary. The consolidation near $877 with declining volume suggests sellers are exhausting. A break above SMA20 ($888) would confirm the reversal.
📍 Key Levels:
• Support: $751 (major)
• Resistance: $888 (SMA20) → $971 (SMA50)
• Entry zone: $853-875 (current consolidation)
Is the semiconductor selloff overdone or just beginning? 🤔
#Micron #Semiconductors #StockAnalysis
⚠️ Disclaimer: Not financial advice. Always do your own research before investing. Past performance ≠ future results.
31
·
--
🧠 Micron ($MU) at $877 — stuck between a rock and a hard place. Here's why traders should care.
Technical Snapshot:
→ Price: $877.57 (-0.44%)
→ RSI: 47.5 — dead neutral
→ Trend: Consolidation after a sharp drop from $1,213 (27.7% off 3-month high)
→ Volume: 71% of average — declining interest
→ SMA50: $970 — massive overhead resistance
📊 The Memory Stock Story:
MU is in a tricky spot. It's bounced 28.8% from its 3-month low of $681, but the rally has stalled hard. Price is now below SMA20 ($888) and far below SMA50 ($970). The MACD is negative and deepening — bears still control the medium-term trend.
HBM (High Bandwidth Memory) demand from AI is the bull thesis. But the stock hasn't been able to translate that narrative into price action. Key levels:
→ Support: $751 (critical floor)
→ Resistance: $971 (SMA50) → $1,088 (prior breakout level)
💬 Are you accumulating MU on weakness or staying away until it reclaims $970? The AI memory thesis is strong, but the chart says patience. 👇
#Micron #MU #StockAnalysis
⚠️ Disclaimer: This is analysis, not financial advice. Always do your own research and manage risk accordingly.
🧠 Micron ($MU ) at $877 — stuck between a rock and a hard place. Here's why traders should care.
Technical Snapshot:
→ Price: $877.57 (-0.44%)
→ RSI: 47.5 — dead neutral
→ Trend: Consolidation after a sharp drop from $1,213 (27.7% off 3-month high)
→ Volume: 71% of average — declining interest
→ SMA50: $970 — massive overhead resistance
📊 The Memory Stock Story:
MU is in a tricky spot. It's bounced 28.8% from its 3-month low of $681, but the rally has stalled hard. Price is now below SMA20 ($888) and far below SMA50 ($970). The MACD is negative and deepening — bears still control the medium-term trend.
HBM (High Bandwidth Memory) demand from AI is the bull thesis. But the stock hasn't been able to translate that narrative into price action. Key levels:
→ Support: $751 (critical floor)
→ Resistance: $971 (SMA50) → $1,088 (prior breakout level)
💬 Are you accumulating MU on weakness or staying away until it reclaims $970? The AI memory thesis is strong, but the chart says patience. 👇
#Micron #MU #StockAnalysis
⚠️ Disclaimer: This is analysis, not financial advice. Always do your own research and manage risk accordingly.
Technical Snapshot:
→ Price: $877.57 (-0.44%)
→ RSI: 47.5 — dead neutral
→ Trend: Consolidation after a sharp drop from $1,213 (27.7% off 3-month high)
→ Volume: 71% of average — declining interest
→ SMA50: $970 — massive overhead resistance
📊 The Memory Stock Story:
MU is in a tricky spot. It's bounced 28.8% from its 3-month low of $681, but the rally has stalled hard. Price is now below SMA20 ($888) and far below SMA50 ($970). The MACD is negative and deepening — bears still control the medium-term trend.
HBM (High Bandwidth Memory) demand from AI is the bull thesis. But the stock hasn't been able to translate that narrative into price action. Key levels:
→ Support: $751 (critical floor)
→ Resistance: $971 (SMA50) → $1,088 (prior breakout level)
💬 Are you accumulating MU on weakness or staying away until it reclaims $970? The AI memory thesis is strong, but the chart says patience. 👇
#Micron #MU #StockAnalysis
⚠️ Disclaimer: This is analysis, not financial advice. Always do your own research and manage risk accordingly.
73
·
--
🧠 Micron (MU) at $868 — memory stocks are bottoming, but is it time to buy?
The semiconductor memory sector has been brutal this quarter. MU is down 28% from its 3-month high. But here's why smart money is watching this level closely.
📊 Technical Snapshot:
• Price: $868.52 | +0.87%
• RSI: 47 (neutral — room to move either way)
• Trend: Downtrend, but volume declining (sellers exhausting)
• SMA20: $878.73 (price below = still bearish)
• Support: $762 | Resistance: $1,088
💡 Why Watch MU Now?
1. Memory pricing cycle is bottoming — HBM demand is real
2. RSI at 47 = not oversold yet, but approaching accumulation zone
3. Volume declining in a downtrend = selling pressure fading
4. SK Hynix (peer) rallied 7.3% today — sector rotation starting?
🔑 Key Levels:
• If $854 (SMA10) holds as support → bullish reversal signal
• Break above $879 (SMA20) → trend change confirmation
• Lose $762 → deeper correction to $680
⚠️ This is a patient trade. Wait for confirmation before entering.
Are semiconductor stocks a buy here or still falling knives? Your take 👇
#MU #Semiconductors #StockAnalysis
⚠️ Disclaimer: This is not financial advice. Always do your own research before investing.
🧠 Micron (MU) at $868 — memory stocks are bottoming, but is it time to buy?
The semiconductor memory sector has been brutal this quarter. MU is down 28% from its 3-month high. But here's why smart money is watching this level closely.
📊 Technical Snapshot:
• Price: $868.52 | +0.87%
• RSI: 47 (neutral — room to move either way)
• Trend: Downtrend, but volume declining (sellers exhausting)
• SMA20: $878.73 (price below = still bearish)
• Support: $762 | Resistance: $1,088
💡 Why Watch MU Now?
1. Memory pricing cycle is bottoming — HBM demand is real
2. RSI at 47 = not oversold yet, but approaching accumulation zone
3. Volume declining in a downtrend = selling pressure fading
4. SK Hynix (peer) rallied 7.3% today — sector rotation starting?
🔑 Key Levels:
• If $854 (SMA10) holds as support → bullish reversal signal
• Break above $879 (SMA20) → trend change confirmation
• Lose $762 → deeper correction to $680
⚠️ This is a patient trade. Wait for confirmation before entering.
Are semiconductor stocks a buy here or still falling knives? Your take 👇
#MU #Semiconductors #StockAnalysis
⚠️ Disclaimer: This is not financial advice. Always do your own research before investing.
The semiconductor memory sector has been brutal this quarter. MU is down 28% from its 3-month high. But here's why smart money is watching this level closely.
📊 Technical Snapshot:
• Price: $868.52 | +0.87%
• RSI: 47 (neutral — room to move either way)
• Trend: Downtrend, but volume declining (sellers exhausting)
• SMA20: $878.73 (price below = still bearish)
• Support: $762 | Resistance: $1,088
💡 Why Watch MU Now?
1. Memory pricing cycle is bottoming — HBM demand is real
2. RSI at 47 = not oversold yet, but approaching accumulation zone
3. Volume declining in a downtrend = selling pressure fading
4. SK Hynix (peer) rallied 7.3% today — sector rotation starting?
🔑 Key Levels:
• If $854 (SMA10) holds as support → bullish reversal signal
• Break above $879 (SMA20) → trend change confirmation
• Lose $762 → deeper correction to $680
⚠️ This is a patient trade. Wait for confirmation before entering.
Are semiconductor stocks a buy here or still falling knives? Your take 👇
#MU #Semiconductors #StockAnalysis
⚠️ Disclaimer: This is not financial advice. Always do your own research before investing.
36
·
--
SK Hynix is down 51% from its 3-month high. The world's #2 memory chipmaker is screaming "value trap" or "generational buy" — and the chart is giving us clues. 🔍
📊 Technical Snapshot:
Price: ₩1,422,000 (-4.88% today)
RSI: 39 (bearish but approaching oversold)
Trend: Strong downtrend — price below ALL moving averages
Volume: 5M shares, normal range (0.83x avg) — no capitulation yet
SMA50: ₩2,124,500 — that's 49% ABOVE current price. Brutal.
🧠 The Bear Case:
Memory pricing is cyclical, and we're clearly in a downturn phase. SK Hynix's HBM dominance for AI is real, but the market is pricing in a deeper trough than expected. The -51% decline from highs suggests the market expects memory ASPs to bottom later than consensus.
🧠 The Bull Case:
RSI at 39 is approaching oversold. At ₩1,322,000 (the 3-month low), we're only 7.6% away. If that level holds, a mean reversion to SMA20 (₩1,725,300) represents a +21% trade.
📋 Key Levels:
Support: ₩1,322,000 (3-month low — do or die)
Resistance: ₩1,577,000 (first bounce target)
Major resistance: ₩2,628,000 (long-term target)
⚠️ Don't buy here. Wait for either: (a) a confirmed bounce off ₩1,322K with volume, or (b) a break below ₩1,322K to reset your thesis entirely.
Is the memory downturn almost over, or are we just getting started? 💾
#SKHynix #Memory #StockAnalysis
⚠️ This is not financial advice. Korean equities carry currency and market risk. Always DYOR.
SK Hynix is down 51% from its 3-month high. The world's #2 memory chipmaker is screaming "value trap" or "generational buy" — and the chart is giving us clues. 🔍
📊 Technical Snapshot:
Price: ₩1,422,000 (-4.88% today)
RSI: 39 (bearish but approaching oversold)
Trend: Strong downtrend — price below ALL moving averages
Volume: 5M shares, normal range (0.83x avg) — no capitulation yet
SMA50: ₩2,124,500 — that's 49% ABOVE current price. Brutal.
🧠 The Bear Case:
Memory pricing is cyclical, and we're clearly in a downturn phase. SK Hynix's HBM dominance for AI is real, but the market is pricing in a deeper trough than expected. The -51% decline from highs suggests the market expects memory ASPs to bottom later than consensus.
🧠 The Bull Case:
RSI at 39 is approaching oversold. At ₩1,322,000 (the 3-month low), we're only 7.6% away. If that level holds, a mean reversion to SMA20 (₩1,725,300) represents a +21% trade.
📋 Key Levels:
Support: ₩1,322,000 (3-month low — do or die)
Resistance: ₩1,577,000 (first bounce target)
Major resistance: ₩2,628,000 (long-term target)
⚠️ Don't buy here. Wait for either: (a) a confirmed bounce off ₩1,322K with volume, or (b) a break below ₩1,322K to reset your thesis entirely.
Is the memory downturn almost over, or are we just getting started? 💾
#SKHynix #Memory #StockAnalysis
⚠️ This is not financial advice. Korean equities carry currency and market risk. Always DYOR.
📊 Technical Snapshot:
Price: ₩1,422,000 (-4.88% today)
RSI: 39 (bearish but approaching oversold)
Trend: Strong downtrend — price below ALL moving averages
Volume: 5M shares, normal range (0.83x avg) — no capitulation yet
SMA50: ₩2,124,500 — that's 49% ABOVE current price. Brutal.
🧠 The Bear Case:
Memory pricing is cyclical, and we're clearly in a downturn phase. SK Hynix's HBM dominance for AI is real, but the market is pricing in a deeper trough than expected. The -51% decline from highs suggests the market expects memory ASPs to bottom later than consensus.
🧠 The Bull Case:
RSI at 39 is approaching oversold. At ₩1,322,000 (the 3-month low), we're only 7.6% away. If that level holds, a mean reversion to SMA20 (₩1,725,300) represents a +21% trade.
📋 Key Levels:
Support: ₩1,322,000 (3-month low — do or die)
Resistance: ₩1,577,000 (first bounce target)
Major resistance: ₩2,628,000 (long-term target)
⚠️ Don't buy here. Wait for either: (a) a confirmed bounce off ₩1,322K with volume, or (b) a break below ₩1,322K to reset your thesis entirely.
Is the memory downturn almost over, or are we just getting started? 💾
#SKHynix #Memory #StockAnalysis
⚠️ This is not financial advice. Korean equities carry currency and market risk. Always DYOR.
93


Article
US Stocks: AI Optimism Meets Higher Oil and Treasury YieldsUS stocks finished Friday, September 25, higher as investors continued to show interest in AI-related technology companies. The S&P 500 gained 0.51%, the Nasdaq rose 0.48%, and the Dow Jones advanced 0.93%.
But the market is not focused on AI alone.
Three themes to watch
AI momentum
Technology and AI-related stocks remained an important source of market strength.
Interest rates and Treasury yields
Higher Treasury yields can affect borrowing costs and investor expectations around future Federal Reserve policy.
Oil prices
Oil prices remain an important inflation variable. Higher energy costs can increase inflation pressure and influence expectations for interest rates.
Market takeaway
The current stock-market environment is being shaped by a combination of technology optimism and macroeconomic concerns. Watching AI earnings, oil prices, Treasury yields and Federal Reserve expectations together may provide more context than looking at index prices alone.
This is educational market analysis, not financial advice.
#stockmarketnews #StockAnalysis
$AAPL.US
{stock_us}(AAPL.US)
$NVDA.US
{stock_us}(NVDA.US)
$CL
US Stocks: AI Optimism Meets Higher Oil and Treasury Yields
US stocks finished Friday, September 25, higher as investors continued to show interest in AI-related technology companies. The S&P 500 gained 0.51%, the Nasdaq rose 0.48%, and the Dow Jones advanced 0.93%.
But the market is not focused on AI alone.
Three themes to watch
AI momentum
Technology and AI-related stocks remained an important source of market strength.
Interest rates and Treasury yields
Higher Treasury yields can affect borrowing costs and investor expectations around future Federal Reserve policy.
Oil prices
Oil prices remain an important inflation variable. Higher energy costs can increase inflation pressure and influence expectations for interest rates.
Market takeaway
The current stock-market environment is being shaped by a combination of technology optimism and macroeconomic concerns. Watching AI earnings, oil prices, Treasury yields and Federal Reserve expectations together may provide more context than looking at index prices alone.
This is educational market analysis, not financial advice.
#stockmarketnews #StockAnalysis
$AAPL.US
$NVDA.US
$CL
But the market is not focused on AI alone.
Three themes to watch
AI momentum
Technology and AI-related stocks remained an important source of market strength.
Interest rates and Treasury yields
Higher Treasury yields can affect borrowing costs and investor expectations around future Federal Reserve policy.
Oil prices
Oil prices remain an important inflation variable. Higher energy costs can increase inflation pressure and influence expectations for interest rates.
Market takeaway
The current stock-market environment is being shaped by a combination of technology optimism and macroeconomic concerns. Watching AI earnings, oil prices, Treasury yields and Federal Reserve expectations together may provide more context than looking at index prices alone.
This is educational market analysis, not financial advice.
#stockmarketnews #StockAnalysis
$AAPL.US
$NVDA.US
$CL
143

·
--
IBM IS SHIFTING TOWARD A SOFTWARE-LED MODEL WITH BULLISH REVENUE IMPLICATIONS 📈
Entry: 270 🔥
Target: 291 🚀
JPMorgan has officially upgraded $IBM to Overweight, highlighting a structural pivot from hardware to high-margin software services. Software now accounts for two-thirds of combined profits, signaling a significant improvement in cash conversion and earnings quality.
This transition supports a higher valuation multiple as the firm shifts its core revenue driver toward hybrid cloud and AI infrastructure. The move to a 291 price target reflects increased confidence in their accelerated growth trajectory. Do you view this shift as sufficient to sustain a long-term trend reversal?
Not financial advice. Always manage your risk.
#IBM #StockAnalysis #MarketStructure #InvestmentStrategy
🎯
IBM IS SHIFTING TOWARD A SOFTWARE-LED MODEL WITH BULLISH REVENUE IMPLICATIONS 📈
Entry: 270 🔥
Target: 291 🚀
JPMorgan has officially upgraded $IBM to Overweight, highlighting a structural pivot from hardware to high-margin software services. Software now accounts for two-thirds of combined profits, signaling a significant improvement in cash conversion and earnings quality.
This transition supports a higher valuation multiple as the firm shifts its core revenue driver toward hybrid cloud and AI infrastructure. The move to a 291 price target reflects increased confidence in their accelerated growth trajectory. Do you view this shift as sufficient to sustain a long-term trend reversal?
Not financial advice. Always manage your risk.
#IBM #StockAnalysis #MarketStructure #InvestmentStrategy
🎯
Entry: 270 🔥
Target: 291 🚀
JPMorgan has officially upgraded $IBM to Overweight, highlighting a structural pivot from hardware to high-margin software services. Software now accounts for two-thirds of combined profits, signaling a significant improvement in cash conversion and earnings quality.
This transition supports a higher valuation multiple as the firm shifts its core revenue driver toward hybrid cloud and AI infrastructure. The move to a 291 price target reflects increased confidence in their accelerated growth trajectory. Do you view this shift as sufficient to sustain a long-term trend reversal?
Not financial advice. Always manage your risk.
#IBM #StockAnalysis #MarketStructure #InvestmentStrategy
🎯
91
Log in to explore more content
Join global crypto users on Binance Square
⚡️ Get latest and useful information about crypto.
💬 Trusted by the world’s largest crypto exchange.
👍 Discover real insights from verified creators.
Email / Phone number
Trending Topics
1
#JobsReportRaisesHikeOdds
226,188 views
1,824 Discussing
2
#CPITestsDecemberRateOutlook
12,504 views
181 Discussing
3
#BitcoinRebounds$75KAsChipsLead
19,541 views
210 Discussing
4
#US Data Center Rules May Constrain AI Expansion
35,838 views
148 Discussing
5
#ARKPlans14ThematicETFsCoveringAIAndTokenizedMarkets
10 views
3 Discussing
6
#WillAnthropicListOnTime
53,084 views
693 Discussing
7
#WillUS-IranTensionsBoostSafe-HavenDemand?
6,495 views
57 Discussing
8
#BitcoinETFsSee$412MNetOutflows
1,991 views
43 Discussing
9
#HKSFCPlansToRestrictCryptoAndExchangeTerms
9,859 views
183 Discussing
10
#TradFiForBeginners
35,906 views
542 Discussing