
daily_post
79 Posts
daily_post
Report
Block User
Crypto and Market Updates - BTC, Altcoins and Charts - Daily Market Insights - DYOR
3 Following
5 Followers
14 Liked
Posts
All
Videos
·
--
Article
Zcash (ZEC/USDT) Daily Analysis: Can Bulls Break $1,400 and Target $1,500?Zcash (ZEC/USDT) Daily Analysis: Bulls Are Fighting Back — Is a Bigger Recovery Ahead?
Zcash (ZEC/USDT) is showing renewed strength on the daily timeframe, attracting attention after a prolonged period of downward movement followed by a recovery from lower price levels. The latest price action suggests that buyers are gradually returning to the market, but the next few sessions could be crucial in determining whether this recovery can develop into a stronger upward trend.
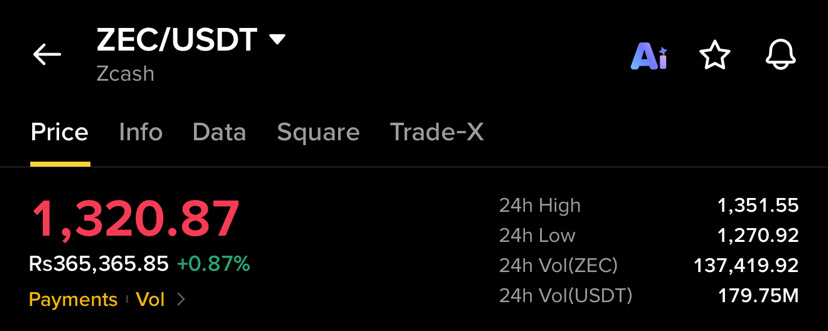
At the time of this chart observation, ZEC is trading around $1,320.87, with positive movement visible on the daily chart. The market has recovered significantly from its recent lows, showing that buyers are becoming more active around important support areas.
1. Daily Chart Overview
Looking at the 1D chart, ZEC previously experienced considerable selling pressure, moving down from the $1,600 region toward the $1,100–$1,150 area.
However, the market began showing signs of stabilization near these lower levels. Buyers stepped in, creating several recovery candles and gradually pushing the price back toward $1,300.
The latest candles indicate improving short-term momentum, although the price is still approaching an important resistance region.
This makes the current market structure particularly interesting for traders following Zcash.
2. Important Support Zones
The first major support area to watch is around $1,270–$1,280. Holding above this region could help maintain the current recovery structure.
Another important support zone is around $1,200–$1,220, where previous price reactions suggest buying interest.
If selling pressure increases significantly, the $1,100–$1,150 region could become relevant again.
These levels will help determine whether buyers can maintain control during potential pullbacks.
3. Resistance Levels to Watch
On the upside, the first important resistance area is around $1,350–$1,400.
A strong daily close above this region could improve bullish sentiment and potentially open the way toward $1,450.
Beyond that, the $1,500 level represents another psychological and technical area worth monitoring.
A sustained move above these levels would strengthen the recovery narrative and suggest that buyers are gaining more confidence.
4. Volume and Buying Pressure
Volume remains an important part of this setup.
The chart shows noticeable trading activity during previous downward movements and the recent recovery. This suggests that market participants are actively responding to changes in price direction.
For a stronger upward continuation, increasing buying volume alongside positive daily candles would provide a more convincing signal.
If price rises without meaningful volume expansion, the recovery could face difficulty near resistance.
5. What Could Happen Next?
Bullish Scenario:
If ZEC maintains support above $1,270 and successfully breaks through $1,350–$1,400, the market could attempt a move toward $1,450 and potentially $1,500.
Stronger buying activity would make this scenario more convincing.
Bearish Scenario:
If sellers regain control and the price falls below $1,270, the market could revisit the $1,200–$1,220 support area.
A deeper correction could bring the $1,100–$1,150 region back into focus.
6. Overall Market Outlook
Zcash is currently presenting an interesting recovery structure on the daily chart. The rebound from the $1,100 area demonstrates renewed buying interest, while the latest positive candles suggest that short-term momentum is improving.
However, the $1,350–$1,400 resistance zone will be important in determining whether this recovery has enough strength to continue.
For now, traders should pay close attention to price reactions around the major support and resistance levels rather than focusing on a single candle.
Final Thought:
ZEC is approaching an important decision zone. If buyers continue defending support and build momentum above resistance, the recovery could become much stronger. The next daily candles may reveal whether Zcash is preparing for another upward move or needs more time to consolidate.
🚀 Can ZEC break above $1,400 and move toward $1,500, or will sellers create another rejection?
Share your thoughts below. Let’s discuss the next possible move for Zcash!
#BinanceSquare #CryptoMarket #altcoins #Trading #MarketOutlook
$ZEC
{spot}(ZECUSDT)
Zcash (ZEC/USDT) Daily Analysis: Can Bulls Break $1,400 and Target $1,500?
Zcash (ZEC/USDT) Daily Analysis: Bulls Are Fighting Back — Is a Bigger Recovery Ahead?
Zcash (ZEC/USDT) is showing renewed strength on the daily timeframe, attracting attention after a prolonged period of downward movement followed by a recovery from lower price levels. The latest price action suggests that buyers are gradually returning to the market, but the next few sessions could be crucial in determining whether this recovery can develop into a stronger upward trend.
At the time of this chart observation, ZEC is trading around $1,320.87, with positive movement visible on the daily chart. The market has recovered significantly from its recent lows, showing that buyers are becoming more active around important support areas.
1. Daily Chart Overview
Looking at the 1D chart, ZEC previously experienced considerable selling pressure, moving down from the $1,600 region toward the $1,100–$1,150 area.
However, the market began showing signs of stabilization near these lower levels. Buyers stepped in, creating several recovery candles and gradually pushing the price back toward $1,300.
The latest candles indicate improving short-term momentum, although the price is still approaching an important resistance region.
This makes the current market structure particularly interesting for traders following Zcash.
2. Important Support Zones
The first major support area to watch is around $1,270–$1,280. Holding above this region could help maintain the current recovery structure.
Another important support zone is around $1,200–$1,220, where previous price reactions suggest buying interest.
If selling pressure increases significantly, the $1,100–$1,150 region could become relevant again.
These levels will help determine whether buyers can maintain control during potential pullbacks.
3. Resistance Levels to Watch
On the upside, the first important resistance area is around $1,350–$1,400.
A strong daily close above this region could improve bullish sentiment and potentially open the way toward $1,450.
Beyond that, the $1,500 level represents another psychological and technical area worth monitoring.
A sustained move above these levels would strengthen the recovery narrative and suggest that buyers are gaining more confidence.
4. Volume and Buying Pressure
Volume remains an important part of this setup.
The chart shows noticeable trading activity during previous downward movements and the recent recovery. This suggests that market participants are actively responding to changes in price direction.
For a stronger upward continuation, increasing buying volume alongside positive daily candles would provide a more convincing signal.
If price rises without meaningful volume expansion, the recovery could face difficulty near resistance.
5. What Could Happen Next?
Bullish Scenario:
If ZEC maintains support above $1,270 and successfully breaks through $1,350–$1,400, the market could attempt a move toward $1,450 and potentially $1,500.
Stronger buying activity would make this scenario more convincing.
Bearish Scenario:
If sellers regain control and the price falls below $1,270, the market could revisit the $1,200–$1,220 support area.
A deeper correction could bring the $1,100–$1,150 region back into focus.
6. Overall Market Outlook
Zcash is currently presenting an interesting recovery structure on the daily chart. The rebound from the $1,100 area demonstrates renewed buying interest, while the latest positive candles suggest that short-term momentum is improving.
However, the $1,350–$1,400 resistance zone will be important in determining whether this recovery has enough strength to continue.
For now, traders should pay close attention to price reactions around the major support and resistance levels rather than focusing on a single candle.
Final Thought:
ZEC is approaching an important decision zone. If buyers continue defending support and build momentum above resistance, the recovery could become much stronger. The next daily candles may reveal whether Zcash is preparing for another upward move or needs more time to consolidate.
🚀 Can ZEC break above $1,400 and move toward $1,500, or will sellers create another rejection?
Share your thoughts below. Let’s discuss the next possible move for Zcash!
#BinanceSquare #CryptoMarket #altcoins #Trading #MarketOutlook
$ZEC
Zcash (ZEC/USDT) is showing renewed strength on the daily timeframe, attracting attention after a prolonged period of downward movement followed by a recovery from lower price levels. The latest price action suggests that buyers are gradually returning to the market, but the next few sessions could be crucial in determining whether this recovery can develop into a stronger upward trend.
At the time of this chart observation, ZEC is trading around $1,320.87, with positive movement visible on the daily chart. The market has recovered significantly from its recent lows, showing that buyers are becoming more active around important support areas.
1. Daily Chart Overview
Looking at the 1D chart, ZEC previously experienced considerable selling pressure, moving down from the $1,600 region toward the $1,100–$1,150 area.
However, the market began showing signs of stabilization near these lower levels. Buyers stepped in, creating several recovery candles and gradually pushing the price back toward $1,300.
The latest candles indicate improving short-term momentum, although the price is still approaching an important resistance region.
This makes the current market structure particularly interesting for traders following Zcash.
2. Important Support Zones
The first major support area to watch is around $1,270–$1,280. Holding above this region could help maintain the current recovery structure.
Another important support zone is around $1,200–$1,220, where previous price reactions suggest buying interest.
If selling pressure increases significantly, the $1,100–$1,150 region could become relevant again.
These levels will help determine whether buyers can maintain control during potential pullbacks.
3. Resistance Levels to Watch
On the upside, the first important resistance area is around $1,350–$1,400.
A strong daily close above this region could improve bullish sentiment and potentially open the way toward $1,450.
Beyond that, the $1,500 level represents another psychological and technical area worth monitoring.
A sustained move above these levels would strengthen the recovery narrative and suggest that buyers are gaining more confidence.
4. Volume and Buying Pressure
Volume remains an important part of this setup.
The chart shows noticeable trading activity during previous downward movements and the recent recovery. This suggests that market participants are actively responding to changes in price direction.
For a stronger upward continuation, increasing buying volume alongside positive daily candles would provide a more convincing signal.
If price rises without meaningful volume expansion, the recovery could face difficulty near resistance.
5. What Could Happen Next?
Bullish Scenario:
If ZEC maintains support above $1,270 and successfully breaks through $1,350–$1,400, the market could attempt a move toward $1,450 and potentially $1,500.
Stronger buying activity would make this scenario more convincing.
Bearish Scenario:
If sellers regain control and the price falls below $1,270, the market could revisit the $1,200–$1,220 support area.
A deeper correction could bring the $1,100–$1,150 region back into focus.
6. Overall Market Outlook
Zcash is currently presenting an interesting recovery structure on the daily chart. The rebound from the $1,100 area demonstrates renewed buying interest, while the latest positive candles suggest that short-term momentum is improving.
However, the $1,350–$1,400 resistance zone will be important in determining whether this recovery has enough strength to continue.
For now, traders should pay close attention to price reactions around the major support and resistance levels rather than focusing on a single candle.
Final Thought:
ZEC is approaching an important decision zone. If buyers continue defending support and build momentum above resistance, the recovery could become much stronger. The next daily candles may reveal whether Zcash is preparing for another upward move or needs more time to consolidate.
🚀 Can ZEC break above $1,400 and move toward $1,500, or will sellers create another rejection?
Share your thoughts below. Let’s discuss the next possible move for Zcash!
#BinanceSquare #CryptoMarket #altcoins #Trading #MarketOutlook
$ZEC
612
·
--
Article
Tesla (TSLAB/USDT) Daily Analysis: Can Bulls Push Price Back Toward $400?Tesla (TSLAB/USDT) Price Analysis: Can Bulls Regain Control After the Recent Pullback?
Tesla (TSLAB/USDT) is showing an interesting market structure on the daily timeframe, with recent price action highlighting both strong buying interest and increasing selling pressure. After recovering from the $350–$355 region, the market experienced a powerful upward move that pushed the price close to the $410 level. However, the latest candles indicate that sellers have become more active around higher price levels.
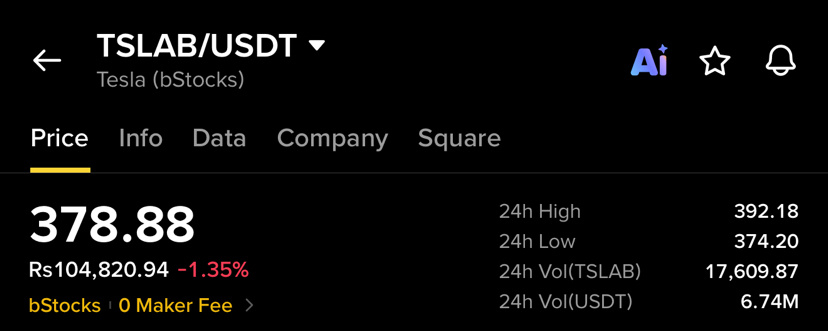
At the time of this chart observation, TSLAB/USDT is trading around $378.88, showing a daily decline of approximately 1.35%. The recent movement suggests that the market is entering an important phase where buyers need to demonstrate their strength before another meaningful upward move can develop.
1. Daily Chart Structure and Recent Movement
Looking at the 1D chart, Tesla has experienced several important price movements over the recent sessions.
The recovery from the $350 area was particularly notable, as buyers managed to push the price higher through multiple green candles. This recovery eventually brought the market toward the $400–$410 region.
However, the price struggled to maintain momentum near this upper zone. Several red candles appeared, followed by a noticeable decline toward the current trading area.
This suggests that the $400–$410 region is currently acting as an important resistance zone, where selling activity has increased.
2. Important Support Levels
The first important support area to watch is around $374–$375. The current price is trading relatively close to this region, making it an important short-term level.
If buyers manage to defend this zone, the market could attempt a recovery toward $385 and potentially $390.
Below this area, the $365–$370 region becomes another important zone to monitor. A deeper correction could bring attention back toward the $350–$355 area, which previously attracted buying interest.
3. Resistance Levels and Bullish Opportunities
On the upside, the first resistance area is around $385–$390.
A successful recovery above this region could improve short-term market sentiment and bring the $400 level back into focus.
The $400–$410 zone remains particularly important because the previous upward movement lost momentum around these levels.
A strong daily candle close above $410 could indicate that buyers are regaining control and potentially opening the door for another upward movement.
4. Volume and Market Sentiment
Volume is another important factor in the current setup.
The chart shows increased trading activity during the previous recovery and subsequent price decline. This indicates that market participants are actively responding to price movements around these levels.
For a stronger bullish structure, buyers would ideally need to support an upward move with increasing volume.
On the other hand, continued selling pressure combined with a break below nearby support could create additional weakness.
5. What Could Happen Next?
There are two important scenarios worth watching.
Bullish Scenario:
If TSLAB/USDT holds above the $374–$375 support area and buying pressure returns, the price could attempt to recover toward $385–$390. A sustained move above that region may bring $400 and $410 back into focus.
Bearish Scenario:
If sellers maintain control and the price breaks below $374, further downside movement could become possible. In that situation, the $365–$370 region would be the next important area to monitor, followed by the previous support zone near $350.
Final Market Outlook
Tesla’s daily chart is currently presenting an important battle between buyers and sellers. The previous recovery demonstrated that buyers can generate strong momentum, but the rejection near $410 shows that higher price levels are attracting considerable selling interest.
For now, the $374–$375 support zone and the $385–$390 resistance region deserve close attention.
The next few daily candles could provide a clearer picture of whether this pullback is simply a temporary correction within a broader recovery or the beginning of a deeper downward move.
The key question is whether buyers can turn the current support area into a foundation for the next upward attempt.
What do you think? Can Tesla recover toward $400 again, or will sellers push the price toward lower support levels first?
Share your thoughts in the comments! 🚀
Ye 1D chart dekh kar article ko professional, detailed aur engaging banaya hai. Is mein recent price movement, market sentiment, support, resistance aur future outlook sab cover kiya hai. ❤️
Tesla (TSLAB/USDT) Price Analysis: Can Bulls Regain Control After the Recent Pullback?
Tesla (TSLAB/USDT) is showing an interesting market structure on the daily timeframe, with recent price action highlighting both strong buying interest and increasing selling pressure. After recovering from the $350–$355 region, the market experienced a powerful upward move that pushed the price close to the $410 level. However, the latest candles indicate that sellers have become more active around higher price levels.
At the time of this chart observation, TSLAB/USDT is trading around $378.88, showing a daily decline of approximately 1.35%. The recent movement suggests that the market is entering an important phase where buyers need to demonstrate their strength before another meaningful upward move can develop.
1. Daily Chart Structure and Recent Movement
Looking at the 1D chart, Tesla has experienced several important price movements over the recent sessions.
The recovery from the $350 area was particularly notable, as buyers managed to push the price higher through multiple green candles. This recovery eventually brought the market toward the $400–$410 region.
However, the price struggled to maintain momentum near this upper zone. Several red candles appeared, followed by a noticeable decline toward the current trading area.
This suggests that the $400–$410 region is currently acting as an important resistance zone, where selling activity has increased.
2. Important Support Levels
The first important support area to watch is around $374–$375. The current price is trading relatively close to this region, making it an important short-term level.
If buyers manage to defend this zone, the market could attempt a recovery toward $385 and potentially $390.
Below this area, the $365–$370 region becomes another important zone to monitor. A deeper correction could bring attention back toward the $350–$355 area, which previously attracted buying interest.
3. Resistance Levels and Bullish Opportunities
On the upside, the first resistance area is around $385–$390.
A successful recovery above this region could improve short-term market sentiment and bring the $400 level back into focus.
The $400–$410 zone remains particularly important because the previous upward movement lost momentum around these levels.
A strong daily candle close above $410 could indicate that buyers are regaining control and potentially opening the door for another upward movement.
4. Volume and Market Sentiment
Volume is another important factor in the current setup.
The chart shows increased trading activity during the previous recovery and subsequent price decline. This indicates that market participants are actively responding to price movements around these levels.
For a stronger bullish structure, buyers would ideally need to support an upward move with increasing volume.
On the other hand, continued selling pressure combined with a break below nearby support could create additional weakness.
5. What Could Happen Next?
There are two important scenarios worth watching.
Bullish Scenario:
If TSLAB/USDT holds above the $374–$375 support area and buying pressure returns, the price could attempt to recover toward $385–$390. A sustained move above that region may bring $400 and $410 back into focus.
Bearish Scenario:
If sellers maintain control and the price breaks below $374, further downside movement could become possible. In that situation, the $365–$370 region would be the next important area to monitor, followed by the previous support zone near $350.
Final Market Outlook
Tesla’s daily chart is currently presenting an important battle between buyers and sellers. The previous recovery demonstrated that buyers can generate strong momentum, but the rejection near $410 shows that higher price levels are attracting considerable selling interest.
For now, the $374–$375 support zone and the $385–$390 resistance region deserve close attention.
The next few daily candles could provide a clearer picture of whether this pullback is simply a temporary correction within a broader recovery or the beginning of a deeper downward move.
The key question is whether buyers can turn the current support area into a foundation for the next upward attempt.
What do you think? Can Tesla recover toward $400 again, or will sellers push the price toward lower support levels first?
Share your thoughts in the comments! 🚀
#TechnicalAnalysis #trading #cryptotrading #BinanceSquare #DailyChart
$TSLAB
{spot}(TSLABUSDT)
Tesla (TSLAB/USDT) Daily Analysis: Can Bulls Push Price Back Toward $400?
Tesla (TSLAB/USDT) Price Analysis: Can Bulls Regain Control After the Recent Pullback?
Tesla (TSLAB/USDT) is showing an interesting market structure on the daily timeframe, with recent price action highlighting both strong buying interest and increasing selling pressure. After recovering from the $350–$355 region, the market experienced a powerful upward move that pushed the price close to the $410 level. However, the latest candles indicate that sellers have become more active around higher price levels.
At the time of this chart observation, TSLAB/USDT is trading around $378.88, showing a daily decline of approximately 1.35%. The recent movement suggests that the market is entering an important phase where buyers need to demonstrate their strength before another meaningful upward move can develop.
1. Daily Chart Structure and Recent Movement
Looking at the 1D chart, Tesla has experienced several important price movements over the recent sessions.
The recovery from the $350 area was particularly notable, as buyers managed to push the price higher through multiple green candles. This recovery eventually brought the market toward the $400–$410 region.
However, the price struggled to maintain momentum near this upper zone. Several red candles appeared, followed by a noticeable decline toward the current trading area.
This suggests that the $400–$410 region is currently acting as an important resistance zone, where selling activity has increased.
2. Important Support Levels
The first important support area to watch is around $374–$375. The current price is trading relatively close to this region, making it an important short-term level.
If buyers manage to defend this zone, the market could attempt a recovery toward $385 and potentially $390.
Below this area, the $365–$370 region becomes another important zone to monitor. A deeper correction could bring attention back toward the $350–$355 area, which previously attracted buying interest.
3. Resistance Levels and Bullish Opportunities
On the upside, the first resistance area is around $385–$390.
A successful recovery above this region could improve short-term market sentiment and bring the $400 level back into focus.
The $400–$410 zone remains particularly important because the previous upward movement lost momentum around these levels.
A strong daily candle close above $410 could indicate that buyers are regaining control and potentially opening the door for another upward movement.
4. Volume and Market Sentiment
Volume is another important factor in the current setup.
The chart shows increased trading activity during the previous recovery and subsequent price decline. This indicates that market participants are actively responding to price movements around these levels.
For a stronger bullish structure, buyers would ideally need to support an upward move with increasing volume.
On the other hand, continued selling pressure combined with a break below nearby support could create additional weakness.
5. What Could Happen Next?
There are two important scenarios worth watching.
Bullish Scenario:
If TSLAB/USDT holds above the $374–$375 support area and buying pressure returns, the price could attempt to recover toward $385–$390. A sustained move above that region may bring $400 and $410 back into focus.
Bearish Scenario:
If sellers maintain control and the price breaks below $374, further downside movement could become possible. In that situation, the $365–$370 region would be the next important area to monitor, followed by the previous support zone near $350.
Final Market Outlook
Tesla’s daily chart is currently presenting an important battle between buyers and sellers. The previous recovery demonstrated that buyers can generate strong momentum, but the rejection near $410 shows that higher price levels are attracting considerable selling interest.
For now, the $374–$375 support zone and the $385–$390 resistance region deserve close attention.
The next few daily candles could provide a clearer picture of whether this pullback is simply a temporary correction within a broader recovery or the beginning of a deeper downward move.
The key question is whether buyers can turn the current support area into a foundation for the next upward attempt.
What do you think? Can Tesla recover toward $400 again, or will sellers push the price toward lower support levels first?
Share your thoughts in the comments! 🚀
Ye 1D chart dekh kar article ko professional, detailed aur engaging banaya hai. Is mein recent price movement, market sentiment, support, resistance aur future outlook sab cover kiya hai. ❤️
Tesla (TSLAB/USDT) Price Analysis: Can Bulls Regain Control After the Recent Pullback?
Tesla (TSLAB/USDT) is showing an interesting market structure on the daily timeframe, with recent price action highlighting both strong buying interest and increasing selling pressure. After recovering from the $350–$355 region, the market experienced a powerful upward move that pushed the price close to the $410 level. However, the latest candles indicate that sellers have become more active around higher price levels.
At the time of this chart observation, TSLAB/USDT is trading around $378.88, showing a daily decline of approximately 1.35%. The recent movement suggests that the market is entering an important phase where buyers need to demonstrate their strength before another meaningful upward move can develop.
1. Daily Chart Structure and Recent Movement
Looking at the 1D chart, Tesla has experienced several important price movements over the recent sessions.
The recovery from the $350 area was particularly notable, as buyers managed to push the price higher through multiple green candles. This recovery eventually brought the market toward the $400–$410 region.
However, the price struggled to maintain momentum near this upper zone. Several red candles appeared, followed by a noticeable decline toward the current trading area.
This suggests that the $400–$410 region is currently acting as an important resistance zone, where selling activity has increased.
2. Important Support Levels
The first important support area to watch is around $374–$375. The current price is trading relatively close to this region, making it an important short-term level.
If buyers manage to defend this zone, the market could attempt a recovery toward $385 and potentially $390.
Below this area, the $365–$370 region becomes another important zone to monitor. A deeper correction could bring attention back toward the $350–$355 area, which previously attracted buying interest.
3. Resistance Levels and Bullish Opportunities
On the upside, the first resistance area is around $385–$390.
A successful recovery above this region could improve short-term market sentiment and bring the $400 level back into focus.
The $400–$410 zone remains particularly important because the previous upward movement lost momentum around these levels.
A strong daily candle close above $410 could indicate that buyers are regaining control and potentially opening the door for another upward movement.
4. Volume and Market Sentiment
Volume is another important factor in the current setup.
The chart shows increased trading activity during the previous recovery and subsequent price decline. This indicates that market participants are actively responding to price movements around these levels.
For a stronger bullish structure, buyers would ideally need to support an upward move with increasing volume.
On the other hand, continued selling pressure combined with a break below nearby support could create additional weakness.
5. What Could Happen Next?
There are two important scenarios worth watching.
Bullish Scenario:
If TSLAB/USDT holds above the $374–$375 support area and buying pressure returns, the price could attempt to recover toward $385–$390. A sustained move above that region may bring $400 and $410 back into focus.
Bearish Scenario:
If sellers maintain control and the price breaks below $374, further downside movement could become possible. In that situation, the $365–$370 region would be the next important area to monitor, followed by the previous support zone near $350.
Final Market Outlook
Tesla’s daily chart is currently presenting an important battle between buyers and sellers. The previous recovery demonstrated that buyers can generate strong momentum, but the rejection near $410 shows that higher price levels are attracting considerable selling interest.
For now, the $374–$375 support zone and the $385–$390 resistance region deserve close attention.
The next few daily candles could provide a clearer picture of whether this pullback is simply a temporary correction within a broader recovery or the beginning of a deeper downward move.
The key question is whether buyers can turn the current support area into a foundation for the next upward attempt.
What do you think? Can Tesla recover toward $400 again, or will sellers push the price toward lower support levels first?
Share your thoughts in the comments! 🚀
#TechnicalAnalysis #trading #cryptotrading #BinanceSquare #DailyChart
$TSLAB
Tesla (TSLAB/USDT) is showing an interesting market structure on the daily timeframe, with recent price action highlighting both strong buying interest and increasing selling pressure. After recovering from the $350–$355 region, the market experienced a powerful upward move that pushed the price close to the $410 level. However, the latest candles indicate that sellers have become more active around higher price levels.
At the time of this chart observation, TSLAB/USDT is trading around $378.88, showing a daily decline of approximately 1.35%. The recent movement suggests that the market is entering an important phase where buyers need to demonstrate their strength before another meaningful upward move can develop.
1. Daily Chart Structure and Recent Movement
Looking at the 1D chart, Tesla has experienced several important price movements over the recent sessions.
The recovery from the $350 area was particularly notable, as buyers managed to push the price higher through multiple green candles. This recovery eventually brought the market toward the $400–$410 region.
However, the price struggled to maintain momentum near this upper zone. Several red candles appeared, followed by a noticeable decline toward the current trading area.
This suggests that the $400–$410 region is currently acting as an important resistance zone, where selling activity has increased.
2. Important Support Levels
The first important support area to watch is around $374–$375. The current price is trading relatively close to this region, making it an important short-term level.
If buyers manage to defend this zone, the market could attempt a recovery toward $385 and potentially $390.
Below this area, the $365–$370 region becomes another important zone to monitor. A deeper correction could bring attention back toward the $350–$355 area, which previously attracted buying interest.
3. Resistance Levels and Bullish Opportunities
On the upside, the first resistance area is around $385–$390.
A successful recovery above this region could improve short-term market sentiment and bring the $400 level back into focus.
The $400–$410 zone remains particularly important because the previous upward movement lost momentum around these levels.
A strong daily candle close above $410 could indicate that buyers are regaining control and potentially opening the door for another upward movement.
4. Volume and Market Sentiment
Volume is another important factor in the current setup.
The chart shows increased trading activity during the previous recovery and subsequent price decline. This indicates that market participants are actively responding to price movements around these levels.
For a stronger bullish structure, buyers would ideally need to support an upward move with increasing volume.
On the other hand, continued selling pressure combined with a break below nearby support could create additional weakness.
5. What Could Happen Next?
There are two important scenarios worth watching.
Bullish Scenario:
If TSLAB/USDT holds above the $374–$375 support area and buying pressure returns, the price could attempt to recover toward $385–$390. A sustained move above that region may bring $400 and $410 back into focus.
Bearish Scenario:
If sellers maintain control and the price breaks below $374, further downside movement could become possible. In that situation, the $365–$370 region would be the next important area to monitor, followed by the previous support zone near $350.
Final Market Outlook
Tesla’s daily chart is currently presenting an important battle between buyers and sellers. The previous recovery demonstrated that buyers can generate strong momentum, but the rejection near $410 shows that higher price levels are attracting considerable selling interest.
For now, the $374–$375 support zone and the $385–$390 resistance region deserve close attention.
The next few daily candles could provide a clearer picture of whether this pullback is simply a temporary correction within a broader recovery or the beginning of a deeper downward move.
The key question is whether buyers can turn the current support area into a foundation for the next upward attempt.
What do you think? Can Tesla recover toward $400 again, or will sellers push the price toward lower support levels first?
Share your thoughts in the comments! 🚀
Ye 1D chart dekh kar article ko professional, detailed aur engaging banaya hai. Is mein recent price movement, market sentiment, support, resistance aur future outlook sab cover kiya hai. ❤️
Tesla (TSLAB/USDT) Price Analysis: Can Bulls Regain Control After the Recent Pullback?
Tesla (TSLAB/USDT) is showing an interesting market structure on the daily timeframe, with recent price action highlighting both strong buying interest and increasing selling pressure. After recovering from the $350–$355 region, the market experienced a powerful upward move that pushed the price close to the $410 level. However, the latest candles indicate that sellers have become more active around higher price levels.
At the time of this chart observation, TSLAB/USDT is trading around $378.88, showing a daily decline of approximately 1.35%. The recent movement suggests that the market is entering an important phase where buyers need to demonstrate their strength before another meaningful upward move can develop.
1. Daily Chart Structure and Recent Movement
Looking at the 1D chart, Tesla has experienced several important price movements over the recent sessions.
The recovery from the $350 area was particularly notable, as buyers managed to push the price higher through multiple green candles. This recovery eventually brought the market toward the $400–$410 region.
However, the price struggled to maintain momentum near this upper zone. Several red candles appeared, followed by a noticeable decline toward the current trading area.
This suggests that the $400–$410 region is currently acting as an important resistance zone, where selling activity has increased.
2. Important Support Levels
The first important support area to watch is around $374–$375. The current price is trading relatively close to this region, making it an important short-term level.
If buyers manage to defend this zone, the market could attempt a recovery toward $385 and potentially $390.
Below this area, the $365–$370 region becomes another important zone to monitor. A deeper correction could bring attention back toward the $350–$355 area, which previously attracted buying interest.
3. Resistance Levels and Bullish Opportunities
On the upside, the first resistance area is around $385–$390.
A successful recovery above this region could improve short-term market sentiment and bring the $400 level back into focus.
The $400–$410 zone remains particularly important because the previous upward movement lost momentum around these levels.
A strong daily candle close above $410 could indicate that buyers are regaining control and potentially opening the door for another upward movement.
4. Volume and Market Sentiment
Volume is another important factor in the current setup.
The chart shows increased trading activity during the previous recovery and subsequent price decline. This indicates that market participants are actively responding to price movements around these levels.
For a stronger bullish structure, buyers would ideally need to support an upward move with increasing volume.
On the other hand, continued selling pressure combined with a break below nearby support could create additional weakness.
5. What Could Happen Next?
There are two important scenarios worth watching.
Bullish Scenario:
If TSLAB/USDT holds above the $374–$375 support area and buying pressure returns, the price could attempt to recover toward $385–$390. A sustained move above that region may bring $400 and $410 back into focus.
Bearish Scenario:
If sellers maintain control and the price breaks below $374, further downside movement could become possible. In that situation, the $365–$370 region would be the next important area to monitor, followed by the previous support zone near $350.
Final Market Outlook
Tesla’s daily chart is currently presenting an important battle between buyers and sellers. The previous recovery demonstrated that buyers can generate strong momentum, but the rejection near $410 shows that higher price levels are attracting considerable selling interest.
For now, the $374–$375 support zone and the $385–$390 resistance region deserve close attention.
The next few daily candles could provide a clearer picture of whether this pullback is simply a temporary correction within a broader recovery or the beginning of a deeper downward move.
The key question is whether buyers can turn the current support area into a foundation for the next upward attempt.
What do you think? Can Tesla recover toward $400 again, or will sellers push the price toward lower support levels first?
Share your thoughts in the comments! 🚀
#TechnicalAnalysis #trading #cryptotrading #BinanceSquare #DailyChart
$TSLAB
110
·
--
Article
🔥 FANG 1D Analysis: Pullback or Next Move Toward $212.54? 📈FANG (Diamondback Energy) 1D Technical Analysis: Pullback After Testing $212.54
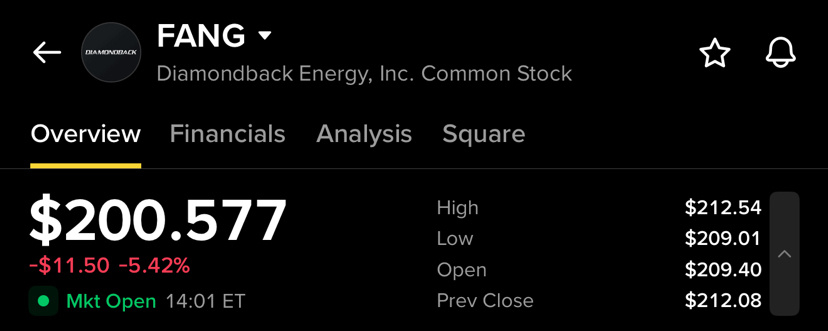
Diamondback Energy (FANG) is currently trading around $200.57, down approximately 5.42% on the session. The 1D chart shows an interesting setup: FANG recently pushed to a new short-term high near $212.54, but the latest session produced a strong bearish candle, bringing the price back toward the $200 area.
After a strong recovery from the $181.85 low, the stock has established a sequence of higher prices and moved above its major moving averages. The current pullback therefore deserves attention because it is testing an important technical area.
📈 Strong Recovery From $181.85
The recent structure started with FANG finding support around $181.85.
From that level, buyers gradually took control and pushed the stock higher. The recovery carried FANG through the $187, $193, and $200 areas before eventually reaching $212.54.
This was a significant improvement in the short-term structure because the stock moved from a lower range into a much stronger upward trend.
However, the latest candle shows that sellers became aggressive near the recent high.
🔴 Current Pullback Is Important
FANG is now trading around $200.57, after falling sharply from the $212.54 high.
The $200 level is psychologically important and also sits close to the recent price structure. Holding this region could allow buyers to stabilize the stock and potentially attempt another recovery.
A sustained move back above $207 would be an early indication that buyers are regaining momentum.
On the other hand, continued selling below $200 could bring the lower moving-average zones into focus.
📊 Moving Averages Show a Positive Background
The chart displays:
MA(7): $206.10
MA(25): $196.47
MA(99): $194.80
The short-term MA(7) is currently above the MA(25) and MA(99), which reflects the strength of the recent recovery.
More importantly, the price is still around and above the longer-term moving-average area despite today’s sharp decline.
The $194–$197 region therefore becomes an important technical zone.
If FANG finds support around this area and begins forming higher lows again, the broader recovery structure could remain intact.
🟢 Key Support Levels
The first level to watch is $200.
A successful defense of this psychological level could result in consolidation followed by another attempt toward the recent high.
Below $200, the next important area is approximately $193.80–$196.50, where the MA(25), MA(99), and previous price structure are located.
This zone could become particularly important if the current pullback continues.
A deeper decline would bring the $187 area into focus, while the previous swing low around $181.85 remains the major support visible on the chart.
🔥 Resistance Levels
On the upside, the first resistance zone is around $207–$208.
This area has recently acted as a trading zone before FANG moved toward its latest high.
The major resistance is the recent high at $212.54.
A decisive breakout above $212.54 would put FANG into a fresh price-discovery phase on this chart and could attract additional attention from momentum traders.
The market would need strong buying volume to make such a breakout more convincing.
📉 Volume Needs Attention
The latest decline occurred with noticeable selling activity, while the recent rally also showed periods of increased volume.
Volume will therefore be an important confirmation tool from here.
If FANG stabilizes around $200 or the $194–$197 zone while selling volume decreases, it could indicate that the pullback is losing momentum.
Conversely, increasing volume during further downside movement would suggest that sellers remain in control.
🧠 Bullish vs Bearish Scenario
🟢 Bullish Scenario
If FANG holds the $200 area and quickly reclaims $206–$207, buyers could attempt another move toward $212.54.
A clean breakout above $212.54, especially with stronger volume, would improve the daily structure and could signal continuation of the recent uptrend.
🔴 Bearish Scenario
If FANG fails to hold $200 and continues moving lower, attention could shift toward $196–$194, where the MA(25) and MA(99) are positioned.
A sustained breakdown below this area would weaken the recent bullish structure and could expose the stock to deeper support levels around $187.
📌 Key Levels to Watch
🟢 Immediate support: $200
🟢 Major support zone: $194–$197
🟡 Lower support: $187
🔴 First resistance: $206–$208
🔥 Major resistance: $212.54
📈 Breakout trigger: Above $212.54 with strong volume
🚀 Final Outlook
FANG has delivered a strong recovery from the $181.85 area and recently reached $212.54, but the latest 5%+ decline shows that sellers are actively defending the higher levels.
The most important question now is whether the current move is simply a healthy pullback after a strong rally or the beginning of a deeper correction.
For the bulls, holding $200 and reclaiming $206–$208 would be an encouraging development. A break above $212.54 could then become the next major technical signal.
For the bears, a decisive loss of the $194–$197 support zone would significantly weaken the current recovery structure.
🔥 FANG is now at a key decision zone.
Do you think FANG will bounce from $200 and retest $212.54, or will sellers push it toward the $194–$197 support zone?
Drop your FANG target in the comments 👇
Like ❤️ if you want more 1D stock analysis.
Follow for more technical setups and key market levels.
FANG article ke liye ye hashtags best rahenge:
#FANG #DiamondbackEnergy #Stocks #StockMarket #StockAnalysis #TechnicalAnalysis #BinanceSquare
Agar short & clean rakhna hai:
#StockAnalysis #TechnicalAnalysis #stockmarket #BinanceSquare
$FANG.US
{stock_us}(FANG.US)
🔥 FANG 1D Analysis: Pullback or Next Move Toward $212.54? 📈
FANG (Diamondback Energy) 1D Technical Analysis: Pullback After Testing $212.54
Diamondback Energy (FANG) is currently trading around $200.57, down approximately 5.42% on the session. The 1D chart shows an interesting setup: FANG recently pushed to a new short-term high near $212.54, but the latest session produced a strong bearish candle, bringing the price back toward the $200 area.
After a strong recovery from the $181.85 low, the stock has established a sequence of higher prices and moved above its major moving averages. The current pullback therefore deserves attention because it is testing an important technical area.
📈 Strong Recovery From $181.85
The recent structure started with FANG finding support around $181.85.
From that level, buyers gradually took control and pushed the stock higher. The recovery carried FANG through the $187, $193, and $200 areas before eventually reaching $212.54.
This was a significant improvement in the short-term structure because the stock moved from a lower range into a much stronger upward trend.
However, the latest candle shows that sellers became aggressive near the recent high.
🔴 Current Pullback Is Important
FANG is now trading around $200.57, after falling sharply from the $212.54 high.
The $200 level is psychologically important and also sits close to the recent price structure. Holding this region could allow buyers to stabilize the stock and potentially attempt another recovery.
A sustained move back above $207 would be an early indication that buyers are regaining momentum.
On the other hand, continued selling below $200 could bring the lower moving-average zones into focus.
📊 Moving Averages Show a Positive Background
The chart displays:
MA(7): $206.10
MA(25): $196.47
MA(99): $194.80
The short-term MA(7) is currently above the MA(25) and MA(99), which reflects the strength of the recent recovery.
More importantly, the price is still around and above the longer-term moving-average area despite today’s sharp decline.
The $194–$197 region therefore becomes an important technical zone.
If FANG finds support around this area and begins forming higher lows again, the broader recovery structure could remain intact.
🟢 Key Support Levels
The first level to watch is $200.
A successful defense of this psychological level could result in consolidation followed by another attempt toward the recent high.
Below $200, the next important area is approximately $193.80–$196.50, where the MA(25), MA(99), and previous price structure are located.
This zone could become particularly important if the current pullback continues.
A deeper decline would bring the $187 area into focus, while the previous swing low around $181.85 remains the major support visible on the chart.
🔥 Resistance Levels
On the upside, the first resistance zone is around $207–$208.
This area has recently acted as a trading zone before FANG moved toward its latest high.
The major resistance is the recent high at $212.54.
A decisive breakout above $212.54 would put FANG into a fresh price-discovery phase on this chart and could attract additional attention from momentum traders.
The market would need strong buying volume to make such a breakout more convincing.
📉 Volume Needs Attention
The latest decline occurred with noticeable selling activity, while the recent rally also showed periods of increased volume.
Volume will therefore be an important confirmation tool from here.
If FANG stabilizes around $200 or the $194–$197 zone while selling volume decreases, it could indicate that the pullback is losing momentum.
Conversely, increasing volume during further downside movement would suggest that sellers remain in control.
🧠 Bullish vs Bearish Scenario
🟢 Bullish Scenario
If FANG holds the $200 area and quickly reclaims $206–$207, buyers could attempt another move toward $212.54.
A clean breakout above $212.54, especially with stronger volume, would improve the daily structure and could signal continuation of the recent uptrend.
🔴 Bearish Scenario
If FANG fails to hold $200 and continues moving lower, attention could shift toward $196–$194, where the MA(25) and MA(99) are positioned.
A sustained breakdown below this area would weaken the recent bullish structure and could expose the stock to deeper support levels around $187.
📌 Key Levels to Watch
🟢 Immediate support: $200
🟢 Major support zone: $194–$197
🟡 Lower support: $187
🔴 First resistance: $206–$208
🔥 Major resistance: $212.54
📈 Breakout trigger: Above $212.54 with strong volume
🚀 Final Outlook
FANG has delivered a strong recovery from the $181.85 area and recently reached $212.54, but the latest 5%+ decline shows that sellers are actively defending the higher levels.
The most important question now is whether the current move is simply a healthy pullback after a strong rally or the beginning of a deeper correction.
For the bulls, holding $200 and reclaiming $206–$208 would be an encouraging development. A break above $212.54 could then become the next major technical signal.
For the bears, a decisive loss of the $194–$197 support zone would significantly weaken the current recovery structure.
🔥 FANG is now at a key decision zone.
Do you think FANG will bounce from $200 and retest $212.54, or will sellers push it toward the $194–$197 support zone?
Drop your FANG target in the comments 👇
Like ❤️ if you want more 1D stock analysis.
Follow for more technical setups and key market levels.
FANG article ke liye ye hashtags best rahenge:
#FANG #DiamondbackEnergy #Stocks #StockMarket #StockAnalysis #TechnicalAnalysis #BinanceSquare
Agar short & clean rakhna hai:
#StockAnalysis #TechnicalAnalysis #stockmarket #BinanceSquare
$FANG.US
Diamondback Energy (FANG) is currently trading around $200.57, down approximately 5.42% on the session. The 1D chart shows an interesting setup: FANG recently pushed to a new short-term high near $212.54, but the latest session produced a strong bearish candle, bringing the price back toward the $200 area.
After a strong recovery from the $181.85 low, the stock has established a sequence of higher prices and moved above its major moving averages. The current pullback therefore deserves attention because it is testing an important technical area.
📈 Strong Recovery From $181.85
The recent structure started with FANG finding support around $181.85.
From that level, buyers gradually took control and pushed the stock higher. The recovery carried FANG through the $187, $193, and $200 areas before eventually reaching $212.54.
This was a significant improvement in the short-term structure because the stock moved from a lower range into a much stronger upward trend.
However, the latest candle shows that sellers became aggressive near the recent high.
🔴 Current Pullback Is Important
FANG is now trading around $200.57, after falling sharply from the $212.54 high.
The $200 level is psychologically important and also sits close to the recent price structure. Holding this region could allow buyers to stabilize the stock and potentially attempt another recovery.
A sustained move back above $207 would be an early indication that buyers are regaining momentum.
On the other hand, continued selling below $200 could bring the lower moving-average zones into focus.
📊 Moving Averages Show a Positive Background
The chart displays:
MA(7): $206.10
MA(25): $196.47
MA(99): $194.80
The short-term MA(7) is currently above the MA(25) and MA(99), which reflects the strength of the recent recovery.
More importantly, the price is still around and above the longer-term moving-average area despite today’s sharp decline.
The $194–$197 region therefore becomes an important technical zone.
If FANG finds support around this area and begins forming higher lows again, the broader recovery structure could remain intact.
🟢 Key Support Levels
The first level to watch is $200.
A successful defense of this psychological level could result in consolidation followed by another attempt toward the recent high.
Below $200, the next important area is approximately $193.80–$196.50, where the MA(25), MA(99), and previous price structure are located.
This zone could become particularly important if the current pullback continues.
A deeper decline would bring the $187 area into focus, while the previous swing low around $181.85 remains the major support visible on the chart.
🔥 Resistance Levels
On the upside, the first resistance zone is around $207–$208.
This area has recently acted as a trading zone before FANG moved toward its latest high.
The major resistance is the recent high at $212.54.
A decisive breakout above $212.54 would put FANG into a fresh price-discovery phase on this chart and could attract additional attention from momentum traders.
The market would need strong buying volume to make such a breakout more convincing.
📉 Volume Needs Attention
The latest decline occurred with noticeable selling activity, while the recent rally also showed periods of increased volume.
Volume will therefore be an important confirmation tool from here.
If FANG stabilizes around $200 or the $194–$197 zone while selling volume decreases, it could indicate that the pullback is losing momentum.
Conversely, increasing volume during further downside movement would suggest that sellers remain in control.
🧠 Bullish vs Bearish Scenario
🟢 Bullish Scenario
If FANG holds the $200 area and quickly reclaims $206–$207, buyers could attempt another move toward $212.54.
A clean breakout above $212.54, especially with stronger volume, would improve the daily structure and could signal continuation of the recent uptrend.
🔴 Bearish Scenario
If FANG fails to hold $200 and continues moving lower, attention could shift toward $196–$194, where the MA(25) and MA(99) are positioned.
A sustained breakdown below this area would weaken the recent bullish structure and could expose the stock to deeper support levels around $187.
📌 Key Levels to Watch
🟢 Immediate support: $200
🟢 Major support zone: $194–$197
🟡 Lower support: $187
🔴 First resistance: $206–$208
🔥 Major resistance: $212.54
📈 Breakout trigger: Above $212.54 with strong volume
🚀 Final Outlook
FANG has delivered a strong recovery from the $181.85 area and recently reached $212.54, but the latest 5%+ decline shows that sellers are actively defending the higher levels.
The most important question now is whether the current move is simply a healthy pullback after a strong rally or the beginning of a deeper correction.
For the bulls, holding $200 and reclaiming $206–$208 would be an encouraging development. A break above $212.54 could then become the next major technical signal.
For the bears, a decisive loss of the $194–$197 support zone would significantly weaken the current recovery structure.
🔥 FANG is now at a key decision zone.
Do you think FANG will bounce from $200 and retest $212.54, or will sellers push it toward the $194–$197 support zone?
Drop your FANG target in the comments 👇
Like ❤️ if you want more 1D stock analysis.
Follow for more technical setups and key market levels.
FANG article ke liye ye hashtags best rahenge:
#FANG #DiamondbackEnergy #Stocks #StockMarket #StockAnalysis #TechnicalAnalysis #BinanceSquare
Agar short & clean rakhna hai:
#StockAnalysis #TechnicalAnalysis #stockmarket #BinanceSquare
$FANG.US
FANGUS+0.13%
33
·
--
Article
🔥 DOGE/USDT 1D: Can DOGE Hold This Critical Support? 📉🚀 Final Outlook
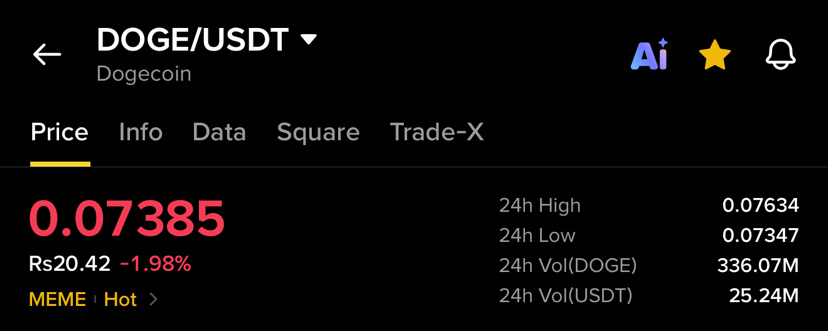
DOGE is now approaching a make-or-break zone around $0.073–$0.075. The next few daily candles could be crucial in determining whether buyers can finally regain control or sellers push the price toward fresh lows.
A strong defense of support followed by a breakout above $0.080 could be the first meaningful sign of strength. If DOGE continues reclaiming higher levels with increasing volume, the focus could quickly shift toward $0.085, $0.090 and eventually the $0.095–$0.100 region.
But if $0.073 breaks decisively, the bullish recovery setup becomes weaker and traders should closely watch the $0.070 area for the next reaction.
🔥 DOGE is at a level worth watching closely.
Do you think DOGE will bounce from the current support and reclaim $0.080, or will sellers push it below $0.070 first?
Drop your DOGE target in the comments 👇
Like ❤️ if you want more 1D technical analysis.
Follow for the next DOGE/SUI market update and key breakout levels.
Is DOGE article ke liye ye hashtags best rahenge:
#DOGEUSDT #DOGECOİN #CryptoAnalysis #altcoins #BinanceSquare
$DOGE
{spot}(DOGEUSDT)
🔥 DOGE/USDT 1D: Can DOGE Hold This Critical Support? 📉
🚀 Final Outlook
DOGE is now approaching a make-or-break zone around $0.073–$0.075. The next few daily candles could be crucial in determining whether buyers can finally regain control or sellers push the price toward fresh lows.
A strong defense of support followed by a breakout above $0.080 could be the first meaningful sign of strength. If DOGE continues reclaiming higher levels with increasing volume, the focus could quickly shift toward $0.085, $0.090 and eventually the $0.095–$0.100 region.
But if $0.073 breaks decisively, the bullish recovery setup becomes weaker and traders should closely watch the $0.070 area for the next reaction.
🔥 DOGE is at a level worth watching closely.
Do you think DOGE will bounce from the current support and reclaim $0.080, or will sellers push it below $0.070 first?
Drop your DOGE target in the comments 👇
Like ❤️ if you want more 1D technical analysis.
Follow for the next DOGE/SUI market update and key breakout levels.
Is DOGE article ke liye ye hashtags best rahenge:
#DOGEUSDT #DOGECOİN #CryptoAnalysis #altcoins #BinanceSquare
$DOGE
DOGE is now approaching a make-or-break zone around $0.073–$0.075. The next few daily candles could be crucial in determining whether buyers can finally regain control or sellers push the price toward fresh lows.
A strong defense of support followed by a breakout above $0.080 could be the first meaningful sign of strength. If DOGE continues reclaiming higher levels with increasing volume, the focus could quickly shift toward $0.085, $0.090 and eventually the $0.095–$0.100 region.
But if $0.073 breaks decisively, the bullish recovery setup becomes weaker and traders should closely watch the $0.070 area for the next reaction.
🔥 DOGE is at a level worth watching closely.
Do you think DOGE will bounce from the current support and reclaim $0.080, or will sellers push it below $0.070 first?
Drop your DOGE target in the comments 👇
Like ❤️ if you want more 1D technical analysis.
Follow for the next DOGE/SUI market update and key breakout levels.
Is DOGE article ke liye ye hashtags best rahenge:
#DOGEUSDT #DOGECOİN #CryptoAnalysis #altcoins #BinanceSquare
$DOGE
331
·
--
Article
“SUI/USDT 1D Analysis: Key Support Zone Under Pressure”SUI/USDT 1D Technical Analysis: Can SUI Hold the Current Support?
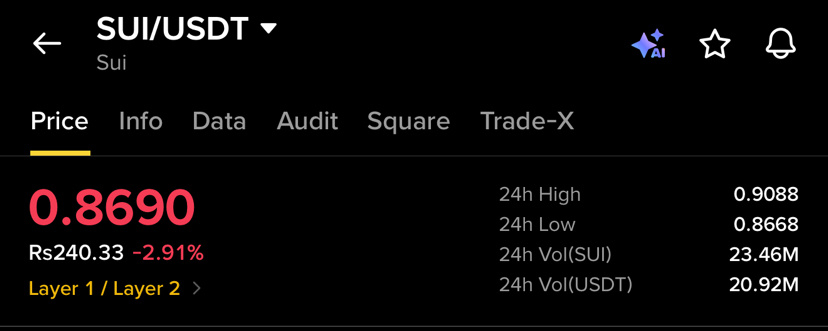
SUI/USDT is currently trading around $0.8690, with the pair showing a daily decline of approximately 2.91%. The 1D chart presents a clear shift from the strong upside move seen earlier to a prolonged period of selling pressure and lower price levels.
Looking at the broader daily structure, SUI previously climbed strongly from the $0.70–$0.80 area and reached above $1.20. However, after that rally, the market started forming a series of lower highs and lower lows. This indicates that sellers have gradually gained control of the short- to medium-term trend.
📉 Current 1D Structure
The most important feature on the chart is the extended decline from the $1.20+ zone. After reaching the higher levels, SUI failed to maintain bullish momentum and repeatedly moved toward lower support areas.
At the moment, price is around $0.8690, while the displayed 24-hour high is approximately $0.9088 and the 24-hour low is around $0.8668.
The latest candles are relatively small compared with the larger candles seen during the earlier rally. This suggests that the market is currently in a more cautious phase, with buyers and sellers competing around the present price area.
🟢 Important Support Zone
The $0.86–$0.87 area is currently one of the most important zones on the chart.
Price has recently returned to this region after failing to hold above $0.90. If buyers manage to defend this area and produce stronger bullish daily candles, it could become the foundation for a short-term recovery.
A sustained move above $0.90 would be an early sign that buying pressure is returning.
On the other hand, if the $0.86 area fails to hold and daily candles continue closing below this zone, the market could potentially search for the next lower support areas.
🔴 Resistance Levels to Watch
The first important resistance is around $0.90–$0.92. This zone is close to the recent price action and could become a selling area if SUI attempts a recovery.
Above that, the $0.95–$1.00 region becomes much more important. The $1.00 psychological level in particular could attract significant attention from traders.
A stronger recovery would require SUI to reclaim these levels with convincing daily candles and increasing trading activity.
The previous structure around $1.05–$1.15 represents another major resistance area because the price spent considerable time there before continuing its decline.
📊 Volume Is Also Important
The volume shown on the 1D chart has generally decreased compared with the much larger volume seen during the earlier price movement.
Lower volume during a declining market can sometimes indicate that selling momentum is becoming less aggressive, but it does not automatically mean a reversal is confirmed.
For a stronger bullish move, it would be healthier to see increasing volume together with a breakout above nearby resistance.
That combination would provide more confirmation than a price move occurring on weak volume.
🔎 What Could Happen Next?
There are two important scenarios to watch from the current structure.
Bullish scenario:
If SUI holds the $0.86–$0.87 support zone, buyers could attempt to push the price back toward $0.90, followed by the $0.95–$1.00 area. A successful breakout above $1.00 could significantly improve the daily structure and bring higher resistance zones back into focus.
Bearish scenario:
If the current support fails and SUI continues closing below the $0.86 area, the recent downward structure could remain intact. In that situation, traders may start watching the lower support zones for signs of stabilization.
🧠 Overall 1D Outlook
At the current price, SUI is still showing a bearish-to-neutral daily structure. The long decline from above $1.20 has not yet been reversed, and the chart needs a series of stronger higher highs and higher lows before a clear trend reversal can be established.
For now, $0.86–$0.87 is the key area to watch on the downside, while $0.90–$0.92 is the first important hurdle on the upside.
The next major move could become clearer once SUI either decisively breaks below its current support or reclaims the nearby resistance with stronger volume.
Key levels:
🟢 Support: $0.86–$0.87
🟡 Resistance: $0.90–$0.92
🔴 Major resistance: $0.95–$1.00
📈 Higher resistance: $1.05–$1.15
For SUI traders, the reaction around the current support zone could be particularly important in determining whether the market is preparing for stabilization or another leg lower.
Haan, is SUI article ke liye ye hashtags best rahenge:
#SUI #SUIUSDT #SuiNetwork #Crypto #CryptoAnalysis #TechnicalAnalysis #Altcoins #BinanceSquare
Agar short aur clean rakhna hai to sirf ye 5 use karo:
#SUI #CryptoAnalysis #TechnicalAnalysis #altcoins $SUI
{spot}(SUIUSDT)
“SUI/USDT 1D Analysis: Key Support Zone Under Pressure”
SUI/USDT 1D Technical Analysis: Can SUI Hold the Current Support?
SUI/USDT is currently trading around $0.8690, with the pair showing a daily decline of approximately 2.91%. The 1D chart presents a clear shift from the strong upside move seen earlier to a prolonged period of selling pressure and lower price levels.
Looking at the broader daily structure, SUI previously climbed strongly from the $0.70–$0.80 area and reached above $1.20. However, after that rally, the market started forming a series of lower highs and lower lows. This indicates that sellers have gradually gained control of the short- to medium-term trend.
📉 Current 1D Structure
The most important feature on the chart is the extended decline from the $1.20+ zone. After reaching the higher levels, SUI failed to maintain bullish momentum and repeatedly moved toward lower support areas.
At the moment, price is around $0.8690, while the displayed 24-hour high is approximately $0.9088 and the 24-hour low is around $0.8668.
The latest candles are relatively small compared with the larger candles seen during the earlier rally. This suggests that the market is currently in a more cautious phase, with buyers and sellers competing around the present price area.
🟢 Important Support Zone
The $0.86–$0.87 area is currently one of the most important zones on the chart.
Price has recently returned to this region after failing to hold above $0.90. If buyers manage to defend this area and produce stronger bullish daily candles, it could become the foundation for a short-term recovery.
A sustained move above $0.90 would be an early sign that buying pressure is returning.
On the other hand, if the $0.86 area fails to hold and daily candles continue closing below this zone, the market could potentially search for the next lower support areas.
🔴 Resistance Levels to Watch
The first important resistance is around $0.90–$0.92. This zone is close to the recent price action and could become a selling area if SUI attempts a recovery.
Above that, the $0.95–$1.00 region becomes much more important. The $1.00 psychological level in particular could attract significant attention from traders.
A stronger recovery would require SUI to reclaim these levels with convincing daily candles and increasing trading activity.
The previous structure around $1.05–$1.15 represents another major resistance area because the price spent considerable time there before continuing its decline.
📊 Volume Is Also Important
The volume shown on the 1D chart has generally decreased compared with the much larger volume seen during the earlier price movement.
Lower volume during a declining market can sometimes indicate that selling momentum is becoming less aggressive, but it does not automatically mean a reversal is confirmed.
For a stronger bullish move, it would be healthier to see increasing volume together with a breakout above nearby resistance.
That combination would provide more confirmation than a price move occurring on weak volume.
🔎 What Could Happen Next?
There are two important scenarios to watch from the current structure.
Bullish scenario:
If SUI holds the $0.86–$0.87 support zone, buyers could attempt to push the price back toward $0.90, followed by the $0.95–$1.00 area. A successful breakout above $1.00 could significantly improve the daily structure and bring higher resistance zones back into focus.
Bearish scenario:
If the current support fails and SUI continues closing below the $0.86 area, the recent downward structure could remain intact. In that situation, traders may start watching the lower support zones for signs of stabilization.
🧠 Overall 1D Outlook
At the current price, SUI is still showing a bearish-to-neutral daily structure. The long decline from above $1.20 has not yet been reversed, and the chart needs a series of stronger higher highs and higher lows before a clear trend reversal can be established.
For now, $0.86–$0.87 is the key area to watch on the downside, while $0.90–$0.92 is the first important hurdle on the upside.
The next major move could become clearer once SUI either decisively breaks below its current support or reclaims the nearby resistance with stronger volume.
Key levels:
🟢 Support: $0.86–$0.87
🟡 Resistance: $0.90–$0.92
🔴 Major resistance: $0.95–$1.00
📈 Higher resistance: $1.05–$1.15
For SUI traders, the reaction around the current support zone could be particularly important in determining whether the market is preparing for stabilization or another leg lower.
Haan, is SUI article ke liye ye hashtags best rahenge:
#SUI #SUIUSDT #SuiNetwork #Crypto #CryptoAnalysis #TechnicalAnalysis #Altcoins #BinanceSquare
Agar short aur clean rakhna hai to sirf ye 5 use karo:
#SUI #CryptoAnalysis #TechnicalAnalysis #altcoins $SUI
SUI/USDT is currently trading around $0.8690, with the pair showing a daily decline of approximately 2.91%. The 1D chart presents a clear shift from the strong upside move seen earlier to a prolonged period of selling pressure and lower price levels.
Looking at the broader daily structure, SUI previously climbed strongly from the $0.70–$0.80 area and reached above $1.20. However, after that rally, the market started forming a series of lower highs and lower lows. This indicates that sellers have gradually gained control of the short- to medium-term trend.
📉 Current 1D Structure
The most important feature on the chart is the extended decline from the $1.20+ zone. After reaching the higher levels, SUI failed to maintain bullish momentum and repeatedly moved toward lower support areas.
At the moment, price is around $0.8690, while the displayed 24-hour high is approximately $0.9088 and the 24-hour low is around $0.8668.
The latest candles are relatively small compared with the larger candles seen during the earlier rally. This suggests that the market is currently in a more cautious phase, with buyers and sellers competing around the present price area.
🟢 Important Support Zone
The $0.86–$0.87 area is currently one of the most important zones on the chart.
Price has recently returned to this region after failing to hold above $0.90. If buyers manage to defend this area and produce stronger bullish daily candles, it could become the foundation for a short-term recovery.
A sustained move above $0.90 would be an early sign that buying pressure is returning.
On the other hand, if the $0.86 area fails to hold and daily candles continue closing below this zone, the market could potentially search for the next lower support areas.
🔴 Resistance Levels to Watch
The first important resistance is around $0.90–$0.92. This zone is close to the recent price action and could become a selling area if SUI attempts a recovery.
Above that, the $0.95–$1.00 region becomes much more important. The $1.00 psychological level in particular could attract significant attention from traders.
A stronger recovery would require SUI to reclaim these levels with convincing daily candles and increasing trading activity.
The previous structure around $1.05–$1.15 represents another major resistance area because the price spent considerable time there before continuing its decline.
📊 Volume Is Also Important
The volume shown on the 1D chart has generally decreased compared with the much larger volume seen during the earlier price movement.
Lower volume during a declining market can sometimes indicate that selling momentum is becoming less aggressive, but it does not automatically mean a reversal is confirmed.
For a stronger bullish move, it would be healthier to see increasing volume together with a breakout above nearby resistance.
That combination would provide more confirmation than a price move occurring on weak volume.
🔎 What Could Happen Next?
There are two important scenarios to watch from the current structure.
Bullish scenario:
If SUI holds the $0.86–$0.87 support zone, buyers could attempt to push the price back toward $0.90, followed by the $0.95–$1.00 area. A successful breakout above $1.00 could significantly improve the daily structure and bring higher resistance zones back into focus.
Bearish scenario:
If the current support fails and SUI continues closing below the $0.86 area, the recent downward structure could remain intact. In that situation, traders may start watching the lower support zones for signs of stabilization.
🧠 Overall 1D Outlook
At the current price, SUI is still showing a bearish-to-neutral daily structure. The long decline from above $1.20 has not yet been reversed, and the chart needs a series of stronger higher highs and higher lows before a clear trend reversal can be established.
For now, $0.86–$0.87 is the key area to watch on the downside, while $0.90–$0.92 is the first important hurdle on the upside.
The next major move could become clearer once SUI either decisively breaks below its current support or reclaims the nearby resistance with stronger volume.
Key levels:
🟢 Support: $0.86–$0.87
🟡 Resistance: $0.90–$0.92
🔴 Major resistance: $0.95–$1.00
📈 Higher resistance: $1.05–$1.15
For SUI traders, the reaction around the current support zone could be particularly important in determining whether the market is preparing for stabilization or another leg lower.
Haan, is SUI article ke liye ye hashtags best rahenge:
#SUI #SUIUSDT #SuiNetwork #Crypto #CryptoAnalysis #TechnicalAnalysis #Altcoins #BinanceSquare
Agar short aur clean rakhna hai to sirf ye 5 use karo:
#SUI #CryptoAnalysis #TechnicalAnalysis #altcoins $SUI
309
·
--
Article
CELO/USDT 1H Analysis 🔥 | Bullish Recovery or More Downside?🔥 CELO/USDT 1H Market Analysis – Is a Reversal Coming?
CELO is currently trading around 0.07278 USDT, and its 1-hour chart is showing an interesting market situation.
After experiencing an upward move, CELO has started facing strong selling pressure. Recent candles show that sellers are currently trying to control the market.
However, the current price area is important because buyers may attempt to defend the support zone and create a possible recovery.
Let’s take a closer look at the CELO/USDT market structure.
📊 1. Current Market Situation
CELO recently moved upward toward the 0.07700 area before losing momentum.
After reaching higher levels, the price started making lower highs and lower lows.
This indicates short-term bearish momentum.
The latest candles are trading close to 0.07278, showing that sellers remain active.
🟢 2. Important Support Levels
Here are some important support areas to monitor:
* 0.07250: Nearby support zone.
* 0.07200: Important psychological support area.
* 0.07150: A lower zone to watch if selling pressure continues.
If buyers defend the current support area, CELO could attempt a short-term recovery.
🔴 3. Important Resistance Levels
On the upside, these levels deserve attention:
* 0.07300: First nearby resistance.
* 0.07400: Important recovery level.
* 0.07500: Stronger resistance area.
* 0.07600: Higher resistance zone.
A move above these levels with strong buying volume could improve the short-term market structure.
📉 4. What Is the 1H Chart Telling Us?
The chart currently shows a series of downward movements after the previous upward rally.
Recent red candles indicate selling pressure, while the volume bars show active trading during the decline.
For a bullish recovery, buyers need to return with stronger momentum and push the price above nearby resistance.
A recovery without sufficient volume may struggle to continue.
🚀 5. Bullish Scenario
If CELO manages to hold above the 0.07250 area and buying pressure increases, the price could attempt to recover toward:
* 0.07300
* 0.07400
* 0.07500
A stronger breakout could bring the 0.07600 area into focus.
🐻 6. Bearish Scenario
If sellers continue controlling the market and CELO loses the 0.07250 support area, further downside could become possible.
The next areas to monitor would be:
* 0.07200
* 0.07150
The reaction around these levels could help determine the next short-term direction.
💡 7. Final Market Outlook
CELO/USDT is currently showing short-term bearish momentum on the 1-hour chart.
The most important thing to watch now is whether buyers can defend the current support area or sellers continue pushing the price lower.
A strong bullish candle with increasing volume could be the first sign of recovery.
For now, the key levels are 0.07250 support and 0.07400 resistance.
💬 What Do You Think?
Can CELO recover from the current support zone and move toward 0.07500?
Or will sellers push the price below 0.07200?
Share your analysis and thoughts in the comments! 👇
#BinanceSquare #Altcoin #CryptoMarket #trading $CELO
{spot}(CELOUSDT)
CELO/USDT 1H Analysis 🔥 | Bullish Recovery or More Downside?
🔥 CELO/USDT 1H Market Analysis – Is a Reversal Coming?
CELO is currently trading around 0.07278 USDT, and its 1-hour chart is showing an interesting market situation.
After experiencing an upward move, CELO has started facing strong selling pressure. Recent candles show that sellers are currently trying to control the market.
However, the current price area is important because buyers may attempt to defend the support zone and create a possible recovery.
Let’s take a closer look at the CELO/USDT market structure.
📊 1. Current Market Situation
CELO recently moved upward toward the 0.07700 area before losing momentum.
After reaching higher levels, the price started making lower highs and lower lows.
This indicates short-term bearish momentum.
The latest candles are trading close to 0.07278, showing that sellers remain active.
🟢 2. Important Support Levels
Here are some important support areas to monitor:
* 0.07250: Nearby support zone.
* 0.07200: Important psychological support area.
* 0.07150: A lower zone to watch if selling pressure continues.
If buyers defend the current support area, CELO could attempt a short-term recovery.
🔴 3. Important Resistance Levels
On the upside, these levels deserve attention:
* 0.07300: First nearby resistance.
* 0.07400: Important recovery level.
* 0.07500: Stronger resistance area.
* 0.07600: Higher resistance zone.
A move above these levels with strong buying volume could improve the short-term market structure.
📉 4. What Is the 1H Chart Telling Us?
The chart currently shows a series of downward movements after the previous upward rally.
Recent red candles indicate selling pressure, while the volume bars show active trading during the decline.
For a bullish recovery, buyers need to return with stronger momentum and push the price above nearby resistance.
A recovery without sufficient volume may struggle to continue.
🚀 5. Bullish Scenario
If CELO manages to hold above the 0.07250 area and buying pressure increases, the price could attempt to recover toward:
* 0.07300
* 0.07400
* 0.07500
A stronger breakout could bring the 0.07600 area into focus.
🐻 6. Bearish Scenario
If sellers continue controlling the market and CELO loses the 0.07250 support area, further downside could become possible.
The next areas to monitor would be:
* 0.07200
* 0.07150
The reaction around these levels could help determine the next short-term direction.
💡 7. Final Market Outlook
CELO/USDT is currently showing short-term bearish momentum on the 1-hour chart.
The most important thing to watch now is whether buyers can defend the current support area or sellers continue pushing the price lower.
A strong bullish candle with increasing volume could be the first sign of recovery.
For now, the key levels are 0.07250 support and 0.07400 resistance.
💬 What Do You Think?
Can CELO recover from the current support zone and move toward 0.07500?
Or will sellers push the price below 0.07200?
Share your analysis and thoughts in the comments! 👇
#BinanceSquare #Altcoin #CryptoMarket #trading $CELO
CELO is currently trading around 0.07278 USDT, and its 1-hour chart is showing an interesting market situation.
After experiencing an upward move, CELO has started facing strong selling pressure. Recent candles show that sellers are currently trying to control the market.
However, the current price area is important because buyers may attempt to defend the support zone and create a possible recovery.
Let’s take a closer look at the CELO/USDT market structure.
📊 1. Current Market Situation
CELO recently moved upward toward the 0.07700 area before losing momentum.
After reaching higher levels, the price started making lower highs and lower lows.
This indicates short-term bearish momentum.
The latest candles are trading close to 0.07278, showing that sellers remain active.
🟢 2. Important Support Levels
Here are some important support areas to monitor:
* 0.07250: Nearby support zone.
* 0.07200: Important psychological support area.
* 0.07150: A lower zone to watch if selling pressure continues.
If buyers defend the current support area, CELO could attempt a short-term recovery.
🔴 3. Important Resistance Levels
On the upside, these levels deserve attention:
* 0.07300: First nearby resistance.
* 0.07400: Important recovery level.
* 0.07500: Stronger resistance area.
* 0.07600: Higher resistance zone.
A move above these levels with strong buying volume could improve the short-term market structure.
📉 4. What Is the 1H Chart Telling Us?
The chart currently shows a series of downward movements after the previous upward rally.
Recent red candles indicate selling pressure, while the volume bars show active trading during the decline.
For a bullish recovery, buyers need to return with stronger momentum and push the price above nearby resistance.
A recovery without sufficient volume may struggle to continue.
🚀 5. Bullish Scenario
If CELO manages to hold above the 0.07250 area and buying pressure increases, the price could attempt to recover toward:
* 0.07300
* 0.07400
* 0.07500
A stronger breakout could bring the 0.07600 area into focus.
🐻 6. Bearish Scenario
If sellers continue controlling the market and CELO loses the 0.07250 support area, further downside could become possible.
The next areas to monitor would be:
* 0.07200
* 0.07150
The reaction around these levels could help determine the next short-term direction.
💡 7. Final Market Outlook
CELO/USDT is currently showing short-term bearish momentum on the 1-hour chart.
The most important thing to watch now is whether buyers can defend the current support area or sellers continue pushing the price lower.
A strong bullish candle with increasing volume could be the first sign of recovery.
For now, the key levels are 0.07250 support and 0.07400 resistance.
💬 What Do You Think?
Can CELO recover from the current support zone and move toward 0.07500?
Or will sellers push the price below 0.07200?
Share your analysis and thoughts in the comments! 👇
#BinanceSquare #Altcoin #CryptoMarket #trading $CELO
311
·
--
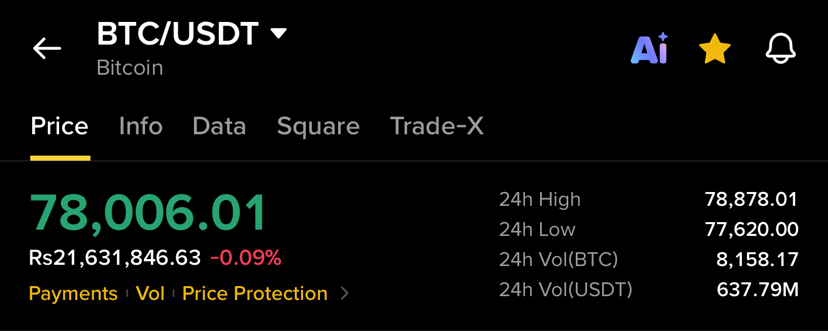
Article
Bitcoin BTC 1H Analysis – Bullish Recovery or More Downside?📊 Bitcoin BTC 1H Analysis – Buyers or Sellers?
Bitcoin is currently trading around $78,006. The 1-hour chart shows recent selling pressure after a strong upward move.
🔍 Key Market Observations:
* BTC is facing short-term selling pressure.
* Buyers need to regain momentum.
* Trading volume is important for confirmation.
* A strong recovery could bring bullish momentum back.
🚀 My View:
Let’s wait for confirmation before making any trading decisions. Risk management is always important.
What do you think?
Will BTC recover or continue moving down?
#BTC #Bitcoin❗ #BinanceSquare #CryptoAnalysis" #trading
{spot}(BTCUSDT)
Bitcoin BTC 1H Analysis – Bullish Recovery or More Downside?
📊 Bitcoin BTC 1H Analysis – Buyers or Sellers?
Bitcoin is currently trading around $78,006. The 1-hour chart shows recent selling pressure after a strong upward move.
🔍 Key Market Observations:
* BTC is facing short-term selling pressure.
* Buyers need to regain momentum.
* Trading volume is important for confirmation.
* A strong recovery could bring bullish momentum back.
🚀 My View:
Let’s wait for confirmation before making any trading decisions. Risk management is always important.
What do you think?
Will BTC recover or continue moving down?
#BTC #Bitcoin❗ #BinanceSquare #CryptoAnalysis" #trading
Bitcoin is currently trading around $78,006. The 1-hour chart shows recent selling pressure after a strong upward move.
🔍 Key Market Observations:
* BTC is facing short-term selling pressure.
* Buyers need to regain momentum.
* Trading volume is important for confirmation.
* A strong recovery could bring bullish momentum back.
🚀 My View:
Let’s wait for confirmation before making any trading decisions. Risk management is always important.
What do you think?
Will BTC recover or continue moving down?
#BTC #Bitcoin❗ #BinanceSquare #CryptoAnalysis" #trading
97
·
--
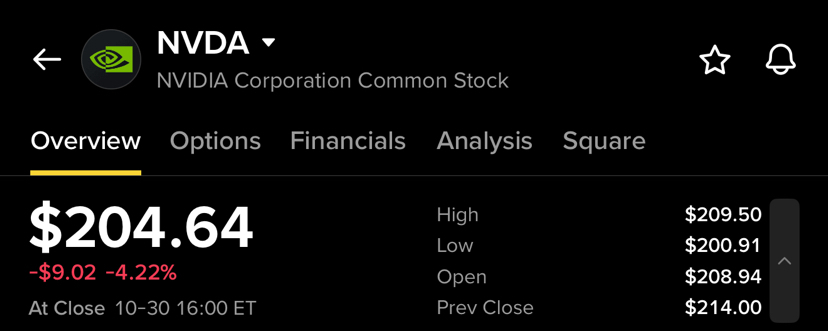
Article
NVDA Stock Analysis: Can NVIDIA Reclaim $210? 📈NVDA Stock Analysis: Can NVIDIA Reclaim $210?
NVIDIA (NVDA) closed around $204.64, down approximately 4.22% in the latest session. The stock experienced a sharp sell-off, reaching an intraday low near $200.91, before buyers stepped in and pushed the price back above $204.
On the 30-minute chart, the recent price action shows an important short-term battle between buyers attempting to stabilize the stock and sellers maintaining pressure after the decline.
📉 Recent Price Action
NVDA opened around $208.94 and moved as high as approximately $209.06 before falling sharply.
The decline took the stock toward the $200.91 area, where buyers appeared to defend the psychological $200 level.
After touching that low, NVDA recovered toward the $205 area. This bounce is encouraging for short-term momentum, but the chart still needs confirmation before a stronger recovery can be considered.
🟢 Key Support Levels
The first major support is around $200–$201.
The recent low near $200.91 makes this zone particularly important. If buyers continue defending this area, it could become the foundation for another recovery attempt.
A decisive break below $200 could weaken the short-term structure and potentially bring additional selling pressure.
🔴 Key Resistance Levels
The first resistance zone is around $205–$206.
The chart’s MA(25) is near $205.25, making this an important short-term level.
Above that, $208–$209 is the next major resistance zone. This area coincides with the recent opening/high region.
A stronger recovery would require NVDA to reclaim $209–$210 and hold above it.
Further above, the $212 area is important because the MA(99) is around $212.12 on the displayed chart.
📊 Moving Averages
The 30-minute chart shows:
MA(7): ~$205.00
MA(25): ~$205.25
MA(99): ~$212.12
The short-term moving averages are currently clustered around $205, while the longer moving average remains considerably higher.
This means NVDA is attempting to stabilize, but the broader short-term chart structure has not fully turned bullish yet.
📈 Volume
The sell-off was accompanied by noticeable trading volume, while the subsequent rebound also showed increased activity.
This is an important area to watch. If another upward move occurs with stronger volume and price successfully breaks through $205–$209, it would provide better confirmation that buyers are returning.
On the other hand, weak volume during a bounce could indicate that the recovery is temporary.
🔎 Two Possible Scenarios
🟢 Bullish Scenario
If NVDA holds above $200–$201 and successfully reclaims $205–$206, buyers could attempt to push the price toward $208–$210.
A clean breakout above $210 could improve the short-term structure and put the $212 region into focus.
🔴 Bearish Scenario
If NVDA fails to hold the $200–$201 support zone, the recent recovery could lose momentum.
A decisive break below $200 would be a significant warning sign and could lead to further downside pressure.
🌐 Bigger Market Picture
The recent decline is also happening during a broader technology and semiconductor sell-off, with investors showing increased concern about the sustainability and cash requirements of the AI spending boom. (24/7 Wall St.)
At the same time, NVIDIA continues to be closely tied to the long-term AI infrastructure theme, so the stock remains highly sensitive to both AI-related developments and overall technology-market sentiment. (Simply Wall St)
🎯 Levels to Watch
Support: $200–$201
Resistance: $205–$206 → $208–$210 → ~$212
For now, the key question is whether NVDA can turn the recent bounce into a sustained recovery. Holding the $200 area and reclaiming $205–$210 would strengthen the bullish case, while losing $200 would make the chart more vulnerable to additional downside.
#NVIDIA #stocks #stockmarket #StockAnalysis #trading $NVDA
{future}(NVDAUSDT)
NVDA Stock Analysis: Can NVIDIA Reclaim $210? 📈
NVDA Stock Analysis: Can NVIDIA Reclaim $210?
NVIDIA (NVDA) closed around $204.64, down approximately 4.22% in the latest session. The stock experienced a sharp sell-off, reaching an intraday low near $200.91, before buyers stepped in and pushed the price back above $204.
On the 30-minute chart, the recent price action shows an important short-term battle between buyers attempting to stabilize the stock and sellers maintaining pressure after the decline.
📉 Recent Price Action
NVDA opened around $208.94 and moved as high as approximately $209.06 before falling sharply.
The decline took the stock toward the $200.91 area, where buyers appeared to defend the psychological $200 level.
After touching that low, NVDA recovered toward the $205 area. This bounce is encouraging for short-term momentum, but the chart still needs confirmation before a stronger recovery can be considered.
🟢 Key Support Levels
The first major support is around $200–$201.
The recent low near $200.91 makes this zone particularly important. If buyers continue defending this area, it could become the foundation for another recovery attempt.
A decisive break below $200 could weaken the short-term structure and potentially bring additional selling pressure.
🔴 Key Resistance Levels
The first resistance zone is around $205–$206.
The chart’s MA(25) is near $205.25, making this an important short-term level.
Above that, $208–$209 is the next major resistance zone. This area coincides with the recent opening/high region.
A stronger recovery would require NVDA to reclaim $209–$210 and hold above it.
Further above, the $212 area is important because the MA(99) is around $212.12 on the displayed chart.
📊 Moving Averages
The 30-minute chart shows:
MA(7): ~$205.00
MA(25): ~$205.25
MA(99): ~$212.12
The short-term moving averages are currently clustered around $205, while the longer moving average remains considerably higher.
This means NVDA is attempting to stabilize, but the broader short-term chart structure has not fully turned bullish yet.
📈 Volume
The sell-off was accompanied by noticeable trading volume, while the subsequent rebound also showed increased activity.
This is an important area to watch. If another upward move occurs with stronger volume and price successfully breaks through $205–$209, it would provide better confirmation that buyers are returning.
On the other hand, weak volume during a bounce could indicate that the recovery is temporary.
🔎 Two Possible Scenarios
🟢 Bullish Scenario
If NVDA holds above $200–$201 and successfully reclaims $205–$206, buyers could attempt to push the price toward $208–$210.
A clean breakout above $210 could improve the short-term structure and put the $212 region into focus.
🔴 Bearish Scenario
If NVDA fails to hold the $200–$201 support zone, the recent recovery could lose momentum.
A decisive break below $200 would be a significant warning sign and could lead to further downside pressure.
🌐 Bigger Market Picture
The recent decline is also happening during a broader technology and semiconductor sell-off, with investors showing increased concern about the sustainability and cash requirements of the AI spending boom. (24/7 Wall St.)
At the same time, NVIDIA continues to be closely tied to the long-term AI infrastructure theme, so the stock remains highly sensitive to both AI-related developments and overall technology-market sentiment. (Simply Wall St)
🎯 Levels to Watch
Support: $200–$201
Resistance: $205–$206 → $208–$210 → ~$212
For now, the key question is whether NVDA can turn the recent bounce into a sustained recovery. Holding the $200 area and reclaiming $205–$210 would strengthen the bullish case, while losing $200 would make the chart more vulnerable to additional downside.
#NVIDIA #stocks #stockmarket #StockAnalysis #trading $NVDA
NVIDIA (NVDA) closed around $204.64, down approximately 4.22% in the latest session. The stock experienced a sharp sell-off, reaching an intraday low near $200.91, before buyers stepped in and pushed the price back above $204.
On the 30-minute chart, the recent price action shows an important short-term battle between buyers attempting to stabilize the stock and sellers maintaining pressure after the decline.
📉 Recent Price Action
NVDA opened around $208.94 and moved as high as approximately $209.06 before falling sharply.
The decline took the stock toward the $200.91 area, where buyers appeared to defend the psychological $200 level.
After touching that low, NVDA recovered toward the $205 area. This bounce is encouraging for short-term momentum, but the chart still needs confirmation before a stronger recovery can be considered.
🟢 Key Support Levels
The first major support is around $200–$201.
The recent low near $200.91 makes this zone particularly important. If buyers continue defending this area, it could become the foundation for another recovery attempt.
A decisive break below $200 could weaken the short-term structure and potentially bring additional selling pressure.
🔴 Key Resistance Levels
The first resistance zone is around $205–$206.
The chart’s MA(25) is near $205.25, making this an important short-term level.
Above that, $208–$209 is the next major resistance zone. This area coincides with the recent opening/high region.
A stronger recovery would require NVDA to reclaim $209–$210 and hold above it.
Further above, the $212 area is important because the MA(99) is around $212.12 on the displayed chart.
📊 Moving Averages
The 30-minute chart shows:
MA(7): ~$205.00
MA(25): ~$205.25
MA(99): ~$212.12
The short-term moving averages are currently clustered around $205, while the longer moving average remains considerably higher.
This means NVDA is attempting to stabilize, but the broader short-term chart structure has not fully turned bullish yet.
📈 Volume
The sell-off was accompanied by noticeable trading volume, while the subsequent rebound also showed increased activity.
This is an important area to watch. If another upward move occurs with stronger volume and price successfully breaks through $205–$209, it would provide better confirmation that buyers are returning.
On the other hand, weak volume during a bounce could indicate that the recovery is temporary.
🔎 Two Possible Scenarios
🟢 Bullish Scenario
If NVDA holds above $200–$201 and successfully reclaims $205–$206, buyers could attempt to push the price toward $208–$210.
A clean breakout above $210 could improve the short-term structure and put the $212 region into focus.
🔴 Bearish Scenario
If NVDA fails to hold the $200–$201 support zone, the recent recovery could lose momentum.
A decisive break below $200 would be a significant warning sign and could lead to further downside pressure.
🌐 Bigger Market Picture
The recent decline is also happening during a broader technology and semiconductor sell-off, with investors showing increased concern about the sustainability and cash requirements of the AI spending boom. (24/7 Wall St.)
At the same time, NVIDIA continues to be closely tied to the long-term AI infrastructure theme, so the stock remains highly sensitive to both AI-related developments and overall technology-market sentiment. (Simply Wall St)
🎯 Levels to Watch
Support: $200–$201
Resistance: $205–$206 → $208–$210 → ~$212
For now, the key question is whether NVDA can turn the recent bounce into a sustained recovery. Holding the $200 area and reclaiming $205–$210 would strengthen the bullish case, while losing $200 would make the chart more vulnerable to additional downside.
#NVIDIA #stocks #stockmarket #StockAnalysis #trading $NVDA
245
·
--
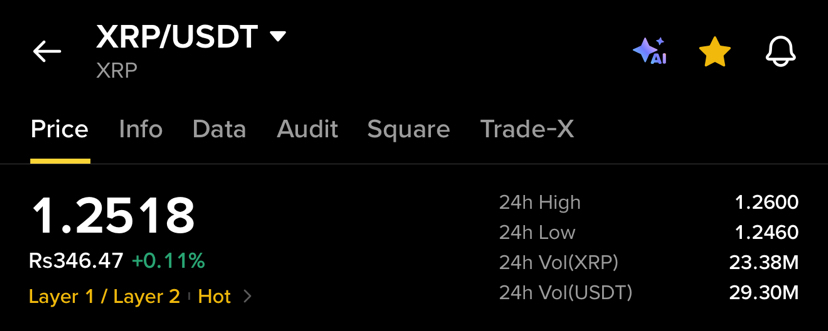
Article
XRP/USDT Analysis: Can XRP Reclaim $1.26? 📈XRP/USDT: Short-Term Setup — Can XRP Reclaim $1.26?
XRP/USDT is currently trading around $1.2518, showing a small intraday recovery after a sharp pullback toward the $1.2460 area. On the 15-minute chart, price action is showing an important battle between buyers defending the lower levels and sellers protecting the upper resistance zone.
The current structure is worth watching closely because XRP recently moved from around $1.2580 down toward $1.2460, but buyers quickly stepped in and pushed the price back toward $1.25.
📊 Current Market Structure
XRP is currently around $1.2518, with the 24-hour range sitting between approximately $1.2460 and $1.2600.
The recent rejection from the $1.2580–$1.2600 area indicates that sellers are still active near the upper end of the range. However, the strong reaction from $1.2460 shows that buyers are also defending the lower zone.
This creates a short-term range where the next breakout could provide a clearer directional signal.
🟢 Key Support Levels
$1.2500 is the first important short-term area to watch. Holding above this level could help XRP stabilize after the recent decline.
Below that, $1.2480–$1.2460 becomes a much more important support zone. The recent wick toward $1.2460 shows that buyers reacted strongly there.
⚠️ A clean break below $1.2460 could weaken the short-term structure and open the door toward lower levels.
🔴 Key Resistance Levels
On the upside, $1.2540–$1.2560 is the first resistance area.
Above this zone, XRP needs to reclaim $1.2580–$1.2600. The $1.2600 area is particularly important because it currently represents the top of the visible 24-hour range.
A strong move above $1.2600, especially with increasing volume, could signal that buyers are gaining control of the short-term trend.
📈 Volume & Momentum
The chart shows several noticeable volume spikes during the recent price movements. The sharp move down toward $1.2460 was accompanied by increased activity, followed by a buying reaction.
This suggests that the $1.2460 area is being actively defended.
However, XRP still needs stronger buying volume to confirm a sustained move above the nearby resistance levels. A breakout without meaningful volume could potentially turn into another rejection.
🔎 What to Watch Next?
There are two main scenarios on the 15-minute chart:
Bullish scenario 🟢
If XRP holds above $1.2500 and successfully breaks through $1.2540–$1.2560, the next major test would be around $1.2580–$1.2600.
A convincing break and hold above $1.2600 could improve the short-term structure and bring higher levels into focus.
Bearish scenario 🔴
If XRP fails to maintain $1.2500 and sellers push price back toward $1.2480–$1.2460, that zone becomes critical.
A decisive breakdown below $1.2460 could indicate that the recent bounce was only a temporary recovery and that further downside pressure may develop.
⚠️ Important Levels
Support: $1.2500 → $1.2480 → $1.2460
Resistance: $1.2540 → $1.2560 → $1.2600
For now, XRP is sitting near the middle of this short-term battle. The most important signal would be whether buyers can reclaim the $1.2580–$1.2600 zone or sellers regain control below $1.2460.
The next few 15-minute candles could therefore be important for determining XRP’s immediate direction. 👀📊
#Trading #Binance #CryptoAnalysis" $XRP
{spot}(XRPUSDT)
XRP/USDT Analysis: Can XRP Reclaim $1.26? 📈
XRP/USDT: Short-Term Setup — Can XRP Reclaim $1.26?
XRP/USDT is currently trading around $1.2518, showing a small intraday recovery after a sharp pullback toward the $1.2460 area. On the 15-minute chart, price action is showing an important battle between buyers defending the lower levels and sellers protecting the upper resistance zone.
The current structure is worth watching closely because XRP recently moved from around $1.2580 down toward $1.2460, but buyers quickly stepped in and pushed the price back toward $1.25.
📊 Current Market Structure
XRP is currently around $1.2518, with the 24-hour range sitting between approximately $1.2460 and $1.2600.
The recent rejection from the $1.2580–$1.2600 area indicates that sellers are still active near the upper end of the range. However, the strong reaction from $1.2460 shows that buyers are also defending the lower zone.
This creates a short-term range where the next breakout could provide a clearer directional signal.
🟢 Key Support Levels
$1.2500 is the first important short-term area to watch. Holding above this level could help XRP stabilize after the recent decline.
Below that, $1.2480–$1.2460 becomes a much more important support zone. The recent wick toward $1.2460 shows that buyers reacted strongly there.
⚠️ A clean break below $1.2460 could weaken the short-term structure and open the door toward lower levels.
🔴 Key Resistance Levels
On the upside, $1.2540–$1.2560 is the first resistance area.
Above this zone, XRP needs to reclaim $1.2580–$1.2600. The $1.2600 area is particularly important because it currently represents the top of the visible 24-hour range.
A strong move above $1.2600, especially with increasing volume, could signal that buyers are gaining control of the short-term trend.
📈 Volume & Momentum
The chart shows several noticeable volume spikes during the recent price movements. The sharp move down toward $1.2460 was accompanied by increased activity, followed by a buying reaction.
This suggests that the $1.2460 area is being actively defended.
However, XRP still needs stronger buying volume to confirm a sustained move above the nearby resistance levels. A breakout without meaningful volume could potentially turn into another rejection.
🔎 What to Watch Next?
There are two main scenarios on the 15-minute chart:
Bullish scenario 🟢
If XRP holds above $1.2500 and successfully breaks through $1.2540–$1.2560, the next major test would be around $1.2580–$1.2600.
A convincing break and hold above $1.2600 could improve the short-term structure and bring higher levels into focus.
Bearish scenario 🔴
If XRP fails to maintain $1.2500 and sellers push price back toward $1.2480–$1.2460, that zone becomes critical.
A decisive breakdown below $1.2460 could indicate that the recent bounce was only a temporary recovery and that further downside pressure may develop.
⚠️ Important Levels
Support: $1.2500 → $1.2480 → $1.2460
Resistance: $1.2540 → $1.2560 → $1.2600
For now, XRP is sitting near the middle of this short-term battle. The most important signal would be whether buyers can reclaim the $1.2580–$1.2600 zone or sellers regain control below $1.2460.
The next few 15-minute candles could therefore be important for determining XRP’s immediate direction. 👀📊
#Trading #Binance #CryptoAnalysis" $XRP
XRP/USDT is currently trading around $1.2518, showing a small intraday recovery after a sharp pullback toward the $1.2460 area. On the 15-minute chart, price action is showing an important battle between buyers defending the lower levels and sellers protecting the upper resistance zone.
The current structure is worth watching closely because XRP recently moved from around $1.2580 down toward $1.2460, but buyers quickly stepped in and pushed the price back toward $1.25.
📊 Current Market Structure
XRP is currently around $1.2518, with the 24-hour range sitting between approximately $1.2460 and $1.2600.
The recent rejection from the $1.2580–$1.2600 area indicates that sellers are still active near the upper end of the range. However, the strong reaction from $1.2460 shows that buyers are also defending the lower zone.
This creates a short-term range where the next breakout could provide a clearer directional signal.
🟢 Key Support Levels
$1.2500 is the first important short-term area to watch. Holding above this level could help XRP stabilize after the recent decline.
Below that, $1.2480–$1.2460 becomes a much more important support zone. The recent wick toward $1.2460 shows that buyers reacted strongly there.
⚠️ A clean break below $1.2460 could weaken the short-term structure and open the door toward lower levels.
🔴 Key Resistance Levels
On the upside, $1.2540–$1.2560 is the first resistance area.
Above this zone, XRP needs to reclaim $1.2580–$1.2600. The $1.2600 area is particularly important because it currently represents the top of the visible 24-hour range.
A strong move above $1.2600, especially with increasing volume, could signal that buyers are gaining control of the short-term trend.
📈 Volume & Momentum
The chart shows several noticeable volume spikes during the recent price movements. The sharp move down toward $1.2460 was accompanied by increased activity, followed by a buying reaction.
This suggests that the $1.2460 area is being actively defended.
However, XRP still needs stronger buying volume to confirm a sustained move above the nearby resistance levels. A breakout without meaningful volume could potentially turn into another rejection.
🔎 What to Watch Next?
There are two main scenarios on the 15-minute chart:
Bullish scenario 🟢
If XRP holds above $1.2500 and successfully breaks through $1.2540–$1.2560, the next major test would be around $1.2580–$1.2600.
A convincing break and hold above $1.2600 could improve the short-term structure and bring higher levels into focus.
Bearish scenario 🔴
If XRP fails to maintain $1.2500 and sellers push price back toward $1.2480–$1.2460, that zone becomes critical.
A decisive breakdown below $1.2460 could indicate that the recent bounce was only a temporary recovery and that further downside pressure may develop.
⚠️ Important Levels
Support: $1.2500 → $1.2480 → $1.2460
Resistance: $1.2540 → $1.2560 → $1.2600
For now, XRP is sitting near the middle of this short-term battle. The most important signal would be whether buyers can reclaim the $1.2580–$1.2600 zone or sellers regain control below $1.2460.
The next few 15-minute candles could therefore be important for determining XRP’s immediate direction. 👀📊
#Trading #Binance #CryptoAnalysis" $XRP
519
·
--
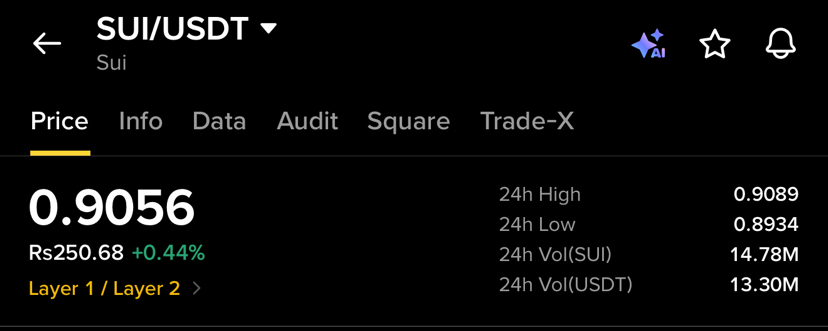
Article
🚀 SUI/USDT: Buyers Are Pushing Toward $0.91 — Breakout Ahead?🚀 SUI/USDT: Buyers Are Pushing Price Higher
SUI/USDT is showing a positive short-term structure on the 15-minute chart, with buyers gradually taking control after the earlier consolidation around the $0.8980–$0.9020 area.
At the time of the chart snapshot, SUI is trading around $0.9056, up approximately 0.44% on the day. The price has recently made a strong upward move and reached the $0.9080–$0.9090 area before facing some selling pressure.
📊 Short-Term Price Structure
Looking at the 15-minute candles, SUI has formed a series of higher levels after finding support near the $0.8980–$0.9000 zone.
The move toward $0.9080 shows that buyers are currently active. However, the rejection from the recent high is also important because it indicates that sellers are defending the upper resistance area.
After that pullback, price has recovered back toward $0.9056, which keeps the short-term structure relatively positive.
🟢 Important Support Levels
The first important support is around $0.9040–$0.9050. Holding this area could help buyers maintain the current upward structure.
Below that, the next notable support zone is around $0.9020–$0.9030.
A deeper pullback could bring price toward the $0.9000 psychological level, which has acted as an important area during the recent consolidation.
🔴 Important Resistance Levels
On the upside, $0.9080–$0.9090 is the key resistance zone visible on the chart.
A strong breakout above this area, especially if supported by increasing trading volume, could open the way for another attempt toward the $0.9100 psychological level.
If buyers fail to break this resistance, another short-term rejection and pullback would not be surprising.
📈 Volume & Order Flow
The recent upward move has been accompanied by noticeable trading activity, showing that the move has attracted market participation.
The order book shown in the snapshot also has slightly higher bid-side interest, with approximately 57.19% bids versus 42.81% asks. This suggests that buyers have a small advantage at the moment, although order-book numbers can change quickly.
Therefore, the price action around $0.9050 and the resistance near $0.9080–$0.9090 remain particularly important.
🔎 What To Watch Next?
The short-term setup is currently leaning bullish, but SUI needs to overcome the recent high to confirm stronger continuation.
Bullish scenario:
A clean break and hold above $0.9080–$0.9090 could strengthen the upward momentum and bring $0.9100+ into focus.
Pullback scenario:
If price gets rejected again near resistance and falls below $0.9040, sellers could push the market toward $0.9020–$0.9000.
For now, SUI remains at an interesting short-term level where the next breakout or rejection could determine the direction of the next move.
#SuiNetwork #crypto #BinanceSquare #SUIUSDT
{spot}(SUIUSDT)
🚀 SUI/USDT: Buyers Are Pushing Toward $0.91 — Breakout Ahead?
🚀 SUI/USDT: Buyers Are Pushing Price Higher
SUI/USDT is showing a positive short-term structure on the 15-minute chart, with buyers gradually taking control after the earlier consolidation around the $0.8980–$0.9020 area.
At the time of the chart snapshot, SUI is trading around $0.9056, up approximately 0.44% on the day. The price has recently made a strong upward move and reached the $0.9080–$0.9090 area before facing some selling pressure.
📊 Short-Term Price Structure
Looking at the 15-minute candles, SUI has formed a series of higher levels after finding support near the $0.8980–$0.9000 zone.
The move toward $0.9080 shows that buyers are currently active. However, the rejection from the recent high is also important because it indicates that sellers are defending the upper resistance area.
After that pullback, price has recovered back toward $0.9056, which keeps the short-term structure relatively positive.
🟢 Important Support Levels
The first important support is around $0.9040–$0.9050. Holding this area could help buyers maintain the current upward structure.
Below that, the next notable support zone is around $0.9020–$0.9030.
A deeper pullback could bring price toward the $0.9000 psychological level, which has acted as an important area during the recent consolidation.
🔴 Important Resistance Levels
On the upside, $0.9080–$0.9090 is the key resistance zone visible on the chart.
A strong breakout above this area, especially if supported by increasing trading volume, could open the way for another attempt toward the $0.9100 psychological level.
If buyers fail to break this resistance, another short-term rejection and pullback would not be surprising.
📈 Volume & Order Flow
The recent upward move has been accompanied by noticeable trading activity, showing that the move has attracted market participation.
The order book shown in the snapshot also has slightly higher bid-side interest, with approximately 57.19% bids versus 42.81% asks. This suggests that buyers have a small advantage at the moment, although order-book numbers can change quickly.
Therefore, the price action around $0.9050 and the resistance near $0.9080–$0.9090 remain particularly important.
🔎 What To Watch Next?
The short-term setup is currently leaning bullish, but SUI needs to overcome the recent high to confirm stronger continuation.
Bullish scenario:
A clean break and hold above $0.9080–$0.9090 could strengthen the upward momentum and bring $0.9100+ into focus.
Pullback scenario:
If price gets rejected again near resistance and falls below $0.9040, sellers could push the market toward $0.9020–$0.9000.
For now, SUI remains at an interesting short-term level where the next breakout or rejection could determine the direction of the next move.
#SuiNetwork #crypto #BinanceSquare #SUIUSDT
SUI/USDT is showing a positive short-term structure on the 15-minute chart, with buyers gradually taking control after the earlier consolidation around the $0.8980–$0.9020 area.
At the time of the chart snapshot, SUI is trading around $0.9056, up approximately 0.44% on the day. The price has recently made a strong upward move and reached the $0.9080–$0.9090 area before facing some selling pressure.
📊 Short-Term Price Structure
Looking at the 15-minute candles, SUI has formed a series of higher levels after finding support near the $0.8980–$0.9000 zone.
The move toward $0.9080 shows that buyers are currently active. However, the rejection from the recent high is also important because it indicates that sellers are defending the upper resistance area.
After that pullback, price has recovered back toward $0.9056, which keeps the short-term structure relatively positive.
🟢 Important Support Levels
The first important support is around $0.9040–$0.9050. Holding this area could help buyers maintain the current upward structure.
Below that, the next notable support zone is around $0.9020–$0.9030.
A deeper pullback could bring price toward the $0.9000 psychological level, which has acted as an important area during the recent consolidation.
🔴 Important Resistance Levels
On the upside, $0.9080–$0.9090 is the key resistance zone visible on the chart.
A strong breakout above this area, especially if supported by increasing trading volume, could open the way for another attempt toward the $0.9100 psychological level.
If buyers fail to break this resistance, another short-term rejection and pullback would not be surprising.
📈 Volume & Order Flow
The recent upward move has been accompanied by noticeable trading activity, showing that the move has attracted market participation.
The order book shown in the snapshot also has slightly higher bid-side interest, with approximately 57.19% bids versus 42.81% asks. This suggests that buyers have a small advantage at the moment, although order-book numbers can change quickly.
Therefore, the price action around $0.9050 and the resistance near $0.9080–$0.9090 remain particularly important.
🔎 What To Watch Next?
The short-term setup is currently leaning bullish, but SUI needs to overcome the recent high to confirm stronger continuation.
Bullish scenario:
A clean break and hold above $0.9080–$0.9090 could strengthen the upward momentum and bring $0.9100+ into focus.
Pullback scenario:
If price gets rejected again near resistance and falls below $0.9040, sellers could push the market toward $0.9020–$0.9000.
For now, SUI remains at an interesting short-term level where the next breakout or rejection could determine the direction of the next move.
#SuiNetwork #crypto #BinanceSquare #SUIUSDT
1
993
·
--
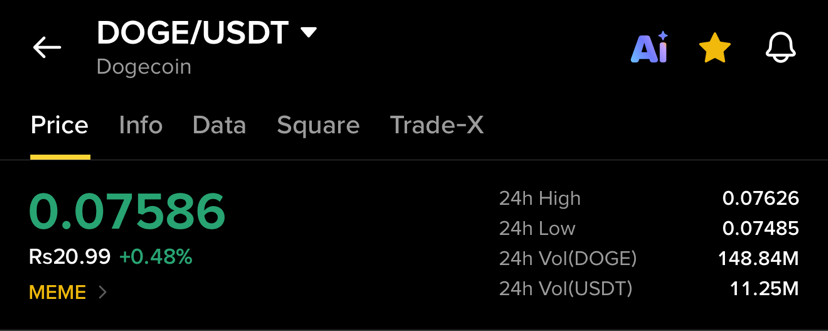
Article
🐕 DOGE/USDT: Bulls Trying to Take Control? 📈🐕 DOGE/USDT Short-Term Analysis
Dogecoin (DOGE) is currently trading around $0.07586, showing a small +0.48% move on the current session. On the 15-minute chart, DOGE has recently shown a recovery from the $0.07540–$0.07550 area and moved back toward the $0.07600 level.
📊 Technical View
The short-term structure is showing some buying interest after the recent dip. DOGE managed to push upward and briefly tested the $0.07600–$0.07610 zone before facing some selling pressure.
Currently, price is holding around $0.07586, which makes the $0.07580 area important for the immediate trend.
Key levels to watch:
🟢 Support: $0.07580 → $0.07550 → $0.07540
🔴 Resistance: $0.07600 → $0.07610 → $0.07620
If DOGE can maintain momentum and break above the $0.07610–$0.07620 resistance area with strong volume, further upside could become possible.
On the other hand, if price falls below $0.07580, sellers could attempt to push DOGE back toward the $0.07550–$0.07540 support zone.
📈 Market Sentiment
The chart currently looks slightly bullish in the very short term, but the recent rejection near $0.07610 shows that buyers still need stronger momentum to continue the move.
Volume should also be watched closely because a breakout supported by increasing volume would generally be more convincing than a move on weak volume.
Overall: DOGE is at an interesting short-term level. Traders may want to watch the $0.07580 support and $0.07610–$0.07620 resistance for the next significant move.
#DOGE #DOGECOİN #crypto #BinanceSquare $DOGE
{spot}(DOGEUSDT)
🐕 DOGE/USDT: Bulls Trying to Take Control? 📈
🐕 DOGE/USDT Short-Term Analysis
Dogecoin (DOGE) is currently trading around $0.07586, showing a small +0.48% move on the current session. On the 15-minute chart, DOGE has recently shown a recovery from the $0.07540–$0.07550 area and moved back toward the $0.07600 level.
📊 Technical View
The short-term structure is showing some buying interest after the recent dip. DOGE managed to push upward and briefly tested the $0.07600–$0.07610 zone before facing some selling pressure.
Currently, price is holding around $0.07586, which makes the $0.07580 area important for the immediate trend.
Key levels to watch:
🟢 Support: $0.07580 → $0.07550 → $0.07540
🔴 Resistance: $0.07600 → $0.07610 → $0.07620
If DOGE can maintain momentum and break above the $0.07610–$0.07620 resistance area with strong volume, further upside could become possible.
On the other hand, if price falls below $0.07580, sellers could attempt to push DOGE back toward the $0.07550–$0.07540 support zone.
📈 Market Sentiment
The chart currently looks slightly bullish in the very short term, but the recent rejection near $0.07610 shows that buyers still need stronger momentum to continue the move.
Volume should also be watched closely because a breakout supported by increasing volume would generally be more convincing than a move on weak volume.
Overall: DOGE is at an interesting short-term level. Traders may want to watch the $0.07580 support and $0.07610–$0.07620 resistance for the next significant move.
#DOGE #DOGECOİN #crypto #BinanceSquare $DOGE
Dogecoin (DOGE) is currently trading around $0.07586, showing a small +0.48% move on the current session. On the 15-minute chart, DOGE has recently shown a recovery from the $0.07540–$0.07550 area and moved back toward the $0.07600 level.
📊 Technical View
The short-term structure is showing some buying interest after the recent dip. DOGE managed to push upward and briefly tested the $0.07600–$0.07610 zone before facing some selling pressure.
Currently, price is holding around $0.07586, which makes the $0.07580 area important for the immediate trend.
Key levels to watch:
🟢 Support: $0.07580 → $0.07550 → $0.07540
🔴 Resistance: $0.07600 → $0.07610 → $0.07620
If DOGE can maintain momentum and break above the $0.07610–$0.07620 resistance area with strong volume, further upside could become possible.
On the other hand, if price falls below $0.07580, sellers could attempt to push DOGE back toward the $0.07550–$0.07540 support zone.
📈 Market Sentiment
The chart currently looks slightly bullish in the very short term, but the recent rejection near $0.07610 shows that buyers still need stronger momentum to continue the move.
Volume should also be watched closely because a breakout supported by increasing volume would generally be more convincing than a move on weak volume.
Overall: DOGE is at an interesting short-term level. Traders may want to watch the $0.07580 support and $0.07610–$0.07620 resistance for the next significant move.
#DOGE #DOGECOİN #crypto #BinanceSquare $DOGE
2
661
·
--
Article
CELO/USDT: Buyers Eye a Break Above $0.0730 📈📊 CELO/USDT Short-Term Market Analysis
CELO/USDT is currently trading around $0.07287, showing a +1.31% gain. On the 1-minute chart, CELO has experienced a noticeable pullback from the $0.0736 area and is now consolidating near $0.0728–$0.0730.
🔎 Current Price Action
The short-term chart shows that sellers were able to push the price lower from the $0.0735–$0.0736 zone. After reaching the $0.0728 area, buyers appeared and the price started moving sideways.
At the moment, CELO is struggling to establish a strong direction. The repeated candles around $0.0729–$0.0730 suggest a short-term battle between buyers and sellers.
📈 Key Levels to Watch
Resistance: $0.0730 – $0.0732
Major Resistance: $0.0735 – $0.0736
Current Price: ~$0.07287
Support: $0.0728
Next Support: Around $0.0725
A move above $0.0730–$0.0732 with stronger volume could give buyers an opportunity to test the $0.0735–$0.0736 resistance zone.
On the other hand, if CELO loses the $0.0728 support with increasing selling volume, the short-term structure could become weaker.
📊 Volume & Order Book
Trading volume has remained active during the recent decline and consolidation. The order book currently shows slightly stronger sell-side pressure, so buyers may need increased volume to regain short-term control.
The 1-minute timeframe can change very quickly, so confirmation from price and volume is important before interpreting a breakout.
🧠 Short-Term Outlook
CELO is currently showing consolidation after a short-term decline. The key area to watch is $0.0730–$0.0732 on the upside and $0.0728 on the downside.
A breakout above resistance could improve bullish momentum, while a break below support may bring additional selling pressure.
This is market analysis for educational purposes, not financial advice. Always do your own research and manage risk carefully.
#CELO #crypto #BinanceSquare #CryptoAnalysis $CELO
{spot}(CELOUSDT)
CELO/USDT: Buyers Eye a Break Above $0.0730 📈
📊 CELO/USDT Short-Term Market Analysis
CELO/USDT is currently trading around $0.07287, showing a +1.31% gain. On the 1-minute chart, CELO has experienced a noticeable pullback from the $0.0736 area and is now consolidating near $0.0728–$0.0730.
🔎 Current Price Action
The short-term chart shows that sellers were able to push the price lower from the $0.0735–$0.0736 zone. After reaching the $0.0728 area, buyers appeared and the price started moving sideways.
At the moment, CELO is struggling to establish a strong direction. The repeated candles around $0.0729–$0.0730 suggest a short-term battle between buyers and sellers.
📈 Key Levels to Watch
Resistance: $0.0730 – $0.0732
Major Resistance: $0.0735 – $0.0736
Current Price: ~$0.07287
Support: $0.0728
Next Support: Around $0.0725
A move above $0.0730–$0.0732 with stronger volume could give buyers an opportunity to test the $0.0735–$0.0736 resistance zone.
On the other hand, if CELO loses the $0.0728 support with increasing selling volume, the short-term structure could become weaker.
📊 Volume & Order Book
Trading volume has remained active during the recent decline and consolidation. The order book currently shows slightly stronger sell-side pressure, so buyers may need increased volume to regain short-term control.
The 1-minute timeframe can change very quickly, so confirmation from price and volume is important before interpreting a breakout.
🧠 Short-Term Outlook
CELO is currently showing consolidation after a short-term decline. The key area to watch is $0.0730–$0.0732 on the upside and $0.0728 on the downside.
A breakout above resistance could improve bullish momentum, while a break below support may bring additional selling pressure.
This is market analysis for educational purposes, not financial advice. Always do your own research and manage risk carefully.
#CELO #crypto #BinanceSquare #CryptoAnalysis $CELO
CELO/USDT is currently trading around $0.07287, showing a +1.31% gain. On the 1-minute chart, CELO has experienced a noticeable pullback from the $0.0736 area and is now consolidating near $0.0728–$0.0730.
🔎 Current Price Action
The short-term chart shows that sellers were able to push the price lower from the $0.0735–$0.0736 zone. After reaching the $0.0728 area, buyers appeared and the price started moving sideways.
At the moment, CELO is struggling to establish a strong direction. The repeated candles around $0.0729–$0.0730 suggest a short-term battle between buyers and sellers.
📈 Key Levels to Watch
Resistance: $0.0730 – $0.0732
Major Resistance: $0.0735 – $0.0736
Current Price: ~$0.07287
Support: $0.0728
Next Support: Around $0.0725
A move above $0.0730–$0.0732 with stronger volume could give buyers an opportunity to test the $0.0735–$0.0736 resistance zone.
On the other hand, if CELO loses the $0.0728 support with increasing selling volume, the short-term structure could become weaker.
📊 Volume & Order Book
Trading volume has remained active during the recent decline and consolidation. The order book currently shows slightly stronger sell-side pressure, so buyers may need increased volume to regain short-term control.
The 1-minute timeframe can change very quickly, so confirmation from price and volume is important before interpreting a breakout.
🧠 Short-Term Outlook
CELO is currently showing consolidation after a short-term decline. The key area to watch is $0.0730–$0.0732 on the upside and $0.0728 on the downside.
A breakout above resistance could improve bullish momentum, while a break below support may bring additional selling pressure.
This is market analysis for educational purposes, not financial advice. Always do your own research and manage risk carefully.
#CELO #crypto #BinanceSquare #CryptoAnalysis $CELO
187
·
--
Article
DOT/USDT Analysis: Key Support & Resistance Levels to Watch 📊📊 DOT/USDT Short-Term Analysis
Polkadot (DOT) is currently trading around $0.955, showing a small 0.95% gain at the time of this analysis. On the short-term 1-minute chart, price action is moving in a very tight range, showing a battle between buyers and sellers.
🔎 Current Market Structure
DOT is currently fluctuating around the $0.955–$0.956 area. The candles are relatively small, which indicates that short-term momentum is limited and the market is currently consolidating.
The immediate resistance appears around $0.956–$0.957. A strong move above this zone, supported by increasing volume, could improve short-term bullish momentum.
On the downside, $0.954 is an important nearby support, followed by the $0.953 area. If sellers push the price below these levels with strong volume, further short-term weakness could develop.
📈 Volume & Order Book
The chart shows some increased selling and buying activity around the recent candles. The order book also shows a stronger bid side compared with the ask side at the moment, suggesting that buyers are still present around the current price.
However, the 1-minute timeframe is extremely short-term and can change very quickly. Therefore, a breakout should ideally be confirmed by both price movement and volume rather than relying on a single candle.
🎯 Key Levels to Watch
Resistance: $0.956 – $0.957
Current Price: ~$0.955
Support: $0.954 – $0.953
If DOT breaks and holds above $0.957, traders may watch for further upside momentum. On the other hand, losing $0.953–$0.954 could indicate increasing selling pressure.
🧠 Market Outlook
For now, DOT appears to be in a short-term consolidation phase. The next meaningful move may depend on whether buyers can push price above the nearby resistance or sellers can take control below support.
Because this analysis is based on a 1-minute chart, it should be viewed as short-term market observation rather than a long-term prediction.
Always manage risk carefully and do your own research before making any trading decision.
#dot #Polkadot #crypto #BinanceSquare #CryptoAnalysis $DOT
{spot}(DOTUSDT)
DOT/USDT Analysis: Key Support & Resistance Levels to Watch 📊
📊 DOT/USDT Short-Term Analysis
Polkadot (DOT) is currently trading around $0.955, showing a small 0.95% gain at the time of this analysis. On the short-term 1-minute chart, price action is moving in a very tight range, showing a battle between buyers and sellers.
🔎 Current Market Structure
DOT is currently fluctuating around the $0.955–$0.956 area. The candles are relatively small, which indicates that short-term momentum is limited and the market is currently consolidating.
The immediate resistance appears around $0.956–$0.957. A strong move above this zone, supported by increasing volume, could improve short-term bullish momentum.
On the downside, $0.954 is an important nearby support, followed by the $0.953 area. If sellers push the price below these levels with strong volume, further short-term weakness could develop.
📈 Volume & Order Book
The chart shows some increased selling and buying activity around the recent candles. The order book also shows a stronger bid side compared with the ask side at the moment, suggesting that buyers are still present around the current price.
However, the 1-minute timeframe is extremely short-term and can change very quickly. Therefore, a breakout should ideally be confirmed by both price movement and volume rather than relying on a single candle.
🎯 Key Levels to Watch
Resistance: $0.956 – $0.957
Current Price: ~$0.955
Support: $0.954 – $0.953
If DOT breaks and holds above $0.957, traders may watch for further upside momentum. On the other hand, losing $0.953–$0.954 could indicate increasing selling pressure.
🧠 Market Outlook
For now, DOT appears to be in a short-term consolidation phase. The next meaningful move may depend on whether buyers can push price above the nearby resistance or sellers can take control below support.
Because this analysis is based on a 1-minute chart, it should be viewed as short-term market observation rather than a long-term prediction.
Always manage risk carefully and do your own research before making any trading decision.
#dot #Polkadot #crypto #BinanceSquare #CryptoAnalysis $DOT
Polkadot (DOT) is currently trading around $0.955, showing a small 0.95% gain at the time of this analysis. On the short-term 1-minute chart, price action is moving in a very tight range, showing a battle between buyers and sellers.
🔎 Current Market Structure
DOT is currently fluctuating around the $0.955–$0.956 area. The candles are relatively small, which indicates that short-term momentum is limited and the market is currently consolidating.
The immediate resistance appears around $0.956–$0.957. A strong move above this zone, supported by increasing volume, could improve short-term bullish momentum.
On the downside, $0.954 is an important nearby support, followed by the $0.953 area. If sellers push the price below these levels with strong volume, further short-term weakness could develop.
📈 Volume & Order Book
The chart shows some increased selling and buying activity around the recent candles. The order book also shows a stronger bid side compared with the ask side at the moment, suggesting that buyers are still present around the current price.
However, the 1-minute timeframe is extremely short-term and can change very quickly. Therefore, a breakout should ideally be confirmed by both price movement and volume rather than relying on a single candle.
🎯 Key Levels to Watch
Resistance: $0.956 – $0.957
Current Price: ~$0.955
Support: $0.954 – $0.953
If DOT breaks and holds above $0.957, traders may watch for further upside momentum. On the other hand, losing $0.953–$0.954 could indicate increasing selling pressure.
🧠 Market Outlook
For now, DOT appears to be in a short-term consolidation phase. The next meaningful move may depend on whether buyers can push price above the nearby resistance or sellers can take control below support.
Because this analysis is based on a 1-minute chart, it should be viewed as short-term market observation rather than a long-term prediction.
Always manage risk carefully and do your own research before making any trading decision.
#dot #Polkadot #crypto #BinanceSquare #CryptoAnalysis $DOT
200
·
--

Article
🚨 Binance Security Incident: $6.3B Impact & User Funds Update🚨 Binance Security Incident Update — What Happened?
Binance has released an important security incident update dated October 30, 2026, providing more details about a recent security incident and the potential impact.
According to Binance’s initial investigation, the incident may have involved a compromised laptop belonging to a DevOps engineer. The attacker was reportedly able to gain access to a service container and submit unauthorized withdrawal transactions.
🔐 Were Binance Wallet Private Keys Leaked?
One of the most important points in Binance’s announcement is that the company has found no evidence of any wallet private key leak.
Binance says its investigation is still ongoing, and a detailed technical post-mortem will be published once the investigation is complete and all facts have been fully verified.
💰 Estimated Impact
Binance estimates the total impact of the incident at approximately $6.3 billion.
The exchange also stated that it has been working with blockchain partners to freeze affected assets. Around $3 billion has reportedly been frozen on-chain so far.
This shows that blockchain monitoring and cooperation between exchanges and blockchain partners can play an important role in responding to major security incidents.
🛡️ What About User Funds?
For Binance users, the most important message is clear:
Binance states that user funds are safe.
The company also says that it will cover all losses resulting from the incident using the SAFU fund and company funds.
Binance further plans to publish an updated Proof of Reserves after the remediation process is complete.
📢 What Happens Next?
The investigation is still ongoing. Binance says it will provide a detailed technical post-mortem after the facts have been fully verified.
For users, the best approach is to stay alert, follow official Binance announcements, and avoid believing unverified information or rumors circulating on social media.
Security incidents can create fear and uncertainty in the crypto market, but it is important to separate confirmed information from speculation.
Binance’s current statement says that user funds are safe and that the company will cover the losses associated with the incident.
#Binance #crypto #blockchain #SAFU #BinanceNews $BNB
{spot}(BNBUSDT)
🚨 Binance Security Incident: $6.3B Impact & User Funds Update
🚨 Binance Security Incident Update — What Happened?
Binance has released an important security incident update dated October 30, 2026, providing more details about a recent security incident and the potential impact.
According to Binance’s initial investigation, the incident may have involved a compromised laptop belonging to a DevOps engineer. The attacker was reportedly able to gain access to a service container and submit unauthorized withdrawal transactions.
🔐 Were Binance Wallet Private Keys Leaked?
One of the most important points in Binance’s announcement is that the company has found no evidence of any wallet private key leak.
Binance says its investigation is still ongoing, and a detailed technical post-mortem will be published once the investigation is complete and all facts have been fully verified.
💰 Estimated Impact
Binance estimates the total impact of the incident at approximately $6.3 billion.
The exchange also stated that it has been working with blockchain partners to freeze affected assets. Around $3 billion has reportedly been frozen on-chain so far.
This shows that blockchain monitoring and cooperation between exchanges and blockchain partners can play an important role in responding to major security incidents.
🛡️ What About User Funds?
For Binance users, the most important message is clear:
Binance states that user funds are safe.
The company also says that it will cover all losses resulting from the incident using the SAFU fund and company funds.
Binance further plans to publish an updated Proof of Reserves after the remediation process is complete.
📢 What Happens Next?
The investigation is still ongoing. Binance says it will provide a detailed technical post-mortem after the facts have been fully verified.
For users, the best approach is to stay alert, follow official Binance announcements, and avoid believing unverified information or rumors circulating on social media.
Security incidents can create fear and uncertainty in the crypto market, but it is important to separate confirmed information from speculation.
Binance’s current statement says that user funds are safe and that the company will cover the losses associated with the incident.
#Binance #crypto #blockchain #SAFU #BinanceNews $BNB
Binance has released an important security incident update dated October 30, 2026, providing more details about a recent security incident and the potential impact.
According to Binance’s initial investigation, the incident may have involved a compromised laptop belonging to a DevOps engineer. The attacker was reportedly able to gain access to a service container and submit unauthorized withdrawal transactions.
🔐 Were Binance Wallet Private Keys Leaked?
One of the most important points in Binance’s announcement is that the company has found no evidence of any wallet private key leak.
Binance says its investigation is still ongoing, and a detailed technical post-mortem will be published once the investigation is complete and all facts have been fully verified.
💰 Estimated Impact
Binance estimates the total impact of the incident at approximately $6.3 billion.
The exchange also stated that it has been working with blockchain partners to freeze affected assets. Around $3 billion has reportedly been frozen on-chain so far.
This shows that blockchain monitoring and cooperation between exchanges and blockchain partners can play an important role in responding to major security incidents.
🛡️ What About User Funds?
For Binance users, the most important message is clear:
Binance states that user funds are safe.
The company also says that it will cover all losses resulting from the incident using the SAFU fund and company funds.
Binance further plans to publish an updated Proof of Reserves after the remediation process is complete.
📢 What Happens Next?
The investigation is still ongoing. Binance says it will provide a detailed technical post-mortem after the facts have been fully verified.
For users, the best approach is to stay alert, follow official Binance announcements, and avoid believing unverified information or rumors circulating on social media.
Security incidents can create fear and uncertainty in the crypto market, but it is important to separate confirmed information from speculation.
Binance’s current statement says that user funds are safe and that the company will cover the losses associated with the incident.
#Binance #crypto #blockchain #SAFU #BinanceNews $BNB
372
·
--
Article
Tesla (TSLA) Price Analysis 📉: Can Tesla Recover or Drop Further? 🚀Tesla (TSLA) Stock Analysis: Strong Selling Pressure — Can TSLA Recover?
📊 Market Overview
Tesla (TSLA) is showing significant selling pressure in the chart provided. The displayed price is around $403.30, and several consecutive red candles indicate that sellers have been dominating the short-term price action.
The chart shows a sharp downward move followed by a small attempt at recovery. However, the latest green candles alone are not enough to confirm a trend reversal. Traders should watch the next few candles carefully to understand whether buyers are returning or sellers remain in control.
🔍 Technical Analysis
1. Short-Term Trend
The short-term trend appears bearish. The price is trading below the moving-average lines shown on the chart, while the yellow moving average is pointing downward. This suggests that downward momentum remains strong.
2. Support Levels
The recent low near the bottom of the chart is an important area to monitor. If the price holds above this area and buying volume increases, TSLA could attempt a short-term rebound.
However, if the recent low breaks, further downside may be possible. Traders should wait for price confirmation rather than assuming support will hold.
3. Resistance Levels
The first resistance area is near the recent consolidation zone around $405–$410. A stronger recovery would require the price to move above nearby resistance and sustain that move.
Higher moving-average lines may also act as resistance if the price attempts a larger recovery.
These price zones are approximate interpretations of the supplied screenshot, not confirmed live market levels.
📈 What Could Happen Next?
Bullish Scenario 🟢
If buyers step in, TSLA could recover from its recent lows and test nearby resistance. Increasing volume and consecutive strong green candles would provide better evidence of a potential rebound.
Bearish Scenario 🔴
If selling pressure continues and the recent low breaks, the stock could experience another downward move. Weak recovery attempts may allow sellers to remain in control.
💡 What Should Traders Watch?
* Price action around the recent low.
* Whether green candles show stronger buying volume.
* A possible breakout above nearby resistance.
* Moving-average direction and overall market sentiment.
* Confirmation before making any trading decision.
🧠 Final Thoughts
Tesla is currently showing a bearish short-term structure in the provided chart. Although a recovery is possible, buyers need to demonstrate stronger momentum before a bullish reversal can be confirmed.
Patience and risk management are important in volatile markets. Avoid making decisions based on a single candle, and remember that stock prices can change quickly.
💬 Join the Discussion
What do you think about Tesla’s next move?
🟢 Will TSLA recover from these levels?
🔴 Or will selling pressure continue?
Share your analysis and thoughts in the comments!
#Tesla #stockmarket #TechnicalAnalysis #trading #BinanceSquare $TSLA
{future}(TSLAUSDT)
Tesla (TSLA) Price Analysis 📉: Can Tesla Recover or Drop Further? 🚀
Tesla (TSLA) Stock Analysis: Strong Selling Pressure — Can TSLA Recover?
📊 Market Overview
Tesla (TSLA) is showing significant selling pressure in the chart provided. The displayed price is around $403.30, and several consecutive red candles indicate that sellers have been dominating the short-term price action.
The chart shows a sharp downward move followed by a small attempt at recovery. However, the latest green candles alone are not enough to confirm a trend reversal. Traders should watch the next few candles carefully to understand whether buyers are returning or sellers remain in control.
🔍 Technical Analysis
1. Short-Term Trend
The short-term trend appears bearish. The price is trading below the moving-average lines shown on the chart, while the yellow moving average is pointing downward. This suggests that downward momentum remains strong.
2. Support Levels
The recent low near the bottom of the chart is an important area to monitor. If the price holds above this area and buying volume increases, TSLA could attempt a short-term rebound.
However, if the recent low breaks, further downside may be possible. Traders should wait for price confirmation rather than assuming support will hold.
3. Resistance Levels
The first resistance area is near the recent consolidation zone around $405–$410. A stronger recovery would require the price to move above nearby resistance and sustain that move.
Higher moving-average lines may also act as resistance if the price attempts a larger recovery.
These price zones are approximate interpretations of the supplied screenshot, not confirmed live market levels.
📈 What Could Happen Next?
Bullish Scenario 🟢
If buyers step in, TSLA could recover from its recent lows and test nearby resistance. Increasing volume and consecutive strong green candles would provide better evidence of a potential rebound.
Bearish Scenario 🔴
If selling pressure continues and the recent low breaks, the stock could experience another downward move. Weak recovery attempts may allow sellers to remain in control.
💡 What Should Traders Watch?
* Price action around the recent low.
* Whether green candles show stronger buying volume.
* A possible breakout above nearby resistance.
* Moving-average direction and overall market sentiment.
* Confirmation before making any trading decision.
🧠 Final Thoughts
Tesla is currently showing a bearish short-term structure in the provided chart. Although a recovery is possible, buyers need to demonstrate stronger momentum before a bullish reversal can be confirmed.
Patience and risk management are important in volatile markets. Avoid making decisions based on a single candle, and remember that stock prices can change quickly.
💬 Join the Discussion
What do you think about Tesla’s next move?
🟢 Will TSLA recover from these levels?
🔴 Or will selling pressure continue?
Share your analysis and thoughts in the comments!
#Tesla #stockmarket #TechnicalAnalysis #trading #BinanceSquare $TSLA
📊 Market Overview
Tesla (TSLA) is showing significant selling pressure in the chart provided. The displayed price is around $403.30, and several consecutive red candles indicate that sellers have been dominating the short-term price action.
The chart shows a sharp downward move followed by a small attempt at recovery. However, the latest green candles alone are not enough to confirm a trend reversal. Traders should watch the next few candles carefully to understand whether buyers are returning or sellers remain in control.
🔍 Technical Analysis
1. Short-Term Trend
The short-term trend appears bearish. The price is trading below the moving-average lines shown on the chart, while the yellow moving average is pointing downward. This suggests that downward momentum remains strong.
2. Support Levels
The recent low near the bottom of the chart is an important area to monitor. If the price holds above this area and buying volume increases, TSLA could attempt a short-term rebound.
However, if the recent low breaks, further downside may be possible. Traders should wait for price confirmation rather than assuming support will hold.
3. Resistance Levels
The first resistance area is near the recent consolidation zone around $405–$410. A stronger recovery would require the price to move above nearby resistance and sustain that move.
Higher moving-average lines may also act as resistance if the price attempts a larger recovery.
These price zones are approximate interpretations of the supplied screenshot, not confirmed live market levels.
📈 What Could Happen Next?
Bullish Scenario 🟢
If buyers step in, TSLA could recover from its recent lows and test nearby resistance. Increasing volume and consecutive strong green candles would provide better evidence of a potential rebound.
Bearish Scenario 🔴
If selling pressure continues and the recent low breaks, the stock could experience another downward move. Weak recovery attempts may allow sellers to remain in control.
💡 What Should Traders Watch?
* Price action around the recent low.
* Whether green candles show stronger buying volume.
* A possible breakout above nearby resistance.
* Moving-average direction and overall market sentiment.
* Confirmation before making any trading decision.
🧠 Final Thoughts
Tesla is currently showing a bearish short-term structure in the provided chart. Although a recovery is possible, buyers need to demonstrate stronger momentum before a bullish reversal can be confirmed.
Patience and risk management are important in volatile markets. Avoid making decisions based on a single candle, and remember that stock prices can change quickly.
💬 Join the Discussion
What do you think about Tesla’s next move?
🟢 Will TSLA recover from these levels?
🔴 Or will selling pressure continue?
Share your analysis and thoughts in the comments!
#Tesla #stockmarket #TechnicalAnalysis #trading #BinanceSquare $TSLA
299
·
--
Article
Gold Price Analysis 📉: Will GOLD Recover or Drop Further?Gold Price Analysis: Can GOLD Recover After the Recent Drop?
Market Overview
Gold (GOLD) was trading around $38.55 in the shared screenshot, showing a decline of approximately 1.25%. The chart indicates short-term selling pressure, with several red candles appearing after a brief recovery.
Technical Analysis
* Current Price: $38.55
* Resistance: $38.80–$39.00
* Support: Around $38.10–$38.30
* Trend: Short-term bearish pressure
The price is trading below several moving-average lines, suggesting that sellers currently have the advantage. If the price holds above support, a recovery may be possible. However, a break below support could lead to further downside.
What Should Traders Watch?
Traders should watch whether GOLD can recover above nearby resistance or continues to make lower lows. Confirmation from the next candles and trading volume may help clarify the direction.
Your Opinion Matters!
Do you think GOLD will recover, or will sellers push the price lower? Share your thoughts in the comments!#GoldAnalysis #trading #MarketUpdate #BinanceSquare $GOLD.US
{stock_us}(GOLD.US)
Gold Price Analysis 📉: Will GOLD Recover or Drop Further?
Gold Price Analysis: Can GOLD Recover After the Recent Drop?
Market Overview
Gold (GOLD) was trading around $38.55 in the shared screenshot, showing a decline of approximately 1.25%. The chart indicates short-term selling pressure, with several red candles appearing after a brief recovery.
Technical Analysis
* Current Price: $38.55
* Resistance: $38.80–$39.00
* Support: Around $38.10–$38.30
* Trend: Short-term bearish pressure
The price is trading below several moving-average lines, suggesting that sellers currently have the advantage. If the price holds above support, a recovery may be possible. However, a break below support could lead to further downside.
What Should Traders Watch?
Traders should watch whether GOLD can recover above nearby resistance or continues to make lower lows. Confirmation from the next candles and trading volume may help clarify the direction.
Your Opinion Matters!
Do you think GOLD will recover, or will sellers push the price lower? Share your thoughts in the comments!#GoldAnalysis #trading #MarketUpdate #BinanceSquare $GOLD.US
Market Overview
Gold (GOLD) was trading around $38.55 in the shared screenshot, showing a decline of approximately 1.25%. The chart indicates short-term selling pressure, with several red candles appearing after a brief recovery.
Technical Analysis
* Current Price: $38.55
* Resistance: $38.80–$39.00
* Support: Around $38.10–$38.30
* Trend: Short-term bearish pressure
The price is trading below several moving-average lines, suggesting that sellers currently have the advantage. If the price holds above support, a recovery may be possible. However, a break below support could lead to further downside.
What Should Traders Watch?
Traders should watch whether GOLD can recover above nearby resistance or continues to make lower lows. Confirmation from the next candles and trading volume may help clarify the direction.
Your Opinion Matters!
Do you think GOLD will recover, or will sellers push the price lower? Share your thoughts in the comments!#GoldAnalysis #trading #MarketUpdate #BinanceSquare $GOLD.US
GOLDUS+0.78%
192
·
--
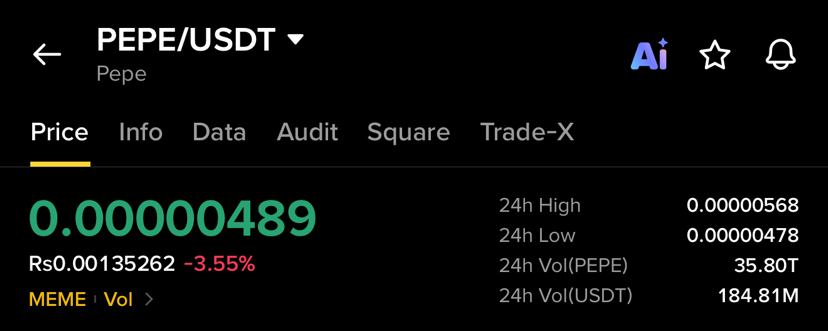
Article
🐸 PEPE/USDT 4H Analysis: Can PEPE Reclaim 0.00000500?🐸 PEPE/USDT 4H Technical Analysis: Can PEPE Recover Above 0.00000500?
PEPE/USDT is currently trading around 0.00000489, after experiencing a noticeable pullback from the recent highs. The 4H chart shows that PEPE had a strong recovery from the 0.00000420–0.00000440 region, but the price faced significant selling pressure after reaching the 0.00000550–0.00000560 area.
The recent price action is particularly interesting because PEPE is now testing an important support zone around 0.00000480–0.00000490. The reaction from this area could provide a clearer indication of the next short-term direction.
📊 Recent Price Action
PEPE spent several candles consolidating around the 0.00000420–0.00000440 region before buyers started gaining momentum.
The recovery then accelerated as the price moved above 0.00000460 and later approached the 0.00000500 level. Buyers continued pushing higher, with PEPE eventually reaching approximately 0.00000550+.
However, the move was followed by a strong rejection. The latest red candle brought the price back toward 0.00000490, showing that sellers remain active around the higher levels.
The increased volume during the recent move also suggests that market participation has increased, meaning the next few 4H candles could be important for determining whether PEPE is preparing for another recovery attempt or entering a deeper correction.
🟢 Bullish Scenario
The first important level to watch is 0.00000480–0.00000490.
If PEPE continues holding this area and buyers step in, the price could attempt to reclaim 0.00000500.
A sustained move above 0.00000500 would improve the short-term structure and could open the way toward:
0.00000520 → 0.00000540 → 0.00000550–0.00000560
The 0.00000550–0.00000560 region is particularly important because it recently acted as a strong rejection area.
A convincing breakout above that zone, preferably supported by strong volume, could indicate that buyers are regaining control.
🔴 Bearish Scenario
On the other hand, if PEPE fails to hold the 0.00000480 support area, the recent recovery could lose momentum.
In that situation, the next areas to watch would be around:
0.00000460 → 0.00000440 → 0.00000420
A move back toward 0.00000440–0.00000420 would mean that a significant portion of the recent recovery has been retraced.
Therefore, the reaction around 0.00000480 is important for the short-term setup.
📌 Important Levels to Watch
Resistance:
🔹 0.00000500
🔹 0.00000520
🔹 0.00000540
🔹 0.00000550–0.00000560
Support:
🔹 0.00000480
🔹 0.00000460
🔹 0.00000440
🔹 0.00000420
📈 Volume & Momentum
One of the notable features of the chart is the increase in trading volume during the recent upward move and subsequent rejection.
Higher volume can indicate stronger participation, but volume alone does not confirm the direction of the next move. For that reason, traders may want to watch how price reacts to the key support and resistance zones rather than relying on a single candle.
The current structure shows that PEPE has already demonstrated strong buying interest from the lower levels, but sellers have also shown strength near 0.00000550.
🔎 What Could Happen Next?
The market is currently sitting between an important support zone and the psychological 0.00000500 level.
If buyers defend 0.00000480–0.00000490, PEPE could attempt another move toward 0.00000500 and potentially retest the recent highs.
If sellers push the price below support with strong volume, the market could instead move toward 0.00000460 and lower support levels.
For now, the 0.00000480–0.00000500 range is the key area to watch.
🐸 Final View
PEPE remains highly volatile, and the 4H chart is showing a battle between buyers defending the recent recovery and sellers protecting the higher resistance zone.
The most important confirmation would be a clear reaction from 0.00000480 or a strong reclaim of 0.00000500.
Until that happens, patience and confirmation may be more important than reacting to short-term price movements.
PEPE is at an interesting decision zone — the next strong 4H move could provide a clearer signal of whether the recent rally can continue or whether a deeper correction is developing. 📊🐸
PEPE article ke liye ye hashtags lagao 👇
#PEPE #PEPEUSDT #PEPECoin #Crypto #Binance #TechnicalAnalysis #CryptoAnalysis
Agar sirf 5 tags allowed hon to:
#pepe #PEPEUSDT #crypto #Binance #TechnicalAnalysis
{spot}(PEPEUSDT)
🐸 PEPE/USDT 4H Analysis: Can PEPE Reclaim 0.00000500?
🐸 PEPE/USDT 4H Technical Analysis: Can PEPE Recover Above 0.00000500?
PEPE/USDT is currently trading around 0.00000489, after experiencing a noticeable pullback from the recent highs. The 4H chart shows that PEPE had a strong recovery from the 0.00000420–0.00000440 region, but the price faced significant selling pressure after reaching the 0.00000550–0.00000560 area.
The recent price action is particularly interesting because PEPE is now testing an important support zone around 0.00000480–0.00000490. The reaction from this area could provide a clearer indication of the next short-term direction.
📊 Recent Price Action
PEPE spent several candles consolidating around the 0.00000420–0.00000440 region before buyers started gaining momentum.
The recovery then accelerated as the price moved above 0.00000460 and later approached the 0.00000500 level. Buyers continued pushing higher, with PEPE eventually reaching approximately 0.00000550+.
However, the move was followed by a strong rejection. The latest red candle brought the price back toward 0.00000490, showing that sellers remain active around the higher levels.
The increased volume during the recent move also suggests that market participation has increased, meaning the next few 4H candles could be important for determining whether PEPE is preparing for another recovery attempt or entering a deeper correction.
🟢 Bullish Scenario
The first important level to watch is 0.00000480–0.00000490.
If PEPE continues holding this area and buyers step in, the price could attempt to reclaim 0.00000500.
A sustained move above 0.00000500 would improve the short-term structure and could open the way toward:
0.00000520 → 0.00000540 → 0.00000550–0.00000560
The 0.00000550–0.00000560 region is particularly important because it recently acted as a strong rejection area.
A convincing breakout above that zone, preferably supported by strong volume, could indicate that buyers are regaining control.
🔴 Bearish Scenario
On the other hand, if PEPE fails to hold the 0.00000480 support area, the recent recovery could lose momentum.
In that situation, the next areas to watch would be around:
0.00000460 → 0.00000440 → 0.00000420
A move back toward 0.00000440–0.00000420 would mean that a significant portion of the recent recovery has been retraced.
Therefore, the reaction around 0.00000480 is important for the short-term setup.
📌 Important Levels to Watch
Resistance:
🔹 0.00000500
🔹 0.00000520
🔹 0.00000540
🔹 0.00000550–0.00000560
Support:
🔹 0.00000480
🔹 0.00000460
🔹 0.00000440
🔹 0.00000420
📈 Volume & Momentum
One of the notable features of the chart is the increase in trading volume during the recent upward move and subsequent rejection.
Higher volume can indicate stronger participation, but volume alone does not confirm the direction of the next move. For that reason, traders may want to watch how price reacts to the key support and resistance zones rather than relying on a single candle.
The current structure shows that PEPE has already demonstrated strong buying interest from the lower levels, but sellers have also shown strength near 0.00000550.
🔎 What Could Happen Next?
The market is currently sitting between an important support zone and the psychological 0.00000500 level.
If buyers defend 0.00000480–0.00000490, PEPE could attempt another move toward 0.00000500 and potentially retest the recent highs.
If sellers push the price below support with strong volume, the market could instead move toward 0.00000460 and lower support levels.
For now, the 0.00000480–0.00000500 range is the key area to watch.
🐸 Final View
PEPE remains highly volatile, and the 4H chart is showing a battle between buyers defending the recent recovery and sellers protecting the higher resistance zone.
The most important confirmation would be a clear reaction from 0.00000480 or a strong reclaim of 0.00000500.
Until that happens, patience and confirmation may be more important than reacting to short-term price movements.
PEPE is at an interesting decision zone — the next strong 4H move could provide a clearer signal of whether the recent rally can continue or whether a deeper correction is developing. 📊🐸
PEPE article ke liye ye hashtags lagao 👇
#PEPE #PEPEUSDT #PEPECoin #Crypto #Binance #TechnicalAnalysis #CryptoAnalysis
Agar sirf 5 tags allowed hon to:
#pepe #PEPEUSDT #crypto #Binance #TechnicalAnalysis
PEPE/USDT is currently trading around 0.00000489, after experiencing a noticeable pullback from the recent highs. The 4H chart shows that PEPE had a strong recovery from the 0.00000420–0.00000440 region, but the price faced significant selling pressure after reaching the 0.00000550–0.00000560 area.
The recent price action is particularly interesting because PEPE is now testing an important support zone around 0.00000480–0.00000490. The reaction from this area could provide a clearer indication of the next short-term direction.
📊 Recent Price Action
PEPE spent several candles consolidating around the 0.00000420–0.00000440 region before buyers started gaining momentum.
The recovery then accelerated as the price moved above 0.00000460 and later approached the 0.00000500 level. Buyers continued pushing higher, with PEPE eventually reaching approximately 0.00000550+.
However, the move was followed by a strong rejection. The latest red candle brought the price back toward 0.00000490, showing that sellers remain active around the higher levels.
The increased volume during the recent move also suggests that market participation has increased, meaning the next few 4H candles could be important for determining whether PEPE is preparing for another recovery attempt or entering a deeper correction.
🟢 Bullish Scenario
The first important level to watch is 0.00000480–0.00000490.
If PEPE continues holding this area and buyers step in, the price could attempt to reclaim 0.00000500.
A sustained move above 0.00000500 would improve the short-term structure and could open the way toward:
0.00000520 → 0.00000540 → 0.00000550–0.00000560
The 0.00000550–0.00000560 region is particularly important because it recently acted as a strong rejection area.
A convincing breakout above that zone, preferably supported by strong volume, could indicate that buyers are regaining control.
🔴 Bearish Scenario
On the other hand, if PEPE fails to hold the 0.00000480 support area, the recent recovery could lose momentum.
In that situation, the next areas to watch would be around:
0.00000460 → 0.00000440 → 0.00000420
A move back toward 0.00000440–0.00000420 would mean that a significant portion of the recent recovery has been retraced.
Therefore, the reaction around 0.00000480 is important for the short-term setup.
📌 Important Levels to Watch
Resistance:
🔹 0.00000500
🔹 0.00000520
🔹 0.00000540
🔹 0.00000550–0.00000560
Support:
🔹 0.00000480
🔹 0.00000460
🔹 0.00000440
🔹 0.00000420
📈 Volume & Momentum
One of the notable features of the chart is the increase in trading volume during the recent upward move and subsequent rejection.
Higher volume can indicate stronger participation, but volume alone does not confirm the direction of the next move. For that reason, traders may want to watch how price reacts to the key support and resistance zones rather than relying on a single candle.
The current structure shows that PEPE has already demonstrated strong buying interest from the lower levels, but sellers have also shown strength near 0.00000550.
🔎 What Could Happen Next?
The market is currently sitting between an important support zone and the psychological 0.00000500 level.
If buyers defend 0.00000480–0.00000490, PEPE could attempt another move toward 0.00000500 and potentially retest the recent highs.
If sellers push the price below support with strong volume, the market could instead move toward 0.00000460 and lower support levels.
For now, the 0.00000480–0.00000500 range is the key area to watch.
🐸 Final View
PEPE remains highly volatile, and the 4H chart is showing a battle between buyers defending the recent recovery and sellers protecting the higher resistance zone.
The most important confirmation would be a clear reaction from 0.00000480 or a strong reclaim of 0.00000500.
Until that happens, patience and confirmation may be more important than reacting to short-term price movements.
PEPE is at an interesting decision zone — the next strong 4H move could provide a clearer signal of whether the recent rally can continue or whether a deeper correction is developing. 📊🐸
PEPE article ke liye ye hashtags lagao 👇
#PEPE #PEPEUSDT #PEPECoin #Crypto #Binance #TechnicalAnalysis #CryptoAnalysis
Agar sirf 5 tags allowed hon to:
#pepe #PEPEUSDT #crypto #Binance #TechnicalAnalysis
2
853
·
--
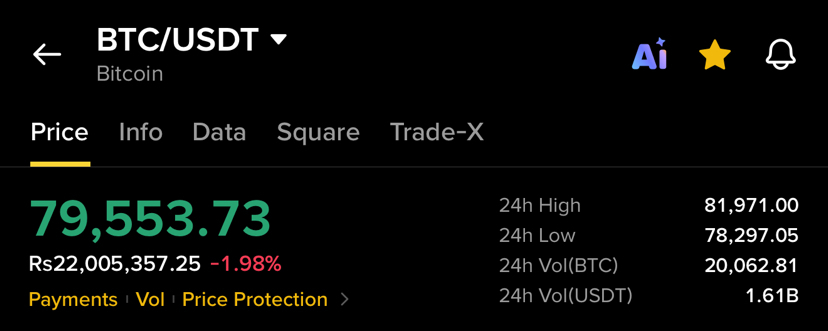
Article
BTC/USDT 1H Analysis: Can Bitcoin Reclaim $80K? 🔥Bitcoin (BTC/USDT) 1H Analysis 📊
Bitcoin is currently trading around $79,553, after a sharp move lower on the 1H chart.
The chart shows strong selling pressure from the $81,700–$81,900 area, followed by a significant bearish candle that pushed BTC down toward the $78,300 zone. The move was accompanied by a noticeable increase in volume, showing strong market activity during the drop.
However, BTC has started to recover from the lows and is currently holding near the $79,500 area. This bounce suggests that buyers are attempting to defend the lower levels.
🔎 Key Levels
Resistance:
• $80,000
• $80,500
• $81,000–$81,500
Support:
• $79,000
• $78,500
• $78,300
If BTC can reclaim and hold above $80,000, the price could attempt another move toward $80,500–$81,000.
On the other hand, failure to hold the $79,000–$78,500 support zone could bring the recent low around $78,300 back into focus.
📌 Market View
For now, the 1H chart remains volatile and slightly bearish after the sharp sell-off. The recent bounce is positive, but confirmation above key resistance would be important before expecting a stronger recovery.
Traders should watch volume, support/resistance levels, and the next few 1H candles for confirmation rather than reacting to a single candle.
BTC is at a key decision zone — the next move could depend on whether buyers can reclaim $80K or sellers push price back toward the recent lows. 📈📉
Haan 👍 Is BTC article ke liye ye tags best rahenge:
#Bitcoin #BTC #BTCUSDT #Crypto #Binance #MarketAnalysis #TechnicalAnalysis #CryptoTrading
Agar Binance mein sirf 3–5 tags rakhne hain to ye lagao:
#Bitcoin❗ #BTC☀ #crypto #Binance #TechnicalAnalysis
{spot}(BTCUSDT)
BTC/USDT 1H Analysis: Can Bitcoin Reclaim $80K? 🔥
Bitcoin (BTC/USDT) 1H Analysis 📊
Bitcoin is currently trading around $79,553, after a sharp move lower on the 1H chart.
The chart shows strong selling pressure from the $81,700–$81,900 area, followed by a significant bearish candle that pushed BTC down toward the $78,300 zone. The move was accompanied by a noticeable increase in volume, showing strong market activity during the drop.
However, BTC has started to recover from the lows and is currently holding near the $79,500 area. This bounce suggests that buyers are attempting to defend the lower levels.
🔎 Key Levels
Resistance:
• $80,000
• $80,500
• $81,000–$81,500
Support:
• $79,000
• $78,500
• $78,300
If BTC can reclaim and hold above $80,000, the price could attempt another move toward $80,500–$81,000.
On the other hand, failure to hold the $79,000–$78,500 support zone could bring the recent low around $78,300 back into focus.
📌 Market View
For now, the 1H chart remains volatile and slightly bearish after the sharp sell-off. The recent bounce is positive, but confirmation above key resistance would be important before expecting a stronger recovery.
Traders should watch volume, support/resistance levels, and the next few 1H candles for confirmation rather than reacting to a single candle.
BTC is at a key decision zone — the next move could depend on whether buyers can reclaim $80K or sellers push price back toward the recent lows. 📈📉
Haan 👍 Is BTC article ke liye ye tags best rahenge:
#Bitcoin #BTC #BTCUSDT #Crypto #Binance #MarketAnalysis #TechnicalAnalysis #CryptoTrading
Agar Binance mein sirf 3–5 tags rakhne hain to ye lagao:
#Bitcoin❗ #BTC☀ #crypto #Binance #TechnicalAnalysis
Bitcoin is currently trading around $79,553, after a sharp move lower on the 1H chart.
The chart shows strong selling pressure from the $81,700–$81,900 area, followed by a significant bearish candle that pushed BTC down toward the $78,300 zone. The move was accompanied by a noticeable increase in volume, showing strong market activity during the drop.
However, BTC has started to recover from the lows and is currently holding near the $79,500 area. This bounce suggests that buyers are attempting to defend the lower levels.
🔎 Key Levels
Resistance:
• $80,000
• $80,500
• $81,000–$81,500
Support:
• $79,000
• $78,500
• $78,300
If BTC can reclaim and hold above $80,000, the price could attempt another move toward $80,500–$81,000.
On the other hand, failure to hold the $79,000–$78,500 support zone could bring the recent low around $78,300 back into focus.
📌 Market View
For now, the 1H chart remains volatile and slightly bearish after the sharp sell-off. The recent bounce is positive, but confirmation above key resistance would be important before expecting a stronger recovery.
Traders should watch volume, support/resistance levels, and the next few 1H candles for confirmation rather than reacting to a single candle.
BTC is at a key decision zone — the next move could depend on whether buyers can reclaim $80K or sellers push price back toward the recent lows. 📈📉
Haan 👍 Is BTC article ke liye ye tags best rahenge:
#Bitcoin #BTC #BTCUSDT #Crypto #Binance #MarketAnalysis #TechnicalAnalysis #CryptoTrading
Agar Binance mein sirf 3–5 tags rakhne hain to ye lagao:
#Bitcoin❗ #BTC☀ #crypto #Binance #TechnicalAnalysis
2
1
687
·
--
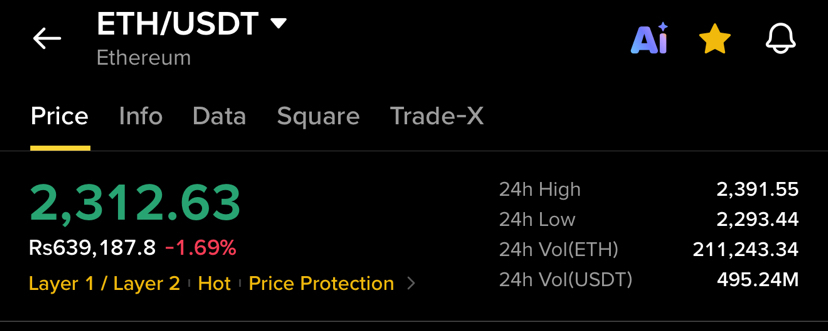
Article
ETH Price Prediction 🚀 Recovery or More Dump?ETH Price Analysis 📉 Will Ethereum Recover or Drop Further?
Ethereum (ETH) is trading around $2,312.63, showing a decline of approximately 0.45% on the displayed chart. Recent candles indicate strong selling pressure after rejection near the $2,350–$2,380 zone.
📊 Key Support & Resistance Levels
🔹 Support: $2,300
🔹 Resistance: $2,330
🔹 Major Resistance: $2,350–$2,380
📉 Bearish Scenario: If ETH breaks below $2,300, further downside could follow.
📈 Bullish Scenario: If buyers regain control and push ETH above $2,330, a recovery toward $2,350 may be possible.
👀 My View: ETH is testing an important support area. Watch the next 1H candle for confirmation before making any decision.
🚀 What do you think? Will ETH bounce back or continue falling?
Share your opinion in the comments!
#ETH #Ethereum #ETHUSDT #CryptoAnalysis" $ETH
{spot}(ETHUSDT)
ETH Price Prediction 🚀 Recovery or More Dump?
ETH Price Analysis 📉 Will Ethereum Recover or Drop Further?
Ethereum (ETH) is trading around $2,312.63, showing a decline of approximately 0.45% on the displayed chart. Recent candles indicate strong selling pressure after rejection near the $2,350–$2,380 zone.
📊 Key Support & Resistance Levels
🔹 Support: $2,300
🔹 Resistance: $2,330
🔹 Major Resistance: $2,350–$2,380
📉 Bearish Scenario: If ETH breaks below $2,300, further downside could follow.
📈 Bullish Scenario: If buyers regain control and push ETH above $2,330, a recovery toward $2,350 may be possible.
👀 My View: ETH is testing an important support area. Watch the next 1H candle for confirmation before making any decision.
🚀 What do you think? Will ETH bounce back or continue falling?
Share your opinion in the comments!
#ETH #Ethereum #ETHUSDT #CryptoAnalysis" $ETH
Ethereum (ETH) is trading around $2,312.63, showing a decline of approximately 0.45% on the displayed chart. Recent candles indicate strong selling pressure after rejection near the $2,350–$2,380 zone.
📊 Key Support & Resistance Levels
🔹 Support: $2,300
🔹 Resistance: $2,330
🔹 Major Resistance: $2,350–$2,380
📉 Bearish Scenario: If ETH breaks below $2,300, further downside could follow.
📈 Bullish Scenario: If buyers regain control and push ETH above $2,330, a recovery toward $2,350 may be possible.
👀 My View: ETH is testing an important support area. Watch the next 1H candle for confirmation before making any decision.
🚀 What do you think? Will ETH bounce back or continue falling?
Share your opinion in the comments!
#ETH #Ethereum #ETHUSDT #CryptoAnalysis" $ETH
49
·
--
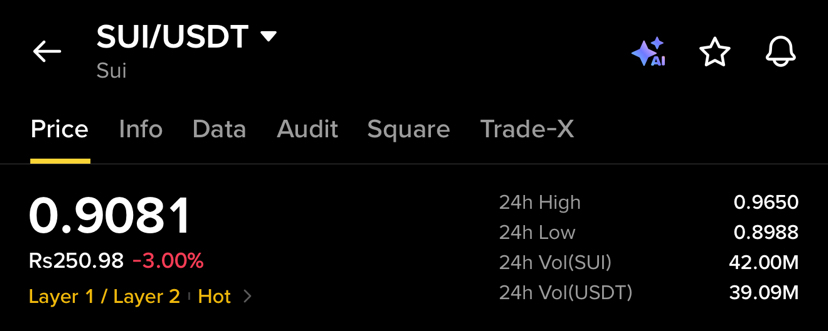
Article
SUI Price Prediction 🚀 Bounce Back or More Dump?SUI/USDT Price Analysis: Will SUI Recover or Drop Further?
SUI/USDT is trading around 0.9081 USDT, down approximately 0.88% on the displayed chart. Recent candles show strong selling pressure after rejection near the 0.95 level.
📊 Key Levels
* Support: 0.9000
* Resistance: 0.9200
* Major Resistance: 0.9400–0.9500
📉 Bearish Scenario: If SUI breaks below 0.9000, further downside may be possible.
📈 Bullish Scenario: If buyers push the price above 0.9200, a recovery toward 0.9400 could develop.
👀 My View: SUI is at an important support zone. Watch the next 1H candle for confirmation before making any decision.
What do you think? Will SUI bounce back or break below support?
Share your thoughts in the comments! 🚀
#SUI🔥 #SUIUSDT #BinanceSquare #CryptoAnalysis📈📉🐋📅🚀 #CryptoMarket $SUI
{spot}(SUIUSDT)
SUI Price Prediction 🚀 Bounce Back or More Dump?
SUI/USDT Price Analysis: Will SUI Recover or Drop Further?
SUI/USDT is trading around 0.9081 USDT, down approximately 0.88% on the displayed chart. Recent candles show strong selling pressure after rejection near the 0.95 level.
📊 Key Levels
* Support: 0.9000
* Resistance: 0.9200
* Major Resistance: 0.9400–0.9500
📉 Bearish Scenario: If SUI breaks below 0.9000, further downside may be possible.
📈 Bullish Scenario: If buyers push the price above 0.9200, a recovery toward 0.9400 could develop.
👀 My View: SUI is at an important support zone. Watch the next 1H candle for confirmation before making any decision.
What do you think? Will SUI bounce back or break below support?
Share your thoughts in the comments! 🚀
#SUI🔥 #SUIUSDT #BinanceSquare #CryptoAnalysis📈📉🐋📅🚀 #CryptoMarket $SUI
SUI/USDT is trading around 0.9081 USDT, down approximately 0.88% on the displayed chart. Recent candles show strong selling pressure after rejection near the 0.95 level.
📊 Key Levels
* Support: 0.9000
* Resistance: 0.9200
* Major Resistance: 0.9400–0.9500
📉 Bearish Scenario: If SUI breaks below 0.9000, further downside may be possible.
📈 Bullish Scenario: If buyers push the price above 0.9200, a recovery toward 0.9400 could develop.
👀 My View: SUI is at an important support zone. Watch the next 1H candle for confirmation before making any decision.
What do you think? Will SUI bounce back or break below support?
Share your thoughts in the comments! 🚀
#SUI🔥 #SUIUSDT #BinanceSquare #CryptoAnalysis📈📉🐋📅🚀 #CryptoMarket $SUI
162
Log in to explore more content
Join global crypto users on Binance Square
⚡️ Get latest and useful information about crypto.
💬 Trusted by the world’s largest crypto exchange.
👍 Discover real insights from verified creators.
Email / Phone number
Trending Topics
BinanceReopensWithdrawalsForMoreAssets
937,137 views
4,805 Discussing
Security Incident | Recovery Update #8: Withdrawals for More Assets to Reopen (2026-11-05)
Binance Announcement
·438 Likes
·2M views
Binance98PercentReplenished
237,743 views
1,984 Discussing
USStocksSlipandCryptoMarketUnderBroadPressure
36,008 views
321 Discussing