Binance Square
#sp500slipsfridaythirdstraightweeklygain

sp500slipsfridaythirdstraightweeklygain

36,663 views
227 Discussing
Vinhtocdo
·
--
Bullish
Verified
Bitcoin Up or Down on August 15?

Bitcoin Up or Down on August 15?

99%Up1%Down
Volume $131,462.6
Verified
#sp500slipsfridaythirdstraightweeklygain Market wrap – Fri close:S&P -0.18% to 7,784… after yday’s ATH (7,799). Soft retail + weak consumer vibes, but market shrugged & kept the AI party going.Reddit +15% on S&P inclusion. AMAT got clapped for “good but not god-tier” nums…My take: Pure AI hopium + “Fed ain’t hiking” energy. Classic “this is fine” dog mode. Fun while it lasts… until it doesn’t.$DOS $GRIFFAIN $FOLKS
If you're still treating every S&P dip like automatic altcoin fuel, stop now. The painful trade is buying $BTC or $ETH because “stocks were green all week,” then watching Friday risk-off turn your entry into exit liquidity. Macro is still driving crypto mood, and with Fear & Greed sitting in Fear, traders are not exactly YOLO-ing like it’s 2021. The S&P 500 slipping Friday after a third straight weekly gain feels small, but the setup matters. We’ve seen this movie before: equities grind higher on rate-cut hopes, crypto front-runs the party, then one weak session reminds everyone that liquidity narratives can flip faster than a meme coin roadmap. The difference now is positioning. In 2023, dips often got bought because cash was waiting and AI stocks carried sentiment. Today, $USDT searches are hot, which tells me people are watching from the sidelines, not blindly aping every green candle. So is this just a healthy pause before risk assets continue higher, or the early crack before crypto gives back the recent bounce? #SP500SlipsFridayThirdStraightWeeklyGain #TradersCutFedRateHikeBetsBeforeMid2027 #DollarFallsToMayLow
If you're still treating every S&P dip like automatic altcoin fuel, stop now.

The painful trade is buying $BTC or $ETH because “stocks were green all week,” then watching Friday risk-off turn your entry into exit liquidity. Macro is still driving crypto mood, and with Fear & Greed sitting in Fear, traders are not exactly YOLO-ing like it’s 2021.

The S&P 500 slipping Friday after a third straight weekly gain feels small, but the setup matters. We’ve seen this movie before: equities grind higher on rate-cut hopes, crypto front-runs the party, then one weak session reminds everyone that liquidity narratives can flip faster than a meme coin roadmap.

The difference now is positioning. In 2023, dips often got bought because cash was waiting and AI stocks carried sentiment. Today, $USDT searches are hot, which tells me people are watching from the sidelines, not blindly aping every green candle.

So is this just a healthy pause before risk assets continue higher, or the early crack before crypto gives back the recent bounce? #SP500SlipsFridayThirdStraightWeeklyGain #TradersCutFedRateHikeBetsBeforeMid2027 #DollarFallsToMayLow
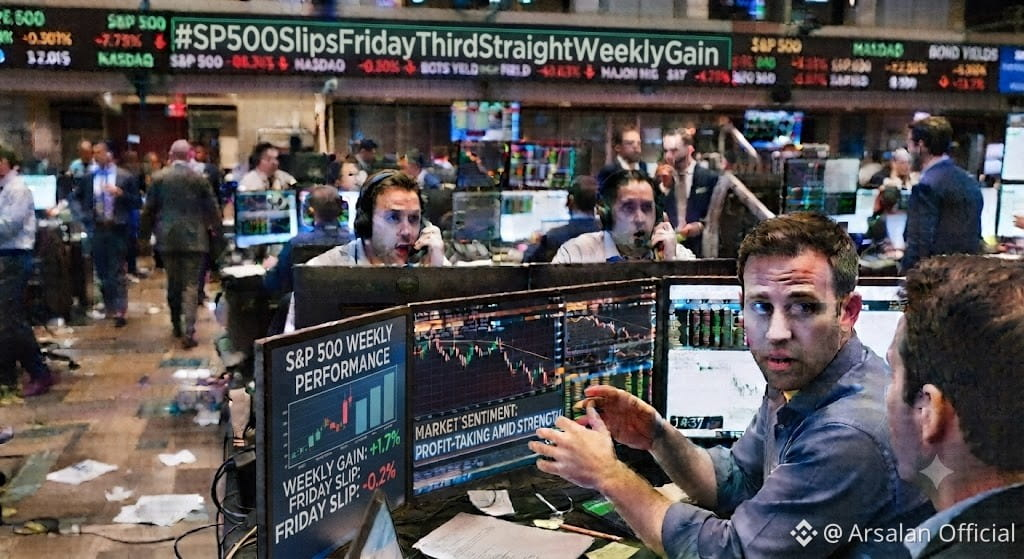
#SP500SlipsFridayThirdStraightWeeklyGain That headline means: the S&P 500 fell on Friday, but still finished the week higher overall, and that marked its third consecutive weekly gain. So the key message is: one weak day did not stop the broader short-term upward trend. How traders usually read it: “slips Friday” = short-term weakness or profit-taking at the end of the week. “third straight weekly gain” = the broader market trend over the last three weeks has still been positive. Why this matters: It suggests equities may still have underlying support even if daily momentum softens. Sometimes this kind of headline reflects a market that is climbing gradually but not in a straight line. For crypto: a steady equity backdrop can be mildly supportive for risk assets, but a down Friday can also signal some near-term caution. The net effect depends on whether the decline was just routine profit-taking or part of a bigger risk-off move. So the headline is basically saying: stocks dipped at the end of the week, but the overall weekly trend remained positive for a third week in a row.$BTC {spot}(BTCUSDT) $SPX {future}(SPXUSDT) $SPYB {spot}(SPYBUSDT)
#SP500SlipsFridayThirdStraightWeeklyGain That headline means:
the S&P 500 fell on Friday,
but still finished the week higher overall,
and that marked its third consecutive weekly gain.

So the key message is: one weak day did not stop the broader short-term upward trend.

How traders usually read it:
“slips Friday” = short-term weakness or profit-taking at the end of the week.
“third straight weekly gain” = the broader market trend over the last three weeks has still been positive.

Why this matters:
It suggests equities may still have underlying support even if daily momentum softens.
Sometimes this kind of headline reflects a market that is climbing gradually but not in a straight line.

For crypto:
a steady equity backdrop can be mildly supportive for risk assets,
but a down Friday can also signal some near-term caution.
The net effect depends on whether the decline was just routine profit-taking or part of a bigger risk-off move.

So the headline is basically saying: stocks dipped at the end of the week, but the overall weekly trend remained positive for a third week in a row.$BTC

$SPX

$SPYB
·
--
Bullish
Verified
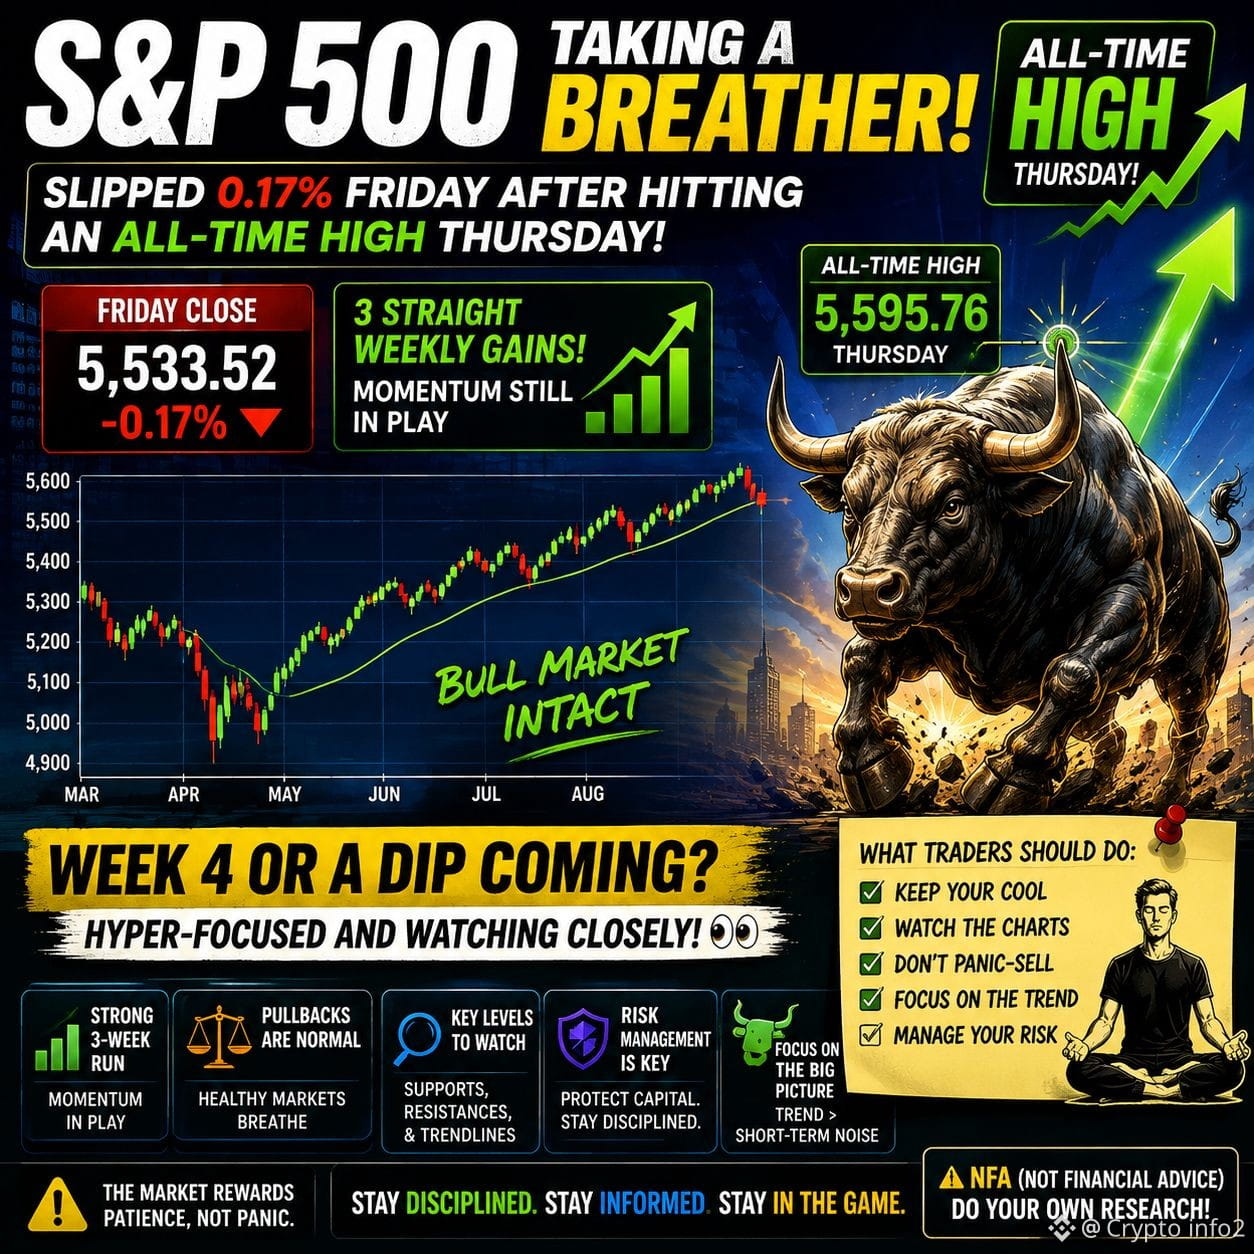
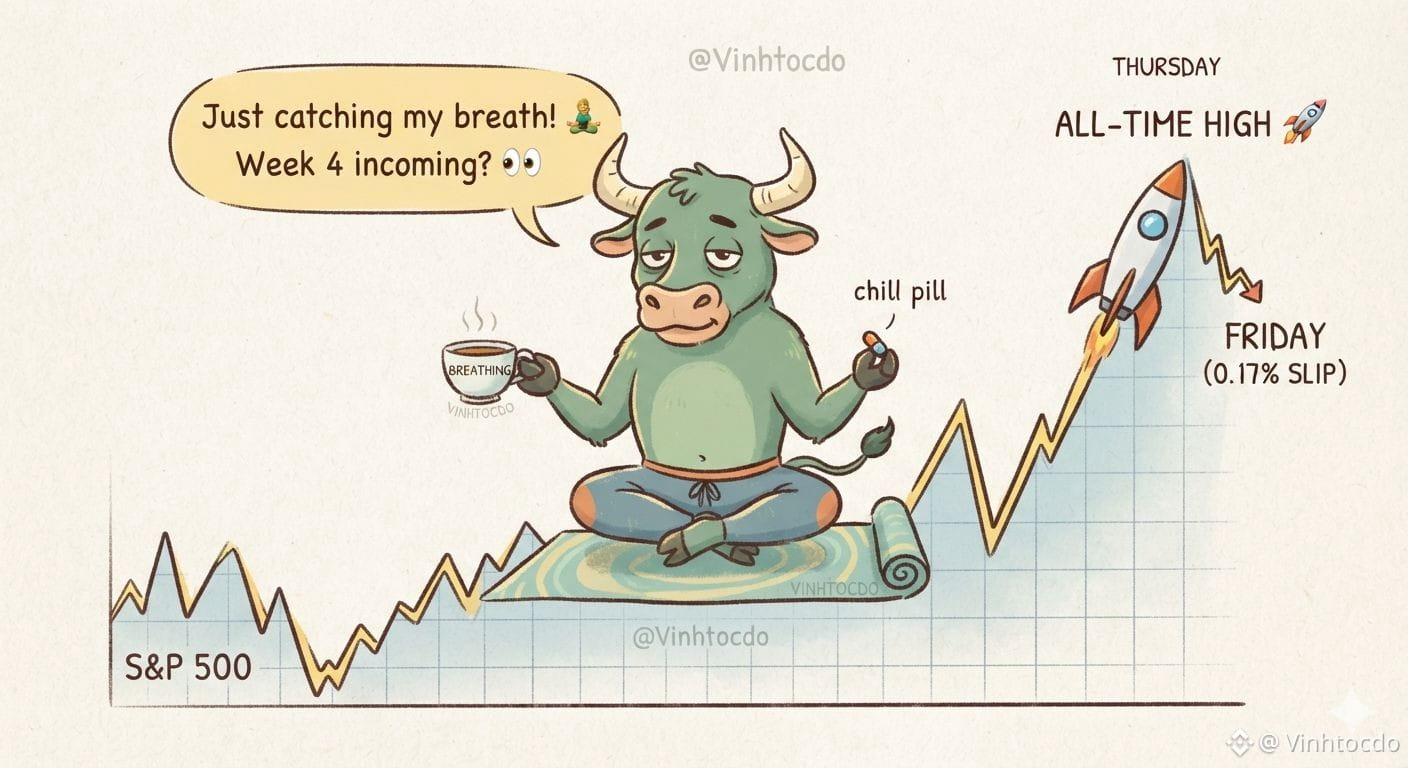
#sp500slipsfridaythirdstraightweeklygain 📈🔥 S&P 500: Taking a Breath, Not Breaking Down The S&P 500 slipped just 0.17% Friday after hitting a fresh all-time high Thursday—and the bigger picture remains strong. 🚀 3 straight weekly gains! So the real question: Week 4… or a pullback? 👀 For traders: 🔹 Don’t panic-sell normal pullbacks. 🔹 Watch support & momentum. 🔹 Track volume and market breadth. 🔹 Respect risk if volatility picks up. 🔹 Avoid chasing after extended moves A red day after record highs doesn’t automatically mean the rally is over. Sometimes the market simply needs to breathe before the next move. 🧘‍♂️📊 Are you betting on Week 4—or preparing for a dip? 👇 ⚠️ NFA. Do your own research. #SP500 #SPX #StockMarket #Trading CLICK TO BELOW TRADE👇 $BTC $ETH $BNB {future}(BNBUSDT) {future}(ETHUSDT) {future}(BTCUSDT)
#sp500slipsfridaythirdstraightweeklygain 📈🔥 S&P 500: Taking a Breath, Not Breaking Down
The S&P 500 slipped just 0.17% Friday after hitting a fresh all-time high Thursday—and the bigger picture remains strong.
🚀 3 straight weekly gains!
So the real question: Week 4… or a pullback? 👀
For traders:
🔹 Don’t panic-sell normal pullbacks.
🔹 Watch support & momentum.
🔹 Track volume and market breadth.
🔹 Respect risk if volatility picks up.
🔹 Avoid chasing after extended moves
A red day after record highs doesn’t automatically mean the rally is over. Sometimes the market simply needs to breathe before the next move. 🧘‍♂️📊
Are you betting on Week 4—or preparing for a dip? 👇
⚠️ NFA. Do your own research.
#SP500 #SPX #StockMarket #Trading
CLICK TO BELOW TRADE👇
$BTC $ETH $BNB
·
--
Bullish
Verified
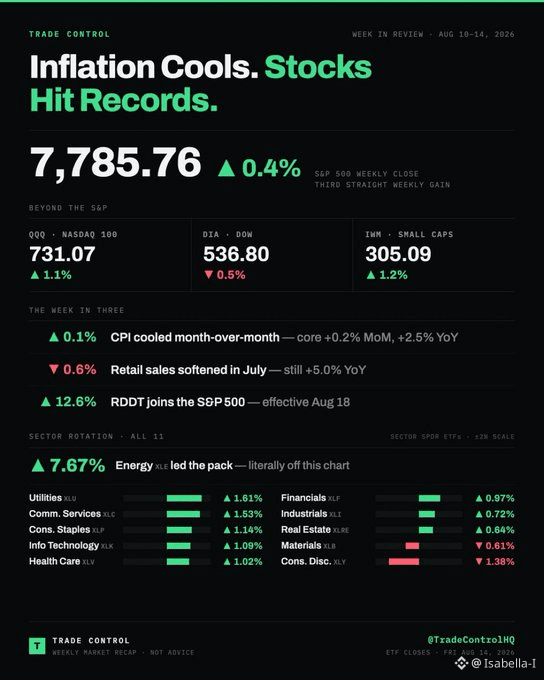
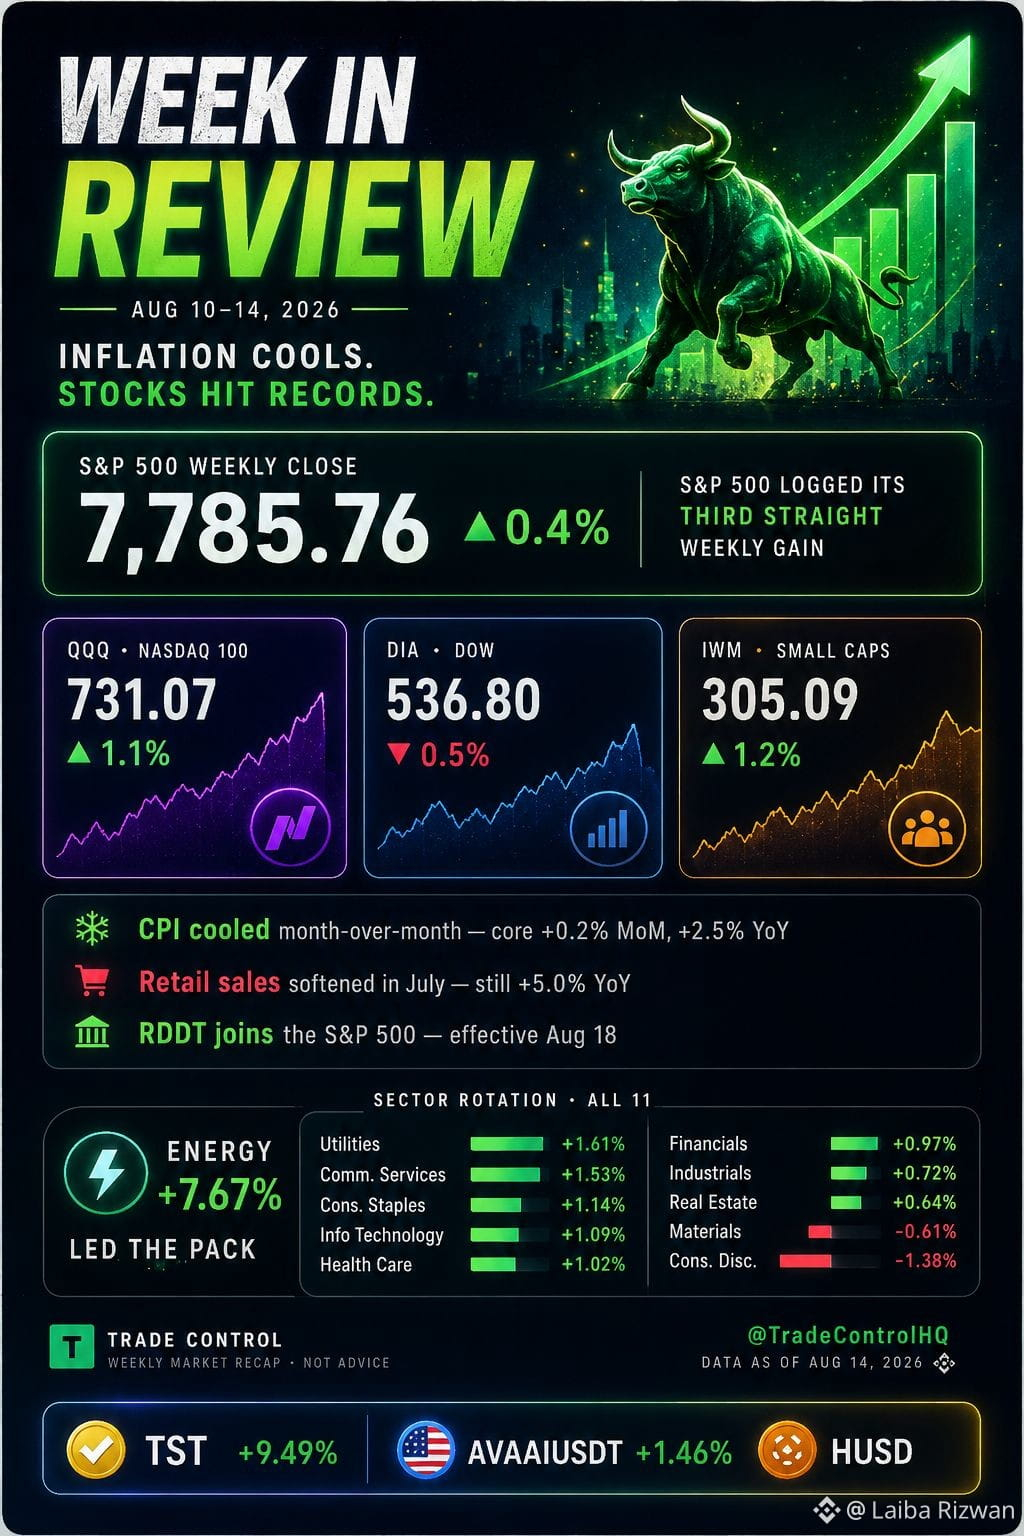
The S&P 500 dipped 13.23 points (0.2%) to 7,785.76 on Friday, retreating from a record high but securing its third consecutive weekly gain of 0.4%. Despite the weekly advance, market gains were capped by a 0.6% decline in July U.S. retail sales and rising oil prices stemming from geopolitical tensions. The Nasdaq added 0.1% for the week, while the Dow dropped 0.6%. Investor sentiment remains largely bullish, supported by cooling inflation data that suggests a potential September interest rate pause. Year-to-date, the S&P 500 maintains strong momentum with a ~13.7% gain. Retail investor sentiment as of mid-August 2026 is leaning toward caution and skepticism, showing a growing divide between institutional momentum and retail confidence. Despite the S&P 500 achieving its third straight weekly gain and hovering near record highs, everyday traders are increasingly anxious about the real economy. #sp500slipsfridaythirdstraightweeklygain
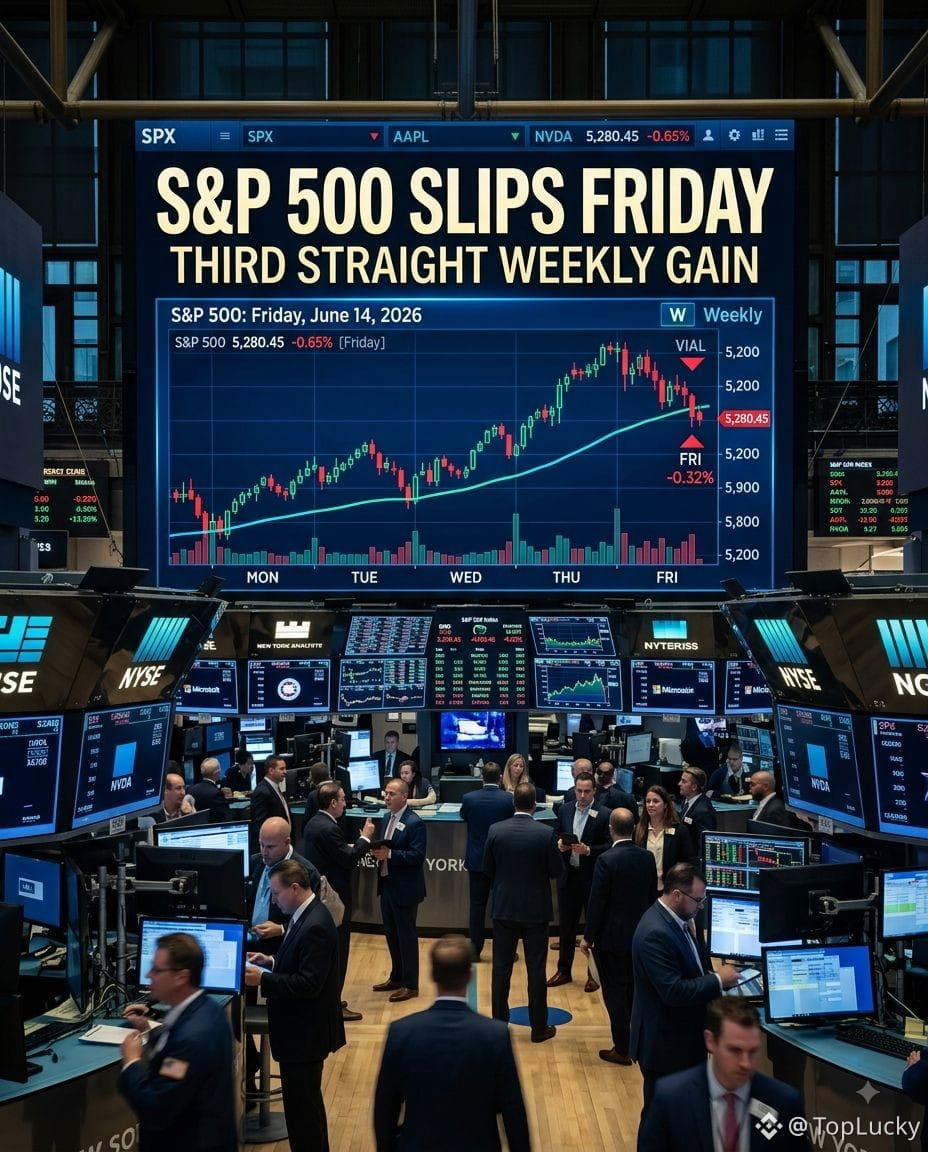
The S&P 500 dipped 13.23 points (0.2%) to 7,785.76 on Friday, retreating from a record high but securing its third consecutive weekly gain of 0.4%. Despite the weekly advance, market gains were capped by a 0.6% decline in July U.S. retail sales and rising oil prices stemming from geopolitical tensions.

The Nasdaq added 0.1% for the week, while the Dow dropped 0.6%. Investor sentiment remains largely bullish, supported by cooling inflation data that suggests a potential September interest rate pause. Year-to-date, the S&P 500 maintains strong momentum with a ~13.7% gain.

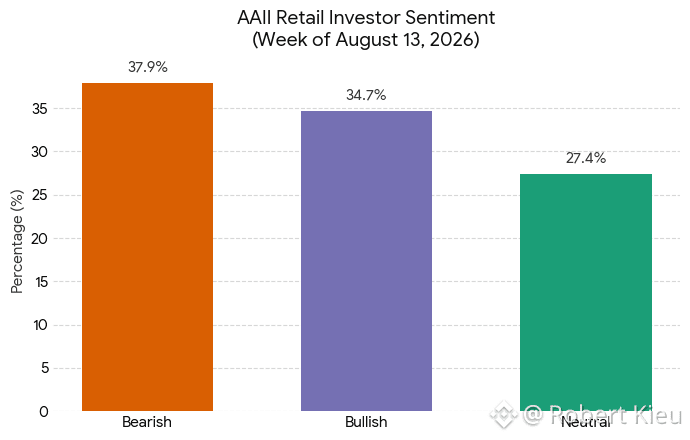
Retail investor sentiment as of mid-August 2026 is leaning toward caution and skepticism, showing a growing divide between institutional momentum and retail confidence.

Despite the S&P 500 achieving its third straight weekly gain and hovering near record highs, everyday traders are increasingly anxious about the real economy.

#sp500slipsfridaythirdstraightweeklygain
Verified
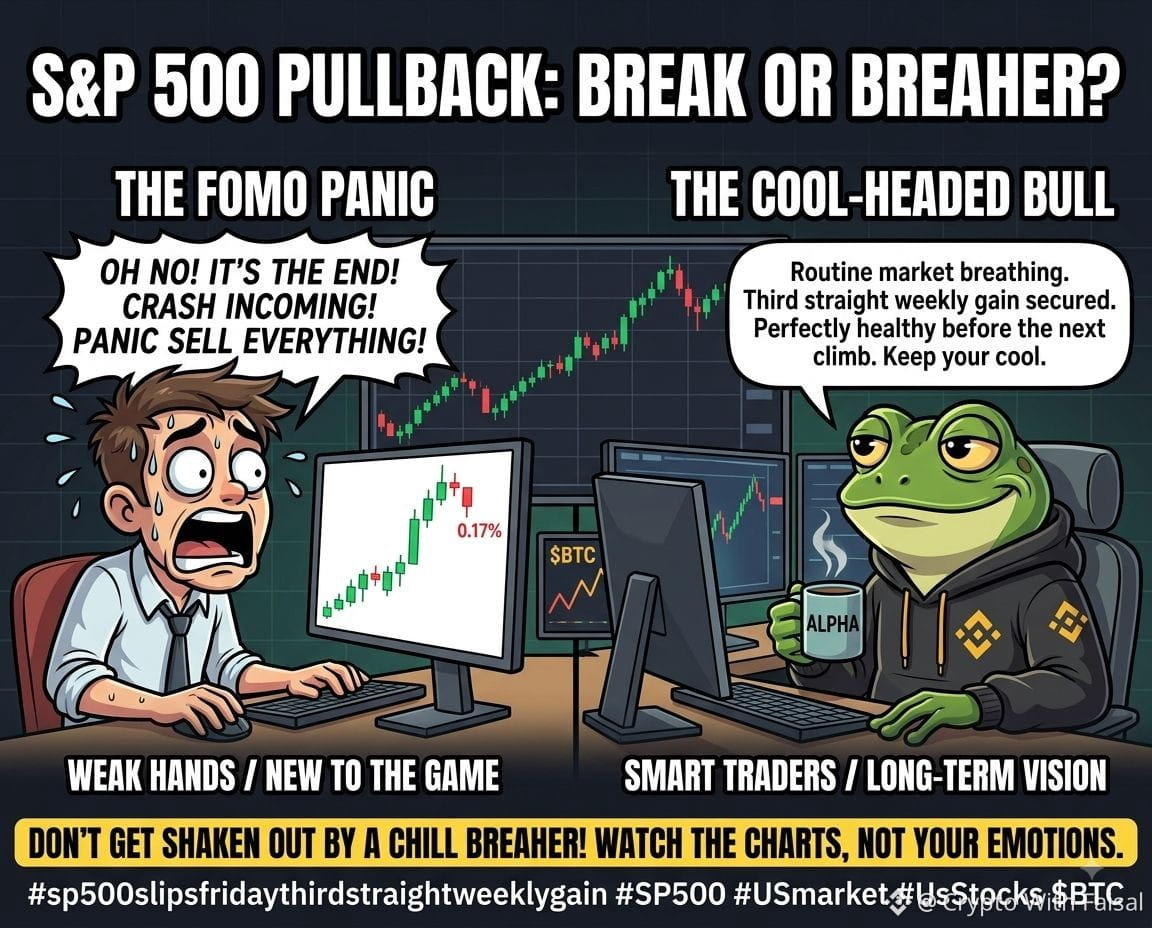
#sp500slipsfridaythirdstraightweeklygain ​📉 A minor 0.17% pullback for the S&P 500 this Friday—but don't let the red fool you. This is merely a healthy market consolidation following Thursday's explosive All-Time High. 📈 ​🔥 We’ve officially secured three consecutive weeks in the green. The critical question now: Are we gearing up for a massive Week 4 rally, or is a broader market correction imminent? The momentum is shifting, and I am closely monitoring the tape. 🦅 ​💡 Strategic Playbook for Traders: ​Maintain discipline: Keep your emotions in check. ​Trust the data: Rely on your chart analysis. ​Hold the line: Avoid getting shaken out during routine market breathers! 🧘‍♂️ ​🚀 Just starting your trading journey? Dive into the action and set up your Binance Registration today to get started! ​⚖️ Disclaimer: NFA (Not Financial Advice). ​#SP500 #USmarket #UsStocks $BTC {future}(BTCUSDT) $ETH {future}(ETHUSDT) $BNB {future}(BNBUSDT)
#sp500slipsfridaythirdstraightweeklygain

​📉 A minor 0.17% pullback for the S&P 500 this Friday—but don't let the red fool you. This is merely a healthy market consolidation following Thursday's explosive All-Time High. 📈

​🔥 We’ve officially secured three consecutive weeks in the green. The critical question now: Are we gearing up for a massive Week 4 rally, or is a broader market correction imminent? The momentum is shifting, and I am closely monitoring the tape. 🦅

​💡 Strategic Playbook for Traders:

​Maintain discipline: Keep your emotions in check.

​Trust the data: Rely on your chart analysis.

​Hold the line: Avoid getting shaken out during routine market breathers! 🧘‍♂️

​🚀 Just starting your trading journey? Dive into the action and set up your Binance Registration today to get started!

​⚖️ Disclaimer: NFA (Not Financial Advice).

​#SP500 #USmarket #UsStocks
$BTC
$ETH
$BNB
Here’s what happened when the S&P 500 slipped on Friday but still managed to lock in a third straight weekly gain. For crypto traders, this is the annoying part of the cycle: the headline says “stocks down,” but the broader trend says “risk appetite is still alive.” That’s where people get chopped up, selling $BTC too early on one red session or chasing $ETH after macro buyers already positioned. The case study here is simple. Equities cooled into the weekend, but the weekly structure stayed constructive, which looks a lot like past phases where traditional markets pulled back briefly while crypto paused rather than collapsed. In those moments, stablecoin parking in $USDT usually rises because traders are not fully leaving the market, they’re waiting for confirmation. Compare it with earlier risk-on periods: when the S&P holds strength despite short-term weakness, crypto often treats it as permission to stabilize. But when stocks start slipping alongside a stronger dollar or higher rate expectations, that’s when altcoins usually take the hit first. Today’s Fear & Greed reading near fear tells you many traders are still cautious, not euphoric. The lesson is that one red day in stocks is not the story. The story is whether the weekly trend, dollar pressure, and rate expectations are all pointing in the same direction. If they are not, patience often beats impulse. Are you treating this S&P dip as a warning sign for crypto, or just another shakeout before the next move? #SP500SlipsFridayThirdStraightWeeklyGain #DollarFallsToMayLow #TradersCutFedRateHikeBetsBeforeMid2027
Here’s what happened when the S&P 500 slipped on Friday but still managed to lock in a third straight weekly gain.

For crypto traders, this is the annoying part of the cycle: the headline says “stocks down,” but the broader trend says “risk appetite is still alive.” That’s where people get chopped up, selling $BTC too early on one red session or chasing $ETH after macro buyers already positioned.

The case study here is simple. Equities cooled into the weekend, but the weekly structure stayed constructive, which looks a lot like past phases where traditional markets pulled back briefly while crypto paused rather than collapsed. In those moments, stablecoin parking in $USDT usually rises because traders are not fully leaving the market, they’re waiting for confirmation.

Compare it with earlier risk-on periods: when the S&P holds strength despite short-term weakness, crypto often treats it as permission to stabilize. But when stocks start slipping alongside a stronger dollar or higher rate expectations, that’s when altcoins usually take the hit first. Today’s Fear & Greed reading near fear tells you many traders are still cautious, not euphoric.

The lesson is that one red day in stocks is not the story. The story is whether the weekly trend, dollar pressure, and rate expectations are all pointing in the same direction. If they are not, patience often beats impulse.

Are you treating this S&P dip as a warning sign for crypto, or just another shakeout before the next move? #SP500SlipsFridayThirdStraightWeeklyGain #DollarFallsToMayLow #TradersCutFedRateHikeBetsBeforeMid2027
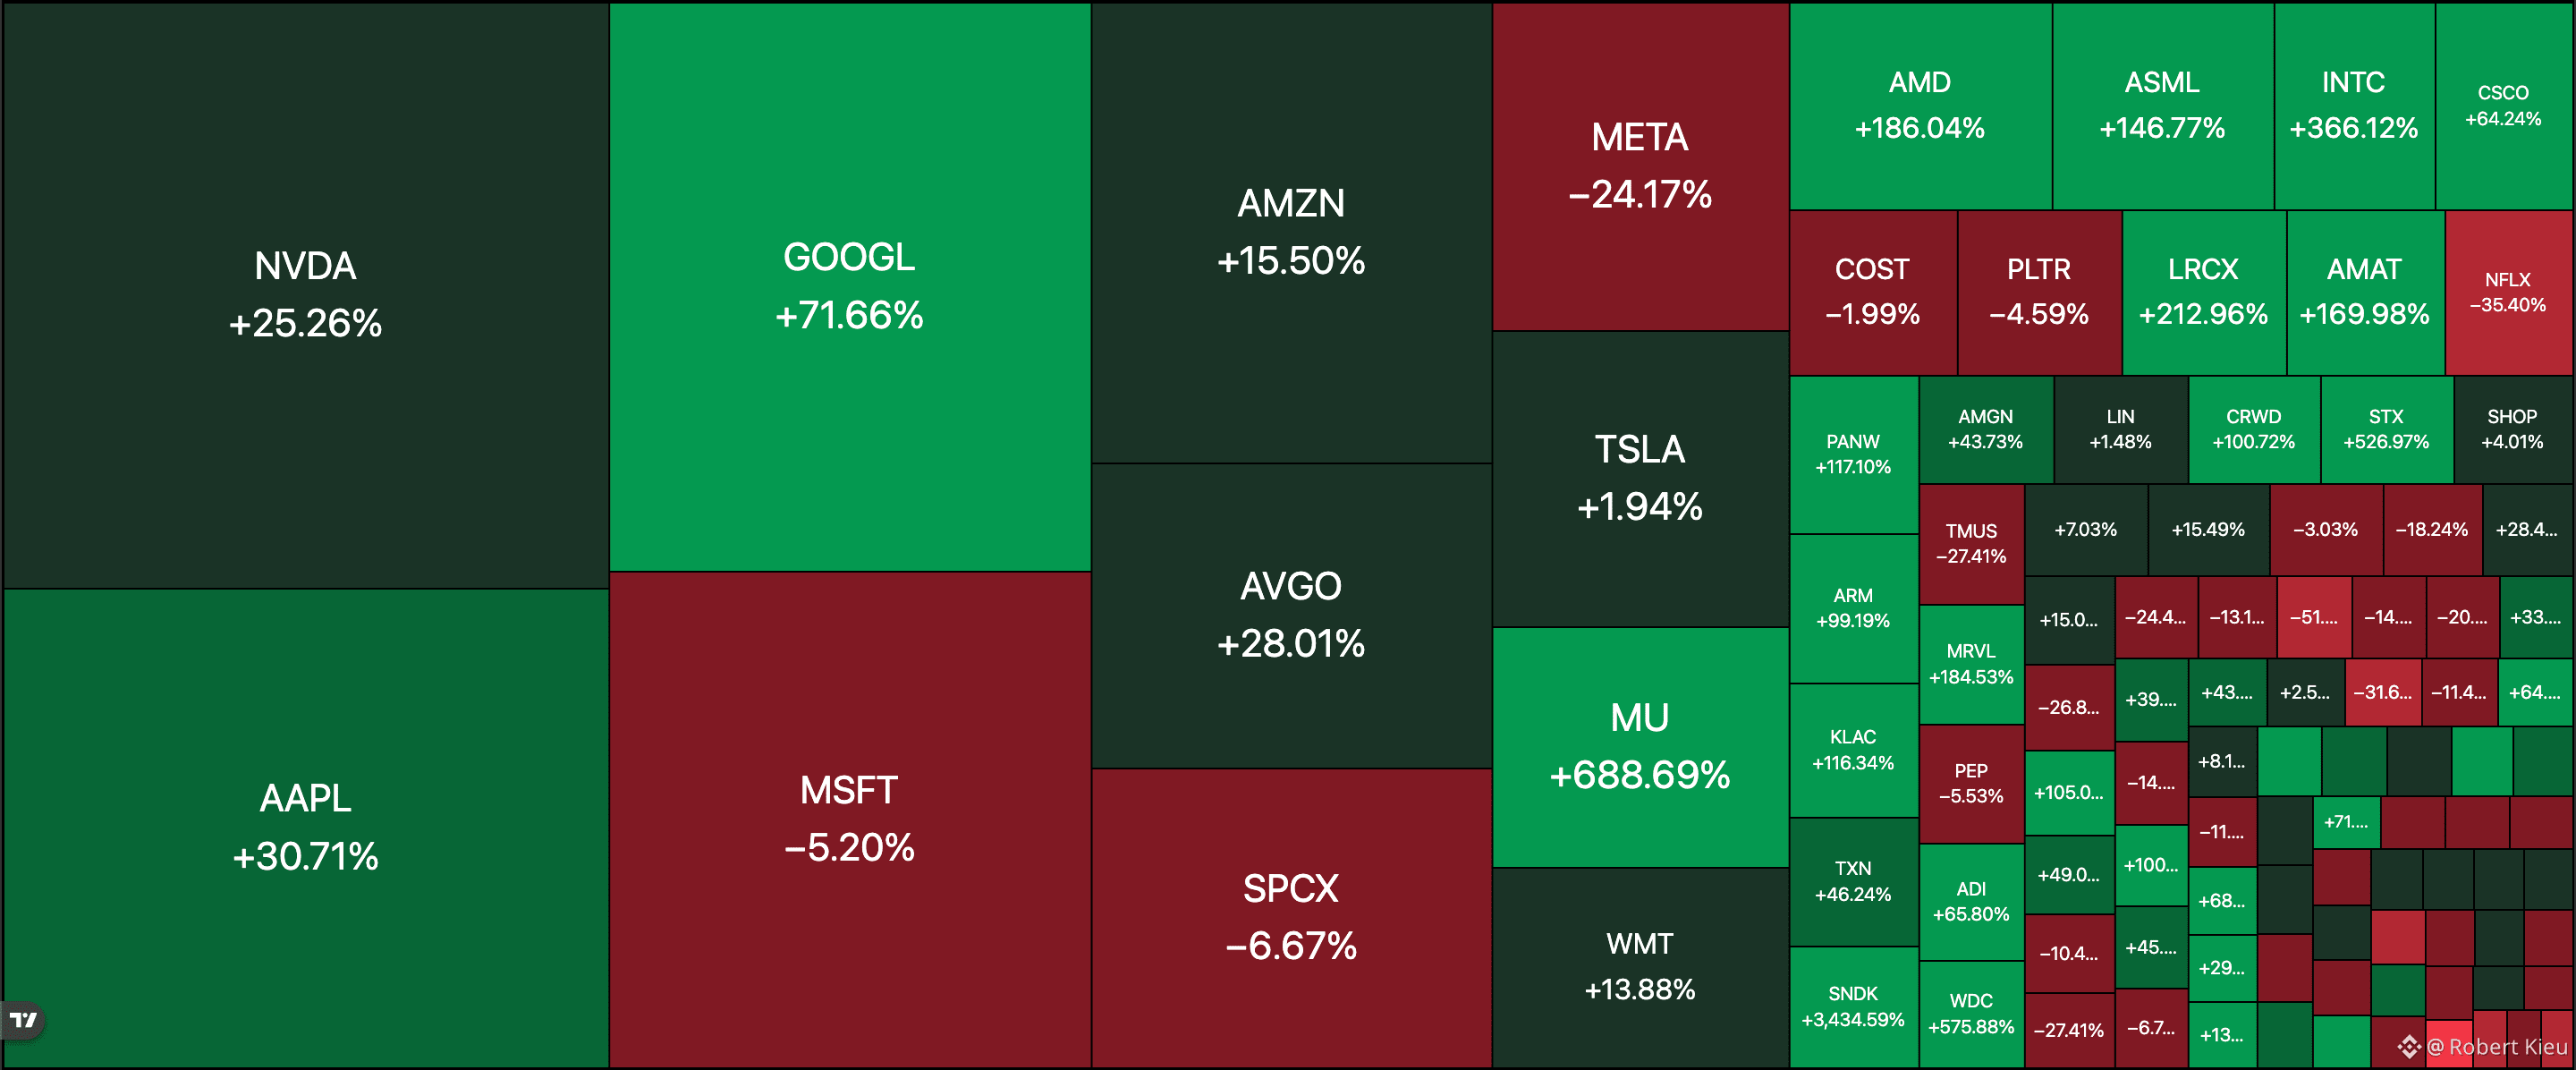
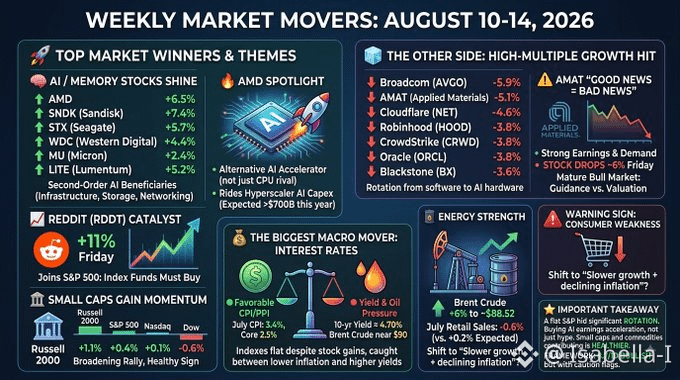
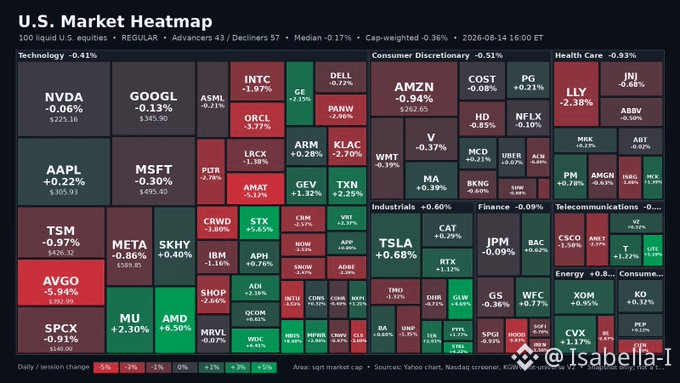
#sp500slipsfridaythirdstraightweeklygain The S&P 500 looked flat (+0.4%) this week, but massive rotations happened under the hood. Here is what you need to know: 1. The #AI Trade Expands Beyond $NVDA Capital rotated hard into memory, storage, and optical infrastructure: * $SNDK +7.4% | $AMD +6.5% | $STX +5.7% | $LITE +5.2% | $WDC +4.4% | $MU +2.4% 2. Key Single-Stock Drivers * $RDDT (+11%): Surged on S&P 500 inclusion catalyst. * $AMAT (-6%): Beat earnings but slid—market is demanding pristine guidance at current multiples. * Software/High-Multiple Tech: Took a backseat ( $AVGO , $NET , $CRWD , $ORCL seeing profit-taking). 3. Rally Breadth is Improving * Small Caps: Russell 2000 outperformed at +1.1%. * Energy & Commodities: Brent crude jumped ~6% to $88.50/bbl, boosting $SLB ,$DVN, and miners ( $NEM , $AEM.NE ). 4. The Macro Tug-of-War * 🟢 Cooling Inflation: July Core CPI at 2.5% YoY gives the Fed breathing room. * 🔴 Friction Points: 10Y yield hovering near 4.70%, oil pressing $90, and July Retail Sales surprising to the downside at -0.6%. The Takeaway: The rally is evolving from "buy anything AI" to rewarding tangible infrastructure earnings and broadening into small caps. Overall structure: 8.7/10 Bullish, imo—with a close eye on the consumer and yields. $EUL $LINK $THETA
#sp500slipsfridaythirdstraightweeklygain The S&P 500 looked flat (+0.4%) this week, but massive rotations happened under the hood. Here is what you need to know: 1. The #AI Trade Expands Beyond
$NVDA
Capital rotated hard into memory, storage, and optical infrastructure: *
$SNDK
+7.4% |
$AMD
+6.5% |
$STX
+5.7% |
$LITE
+5.2% |
$WDC
+4.4% |
$MU
+2.4% 2. Key Single-Stock Drivers *
$RDDT
(+11%): Surged on S&P 500 inclusion catalyst. *
$AMAT
(-6%): Beat earnings but slid—market is demanding pristine guidance at current multiples. * Software/High-Multiple Tech: Took a backseat (
$AVGO
,
$NET
,
$CRWD
,
$ORCL
seeing profit-taking). 3. Rally Breadth is Improving * Small Caps: Russell 2000 outperformed at +1.1%. * Energy & Commodities: Brent crude jumped ~6% to $88.50/bbl, boosting
$SLB
,$DVN, and miners (
$NEM
,
$AEM.NE
). 4. The Macro Tug-of-War *
🟢
Cooling Inflation: July Core CPI at 2.5% YoY gives the Fed breathing room. *
🔴
Friction Points: 10Y yield hovering near 4.70%, oil pressing $90, and July Retail Sales surprising to the downside at -0.6%. The Takeaway: The rally is evolving from "buy anything AI" to rewarding tangible infrastructure earnings and broadening into small caps. Overall structure: 8.7/10 Bullish, imo—with a close eye on the consumer and yields.
$EUL $LINK $THETA
A red Friday in the S&P 500 can still be a bullish week, and that’s exactly the kind of contradiction that traps impatient crypto traders. I’ve seen this movie in past cycles: traders panic on the daily candle, sell $BTC into weakness, then watch liquidity rotate back when macro risk calms. Fear is loud right now, especially with the Fear & Greed Index sitting at 36, but fear alone is not a trading plan. When the S&P slips after several strong weeks, the lesson is not “stocks are crashing.” The lesson is to watch whether the move is profit-taking or a real risk-off shift. If the dollar keeps softening and rate-hike expectations keep getting pushed out, risk assets can still find support even after ugly sessions. For crypto, that means $USDT flows matter. If traders are hiding in stables but not exiting the market entirely, it often signals waiting power, not surrender. In previous cycles, the best entries came when everyone felt nervous but liquidity had not actually left the room. The veteran move is simple: separate noise from structure. A single weak Friday does not break a trend, but a series of lower highs with rising dollar strength might. That’s the difference between fear you can use and fear that uses you. Are you treating this S&P pullback as a warning sign for $BTC, or just another shakeout before the next rotation? #SP500SlipsFridayThirdStraightWeeklyGain #TradersCutFedRateHikeBetsBeforeMid2027 #DollarFallsToMayLow
A red Friday in the S&P 500 can still be a bullish week, and that’s exactly the kind of contradiction that traps impatient crypto traders.

I’ve seen this movie in past cycles: traders panic on the daily candle, sell $BTC into weakness, then watch liquidity rotate back when macro risk calms. Fear is loud right now, especially with the Fear & Greed Index sitting at 36, but fear alone is not a trading plan.

When the S&P slips after several strong weeks, the lesson is not “stocks are crashing.” The lesson is to watch whether the move is profit-taking or a real risk-off shift. If the dollar keeps softening and rate-hike expectations keep getting pushed out, risk assets can still find support even after ugly sessions.

For crypto, that means $USDT flows matter. If traders are hiding in stables but not exiting the market entirely, it often signals waiting power, not surrender. In previous cycles, the best entries came when everyone felt nervous but liquidity had not actually left the room.

The veteran move is simple: separate noise from structure. A single weak Friday does not break a trend, but a series of lower highs with rising dollar strength might. That’s the difference between fear you can use and fear that uses you.

Are you treating this S&P pullback as a warning sign for $BTC , or just another shakeout before the next rotation? #SP500SlipsFridayThirdStraightWeeklyGain #TradersCutFedRateHikeBetsBeforeMid2027 #DollarFallsToMayLow
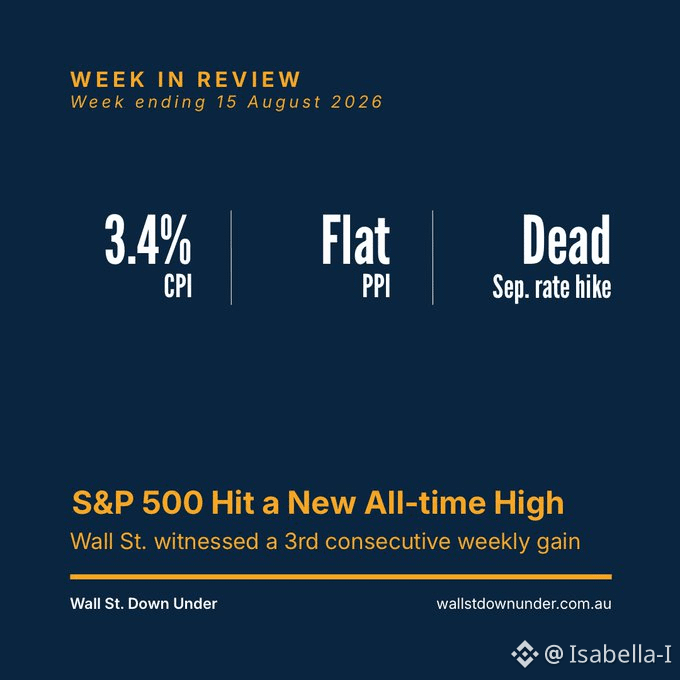
#sp500slipsfridaythirdstraightweeklygain Oil hit $89 on Iran tensions. Markets sold Mon-Tue. Then July CPI landed at 3.4% — Sep. rate hike: dead. S&P 500 hit a new all-time high on Thu. Third straight weekly gain. The anxiety machine and the pricing machine both showed up this week.$CL $LA $COLLECT
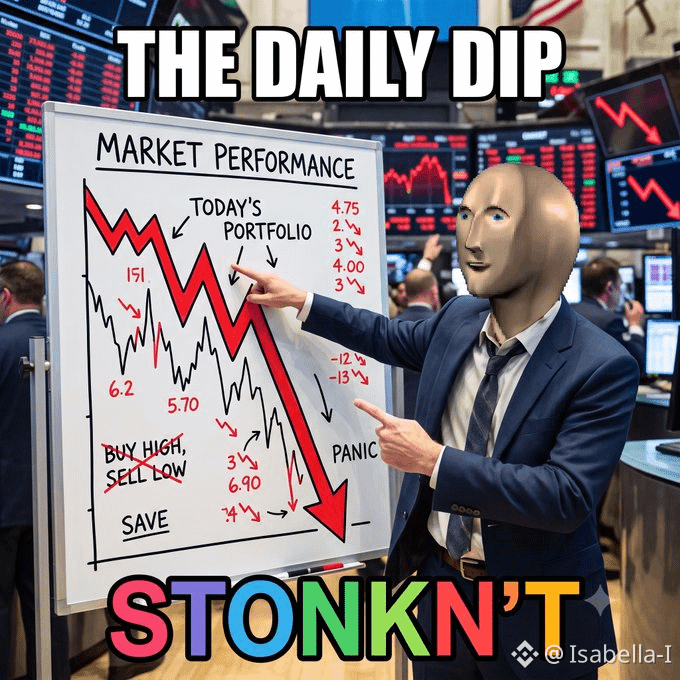
#sp500slipsfridaythirdstraightweeklygain The Daily Dip What a wild Friday… S&P hits a fresh ATH yesterday then immediately takes a chill pill like “nah I’m good” S&P500 $7,785 (DOWN 0.17%) NASDAQ $26,729 (DOWN 0.28%) GOLD $4,375 (UP 0.5%) OIL $82.40 (UP 1.4%) BITCOIN $62,900 (DOWN 0.7%) Markets just closed and the plot twist was real. Soft retail sales (biggest drop in 14 months) + consumer sentiment tanking sent the party to the curb after yesterday’s record high flex. Tech got the cold shoulder hard while oil decided to flex on Iran/Hormuz drama and US blockade vibes. Classic end-of-week “wait… what just happened?” energy. Biggest movers? Chips took the L (Applied Materials got smoked even on good numbers ), energy laughed all the way to the bank, and gold just quietly did its safe-haven thing like the responsible adult in the group chat.$BTC $XAU $BZ
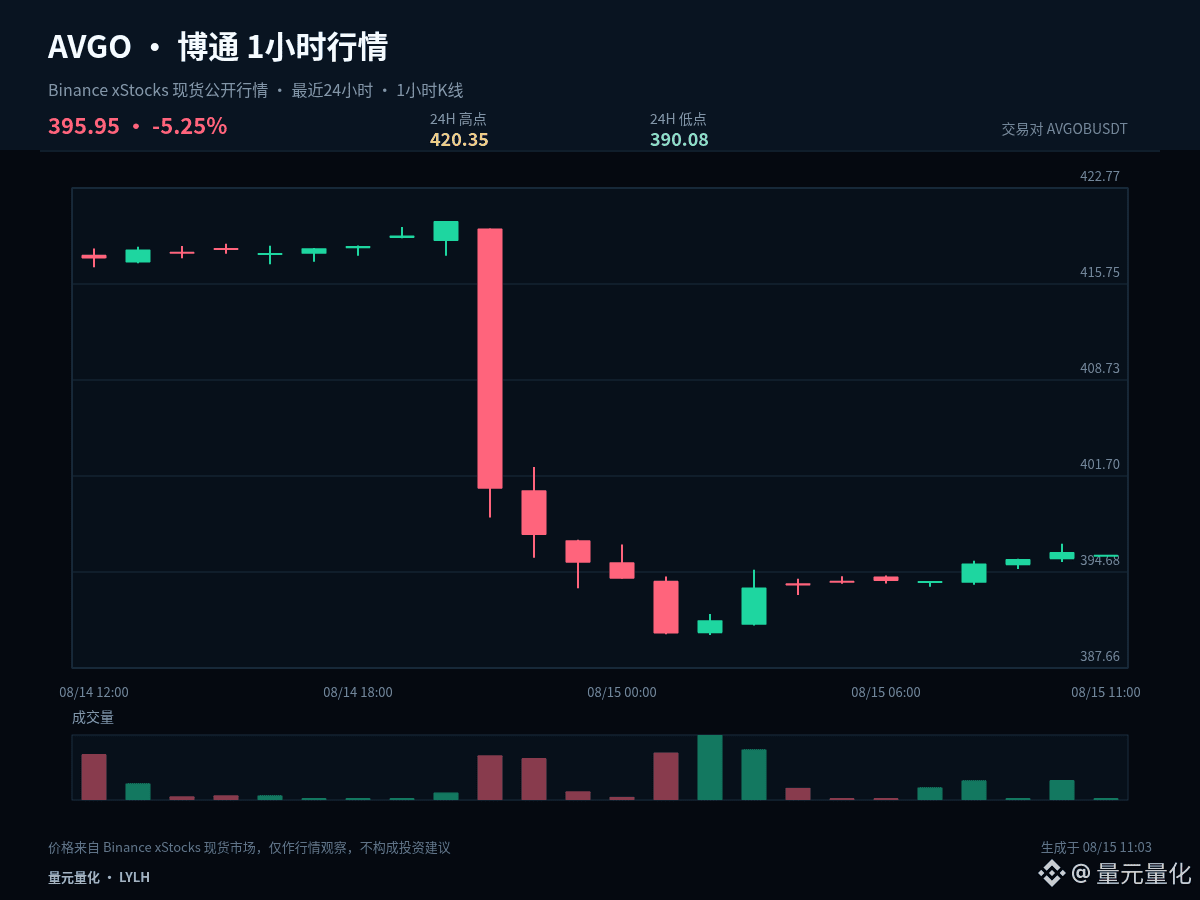
$AVGOB #AVGO Over the past 24 hours, the high-low amplitude is about 7.6%. The current price is 395.95. This is not a calm range market that you can casually open a position in. When volatility expands, you should adjust your position first, and only then discuss direction. $AVGOB #AVGO is still trading back and forth within the past-24-hour range, and there is no clear directional advantage. The middle zone is the biggest test of patience—waiting for boundary signals is usually more effective. Currently: 1 hour -0.05%, 24 hours -5.32%. The two timeframes have not formed sufficiently clear aligned moves in the same direction. In a range market, the tolerance for chasing or selling impulsively is low. It’s more suitable to use upper-band confirmation for direction and lower-band confirmation for rebound/holding strength. The midline is only used as the strength/weakness dividing line. For key levels: 405.215 is the midline that must be reclaimed for weak repair to hold. If price cannot stand back above it, any rebound should still be treated as a technical bounce. There is a possibility that 390.08 will be tested again below. Only after reclaiming the midline is it appropriate to further observe 420.35. The execution principle during high-volatility phases is to reduce single-trade exposure, avoid chasing prices back and forth in the middle of the range, and write your invalidation conditions before entering. If price does not give confirmation, it’s better to do one less trade than to use a larger position to compensate for uncertainty. My scenario analysis is not a one-way bet. If price breaks above 420.35 and can hold, it means the upside space has been reopened. If it breaks below 390.08 and the subsequent retest fails, it means the structure weakens further. If price moves within the range between the two, continue to observe the closes on either side of 405.215. For short-term positioning, the key is not to predict every candlestick. It’s to ensure there is a basis for entry, trimming, and exit. Do fewer trades without confirmation. If a key level fails, redo the plan. Control single-trade risk first, then discuss potential space. Right now, the most important thing isn’t guessing the target. It’s whether this level can be defended. How do you think it will move? Want to learn about the quant hedging arbitrage trading robot? Join the chat. #SP500SlipsFridayThirdStraightWeeklyGain
$AVGOB #AVGO Over the past 24 hours, the high-low amplitude is about 7.6%. The current price is 395.95. This is not a calm range market that you can casually open a position in. When volatility expands, you should adjust your position first, and only then discuss direction.

$AVGOB #AVGO is still trading back and forth within the past-24-hour range, and there is no clear directional advantage. The middle zone is the biggest test of patience—waiting for boundary signals is usually more effective.

Currently: 1 hour -0.05%, 24 hours -5.32%. The two timeframes have not formed sufficiently clear aligned moves in the same direction. In a range market, the tolerance for chasing or selling impulsively is low. It’s more suitable to use upper-band confirmation for direction and lower-band confirmation for rebound/holding strength. The midline is only used as the strength/weakness dividing line.

For key levels: 405.215 is the midline that must be reclaimed for weak repair to hold. If price cannot stand back above it, any rebound should still be treated as a technical bounce. There is a possibility that 390.08 will be tested again below. Only after reclaiming the midline is it appropriate to further observe 420.35.

The execution principle during high-volatility phases is to reduce single-trade exposure, avoid chasing prices back and forth in the middle of the range, and write your invalidation conditions before entering. If price does not give confirmation, it’s better to do one less trade than to use a larger position to compensate for uncertainty.

My scenario analysis is not a one-way bet. If price breaks above 420.35 and can hold, it means the upside space has been reopened. If it breaks below 390.08 and the subsequent retest fails, it means the structure weakens further. If price moves within the range between the two, continue to observe the closes on either side of 405.215.

For short-term positioning, the key is not to predict every candlestick. It’s to ensure there is a basis for entry, trimming, and exit. Do fewer trades without confirmation. If a key level fails, redo the plan. Control single-trade risk first, then discuss potential space.

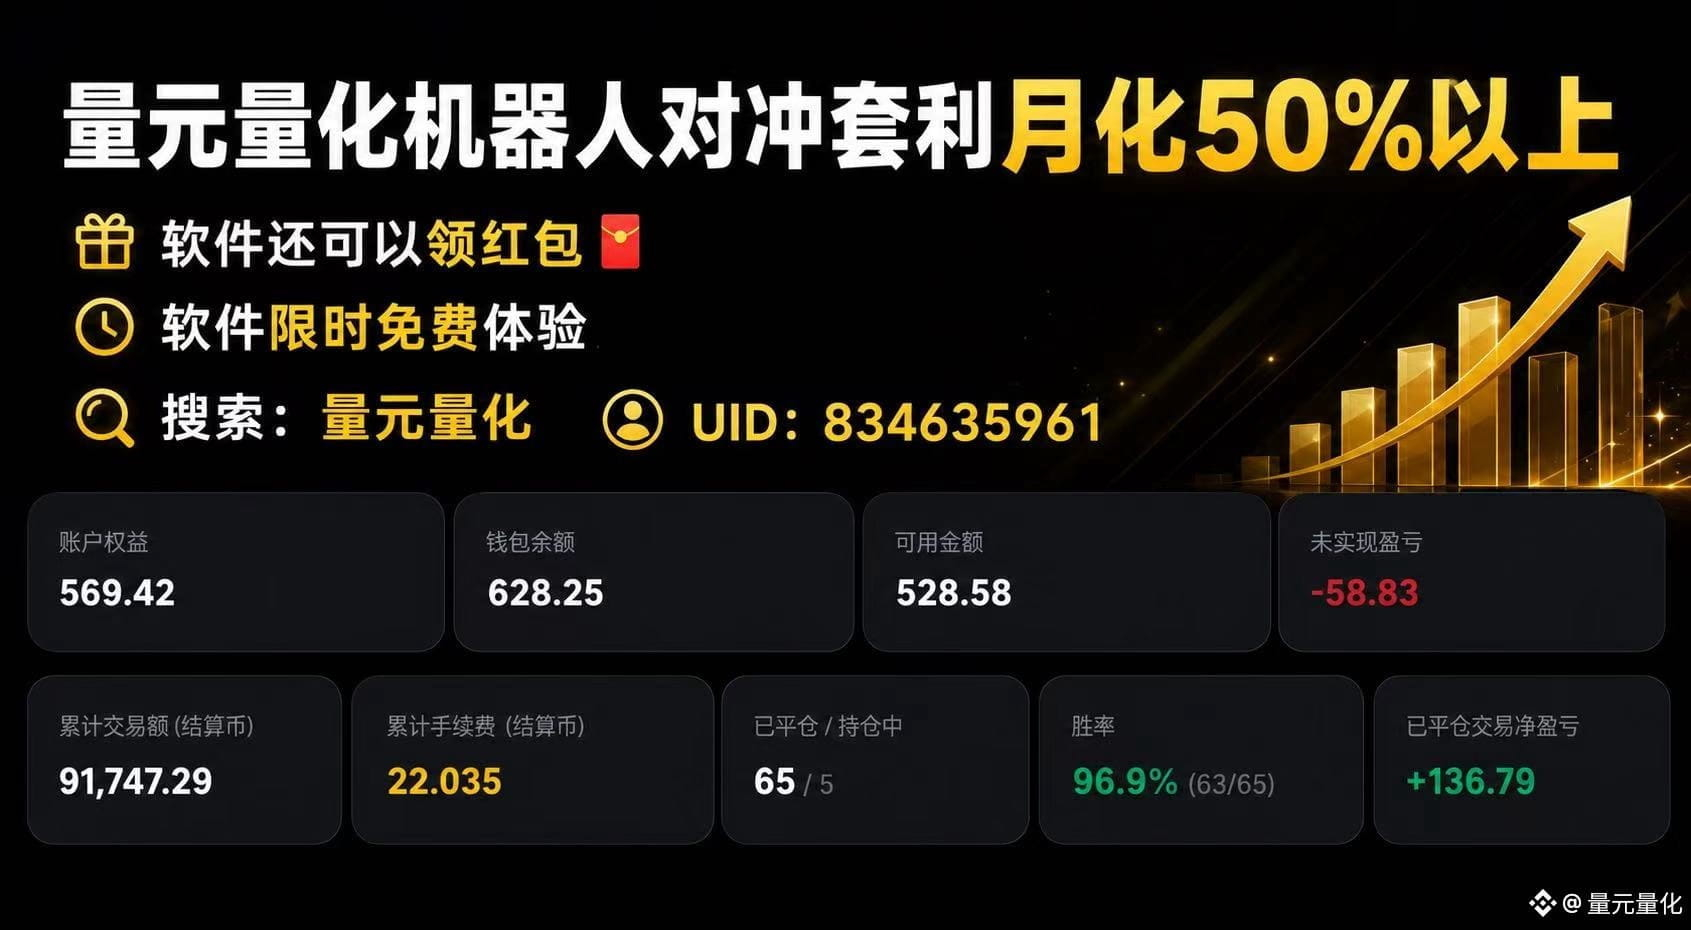
Right now, the most important thing isn’t guessing the target. It’s whether this level can be defended. How do you think it will move? Want to learn about the quant hedging arbitrage trading robot? Join the chat.

#SP500SlipsFridayThirdStraightWeeklyGain

·
--
Bullish
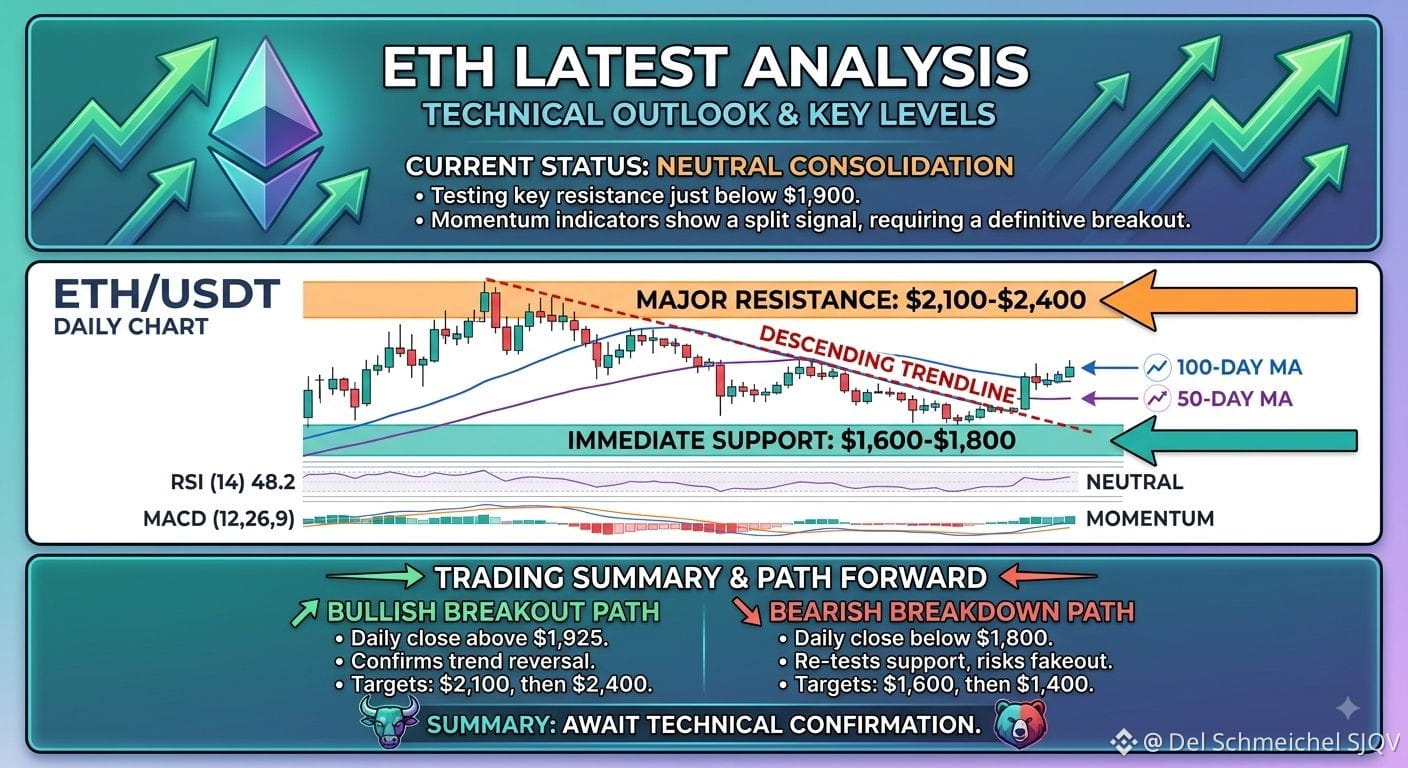
$ETH {spot}(ETHUSDT) has recently shown notable price volatility, influenced by broader cryptocurrency market trends and network-specific updates. Despite a recent minor correction, analysts maintain a bullish outlook for the remainder of the year. This optimism is driven by increasing adoption, the ongoing development of layer-2 solutions, and anticipation surrounding potential future upgrades. ​Technical indicators present a mixed signal, suggesting short-term consolidation before a potential breakout. However, long-term sentiment remains strongly positive, fueled by institutional interest and the growing relevance of the Ethereum ecosystem in decentralized finance (DeFi) and non-fungible tokens (NFTs). ​[Picture: A dynamic image illustrating the Ethereum logo and a rising price graph, symbolizing positive market momentum.] ​Key Takeaways: ​Volatility: ETH experiences price fluctuations reflecting overall market volatility. ​Bullish Long-term Outlook: Analysts predict a positive trajectory for ETH in the coming months. ​Network Development: Ongoing improvements and layer-2 adoption contribute to long-term growth. ​Institutional Interest: Increasing interest from institutions bolsters investor confidence. ​DeFi & NFT Role: Ethereum’s position as a foundation for DeFi and NFTs remains a key driver #BerkshireAddsToDeltaAndAlphabetHoldings #AnthropicQ2RevenueRoseOver14Fold #UkraineSaysOdesaBlackSeaPortsEffectivelyClosed #SP500SlipsFridayThirdStraightWeeklyGain
$ETH
has recently shown notable price volatility, influenced by broader cryptocurrency market trends and network-specific updates. Despite a recent minor correction, analysts maintain a bullish outlook for the remainder of the year. This optimism is driven by increasing adoption, the ongoing development of layer-2 solutions, and anticipation surrounding potential future upgrades.

​Technical indicators present a mixed signal, suggesting short-term consolidation before a potential breakout. However, long-term sentiment remains strongly positive, fueled by institutional interest and the growing relevance of the Ethereum ecosystem in decentralized finance (DeFi) and non-fungible tokens (NFTs).

​[Picture: A dynamic image illustrating the Ethereum logo and a rising price graph, symbolizing positive market momentum.]

​Key Takeaways:

​Volatility: ETH experiences price fluctuations reflecting overall market volatility.

​Bullish Long-term Outlook: Analysts predict a positive trajectory for ETH in the coming months.

​Network Development: Ongoing improvements and layer-2 adoption contribute to long-term growth.

​Institutional Interest: Increasing interest from institutions bolsters investor confidence.

​DeFi & NFT Role: Ethereum’s position as a foundation for DeFi and NFTs remains a key driver
#BerkshireAddsToDeltaAndAlphabetHoldings #AnthropicQ2RevenueRoseOver14Fold #UkraineSaysOdesaBlackSeaPortsEffectivelyClosed #SP500SlipsFridayThirdStraightWeeklyGain

A development that could force the market to rethink $BTC ’s true value is a renewed, sustained wave of institutional accumulation—especially if spot Bitcoin ETF inflows remain strong while BTC is still trading around the low-$60Ks. Recent data show a mixed picture: ETF flows have at times been strong, but Bitcoin has struggled to respond, with weak liquidity and continued ETF outflows weighing on price. � The Economic Times +2 The real valuation signal would be: Institutional demand ↑ + exchange supply ↓ + long-term holders holding = BTC price remaining undervalued relative to actual capital demand. If that combination appears consistently, the market may start treating BTC less like a speculative risk asset and more like a scarce institutional reserve asset—potentially triggering a major valuation reset. Bottom line: Watch sustained ETF/institutional net inflows without a corresponding increase in $BTC available for sale. That could be the catalyst that makes the market reconsider Bitcoin's fair value. {spot}(BTCUSDT) #PolymarketOddsIranBlockadeEndFallTo23% WallStreetBanksPledgeTrillionsForInfrastructureAndAI#SP500SlipsFridayThirdStraightWeeklyGain #UkraineSaysOdesaBlackSeaPortsEffectivelyClosed #BerkshireAddsToDeltaAndAlphabetHoldings
A development that could force the market to rethink $BTC ’s true value is a renewed, sustained wave of institutional accumulation—especially if spot Bitcoin ETF inflows remain strong while BTC is still trading around the low-$60Ks.
Recent data show a mixed picture: ETF flows have at times been strong, but Bitcoin has struggled to respond, with weak liquidity and continued ETF outflows weighing on price. �
The Economic Times +2
The real valuation signal would be:
Institutional demand ↑ + exchange supply ↓ + long-term holders holding = BTC price remaining undervalued relative to actual capital demand.
If that combination appears consistently, the market may start treating BTC less like a speculative risk asset and more like a scarce institutional reserve asset—potentially triggering a major valuation reset.
Bottom line: Watch sustained ETF/institutional net inflows without a corresponding increase in $BTC available for sale. That could be the catalyst that makes the market reconsider Bitcoin's fair value.

#PolymarketOddsIranBlockadeEndFallTo23% WallStreetBanksPledgeTrillionsForInfrastructureAndAI#SP500SlipsFridayThirdStraightWeeklyGain #UkraineSaysOdesaBlackSeaPortsEffectivelyClosed #BerkshireAddsToDeltaAndAlphabetHoldings
Log in to explore more content

Join global crypto users on Binance Square
⚡️ Get latest and useful information about crypto.
💬 Trusted by the world’s largest crypto exchange.
👍 Discover real insights from verified creators.
Email / Phone number