
#avgo
avgo
51,135 views
857 Discussing
Hot
Latest

·
--
Bullish
🚨 AVGO (Broadcom) 1W Setup: Multi-Year Channel Support Test! 🚨
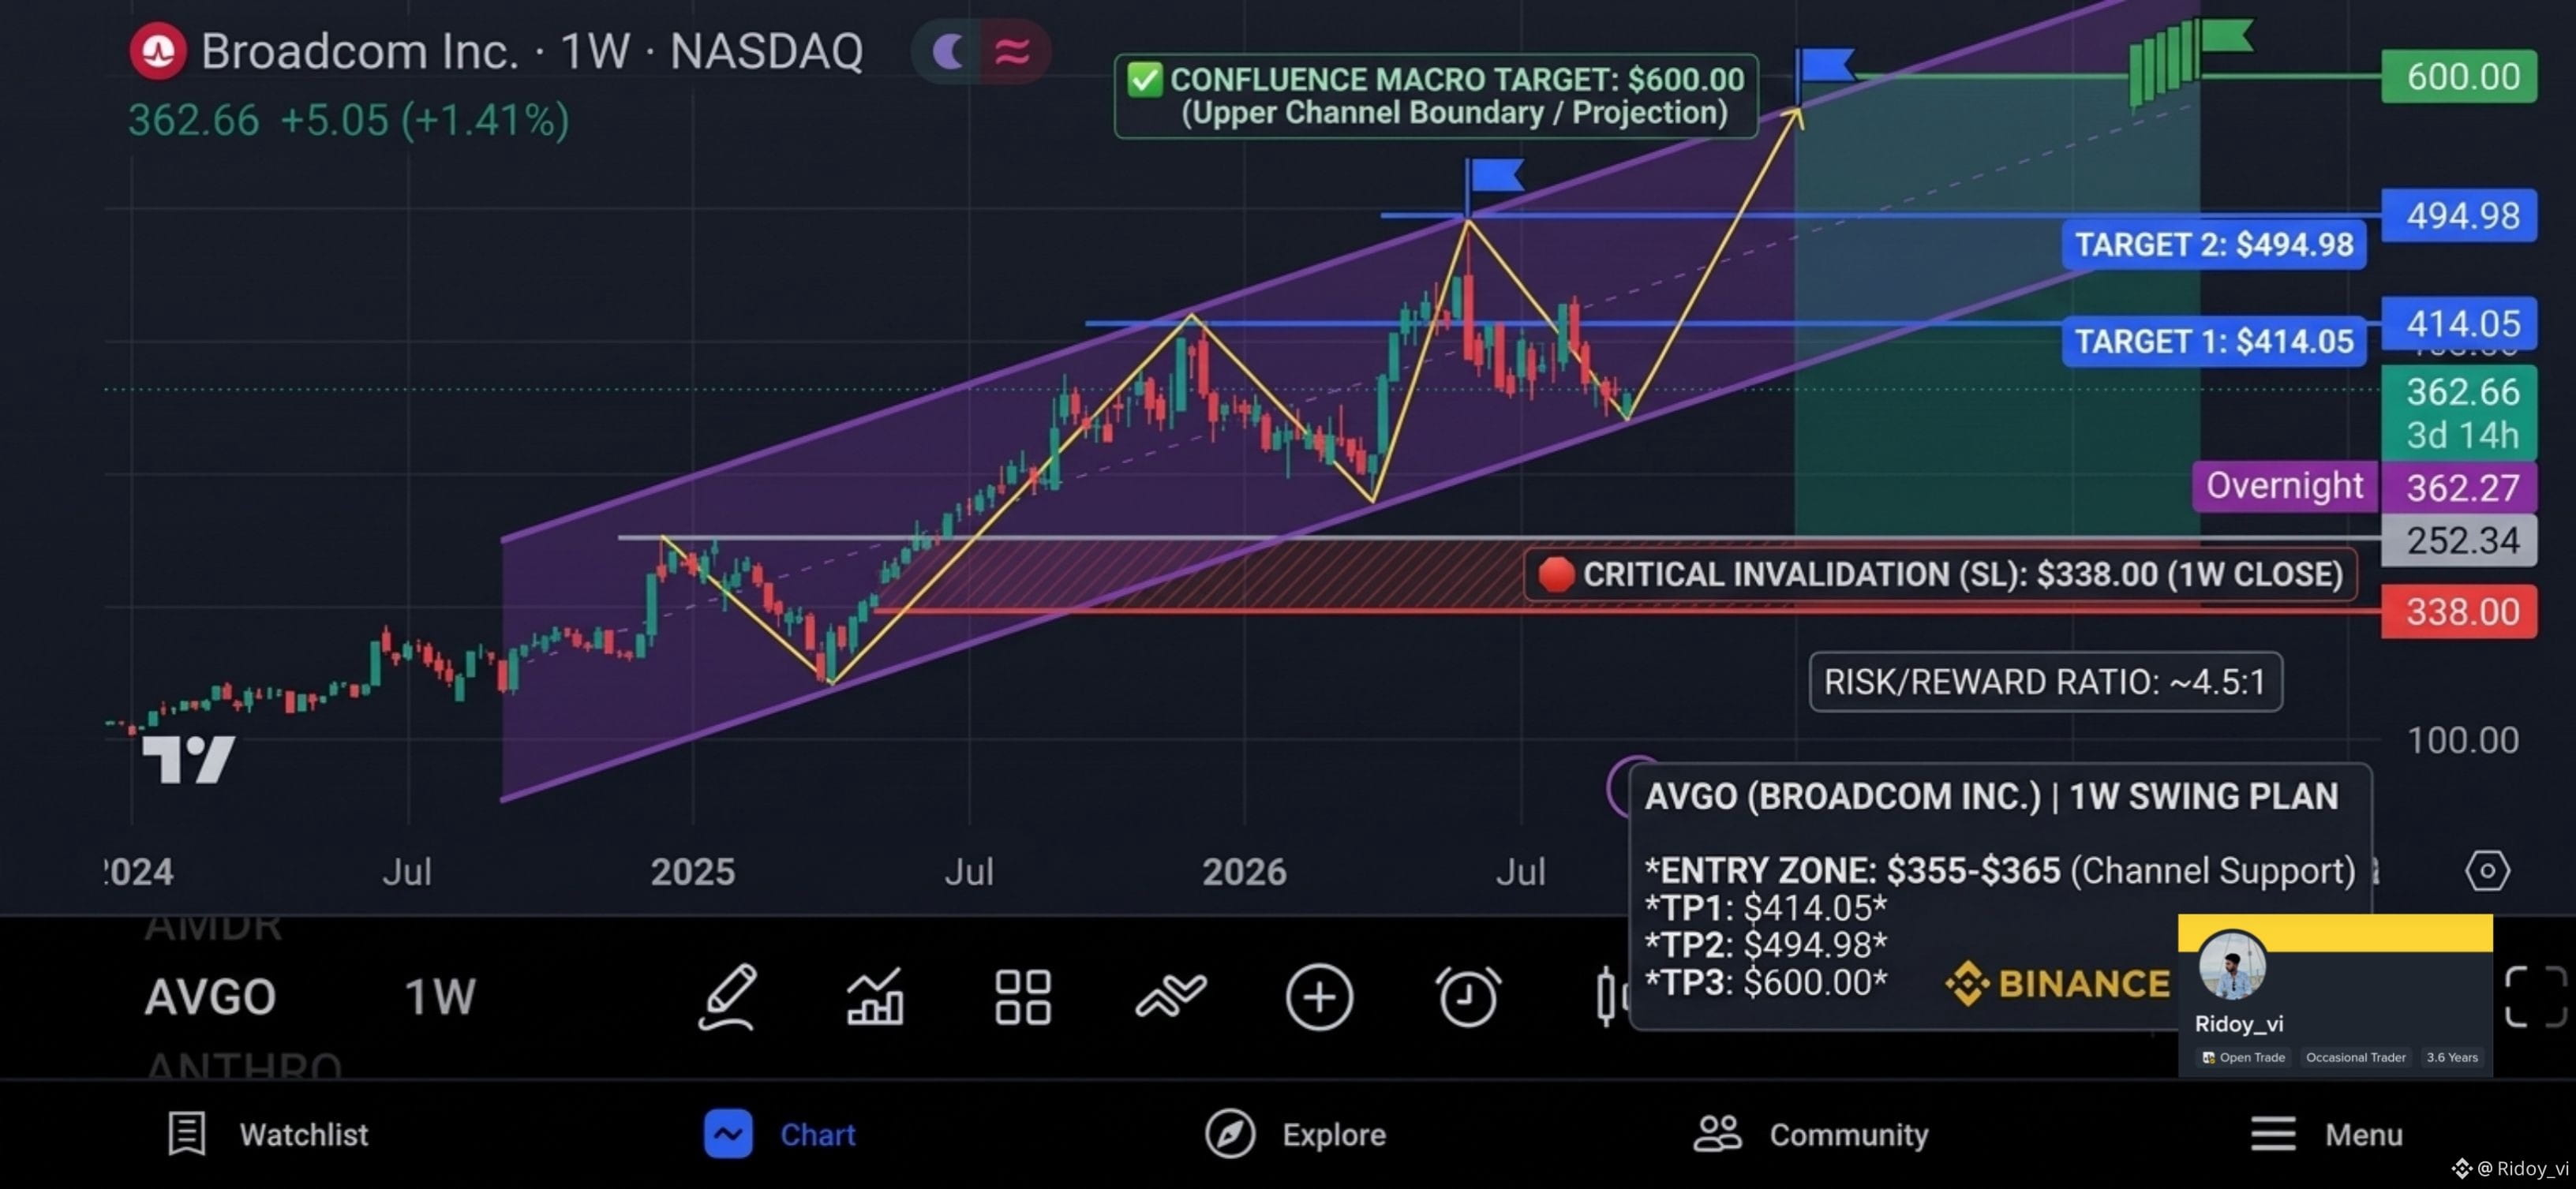
Broadcom ($AVGO) is currently trading at $362.66, retesting the lower boundary of its multi-year weekly ascending channel. This high-timeframe structural support offers an asymmetric risk-to-reward swing setup.
🟢 BULLISH MACRO SWING PLAN
Entry Zone: $355.00 – $365.00 (Channel Floor Support)
Target 1 (TP1): $414.05 🎯 (Scale out partials & adjust SL to breakeven)
Target 2 (TP2): $494.98 🎯 (Previous Peak)
Macro Target (TP3): $600.00 🎯 (Upper Channel Boundary)
Invalidation (SL): Weekly candle body close below $338.00 🛑
⚠️ RISK MANAGEMENT: Swing positions on a 1W chart require patience over months. Ensure position sizing accounts for the $338 invalidation level.
Is AVGO ready to bounce toward $600 or break lower? Share your bias below! 👇
#AVGO #Broadcom #Stocks #Tech #TradingSignals #BinanceSquare #TechnicalAnalysis
Option 2: Quick Signal Checklist
📊 $AVGO 1W Macro Channel Setup
Current Price: $362.66
Chart Timeframe: 1-Week (NASDAQ)
📈 Trade Execution Parameters:
Entry Range: $355.00 – $365.00
TP1: $414.05
TP2: $494.98
TP3: $600.00
Stop-Loss (SL): $338.00 (1W Close Invalidation)
{stock_us}(AVGO.US)
📉 Key Breakdown Level:
Bearish Trigger: Weekly close < $340.00 → Target $252.34
📌 Strategy Note: Entering near the channel bottom keeps risk minimal ($338 SL) while targeting upside expansion toward upper channel resistance.
#AVGO #stockmarket
🚨 AVGO (Broadcom) 1W Setup: Multi-Year Channel Support Test! 🚨
Broadcom ($AVGO) is currently trading at $362.66, retesting the lower boundary of its multi-year weekly ascending channel. This high-timeframe structural support offers an asymmetric risk-to-reward swing setup.
🟢 BULLISH MACRO SWING PLAN
Entry Zone: $355.00 – $365.00 (Channel Floor Support)
Target 1 (TP1): $414.05 🎯 (Scale out partials & adjust SL to breakeven)
Target 2 (TP2): $494.98 🎯 (Previous Peak)
Macro Target (TP3): $600.00 🎯 (Upper Channel Boundary)
Invalidation (SL): Weekly candle body close below $338.00 🛑
⚠️ RISK MANAGEMENT: Swing positions on a 1W chart require patience over months. Ensure position sizing accounts for the $338 invalidation level.
Is AVGO ready to bounce toward $600 or break lower? Share your bias below! 👇
#AVGO #Broadcom #Stocks #Tech #TradingSignals #BinanceSquare #TechnicalAnalysis
Option 2: Quick Signal Checklist
📊 $AVGO 1W Macro Channel Setup
Current Price: $362.66
Chart Timeframe: 1-Week (NASDAQ)
📈 Trade Execution Parameters:
Entry Range: $355.00 – $365.00
TP1: $414.05
TP2: $494.98
TP3: $600.00
Stop-Loss (SL): $338.00 (1W Close Invalidation)
📉 Key Breakdown Level:
Bearish Trigger: Weekly close < $340.00 → Target $252.34
📌 Strategy Note: Entering near the channel bottom keeps risk minimal ($338 SL) while targeting upside expansion toward upper channel resistance.
#AVGO #stockmarket
Broadcom ($AVGO) is currently trading at $362.66, retesting the lower boundary of its multi-year weekly ascending channel. This high-timeframe structural support offers an asymmetric risk-to-reward swing setup.
🟢 BULLISH MACRO SWING PLAN
Entry Zone: $355.00 – $365.00 (Channel Floor Support)
Target 1 (TP1): $414.05 🎯 (Scale out partials & adjust SL to breakeven)
Target 2 (TP2): $494.98 🎯 (Previous Peak)
Macro Target (TP3): $600.00 🎯 (Upper Channel Boundary)
Invalidation (SL): Weekly candle body close below $338.00 🛑
⚠️ RISK MANAGEMENT: Swing positions on a 1W chart require patience over months. Ensure position sizing accounts for the $338 invalidation level.
Is AVGO ready to bounce toward $600 or break lower? Share your bias below! 👇
#AVGO #Broadcom #Stocks #Tech #TradingSignals #BinanceSquare #TechnicalAnalysis
Option 2: Quick Signal Checklist
📊 $AVGO 1W Macro Channel Setup
Current Price: $362.66
Chart Timeframe: 1-Week (NASDAQ)
📈 Trade Execution Parameters:
Entry Range: $355.00 – $365.00
TP1: $414.05
TP2: $494.98
TP3: $600.00
Stop-Loss (SL): $338.00 (1W Close Invalidation)
📉 Key Breakdown Level:
Bearish Trigger: Weekly close < $340.00 → Target $252.34
📌 Strategy Note: Entering near the channel bottom keeps risk minimal ($338 SL) while targeting upside expansion toward upper channel resistance.
#AVGO #stockmarket
AVGO-0.16%
AVGOUS+0.74%
166

·
--
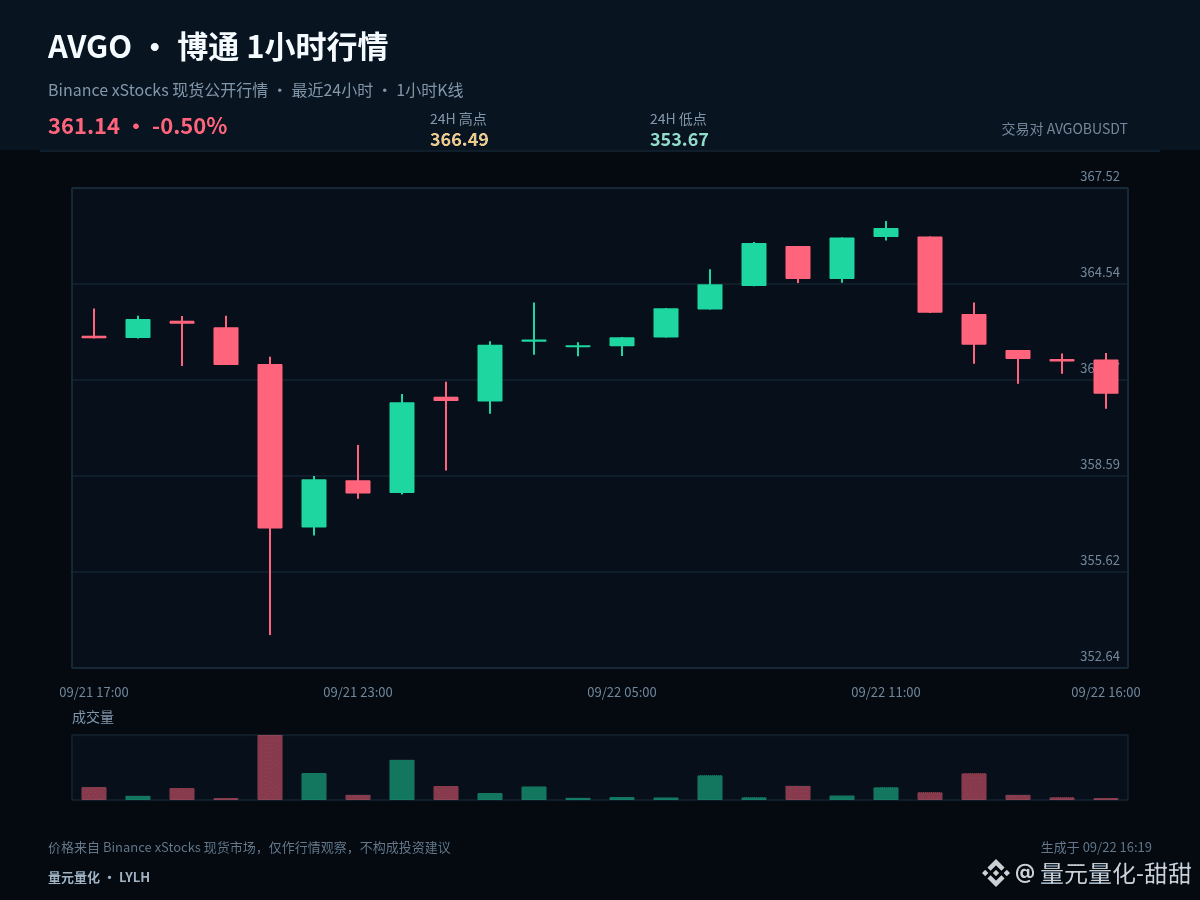
$AVGOB #AVGO If in this round we only keep one observation price, I would choose 360.08. The current price is 361.14; in the past 1 hour it is -0.28%, and in the past 24 hours it is -0.34%. The gain/loss of the central axis can help filter out a lot of intraday noise.
The price has not yet reclaimed 360.08. For now, treat the current rebound as a weak repair; a true turn for strength needs proof from a stable close. If it turns weak again, 353.67 is the next level to observe whether the selling pressure is fading.
Currently, 1 hour is -0.28% and 24 hours is -0.34%. Across these two periods, there hasn’t been sufficiently clear same-direction alignment. In a range-bound market, the margin for error when chasing or cutting is lower. It’s better to use the upper boundary to confirm direction, and the lower boundary to confirm support. The central axis serves only as the line between strength and weakness.
For execution, set clear conditions: after breaking above 366.49, you need confirmation—not chasing just because you see a brief spike. After dipping to 353.67, you need to see whether it can quickly pull back—not catch every drop. When the middle region doesn’t offer enough odds, waiting is also part of the strategy.
For positions you already hold, you can handle them in segments based on key levels to avoid making all decisions at once. Those who are currently in cash should wait for confirmation of a breakout or a pullback that stabilizes. For US stock-related targets, also pay attention to volatility caused by trading session transitions. Your plan should be based on price conditions, not emotion replacing execution.
For the next 1-hour candle: if it closes above 360.08, the structure will be more proactive; if it closes below, continue to be cautious. Which path are you leaning toward right now?
#AIStocksWhatNext
$AVGOB #AVGO If in this round we only keep one observation price, I would choose 360.08. The current price is 361.14; in the past 1 hour it is -0.28%, and in the past 24 hours it is -0.34%. The gain/loss of the central axis can help filter out a lot of intraday noise.
The price has not yet reclaimed 360.08. For now, treat the current rebound as a weak repair; a true turn for strength needs proof from a stable close. If it turns weak again, 353.67 is the next level to observe whether the selling pressure is fading.
Currently, 1 hour is -0.28% and 24 hours is -0.34%. Across these two periods, there hasn’t been sufficiently clear same-direction alignment. In a range-bound market, the margin for error when chasing or cutting is lower. It’s better to use the upper boundary to confirm direction, and the lower boundary to confirm support. The central axis serves only as the line between strength and weakness.
For execution, set clear conditions: after breaking above 366.49, you need confirmation—not chasing just because you see a brief spike. After dipping to 353.67, you need to see whether it can quickly pull back—not catch every drop. When the middle region doesn’t offer enough odds, waiting is also part of the strategy.
For positions you already hold, you can handle them in segments based on key levels to avoid making all decisions at once. Those who are currently in cash should wait for confirmation of a breakout or a pullback that stabilizes. For US stock-related targets, also pay attention to volatility caused by trading session transitions. Your plan should be based on price conditions, not emotion replacing execution.
For the next 1-hour candle: if it closes above 360.08, the structure will be more proactive; if it closes below, continue to be cautious. Which path are you leaning toward right now?
#AIStocksWhatNext
The price has not yet reclaimed 360.08. For now, treat the current rebound as a weak repair; a true turn for strength needs proof from a stable close. If it turns weak again, 353.67 is the next level to observe whether the selling pressure is fading.
Currently, 1 hour is -0.28% and 24 hours is -0.34%. Across these two periods, there hasn’t been sufficiently clear same-direction alignment. In a range-bound market, the margin for error when chasing or cutting is lower. It’s better to use the upper boundary to confirm direction, and the lower boundary to confirm support. The central axis serves only as the line between strength and weakness.
For execution, set clear conditions: after breaking above 366.49, you need confirmation—not chasing just because you see a brief spike. After dipping to 353.67, you need to see whether it can quickly pull back—not catch every drop. When the middle region doesn’t offer enough odds, waiting is also part of the strategy.
For positions you already hold, you can handle them in segments based on key levels to avoid making all decisions at once. Those who are currently in cash should wait for confirmation of a breakout or a pullback that stabilizes. For US stock-related targets, also pay attention to volatility caused by trading session transitions. Your plan should be based on price conditions, not emotion replacing execution.
For the next 1-hour candle: if it closes above 360.08, the structure will be more proactive; if it closes below, continue to be cautious. Which path are you leaning toward right now?
#AIStocksWhatNext
2

·
--
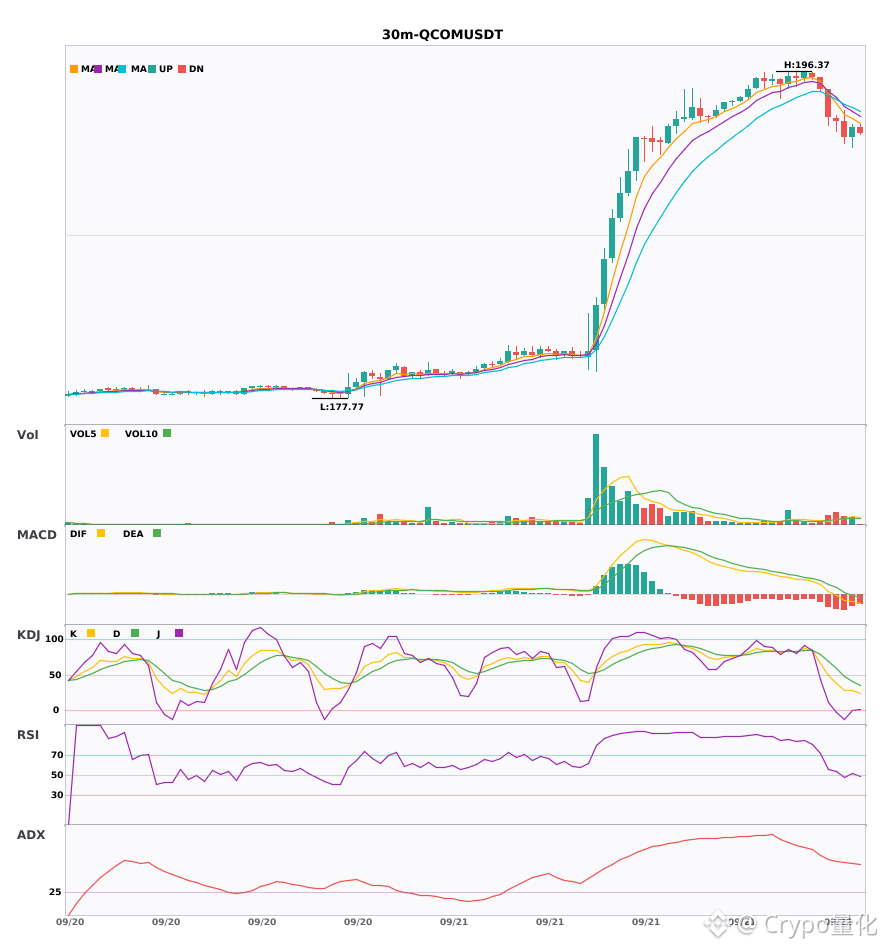
$SAMSUNG / $AVGO / $QCOM 30-minute timeframe slightly bearish; short-term pressure 🔥
════════════════════
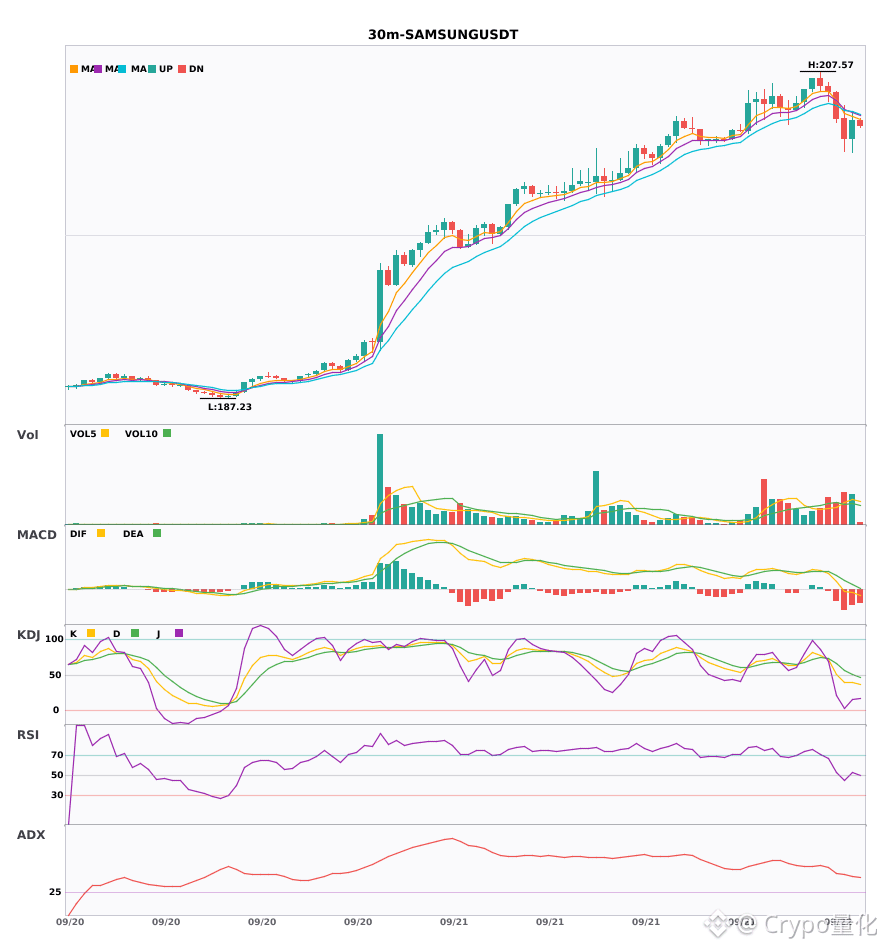
🟢 $SAMSUNG 30-minute bearish signal
⚠️ Technicals: ADX(44) shows a clear trending market | MACD DIF breaks below the zero axis, trend turns bearish | EMA5 crosses below EMA8, short-term turns bearish | Volume expands (1.6x)
════════════════════
🟢 $AVGO 30-minute bearish signal
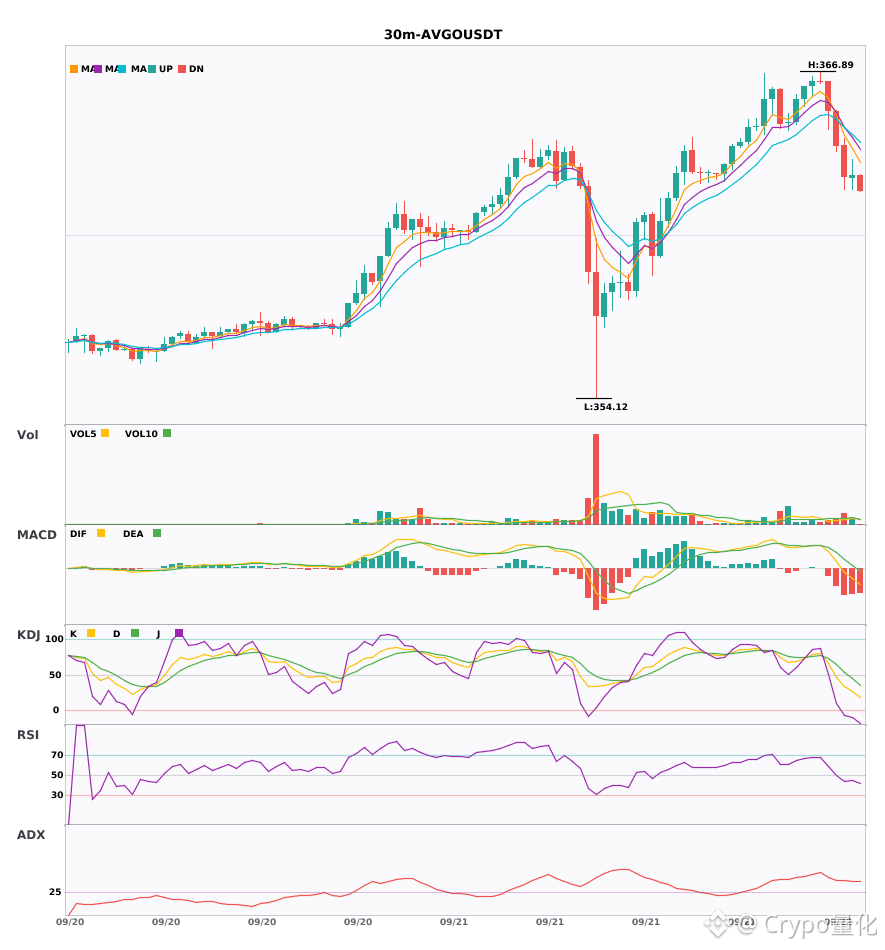
⚠️ Technicals: ADX(41) shows a clear trending market | MACD is running bearish; the trend is weak and momentum is decreasing | EMA5 < EMA8 < EMA13 bearish alignment | KDJ is weak; bears are in control (K=26.6, D=44.9) | Volume expands (1.6x)
📢 Market update: Binance will support the Broadcom (AVGO), Invesco QQQ Trust (QQQ), Meta (META), and Seagate (STX) cash dividend distribution via bStocks
════════════════════
🟢 $QCOM 30-minute bearish signal
⚠️ Technicals: ADX(57) extremely strong trend (be cautious of an overheated pullback) | MACD is running bearish; trend is weak with increasing momentum | EMA5 < EMA8 < EMA13 bearish alignment | KDJ is weak; bears are in control (K=28.3, D=48.4) | Volume expands (2.2x)
════════════════════
🔔 Watch and get first-hand info on intraday market anomalies 🔔
#技术分析 #SAMSUNG #AVGO #QCOM
📌 When trading, pay attention to whether the candlestick pattern matches
$SAMSUNG / $AVGO / $QCOM 30-minute timeframe slightly bearish; short-term pressure 🔥
════════════════════
🟢 $SAMSUNG 30-minute bearish signal
⚠️ Technicals: ADX(44) shows a clear trending market | MACD DIF breaks below the zero axis, trend turns bearish | EMA5 crosses below EMA8, short-term turns bearish | Volume expands (1.6x)
════════════════════
🟢 $AVGO 30-minute bearish signal
⚠️ Technicals: ADX(41) shows a clear trending market | MACD is running bearish; the trend is weak and momentum is decreasing | EMA5 < EMA8 < EMA13 bearish alignment | KDJ is weak; bears are in control (K=26.6, D=44.9) | Volume expands (1.6x)
📢 Market update: Binance will support the Broadcom (AVGO), Invesco QQQ Trust (QQQ), Meta (META), and Seagate (STX) cash dividend distribution via bStocks
════════════════════
🟢 $QCOM 30-minute bearish signal
⚠️ Technicals: ADX(57) extremely strong trend (be cautious of an overheated pullback) | MACD is running bearish; trend is weak with increasing momentum | EMA5 < EMA8 < EMA13 bearish alignment | KDJ is weak; bears are in control (K=28.3, D=48.4) | Volume expands (2.2x)
════════════════════
🔔 Watch and get first-hand info on intraday market anomalies 🔔
#技术分析 #SAMSUNG #AVGO #QCOM
📌 When trading, pay attention to whether the candlestick pattern matches
════════════════════
🟢 $SAMSUNG 30-minute bearish signal
⚠️ Technicals: ADX(44) shows a clear trending market | MACD DIF breaks below the zero axis, trend turns bearish | EMA5 crosses below EMA8, short-term turns bearish | Volume expands (1.6x)
════════════════════
🟢 $AVGO 30-minute bearish signal
⚠️ Technicals: ADX(41) shows a clear trending market | MACD is running bearish; the trend is weak and momentum is decreasing | EMA5 < EMA8 < EMA13 bearish alignment | KDJ is weak; bears are in control (K=26.6, D=44.9) | Volume expands (1.6x)
📢 Market update: Binance will support the Broadcom (AVGO), Invesco QQQ Trust (QQQ), Meta (META), and Seagate (STX) cash dividend distribution via bStocks
════════════════════
🟢 $QCOM 30-minute bearish signal
⚠️ Technicals: ADX(57) extremely strong trend (be cautious of an overheated pullback) | MACD is running bearish; trend is weak with increasing momentum | EMA5 < EMA8 < EMA13 bearish alignment | KDJ is weak; bears are in control (K=28.3, D=48.4) | Volume expands (2.2x)
════════════════════
🔔 Watch and get first-hand info on intraday market anomalies 🔔
#技术分析 #SAMSUNG #AVGO #QCOM
📌 When trading, pay attention to whether the candlestick pattern matches
116

·
--
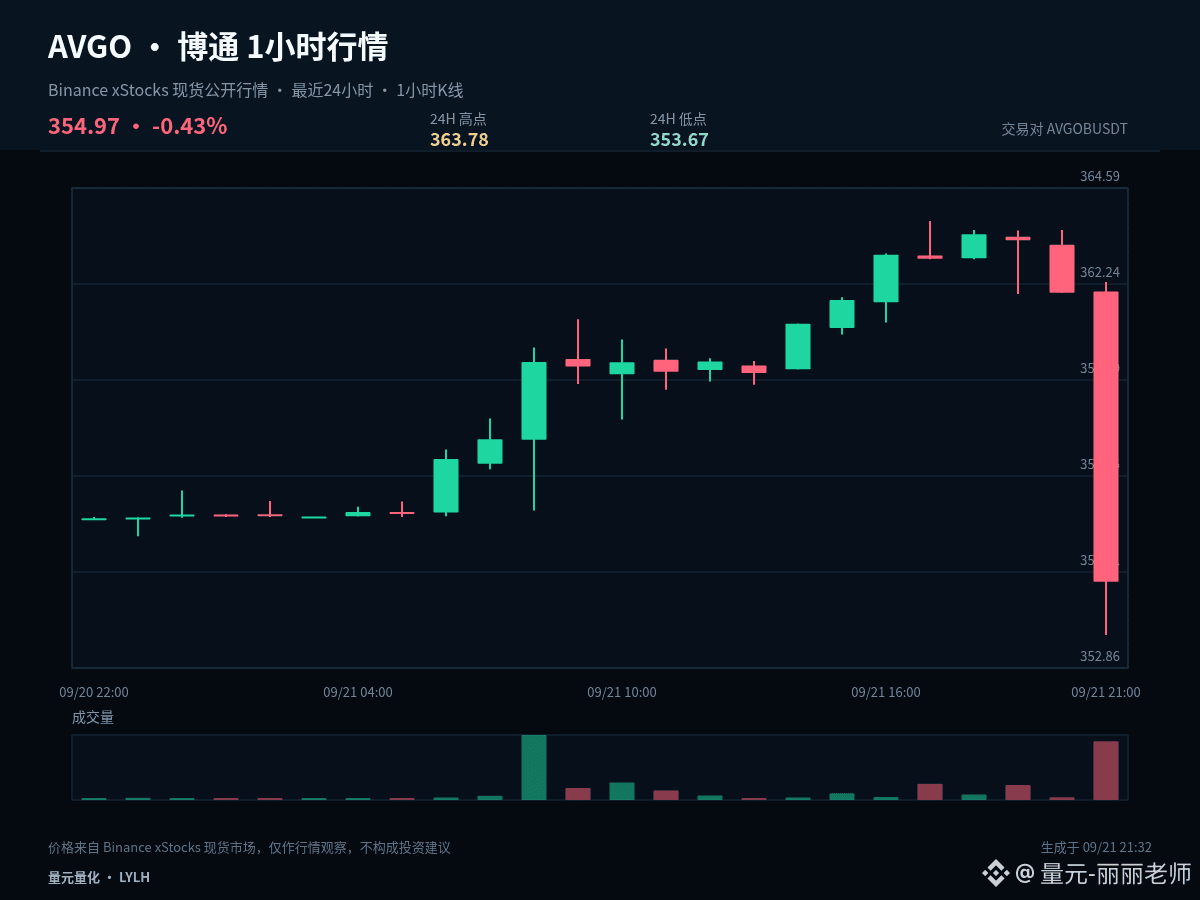
$AVGOB #AVGO If I have to keep only one observation price for this round, I would choose 358.725. Current price: 354.97. 1 hour: -1.95%, 24 hours: -0.34%. The gain/loss around the midline can help filter out a lot of intraday noise.
Price has not yet reclaimed 358.725. For now, treat the current rebound as a weak repair. True strength needs to be proven by consistent closes. If it turns weaker again, 353.67 will be the next level to watch for whether the sell pressure is fading.
The current price is close to the lower bound of the past 24 hours’ range: 1 hour -1.95%, 24 hours -0.34%. The core of low-level analysis is not trying to bottom early—it’s observing whether price can quickly reclaim after a breakdown. If it can reclaim, it suggests sell pressure is being absorbed. If it keeps lingering below the lower bound, it means the weakness hasn’t ended yet.
Execution should follow clear conditions: after a breakout above 363.78, you need confirmation—not chasing just because of a sudden spike. After dipping to 353.67, you should watch whether it can quickly reclaim—not catching just because price is falling. In the middle zone, if the reward-to-risk isn’t sufficient, waiting is also part of the strategy.
Position management should distinguish between swing (mid-term) and short-term trades. For existing swing positions, first check whether the structure is broken; don’t let repeated fluctuations from a single 1-hour candlestick keep swaying you. Short-term positions should be executed around support, resistance, and close confirmation. If you’re currently in cash, there’s no need to chase the price in the middle of the range—waiting for a clearer location is often more advantageous.
The real divergence in this market comes down to whether it continues or reverts to the range. Will you wait for a confirmed breakout, or wait for a support retest? Tell me which price you’re most focused on.
#BuffettStepsDownAsBerkshireChairman
$AVGOB #AVGO If I have to keep only one observation price for this round, I would choose 358.725. Current price: 354.97. 1 hour: -1.95%, 24 hours: -0.34%. The gain/loss around the midline can help filter out a lot of intraday noise.
Price has not yet reclaimed 358.725. For now, treat the current rebound as a weak repair. True strength needs to be proven by consistent closes. If it turns weaker again, 353.67 will be the next level to watch for whether the sell pressure is fading.
The current price is close to the lower bound of the past 24 hours’ range: 1 hour -1.95%, 24 hours -0.34%. The core of low-level analysis is not trying to bottom early—it’s observing whether price can quickly reclaim after a breakdown. If it can reclaim, it suggests sell pressure is being absorbed. If it keeps lingering below the lower bound, it means the weakness hasn’t ended yet.
Execution should follow clear conditions: after a breakout above 363.78, you need confirmation—not chasing just because of a sudden spike. After dipping to 353.67, you should watch whether it can quickly reclaim—not catching just because price is falling. In the middle zone, if the reward-to-risk isn’t sufficient, waiting is also part of the strategy.
Position management should distinguish between swing (mid-term) and short-term trades. For existing swing positions, first check whether the structure is broken; don’t let repeated fluctuations from a single 1-hour candlestick keep swaying you. Short-term positions should be executed around support, resistance, and close confirmation. If you’re currently in cash, there’s no need to chase the price in the middle of the range—waiting for a clearer location is often more advantageous.
The real divergence in this market comes down to whether it continues or reverts to the range. Will you wait for a confirmed breakout, or wait for a support retest? Tell me which price you’re most focused on.
#BuffettStepsDownAsBerkshireChairman
Price has not yet reclaimed 358.725. For now, treat the current rebound as a weak repair. True strength needs to be proven by consistent closes. If it turns weaker again, 353.67 will be the next level to watch for whether the sell pressure is fading.
The current price is close to the lower bound of the past 24 hours’ range: 1 hour -1.95%, 24 hours -0.34%. The core of low-level analysis is not trying to bottom early—it’s observing whether price can quickly reclaim after a breakdown. If it can reclaim, it suggests sell pressure is being absorbed. If it keeps lingering below the lower bound, it means the weakness hasn’t ended yet.
Execution should follow clear conditions: after a breakout above 363.78, you need confirmation—not chasing just because of a sudden spike. After dipping to 353.67, you should watch whether it can quickly reclaim—not catching just because price is falling. In the middle zone, if the reward-to-risk isn’t sufficient, waiting is also part of the strategy.
Position management should distinguish between swing (mid-term) and short-term trades. For existing swing positions, first check whether the structure is broken; don’t let repeated fluctuations from a single 1-hour candlestick keep swaying you. Short-term positions should be executed around support, resistance, and close confirmation. If you’re currently in cash, there’s no need to chase the price in the middle of the range—waiting for a clearer location is often more advantageous.
The real divergence in this market comes down to whether it continues or reverts to the range. Will you wait for a confirmed breakout, or wait for a support retest? Tell me which price you’re most focused on.
#BuffettStepsDownAsBerkshireChairman
1
18
·
--
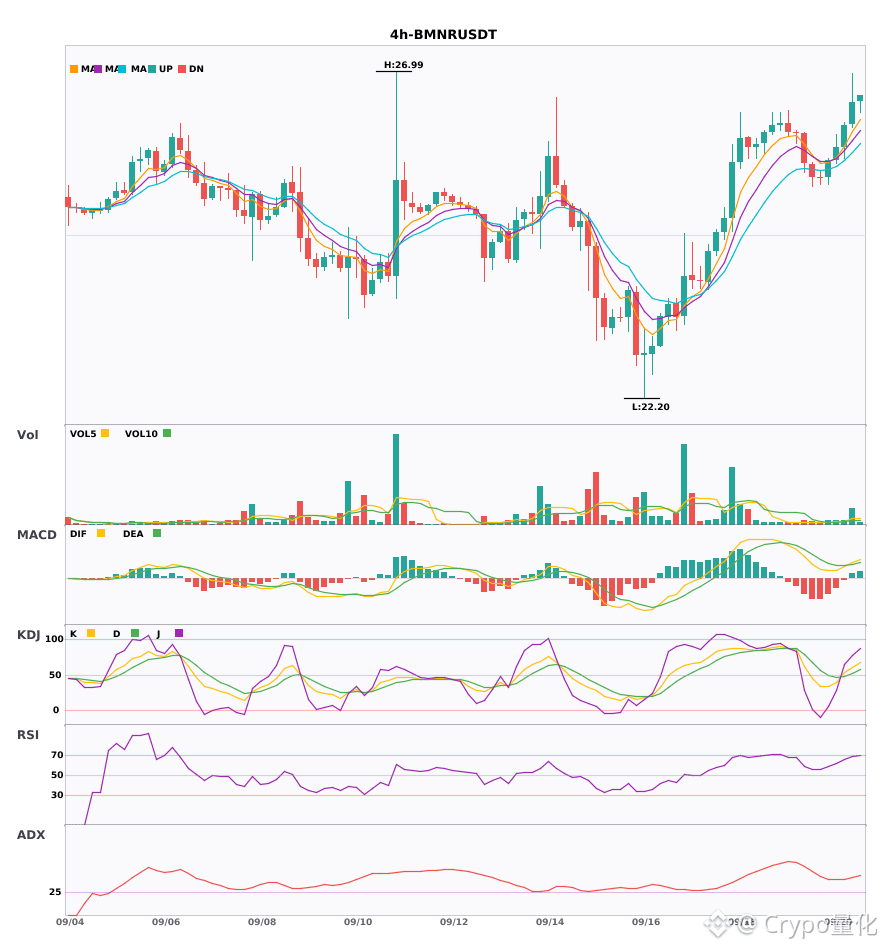
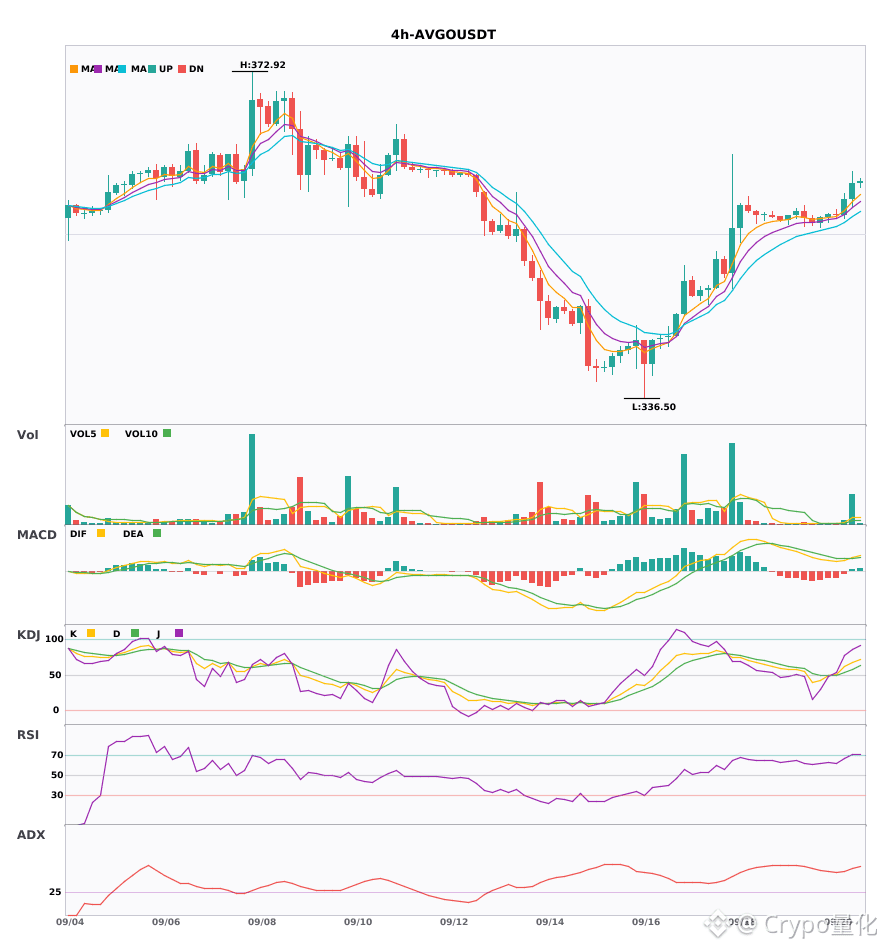
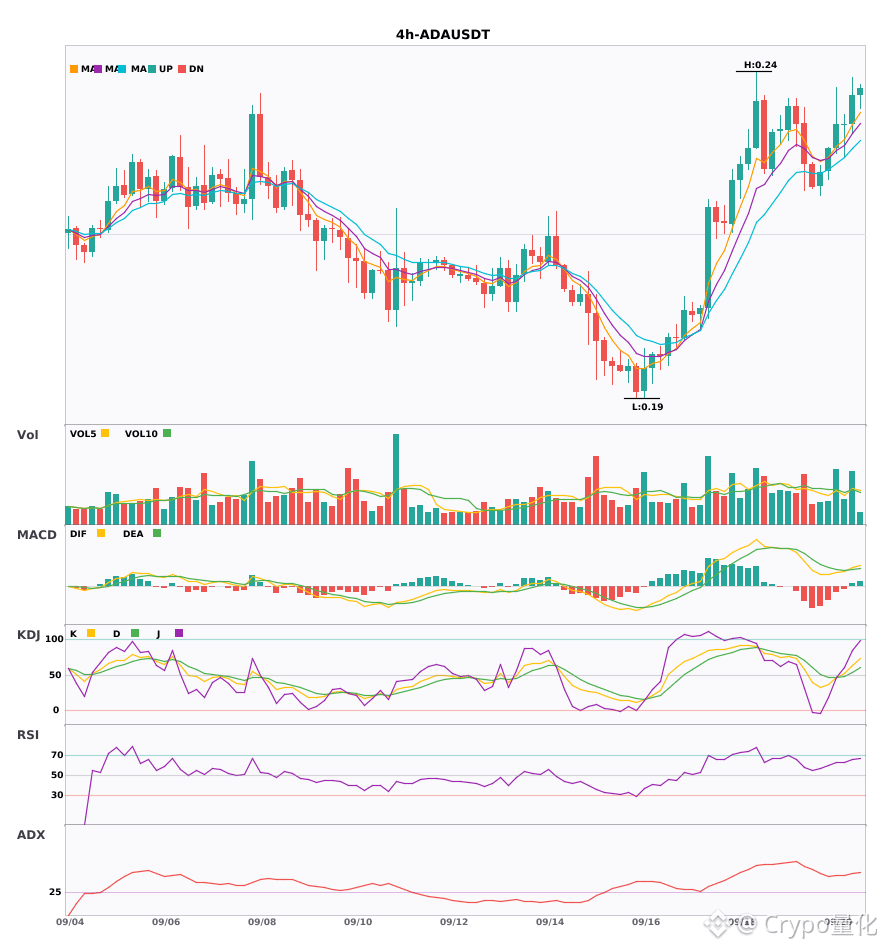
$BMNR / $AVGO / $ADA 4 hours resonance turning from multi to multi; bullish signals appear simultaneously 🔥
════════════════════
🔴 $BMNR 4-hour bullish signal
⚠️ Technicals: ADX (41) indicates a clear trending market | MACD forms a golden cross above the zero line, bullish momentum released | EMA5 > EMA8 > EMA13 with a bullish alignment | KDJ is running strongly, bulls dominant (K is 60.7, D is 52.6) | Volume spikes (3.7x)
════════════════════
🔴 $AVGO 4-hour bullish signal
⚠️ Technicals: ADX (52) is a very strong trend (watch out for an overheating pullback) | MACD forms a golden cross above the zero line, bullish momentum released | EMA5 > EMA8 > EMA13 with a bullish alignment | KDJ is running strongly, bulls dominant (K is 67.1, D is 58.1) | Volume spikes (6.7x)
📢 Market update: Binance will support Broadcom (AVGO), Invesco QQQ Trust (QQQ), Meta (META), and Seagate (STX) with cash dividend distributions via bStocks.
════════════════════
🔴 $ADA 4 4-hour bullish signal
⚠️ Technicals: ADX (45) indicates a clear trending market | MACD forms a golden cross above the zero line, bullish momentum released | EMA5 > EMA8 > EMA13 with a bullish alignment | KDJ is running strongly, bulls dominant (K is 63.5, D is 53.5) | Volume expands (1.5x)
════════════════════
🔔 Watch for first-hand market moves and anomalies 🔔
#技术分析 #BMNR #AVGO #ADA
📌 When trading, pay attention to whether the candlestick pattern matches
$BMNR / $AVGO / $ADA 4 hours resonance turning from multi to multi; bullish signals appear simultaneously 🔥
════════════════════
🔴 $BMNR 4-hour bullish signal
⚠️ Technicals: ADX (41) indicates a clear trending market | MACD forms a golden cross above the zero line, bullish momentum released | EMA5 > EMA8 > EMA13 with a bullish alignment | KDJ is running strongly, bulls dominant (K is 60.7, D is 52.6) | Volume spikes (3.7x)
════════════════════
🔴 $AVGO 4-hour bullish signal
⚠️ Technicals: ADX (52) is a very strong trend (watch out for an overheating pullback) | MACD forms a golden cross above the zero line, bullish momentum released | EMA5 > EMA8 > EMA13 with a bullish alignment | KDJ is running strongly, bulls dominant (K is 67.1, D is 58.1) | Volume spikes (6.7x)
📢 Market update: Binance will support Broadcom (AVGO), Invesco QQQ Trust (QQQ), Meta (META), and Seagate (STX) with cash dividend distributions via bStocks.
════════════════════
🔴 $ADA 4 4-hour bullish signal
⚠️ Technicals: ADX (45) indicates a clear trending market | MACD forms a golden cross above the zero line, bullish momentum released | EMA5 > EMA8 > EMA13 with a bullish alignment | KDJ is running strongly, bulls dominant (K is 63.5, D is 53.5) | Volume expands (1.5x)
════════════════════
🔔 Watch for first-hand market moves and anomalies 🔔
#技术分析 #BMNR #AVGO #ADA
📌 When trading, pay attention to whether the candlestick pattern matches
════════════════════
🔴 $BMNR 4-hour bullish signal
⚠️ Technicals: ADX (41) indicates a clear trending market | MACD forms a golden cross above the zero line, bullish momentum released | EMA5 > EMA8 > EMA13 with a bullish alignment | KDJ is running strongly, bulls dominant (K is 60.7, D is 52.6) | Volume spikes (3.7x)
════════════════════
🔴 $AVGO 4-hour bullish signal
⚠️ Technicals: ADX (52) is a very strong trend (watch out for an overheating pullback) | MACD forms a golden cross above the zero line, bullish momentum released | EMA5 > EMA8 > EMA13 with a bullish alignment | KDJ is running strongly, bulls dominant (K is 67.1, D is 58.1) | Volume spikes (6.7x)
📢 Market update: Binance will support Broadcom (AVGO), Invesco QQQ Trust (QQQ), Meta (META), and Seagate (STX) with cash dividend distributions via bStocks.
════════════════════
🔴 $ADA 4 4-hour bullish signal
⚠️ Technicals: ADX (45) indicates a clear trending market | MACD forms a golden cross above the zero line, bullish momentum released | EMA5 > EMA8 > EMA13 with a bullish alignment | KDJ is running strongly, bulls dominant (K is 63.5, D is 53.5) | Volume expands (1.5x)
════════════════════
🔔 Watch for first-hand market moves and anomalies 🔔
#技术分析 #BMNR #AVGO #ADA
📌 When trading, pay attention to whether the candlestick pattern matches
136
·
--
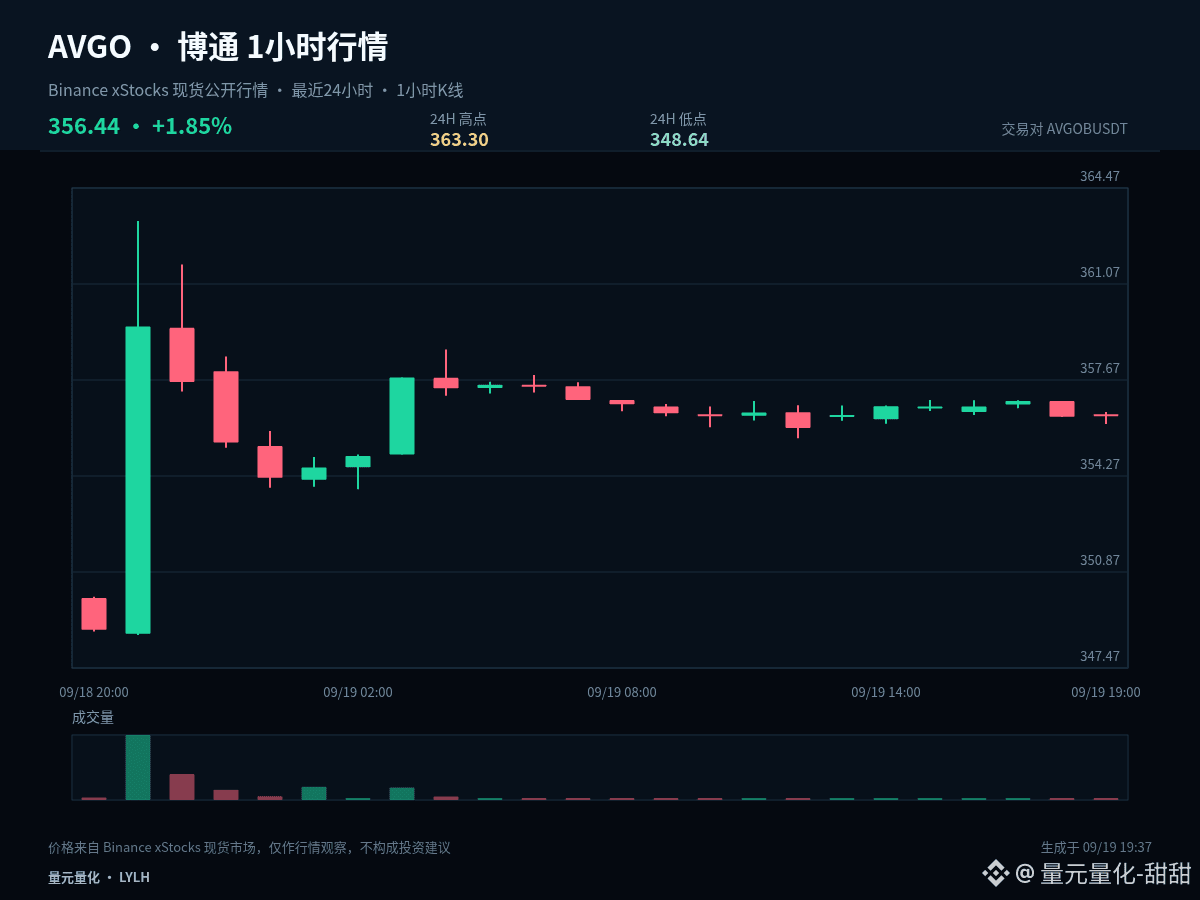
$AVGOB #AVGO From a positioning perspective, the key is not to chase fluctuations that have already occurred, but to determine in advance the position you are willing to wait for. Current price 356.44, +0.02% in the past 1 hour, +1.75% in the past 24 hours.
Currently +0.02% over 1 hour and +1.75% over 24 hours: the two cycles have not formed sufficiently clear alignment in the same direction. In a range-bound market, the tolerance for buying high and selling low is low. It is more suitable to use the confirmation of the upper bound to confirm direction, and the confirmation of the lower bound to confirm support/resumption. The midline should only be used as the line separating strength and weakness.
The first observation zone is 355.97, used to judge whether an ordinary pullback has ended. The second observation zone is 348.64, used to judge whether a deeper retracement can form a continuation/support signal. To the upside, pay attention to 363.3; after a breakout, you should look for a pullback confirmation to avoid mistaking a brief penetration for the trend being fully opened.
For existing positions, you can handle them in stages based on key levels to avoid making all decisions at once. For those with no position, wait for confirmation of a breakout or for stabilization after a pullback. For US stock instruments, also be mindful of volatility caused by trading session switches. Your plan should be based on price conditions; do not let emotions replace execution.
The purpose of scaling in/out is not to continuously lower your average cost, but to control the pace when the structure is still valid. Once key support fails, you should stop the original positioning plan and wait for a new price range to form.
A trading plan must include invalidation conditions. If your judgment is correct, you can realize profits in stages. If your judgment is wrong, you must also allow yourself to exit. You cannot use adding positions to conceal the fact that the original logic has changed. The market will update, and your viewpoint should adjust in line with the price evidence.
#BitcoinMarketCapTopsTesla
$AVGOB #AVGO From a positioning perspective, the key is not to chase fluctuations that have already occurred, but to determine in advance the position you are willing to wait for. Current price 356.44, +0.02% in the past 1 hour, +1.75% in the past 24 hours.
Currently +0.02% over 1 hour and +1.75% over 24 hours: the two cycles have not formed sufficiently clear alignment in the same direction. In a range-bound market, the tolerance for buying high and selling low is low. It is more suitable to use the confirmation of the upper bound to confirm direction, and the confirmation of the lower bound to confirm support/resumption. The midline should only be used as the line separating strength and weakness.
The first observation zone is 355.97, used to judge whether an ordinary pullback has ended. The second observation zone is 348.64, used to judge whether a deeper retracement can form a continuation/support signal. To the upside, pay attention to 363.3; after a breakout, you should look for a pullback confirmation to avoid mistaking a brief penetration for the trend being fully opened.
For existing positions, you can handle them in stages based on key levels to avoid making all decisions at once. For those with no position, wait for confirmation of a breakout or for stabilization after a pullback. For US stock instruments, also be mindful of volatility caused by trading session switches. Your plan should be based on price conditions; do not let emotions replace execution.
The purpose of scaling in/out is not to continuously lower your average cost, but to control the pace when the structure is still valid. Once key support fails, you should stop the original positioning plan and wait for a new price range to form.
A trading plan must include invalidation conditions. If your judgment is correct, you can realize profits in stages. If your judgment is wrong, you must also allow yourself to exit. You cannot use adding positions to conceal the fact that the original logic has changed. The market will update, and your viewpoint should adjust in line with the price evidence.
#BitcoinMarketCapTopsTesla
Currently +0.02% over 1 hour and +1.75% over 24 hours: the two cycles have not formed sufficiently clear alignment in the same direction. In a range-bound market, the tolerance for buying high and selling low is low. It is more suitable to use the confirmation of the upper bound to confirm direction, and the confirmation of the lower bound to confirm support/resumption. The midline should only be used as the line separating strength and weakness.
The first observation zone is 355.97, used to judge whether an ordinary pullback has ended. The second observation zone is 348.64, used to judge whether a deeper retracement can form a continuation/support signal. To the upside, pay attention to 363.3; after a breakout, you should look for a pullback confirmation to avoid mistaking a brief penetration for the trend being fully opened.
For existing positions, you can handle them in stages based on key levels to avoid making all decisions at once. For those with no position, wait for confirmation of a breakout or for stabilization after a pullback. For US stock instruments, also be mindful of volatility caused by trading session switches. Your plan should be based on price conditions; do not let emotions replace execution.
The purpose of scaling in/out is not to continuously lower your average cost, but to control the pace when the structure is still valid. Once key support fails, you should stop the original positioning plan and wait for a new price range to form.
A trading plan must include invalidation conditions. If your judgment is correct, you can realize profits in stages. If your judgment is wrong, you must also allow yourself to exit. You cannot use adding positions to conceal the fact that the original logic has changed. The market will update, and your viewpoint should adjust in line with the price evidence.
#BitcoinMarketCapTopsTesla
13
·
--
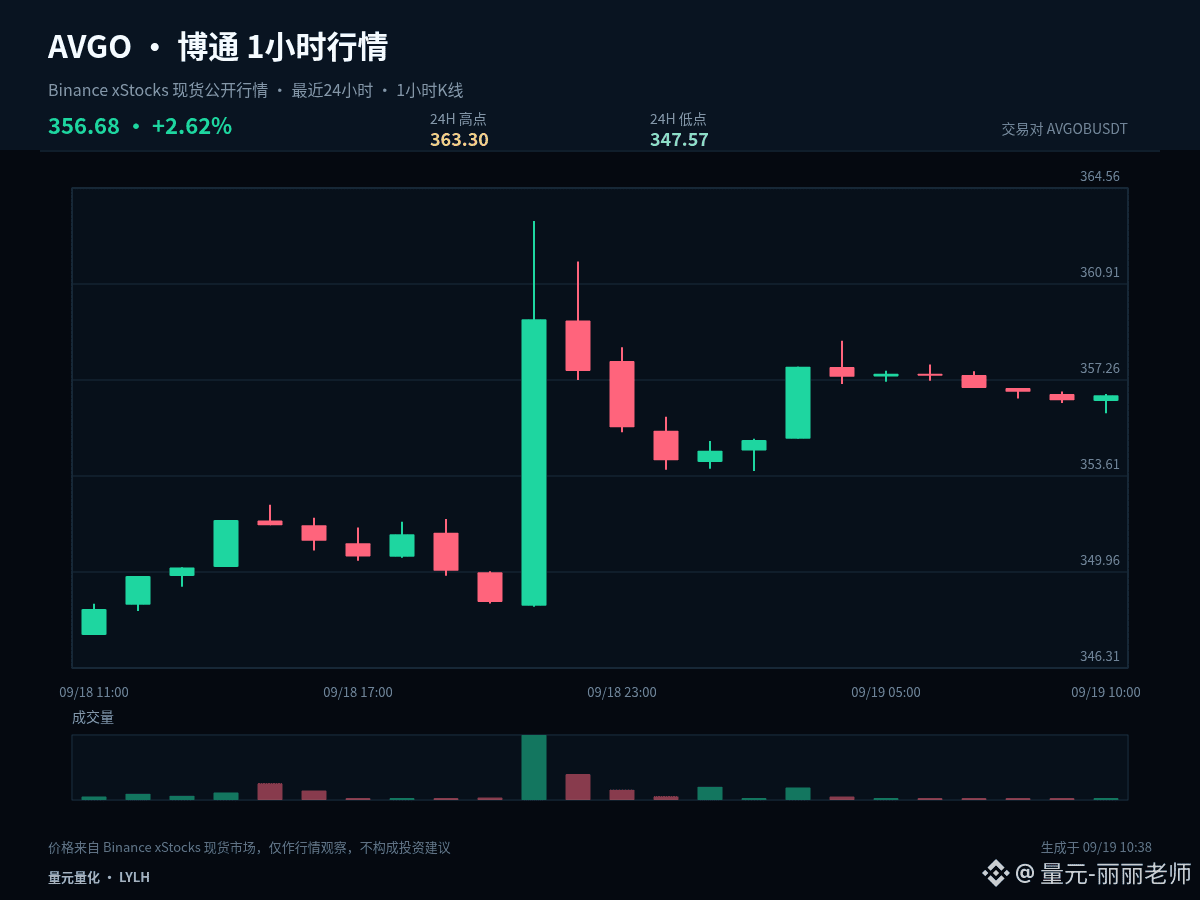
$AVGOB #AVGO This time, we break down the market from a position perspective. The same chart will highlight different focuses depending on whether you already hold positions or are sitting in cash. Current price is 356.68, with +0.05% over 1 hour and +2.56% over 24 hours.
Currently, +0.05% in the past 1 hour and +2.56% in the past 24 hours—these two timeframes have not yet formed sufficiently clear alignment in the same direction. In a range-bound market, the tolerance for chasing and killing trades is lower. It’s more suitable to use the upper boundary to confirm direction, and the lower boundary to confirm pullback/acceptance. The midline is only used as a boundary between strength and weakness.
If you already hold positions, first observe whether continuous rejection appears around 363.3, using 355.435 as the protective structure. If you are in cash (no position), don’t chase near resistance; wait for the pullback to the midline to show acceptance, or for a second confirmation after a breakout of resistance.
For the next path, handle it in three ways: if price successfully holds above 363.3, then wait to reassess after a pullback that doesn’t break; if price breaks down below 347.57, prioritize risk control and wait for new support; if price continues to range around 355.435, treat it as a rotation within the range—don’t repeatedly chase direction from the middle.
Position management needs to distinguish between swing (mid-term) and short-term trades. For existing swing positions, first check whether the structure is broken, and don’t be repeatedly swayed by a single 1-hour candlestick. For short-term positions, execute based on support, resistance, and confirmation at the close. If you’re currently in cash, you don’t need to chase price in the middle of the range—waiting for clearer locations is usually more advantageous.
The key for short-term positioning isn’t to predict every single candlestick, but to ensure that entries, de-risking, and exits all have a basis. If there’s no confirmation, do less. If a key level fails, rebuild the plan—first control single-trade risk, then discuss potential upside/downside space.
#BTCBreaks80K
$AVGOB #AVGO This time, we break down the market from a position perspective. The same chart will highlight different focuses depending on whether you already hold positions or are sitting in cash. Current price is 356.68, with +0.05% over 1 hour and +2.56% over 24 hours.
Currently, +0.05% in the past 1 hour and +2.56% in the past 24 hours—these two timeframes have not yet formed sufficiently clear alignment in the same direction. In a range-bound market, the tolerance for chasing and killing trades is lower. It’s more suitable to use the upper boundary to confirm direction, and the lower boundary to confirm pullback/acceptance. The midline is only used as a boundary between strength and weakness.
If you already hold positions, first observe whether continuous rejection appears around 363.3, using 355.435 as the protective structure. If you are in cash (no position), don’t chase near resistance; wait for the pullback to the midline to show acceptance, or for a second confirmation after a breakout of resistance.
For the next path, handle it in three ways: if price successfully holds above 363.3, then wait to reassess after a pullback that doesn’t break; if price breaks down below 347.57, prioritize risk control and wait for new support; if price continues to range around 355.435, treat it as a rotation within the range—don’t repeatedly chase direction from the middle.
Position management needs to distinguish between swing (mid-term) and short-term trades. For existing swing positions, first check whether the structure is broken, and don’t be repeatedly swayed by a single 1-hour candlestick. For short-term positions, execute based on support, resistance, and confirmation at the close. If you’re currently in cash, you don’t need to chase price in the middle of the range—waiting for clearer locations is usually more advantageous.
The key for short-term positioning isn’t to predict every single candlestick, but to ensure that entries, de-risking, and exits all have a basis. If there’s no confirmation, do less. If a key level fails, rebuild the plan—first control single-trade risk, then discuss potential upside/downside space.
#BTCBreaks80K
Currently, +0.05% in the past 1 hour and +2.56% in the past 24 hours—these two timeframes have not yet formed sufficiently clear alignment in the same direction. In a range-bound market, the tolerance for chasing and killing trades is lower. It’s more suitable to use the upper boundary to confirm direction, and the lower boundary to confirm pullback/acceptance. The midline is only used as a boundary between strength and weakness.
If you already hold positions, first observe whether continuous rejection appears around 363.3, using 355.435 as the protective structure. If you are in cash (no position), don’t chase near resistance; wait for the pullback to the midline to show acceptance, or for a second confirmation after a breakout of resistance.
For the next path, handle it in three ways: if price successfully holds above 363.3, then wait to reassess after a pullback that doesn’t break; if price breaks down below 347.57, prioritize risk control and wait for new support; if price continues to range around 355.435, treat it as a rotation within the range—don’t repeatedly chase direction from the middle.
Position management needs to distinguish between swing (mid-term) and short-term trades. For existing swing positions, first check whether the structure is broken, and don’t be repeatedly swayed by a single 1-hour candlestick. For short-term positions, execute based on support, resistance, and confirmation at the close. If you’re currently in cash, you don’t need to chase price in the middle of the range—waiting for clearer locations is usually more advantageous.
The key for short-term positioning isn’t to predict every single candlestick, but to ensure that entries, de-risking, and exits all have a basis. If there’s no confirmation, do less. If a key level fails, rebuild the plan—first control single-trade risk, then discuss potential upside/downside space.
#BTCBreaks80K
28
·
--
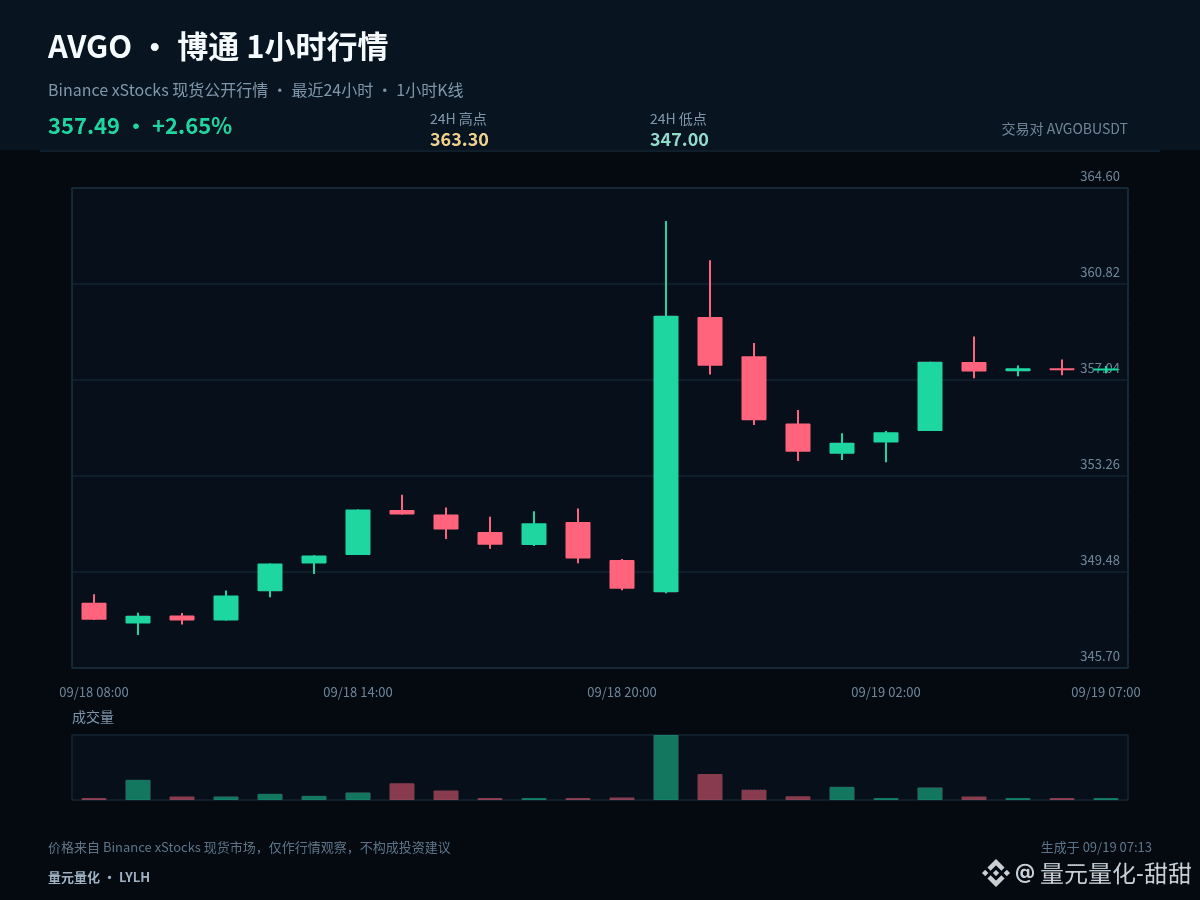
$AVGOB #AVGO If I’m only keeping one observation price this round, I’d choose 355.15. The current price is 357.49; over the past 1 hour it’s +0.01%, and over 24 hours it’s +2.61%. Using the midline’s gains/losses can help filter out a lot of intraday noise.
Holding above 355.15 indicates that pullbacks are still being paced by the bulls. The next target is to test the pressure at 363.3. If price falls back below the midline, the earlier strength will be discounted—and watch out for a further move back toward 347.
Right now, the 1-hour (+0.01%) and 24-hour (+2.61%) timeframes aren’t showing enough clear directional alignment. In a range-bound market, the margin of error for chasing or killing positions is low. It’s better to confirm direction with a breakout above the upper band, and confirm support with a hold near the lower band. The midline should only be treated as the dividing line for strength/weakness.
My scenario isn’t a single-direction bet. A break above 363.3 and the ability to hold it would mean the upside space is reopened. A drop below 347 and failure to reclaim it on the bounce would mean the structure weakens further. If price stays between the two, we should continue observing how it closes on either side of 355.15.
If you already have positions, handle them in segments around key levels to avoid making all decisions at once. If you’re currently in cash, wait for breakout confirmation or for pullback stabilization. For U.S. stock/ETF underlyings, also be mindful of volatility caused by trading-session transitions. Your plan should be based on price conditions—not replaced by emotion.
If the next 1-hour candle closes above 355.15, the structure will be more proactive; if it closes below, keep being cautious. Which path are you currently leaning toward?
#BOJHikesRatesTo31YearHigh
$AVGOB #AVGO If I’m only keeping one observation price this round, I’d choose 355.15. The current price is 357.49; over the past 1 hour it’s +0.01%, and over 24 hours it’s +2.61%. Using the midline’s gains/losses can help filter out a lot of intraday noise.
Holding above 355.15 indicates that pullbacks are still being paced by the bulls. The next target is to test the pressure at 363.3. If price falls back below the midline, the earlier strength will be discounted—and watch out for a further move back toward 347.
Right now, the 1-hour (+0.01%) and 24-hour (+2.61%) timeframes aren’t showing enough clear directional alignment. In a range-bound market, the margin of error for chasing or killing positions is low. It’s better to confirm direction with a breakout above the upper band, and confirm support with a hold near the lower band. The midline should only be treated as the dividing line for strength/weakness.
My scenario isn’t a single-direction bet. A break above 363.3 and the ability to hold it would mean the upside space is reopened. A drop below 347 and failure to reclaim it on the bounce would mean the structure weakens further. If price stays between the two, we should continue observing how it closes on either side of 355.15.
If you already have positions, handle them in segments around key levels to avoid making all decisions at once. If you’re currently in cash, wait for breakout confirmation or for pullback stabilization. For U.S. stock/ETF underlyings, also be mindful of volatility caused by trading-session transitions. Your plan should be based on price conditions—not replaced by emotion.
If the next 1-hour candle closes above 355.15, the structure will be more proactive; if it closes below, keep being cautious. Which path are you currently leaning toward?
#BOJHikesRatesTo31YearHigh
Holding above 355.15 indicates that pullbacks are still being paced by the bulls. The next target is to test the pressure at 363.3. If price falls back below the midline, the earlier strength will be discounted—and watch out for a further move back toward 347.
Right now, the 1-hour (+0.01%) and 24-hour (+2.61%) timeframes aren’t showing enough clear directional alignment. In a range-bound market, the margin of error for chasing or killing positions is low. It’s better to confirm direction with a breakout above the upper band, and confirm support with a hold near the lower band. The midline should only be treated as the dividing line for strength/weakness.
My scenario isn’t a single-direction bet. A break above 363.3 and the ability to hold it would mean the upside space is reopened. A drop below 347 and failure to reclaim it on the bounce would mean the structure weakens further. If price stays between the two, we should continue observing how it closes on either side of 355.15.
If you already have positions, handle them in segments around key levels to avoid making all decisions at once. If you’re currently in cash, wait for breakout confirmation or for pullback stabilization. For U.S. stock/ETF underlyings, also be mindful of volatility caused by trading-session transitions. Your plan should be based on price conditions—not replaced by emotion.
If the next 1-hour candle closes above 355.15, the structure will be more proactive; if it closes below, keep being cautious. Which path are you currently leaning toward?
#BOJHikesRatesTo31YearHigh
3

·
--
The market is lining up a potential shift, and $AVGO is currently sitting at a zone that demands attention for those positioned for a move downward.
⚡ $AVGO — SHORT SETUP
📍 Entry: 351.22 – 353.32
🎯 TP1: 347.02
🎯 TP2: 344.22
🎯 TP3: 340.03
🛑 Stop Loss: 355.42
Trade here 👇
📌 Trade management rules: see pinned post.
How are you positioning for this volatility? Let me know your thoughts or hit follow for more updates.
#WriteToEarn #AVGO #CryptoTrading #BinanceSquare #Crypto
The market is lining up a potential shift, and $AVGO is currently sitting at a zone that demands attention for those positioned for a move downward.
⚡ $AVGO — SHORT SETUP
📍 Entry: 351.22 – 353.32
🎯 TP1: 347.02
🎯 TP2: 344.22
🎯 TP3: 340.03
🛑 Stop Loss: 355.42
Trade here 👇
📌 Trade management rules: see pinned post.
How are you positioning for this volatility? Let me know your thoughts or hit follow for more updates.
#WriteToEarn #AVGO #CryptoTrading #BinanceSquare #Crypto
⚡ $AVGO — SHORT SETUP
📍 Entry: 351.22 – 353.32
🎯 TP1: 347.02
🎯 TP2: 344.22
🎯 TP3: 340.03
🛑 Stop Loss: 355.42
Trade here 👇
📌 Trade management rules: see pinned post.
How are you positioning for this volatility? Let me know your thoughts or hit follow for more updates.
#WriteToEarn #AVGO #CryptoTrading #BinanceSquare #Crypto
1
82

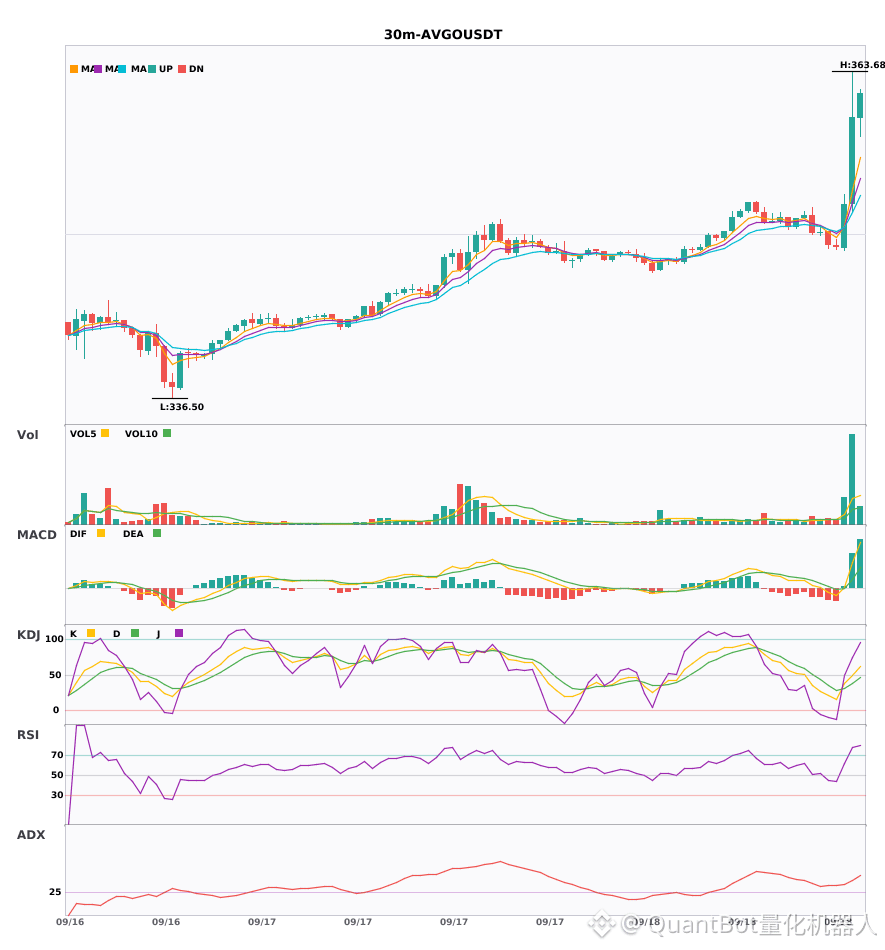
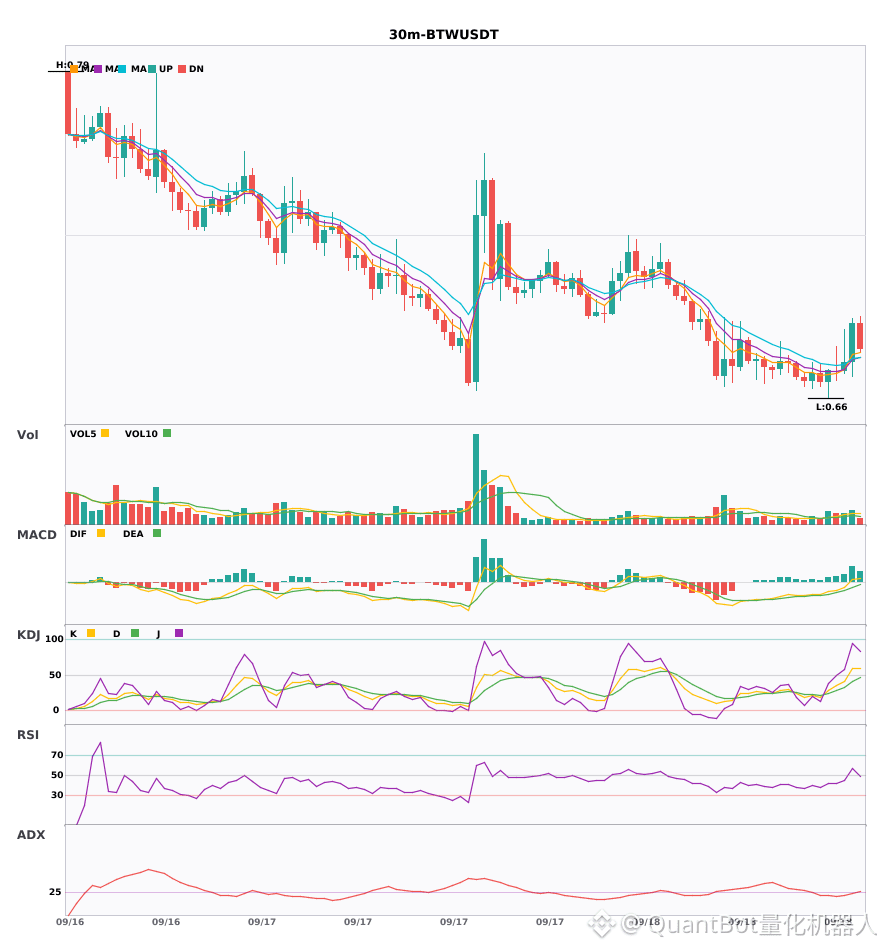
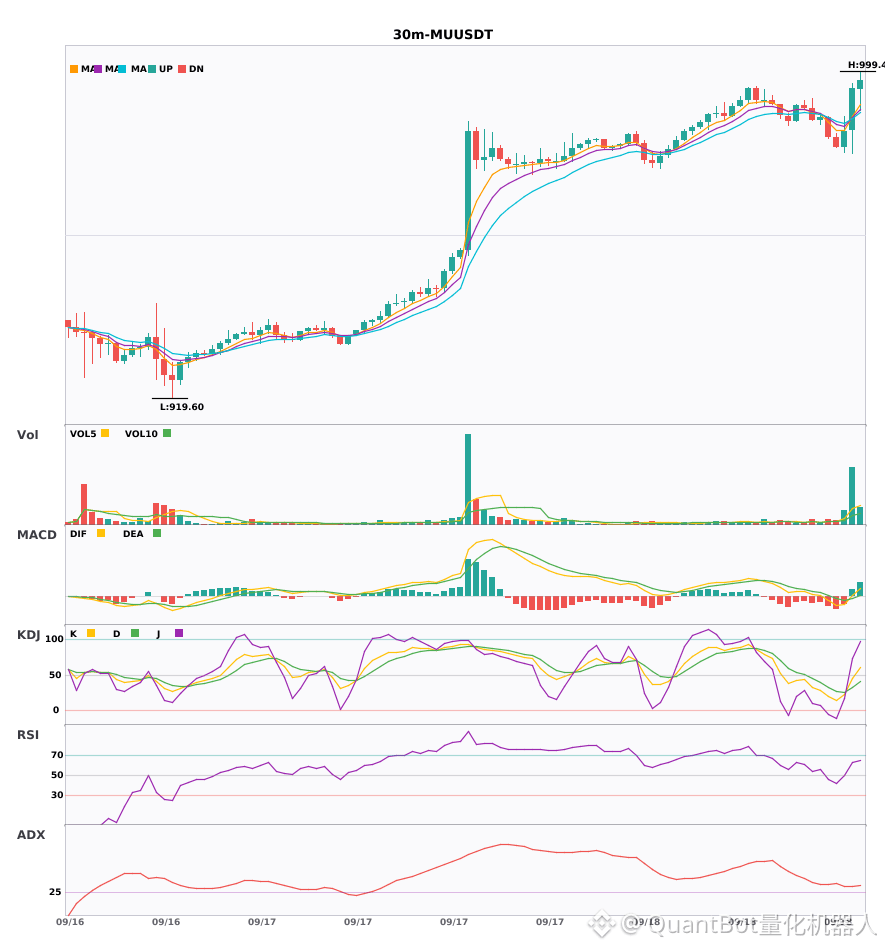
3 long signals triggered in sync at the 30-minute level: $AVGO, $BTW, $MU
📈 $AVGO | 30-minute bullish signal
━━━━━━━━━━━━━━━━━━
Technical Analysis: ADX at 35 confirms a trending market. MACD forms a bullish crossover above zero, releasing bullish momentum. EMA5 crosses above EMA8 turns the short-term trend bullish. KDJ gives a bullish crossover (K37.5/D31.7), suggesting a short-term bullish outlook. Volume expands to 4.1x.
Price Movement: 1.0300%
📌 Market Update: Binance will support Broadcom (AVGO), Invesco QQQ Trust (QQQ), Meta (META), and Seagate (STX) through bStocks for cash dividend distribution.
📈 $BTW | 30-minute bullish signal
━━━━━━━━━━━━━━━━━━
Technical Analysis: ADX (25) indicates trend formation and suggests you can participate. MACD DIF breaks above the zero line, turning the trend bullish. EMA5 crosses above EMA8, turning the short-term trend bullish. Trading volume expands 1.6x.
Price Movement: 2.2400%
📈 $MU | 30-minute bullish signal
━━━━━━━━━━━━━━━━━━
Technical Analysis: ADX (32) shows a clear trending market | MACD bullish crossover above zero, bullish momentum released | EMA5 crosses above EMA8, turning the short-term trend bullish | KDJ bullish crossover, short-term bullish (K is 45.6, D is 32.1) | Volume surges (5.8x)
Price Movement: 1.0400%
━━━━━━━━━━━━━━━━━━
#技术分析 #AVGO #BTW #MU
📌 The above content is for reference only and does not constitute investment advice
3 long signals triggered in sync at the 30-minute level: $AVGO , $BTW , $MU
📈 $AVGO | 30-minute bullish signal
━━━━━━━━━━━━━━━━━━
Technical Analysis: ADX at 35 confirms a trending market. MACD forms a bullish crossover above zero, releasing bullish momentum. EMA5 crosses above EMA8 turns the short-term trend bullish. KDJ gives a bullish crossover (K37.5/D31.7), suggesting a short-term bullish outlook. Volume expands to 4.1x.
Price Movement: 1.0300%
📌 Market Update: Binance will support Broadcom (AVGO), Invesco QQQ Trust (QQQ), Meta (META), and Seagate (STX) through bStocks for cash dividend distribution.
📈 $BTW | 30-minute bullish signal
━━━━━━━━━━━━━━━━━━
Technical Analysis: ADX (25) indicates trend formation and suggests you can participate. MACD DIF breaks above the zero line, turning the trend bullish. EMA5 crosses above EMA8, turning the short-term trend bullish. Trading volume expands 1.6x.
Price Movement: 2.2400%
📈 $MU | 30-minute bullish signal
━━━━━━━━━━━━━━━━━━
Technical Analysis: ADX (32) shows a clear trending market | MACD bullish crossover above zero, bullish momentum released | EMA5 crosses above EMA8, turning the short-term trend bullish | KDJ bullish crossover, short-term bullish (K is 45.6, D is 32.1) | Volume surges (5.8x)
Price Movement: 1.0400%
━━━━━━━━━━━━━━━━━━
#技术分析 #AVGO #BTW #MU
📌 The above content is for reference only and does not constitute investment advice
📈 $AVGO | 30-minute bullish signal
━━━━━━━━━━━━━━━━━━
Technical Analysis: ADX at 35 confirms a trending market. MACD forms a bullish crossover above zero, releasing bullish momentum. EMA5 crosses above EMA8 turns the short-term trend bullish. KDJ gives a bullish crossover (K37.5/D31.7), suggesting a short-term bullish outlook. Volume expands to 4.1x.
Price Movement: 1.0300%
📌 Market Update: Binance will support Broadcom (AVGO), Invesco QQQ Trust (QQQ), Meta (META), and Seagate (STX) through bStocks for cash dividend distribution.
📈 $BTW | 30-minute bullish signal
━━━━━━━━━━━━━━━━━━
Technical Analysis: ADX (25) indicates trend formation and suggests you can participate. MACD DIF breaks above the zero line, turning the trend bullish. EMA5 crosses above EMA8, turning the short-term trend bullish. Trading volume expands 1.6x.
Price Movement: 2.2400%
📈 $MU | 30-minute bullish signal
━━━━━━━━━━━━━━━━━━
Technical Analysis: ADX (32) shows a clear trending market | MACD bullish crossover above zero, bullish momentum released | EMA5 crosses above EMA8, turning the short-term trend bullish | KDJ bullish crossover, short-term bullish (K is 45.6, D is 32.1) | Volume surges (5.8x)
Price Movement: 1.0400%
━━━━━━━━━━━━━━━━━━
#技术分析 #AVGO #BTW #MU
📌 The above content is for reference only and does not constitute investment advice
13

·
--
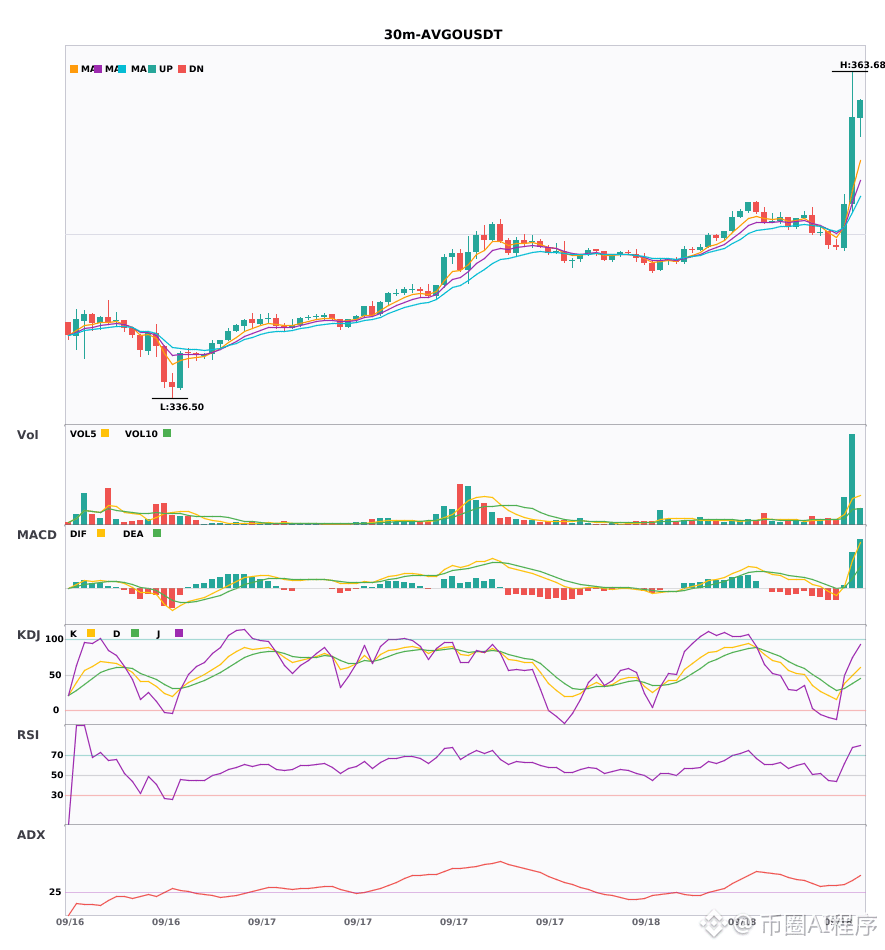
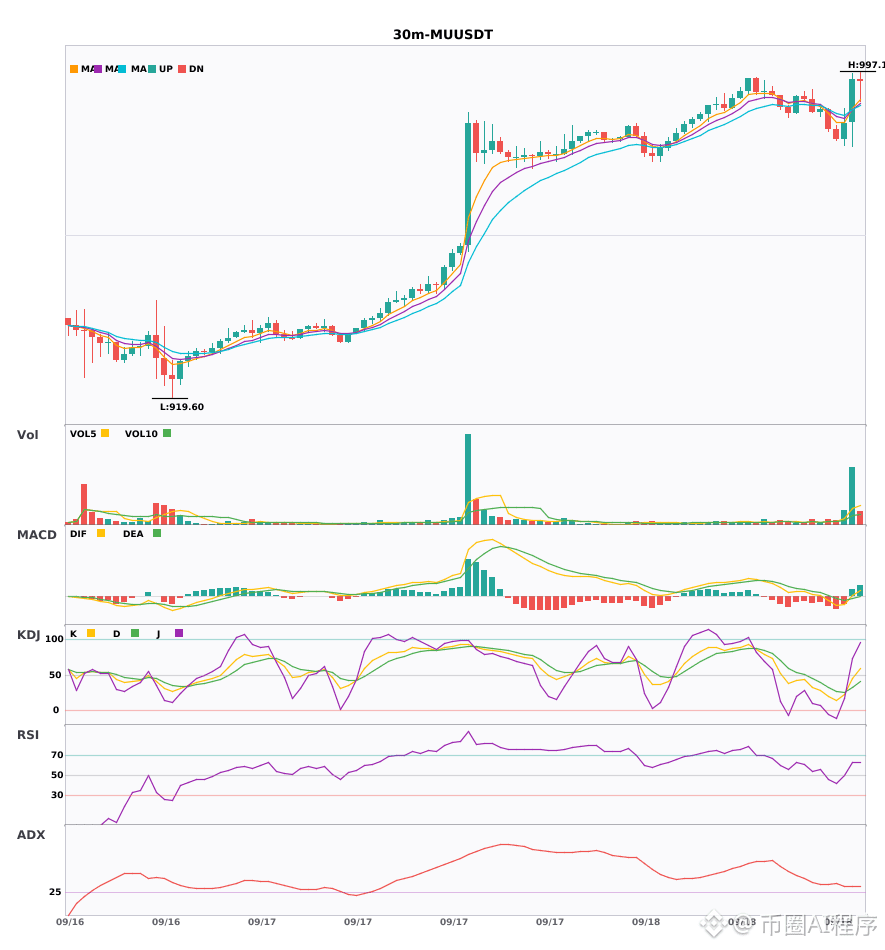
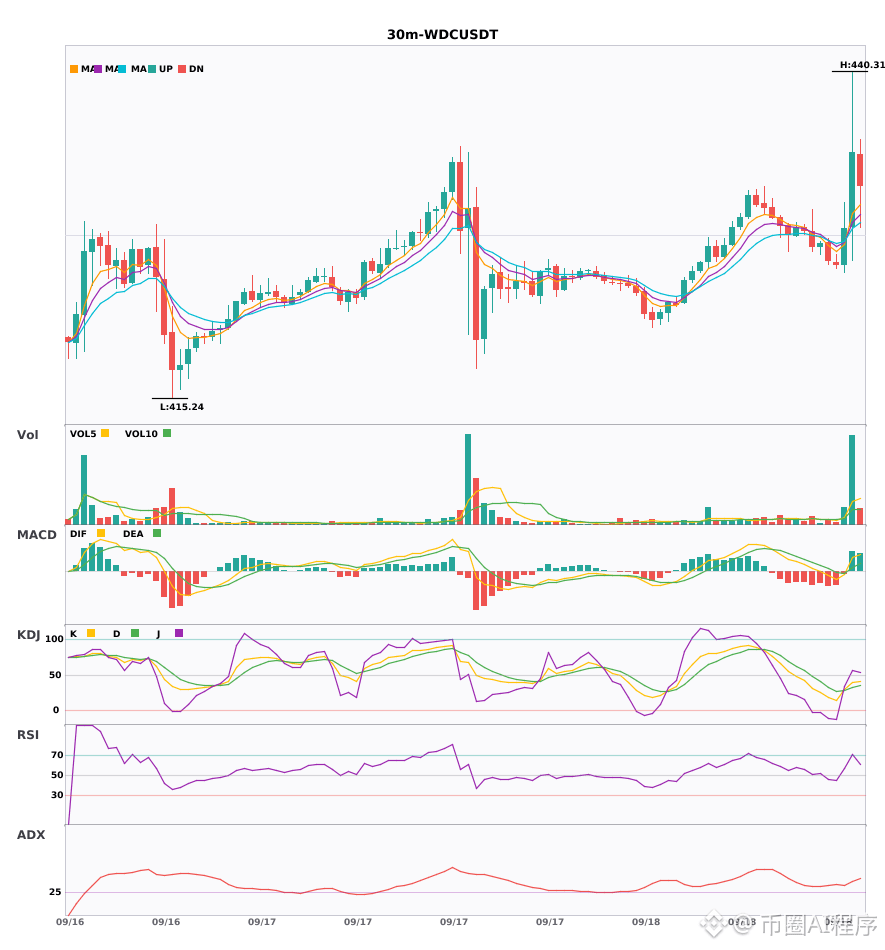
$AVGO / $MU / $WDC 30 minutes long + 4-hour long in the same direction. Multi-cycle resonance turns 🔥
════════════════════
🔴 $AVGO 30-minute long signal
⚠️ Technical analysis: Multi-cycle resonance signal. 4-hour long confirms the trend. 30-minute provides entry/exit signals. MACD bullish crossover above zero with a volume spike of 4.1x. The short moving averages are just forming a bullish alignment. KDJ bullish crossover has not entered overbought. Near-term is bullish.
📢 Market updates: Binance will support Broadcom (AVGO), Invesco QQQ Trust (QQQ), Meta (META), and Seagate (STX) through bStocks to distribute cash dividends.
════════════════════
🔴 $MU 30-minute long signal
⚠️ Technical analysis: 4-hour long resonance confirms | 30-minute entry. MACD bullish crossover above zero releases bullish momentum | EMA5 crosses above EMA8, turning bullish in the short term | KDJ bullish crossover; bullish in the short term (K is 45.6, D is 32.1) | Volume surges (5.8x)
════════════════════
🔴 $WDC 30-minute long signal
⚠️ Technical analysis: 4-hour long resonance confirms | 30-minute entry. MACD bullish crossover above zero releases bullish momentum | EMA5 crosses above EMA8, turning bullish in the short term | KDJ weak operation; bears dominate (K is 39.9, D is 31.8) | Volume surges (5.9x)
════════════════════
🔔 Watch for first-hand alerts on unusual market moves 🔔
#多周期共振 #AVGO #MU #WDC
📌 When trading, pay attention to whether the candlestick patterns match
$AVGO / $MU / $WDC 30 minutes long + 4-hour long in the same direction. Multi-cycle resonance turns 🔥
════════════════════
🔴 $AVGO 30-minute long signal
⚠️ Technical analysis: Multi-cycle resonance signal. 4-hour long confirms the trend. 30-minute provides entry/exit signals. MACD bullish crossover above zero with a volume spike of 4.1x. The short moving averages are just forming a bullish alignment. KDJ bullish crossover has not entered overbought. Near-term is bullish.
📢 Market updates: Binance will support Broadcom (AVGO), Invesco QQQ Trust (QQQ), Meta (META), and Seagate (STX) through bStocks to distribute cash dividends.
════════════════════
🔴 $MU 30-minute long signal
⚠️ Technical analysis: 4-hour long resonance confirms | 30-minute entry. MACD bullish crossover above zero releases bullish momentum | EMA5 crosses above EMA8, turning bullish in the short term | KDJ bullish crossover; bullish in the short term (K is 45.6, D is 32.1) | Volume surges (5.8x)
════════════════════
🔴 $WDC 30-minute long signal
⚠️ Technical analysis: 4-hour long resonance confirms | 30-minute entry. MACD bullish crossover above zero releases bullish momentum | EMA5 crosses above EMA8, turning bullish in the short term | KDJ weak operation; bears dominate (K is 39.9, D is 31.8) | Volume surges (5.9x)
════════════════════
🔔 Watch for first-hand alerts on unusual market moves 🔔
#多周期共振 #AVGO #MU #WDC
📌 When trading, pay attention to whether the candlestick patterns match
════════════════════
🔴 $AVGO 30-minute long signal
⚠️ Technical analysis: Multi-cycle resonance signal. 4-hour long confirms the trend. 30-minute provides entry/exit signals. MACD bullish crossover above zero with a volume spike of 4.1x. The short moving averages are just forming a bullish alignment. KDJ bullish crossover has not entered overbought. Near-term is bullish.
📢 Market updates: Binance will support Broadcom (AVGO), Invesco QQQ Trust (QQQ), Meta (META), and Seagate (STX) through bStocks to distribute cash dividends.
════════════════════
🔴 $MU 30-minute long signal
⚠️ Technical analysis: 4-hour long resonance confirms | 30-minute entry. MACD bullish crossover above zero releases bullish momentum | EMA5 crosses above EMA8, turning bullish in the short term | KDJ bullish crossover; bullish in the short term (K is 45.6, D is 32.1) | Volume surges (5.8x)
════════════════════
🔴 $WDC 30-minute long signal
⚠️ Technical analysis: 4-hour long resonance confirms | 30-minute entry. MACD bullish crossover above zero releases bullish momentum | EMA5 crosses above EMA8, turning bullish in the short term | KDJ weak operation; bears dominate (K is 39.9, D is 31.8) | Volume surges (5.9x)
════════════════════
🔔 Watch for first-hand alerts on unusual market moves 🔔
#多周期共振 #AVGO #MU #WDC
📌 When trading, pay attention to whether the candlestick patterns match
254
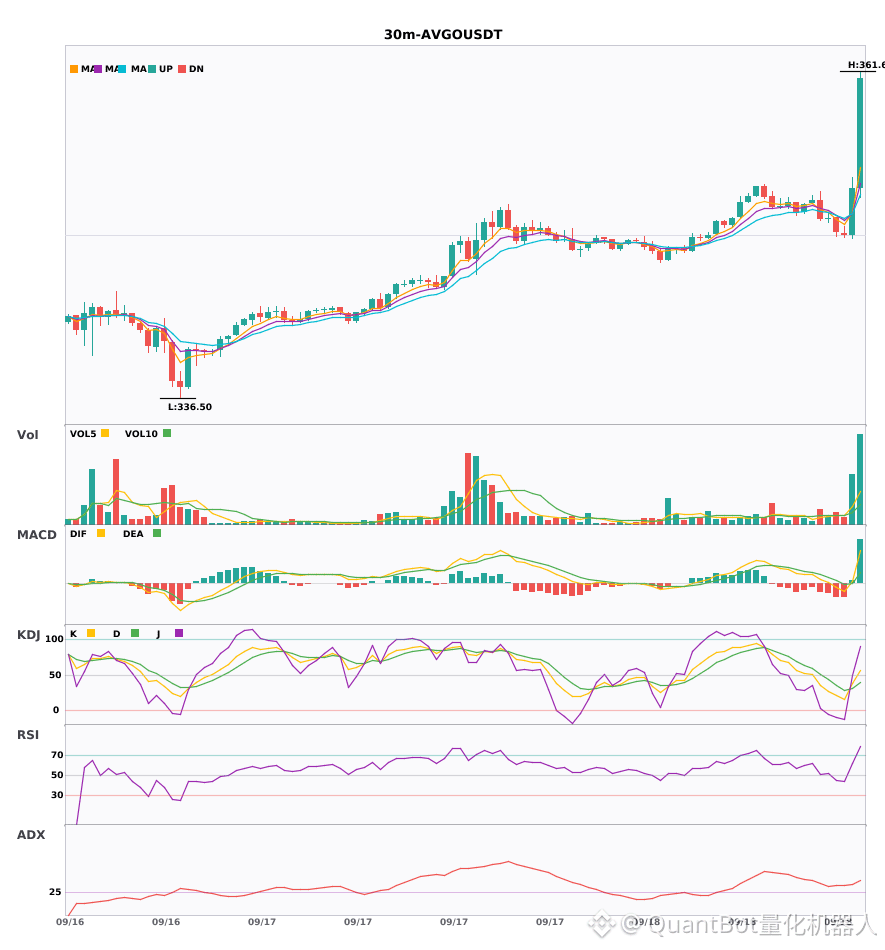
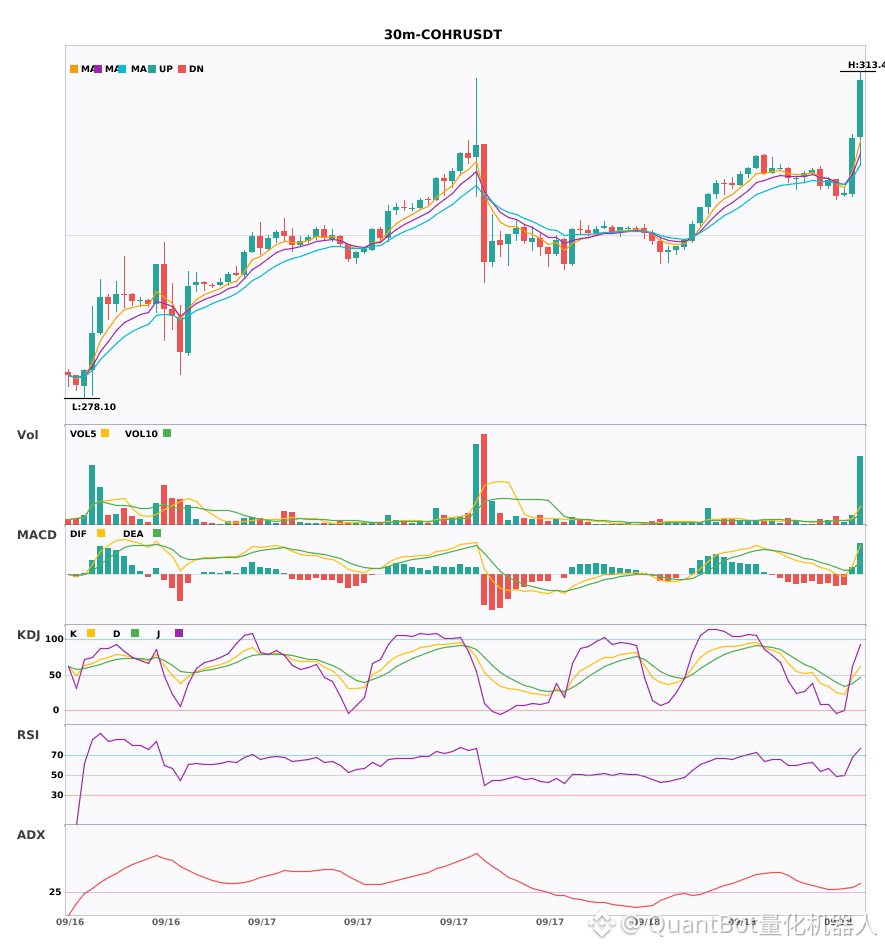
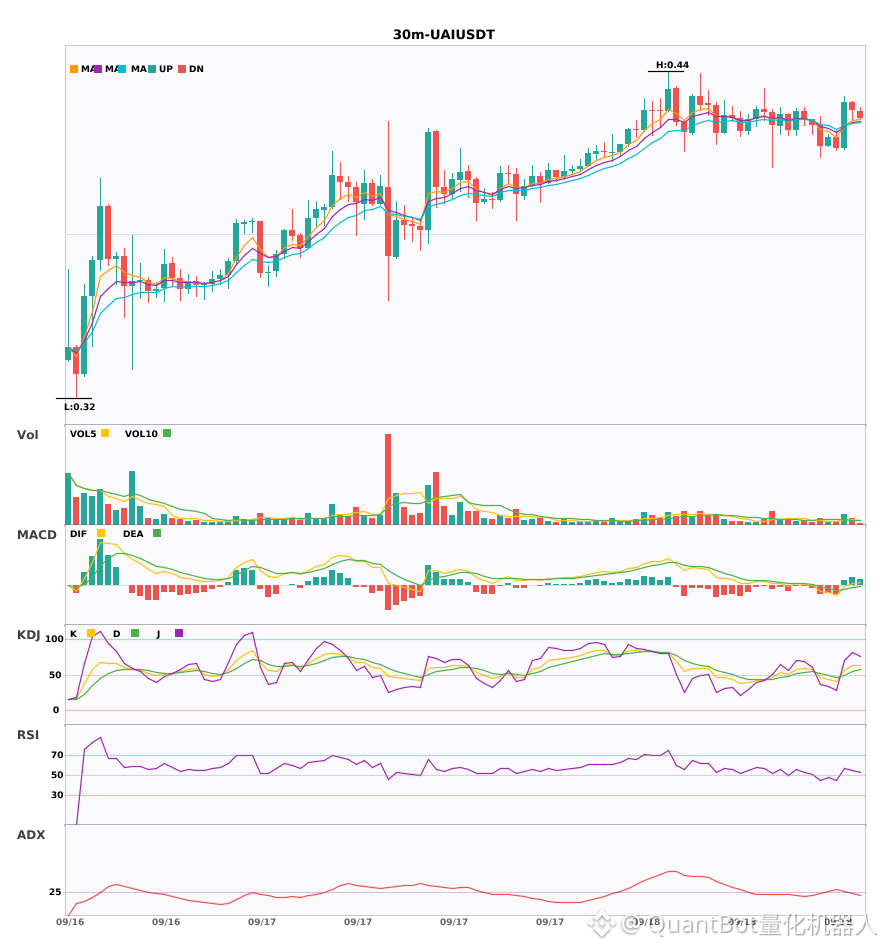
Synchronized long signals triggered across three 30-minute levels: $AVGO, $COHR, $UAI
📈 $AVGO | 30-minute Long Signal
━━━━━━━━━━━━━━━━━━
Technical Analysis: ADX(35) clearly indicates a trending market. MACD above the zero line golden cross releases bullish momentum. EMA5 crosses above EMA8. KDJ forms a golden cross (K37.5, D31.7). The short-term outlook turns bullish, with volume expanding by 4.1x.
Price Movement: 1.0300%
📌 Market Update: Binance will support Broadcom (AVGO), Invesco QQQ Trust (QQQ), Meta (META), and Seagate (STX) via bStocks to distribute cash dividends.
📈 $COHR | 30-minute Long Signal
━━━━━━━━━━━━━━━━━━
Technical Analysis: ADX is 33, indicating a clear trend. MACD above the zero line golden cross releases bullish momentum. EMA5 crosses above EMA8—short-term turns bullish. KDJ forms a golden cross (K46.1, D38.2). Volume expands by 2.2x.
Price Movement: 1.9800%
📈 $UAI | 30-minute Long Signal
━━━━━━━━━━━━━━━━━━
Technical Analysis: ADX(26) Trend is forming and can be acted on | MACD DIF breaks above the zero line, trend turns bullish | Bullish alignment with EMA5 > EMA8 > EMA13 | KDJ is running strongly with bulls in control (K 63.4, D 54.4) | Volume expands (1.8x)
Price Movement: -0.6400%
━━━━━━━━━━━━━━━━━━
#技术分析 #AVGO #COHR #UAI
📌 The information above is for reference only and does not constitute investment advice
Synchronized long signals triggered across three 30-minute levels: $AVGO , $COHR , $UAI
📈 $AVGO | 30-minute Long Signal
━━━━━━━━━━━━━━━━━━
Technical Analysis: ADX(35) clearly indicates a trending market. MACD above the zero line golden cross releases bullish momentum. EMA5 crosses above EMA8. KDJ forms a golden cross (K37.5, D31.7). The short-term outlook turns bullish, with volume expanding by 4.1x.
Price Movement: 1.0300%
📌 Market Update: Binance will support Broadcom (AVGO), Invesco QQQ Trust (QQQ), Meta (META), and Seagate (STX) via bStocks to distribute cash dividends.
📈 $COHR | 30-minute Long Signal
━━━━━━━━━━━━━━━━━━
Technical Analysis: ADX is 33, indicating a clear trend. MACD above the zero line golden cross releases bullish momentum. EMA5 crosses above EMA8—short-term turns bullish. KDJ forms a golden cross (K46.1, D38.2). Volume expands by 2.2x.
Price Movement: 1.9800%
📈 $UAI | 30-minute Long Signal
━━━━━━━━━━━━━━━━━━
Technical Analysis: ADX(26) Trend is forming and can be acted on | MACD DIF breaks above the zero line, trend turns bullish | Bullish alignment with EMA5 > EMA8 > EMA13 | KDJ is running strongly with bulls in control (K 63.4, D 54.4) | Volume expands (1.8x)
Price Movement: -0.6400%
━━━━━━━━━━━━━━━━━━
#技术分析 #AVGO #COHR #UAI
📌 The information above is for reference only and does not constitute investment advice
📈 $AVGO | 30-minute Long Signal
━━━━━━━━━━━━━━━━━━
Technical Analysis: ADX(35) clearly indicates a trending market. MACD above the zero line golden cross releases bullish momentum. EMA5 crosses above EMA8. KDJ forms a golden cross (K37.5, D31.7). The short-term outlook turns bullish, with volume expanding by 4.1x.
Price Movement: 1.0300%
📌 Market Update: Binance will support Broadcom (AVGO), Invesco QQQ Trust (QQQ), Meta (META), and Seagate (STX) via bStocks to distribute cash dividends.
📈 $COHR | 30-minute Long Signal
━━━━━━━━━━━━━━━━━━
Technical Analysis: ADX is 33, indicating a clear trend. MACD above the zero line golden cross releases bullish momentum. EMA5 crosses above EMA8—short-term turns bullish. KDJ forms a golden cross (K46.1, D38.2). Volume expands by 2.2x.
Price Movement: 1.9800%
📈 $UAI | 30-minute Long Signal
━━━━━━━━━━━━━━━━━━
Technical Analysis: ADX(26) Trend is forming and can be acted on | MACD DIF breaks above the zero line, trend turns bullish | Bullish alignment with EMA5 > EMA8 > EMA13 | KDJ is running strongly with bulls in control (K 63.4, D 54.4) | Volume expands (1.8x)
Price Movement: -0.6400%
━━━━━━━━━━━━━━━━━━
#技术分析 #AVGO #COHR #UAI
📌 The information above is for reference only and does not constitute investment advice
220
·
--
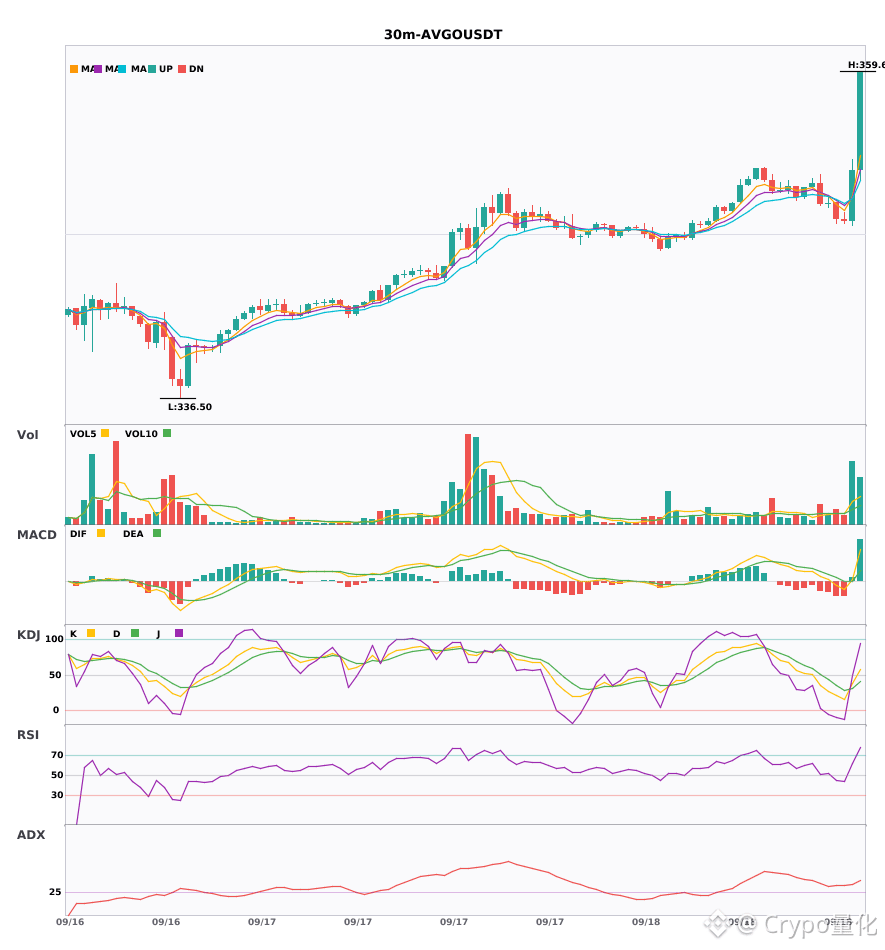
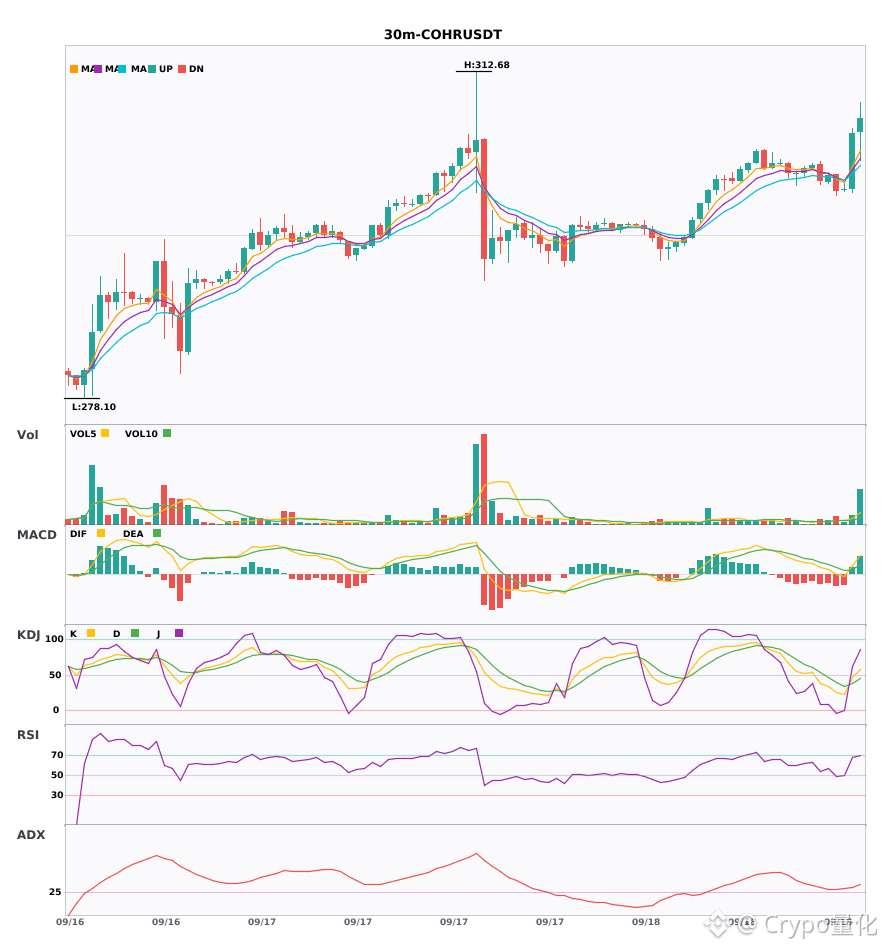
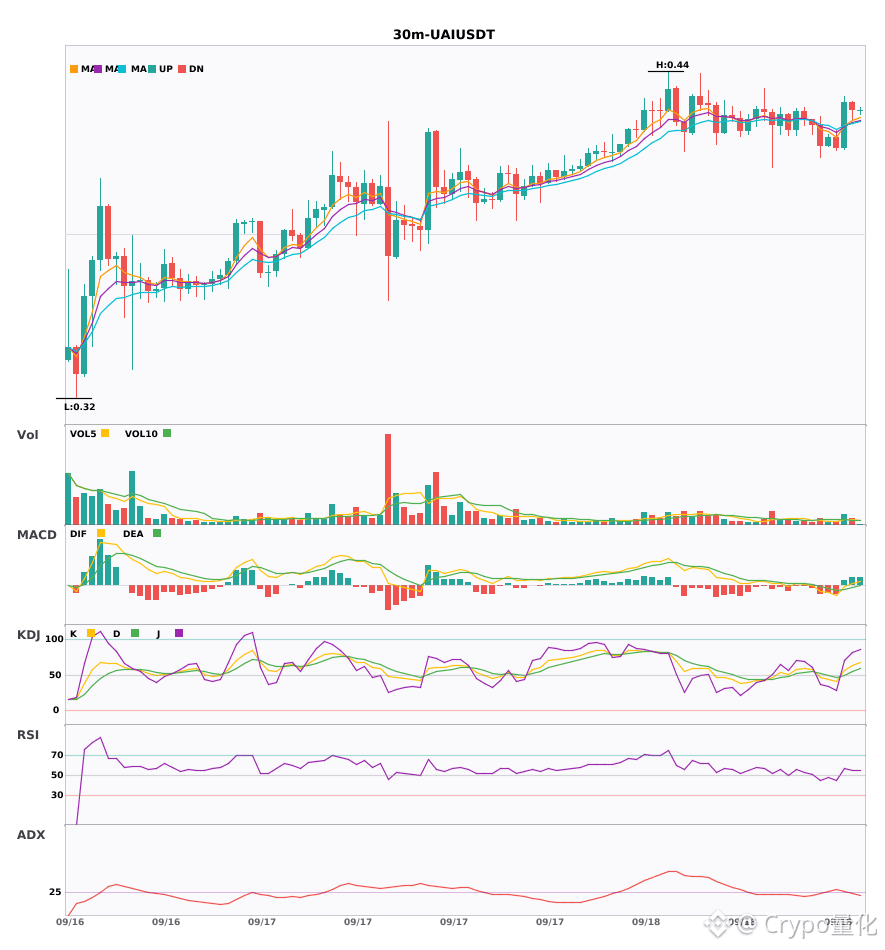
$AVGO $COHR $UAI 30-minute level indicates more bullish pressure. Short-term resonance opportunity is here🔥
════════════════════
🔴 $AVGO 30 minutes Bullish signal
⚠️ Technicals: ADX(35) clearly shows a trending market | MACD forms a golden cross above the zero line, bullish momentum is released | EMA5 crosses above EMA8, short-term turns bullish | KDJ golden cross, short-term bullish (K=37.5, D=31.7) | Volume surge (4.1x)
📢 Market update: Binance will support the cash dividend distribution of Broadcom (AVGO), Invesco QQQ Trust (QQQ), Meta (META), and Seagate (STX) through bStocks.
════════════════════
🔴 $COHR 30 minutes Bullish signal
⚠️ Technicals: ADX(33) clearly shows a trending market | MACD forms a golden cross above the zero line, bullish momentum is released | EMA5 crosses above EMA8, short-term turns bullish | KDJ golden cross, short-term bullish (K=46.1, D=38.2) | Volume expands (2.2x)
════════════════════
🔴 $UAI 30 minutes Bullish signal
⚠️ Technicals: ADX26 trend is forming and is actionable; MACD breaks above the zero axis to turn bullish; moving averages are aligned bullishly; KDJ golden cross has not entered overbought; volume expands 1.8x
════════════════════
🔔 Watch for the first-hand trading signals and anomalies 🔔
#技术分析 #AVGO #COHR #UAI
📌 When trading, make sure the candlestick pattern matches
$AVGO $COHR $UAI 30-minute level indicates more bullish pressure. Short-term resonance opportunity is here🔥
════════════════════
🔴 $AVGO 30 minutes Bullish signal
⚠️ Technicals: ADX(35) clearly shows a trending market | MACD forms a golden cross above the zero line, bullish momentum is released | EMA5 crosses above EMA8, short-term turns bullish | KDJ golden cross, short-term bullish (K=37.5, D=31.7) | Volume surge (4.1x)
📢 Market update: Binance will support the cash dividend distribution of Broadcom (AVGO), Invesco QQQ Trust (QQQ), Meta (META), and Seagate (STX) through bStocks.
════════════════════
🔴 $COHR 30 minutes Bullish signal
⚠️ Technicals: ADX(33) clearly shows a trending market | MACD forms a golden cross above the zero line, bullish momentum is released | EMA5 crosses above EMA8, short-term turns bullish | KDJ golden cross, short-term bullish (K=46.1, D=38.2) | Volume expands (2.2x)
════════════════════
🔴 $UAI 30 minutes Bullish signal
⚠️ Technicals: ADX26 trend is forming and is actionable; MACD breaks above the zero axis to turn bullish; moving averages are aligned bullishly; KDJ golden cross has not entered overbought; volume expands 1.8x
════════════════════
🔔 Watch for the first-hand trading signals and anomalies 🔔
#技术分析 #AVGO #COHR #UAI
📌 When trading, make sure the candlestick pattern matches
════════════════════
🔴 $AVGO 30 minutes Bullish signal
⚠️ Technicals: ADX(35) clearly shows a trending market | MACD forms a golden cross above the zero line, bullish momentum is released | EMA5 crosses above EMA8, short-term turns bullish | KDJ golden cross, short-term bullish (K=37.5, D=31.7) | Volume surge (4.1x)
📢 Market update: Binance will support the cash dividend distribution of Broadcom (AVGO), Invesco QQQ Trust (QQQ), Meta (META), and Seagate (STX) through bStocks.
════════════════════
🔴 $COHR 30 minutes Bullish signal
⚠️ Technicals: ADX(33) clearly shows a trending market | MACD forms a golden cross above the zero line, bullish momentum is released | EMA5 crosses above EMA8, short-term turns bullish | KDJ golden cross, short-term bullish (K=46.1, D=38.2) | Volume expands (2.2x)
════════════════════
🔴 $UAI 30 minutes Bullish signal
⚠️ Technicals: ADX26 trend is forming and is actionable; MACD breaks above the zero axis to turn bullish; moving averages are aligned bullishly; KDJ golden cross has not entered overbought; volume expands 1.8x
════════════════════
🔔 Watch for the first-hand trading signals and anomalies 🔔
#技术分析 #AVGO #COHR #UAI
📌 When trading, make sure the candlestick pattern matches
199
·
--
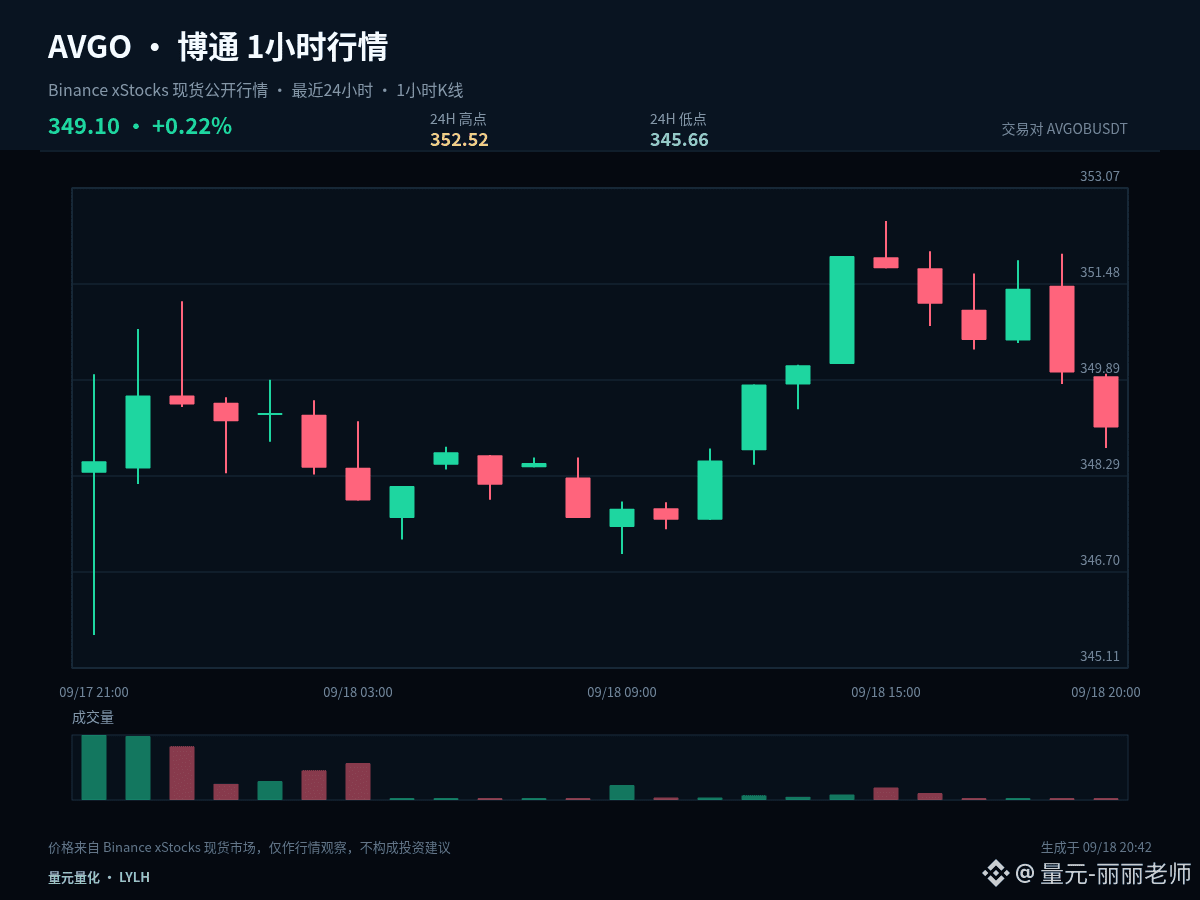
$AVGOB #AVGO If I can keep only one observation price in this round, I would choose 349.09. Current price 349.1, 1 hour -0.26%, 24 hours +0.21%. The midline gains/losses can help filter out a lot of intraday noise.
The price has not yet recovered 349.09. For now, treat the current rebound as a weak repair; a true turn to strength depends on stable closing that proves it. If it weakens again, 345.66 is the next level to observe whether the sell pressure is fading.
With the current 1 hour -0.26% and 24 hours +0.21%, the two timeframes have not formed a clear same-direction alignment. In a range-bound market, the tolerance for chasing or cutting positions is low. It’s better to use the upper boundary to confirm direction and the lower boundary to confirm support/holding. The midline is only used as the line that distinguishes strength from weakness.
For execution, set clear conditions: after a break above 352.52, you need confirmation—not chasing just because of a brief surge. After a dip to 345.66, you need to see whether it can quickly reclaim the level—not blindly buying just because it’s falling. If the middle zone doesn’t offer sufficient reward-to-risk, waiting is also part of the strategy.
If you already hold positions, manage them in segments based on key levels to avoid making all decisions at once. If you’re currently in cash, wait for a breakout confirmation or a retest that stabilizes. For US stock/market tickers, also watch for volatility caused by trading session transitions. Your plan should be based on price conditions, not emotions substituting for execution.
The real disagreement in this market is whether it will continue or revert back into the range. Will you wait for breakout confirmation, or wait for a support retest? Tell me the price level you’re most focused on.
#ChainlinkPowersBottomlinePaymentPlatform
$AVGOB #AVGO If I can keep only one observation price in this round, I would choose 349.09. Current price 349.1, 1 hour -0.26%, 24 hours +0.21%. The midline gains/losses can help filter out a lot of intraday noise.
The price has not yet recovered 349.09. For now, treat the current rebound as a weak repair; a true turn to strength depends on stable closing that proves it. If it weakens again, 345.66 is the next level to observe whether the sell pressure is fading.
With the current 1 hour -0.26% and 24 hours +0.21%, the two timeframes have not formed a clear same-direction alignment. In a range-bound market, the tolerance for chasing or cutting positions is low. It’s better to use the upper boundary to confirm direction and the lower boundary to confirm support/holding. The midline is only used as the line that distinguishes strength from weakness.
For execution, set clear conditions: after a break above 352.52, you need confirmation—not chasing just because of a brief surge. After a dip to 345.66, you need to see whether it can quickly reclaim the level—not blindly buying just because it’s falling. If the middle zone doesn’t offer sufficient reward-to-risk, waiting is also part of the strategy.
If you already hold positions, manage them in segments based on key levels to avoid making all decisions at once. If you’re currently in cash, wait for a breakout confirmation or a retest that stabilizes. For US stock/market tickers, also watch for volatility caused by trading session transitions. Your plan should be based on price conditions, not emotions substituting for execution.
The real disagreement in this market is whether it will continue or revert back into the range. Will you wait for breakout confirmation, or wait for a support retest? Tell me the price level you’re most focused on.
#ChainlinkPowersBottomlinePaymentPlatform
The price has not yet recovered 349.09. For now, treat the current rebound as a weak repair; a true turn to strength depends on stable closing that proves it. If it weakens again, 345.66 is the next level to observe whether the sell pressure is fading.
With the current 1 hour -0.26% and 24 hours +0.21%, the two timeframes have not formed a clear same-direction alignment. In a range-bound market, the tolerance for chasing or cutting positions is low. It’s better to use the upper boundary to confirm direction and the lower boundary to confirm support/holding. The midline is only used as the line that distinguishes strength from weakness.
For execution, set clear conditions: after a break above 352.52, you need confirmation—not chasing just because of a brief surge. After a dip to 345.66, you need to see whether it can quickly reclaim the level—not blindly buying just because it’s falling. If the middle zone doesn’t offer sufficient reward-to-risk, waiting is also part of the strategy.
If you already hold positions, manage them in segments based on key levels to avoid making all decisions at once. If you’re currently in cash, wait for a breakout confirmation or a retest that stabilizes. For US stock/market tickers, also watch for volatility caused by trading session transitions. Your plan should be based on price conditions, not emotions substituting for execution.
The real disagreement in this market is whether it will continue or revert back into the range. Will you wait for breakout confirmation, or wait for a support retest? Tell me the price level you’re most focused on.
#ChainlinkPowersBottomlinePaymentPlatform
16
·
--
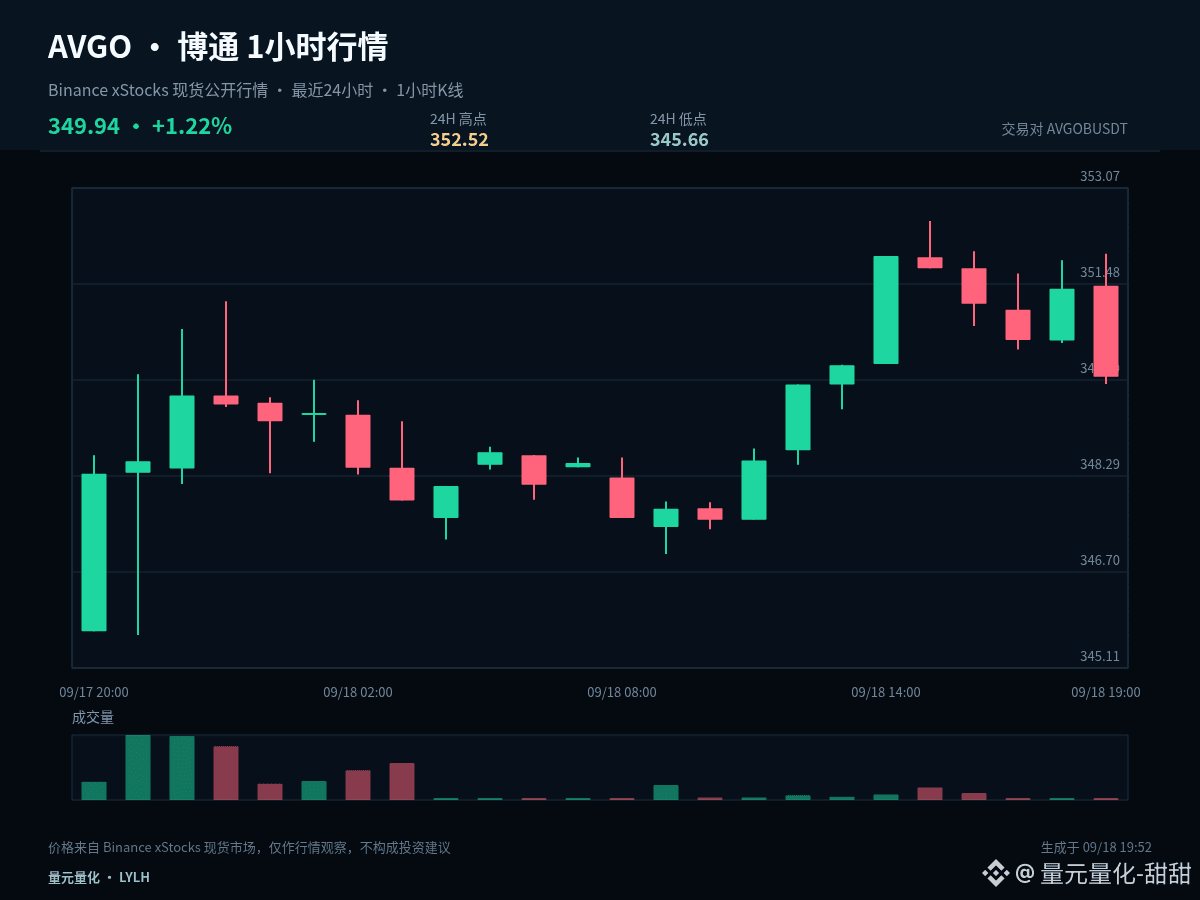
$AVGOB #AVGO This time, we break down the move from a position perspective. The same chart highlights different key points depending on whether you already hold a position or are currently flat. Current price: 349.94; 1 hour: -0.42%, 24 hours: +1.44%.
At present, the 1-hour (-0.42%) and 24-hour (+1.44%) cycles have not formed a sufficiently clear alignment in the same direction. In a range-bound market, the tolerance for chase-and-fail is low. It’s more suitable to confirm the direction with the upper boundary, confirm the hold/support with the lower boundary; the midline is only a line that separates strength and weakness.
For those who already have positions: watch whether 345.66 breaks and gets lost. If it does, reduce risk exposure first. For those who are flat: wait for the low to stop making lower lows, and confirm that price has reclaimed 349.09. Don’t catch the falling structure too early.
There are three ways the next path could be handled. If price effectively holds and stands above 352.52, wait for the pullback to not break before reassessing for continuation. If price breaks down below 345.66, prioritize controlling risk and wait for new support. If price continues to trade around 349.09 in a range, treat it as range rotation and don’t repeatedly chase direction in the middle zone.
Those already in positions can manage decisions in stages based on key levels, avoiding making all judgments at once. Flat traders should wait for breakout confirmation or pullback stabilization. For US stocks, also watch for volatility caused by trading session transitions. Your plan should be based on price conditions—don’t let emotion replace execution.
For short-term positions, the focus is not to predict every single candlestick. It’s to ensure there is a basis for entries, reducing exposure, and exits. Do less until confirmed; when a key level fails, redo the plan. First control per-trade risk, then discuss the upside/downside room ahead.
#InjectiveLaunchesINJOnSolana
$AVGOB #AVGO This time, we break down the move from a position perspective. The same chart highlights different key points depending on whether you already hold a position or are currently flat. Current price: 349.94; 1 hour: -0.42%, 24 hours: +1.44%.
At present, the 1-hour (-0.42%) and 24-hour (+1.44%) cycles have not formed a sufficiently clear alignment in the same direction. In a range-bound market, the tolerance for chase-and-fail is low. It’s more suitable to confirm the direction with the upper boundary, confirm the hold/support with the lower boundary; the midline is only a line that separates strength and weakness.
For those who already have positions: watch whether 345.66 breaks and gets lost. If it does, reduce risk exposure first. For those who are flat: wait for the low to stop making lower lows, and confirm that price has reclaimed 349.09. Don’t catch the falling structure too early.
There are three ways the next path could be handled. If price effectively holds and stands above 352.52, wait for the pullback to not break before reassessing for continuation. If price breaks down below 345.66, prioritize controlling risk and wait for new support. If price continues to trade around 349.09 in a range, treat it as range rotation and don’t repeatedly chase direction in the middle zone.
Those already in positions can manage decisions in stages based on key levels, avoiding making all judgments at once. Flat traders should wait for breakout confirmation or pullback stabilization. For US stocks, also watch for volatility caused by trading session transitions. Your plan should be based on price conditions—don’t let emotion replace execution.
For short-term positions, the focus is not to predict every single candlestick. It’s to ensure there is a basis for entries, reducing exposure, and exits. Do less until confirmed; when a key level fails, redo the plan. First control per-trade risk, then discuss the upside/downside room ahead.
#InjectiveLaunchesINJOnSolana
At present, the 1-hour (-0.42%) and 24-hour (+1.44%) cycles have not formed a sufficiently clear alignment in the same direction. In a range-bound market, the tolerance for chase-and-fail is low. It’s more suitable to confirm the direction with the upper boundary, confirm the hold/support with the lower boundary; the midline is only a line that separates strength and weakness.
For those who already have positions: watch whether 345.66 breaks and gets lost. If it does, reduce risk exposure first. For those who are flat: wait for the low to stop making lower lows, and confirm that price has reclaimed 349.09. Don’t catch the falling structure too early.
There are three ways the next path could be handled. If price effectively holds and stands above 352.52, wait for the pullback to not break before reassessing for continuation. If price breaks down below 345.66, prioritize controlling risk and wait for new support. If price continues to trade around 349.09 in a range, treat it as range rotation and don’t repeatedly chase direction in the middle zone.
Those already in positions can manage decisions in stages based on key levels, avoiding making all judgments at once. Flat traders should wait for breakout confirmation or pullback stabilization. For US stocks, also watch for volatility caused by trading session transitions. Your plan should be based on price conditions—don’t let emotion replace execution.
For short-term positions, the focus is not to predict every single candlestick. It’s to ensure there is a basis for entries, reducing exposure, and exits. Do less until confirmed; when a key level fails, redo the plan. First control per-trade risk, then discuss the upside/downside room ahead.
#InjectiveLaunchesINJOnSolana
6
·
--
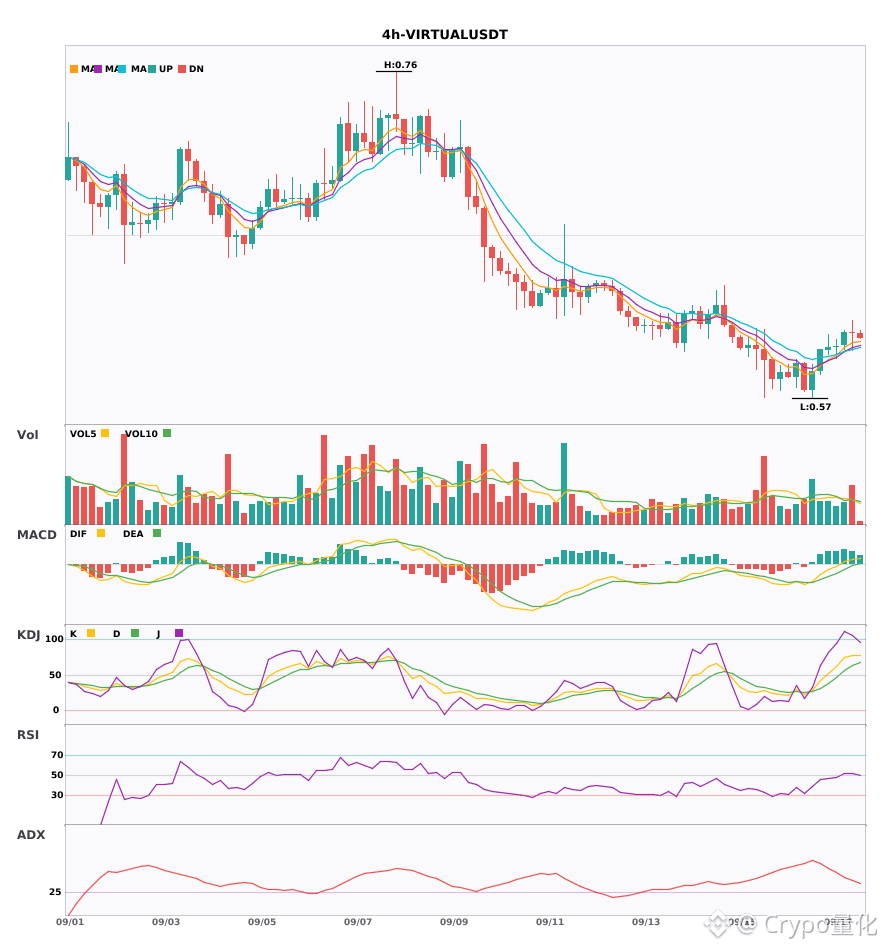
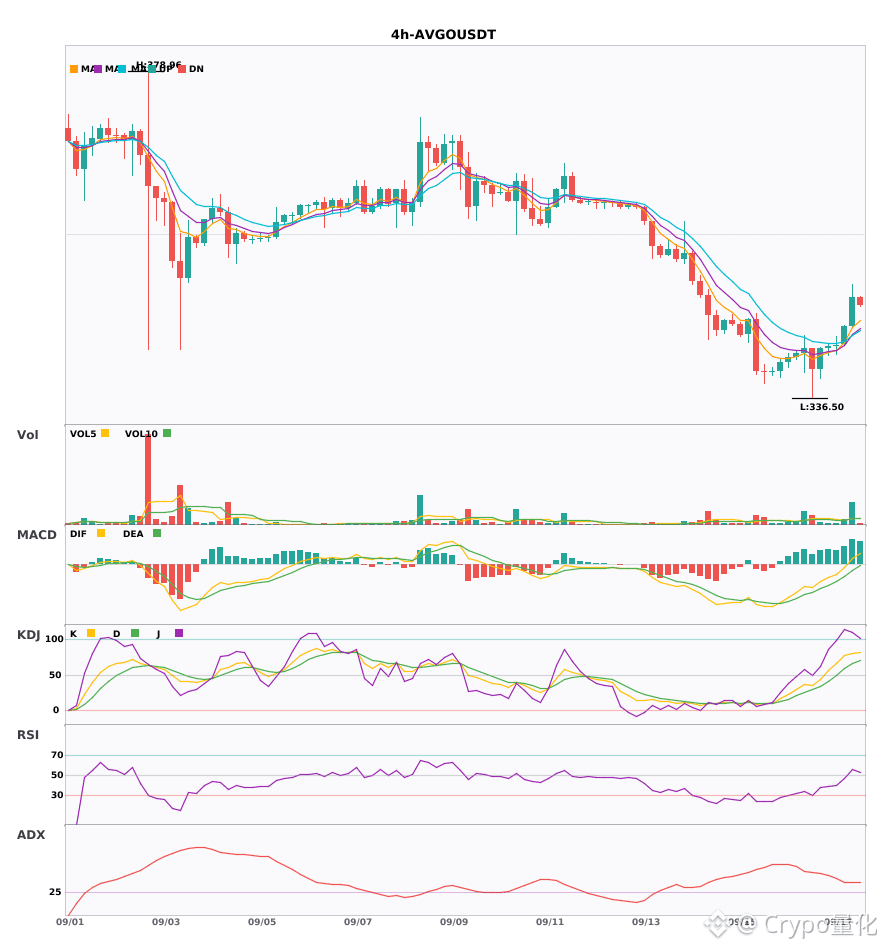
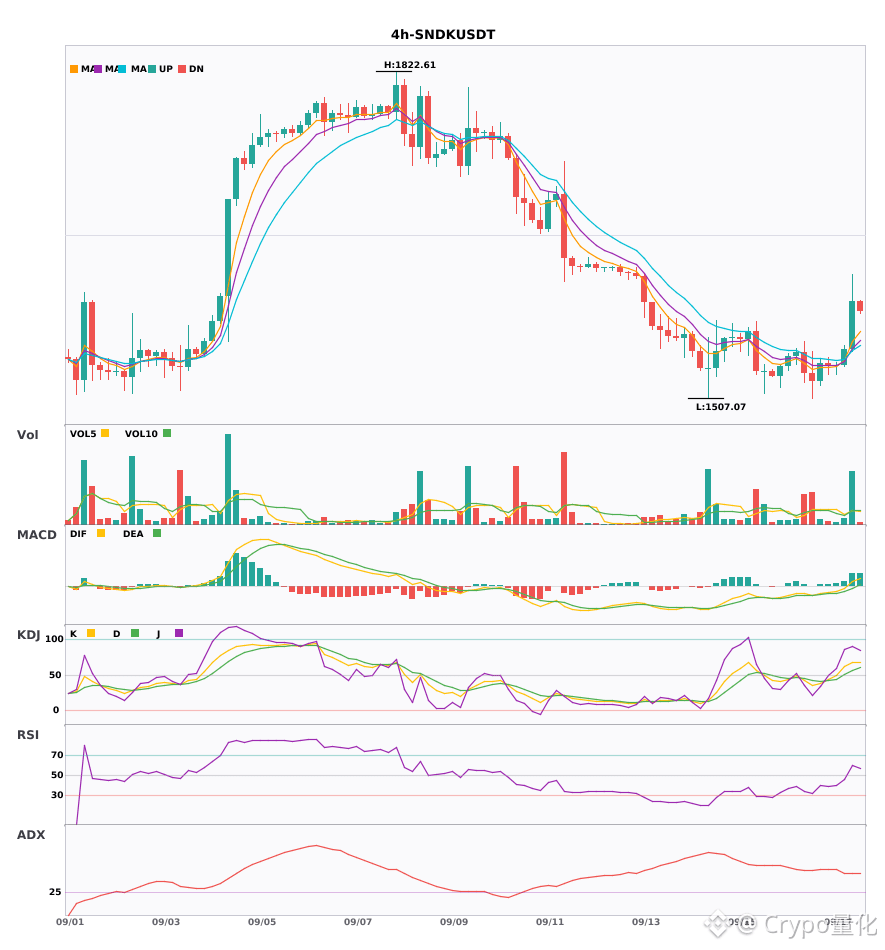
$VIRTUAL / $AVGO / $SNDK 4 hours level appears to be more frequent, with short-term resonance opportunities🔥
════════════════════
🔴 $VIRTUAL 4 hours Bullish Signal
⚠️ Technicals: ADX38 shows a clear trend; MACD bullish momentum is weakening; moving averages are in a bullish alignment. The K-line crosses above D without being overbought; volume is up by 1.6x.
════════════════════
🔴 $AVGO 4 hours Bullish Signal
⚠️ Technicals: ADX(35) indicates a clear trending market | MACD DIF breaks above the zero line, trend turns bullish | EMA5 > EMA8 > EMA13 with a bullish configuration | KDJ is running strong, bulls are dominant (K is 80.5, D is 65.9) | Volume surges (3.5x)
════════════════════
🔴 $SNDK 4 hours Bullish Signal
⚠️ Technicals: ADX(45) indicates a clear trending market | MACD DIF breaks above the zero line, trend turns bullish | EMA5 > EMA8 > EMA13 with a bullish configuration | KDJ is running strong, bulls are dominant (K is 67.3, D is 55.8) | Volume surges (3.6x)
════════════════════
🔔 Watch for and get the first-hand market updates on unusual moves 🔔
#技术分析 #VIRTUAL #AVGO #SNDK
📌 When trading, pay attention to whether the candlestick patterns match
$VIRTUAL / $AVGO / $SNDK 4 hours level appears to be more frequent, with short-term resonance opportunities🔥
════════════════════
🔴 $VIRTUAL 4 hours Bullish Signal
⚠️ Technicals: ADX38 shows a clear trend; MACD bullish momentum is weakening; moving averages are in a bullish alignment. The K-line crosses above D without being overbought; volume is up by 1.6x.
════════════════════
🔴 $AVGO 4 hours Bullish Signal
⚠️ Technicals: ADX(35) indicates a clear trending market | MACD DIF breaks above the zero line, trend turns bullish | EMA5 > EMA8 > EMA13 with a bullish configuration | KDJ is running strong, bulls are dominant (K is 80.5, D is 65.9) | Volume surges (3.5x)
════════════════════
🔴 $SNDK 4 hours Bullish Signal
⚠️ Technicals: ADX(45) indicates a clear trending market | MACD DIF breaks above the zero line, trend turns bullish | EMA5 > EMA8 > EMA13 with a bullish configuration | KDJ is running strong, bulls are dominant (K is 67.3, D is 55.8) | Volume surges (3.6x)
════════════════════
🔔 Watch for and get the first-hand market updates on unusual moves 🔔
#技术分析 #VIRTUAL #AVGO #SNDK
📌 When trading, pay attention to whether the candlestick patterns match
════════════════════
🔴 $VIRTUAL 4 hours Bullish Signal
⚠️ Technicals: ADX38 shows a clear trend; MACD bullish momentum is weakening; moving averages are in a bullish alignment. The K-line crosses above D without being overbought; volume is up by 1.6x.
════════════════════
🔴 $AVGO 4 hours Bullish Signal
⚠️ Technicals: ADX(35) indicates a clear trending market | MACD DIF breaks above the zero line, trend turns bullish | EMA5 > EMA8 > EMA13 with a bullish configuration | KDJ is running strong, bulls are dominant (K is 80.5, D is 65.9) | Volume surges (3.5x)
════════════════════
🔴 $SNDK 4 hours Bullish Signal
⚠️ Technicals: ADX(45) indicates a clear trending market | MACD DIF breaks above the zero line, trend turns bullish | EMA5 > EMA8 > EMA13 with a bullish configuration | KDJ is running strong, bulls are dominant (K is 67.3, D is 55.8) | Volume surges (3.6x)
════════════════════
🔔 Watch for and get the first-hand market updates on unusual moves 🔔
#技术分析 #VIRTUAL #AVGO #SNDK
📌 When trading, pay attention to whether the candlestick patterns match
297
·
--
$AVGOB #AVGO It’s currently more like rotation within a range; there’s no need to explain every 1-hour candlestick as a new trend. Current price is 345.15, up 0.05% in 1 hour and up 0.86% in 24 hours.
The current price is near the upper end of the past 24-hour trading range: +0.05% in 1 hour and +0.86% in 24 hours. The most important thing at the top is to confirm the market’s acceptance after a breakout: if price can stay above the upper band, it means the market is recognizing a higher range; if it only briefly pierces and then quickly snaps back, you need to guard against a false breakout.
Upper band: 345.36, lower band: 336.15, midline: 340.755. When near the upper band, watch the quality of the breakout; when near the lower band, watch the follow-through/support; around the midline, reduce frequent trading—because it’s not far enough from either side, and the direction and risk-reward ratio are not clear.
The signals truly worth acting on are: after breaking the boundary, price is willing to stay in the new range; or after probing down to the boundary, it quickly recovers. Without such confirmation, continue treating it as range-bound and don’t change the overall plan due to temporary intraday fluctuations.
For existing positions, handle them in segments based on key levels to avoid making all judgments at once. For those with no position, wait for breakout confirmation or a pullback that stabilizes. Also be mindful of volatility caused by switching U.S. stock trading sessions—your plan should be based on price conditions, not emotions driving execution.
For short-term positions, the focus isn’t to predict every single candlestick, but to ensure the rationale exists for entries, trimming, and exits. If there’s no confirmation, trade less; if key levels fail, redo the plan—control single-trade risk first, then talk about further upside/downside potential.
#RobinhoodToSupportCircleArcNetwork
$AVGOB #AVGO It’s currently more like rotation within a range; there’s no need to explain every 1-hour candlestick as a new trend. Current price is 345.15, up 0.05% in 1 hour and up 0.86% in 24 hours.
The current price is near the upper end of the past 24-hour trading range: +0.05% in 1 hour and +0.86% in 24 hours. The most important thing at the top is to confirm the market’s acceptance after a breakout: if price can stay above the upper band, it means the market is recognizing a higher range; if it only briefly pierces and then quickly snaps back, you need to guard against a false breakout.
Upper band: 345.36, lower band: 336.15, midline: 340.755. When near the upper band, watch the quality of the breakout; when near the lower band, watch the follow-through/support; around the midline, reduce frequent trading—because it’s not far enough from either side, and the direction and risk-reward ratio are not clear.
The signals truly worth acting on are: after breaking the boundary, price is willing to stay in the new range; or after probing down to the boundary, it quickly recovers. Without such confirmation, continue treating it as range-bound and don’t change the overall plan due to temporary intraday fluctuations.
For existing positions, handle them in segments based on key levels to avoid making all judgments at once. For those with no position, wait for breakout confirmation or a pullback that stabilizes. Also be mindful of volatility caused by switching U.S. stock trading sessions—your plan should be based on price conditions, not emotions driving execution.
For short-term positions, the focus isn’t to predict every single candlestick, but to ensure the rationale exists for entries, trimming, and exits. If there’s no confirmation, trade less; if key levels fail, redo the plan—control single-trade risk first, then talk about further upside/downside potential.
#RobinhoodToSupportCircleArcNetwork
The current price is near the upper end of the past 24-hour trading range: +0.05% in 1 hour and +0.86% in 24 hours. The most important thing at the top is to confirm the market’s acceptance after a breakout: if price can stay above the upper band, it means the market is recognizing a higher range; if it only briefly pierces and then quickly snaps back, you need to guard against a false breakout.
Upper band: 345.36, lower band: 336.15, midline: 340.755. When near the upper band, watch the quality of the breakout; when near the lower band, watch the follow-through/support; around the midline, reduce frequent trading—because it’s not far enough from either side, and the direction and risk-reward ratio are not clear.
The signals truly worth acting on are: after breaking the boundary, price is willing to stay in the new range; or after probing down to the boundary, it quickly recovers. Without such confirmation, continue treating it as range-bound and don’t change the overall plan due to temporary intraday fluctuations.
For existing positions, handle them in segments based on key levels to avoid making all judgments at once. For those with no position, wait for breakout confirmation or a pullback that stabilizes. Also be mindful of volatility caused by switching U.S. stock trading sessions—your plan should be based on price conditions, not emotions driving execution.
For short-term positions, the focus isn’t to predict every single candlestick, but to ensure the rationale exists for entries, trimming, and exits. If there’s no confirmation, trade less; if key levels fail, redo the plan—control single-trade risk first, then talk about further upside/downside potential.
#RobinhoodToSupportCircleArcNetwork
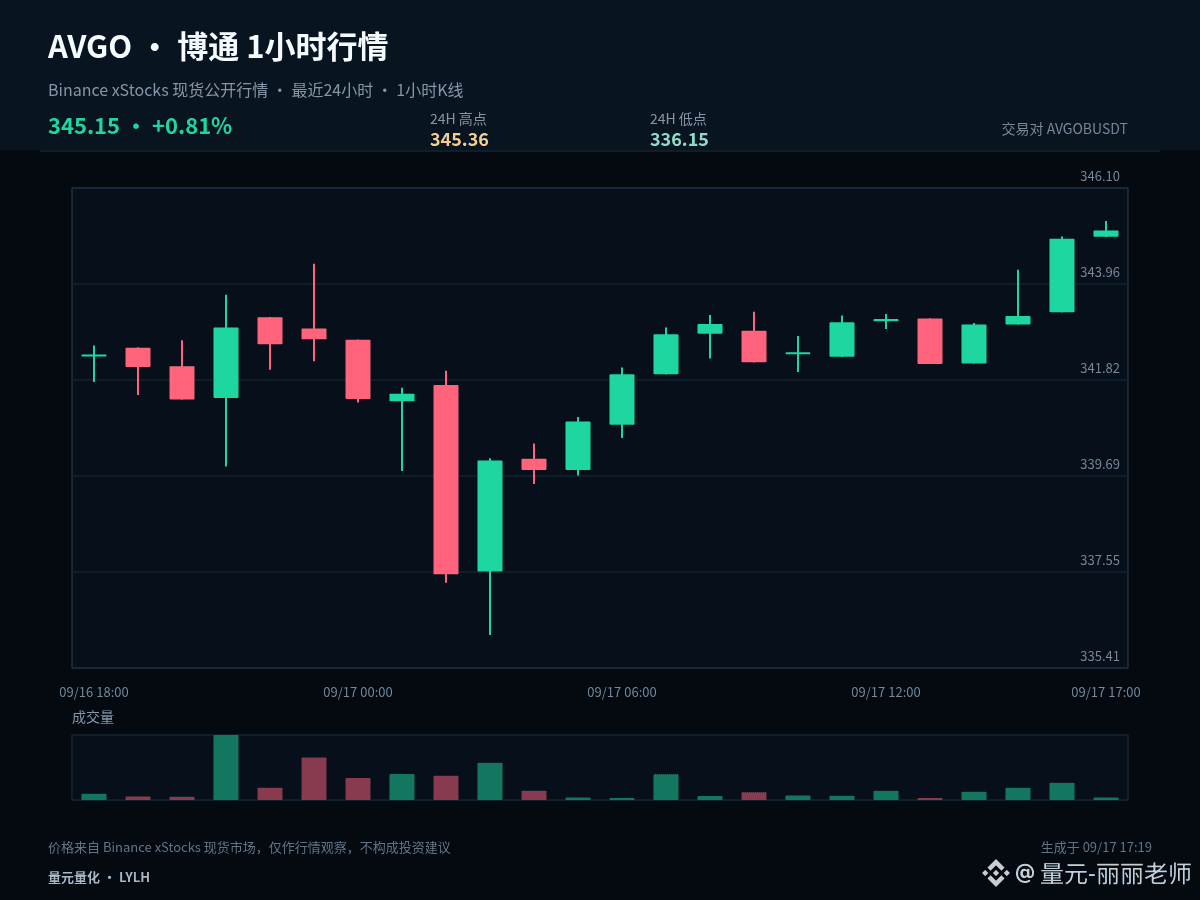
10
·
--
$ETH / $RAYSOL / $AVGO 30 minutes: more bullish signals; short-term resonance opportunities 🔥
════════════════════
🔴 $ETH 30 minutes bullish signal
⚠️ Technicals: ADX(34) shows a clear trending market | MACD is above zero and has a bullish golden cross; bullish momentum is releasing | EMA5 > EMA8 > EMA13 with a bullish alignment | KDJ is running strongly with bulls in control (K=77.9, D=75.9) | Volume expands (2.3x)
📢 Market update: On Aug 27, 2026, the Ethereum (ETH) network will undergo wallet maintenance
════════════════════
🔴 $RAYSOL 30 minutes bullish signal
⚠️ Technicals: ADX(27) indicates a trend is forming and is open for participation | MACD is above zero and has a bullish golden cross; bullish momentum is releasing | EMA5 crosses above EMA8; short-term turns bullish | KDJ golden cross; short-term upside (K=47.1, D=39.7) | Volume expands (1.9x)
════════════════════
🔴 $AVGO 30 minutes bullish signal
⚠️ Technicals: ADX(26) indicates a trend is forming and is open for participation | MACD is above zero and has a bullish golden cross; bullish momentum is releasing | EMA5 > EMA8 > EMA13 with a bullish alignment | KDJ golden cross; short-term upside (K=77.0, D=70.1) | Volume expands (1.9x)
════════════════════
🔔 Follow for the very first updates on sudden market moves 🔔
#技术分析 #ETH #RAYSOL #AVGO
📌 When trading, pay attention to whether the candlestick patterns match
$ETH / $RAYSOL / $AVGO 30 minutes: more bullish signals; short-term resonance opportunities 🔥
════════════════════
🔴 $ETH 30 minutes bullish signal
⚠️ Technicals: ADX(34) shows a clear trending market | MACD is above zero and has a bullish golden cross; bullish momentum is releasing | EMA5 > EMA8 > EMA13 with a bullish alignment | KDJ is running strongly with bulls in control (K=77.9, D=75.9) | Volume expands (2.3x)
📢 Market update: On Aug 27, 2026, the Ethereum (ETH) network will undergo wallet maintenance
════════════════════
🔴 $RAYSOL 30 minutes bullish signal
⚠️ Technicals: ADX(27) indicates a trend is forming and is open for participation | MACD is above zero and has a bullish golden cross; bullish momentum is releasing | EMA5 crosses above EMA8; short-term turns bullish | KDJ golden cross; short-term upside (K=47.1, D=39.7) | Volume expands (1.9x)
════════════════════
🔴 $AVGO 30 minutes bullish signal
⚠️ Technicals: ADX(26) indicates a trend is forming and is open for participation | MACD is above zero and has a bullish golden cross; bullish momentum is releasing | EMA5 > EMA8 > EMA13 with a bullish alignment | KDJ golden cross; short-term upside (K=77.0, D=70.1) | Volume expands (1.9x)
════════════════════
🔔 Follow for the very first updates on sudden market moves 🔔
#技术分析 #ETH #RAYSOL #AVGO
📌 When trading, pay attention to whether the candlestick patterns match
════════════════════
🔴 $ETH 30 minutes bullish signal
⚠️ Technicals: ADX(34) shows a clear trending market | MACD is above zero and has a bullish golden cross; bullish momentum is releasing | EMA5 > EMA8 > EMA13 with a bullish alignment | KDJ is running strongly with bulls in control (K=77.9, D=75.9) | Volume expands (2.3x)
📢 Market update: On Aug 27, 2026, the Ethereum (ETH) network will undergo wallet maintenance
════════════════════
🔴 $RAYSOL 30 minutes bullish signal
⚠️ Technicals: ADX(27) indicates a trend is forming and is open for participation | MACD is above zero and has a bullish golden cross; bullish momentum is releasing | EMA5 crosses above EMA8; short-term turns bullish | KDJ golden cross; short-term upside (K=47.1, D=39.7) | Volume expands (1.9x)
════════════════════
🔴 $AVGO 30 minutes bullish signal
⚠️ Technicals: ADX(26) indicates a trend is forming and is open for participation | MACD is above zero and has a bullish golden cross; bullish momentum is releasing | EMA5 > EMA8 > EMA13 with a bullish alignment | KDJ golden cross; short-term upside (K=77.0, D=70.1) | Volume expands (1.9x)
════════════════════
🔔 Follow for the very first updates on sudden market moves 🔔
#技术分析 #ETH #RAYSOL #AVGO
📌 When trading, pay attention to whether the candlestick patterns match
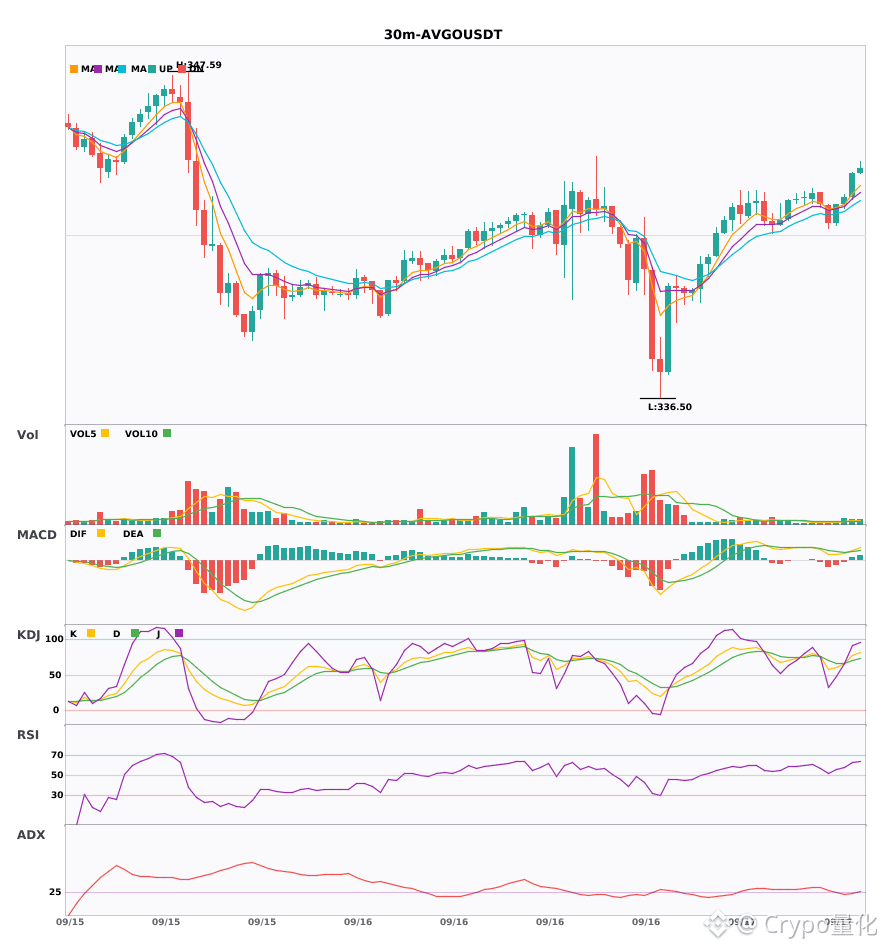
9
·
--
$AVGOB #AVGO Trading conclusion first: if it can’t be reclaimed at 342.845, you need to keep defending 338.34. Current price: 341.97; 1-hour: -0.12%, 24-hour: -1.31%.
Currently, 1-hour is -0.12% and 24-hour is -1.31%. Across the two timeframes, there hasn’t been enough clear same-direction coordination. In a range-bound market, the tolerance for chasing moves is lower; it’s better to confirm direction with the upper band and confirm follow-through with the lower band. The midline is only used as the line between strength and weakness.
For key price levels: 342.845 is the midline that must be reclaimed for a weak repair. If price can’t stand back above here, any rebound should still be treated as a technical repair. Below, 338.34 still has the possibility of being tested again. Only after the midline is recovered do you have the qualification to further watch 347.35.
There are three ways forward: (1) If price effectively holds above 347.35, wait for a pullback that doesn’t break and then reassess whether it can continue; (2) If price breaks below 338.34, prioritize risk control and wait for a new support; (3) If it continues to oscillate around 342.845, treat it as a range turnover area—don’t repeatedly chase direction from the middle.
Position management should distinguish between swing and short-term trades. For existing swing positions, first check whether the structure is broken; don’t let repeated reactions from a single 1-hour candlestick sway you. For short-term positions, execute around support, resistance, and closing confirmation. If you’re currently in cash (no position), there’s no need to chase price in the middle of the range—waiting for a clearer location is usually more advantageous.
Simplifying the conclusion doesn’t mean simplifying risk management. When executing, you still need to wait for price confirmation and leave room to exit if your thesis fails. The market will ultimately validate viewpoints with price action. Do you think the most critical point right now is the break of 347.35, or the defense of 338.34? Let’s track the next results together.
#MSTRTradingVolumeSurpassesMorganStanley
$AVGOB #AVGO Trading conclusion first: if it can’t be reclaimed at 342.845, you need to keep defending 338.34. Current price: 341.97; 1-hour: -0.12%, 24-hour: -1.31%.
Currently, 1-hour is -0.12% and 24-hour is -1.31%. Across the two timeframes, there hasn’t been enough clear same-direction coordination. In a range-bound market, the tolerance for chasing moves is lower; it’s better to confirm direction with the upper band and confirm follow-through with the lower band. The midline is only used as the line between strength and weakness.
For key price levels: 342.845 is the midline that must be reclaimed for a weak repair. If price can’t stand back above here, any rebound should still be treated as a technical repair. Below, 338.34 still has the possibility of being tested again. Only after the midline is recovered do you have the qualification to further watch 347.35.
There are three ways forward: (1) If price effectively holds above 347.35, wait for a pullback that doesn’t break and then reassess whether it can continue; (2) If price breaks below 338.34, prioritize risk control and wait for a new support; (3) If it continues to oscillate around 342.845, treat it as a range turnover area—don’t repeatedly chase direction from the middle.
Position management should distinguish between swing and short-term trades. For existing swing positions, first check whether the structure is broken; don’t let repeated reactions from a single 1-hour candlestick sway you. For short-term positions, execute around support, resistance, and closing confirmation. If you’re currently in cash (no position), there’s no need to chase price in the middle of the range—waiting for a clearer location is usually more advantageous.
Simplifying the conclusion doesn’t mean simplifying risk management. When executing, you still need to wait for price confirmation and leave room to exit if your thesis fails. The market will ultimately validate viewpoints with price action. Do you think the most critical point right now is the break of 347.35, or the defense of 338.34? Let’s track the next results together.
#MSTRTradingVolumeSurpassesMorganStanley
Currently, 1-hour is -0.12% and 24-hour is -1.31%. Across the two timeframes, there hasn’t been enough clear same-direction coordination. In a range-bound market, the tolerance for chasing moves is lower; it’s better to confirm direction with the upper band and confirm follow-through with the lower band. The midline is only used as the line between strength and weakness.
For key price levels: 342.845 is the midline that must be reclaimed for a weak repair. If price can’t stand back above here, any rebound should still be treated as a technical repair. Below, 338.34 still has the possibility of being tested again. Only after the midline is recovered do you have the qualification to further watch 347.35.
There are three ways forward: (1) If price effectively holds above 347.35, wait for a pullback that doesn’t break and then reassess whether it can continue; (2) If price breaks below 338.34, prioritize risk control and wait for a new support; (3) If it continues to oscillate around 342.845, treat it as a range turnover area—don’t repeatedly chase direction from the middle.
Position management should distinguish between swing and short-term trades. For existing swing positions, first check whether the structure is broken; don’t let repeated reactions from a single 1-hour candlestick sway you. For short-term positions, execute around support, resistance, and closing confirmation. If you’re currently in cash (no position), there’s no need to chase price in the middle of the range—waiting for a clearer location is usually more advantageous.
Simplifying the conclusion doesn’t mean simplifying risk management. When executing, you still need to wait for price confirmation and leave room to exit if your thesis fails. The market will ultimately validate viewpoints with price action. Do you think the most critical point right now is the break of 347.35, or the defense of 338.34? Let’s track the next results together.
#MSTRTradingVolumeSurpassesMorganStanley
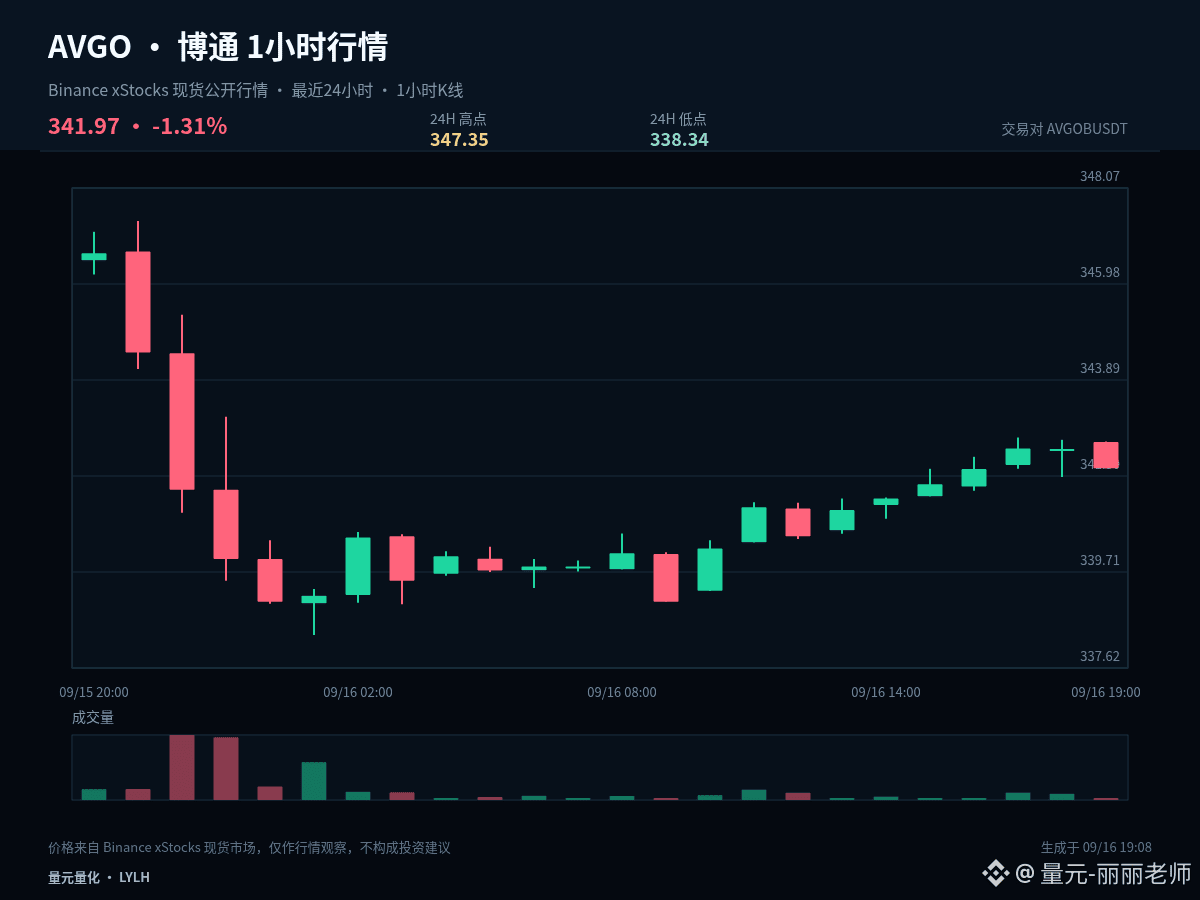
3

·
--
Bearish
AVGO is seeing a notable long flush here.
I’d watch whether sellers can press below this level.
$AVGO
{future}(AVGOUSDT)
🔴 LIQUIDITY ZONE HIT 🔴
Long liquidation spotted 🧨
$10.379K cleared at $339.64127
Downside liquidity swept — watch reaction 👀
🎯 TP Targets:
TP1: ~$336.24
TP2: ~$332.85
TP3: ~$329.45
#avgo
AVGO is seeing a notable long flush here.
I’d watch whether sellers can press below this level.
$AVGO
🔴 LIQUIDITY ZONE HIT 🔴
Long liquidation spotted 🧨
$10.379K cleared at $339.64127
Downside liquidity swept — watch reaction 👀
🎯 TP Targets:
TP1: ~$336.24
TP2: ~$332.85
TP3: ~$329.45
#avgo
I’d watch whether sellers can press below this level.
$AVGO
🔴 LIQUIDITY ZONE HIT 🔴
Long liquidation spotted 🧨
$10.379K cleared at $339.64127
Downside liquidity swept — watch reaction 👀
🎯 TP Targets:
TP1: ~$336.24
TP2: ~$332.85
TP3: ~$329.45
#avgo
157
Log in to explore more content
Join global crypto users on Binance Square
⚡️ Get latest and useful information about crypto.
💬 Trusted by the world’s largest crypto exchange.
👍 Discover real insights from verified creators.
Email / Phone number
Trending Topics
1
#AIStocksWhatNext
385,850 views
3,057 Discussing
2
#BitcoinBreaksAboveMayHighNears$86K
16,156 views
196 Discussing
3
#DogecoinRises15%
51,527 views
1,019 Discussing
4
#$14BBitcoinOptionsExpireFriday
4,181 views
90 Discussing
5
#BNBMarketCapPassesBNYMellon
32,373 views
733 Discussing
6
#CryptoMarketCapReclaims$3Trillion
5,555 views
82 Discussing
7
#MuseOvertakesChatGPTAsTopFreeIOSApp
18,847 views
543 Discussing
8
#TokenizedStockPlatformsCouldLaunchNextQuarter
29,712 views
597 Discussing
9
#StrategyAdds950Bitcoin
37,233 views
692 Discussing
10
#CardanoAddedToX402KitForADAPayments
31,107 views
665 Discussing