
#ram
ram
638,591 views
1,334 Discussing
Hot
Latest

·
--
$RAM surged 4.676% over the past 24 hours, with the price at 13.88. U.S. tech stocks have been in a recent pullback; if Trump again speaks out to pressure tariffs, on-chain U.S.-stock proxies could slip as well. The funding rate is 0.00055728, which is positive—meaning longs are paying to maintain positions. A rise along with a positive funding rate indicates that the cost of chasing highs is accumulating. My view is that the risk of going long in the short term is greater than the potential upside; this area is likely to get hit.
The counterargument is that if U.S. stocks V-rebound, $RAM might rebound too. But the fact remains that the longs are crowded. If Trump posts again and calls out tech companies, panic selling could first target this level.
Trading tag: #TradFi #链上美股 #RAM
Where do you think this set of 판단 is most likely to be wrong?
$RAM surged 4.676% over the past 24 hours, with the price at 13.88. U.S. tech stocks have been in a recent pullback; if Trump again speaks out to pressure tariffs, on-chain U.S.-stock proxies could slip as well. The funding rate is 0.00055728, which is positive—meaning longs are paying to maintain positions. A rise along with a positive funding rate indicates that the cost of chasing highs is accumulating. My view is that the risk of going long in the short term is greater than the potential upside; this area is likely to get hit.
The counterargument is that if U.S. stocks V-rebound, $RAM might rebound too. But the fact remains that the longs are crowded. If Trump posts again and calls out tech companies, panic selling could first target this level.
Trading tag: #TradFi #链上美股 #RAM
Where do you think this set of 판단 is most likely to be wrong?
The counterargument is that if U.S. stocks V-rebound, $RAM might rebound too. But the fact remains that the longs are crowded. If Trump posts again and calls out tech companies, panic selling could first target this level.
Trading tag: #TradFi #链上美股 #RAM
Where do you think this set of 판단 is most likely to be wrong?
38

·
--
$RAM fell 11.68, down 2.99% over 24 hours, but the corresponding perpetual contract funding rate remains positive at 0.00062. Price weakness alongside a positive funding rate means long positions are paying financing costs against the trend.
Current open interest is 37,668, with trading volume of about 1.51 million. Liquidity is not particularly strong. This structure is a classic case of longs trapped: as the price declines, longs not only absorb unrealized losses, but also pay the short side for holding the positions. If the funding rate continues to stay positive, longs’ time costs will keep accumulating until they either reduce exposure or get liquidated.
The counterpoint is that if sentiment in the US stock market suddenly turns bullish and lifts these TradFi derivatives, longs could quickly swing back into profit and the funding pressure would dissipate instantly. The trigger for this thesis to fail is straightforward: the price recovers 11.68 for two consecutive days and the funding rate turns negative.
I’m waiting for a clearer signal. This drifting lower-with-interest-paid setup is not suitable for a left-side entry. If the price stabilizes above 11.68 and we observe the funding rate turning negative, that would be an initial signal that shorts concede and longs regain control. At that point, you could consider a small initial long position.
Aggressive: When the price holds above 11.68 and the funding rate turns negative, go long with a small position; set a stop-loss below the prior low.
Trading tag: #TradFi #链上美股 #RAM
Where do you think this judgment is most likely to be wrong?
$RAM fell 11.68, down 2.99% over 24 hours, but the corresponding perpetual contract funding rate remains positive at 0.00062. Price weakness alongside a positive funding rate means long positions are paying financing costs against the trend.
Current open interest is 37,668, with trading volume of about 1.51 million. Liquidity is not particularly strong. This structure is a classic case of longs trapped: as the price declines, longs not only absorb unrealized losses, but also pay the short side for holding the positions. If the funding rate continues to stay positive, longs’ time costs will keep accumulating until they either reduce exposure or get liquidated.
The counterpoint is that if sentiment in the US stock market suddenly turns bullish and lifts these TradFi derivatives, longs could quickly swing back into profit and the funding pressure would dissipate instantly. The trigger for this thesis to fail is straightforward: the price recovers 11.68 for two consecutive days and the funding rate turns negative.
I’m waiting for a clearer signal. This drifting lower-with-interest-paid setup is not suitable for a left-side entry. If the price stabilizes above 11.68 and we observe the funding rate turning negative, that would be an initial signal that shorts concede and longs regain control. At that point, you could consider a small initial long position.
Aggressive: When the price holds above 11.68 and the funding rate turns negative, go long with a small position; set a stop-loss below the prior low.
Trading tag: #TradFi #链上美股 #RAM
Where do you think this judgment is most likely to be wrong?
Current open interest is 37,668, with trading volume of about 1.51 million. Liquidity is not particularly strong. This structure is a classic case of longs trapped: as the price declines, longs not only absorb unrealized losses, but also pay the short side for holding the positions. If the funding rate continues to stay positive, longs’ time costs will keep accumulating until they either reduce exposure or get liquidated.
The counterpoint is that if sentiment in the US stock market suddenly turns bullish and lifts these TradFi derivatives, longs could quickly swing back into profit and the funding pressure would dissipate instantly. The trigger for this thesis to fail is straightforward: the price recovers 11.68 for two consecutive days and the funding rate turns negative.
I’m waiting for a clearer signal. This drifting lower-with-interest-paid setup is not suitable for a left-side entry. If the price stabilizes above 11.68 and we observe the funding rate turning negative, that would be an initial signal that shorts concede and longs regain control. At that point, you could consider a small initial long position.
Aggressive: When the price holds above 11.68 and the funding rate turns negative, go long with a small position; set a stop-loss below the prior low.
Trading tag: #TradFi #链上美股 #RAM
Where do you think this judgment is most likely to be wrong?
28
·
--
$RAM current price 11.68, down 2.99% over the past 24 hours, yet the funding rate remains at 0.00062257. Price is falling, and the funding rate is still positive—this is a typical long-squeeze/longs-being-trapped situation, where shorts are collecting funding from longs.
This is a single-signal judgment, but the structure is clear. A positive funding rate means longs are currently paying shorts the cost of holding positions. If the price drops while the funding rate stays positive, it suggests the longs that are “holding on” have not admitted defeat and exited—possibly even adding to positions to dilute their cost basis. Open interest is 37668.15; that number alone can’t be directly compared, but combined with the price and funding rate, it points to a crowded long position and a passive/forced situation. Under this kind of structure, any further decline may trigger long liquidation stops or even liquidations, leading to liquidity “trampling.”
The opposing view is that $RAM, as a tokenized U.S. stock product, may have underlying assets supported by earnings reports or industry tailwinds, and after a short-term pullback, buy-side demand will re-enter. However, the current contract structure doesn’t reflect that—funding hasn’t quickly dropped toward zero or turned negative as the price falls, which suggests shorts have not widely closed their positions, and bearish pressure is still solid.
If the price breaks below 11.5 and the funding rate does not show a significant decline, I would reduce exposure to avoid the risk of “one sell triggers another.” Conversely, if the funding rate quickly turns negative, that would indicate shorts are exhausted, and the market may enter a new balance.
Trading tag: #TradFi #链上美股 #RAM
Where do you think this analysis is most likely to be wrong?
$RAM current price 11.68, down 2.99% over the past 24 hours, yet the funding rate remains at 0.00062257. Price is falling, and the funding rate is still positive—this is a typical long-squeeze/longs-being-trapped situation, where shorts are collecting funding from longs.
This is a single-signal judgment, but the structure is clear. A positive funding rate means longs are currently paying shorts the cost of holding positions. If the price drops while the funding rate stays positive, it suggests the longs that are “holding on” have not admitted defeat and exited—possibly even adding to positions to dilute their cost basis. Open interest is 37668.15; that number alone can’t be directly compared, but combined with the price and funding rate, it points to a crowded long position and a passive/forced situation. Under this kind of structure, any further decline may trigger long liquidation stops or even liquidations, leading to liquidity “trampling.”
The opposing view is that $RAM , as a tokenized U.S. stock product, may have underlying assets supported by earnings reports or industry tailwinds, and after a short-term pullback, buy-side demand will re-enter. However, the current contract structure doesn’t reflect that—funding hasn’t quickly dropped toward zero or turned negative as the price falls, which suggests shorts have not widely closed their positions, and bearish pressure is still solid.
If the price breaks below 11.5 and the funding rate does not show a significant decline, I would reduce exposure to avoid the risk of “one sell triggers another.” Conversely, if the funding rate quickly turns negative, that would indicate shorts are exhausted, and the market may enter a new balance.
Trading tag: #TradFi #链上美股 #RAM
Where do you think this analysis is most likely to be wrong?
This is a single-signal judgment, but the structure is clear. A positive funding rate means longs are currently paying shorts the cost of holding positions. If the price drops while the funding rate stays positive, it suggests the longs that are “holding on” have not admitted defeat and exited—possibly even adding to positions to dilute their cost basis. Open interest is 37668.15; that number alone can’t be directly compared, but combined with the price and funding rate, it points to a crowded long position and a passive/forced situation. Under this kind of structure, any further decline may trigger long liquidation stops or even liquidations, leading to liquidity “trampling.”
The opposing view is that $RAM , as a tokenized U.S. stock product, may have underlying assets supported by earnings reports or industry tailwinds, and after a short-term pullback, buy-side demand will re-enter. However, the current contract structure doesn’t reflect that—funding hasn’t quickly dropped toward zero or turned negative as the price falls, which suggests shorts have not widely closed their positions, and bearish pressure is still solid.
If the price breaks below 11.5 and the funding rate does not show a significant decline, I would reduce exposure to avoid the risk of “one sell triggers another.” Conversely, if the funding rate quickly turns negative, that would indicate shorts are exhausted, and the market may enter a new balance.
Trading tag: #TradFi #链上美股 #RAM
Where do you think this analysis is most likely to be wrong?
70
·
--
$RAM 24 hours saw a 6.67% drop, with a closing price of 11.48. Political and military tensions are heating up, and risk-avoidance sentiment in the market is rising. The typical route is capital flowing out of high-risk assets. $RAM, such as these on-chain U.S. stock-style contracts, is hit first—its decline is the evidence.
The drawdown isn’t that deep because the funding rate is 0. This indicates there’s no extreme sentiment on either the long or short side—neither side is paying funding fees to stubbornly hold. The fall looks more like a natural adjustment rather than a panic sell-off or a situation where shorts squeeze the market. Trading volume is 1.69 million, open interest is 38,000, and for now there are no signs of large-scale withdrawal.
My take: geopolitical risk is the knife hanging overhead. Nothing major has happened yet, so the market is holding steady. But as soon as another piece of news drops, a liquidity-middling asset like $RAM could fall even harder than the broader market. Chasing longs now is essentially betting that the conflict will cool down—the odds aren’t good.
Clear action: stay on the sidelines. If the price breaks below the previous low around 11.40, I’ll test a short position with a small size, with a stop-loss set above 11.80. If the price first rises back above 11.60, then this short thesis will be abandoned for now.
Trading tag: #TradFi #链上美股 #RAM
Where do you think this analysis is most likely to be wrong?
$RAM 24 hours saw a 6.67% drop, with a closing price of 11.48. Political and military tensions are heating up, and risk-avoidance sentiment in the market is rising. The typical route is capital flowing out of high-risk assets. $RAM , such as these on-chain U.S. stock-style contracts, is hit first—its decline is the evidence.
The drawdown isn’t that deep because the funding rate is 0. This indicates there’s no extreme sentiment on either the long or short side—neither side is paying funding fees to stubbornly hold. The fall looks more like a natural adjustment rather than a panic sell-off or a situation where shorts squeeze the market. Trading volume is 1.69 million, open interest is 38,000, and for now there are no signs of large-scale withdrawal.
My take: geopolitical risk is the knife hanging overhead. Nothing major has happened yet, so the market is holding steady. But as soon as another piece of news drops, a liquidity-middling asset like $RAM could fall even harder than the broader market. Chasing longs now is essentially betting that the conflict will cool down—the odds aren’t good.
Clear action: stay on the sidelines. If the price breaks below the previous low around 11.40, I’ll test a short position with a small size, with a stop-loss set above 11.80. If the price first rises back above 11.60, then this short thesis will be abandoned for now.
Trading tag: #TradFi #链上美股 #RAM
Where do you think this analysis is most likely to be wrong?
The drawdown isn’t that deep because the funding rate is 0. This indicates there’s no extreme sentiment on either the long or short side—neither side is paying funding fees to stubbornly hold. The fall looks more like a natural adjustment rather than a panic sell-off or a situation where shorts squeeze the market. Trading volume is 1.69 million, open interest is 38,000, and for now there are no signs of large-scale withdrawal.
My take: geopolitical risk is the knife hanging overhead. Nothing major has happened yet, so the market is holding steady. But as soon as another piece of news drops, a liquidity-middling asset like $RAM could fall even harder than the broader market. Chasing longs now is essentially betting that the conflict will cool down—the odds aren’t good.
Clear action: stay on the sidelines. If the price breaks below the previous low around 11.40, I’ll test a short position with a small size, with a stop-loss set above 11.80. If the price first rises back above 11.60, then this short thesis will be abandoned for now.
Trading tag: #TradFi #链上美股 #RAM
Where do you think this analysis is most likely to be wrong?
26

·
--
$RAM fell 7.076% over the past 24 hours, and the price is down to 11.95. The old dog glanced at the data and found something interesting: with this kind of drawdown, the perpetual contract funding rate is 0.00000000. This setup needs to be looked at piece by piece.
The price has dropped sharply; under normal logic, short-side pressure should strengthen and push the funding rate into negative territory—meaning shorts pay longs. But now the rate hasn’t moved at all and stays at zero, which indicates that the costs between longs and shorts in the contract market are perfectly balanced, with no side needing to pay extra for holding positions. This points to a possible scenario: the selling pressure behind this drop is likely not mainly from shorts actively driving the market down in the futures/perps, but more likely from spot holders or longs on the contract side actively closing positions.
Open interest (OI) remains at 37774.47, but without historical comparisons, it’s impossible to say whether this level is high or low. Looking at just this one signal, the decline lacks “fuel” from shorts in the contract market, so the continuation of the selloff needs a question mark.
My view is that this isn’t the beginning of a trend-driven selloff led by shorts. It looks more like a concentrated profit-taking and position-reduction move on the spot side or from long positions in the contracts. Because if shorts truly rushed in aggressively, they wouldn’t be able to accept the zero-funding cost—they would push funding down. The current data doesn’t support the idea that shorts have strong intentions to go heavily short. So, based on a single-signal read: the rapid selloff in the short term may be close to the end, but an immediate reversal still requires fresh evidence of new buying.
But on the other hand, the strongest counter-evidence is this: if the funding rate quickly turns negative—for example, below -0.01%—then it would mean shorts have started moving in to buy the dip and bet on further downside, and my judgment would be wrong. At the same time, watch OI: if the price stabilizes and OI increases significantly, it may indicate longs taking orders on the left side; if the price stabilizes but OI declines, it suggests funding is being withdrawn and the rebound lacks momentum.
The second-order effect is that if the price consolidates here while funding stays at zero, contract longs don’t have to pay interest, but they still face unrealized losses on their positions. That psychological pressure could trigger a new round of forced liquidations. If spot selling pressure continues, it could weigh on the coin price; however, the calm in the contract market limits the depth of panic-driven selloffs, which may keep the market trapped in a frustrating grind lower.
When would my view become invalid?
Trading tag: #BinanceFutures #TradFi #USDⓈM #RAM #RAMUSDT $RAM
$RAM fell 7.076% over the past 24 hours, and the price is down to 11.95. The old dog glanced at the data and found something interesting: with this kind of drawdown, the perpetual contract funding rate is 0.00000000. This setup needs to be looked at piece by piece.
The price has dropped sharply; under normal logic, short-side pressure should strengthen and push the funding rate into negative territory—meaning shorts pay longs. But now the rate hasn’t moved at all and stays at zero, which indicates that the costs between longs and shorts in the contract market are perfectly balanced, with no side needing to pay extra for holding positions. This points to a possible scenario: the selling pressure behind this drop is likely not mainly from shorts actively driving the market down in the futures/perps, but more likely from spot holders or longs on the contract side actively closing positions.
Open interest (OI) remains at 37774.47, but without historical comparisons, it’s impossible to say whether this level is high or low. Looking at just this one signal, the decline lacks “fuel” from shorts in the contract market, so the continuation of the selloff needs a question mark.
My view is that this isn’t the beginning of a trend-driven selloff led by shorts. It looks more like a concentrated profit-taking and position-reduction move on the spot side or from long positions in the contracts. Because if shorts truly rushed in aggressively, they wouldn’t be able to accept the zero-funding cost—they would push funding down. The current data doesn’t support the idea that shorts have strong intentions to go heavily short. So, based on a single-signal read: the rapid selloff in the short term may be close to the end, but an immediate reversal still requires fresh evidence of new buying.
But on the other hand, the strongest counter-evidence is this: if the funding rate quickly turns negative—for example, below -0.01%—then it would mean shorts have started moving in to buy the dip and bet on further downside, and my judgment would be wrong. At the same time, watch OI: if the price stabilizes and OI increases significantly, it may indicate longs taking orders on the left side; if the price stabilizes but OI declines, it suggests funding is being withdrawn and the rebound lacks momentum.
The second-order effect is that if the price consolidates here while funding stays at zero, contract longs don’t have to pay interest, but they still face unrealized losses on their positions. That psychological pressure could trigger a new round of forced liquidations. If spot selling pressure continues, it could weigh on the coin price; however, the calm in the contract market limits the depth of panic-driven selloffs, which may keep the market trapped in a frustrating grind lower.
When would my view become invalid?
Trading tag: #BinanceFutures #TradFi #USDⓈM #RAM #RAMUSDT $RAM
The price has dropped sharply; under normal logic, short-side pressure should strengthen and push the funding rate into negative territory—meaning shorts pay longs. But now the rate hasn’t moved at all and stays at zero, which indicates that the costs between longs and shorts in the contract market are perfectly balanced, with no side needing to pay extra for holding positions. This points to a possible scenario: the selling pressure behind this drop is likely not mainly from shorts actively driving the market down in the futures/perps, but more likely from spot holders or longs on the contract side actively closing positions.
Open interest (OI) remains at 37774.47, but without historical comparisons, it’s impossible to say whether this level is high or low. Looking at just this one signal, the decline lacks “fuel” from shorts in the contract market, so the continuation of the selloff needs a question mark.
My view is that this isn’t the beginning of a trend-driven selloff led by shorts. It looks more like a concentrated profit-taking and position-reduction move on the spot side or from long positions in the contracts. Because if shorts truly rushed in aggressively, they wouldn’t be able to accept the zero-funding cost—they would push funding down. The current data doesn’t support the idea that shorts have strong intentions to go heavily short. So, based on a single-signal read: the rapid selloff in the short term may be close to the end, but an immediate reversal still requires fresh evidence of new buying.
But on the other hand, the strongest counter-evidence is this: if the funding rate quickly turns negative—for example, below -0.01%—then it would mean shorts have started moving in to buy the dip and bet on further downside, and my judgment would be wrong. At the same time, watch OI: if the price stabilizes and OI increases significantly, it may indicate longs taking orders on the left side; if the price stabilizes but OI declines, it suggests funding is being withdrawn and the rebound lacks momentum.
The second-order effect is that if the price consolidates here while funding stays at zero, contract longs don’t have to pay interest, but they still face unrealized losses on their positions. That psychological pressure could trigger a new round of forced liquidations. If spot selling pressure continues, it could weigh on the coin price; however, the calm in the contract market limits the depth of panic-driven selloffs, which may keep the market trapped in a frustrating grind lower.
When would my view become invalid?
Trading tag: #BinanceFutures #TradFi #USDⓈM #RAM #RAMUSDT $RAM
5

·
--
RAM 4-hour window: dark clouds over the top + key levels—say it all at once
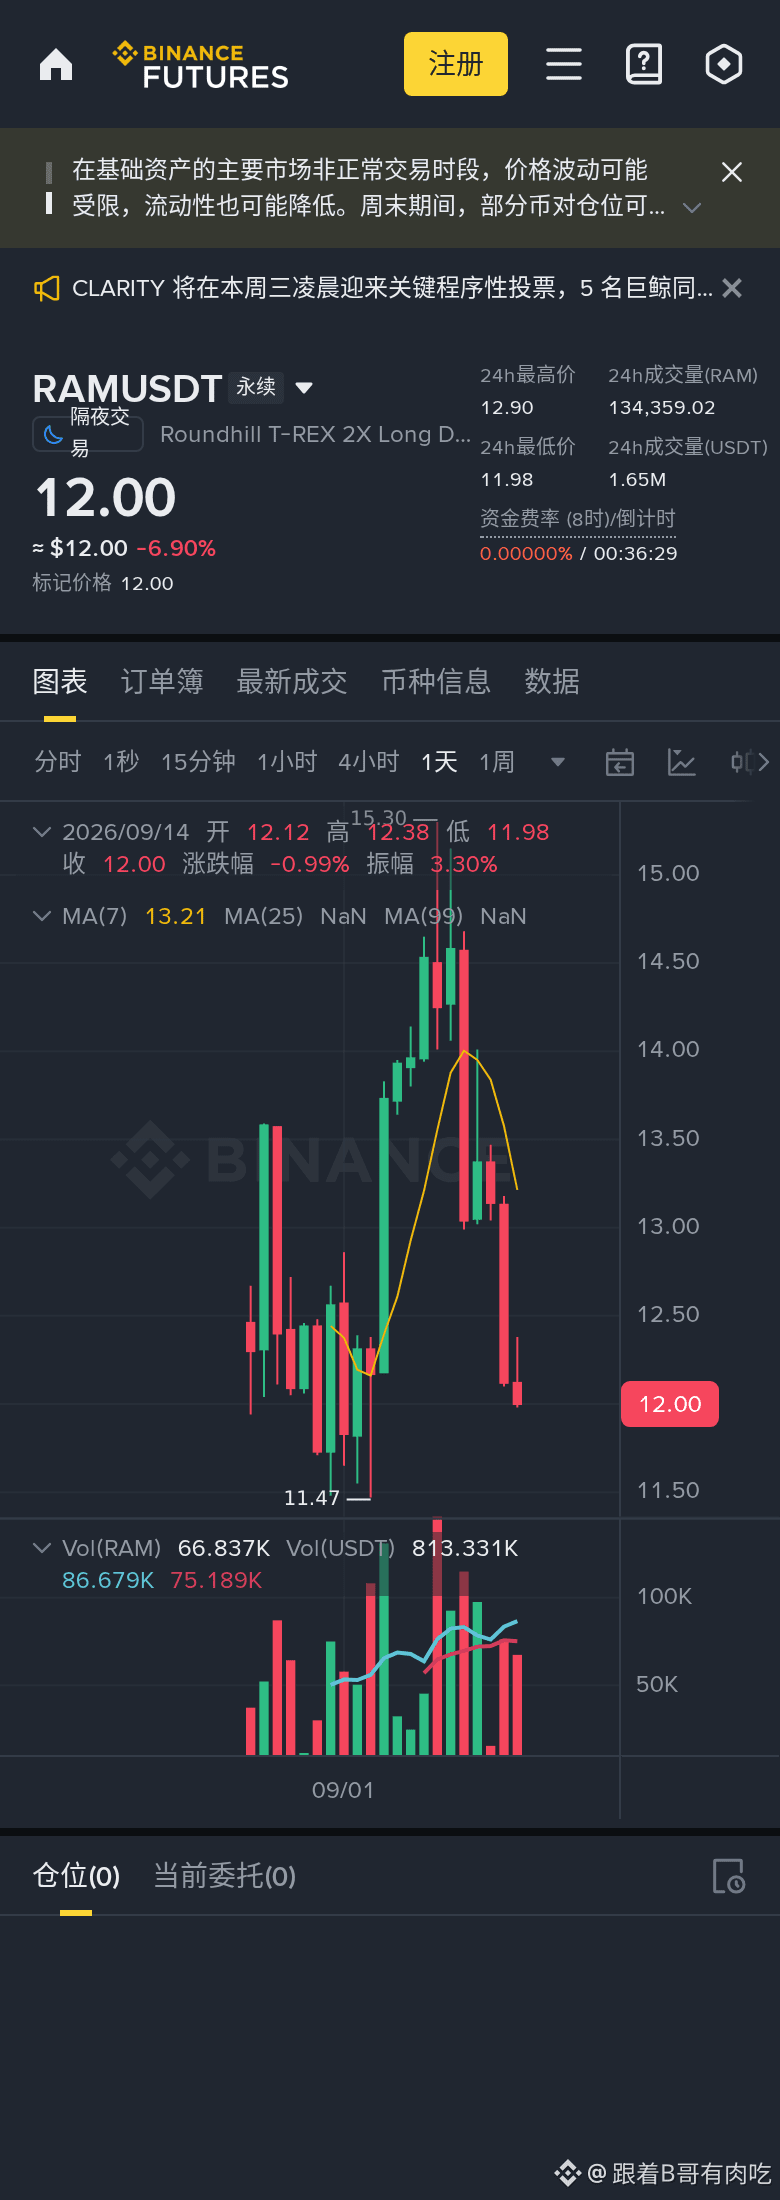
After watching RAM for hours, a 4-hour level signal has finally appeared. “Dark clouds over the top” forming at a high level is a strong warning of resistance against any rebound. On the 4-hour chart, it’s at 12.00 (-6.69%); RSI is 14.5. Moving averages are bearish (and the data is insufficient), and the candlestick pattern is “dark clouds over the top.”
Key levels on the 4-hour chart: support 11.98 / resistance 15.30.
Trigger conditions, written clearly: go long if it breaks and holds above 15.30; go short if it breaks below 11.98. Don’t make any moves in between—let it choose its direction on its own.
Right now, it’s not advisable to take action. The 4-hour direction isn’t clear yet—wait for a breakout.
Bottom line: if you’re wrong, cut the loss—don’t stubbornly “hold and it’ll come back.” That’s how people start losing big money. Markets change fast, but keep the same mindset. Good luck.
⚠️ Pure technical sharing, not investment advice. Take full responsibility for your own gains and losses. Crypto markets are highly volatile—make independent judgments and control risk.
#RAM #币安广场 #low-position setup
RAM 4-hour window: dark clouds over the top + key levels—say it all at once
After watching RAM for hours, a 4-hour level signal has finally appeared. “Dark clouds over the top” forming at a high level is a strong warning of resistance against any rebound. On the 4-hour chart, it’s at 12.00 (-6.69%); RSI is 14.5. Moving averages are bearish (and the data is insufficient), and the candlestick pattern is “dark clouds over the top.”
Key levels on the 4-hour chart: support 11.98 / resistance 15.30.
Trigger conditions, written clearly: go long if it breaks and holds above 15.30; go short if it breaks below 11.98. Don’t make any moves in between—let it choose its direction on its own.
Right now, it’s not advisable to take action. The 4-hour direction isn’t clear yet—wait for a breakout.
Bottom line: if you’re wrong, cut the loss—don’t stubbornly “hold and it’ll come back.” That’s how people start losing big money. Markets change fast, but keep the same mindset. Good luck.
⚠️ Pure technical sharing, not investment advice. Take full responsibility for your own gains and losses. Crypto markets are highly volatile—make independent judgments and control risk.
#RAM #币安广场 #low-position setup
After watching RAM for hours, a 4-hour level signal has finally appeared. “Dark clouds over the top” forming at a high level is a strong warning of resistance against any rebound. On the 4-hour chart, it’s at 12.00 (-6.69%); RSI is 14.5. Moving averages are bearish (and the data is insufficient), and the candlestick pattern is “dark clouds over the top.”
Key levels on the 4-hour chart: support 11.98 / resistance 15.30.
Trigger conditions, written clearly: go long if it breaks and holds above 15.30; go short if it breaks below 11.98. Don’t make any moves in between—let it choose its direction on its own.
Right now, it’s not advisable to take action. The 4-hour direction isn’t clear yet—wait for a breakout.
Bottom line: if you’re wrong, cut the loss—don’t stubbornly “hold and it’ll come back.” That’s how people start losing big money. Markets change fast, but keep the same mindset. Good luck.
⚠️ Pure technical sharing, not investment advice. Take full responsibility for your own gains and losses. Crypto markets are highly volatile—make independent judgments and control risk.
#RAM #币安广场 #low-position setup
32
·
--
The old dog scanned and found that this $RAM 24-hour line is pierced a bit deep; a -7.219% drop paired with a funding rate of -0.00114409 is a combination worth a closer look. The price is $12.21, daily trading volume is over $1.25 million, and open interest is 36,901.57—everything here is ready-made data.
From an angle that falls on the M4 mover, this looks more like a short-term liquidity anomaly. A negative funding rate means shorts are continuously paying longs, which is usually interpreted as bearish sentiment being dominant and positions being crowded. But the price is falling, creating a setup where the price is down while the funding rate is negative. This kind of divergence on short timeframes often suggests shorts have built up too many contrarian positions, making them prone to liquidation on a small rebound or changes in liquidity—what people commonly call a short squeeze. Right now, I haven’t seen comparative data from other coins in the same sector, so I can’t tell whether it’s a broad sector selloff or whether $RAM alone is under pressure.
My view is that the current negative funding rate may be building power for a potential rebound as shorts liquidate/close—but the prerequisite is that the price needs to stabilize. If the price keeps grinding lower, the funding rate could remain negative as well. So the key thing to watch is whether the divergence between price and funding can be corrected.
Trading tag: #BinanceFutures #TradFi #USDⓈM #RAM #RAMUSDT $RAM
The old dog scanned and found that this $RAM 24-hour line is pierced a bit deep; a -7.219% drop paired with a funding rate of -0.00114409 is a combination worth a closer look. The price is $12.21, daily trading volume is over $1.25 million, and open interest is 36,901.57—everything here is ready-made data.
From an angle that falls on the M4 mover, this looks more like a short-term liquidity anomaly. A negative funding rate means shorts are continuously paying longs, which is usually interpreted as bearish sentiment being dominant and positions being crowded. But the price is falling, creating a setup where the price is down while the funding rate is negative. This kind of divergence on short timeframes often suggests shorts have built up too many contrarian positions, making them prone to liquidation on a small rebound or changes in liquidity—what people commonly call a short squeeze. Right now, I haven’t seen comparative data from other coins in the same sector, so I can’t tell whether it’s a broad sector selloff or whether $RAM alone is under pressure.
My view is that the current negative funding rate may be building power for a potential rebound as shorts liquidate/close—but the prerequisite is that the price needs to stabilize. If the price keeps grinding lower, the funding rate could remain negative as well. So the key thing to watch is whether the divergence between price and funding can be corrected.
Trading tag: #BinanceFutures #TradFi #USDⓈM #RAM #RAMUSDT $RAM
From an angle that falls on the M4 mover, this looks more like a short-term liquidity anomaly. A negative funding rate means shorts are continuously paying longs, which is usually interpreted as bearish sentiment being dominant and positions being crowded. But the price is falling, creating a setup where the price is down while the funding rate is negative. This kind of divergence on short timeframes often suggests shorts have built up too many contrarian positions, making them prone to liquidation on a small rebound or changes in liquidity—what people commonly call a short squeeze. Right now, I haven’t seen comparative data from other coins in the same sector, so I can’t tell whether it’s a broad sector selloff or whether $RAM alone is under pressure.
My view is that the current negative funding rate may be building power for a potential rebound as shorts liquidate/close—but the prerequisite is that the price needs to stabilize. If the price keeps grinding lower, the funding rate could remain negative as well. So the key thing to watch is whether the divergence between price and funding can be corrected.
Trading tag: #BinanceFutures #TradFi #USDⓈM #RAM #RAMUSDT $RAM
40
·
--
An old dog scanned the order book: in the past 24 hours, $RAM fell 5.416%, with the price at $12.4. One interesting number is that its funding rate is stuck at an absolute zero. No up, no down—neither long nor short pays the other, which is rather unusual in a period with plenty of volatility.
This isn’t a complicated setup. Even as the price is dropping, the funding costs for going long and going short are the same. That suggests the market isn’t applying pressure uniformly to one side. Usually, a zero funding rate paired with price declines looks more like the natural erosion of positions than an all-out assault by shorts. The on-chain asset here is a long-position contract; the price dip hasn’t triggered a flip of the funding rate into the negative. Short power hasn’t really risen. Looking at funding rate alone, this signal isn’t a traditional short-term “bottoming” indicator—it’s more like longs are slowly retreating, while shorts haven’t managed to profit off the move, leaving both sides temporarily stuck in a stalemate.
Trading volume is over $770,000. Compared with the price action and open interest, it’s not especially active, but it’s not dead either. Open interest is still over 30,700 contracts. The capital trapped in those positions has to figure out its own way out.
My take is simple: $RAM is going through a deleveraging-style grind lower adjustment, not a coordinated short-squeeze-style attack. A zero funding rate means long positions aren’t getting extra unrealized gains or cost pressure. When price slides, that patience is what gets tested. The market hasn’t provided a clear rebound signal, and longs also lack a reason to add to positions. At this point, the most reasonable action is: if you don’t have a position, don’t touch it; if you do have one, set a stop-loss. For example, if the price can’t get back above $12.4 and OI doesn’t increase along with it, the adjustment likely isn’t finished. I would choose to wait on the sidelines until the funding rate shows a clear tilt or the price stabilizes at key levels.
The strongest counter-argument is: what if this isn’t an adjustment, but deep base building? It’s possible. But a zero funding rate paired with price weakness lacks the usual “bottom” signs—there’s no short covering in a meaningful way, and there’s no squeeze signal from the funding rate turning positive. The second-order effect is that longs who got stuck at high prices become a source of sell pressure later. Every time they cut losses at a lower price, they add another unit of downward momentum. And since shorts don’t have consistent funding income, they’re also less inclined to build large positions.
Where is my judgment most likely to be wrong? By assuming a zero funding rate simply means balance. What if this is just dead calm before the storm—some sudden news causes the funding rate to swing violently and triggers a one-sided move? Then the foundation of the current analysis changes completely.
Trading tag: #BinanceFutures #TradFi #USDⓈM #RAM #RAMUSDT $RAM
An old dog scanned the order book: in the past 24 hours, $RAM fell 5.416%, with the price at $12.4. One interesting number is that its funding rate is stuck at an absolute zero. No up, no down—neither long nor short pays the other, which is rather unusual in a period with plenty of volatility.
This isn’t a complicated setup. Even as the price is dropping, the funding costs for going long and going short are the same. That suggests the market isn’t applying pressure uniformly to one side. Usually, a zero funding rate paired with price declines looks more like the natural erosion of positions than an all-out assault by shorts. The on-chain asset here is a long-position contract; the price dip hasn’t triggered a flip of the funding rate into the negative. Short power hasn’t really risen. Looking at funding rate alone, this signal isn’t a traditional short-term “bottoming” indicator—it’s more like longs are slowly retreating, while shorts haven’t managed to profit off the move, leaving both sides temporarily stuck in a stalemate.
Trading volume is over $770,000. Compared with the price action and open interest, it’s not especially active, but it’s not dead either. Open interest is still over 30,700 contracts. The capital trapped in those positions has to figure out its own way out.
My take is simple: $RAM is going through a deleveraging-style grind lower adjustment, not a coordinated short-squeeze-style attack. A zero funding rate means long positions aren’t getting extra unrealized gains or cost pressure. When price slides, that patience is what gets tested. The market hasn’t provided a clear rebound signal, and longs also lack a reason to add to positions. At this point, the most reasonable action is: if you don’t have a position, don’t touch it; if you do have one, set a stop-loss. For example, if the price can’t get back above $12.4 and OI doesn’t increase along with it, the adjustment likely isn’t finished. I would choose to wait on the sidelines until the funding rate shows a clear tilt or the price stabilizes at key levels.
The strongest counter-argument is: what if this isn’t an adjustment, but deep base building? It’s possible. But a zero funding rate paired with price weakness lacks the usual “bottom” signs—there’s no short covering in a meaningful way, and there’s no squeeze signal from the funding rate turning positive. The second-order effect is that longs who got stuck at high prices become a source of sell pressure later. Every time they cut losses at a lower price, they add another unit of downward momentum. And since shorts don’t have consistent funding income, they’re also less inclined to build large positions.
Where is my judgment most likely to be wrong? By assuming a zero funding rate simply means balance. What if this is just dead calm before the storm—some sudden news causes the funding rate to swing violently and triggers a one-sided move? Then the foundation of the current analysis changes completely.
Trading tag: #BinanceFutures #TradFi #USDⓈM #RAM #RAMUSDT $RAM
This isn’t a complicated setup. Even as the price is dropping, the funding costs for going long and going short are the same. That suggests the market isn’t applying pressure uniformly to one side. Usually, a zero funding rate paired with price declines looks more like the natural erosion of positions than an all-out assault by shorts. The on-chain asset here is a long-position contract; the price dip hasn’t triggered a flip of the funding rate into the negative. Short power hasn’t really risen. Looking at funding rate alone, this signal isn’t a traditional short-term “bottoming” indicator—it’s more like longs are slowly retreating, while shorts haven’t managed to profit off the move, leaving both sides temporarily stuck in a stalemate.
Trading volume is over $770,000. Compared with the price action and open interest, it’s not especially active, but it’s not dead either. Open interest is still over 30,700 contracts. The capital trapped in those positions has to figure out its own way out.
My take is simple: $RAM is going through a deleveraging-style grind lower adjustment, not a coordinated short-squeeze-style attack. A zero funding rate means long positions aren’t getting extra unrealized gains or cost pressure. When price slides, that patience is what gets tested. The market hasn’t provided a clear rebound signal, and longs also lack a reason to add to positions. At this point, the most reasonable action is: if you don’t have a position, don’t touch it; if you do have one, set a stop-loss. For example, if the price can’t get back above $12.4 and OI doesn’t increase along with it, the adjustment likely isn’t finished. I would choose to wait on the sidelines until the funding rate shows a clear tilt or the price stabilizes at key levels.
The strongest counter-argument is: what if this isn’t an adjustment, but deep base building? It’s possible. But a zero funding rate paired with price weakness lacks the usual “bottom” signs—there’s no short covering in a meaningful way, and there’s no squeeze signal from the funding rate turning positive. The second-order effect is that longs who got stuck at high prices become a source of sell pressure later. Every time they cut losses at a lower price, they add another unit of downward momentum. And since shorts don’t have consistent funding income, they’re also less inclined to build large positions.
Where is my judgment most likely to be wrong? By assuming a zero funding rate simply means balance. What if this is just dead calm before the storm—some sudden news causes the funding rate to swing violently and triggers a one-sided move? Then the foundation of the current analysis changes completely.
Trading tag: #BinanceFutures #TradFi #USDⓈM #RAM #RAMUSDT $RAM
2
·
--
The old dog scanned the order book of $RAM —over the past 24 hours it’s down 7.91%. The current price is 12.34, but the funding rate is negative at -0.00212440. Prices are falling, yet the shorts are the ones paying. This combination is kind of interesting.
The angle is M4_mover unusual activity—dig a bit deeper. The price decline comes with a negative funding rate. By the iron law in the direction of the funding rate, this is a typical structure of crowded shorts. Shorts are willing to pay longs to maintain their positions, which suggests they have a strong bearish conviction. But on the flip side, once there’s any hint of a rebound, these paid-for shorts can easily get squeezed out.
Open interest (OI) is currently 30884.08, down somewhat from the recent highs over the past few days, which indicates that some long positions have already cut losses and exited. The market is digesting this sell-off.
The old dog’s view is that right now the downtrend is dominated by the bears’ momentum, but the negative funding rate plants the seeds for a short squeeze. My actions are very clear: I won’t touch it now. I’m waiting for two signals—either (1) price rebounds quickly along with the funding rate turning positive, which would mean the shorts are conceding and the market could pivot; or (2) price continues to bleed lower and the funding rate stays deeply negative, which would mean the shorts haven’t been squeezed out yet, and the timing for a rebound isn’t right. If I go long now, it would just be betting on a rebound, but market sentiment hasn’t shown a clear turning point yet.
Trading tag: #BinanceFutures #TradFi #USDⓈM #RAM #RAMUSDT $RAM
The old dog scanned the order book of $RAM —over the past 24 hours it’s down 7.91%. The current price is 12.34, but the funding rate is negative at -0.00212440. Prices are falling, yet the shorts are the ones paying. This combination is kind of interesting.
The angle is M4_mover unusual activity—dig a bit deeper. The price decline comes with a negative funding rate. By the iron law in the direction of the funding rate, this is a typical structure of crowded shorts. Shorts are willing to pay longs to maintain their positions, which suggests they have a strong bearish conviction. But on the flip side, once there’s any hint of a rebound, these paid-for shorts can easily get squeezed out.
Open interest (OI) is currently 30884.08, down somewhat from the recent highs over the past few days, which indicates that some long positions have already cut losses and exited. The market is digesting this sell-off.
The old dog’s view is that right now the downtrend is dominated by the bears’ momentum, but the negative funding rate plants the seeds for a short squeeze. My actions are very clear: I won’t touch it now. I’m waiting for two signals—either (1) price rebounds quickly along with the funding rate turning positive, which would mean the shorts are conceding and the market could pivot; or (2) price continues to bleed lower and the funding rate stays deeply negative, which would mean the shorts haven’t been squeezed out yet, and the timing for a rebound isn’t right. If I go long now, it would just be betting on a rebound, but market sentiment hasn’t shown a clear turning point yet.
Trading tag: #BinanceFutures #TradFi #USDⓈM #RAM #RAMUSDT $RAM
The angle is M4_mover unusual activity—dig a bit deeper. The price decline comes with a negative funding rate. By the iron law in the direction of the funding rate, this is a typical structure of crowded shorts. Shorts are willing to pay longs to maintain their positions, which suggests they have a strong bearish conviction. But on the flip side, once there’s any hint of a rebound, these paid-for shorts can easily get squeezed out.
Open interest (OI) is currently 30884.08, down somewhat from the recent highs over the past few days, which indicates that some long positions have already cut losses and exited. The market is digesting this sell-off.
The old dog’s view is that right now the downtrend is dominated by the bears’ momentum, but the negative funding rate plants the seeds for a short squeeze. My actions are very clear: I won’t touch it now. I’m waiting for two signals—either (1) price rebounds quickly along with the funding rate turning positive, which would mean the shorts are conceding and the market could pivot; or (2) price continues to bleed lower and the funding rate stays deeply negative, which would mean the shorts haven’t been squeezed out yet, and the timing for a rebound isn’t right. If I go long now, it would just be betting on a rebound, but market sentiment hasn’t shown a clear turning point yet.
Trading tag: #BinanceFutures #TradFi #USDⓈM #RAM #RAMUSDT $RAM
39
·
--
$RAM 24 hours down 7.91%, price hits 12.34, and the funding rate is negative. Shorts are paying longs.
This kind of drop with a negative funding rate is a typical bearish consensus crowding setup. Funding rate -0.00236503 suggests shorts are crowded—they’re paying interest to short. But the price has already fallen nearly 8%, so these shorts may be excessively crowded; the fuse for a rebound is being built up.
If the “Trump trade” is bullish for traditional U.S. stocks, money may flow from on-chain derivatives back to the underlying stocks, which would be bloodletting for on-chain U.S.-stock-style contracts like RAM. Conversely, if traditional U.S. stocks pull back, on-chain contracts—due to their leverage—could fall even harder. In this structure, the risk of chasing shorts is high. With a negative funding rate plus a big sell-off, a short-term rebound could squeeze shorts at any moment.
The strongest counter-evidence: if Trump posts a bullish note for the crypto market and capital flows back, RAM could jump straight up. But if there’s no new narrative, with this funding structure alone, upside for a rebound may be limited. Bulls may only be collecting some interest without truly daring to enter in size.
I’ll observe. If the price rebounds back near 12.5 (close to the opening price), and momentum is exhausted, I can test a short with a small position, setting a stop-loss at 12.7. If it breaks directly below the 12 integer level, the chart could accelerate. For now, I’m not chasing shorts—waiting for a rebound or a breakdown signal.
Trading tag: #TradFi #链上美股 #RAM
Where do you think this judgment is most likely to be wrong?
$RAM 24 hours down 7.91%, price hits 12.34, and the funding rate is negative. Shorts are paying longs.
This kind of drop with a negative funding rate is a typical bearish consensus crowding setup. Funding rate -0.00236503 suggests shorts are crowded—they’re paying interest to short. But the price has already fallen nearly 8%, so these shorts may be excessively crowded; the fuse for a rebound is being built up.
If the “Trump trade” is bullish for traditional U.S. stocks, money may flow from on-chain derivatives back to the underlying stocks, which would be bloodletting for on-chain U.S.-stock-style contracts like RAM. Conversely, if traditional U.S. stocks pull back, on-chain contracts—due to their leverage—could fall even harder. In this structure, the risk of chasing shorts is high. With a negative funding rate plus a big sell-off, a short-term rebound could squeeze shorts at any moment.
The strongest counter-evidence: if Trump posts a bullish note for the crypto market and capital flows back, RAM could jump straight up. But if there’s no new narrative, with this funding structure alone, upside for a rebound may be limited. Bulls may only be collecting some interest without truly daring to enter in size.
I’ll observe. If the price rebounds back near 12.5 (close to the opening price), and momentum is exhausted, I can test a short with a small position, setting a stop-loss at 12.7. If it breaks directly below the 12 integer level, the chart could accelerate. For now, I’m not chasing shorts—waiting for a rebound or a breakdown signal.
Trading tag: #TradFi #链上美股 #RAM
Where do you think this judgment is most likely to be wrong?
This kind of drop with a negative funding rate is a typical bearish consensus crowding setup. Funding rate -0.00236503 suggests shorts are crowded—they’re paying interest to short. But the price has already fallen nearly 8%, so these shorts may be excessively crowded; the fuse for a rebound is being built up.
If the “Trump trade” is bullish for traditional U.S. stocks, money may flow from on-chain derivatives back to the underlying stocks, which would be bloodletting for on-chain U.S.-stock-style contracts like RAM. Conversely, if traditional U.S. stocks pull back, on-chain contracts—due to their leverage—could fall even harder. In this structure, the risk of chasing shorts is high. With a negative funding rate plus a big sell-off, a short-term rebound could squeeze shorts at any moment.
The strongest counter-evidence: if Trump posts a bullish note for the crypto market and capital flows back, RAM could jump straight up. But if there’s no new narrative, with this funding structure alone, upside for a rebound may be limited. Bulls may only be collecting some interest without truly daring to enter in size.
I’ll observe. If the price rebounds back near 12.5 (close to the opening price), and momentum is exhausted, I can test a short with a small position, setting a stop-loss at 12.7. If it breaks directly below the 12 integer level, the chart could accelerate. For now, I’m not chasing shorts—waiting for a rebound or a breakdown signal.
Trading tag: #TradFi #链上美股 #RAM
Where do you think this judgment is most likely to be wrong?
45
·
--
The old dog glanced at the past 24 hours of $RAM — the funding rate came in at 0.00000000. That’s even more striking than the price dropping 3.577%. At the 12.94 level, the interest paid between longs and shorts is completely zeroed out.
A price moving in one direction while the cost of the long-vs-short battle is set to zero can only happen in two situations: either the platform’s order book depth is new and insufficient, or large capital has temporarily stepped away, leaving so few orders on the book that the funding-rate calculation loses its meaning. Judging by its position size of 30491.60 and a trading volume of over $240,000 in 24 hours, liquidity really isn’t that strong. This suggests the current price movement probably isn’t driven by a flood of new longs or new shorts entering the market; it’s more likely that the book is thin—just a small number of buy/sell orders can cause big swings. With a 3.577% drop, the “make-believe” component may well be greater than the real one.
So my take is: this is not a signal of a trend-like selloff. It looks more like price drifting in a low-liquidity environment. This is not the time to chase shorts or panic. The old dog’s own actions are light-portfolio observation—no new position taken proactively. If the price can next increase volume and hold above 13.00, and the funding rate turns clearly positive, I’ll consider lightly trying longs, because that would mean new capital has entered the market to take the long side and is willing to pay the cost. Conversely, if the price breaks below 12.50 on volume, I’ll immediately close the current position, because that could mean support has failed—liquidity panic can then reinforce itself.
Where is this view most likely to be wrong? If later there’s an official news injection strong narrative that I don’t see here, or if the entire on-chain U.S.-stock sector sees a collective surge of capital inflows, then my liquidity-based judgment that the volatility is “fake” will no longer hold. Once such a one-sided, high-volume market shows up, my current wait-and-see strategy will need to change immediately.
Trading tag: #BinanceFutures #TradFi #USDⓈM #RAM #RAMUSDT $RAM
The old dog glanced at the past 24 hours of $RAM — the funding rate came in at 0.00000000. That’s even more striking than the price dropping 3.577%. At the 12.94 level, the interest paid between longs and shorts is completely zeroed out.
A price moving in one direction while the cost of the long-vs-short battle is set to zero can only happen in two situations: either the platform’s order book depth is new and insufficient, or large capital has temporarily stepped away, leaving so few orders on the book that the funding-rate calculation loses its meaning. Judging by its position size of 30491.60 and a trading volume of over $240,000 in 24 hours, liquidity really isn’t that strong. This suggests the current price movement probably isn’t driven by a flood of new longs or new shorts entering the market; it’s more likely that the book is thin—just a small number of buy/sell orders can cause big swings. With a 3.577% drop, the “make-believe” component may well be greater than the real one.
So my take is: this is not a signal of a trend-like selloff. It looks more like price drifting in a low-liquidity environment. This is not the time to chase shorts or panic. The old dog’s own actions are light-portfolio observation—no new position taken proactively. If the price can next increase volume and hold above 13.00, and the funding rate turns clearly positive, I’ll consider lightly trying longs, because that would mean new capital has entered the market to take the long side and is willing to pay the cost. Conversely, if the price breaks below 12.50 on volume, I’ll immediately close the current position, because that could mean support has failed—liquidity panic can then reinforce itself.
Where is this view most likely to be wrong? If later there’s an official news injection strong narrative that I don’t see here, or if the entire on-chain U.S.-stock sector sees a collective surge of capital inflows, then my liquidity-based judgment that the volatility is “fake” will no longer hold. Once such a one-sided, high-volume market shows up, my current wait-and-see strategy will need to change immediately.
Trading tag: #BinanceFutures #TradFi #USDⓈM #RAM #RAMUSDT $RAM
A price moving in one direction while the cost of the long-vs-short battle is set to zero can only happen in two situations: either the platform’s order book depth is new and insufficient, or large capital has temporarily stepped away, leaving so few orders on the book that the funding-rate calculation loses its meaning. Judging by its position size of 30491.60 and a trading volume of over $240,000 in 24 hours, liquidity really isn’t that strong. This suggests the current price movement probably isn’t driven by a flood of new longs or new shorts entering the market; it’s more likely that the book is thin—just a small number of buy/sell orders can cause big swings. With a 3.577% drop, the “make-believe” component may well be greater than the real one.
So my take is: this is not a signal of a trend-like selloff. It looks more like price drifting in a low-liquidity environment. This is not the time to chase shorts or panic. The old dog’s own actions are light-portfolio observation—no new position taken proactively. If the price can next increase volume and hold above 13.00, and the funding rate turns clearly positive, I’ll consider lightly trying longs, because that would mean new capital has entered the market to take the long side and is willing to pay the cost. Conversely, if the price breaks below 12.50 on volume, I’ll immediately close the current position, because that could mean support has failed—liquidity panic can then reinforce itself.
Where is this view most likely to be wrong? If later there’s an official news injection strong narrative that I don’t see here, or if the entire on-chain U.S.-stock sector sees a collective surge of capital inflows, then my liquidity-based judgment that the volatility is “fake” will no longer hold. Once such a one-sided, high-volume market shows up, my current wait-and-see strategy will need to change immediately.
Trading tag: #BinanceFutures #TradFi #USDⓈM #RAM #RAMUSDT $RAM
20
·
--
The old dog glanced at $RAM: over the past 24 hours it’s down 1.719%. Current price is 13.15. The funding rate has hit -0.00051849—shorts are paying longs. Trading volume is 195,800 units, open interest is 29,600 units. That’s all the data there is—no other news. My read is that $RAM may face tug-of-war from short covering in the near term, but the downtrend isn’t over yet. Keep a close eye on funding changes.
Why do I say that? When funding is negative at this level, by the iron law, shorts pay longs—meaning the short positions are crowded. The price is down 1.719%, and shorts are making money on paper, but they still have to keep paying funding, and that cost accumulates. If the price bounces even slightly, shorts may be forced to close to staunch the bleeding, triggering a short squeeze. But if the price keeps sliding downward, shorts can “carry” the position and continue to eat profits from funding, while longs may stop-loss due to floating losses, accelerating the selloff. Open interest at 29,600 hasn’t changed, suggesting positions aren’t exiting in large numbers—they’re just holding on. Volume at 195,800 isn’t low; turnover is active, but the price isn’t rising, so the selling pressure is still there. Just looking at funding alone is a sharp signal: the selloff supported by a negative funding rate favors shorts, but the capital cost is rising too—so it’s easy to see a short-term rebound.
My take is simple: don’t touch it now. When price is falling and funding is negative, and shorts are crowded, that combination feels like it’s brewing a short-term rebound. If $RAM rebounds above 13.30, and funding remains negative, then I might consider going long with a small position, betting on a wave of short covering. If it breaks below 13.00 and funding is still negative, then don’t chase the short—because the risk of a short squeeze would be even higher. Where I diverge from the consensus is this: the market may think the down move is smooth and just go short, but the old dog believes that in an environment where shorts are paying, the price accelerating lower is more likely to trigger shorts to trample in panic. On positioning, I’d rather wait—let funding turn positive or wait until price holds above 13.15.
Where is this call most likely to be wrong? If the trading volume for $RAM suddenly surges and the price keeps getting crushed, while funding stays negative—meaning shorts are strong enough to keep pressing down despite the cost—then my take would fail.
Trading tags: #BinanceFutures #TradFi #USDⓈM #RAM #RAMUSDT $RAM
The old dog glanced at $RAM : over the past 24 hours it’s down 1.719%. Current price is 13.15. The funding rate has hit -0.00051849—shorts are paying longs. Trading volume is 195,800 units, open interest is 29,600 units. That’s all the data there is—no other news. My read is that $RAM may face tug-of-war from short covering in the near term, but the downtrend isn’t over yet. Keep a close eye on funding changes.
Why do I say that? When funding is negative at this level, by the iron law, shorts pay longs—meaning the short positions are crowded. The price is down 1.719%, and shorts are making money on paper, but they still have to keep paying funding, and that cost accumulates. If the price bounces even slightly, shorts may be forced to close to staunch the bleeding, triggering a short squeeze. But if the price keeps sliding downward, shorts can “carry” the position and continue to eat profits from funding, while longs may stop-loss due to floating losses, accelerating the selloff. Open interest at 29,600 hasn’t changed, suggesting positions aren’t exiting in large numbers—they’re just holding on. Volume at 195,800 isn’t low; turnover is active, but the price isn’t rising, so the selling pressure is still there. Just looking at funding alone is a sharp signal: the selloff supported by a negative funding rate favors shorts, but the capital cost is rising too—so it’s easy to see a short-term rebound.
My take is simple: don’t touch it now. When price is falling and funding is negative, and shorts are crowded, that combination feels like it’s brewing a short-term rebound. If $RAM rebounds above 13.30, and funding remains negative, then I might consider going long with a small position, betting on a wave of short covering. If it breaks below 13.00 and funding is still negative, then don’t chase the short—because the risk of a short squeeze would be even higher. Where I diverge from the consensus is this: the market may think the down move is smooth and just go short, but the old dog believes that in an environment where shorts are paying, the price accelerating lower is more likely to trigger shorts to trample in panic. On positioning, I’d rather wait—let funding turn positive or wait until price holds above 13.15.
Where is this call most likely to be wrong? If the trading volume for $RAM suddenly surges and the price keeps getting crushed, while funding stays negative—meaning shorts are strong enough to keep pressing down despite the cost—then my take would fail.
Trading tags: #BinanceFutures #TradFi #USDⓈM #RAM #RAMUSDT $RAM
Why do I say that? When funding is negative at this level, by the iron law, shorts pay longs—meaning the short positions are crowded. The price is down 1.719%, and shorts are making money on paper, but they still have to keep paying funding, and that cost accumulates. If the price bounces even slightly, shorts may be forced to close to staunch the bleeding, triggering a short squeeze. But if the price keeps sliding downward, shorts can “carry” the position and continue to eat profits from funding, while longs may stop-loss due to floating losses, accelerating the selloff. Open interest at 29,600 hasn’t changed, suggesting positions aren’t exiting in large numbers—they’re just holding on. Volume at 195,800 isn’t low; turnover is active, but the price isn’t rising, so the selling pressure is still there. Just looking at funding alone is a sharp signal: the selloff supported by a negative funding rate favors shorts, but the capital cost is rising too—so it’s easy to see a short-term rebound.
My take is simple: don’t touch it now. When price is falling and funding is negative, and shorts are crowded, that combination feels like it’s brewing a short-term rebound. If $RAM rebounds above 13.30, and funding remains negative, then I might consider going long with a small position, betting on a wave of short covering. If it breaks below 13.00 and funding is still negative, then don’t chase the short—because the risk of a short squeeze would be even higher. Where I diverge from the consensus is this: the market may think the down move is smooth and just go short, but the old dog believes that in an environment where shorts are paying, the price accelerating lower is more likely to trigger shorts to trample in panic. On positioning, I’d rather wait—let funding turn positive or wait until price holds above 13.15.
Where is this call most likely to be wrong? If the trading volume for $RAM suddenly surges and the price keeps getting crushed, while funding stays negative—meaning shorts are strong enough to keep pressing down despite the cost—then my take would fail.
Trading tags: #BinanceFutures #TradFi #USDⓈM #RAM #RAMUSDT $RAM
17
·
--
$RAM fell 1.399% over the past 24 hours to close at 13.39, with a volume of 135407. This pullback isn’t big, but the funding rate is 0—meaning neither longs nor shorts have to pay the other side—suggesting that the forces are temporarily balanced. The open interest is 28066.43; I didn’t see a prior value for comparison, so I can only comment on the number in front of me.
Old dog took a quick look: a zero funding rate means the market doesn’t show a clear one-sided push, but the price is drifting lower. The selling pressure is more likely coming from proactive selling on the spot side rather than a contract-side liquidation chain reaction. As a U.S.-stock-style contract on BNB Chain, $RAM’s price action is currently decoupled from the broader Crypto market’s linkage signals. Since your input doesn’t include data for assets like BTC or Coinbase, I can’t force a resonance theory. Looking purely at the contract structure, neither side is crowded. So when the price drops—who’s holding it up? More likely, spot holders are taking losses and exiting, while the contract positioning hasn’t moved much.
My view is that in the short term the price still needs to grind, possibly dipping a bit further, because I haven’t seen signs of buying pressure stepping in. In terms of action: if the price breaks below 13.0, I’ll close my observation position. Breaking that level could trigger a chain of stop-loss orders. On the upside, I need to first see the price reclaim 13.5 and the funding rate turn negative; only then would it indicate shorts are starting to gain strength—maybe creating an opportunity for a rebound. At this point in time, I choose to observe with light exposure—no chasing, no holding the bag.
The most likely thing that could make this call wrong is if sudden external capital rapidly pulls the price back above 13.5 while open interest increases noticeably. That would suggest the longs have quietly entered, and I’d immediately flip long. The invalidation conditions are very specific: if there’s a valid breakout above 13.5 and OI rises, I’ll撤销 my bearish view. Otherwise, I’ll keep watching.
Trading tag: #BinanceFutures #TradFi #USDⓈM #RAM #RAMUSDT $RAM
$RAM fell 1.399% over the past 24 hours to close at 13.39, with a volume of 135407. This pullback isn’t big, but the funding rate is 0—meaning neither longs nor shorts have to pay the other side—suggesting that the forces are temporarily balanced. The open interest is 28066.43; I didn’t see a prior value for comparison, so I can only comment on the number in front of me.
Old dog took a quick look: a zero funding rate means the market doesn’t show a clear one-sided push, but the price is drifting lower. The selling pressure is more likely coming from proactive selling on the spot side rather than a contract-side liquidation chain reaction. As a U.S.-stock-style contract on BNB Chain, $RAM ’s price action is currently decoupled from the broader Crypto market’s linkage signals. Since your input doesn’t include data for assets like BTC or Coinbase, I can’t force a resonance theory. Looking purely at the contract structure, neither side is crowded. So when the price drops—who’s holding it up? More likely, spot holders are taking losses and exiting, while the contract positioning hasn’t moved much.
My view is that in the short term the price still needs to grind, possibly dipping a bit further, because I haven’t seen signs of buying pressure stepping in. In terms of action: if the price breaks below 13.0, I’ll close my observation position. Breaking that level could trigger a chain of stop-loss orders. On the upside, I need to first see the price reclaim 13.5 and the funding rate turn negative; only then would it indicate shorts are starting to gain strength—maybe creating an opportunity for a rebound. At this point in time, I choose to observe with light exposure—no chasing, no holding the bag.
The most likely thing that could make this call wrong is if sudden external capital rapidly pulls the price back above 13.5 while open interest increases noticeably. That would suggest the longs have quietly entered, and I’d immediately flip long. The invalidation conditions are very specific: if there’s a valid breakout above 13.5 and OI rises, I’ll撤销 my bearish view. Otherwise, I’ll keep watching.
Trading tag: #BinanceFutures #TradFi #USDⓈM #RAM #RAMUSDT $RAM
Old dog took a quick look: a zero funding rate means the market doesn’t show a clear one-sided push, but the price is drifting lower. The selling pressure is more likely coming from proactive selling on the spot side rather than a contract-side liquidation chain reaction. As a U.S.-stock-style contract on BNB Chain, $RAM ’s price action is currently decoupled from the broader Crypto market’s linkage signals. Since your input doesn’t include data for assets like BTC or Coinbase, I can’t force a resonance theory. Looking purely at the contract structure, neither side is crowded. So when the price drops—who’s holding it up? More likely, spot holders are taking losses and exiting, while the contract positioning hasn’t moved much.
My view is that in the short term the price still needs to grind, possibly dipping a bit further, because I haven’t seen signs of buying pressure stepping in. In terms of action: if the price breaks below 13.0, I’ll close my observation position. Breaking that level could trigger a chain of stop-loss orders. On the upside, I need to first see the price reclaim 13.5 and the funding rate turn negative; only then would it indicate shorts are starting to gain strength—maybe creating an opportunity for a rebound. At this point in time, I choose to observe with light exposure—no chasing, no holding the bag.
The most likely thing that could make this call wrong is if sudden external capital rapidly pulls the price back above 13.5 while open interest increases noticeably. That would suggest the longs have quietly entered, and I’d immediately flip long. The invalidation conditions are very specific: if there’s a valid breakout above 13.5 and OI rises, I’ll撤销 my bearish view. Otherwise, I’ll keep watching.
Trading tag: #BinanceFutures #TradFi #USDⓈM #RAM #RAMUSDT $RAM
11

·
--
Bullish
RAM shorts just got squeezed near $13.46087.
The $4.3108K liquidation gives the upside move some weight.
$RAM
{future}(RAMUSDT)
🟢 LIQUIDITY ZONE HIT 🟢
Short liquidation spotted 🧨
$4.3108K cleared at $13.46087
Upside liquidity swept — watch reaction 👀
🎯 TP Targets:
TP1: ~$13.59548
TP2: ~$13.73009
TP3: ~$13.86470
#RAM
RAM shorts just got squeezed near $13.46087.
The $4.3108K liquidation gives the upside move some weight.
$RAM
🟢 LIQUIDITY ZONE HIT 🟢
Short liquidation spotted 🧨
$4.3108K cleared at $13.46087
Upside liquidity swept — watch reaction 👀
🎯 TP Targets:
TP1: ~$13.59548
TP2: ~$13.73009
TP3: ~$13.86470
#RAM
The $4.3108K liquidation gives the upside move some weight.
$RAM
🟢 LIQUIDITY ZONE HIT 🟢
Short liquidation spotted 🧨
$4.3108K cleared at $13.46087
Upside liquidity swept — watch reaction 👀
🎯 TP Targets:
TP1: ~$13.59548
TP2: ~$13.73009
TP3: ~$13.86470
#RAM
80
·
--
In the past 24 hours, $RAM has fallen 6.846%, with the price stalling at 13.47 and volume surging to over 1.56 million. The funding rate is still hovering at 0.00070697—positive. Longs are continuously paying shorts, so the overcrowding on the long side hasn’t really eased.
Digging deeper from the M4_mover perspective, the core of the disruption lies in a mismatch between funding and positioning. While the price is dropping, funding remains positive—this suggests that longs are holding on hard under a negative-fee environment, and may even be adding to positions to average down. Shorts are pushing the price down, but without triggering enough squeeze. OI is 23878.55 (in contract quantity, not USD), so you can’t directly judge price direction versus OI without conversion; however, considering the price decline, positive funding, and rising volume, there are clear signs of longs being trapped and adding anyway. With no cross-coin reference, looking only at $RAM, this pullback looks more like a natural correction after excessive long overcrowding, rather than a narrative-driven independent move.
The funding-rule is applied directly here: when funding is greater than 0, longs pay shorts. The more crowded the longs are, the easier it is—on a rebound—for liquidity-driven squeezing to hurt them.
Old dog’s view is that $RAM’s near-term upside potential is capped by crowded long positions. The trigger is simple: if the price breaks below 13.00, I’ll cut down to a light position to observe. If it suddenly breaks above 14.50 on a big volume spike, I’ll consider adding cautiously. A contrarian take: the market may frame this as a normal pullback and call for buying the dip, but I disagree. The long-overcrowded structure hasn’t changed; a rebound could instead attract even more liquidation sell orders.
As for positioning: I won’t touch it now. I’ll wait until the funding rate turns negative or OI clearly declines before acting.
Invalidation conditions: if funding turns negative quickly next, meaning shorts start paying longs, then market sentiment has flipped and my view is wrong; or if price stays above 13.5 and OI keeps shrinking, that would indicate longs are exiting in an orderly way and risk is reduced. None of these signals has appeared yet, so I’m staying defensive.
Trading tag: #BinanceFutures #TradFi #USDⓈM #RAM #RAMUSDT $RAM
In the past 24 hours, $RAM has fallen 6.846%, with the price stalling at 13.47 and volume surging to over 1.56 million. The funding rate is still hovering at 0.00070697—positive. Longs are continuously paying shorts, so the overcrowding on the long side hasn’t really eased.
Digging deeper from the M4_mover perspective, the core of the disruption lies in a mismatch between funding and positioning. While the price is dropping, funding remains positive—this suggests that longs are holding on hard under a negative-fee environment, and may even be adding to positions to average down. Shorts are pushing the price down, but without triggering enough squeeze. OI is 23878.55 (in contract quantity, not USD), so you can’t directly judge price direction versus OI without conversion; however, considering the price decline, positive funding, and rising volume, there are clear signs of longs being trapped and adding anyway. With no cross-coin reference, looking only at $RAM , this pullback looks more like a natural correction after excessive long overcrowding, rather than a narrative-driven independent move.
The funding-rule is applied directly here: when funding is greater than 0, longs pay shorts. The more crowded the longs are, the easier it is—on a rebound—for liquidity-driven squeezing to hurt them.
Old dog’s view is that $RAM ’s near-term upside potential is capped by crowded long positions. The trigger is simple: if the price breaks below 13.00, I’ll cut down to a light position to observe. If it suddenly breaks above 14.50 on a big volume spike, I’ll consider adding cautiously. A contrarian take: the market may frame this as a normal pullback and call for buying the dip, but I disagree. The long-overcrowded structure hasn’t changed; a rebound could instead attract even more liquidation sell orders.
As for positioning: I won’t touch it now. I’ll wait until the funding rate turns negative or OI clearly declines before acting.
Invalidation conditions: if funding turns negative quickly next, meaning shorts start paying longs, then market sentiment has flipped and my view is wrong; or if price stays above 13.5 and OI keeps shrinking, that would indicate longs are exiting in an orderly way and risk is reduced. None of these signals has appeared yet, so I’m staying defensive.
Trading tag: #BinanceFutures #TradFi #USDⓈM #RAM #RAMUSDT $RAM
Digging deeper from the M4_mover perspective, the core of the disruption lies in a mismatch between funding and positioning. While the price is dropping, funding remains positive—this suggests that longs are holding on hard under a negative-fee environment, and may even be adding to positions to average down. Shorts are pushing the price down, but without triggering enough squeeze. OI is 23878.55 (in contract quantity, not USD), so you can’t directly judge price direction versus OI without conversion; however, considering the price decline, positive funding, and rising volume, there are clear signs of longs being trapped and adding anyway. With no cross-coin reference, looking only at $RAM , this pullback looks more like a natural correction after excessive long overcrowding, rather than a narrative-driven independent move.
The funding-rule is applied directly here: when funding is greater than 0, longs pay shorts. The more crowded the longs are, the easier it is—on a rebound—for liquidity-driven squeezing to hurt them.
Old dog’s view is that $RAM ’s near-term upside potential is capped by crowded long positions. The trigger is simple: if the price breaks below 13.00, I’ll cut down to a light position to observe. If it suddenly breaks above 14.50 on a big volume spike, I’ll consider adding cautiously. A contrarian take: the market may frame this as a normal pullback and call for buying the dip, but I disagree. The long-overcrowded structure hasn’t changed; a rebound could instead attract even more liquidation sell orders.
As for positioning: I won’t touch it now. I’ll wait until the funding rate turns negative or OI clearly declines before acting.
Invalidation conditions: if funding turns negative quickly next, meaning shorts start paying longs, then market sentiment has flipped and my view is wrong; or if price stays above 13.5 and OI keeps shrinking, that would indicate longs are exiting in an orderly way and risk is reduced. None of these signals has appeared yet, so I’m staying defensive.
Trading tag: #BinanceFutures #TradFi #USDⓈM #RAM #RAMUSDT $RAM
10

·
--
📈 Naise Strategy Sharing
━━━━━━━━━━━━━━━━
💰 Coin: RAMUSDT
🟢 Direction: Long
📊 Signal: Buy
⭐ Confidence: 70%
📈 Trend: Uptrend
━━━━━━━━━━━━━━━━
💎 Current Price: 13.13
🔴 Resistance Levels: [15.3, 15.354132]
🟢 Support Levels: [13.276868, 11.47]
━━━━━━━━━━━━━━━━
📝 Analysis: Drop of -9.8% + RSI oversold + near the lower Bollinger Band, rebound probability is high
━━━━━━━━━━━━━━━━
📅 2026.09.11 06:26 | For reference only, not investment advice
#RAM #加密货币 #合约交易 #奈斯哥 #quantitative trading
📈 Naise Strategy Sharing
━━━━━━━━━━━━━━━━
💰 Coin: RAMUSDT
🟢 Direction: Long
📊 Signal: Buy
⭐ Confidence: 70%
📈 Trend: Uptrend
━━━━━━━━━━━━━━━━
💎 Current Price: 13.13
🔴 Resistance Levels: [15.3, 15.354132]
🟢 Support Levels: [13.276868, 11.47]
━━━━━━━━━━━━━━━━
📝 Analysis: Drop of -9.8% + RSI oversold + near the lower Bollinger Band, rebound probability is high
━━━━━━━━━━━━━━━━
📅 2026.09.11 06:26 | For reference only, not investment advice
#RAM #加密货币 #合约交易 #奈斯哥 #quantitative trading
━━━━━━━━━━━━━━━━
💰 Coin: RAMUSDT
🟢 Direction: Long
📊 Signal: Buy
⭐ Confidence: 70%
📈 Trend: Uptrend
━━━━━━━━━━━━━━━━
💎 Current Price: 13.13
🔴 Resistance Levels: [15.3, 15.354132]
🟢 Support Levels: [13.276868, 11.47]
━━━━━━━━━━━━━━━━
📝 Analysis: Drop of -9.8% + RSI oversold + near the lower Bollinger Band, rebound probability is high
━━━━━━━━━━━━━━━━
📅 2026.09.11 06:26 | For reference only, not investment advice
#RAM #加密货币 #合约交易 #奈斯哥 #quantitative trading
9
·
--
The old dog glanced at $RAM; in the past 24 hours it’s down nearly 10%, with the spot price at 13.15. In the on-chain US stock sector, this kind of drop is quite eye-catching—but its funding rate is 0, so neither side is really being offended. That suggests this selloff isn’t because the shorts are aggressively dumping; it’s more like longs are proactively taking profits, or some big players are reducing their positions. Open interest is still 25,505 contracts—no sign of large-scale liquidation, and the positioning structure is holding steady for now.
Right now, this level is kind of awkward.
Trading tag: #BinanceFutures #TradFi #USDⓈM #RAM #RAMUSDT $RAM
The old dog glanced at $RAM ; in the past 24 hours it’s down nearly 10%, with the spot price at 13.15. In the on-chain US stock sector, this kind of drop is quite eye-catching—but its funding rate is 0, so neither side is really being offended. That suggests this selloff isn’t because the shorts are aggressively dumping; it’s more like longs are proactively taking profits, or some big players are reducing their positions. Open interest is still 25,505 contracts—no sign of large-scale liquidation, and the positioning structure is holding steady for now.
Right now, this level is kind of awkward.
Trading tag: #BinanceFutures #TradFi #USDⓈM #RAM #RAMUSDT $RAM
Right now, this level is kind of awkward.
Trading tag: #BinanceFutures #TradFi #USDⓈM #RAM #RAMUSDT $RAM
12
·
--
$RAM fell 10.88% over the past 24 hours; the current price is 13.35, but trading volume has surged to 1.64 million—more than five times the market value of positions held. This kind of volume-spiking drop is not a simple profit-taking event; it looks more like a rapid liquidation triggered by the fading of political narratives. With the funding rate at zero, neither side has paid—suggesting that the market’s directional expectations suddenly collapsed.
Why is it dropping like this? For politically driven tokens, their price elasticity is already amplified by geopolitical news and policy changes. Once a particular catalyst expectation fails—or when broader market risk appetite tightens—capital will be the first to pull out of these high-Beta assets. Such a large trading volume indicates that selling pressure has been quickly absorbed, but the buying force is clearly weaker; the “buyers-at-the-bench” didn’t hold up.
If this sell-off were purely a technical correction, you should see the funding rate turn negative, with shorts actively pressing down. Now it’s zero, which more closely resembles the bullish side withdrawing first after a consensus breaks. Conversely, if new policy positives are reported tomorrow morning, the price could rebound quickly because much of the selling pressure has already been released.
Next, we need to see whether the 13.35 level can hold. If it continues to break below, longs who entered at high levels may be forced to close positions, potentially triggering a new round of panic selling.
Trading tag: #TradFi #链上美股 #RAM
Where do you think this assessment is most likely to be wrong?
$RAM fell 10.88% over the past 24 hours; the current price is 13.35, but trading volume has surged to 1.64 million—more than five times the market value of positions held. This kind of volume-spiking drop is not a simple profit-taking event; it looks more like a rapid liquidation triggered by the fading of political narratives. With the funding rate at zero, neither side has paid—suggesting that the market’s directional expectations suddenly collapsed.
Why is it dropping like this? For politically driven tokens, their price elasticity is already amplified by geopolitical news and policy changes. Once a particular catalyst expectation fails—or when broader market risk appetite tightens—capital will be the first to pull out of these high-Beta assets. Such a large trading volume indicates that selling pressure has been quickly absorbed, but the buying force is clearly weaker; the “buyers-at-the-bench” didn’t hold up.
If this sell-off were purely a technical correction, you should see the funding rate turn negative, with shorts actively pressing down. Now it’s zero, which more closely resembles the bullish side withdrawing first after a consensus breaks. Conversely, if new policy positives are reported tomorrow morning, the price could rebound quickly because much of the selling pressure has already been released.
Next, we need to see whether the 13.35 level can hold. If it continues to break below, longs who entered at high levels may be forced to close positions, potentially triggering a new round of panic selling.
Trading tag: #TradFi #链上美股 #RAM
Where do you think this assessment is most likely to be wrong?
Why is it dropping like this? For politically driven tokens, their price elasticity is already amplified by geopolitical news and policy changes. Once a particular catalyst expectation fails—or when broader market risk appetite tightens—capital will be the first to pull out of these high-Beta assets. Such a large trading volume indicates that selling pressure has been quickly absorbed, but the buying force is clearly weaker; the “buyers-at-the-bench” didn’t hold up.
If this sell-off were purely a technical correction, you should see the funding rate turn negative, with shorts actively pressing down. Now it’s zero, which more closely resembles the bullish side withdrawing first after a consensus breaks. Conversely, if new policy positives are reported tomorrow morning, the price could rebound quickly because much of the selling pressure has already been released.
Next, we need to see whether the 13.35 level can hold. If it continues to break below, longs who entered at high levels may be forced to close positions, potentially triggering a new round of panic selling.
Trading tag: #TradFi #链上美股 #RAM
Where do you think this assessment is most likely to be wrong?
41
·
--
$RAM dropped 4.86% over the past 24 hours, while the funding rate during the same period was positive at 0.0062%. This setup is worth being wary of: when price is falling and the funding rate is positive, it means longs are still paying to maintain their positions—typically a pattern of long-side trapped longs adding more.
I looked into how it’s positioned as an on-chain U.S. stock semiconductor proxy. Under the narrative of M2_semi, there aren’t other secondary meme tokens to compare against, so $RAM’s price action more clearly reflects the independent sentiment of this sub-sector. A 0.0062% annualized funding rate isn’t high, but the key is the direction: in a downtrend, longs are paying. That suggests the dip-buying capital hasn’t left—possibly it’s even adding. This is different from a purely short-dominated selloff; instead, it pushes longs into a more fragile corner. Once the price drops another level, liquidation pressure from this portion of positions could be released in a concentrated wave.
So my conclusion is straightforward: this is a typical long liquidity trap—don’t rush to buy the dip. In terms of action, I’ll set an observation level around the current price of 14.49. If the price action remains weak and can’t reclaim that area, I’ll choose to reduce exposure or exit. The strongest counter-evidence would be if the semiconductor cycle shows a strong recovery signal—then funding could ignore technical difficulties and rush in. But in the inputs I don’t have any such macro evidence.
Trading tag: #BinanceFutures #TradFi #USDⓈM #RAM #RAMUSDT $RAM
$RAM dropped 4.86% over the past 24 hours, while the funding rate during the same period was positive at 0.0062%. This setup is worth being wary of: when price is falling and the funding rate is positive, it means longs are still paying to maintain their positions—typically a pattern of long-side trapped longs adding more.
I looked into how it’s positioned as an on-chain U.S. stock semiconductor proxy. Under the narrative of M2_semi, there aren’t other secondary meme tokens to compare against, so $RAM ’s price action more clearly reflects the independent sentiment of this sub-sector. A 0.0062% annualized funding rate isn’t high, but the key is the direction: in a downtrend, longs are paying. That suggests the dip-buying capital hasn’t left—possibly it’s even adding. This is different from a purely short-dominated selloff; instead, it pushes longs into a more fragile corner. Once the price drops another level, liquidation pressure from this portion of positions could be released in a concentrated wave.
So my conclusion is straightforward: this is a typical long liquidity trap—don’t rush to buy the dip. In terms of action, I’ll set an observation level around the current price of 14.49. If the price action remains weak and can’t reclaim that area, I’ll choose to reduce exposure or exit. The strongest counter-evidence would be if the semiconductor cycle shows a strong recovery signal—then funding could ignore technical difficulties and rush in. But in the inputs I don’t have any such macro evidence.
Trading tag: #BinanceFutures #TradFi #USDⓈM #RAM #RAMUSDT $RAM
I looked into how it’s positioned as an on-chain U.S. stock semiconductor proxy. Under the narrative of M2_semi, there aren’t other secondary meme tokens to compare against, so $RAM ’s price action more clearly reflects the independent sentiment of this sub-sector. A 0.0062% annualized funding rate isn’t high, but the key is the direction: in a downtrend, longs are paying. That suggests the dip-buying capital hasn’t left—possibly it’s even adding. This is different from a purely short-dominated selloff; instead, it pushes longs into a more fragile corner. Once the price drops another level, liquidation pressure from this portion of positions could be released in a concentrated wave.
So my conclusion is straightforward: this is a typical long liquidity trap—don’t rush to buy the dip. In terms of action, I’ll set an observation level around the current price of 14.49. If the price action remains weak and can’t reclaim that area, I’ll choose to reduce exposure or exit. The strongest counter-evidence would be if the semiconductor cycle shows a strong recovery signal—then funding could ignore technical difficulties and rush in. But in the inputs I don’t have any such macro evidence.
Trading tag: #BinanceFutures #TradFi #USDⓈM #RAM #RAMUSDT $RAM
20
·
--
$RAM That 7.67% bullish candle looks pretty lively. The price pushed up to 15.16, but when the old dog glanced at another set of numbers, my heart sank halfway: the funding rate is positive at 0.00155893, yet the open interest is only 25439. This combination is clearly suspicious at a glance.
By the iron rule of funding rates: if funding is positive, longs are paying shorts, which suggests that the long positions are more crowded than shorts, and theoretically OI should be pushed higher by corresponding incremental funds. But the data says otherwise—price is up nearly 8%, yet OI hasn’t moved. And the volume, at just a little over one hundred thousand, doesn’t really count as a breakout in volume. This points to a fact: this rally is most likely a local lift caused by shifting existing positions, not fresh long money from outside the market rushing in.
Behind the rise, there’s no new money propping up new positioning volume, so the foundation isn’t solid.
My view is that $RAM ’s current round of上涨 is a local pull-up under a contest of existing positions, not the start of a trend-driven main upswing. Longs are crowded, but they lack reinforcement—this structure is fragile. The strongest counter-evidence would be: if next OI can quickly climb, say breaking above 26,000, while volume expands to more than twice the daily average, then it would mean new capital recognizes this price level, and my judgment would be wrong. But what I’m seeing now is longs trading among themselves with positive funding, without forming a real collective force.
The second-order effects are already very clear: longs with high position costs will feel increasingly uncomfortable in a negative funding-rate environment. Once price stalls, this chunk of positions will become the most unstable selling pressure. Liquidity will shift toward assets where OI and volume can grow in sync. If $RAM keeps this “price up, positions flat” pattern, it’s easy for the market’s short-term funds to abandon it.
So the action is straightforward: I won’t add to my position, and I’m even considering trimming part of my short-term holdings if the price revisits the integer level of 15. If OI doesn’t show improvement over the next one or two trading days, I’ll maintain a light position and stay on the sidelines. The invalidation conditions for this thesis are also simple: either OI rises significantly and holds above 26,000, or funding turns negative while the price remains firm—then it would indicate shorts are hard-fighting the squeeze and the situation would reverse. Now? Let’s first see how the longs digest the cage they built for themselves.
Trading tag: #BinanceFutures #TradFi #USDⓈM #RAM #RAMUSDT $RAM
$RAM That 7.67% bullish candle looks pretty lively. The price pushed up to 15.16, but when the old dog glanced at another set of numbers, my heart sank halfway: the funding rate is positive at 0.00155893, yet the open interest is only 25439. This combination is clearly suspicious at a glance.
By the iron rule of funding rates: if funding is positive, longs are paying shorts, which suggests that the long positions are more crowded than shorts, and theoretically OI should be pushed higher by corresponding incremental funds. But the data says otherwise—price is up nearly 8%, yet OI hasn’t moved. And the volume, at just a little over one hundred thousand, doesn’t really count as a breakout in volume. This points to a fact: this rally is most likely a local lift caused by shifting existing positions, not fresh long money from outside the market rushing in.
Behind the rise, there’s no new money propping up new positioning volume, so the foundation isn’t solid.
My view is that $RAM ’s current round of上涨 is a local pull-up under a contest of existing positions, not the start of a trend-driven main upswing. Longs are crowded, but they lack reinforcement—this structure is fragile. The strongest counter-evidence would be: if next OI can quickly climb, say breaking above 26,000, while volume expands to more than twice the daily average, then it would mean new capital recognizes this price level, and my judgment would be wrong. But what I’m seeing now is longs trading among themselves with positive funding, without forming a real collective force.
The second-order effects are already very clear: longs with high position costs will feel increasingly uncomfortable in a negative funding-rate environment. Once price stalls, this chunk of positions will become the most unstable selling pressure. Liquidity will shift toward assets where OI and volume can grow in sync. If $RAM keeps this “price up, positions flat” pattern, it’s easy for the market’s short-term funds to abandon it.
So the action is straightforward: I won’t add to my position, and I’m even considering trimming part of my short-term holdings if the price revisits the integer level of 15. If OI doesn’t show improvement over the next one or two trading days, I’ll maintain a light position and stay on the sidelines. The invalidation conditions for this thesis are also simple: either OI rises significantly and holds above 26,000, or funding turns negative while the price remains firm—then it would indicate shorts are hard-fighting the squeeze and the situation would reverse. Now? Let’s first see how the longs digest the cage they built for themselves.
Trading tag: #BinanceFutures #TradFi #USDⓈM #RAM #RAMUSDT $RAM
By the iron rule of funding rates: if funding is positive, longs are paying shorts, which suggests that the long positions are more crowded than shorts, and theoretically OI should be pushed higher by corresponding incremental funds. But the data says otherwise—price is up nearly 8%, yet OI hasn’t moved. And the volume, at just a little over one hundred thousand, doesn’t really count as a breakout in volume. This points to a fact: this rally is most likely a local lift caused by shifting existing positions, not fresh long money from outside the market rushing in.
Behind the rise, there’s no new money propping up new positioning volume, so the foundation isn’t solid.
My view is that $RAM ’s current round of上涨 is a local pull-up under a contest of existing positions, not the start of a trend-driven main upswing. Longs are crowded, but they lack reinforcement—this structure is fragile. The strongest counter-evidence would be: if next OI can quickly climb, say breaking above 26,000, while volume expands to more than twice the daily average, then it would mean new capital recognizes this price level, and my judgment would be wrong. But what I’m seeing now is longs trading among themselves with positive funding, without forming a real collective force.
The second-order effects are already very clear: longs with high position costs will feel increasingly uncomfortable in a negative funding-rate environment. Once price stalls, this chunk of positions will become the most unstable selling pressure. Liquidity will shift toward assets where OI and volume can grow in sync. If $RAM keeps this “price up, positions flat” pattern, it’s easy for the market’s short-term funds to abandon it.
So the action is straightforward: I won’t add to my position, and I’m even considering trimming part of my short-term holdings if the price revisits the integer level of 15. If OI doesn’t show improvement over the next one or two trading days, I’ll maintain a light position and stay on the sidelines. The invalidation conditions for this thesis are also simple: either OI rises significantly and holds above 26,000, or funding turns negative while the price remains firm—then it would indicate shorts are hard-fighting the squeeze and the situation would reverse. Now? Let’s first see how the longs digest the cage they built for themselves.
Trading tag: #BinanceFutures #TradFi #USDⓈM #RAM #RAMUSDT $RAM
11
Log in to explore more content
Join global crypto users on Binance Square
⚡️ Get latest and useful information about crypto.
💬 Trusted by the world’s largest crypto exchange.
👍 Discover real insights from verified creators.
Email / Phone number
Trending Topics
1
#CardanoAddedToX402KitForADAPayments
992 views
112 Discussing
2
#XRPRises8%
8,643 views
451 Discussing
3
#AMDHits$1TrillionMarketCap
149 views
23 Discussing
4
#BitcoinSpotETFs$999MNetInflow
478 views
35 Discussing
5
#AppleGoogleSeekStablecoinTokenizedDepositTalent
5,695 views
346 Discussing
6
#NvidiaToBuyAnother$1.5BSBEnergySharesPreIPO
1,189 views
31 Discussing
7
#AgoraGetsPreliminaryOCCApprovalForTrustBank
3,500 views
170 Discussing
8
#NEARRisesNearly80%InAWeek
71,472 views
1,311 Discussing
9
#MultiversXPlansHardForkRecovery
56,245 views
993 Discussing
10
#CircleLaunchesInstitutionalBTCBackedBorrowing
49,438 views
977 Discussing