Binance Square
#binancefutures

binancefutures

19.3M views
94,725 Discussing
Spider_BNB
·
--
Boooooooommmmmmm👀👀👀👀🔥🔥🔥🔥💥💥💥💥💥💥💥💥💥💥💥💥💥💥💥💥💥 ## 🔍 TradFi Meets Crypto Futures! New Assets Hitting the Board! 📈 ### 🆕 Newly Added Futures Pairs: * **$TENCENT USDT (Perp):** Tech giant Tencent is hitting the perpetual markets. 📱 * **$HK1810 1810USDT (Perp):** Xiaomi Corporation ticker pair, bringing massive consumer tech exposure. 🔌 * **HK0700US0T (Perp):** Additional tracking for heavy-hitting Hong Kong equities. 🏛️ * **$SPCX USD1 (Perp):** Bringing highly anticipated private aerospace and technology tracking directly to your trading dashboard! 🚀 Having access to fractional, high-leverage perpetuals for massive global tech and asset conglomerates changes the game for portfolio diversification. Keep a very close eye on these as liquidity begins to flow and the first major volatility trends print! #TradFi #BinanceFutures #SPIDER_BNB
Boooooooommmmmmm👀👀👀👀🔥🔥🔥🔥💥💥💥💥💥💥💥💥💥💥💥💥💥💥💥💥💥

## 🔍 TradFi Meets Crypto Futures! New Assets Hitting the Board! 📈

### 🆕 Newly Added Futures Pairs:
* **$TENCENT USDT (Perp):** Tech giant Tencent is hitting the perpetual markets. 📱

* **$HK1810 1810USDT (Perp):** Xiaomi Corporation ticker pair, bringing massive consumer tech exposure. 🔌

* **HK0700US0T (Perp):** Additional tracking for heavy-hitting Hong Kong equities. 🏛️

* **$SPCX USD1 (Perp):** Bringing highly anticipated private aerospace and technology tracking directly to your trading dashboard! 🚀

Having access to fractional, high-leverage perpetuals for massive global tech and asset conglomerates changes the game for portfolio diversification. Keep a very close eye on these as liquidity begins to flow and the first major volatility trends print!

#TradFi #BinanceFutures #SPIDER_BNB
🚨 Binance Futures | $SPCX USDT Market Update SPCXUSDT is trading around 125.45 USDT on the 15m timeframe after a sharp sell-off from 128.45 USDT. Key support is at 124.89, while immediate resistance is near 126.30–128.45 USDT. A confirmed breakout above 126.30 with strong buying volume could trigger a recovery toward 128.45 USDT. If 124.89 breaks, bearish momentum may continue. Wait for confirmation, use a stop-loss, and always manage your risk. #SPCXUSDT #BinanceFutures #CryptoTrading #TechnicalAnalysis #DYOR
🚨 Binance Futures | $SPCX USDT Market Update

SPCXUSDT is trading around 125.45 USDT on the 15m timeframe after a sharp sell-off from 128.45 USDT. Key support is at 124.89, while immediate resistance is near 126.30–128.45 USDT. A confirmed breakout above 126.30 with strong buying volume could trigger a recovery toward 128.45 USDT. If 124.89 breaks, bearish momentum may continue. Wait for confirmation, use a stop-loss, and always manage your risk.

#SPCXUSDT #BinanceFutures #CryptoTrading #TechnicalAnalysis #DYOR
🚨 Binance Futures | $OPENAI USDT Market Update OPENAIUSDT is trading around 1,166.45 USDT on the 15m timeframe after a sharp decline from 1,206.00 USDT. Key support is at 1,158.55, while immediate resistance is near 1,177–1,206 USDT. A confirmed breakout above 1,177 with strong volume could trigger a recovery toward 1,190–1,206 USDT. If 1,158.55 breaks, further downside pressure may follow. Wait for confirmation, use a stop-loss, and manage risk carefully. #OPENAIUSDT #BinanceFutures #CryptoTrading #TechnicalAnalysis #DYOR
🚨 Binance Futures | $OPENAI USDT Market Update

OPENAIUSDT is trading around 1,166.45 USDT on the 15m timeframe after a sharp decline from 1,206.00 USDT. Key support is at 1,158.55, while immediate resistance is near 1,177–1,206 USDT. A confirmed breakout above 1,177 with strong volume could trigger a recovery toward 1,190–1,206 USDT. If 1,158.55 breaks, further downside pressure may follow. Wait for confirmation, use a stop-loss, and manage risk carefully.

#OPENAIUSDT #BinanceFutures #CryptoTrading #TechnicalAnalysis #DYOR
🚨 Binance Futures | $BTW USDT (Bitway) Market Update BTWUSDT is trading around 0.06871 USDT on the 15m timeframe after a strong rally and minor pullback. Key support is at 0.06770–0.06800, while immediate resistance is near 0.06960, followed by 0.07300. A breakout above 0.06960 with strong volume could lead to a move toward 0.07300. If 0.06770 breaks, short-term selling pressure may increase. Use a stop-loss and wait for confirmation before entering. {alpha}(560x444045b0ee1ee319a660a5e3d604ca0ffa35acaa) #BTWUSDT #BinanceFutures #CryptoTrading #TechnicalAnalysis
🚨 Binance Futures | $BTW USDT (Bitway) Market Update
BTWUSDT is trading around 0.06871 USDT on the 15m timeframe after a strong rally and minor pullback. Key support is at 0.06770–0.06800, while immediate resistance is near 0.06960, followed by 0.07300. A breakout above 0.06960 with strong volume could lead to a move toward 0.07300. If 0.06770 breaks, short-term selling pressure may increase. Use a stop-loss and wait for confirmation before entering.

#BTWUSDT #BinanceFutures #CryptoTrading #TechnicalAnalysis
Article
Futures TradFi Is Not Stock Ownership: A Deep Beginner’s Guide to Trading Traditional MarketsTraditional assets and cryptocurrency markets are increasingly appearing on the same trading platforms. Binance Futures TradFi is one example of this development, allowing eligible users to trade perpetual futures linked to traditional-market assets such as precious metals, commodities, major ETFs, and individual company shares. At first glance, the idea may appear simple: find a familiar asset, predict whether its price will rise or fall, and open a position. However, the most important beginner lesson is that recognizing the underlying asset does not mean the product itself is simple. A trader may understand what gold, Apple, NVIDIA, the S&P 500, or crude oil represents while still not understanding perpetual contracts, mark price, funding payments, margin, leverage, or liquidation. Futures TradFi therefore requires two different types of knowledge: knowledge of the traditional asset and knowledge of the futures contract being used to trade it. What is Binance Futures TradFi? Binance Futures TradFi consists of perpetual futures contracts that track the prices of selected traditional financial assets. The available categories can include commodities, precious metals, ETF-linked market exposure, and individual equities. Examples Binance has discussed include gold, silver, crude oil, SPY, QQQ, Apple, Microsoft, and NVIDIA. These products are derivatives. When someone trades a stock-linked TradFi perpetual contract, they are not purchasing a share in the company. They do not become a shareholder, receive voting rights, or directly own the underlying security. Similarly, trading XAUUSDT does not mean the user owns physical gold. The user is trading a USDT-settled contract designed to follow gold’s price movement. This distinction matters because a derivative can behave differently from direct ownership. A shareholder may decide to hold a stock for several years without facing liquidation simply because its price declined. A leveraged futures trader, however, may have the position liquidated if the market moves far enough against it and the available margin becomes insufficient. What does “perpetual” mean? Traditional futures contracts commonly have expiration dates. A perpetual futures contract does not have a fixed expiry date. This means a trader does not have to close the position because a settlement date has arrived. The position may remain open as long as the trader maintains sufficient margin and follows the contract requirements. However, “no expiry” does not mean “no ongoing cost.” Perpetual futures commonly use funding payments to help keep the contract price connected to the price of the underlying market. Depending on the funding rate and the trader’s position, the trader may periodically pay funding or receive it. Funding can therefore affect the result of a position even when the underlying asset’s price has not moved significantly. A trade that appears slightly profitable based only on entry and exit prices may produce a smaller result after funding fees, trading fees, and slippage are included. How Futures TradFi positions work A trader generally chooses between two directions. A long position expresses the view that the contract’s price may rise. A short position expresses the view that the contract’s price may fall. Suppose a trader expects gold to strengthen because of economic uncertainty. The trader may open a long position on XAUUSDT. If the contract price rises after the position is opened, the long position may gain value. If the price falls, the position may lose value. Another trader may believe a particular stock is overvalued before an earnings announcement. That trader may open a short position on a related TradFi perpetual contract. If the price falls, the short position may gain value. If the company reports stronger-than-expected results and the price rises sharply, the short position may lose value. This ability to trade in either direction provides flexibility, but it also creates risk. Short positions can suffer rapid losses when prices rise unexpectedly, while long positions can be damaged by sudden declines. A realistic leverage example Consider a simplified educational example. A trader has 100 USDT available as margin and opens a 500 USDT gold-linked position using 5x leverage. The trader is controlling a position five times larger than the margin committed. If the contract rises by 2%, the gross gain on a 500 USDT position would be approximately 10 USDT. That 10 USDT represents approximately 10% of the trader’s original 100 USDT margin. But the same calculation works in the opposite direction. If the contract falls by 2%, the gross loss would also be approximately 10 USDT, before fees, funding, and slippage. The underlying market moved only 2%, but the effect on the trader’s committed margin was approximately 10%. This is what leverage does. It does not make the trader’s prediction more accurate. It increases the financial effect of the price movement on the trader’s capital. At 10x leverage, a 2% adverse movement on a similarly structured position could create a loss equal to approximately 20% of the committed margin, before additional costs. The exact liquidation price cannot be calculated from leverage alone. It also depends on factors such as the entry price, position size, maintenance margin, margin mode, available balance, fees, and other account conditions. The important lesson is that higher leverage leaves less room for the market to move against the position. Why 24/7 TradFi trading requires special attention One of the most distinctive features of Binance TradFi perpetuals is that the futures contracts can trade continuously even though the underlying traditional markets do not. Cryptocurrency markets generally operate continuously. Traditional equity and commodity markets have regular sessions, extended sessions, maintenance periods, weekends, and holidays. This creates an important challenge: how should a perpetual contract continue trading when the main underlying market is closed? Binance uses specific Price Index and Mark Price mechanisms for TradFi perpetuals. During normal trading periods, external data vendors contribute to the Price Index. During periods when normal external price formation is unavailable or liquidity is limited, different calculation modes may apply, including order-book-based and smoothed pricing mechanisms. The Mark Price is especially important because futures platforms generally use it for risk calculations and liquidation management rather than relying only on the most recent trade price.k This means beginners should understand that three prices may not always be identical: The price of the underlying traditional assetThe TradFi perpetual contract’s latest traded priceThe contract’s Mark Price During active traditional-market hours, these prices may remain relatively close. During weekends, holidays, overnight periods, or moments of limited liquidity, differences may become more noticeable. My main product observation After examining how Binance designed TradFi perpetuals, the most important product observation is that off-hours trading should not be treated as merely “extra time to trade.” It can represent a different pricing environment. When the traditional market is open, the underlying asset benefits from active price discovery across its main venues. When that market is closed, the perpetual contract may continue reacting to Binance order-book activity, market expectations, related instruments, and available pricing mechanisms. That does not automatically make off-hours trading unsuitable, but it means traders should be more careful about liquidity, spreads, volatility, and the difference between the perpetual price and the last widely recognized underlying-market price. The ability to trade a stock-linked contract on a weekend may appear convenient. The more important question is whether the trader understands how that contract is being priced while the primary stock market is closed. Binance itself warns that TradFi perpetuals can face high market risk and price volatility, particularly outside traditional market hours. A realistic off-hours scenario Imagine that a trader follows a technology company whose shares closed at $200 on Friday. During the weekend, major news appears that could affect the company. The company’s main stock exchange is closed, but a related TradFi perpetual contract continues trading. Buyers and sellers begin reacting to the news. The perpetual contract moves to a level equivalent to $208. This does not necessarily mean the actual stock will open at exactly $208 on Monday. When the traditional market reopens, new institutional orders, updated analyst views, liquidity, broader market conditions, and official price discovery may produce a different opening price. The perpetual contract could have anticipated the move correctly, overreacted to the news, or underestimated it. A trader entering during the weekend is therefore not simply trading the last official stock price. The trader is trading the market’s current expectation of where the asset may be valued when deeper traditional-market liquidity returns. This is a useful feature for expressing a market view, but it introduces basis, liquidity, and repricing risks that beginners may overlook. Price Index, Mark Price, and last price The last price is the price at which the most recent trade occurred. The Price Index is a calculated reference intended to represent the external value of the underlying asset using available pricing inputs. The Mark Price is a risk-management reference designed to reduce the effect of short-term manipulation or abnormal contract-price movements on unrealized profit, loss, and liquidation calculations. A trader may see the last price move sharply while the Mark Price moves less aggressively. Conversely, changes in the pricing mode or underlying reference can affect the Mark Price even when the trader is focused only on the visible candlestick chart. For this reason, checking only the entry price and latest traded price is not enough. Futures traders should also know which price is used to calculate their liquidation risk. Understanding funding Funding is another mechanism that beginners can underestimate When a perpetual contract trades at a premium or discount relative to its reference market, funding payments can help encourage the contract price to remain connected to the underlying asset. If the funding rate is positive, long-position holders generally pay short-position holders. If the rate is negative, short-position holders generally pay long-position holders. Funding rates can change. A trader who plans to hold a position for several days should therefore consider not only the expected price move but also the possible cost of maintaining the position. For example, a trader may correctly predict that an asset will rise slowly over a week. However, repeated funding payments, trading fees, and an imprecise entry may reduce the final result. Funding should not be treated as a small detail displayed near the order panel. It is part of the trade’s cost structure. Cross margin versus isolated margin Margin mode can significantly affect risk. Under isolated margin, a specific amount of margin is assigned to one position. The potential damage is more contained because the position does not automatically use the entire available futures balance in the same way a cross-margin position might. Under cross margin, available margin can be shared across positions. This may help a position remain open during temporary volatility, but it can also expose a larger portion of the account balance if the trade continues moving in the wrong direction. Neither mode removes risk. Isolated margin can still be fully lost if the position is liquidated. Cross margin can place more account capital at risk. Beginners should understand the selected margin mode before submitting an order rather than discovering its effect after the market moves. What moves TradFi perpetual prices? The answer depends on the underlying asset. Stock-linked contracts may react to:Company earningsRevenue and profit guidanceProduct announcementsManagement changesIndustry developmentsInterest-rate expectationsRegulatory decisionsBroader stock-market sentimentCommodity-linked contracts may react to:InflationCurrency movementsInterest ratesGeopolitical eventsSupply disruptionsProduction decisionsIndustrial demandWeather conditionsInventory reports ETF-linked contracts may respond to the combined movement of many companies and broader economic expectations. This means technical analysis alone may not provide enough context. A chart can show where price has moved, but traditional-market news often helps explain why it is moving. Common beginner mistakes The first mistake is confusing the contract with ownership. Trading an Apple-linked perpetual does not mean owning Apple shares. The second mistake is using high leverage because the underlying asset appears less volatile than cryptocurrency. A stock or commodity does not need to move 20% in one day to cause serious damage to a highly leveraged position. A relatively small adverse move can have a large effect on margin. The third mistake is ignoring funding and fees. Frequent entries and exits or long holding periods can create costs that reduce performance. The fourth mistake is trading major news without a plan. Earnings reports, inflation releases, employment data, and central-bank decisions can produce rapid price changes and slippage. The fifth mistake is assuming 24/7 access means equal liquidity throughout the entire week. Trading conditions can vary significantly between active underlying-market hours and off-hours. The sixth mistake is watching only the last price. Mark Price is essential for understanding unrealized profit, loss, and liquidation risk. Who may find Futures TradFi useful? The product may interest experienced futures users who want to express views on traditional assets while using a familiar USDT-settled trading environment. It may also be useful for traders who already follow commodities, equities, or major market ETFs and understand how economic events affect them. However, the product may be unsuitable for someone who: Does not understand leverageCannot explain liquidationHas no position-sizing methodUses money needed for essential expensesTrades primarily because of social-media excitementAssumes familiar assets are automatically safeIs unwilling to monitor funding and marginA beginner checklist before opening a positionBefore trading a TradFi perpetual contract, a user should be able to answer the following questions: What exactly does this contract track? Am I trading a derivative or purchasing the underlying asset? Is the underlying traditional market currently open? What is the contract’s Mark Price? What leverage have I selected? How much of my capital is actually at risk? Am I using isolated or cross margin? Where is my estimated liquidation price? When is the next funding payment? What news event could affect this asset? Where will I exit if the trade is wrong? Is the possible loss acceptable before I place the order? If these questions cannot be answered, the user may need more education before opening the position. Final perspective Binance Futures TradFi creates a bridge between traditional financial markets and crypto-style perpetual trading. Its v.lue is not simply that recognizable assets are available on a crypto platform. Its deeper value is that eligible traders can express long or short views on different global markets using USDT-settled perpetual contracts and continuous access. But the same features that make the product flexible also create its main risks. Leverage magnifies losses. Funding affects holding costs. Liquidation can close a position automatically. Traditional markets do not provide equal price discovery at every hour. A perpetual contract is not the same as the asset it tracks. The responsible approach is to treat Futures TradFi as a derivatives product first and a familiar-asset product second. Before trading, explore the TradFi section on Binance Futures, review the individual contract specifications, observe how the Mark Price behaves during different market sessions, and understand the full risk of the position before committing capital. This content is for educational purposes only and does not constitute financial advice or a recommendation to trade. Futures and leveraged products involve significant risk and can result in partial or total loss of capital. Product availability, contract specifications, leverage limits, pricing mechanisms, and eligibility may vary by region and can change. Always review the latest official Binance information, conduct independent research, and consider your experience and risk tolerance before trading. $AKE $BANK #BinanceFutures #TradFi #RiskEducation $ESPORTS

Futures TradFi Is Not Stock Ownership: A Deep Beginner’s Guide to Trading Traditional Markets

Traditional assets and cryptocurrency markets are increasingly appearing on the same trading platforms. Binance Futures TradFi is one example of this development, allowing eligible users to trade perpetual futures linked to traditional-market assets such as precious metals, commodities, major ETFs, and individual company shares.
At first glance, the idea may appear simple: find a familiar asset, predict whether its price will rise or fall, and open a position.
However, the most important beginner lesson is that recognizing the underlying asset does not mean the product itself is simple.
A trader may understand what gold, Apple, NVIDIA, the S&P 500, or crude oil represents while still not understanding perpetual contracts, mark price, funding payments, margin, leverage, or liquidation.
Futures TradFi therefore requires two different types of knowledge: knowledge of the traditional asset and knowledge of the futures contract being used to trade it.
What is Binance Futures TradFi?
Binance Futures TradFi consists of perpetual futures contracts that track the prices of selected traditional financial assets. The available categories can include commodities, precious metals, ETF-linked market exposure, and individual equities. Examples Binance has discussed include gold, silver, crude oil, SPY, QQQ, Apple, Microsoft, and NVIDIA.
These products are derivatives.
When someone trades a stock-linked TradFi perpetual contract, they are not purchasing a share in the company. They do not become a shareholder, receive voting rights, or directly own the underlying security.
Similarly, trading XAUUSDT does not mean the user owns physical gold. The user is trading a USDT-settled contract designed to follow gold’s price movement.
This distinction matters because a derivative can behave differently from direct ownership.
A shareholder may decide to hold a stock for several years without facing liquidation simply because its price declined. A leveraged futures trader, however, may have the position liquidated if the market moves far enough against it and the available margin becomes insufficient.
What does “perpetual” mean?
Traditional futures contracts commonly have expiration dates. A perpetual futures contract does not have a fixed expiry date.
This means a trader does not have to close the position because a settlement date has arrived. The position may remain open as long as the trader maintains sufficient margin and follows the contract requirements.
However, “no expiry” does not mean “no ongoing cost.”
Perpetual futures commonly use funding payments to help keep the contract price connected to the price of the underlying market. Depending on the funding rate and the trader’s position, the trader may periodically pay funding or receive it.
Funding can therefore affect the result of a position even when the underlying asset’s price has not moved significantly.
A trade that appears slightly profitable based only on entry and exit prices may produce a smaller result after funding fees, trading fees, and slippage are included.
How Futures TradFi positions work
A trader generally chooses between two directions.
A long position expresses the view that the contract’s price may rise.
A short position expresses the view that the contract’s price may fall.
Suppose a trader expects gold to strengthen because of economic uncertainty. The trader may open a long position on XAUUSDT.
If the contract price rises after the position is opened, the long position may gain value. If the price falls, the position may lose value.
Another trader may believe a particular stock is overvalued before an earnings announcement. That trader may open a short position on a related TradFi perpetual contract.
If the price falls, the short position may gain value. If the company reports stronger-than-expected results and the price rises sharply, the short position may lose value.
This ability to trade in either direction provides flexibility, but it also creates risk. Short positions can suffer rapid losses when prices rise unexpectedly, while long positions can be damaged by sudden declines.
A realistic leverage example
Consider a simplified educational example.
A trader has 100 USDT available as margin and opens a 500 USDT gold-linked position using 5x leverage.
The trader is controlling a position five times larger than the margin committed.
If the contract rises by 2%, the gross gain on a 500 USDT position would be approximately 10 USDT.
That 10 USDT represents approximately 10% of the trader’s original 100 USDT margin.
But the same calculation works in the opposite direction.
If the contract falls by 2%, the gross loss would also be approximately 10 USDT, before fees, funding, and slippage.
The underlying market moved only 2%, but the effect on the trader’s committed margin was approximately 10%.
This is what leverage does. It does not make the trader’s prediction more accurate. It increases the financial effect of the price movement on the trader’s capital.
At 10x leverage, a 2% adverse movement on a similarly structured position could create a loss equal to approximately 20% of the committed margin, before additional costs.
The exact liquidation price cannot be calculated from leverage alone. It also depends on factors such as the entry price, position size, maintenance margin, margin mode, available balance, fees, and other account conditions.
The important lesson is that higher leverage leaves less room for the market to move against the position.
Why 24/7 TradFi trading requires special attention
One of the most distinctive features of Binance TradFi perpetuals is that the futures contracts can trade continuously even though the underlying traditional markets do not.
Cryptocurrency markets generally operate continuously. Traditional equity and commodity markets have regular sessions, extended sessions, maintenance periods, weekends, and holidays.
This creates an important challenge: how should a perpetual contract continue trading when the main underlying market is closed?
Binance uses specific Price Index and Mark Price mechanisms for TradFi perpetuals. During normal trading periods, external data vendors contribute to the Price Index. During periods when normal external price formation is unavailable or liquidity is limited, different calculation modes may apply, including order-book-based and smoothed pricing mechanisms.
The Mark Price is especially important because futures platforms generally use it for risk calculations and liquidation management rather than relying only on the most recent trade price.k
This means beginners should understand that three prices may not always be identical:
The price of the underlying traditional assetThe TradFi perpetual contract’s latest traded priceThe contract’s Mark Price
During active traditional-market hours, these prices may remain relatively close. During weekends, holidays, overnight periods, or moments of limited liquidity, differences may become more noticeable.
My main product observation
After examining how Binance designed TradFi perpetuals, the most important product observation is that off-hours trading should not be treated as merely “extra time to trade.”
It can represent a different pricing environment.
When the traditional market is open, the underlying asset benefits from active price discovery across its main venues. When that market is closed, the perpetual contract may continue reacting to Binance order-book activity, market expectations, related instruments, and available pricing mechanisms.
That does not automatically make off-hours trading unsuitable, but it means traders should be more careful about liquidity, spreads, volatility, and the difference between the perpetual price and the last widely recognized underlying-market price.
The ability to trade a stock-linked contract on a weekend may appear convenient. The more important question is whether the trader understands how that contract is being priced while the primary stock market is closed.
Binance itself warns that TradFi perpetuals can face high market risk and price volatility, particularly outside traditional market hours.
A realistic off-hours scenario
Imagine that a trader follows a technology company whose shares closed at $200 on Friday.
During the weekend, major news appears that could affect the company. The company’s main stock exchange is closed, but a related TradFi perpetual contract continues trading.
Buyers and sellers begin reacting to the news. The perpetual contract moves to a level equivalent to $208.
This does not necessarily mean the actual stock will open at exactly $208 on Monday.
When the traditional market reopens, new institutional orders, updated analyst views, liquidity, broader market conditions, and official price discovery may produce a different opening price.
The perpetual contract could have anticipated the move correctly, overreacted to the news, or underestimated it.
A trader entering during the weekend is therefore not simply trading the last official stock price. The trader is trading the market’s current expectation of where the asset may be valued when deeper traditional-market liquidity returns.
This is a useful feature for expressing a market view, but it introduces basis, liquidity, and repricing risks that beginners may overlook.
Price Index, Mark Price, and last price
The last price is the price at which the most recent trade occurred.
The Price Index is a calculated reference intended to represent the external value of the underlying asset using available pricing inputs.
The Mark Price is a risk-management reference designed to reduce the effect of short-term manipulation or abnormal contract-price movements on unrealized profit, loss, and liquidation calculations.
A trader may see the last price move sharply while the Mark Price moves less aggressively. Conversely, changes in the pricing mode or underlying reference can affect the Mark Price even when the trader is focused only on the visible candlestick chart.
For this reason, checking only the entry price and latest traded price is not enough. Futures traders should also know which price is used to calculate their liquidation risk.
Understanding funding
Funding is another mechanism that beginners can underestimate
When a perpetual contract trades at a premium or discount relative to its reference market, funding payments can help encourage the contract price to remain connected to the underlying asset.
If the funding rate is positive, long-position holders generally pay short-position holders.
If the rate is negative, short-position holders generally pay long-position holders.
Funding rates can change.
A trader who plans to hold a position for several days should therefore consider not only the expected price move but also the possible cost of maintaining the position.
For example, a trader may correctly predict that an asset will rise slowly over a week. However, repeated funding payments, trading fees, and an imprecise entry may reduce the final result.
Funding should not be treated as a small detail displayed near the order panel. It is part of the trade’s cost structure.
Cross margin versus isolated margin
Margin mode can significantly affect risk.
Under isolated margin, a specific amount of margin is assigned to one position. The potential damage is more contained because the position does not automatically use the entire available futures balance in the same way a cross-margin position might.
Under cross margin, available margin can be shared across positions. This may help a position remain open during temporary volatility, but it can also expose a larger portion of the account balance if the trade continues moving in the wrong direction.
Neither mode removes risk.
Isolated margin can still be fully lost if the position is liquidated. Cross margin can place more account capital at risk.
Beginners should understand the selected margin mode before submitting an order rather than discovering its effect after the market moves.
What moves TradFi perpetual prices?
The answer depends on the underlying asset.
Stock-linked contracts may react to:Company earningsRevenue and profit guidanceProduct announcementsManagement changesIndustry developmentsInterest-rate expectationsRegulatory decisionsBroader stock-market sentimentCommodity-linked contracts may react to:InflationCurrency movementsInterest ratesGeopolitical eventsSupply disruptionsProduction decisionsIndustrial demandWeather conditionsInventory reports
ETF-linked contracts may respond to the combined movement of many companies and broader economic expectations.
This means technical analysis alone may not provide enough context. A chart can show where price has moved, but traditional-market news often helps explain why it is moving.
Common beginner mistakes
The first mistake is confusing the contract with ownership.
Trading an Apple-linked perpetual does not mean owning Apple shares.
The second mistake is using high leverage because the underlying asset appears less volatile than cryptocurrency.
A stock or commodity does not need to move 20% in one day to cause serious damage to a highly leveraged position. A relatively small adverse move can have a large effect on margin.
The third mistake is ignoring funding and fees.
Frequent entries and exits or long holding periods can create costs that reduce performance.
The fourth mistake is trading major news without a plan.
Earnings reports, inflation releases, employment data, and central-bank decisions can produce rapid price changes and slippage.
The fifth mistake is assuming 24/7 access means equal liquidity throughout the entire week.
Trading conditions can vary significantly between active underlying-market hours and off-hours.
The sixth mistake is watching only the last price.
Mark Price is essential for understanding unrealized profit, loss, and liquidation risk.
Who may find Futures TradFi useful?
The product may interest experienced futures users who want to express views on traditional assets while using a familiar USDT-settled trading environment.
It may also be useful for traders who already follow commodities, equities, or major market ETFs and understand how economic events affect them.
However, the product may be unsuitable for someone who:
Does not understand leverageCannot explain liquidationHas no position-sizing methodUses money needed for essential expensesTrades primarily because of social-media excitementAssumes familiar assets are automatically safeIs unwilling to monitor funding and marginA beginner checklist before opening a positionBefore trading a TradFi perpetual contract, a user should be able to answer the following questions:
What exactly does this contract track?
Am I trading a derivative or purchasing the underlying asset?
Is the underlying traditional market currently open?
What is the contract’s Mark Price?
What leverage have I selected?
How much of my capital is actually at risk?
Am I using isolated or cross margin?
Where is my estimated liquidation price?
When is the next funding payment?
What news event could affect this asset?
Where will I exit if the trade is wrong?
Is the possible loss acceptable before I place the order?
If these questions cannot be answered, the user may need more education before opening the position.
Final perspective
Binance Futures TradFi creates a bridge between traditional financial markets and crypto-style perpetual trading.
Its v.lue is not simply that recognizable assets are available on a crypto platform. Its deeper value is that eligible traders can express long or short views on different global markets using USDT-settled perpetual contracts and continuous access.
But the same features that make the product flexible also create its main risks.
Leverage magnifies losses.
Funding affects holding costs.
Liquidation can close a position automatically.
Traditional markets do not provide equal price discovery at every hour.
A perpetual contract is not the same as the asset it tracks.
The responsible approach is to treat Futures TradFi as a derivatives product first and a familiar-asset product second.
Before trading, explore the TradFi section on Binance Futures, review the individual contract specifications, observe how the Mark Price behaves during different market sessions, and understand the full risk of the position before committing capital.
This content is for educational purposes only and does not constitute financial advice or a recommendation to trade. Futures and leveraged products involve significant risk and can result in partial or total loss of capital. Product availability, contract specifications, leverage limits, pricing mechanisms, and eligibility may vary by region and can change. Always review the latest official Binance information, conduct independent research, and consider your experience and risk tolerance before trading.
$AKE $BANK
#BinanceFutures #TradFi #RiskEducation $ESPORTS
Capitalizing on Live Match Volatility ⚡ On Binance Futures, the 90 minutes of high-stakes games like the Argentina-Spain final offer a wild playground for scalpers due to rapid price shifts with every goal. Keep your stop-losses tight and manage your risk! $ETH $BTC $BNB #BinanceFutures #scalping #BinanceSquare #crypto
Capitalizing on Live Match Volatility ⚡

On Binance Futures, the 90 minutes of high-stakes games like the Argentina-Spain final offer a wild playground for scalpers due to rapid price shifts with every goal. Keep your stop-losses tight and manage your risk!
$ETH $BTC $BNB

#BinanceFutures #scalping #BinanceSquare #crypto
### 💰 Massive Futures Performance: PNL Explodes by Over 67% Intraday This Binance Futures portfolio snapshot shows an incredible day of high-conviction execution, printing a massive surge in daily profits and pushing the total margin account past a key six-figure milestone. ### 📊 Key Account Metrics * **Margin Balance:** **100,677.33 USDT** 📈 * **Today's Realized PNL:** **+$33,803.13** (**+67.55%**) 🔥 * **Wallet Balance:** **81,513.94 USDT** * **Unrealized PNL:** **+19,163.39 USDT** (Still running in open equity) ### 🔍 Performance Breakdown * **⚡ Exceptional Strike Rate:** Locking in over **$33.8k** in a single day represents an absolute masterclass in catching high-momentum volatility or a perfectly timed market squeeze. * **📈 Additional Running Gains:** On top of the massive realized bag today, there is still **19,163.39 USDT** sitting in floating unrealized profits. This shows strong trade management—letting winning positions run rather than cutting them early. * **🛡️ Risk Management Strategy:** Crossing into a **$100k+ margin balance** means position sizing and leverage management become more critical than ever. Protecting a six-figure stack requires strict stop-loss discipline to safeguard these explosive compounding gains against sudden trend reversals. **Tags:** #BinanceFutures #PNL #SPIDER_BNB
### 💰 Massive Futures Performance: PNL Explodes by Over 67% Intraday

This Binance Futures portfolio snapshot shows an incredible day of high-conviction execution, printing a massive surge in daily profits and pushing the total margin account past a key six-figure milestone.

### 📊 Key Account Metrics
* **Margin Balance:** **100,677.33 USDT** 📈

* **Today's Realized PNL:** **+$33,803.13** (**+67.55%**) 🔥
* **Wallet Balance:** **81,513.94 USDT**

* **Unrealized PNL:** **+19,163.39 USDT** (Still running in open equity)

### 🔍 Performance Breakdown
* **⚡ Exceptional Strike Rate:** Locking in over **$33.8k** in a single day represents an absolute masterclass in catching high-momentum volatility or a perfectly timed market squeeze.

* **📈 Additional Running Gains:** On top of the massive realized bag today, there is still **19,163.39 USDT** sitting in floating unrealized profits. This shows strong trade management—letting winning positions run rather than cutting them early.

* **🛡️ Risk Management Strategy:** Crossing into a **$100k+ margin balance** means position sizing and leverage management become more critical than ever. Protecting a six-figure stack requires strict stop-loss discipline to safeguard these explosive compounding gains against sudden trend reversals.

**Tags:** #BinanceFutures #PNL #SPIDER_BNB
### 🚀 $US USDT Long: Securing an Elite +$27,400 Payday This "Close Position" confirmation screen shows an absolute home-run of a trade on **USUSDT Perpetual** (Binance Futures), capturing a massive upward surge with tight, disciplined leverage. ### 📊 Position Breakdown * **Estimated PNL:** **+$27,452.30 USDT** 🟢 * **Leverage:** **Long 10x** * **Total Position Amount:** **$46,623.54 USDT** * **Entry Price:** **$0.0185900** * **Mark Price:** **$0.0451650** * **Close Percent:** **100% (Market Close)** ### 🔍 Execution Insights * **Massive Spot Expansion:** Buying in at **$0.01859** and holding all the way up to **$0.04516** represents an incredible **+142.9%** raw spot price move. * **Leverage Amplification:** By utilizing a highly controlled **10x leverage**, that spot move translated into a spectacular **~1,429% ROI** on your initial margin, enabling you to extract over **$27.4k** in pure profit from a $46.6k total position size. * **Perfect Profit Taking:** Executing a 100% market close into this level of strength is textbook trading. Locking in massive green numbers eliminates the risk of an aggressive pull-back wiping out paper gains. {future}(USUSDT) *Tags:** #USUSDT #BinanceFutures #SPIDER_BNB
### 🚀 $US USDT Long: Securing an Elite +$27,400 Payday

This "Close Position" confirmation screen shows an absolute home-run of a trade on **USUSDT Perpetual** (Binance Futures), capturing a massive upward surge with tight, disciplined leverage.

### 📊 Position Breakdown
* **Estimated PNL:** **+$27,452.30 USDT** 🟢
* **Leverage:** **Long 10x**
* **Total Position Amount:** **$46,623.54 USDT**
* **Entry Price:** **$0.0185900**
* **Mark Price:** **$0.0451650**
* **Close Percent:** **100% (Market Close)**

### 🔍 Execution Insights
* **Massive Spot Expansion:** Buying in at **$0.01859** and holding all the way up to **$0.04516** represents an incredible **+142.9%** raw spot price move.

* **Leverage Amplification:** By utilizing a highly controlled **10x leverage**, that spot move translated into a spectacular **~1,429% ROI** on your initial margin, enabling you to extract over **$27.4k** in pure profit from a $46.6k total position size.

* **Perfect Profit Taking:** Executing a 100% market close into this level of strength is textbook trading. Locking in massive green numbers eliminates the risk of an aggressive pull-back wiping out paper gains.

*Tags:** #USUSDT #BinanceFutures #SPIDER_BNB
·
--
Bearish
Guy's 🔺short now $BR ❗❗ #BR is showing weakness after failing to hold higher levels, with price action forming lower highs on the 4H chart. A breakdown below key support could trigger another leg down, while any weak bounce may offer a better short opportunity. $BR - SHORT Trade Plan: Entry: 0.14900–0.15300 SL: 0.16250 TP1: 0.14250 TP2: 0.13500 TP3: 0.12500 Why this setup? The 4H structure remains under pressure, with sellers defending resistance and momentum fading. Unless #BR reclaims the 0.15300–0.16000 zone, the trend favors continued downside movement. Debate: Will $BR break support and continue its bearish move, or can bulls regain control with a strong recovery? Click here to Trade 👇️ {future}(BRUSDT) #BR #CryptoTrading #BinanceFutures
Guy's 🔺short now $BR ❗❗

#BR is showing weakness after failing to hold higher levels, with price action forming lower highs on the 4H chart. A breakdown below key support could trigger another leg down, while any weak bounce may offer a better short opportunity.

$BR - SHORT

Trade Plan:

Entry: 0.14900–0.15300
SL: 0.16250
TP1: 0.14250
TP2: 0.13500
TP3: 0.12500

Why this setup?
The 4H structure remains under pressure, with sellers defending resistance and momentum fading. Unless #BR reclaims the 0.15300–0.16000 zone, the trend favors continued downside movement.

Debate:
Will $BR break support and continue its bearish move, or can bulls regain control with a strong recovery?

Click here to Trade 👇️


#BR #CryptoTrading #BinanceFutures
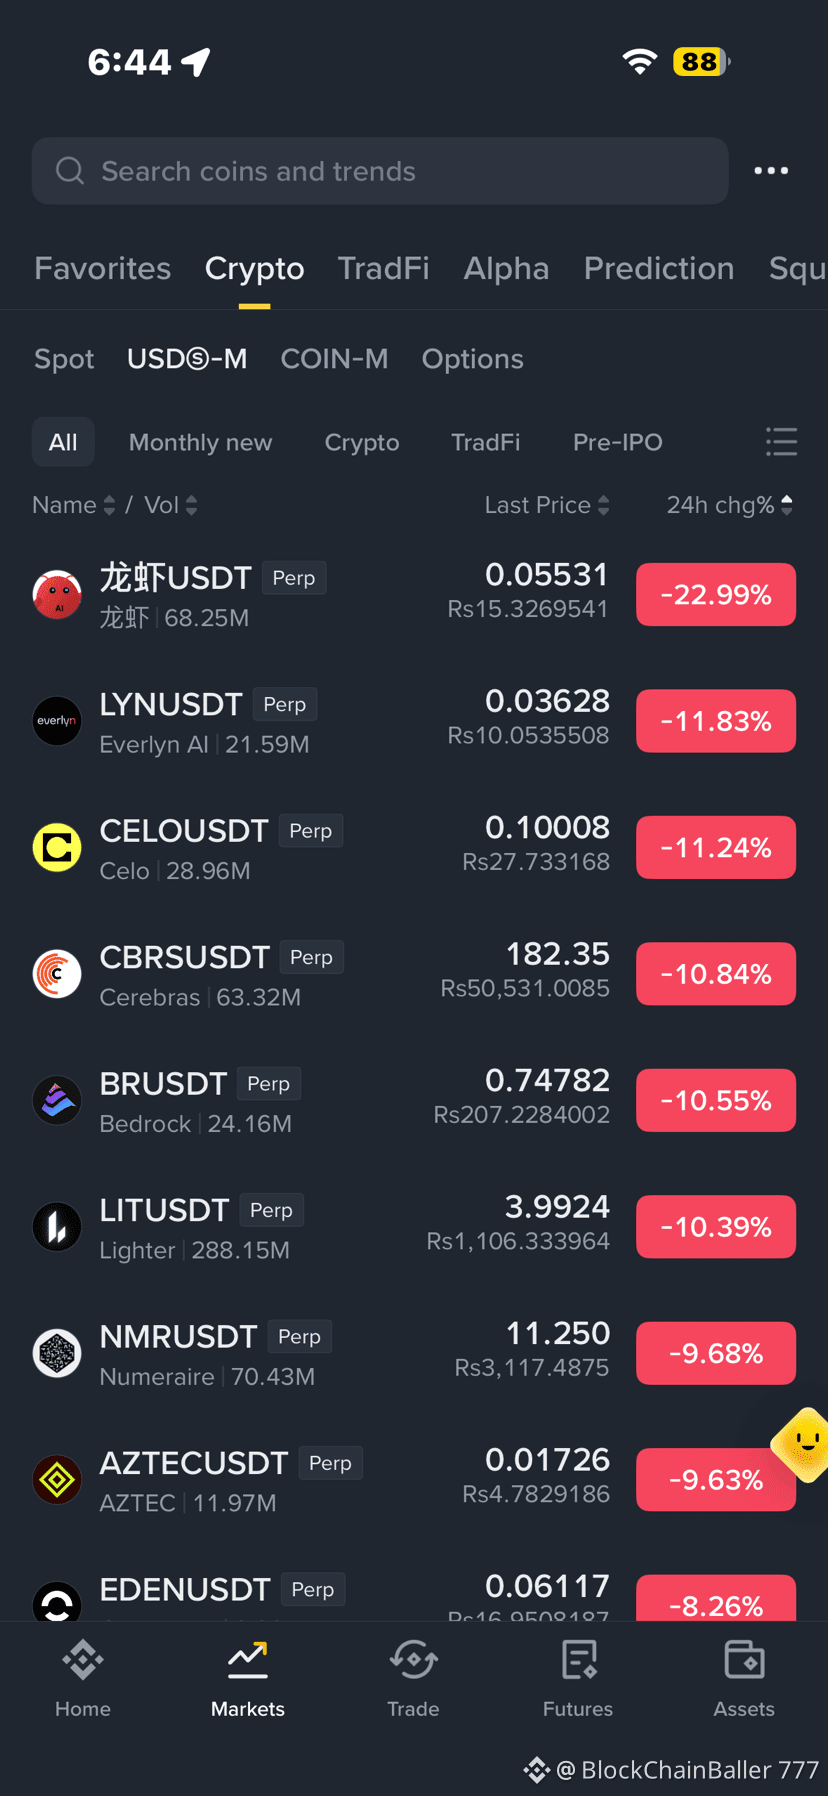
### 🔴 Futures Losers Board: Market Triggers Sharp Liquidations The **USDⓈ-M Futures** losers board is flashing deep pink as a strong wave of profit-taking and localized selling sweeps through specific asset segments. ### 📉 Top Perpetual Losers (24h) * **$HOME USDT** ➡️ **$0.00834** (Rs. 2.32) | **-41.23%** * **BLUAIUSDT** ➡️ **$0.010936** (Rs. 3.04) | **-31.74%** * **$SNXX USDT** ➡️ **$12.65** (Rs. 3,517.84) | **-28.53%** * **$MVLL.ETF USDT** ➡️ **$19.20** (Rs. 5,339.33) | **-23.78%** * **BILLUSDT** ➡️ **$0.02277* * (Rs. 6.32) | **-22.13%** * **SOXLUSDT** ➡️ **$125.37** (Rs. 34,844.68) | **-20.33%** * **DODOXUSDT** ➡️ **$0.021148** (Rs. 5.88) | **-20.14%** ### 🔍 Market Takeaway > Leveraged instruments like **SNXX (2X Long)** and **SOXL (3X Bull)** are bearing the brunt of the downturn due to amplified volatility. Avoid trying to "catch a falling knife" without a confirmed technical support structure. > **Tags:** #CryptoTrading #BinanceFutures #SPIDER_BNB
### 🔴 Futures Losers Board: Market Triggers Sharp Liquidations

The **USDⓈ-M Futures** losers board is flashing deep pink as a strong wave of profit-taking and localized selling sweeps through specific asset segments.

### 📉 Top Perpetual Losers (24h)

* **$HOME USDT** ➡️ **$0.00834** (Rs. 2.32) | **-41.23%**

* **BLUAIUSDT** ➡️ **$0.010936** (Rs. 3.04) | **-31.74%**

* **$SNXX USDT** ➡️ **$12.65** (Rs. 3,517.84) | **-28.53%**

* **$MVLL.ETF USDT** ➡️ **$19.20** (Rs. 5,339.33) | **-23.78%**

* **BILLUSDT** ➡️ **$0.02277*
* (Rs. 6.32) | **-22.13%**

* **SOXLUSDT** ➡️ **$125.37** (Rs. 34,844.68) | **-20.33%**

* **DODOXUSDT** ➡️ **$0.021148** (Rs. 5.88) | **-20.14%**

### 🔍 Market Takeaway
> Leveraged instruments like **SNXX (2X Long)** and **SOXL (3X Bull)** are bearing the brunt of the downturn due to amplified volatility. Avoid trying to "catch a falling knife" without a confirmed technical support structure.
>

**Tags:** #CryptoTrading #BinanceFutures #SPIDER_BNB
·
--
Bullish
🚨 BSBUSDT Trade Setup (15M) 🚨 The chart is showing a strong bullish trend with higher highs and higher lows. Price has rallied sharply and is now consolidating just below resistance around 0.1440–0.1450. As long as buyers defend the pullback, another leg higher is possible. Long Trade Setup * Entry: 0.1398 – 0.1410 * Take Profit 1: 0.1448 * Take Profit 2: 0.1485 * Take Profit 3: 0.1520 * Stop Loss: 0.1375 * Strong bullish momentum remains intact. * Healthy consolidation after the breakout instead of an immediate reversal. * Holding above 0.1400 keeps buyers in control. * A break above 0.1450 could trigger another momentum move. Trade from here 👉$BSB 👈 for 0 commission fees. #BSBUSDT #BinanceFutures #cryptotrading #TradeSetup {future}(BSBUSDT)
🚨 BSBUSDT Trade Setup (15M) 🚨

The chart is showing a strong bullish trend with higher highs and higher lows. Price has rallied sharply and is now consolidating just below resistance around 0.1440–0.1450. As long as buyers defend the pullback, another leg higher is possible.

Long Trade Setup

* Entry: 0.1398 – 0.1410
* Take Profit 1: 0.1448
* Take Profit 2: 0.1485
* Take Profit 3: 0.1520
* Stop Loss: 0.1375

* Strong bullish momentum remains intact.
* Healthy consolidation after the breakout instead of an immediate reversal.
* Holding above 0.1400 keeps buyers in control.
* A break above 0.1450 could trigger another momentum move.

Trade from here 👉$BSB 👈 for 0 commission fees.
#BSBUSDT #BinanceFutures #cryptotrading #TradeSetup
🚀 New Binance Futures Listings Are Live! The launch of MUUUUSDT, SOXSUSDT, and TZAUSDT shows that Binance continues expanding trading opportunities for futures users. 📊 New listings often attract: ✅ Higher trading volume ✅ Increased market attention ✅ More short-term volatility Remember, volatility can create opportunities—but it also increases risk. Always use proper risk management and avoid overleveraging. 💬 Which of these new perpetual contracts are you watching the closest: MUUUUSDT, SOXSUSDT, or TZAUSDT? #Binance #BinanceFutures #crypto #TradingSignals #PerpetualFutures $MUU $SOXS $TZA
🚀 New Binance Futures Listings Are Live!
The launch of MUUUUSDT, SOXSUSDT, and TZAUSDT shows that Binance continues expanding trading opportunities for futures users.
📊 New listings often attract: ✅ Higher trading volume ✅ Increased market attention ✅ More short-term volatility
Remember, volatility can create opportunities—but it also increases risk. Always use proper risk management and avoid overleveraging.
💬 Which of these new perpetual contracts are you watching the closest: MUUUUSDT, SOXSUSDT, or TZAUSDT?
#Binance #BinanceFutures #crypto #TradingSignals #PerpetualFutures $MUU $SOXS $TZA
### 💎 Maximizing Capital Efficiency: Futures Margin & Yield Optimization Capital utility is hitting peak performance . While maintaining a strong, highly funded futures trading book, the portfolio is simultaneously putting idle collateral to work using Binance's latest unified yield products. ### 📊 Portfolio At A Glance * **Margin Balance:** **$945,327.39 USD** * **Wallet Balance:** **$878,320.98 USD** * **Today's Realized PNL:** **+$28,689.22 USD** (**+3.02%** daily gain) * **Unrealized PNL:** **+$67,006.41 USD** ### 🔍 Collateral Yield Breakdown Rather than letting passive margin sit idle, the account is capturing multi-layered yield streams directly inside the futures dashboard: 1. **BFUSD Earning (2.40% APR):** Capitalizing on Binance's stable-value margin asset, which utilizes spot/futures delta-hedging to accumulate daily rewards. 2. **LDUSDT Earning (1.52% APR):** Maximizing capital efficiency by using Simple Earn USDT Flexible assets directly as USDⓈ-M trading margin while collecting real-time APR. 3. **RWUSD Earning (3.36% APR):** Leveraging tokenized real-world asset (RWA) treasury yields seamlessly from the USDⓈ-M interface. ### 🛡️ Tactical Focus With over **$67k in unrealized gains** riding the current trend and a solid **+3.02% realized today**, the risk engine is operating in prime condition. The 10% BNB fee discount is also toggled on, keeping trade execution costs at an absolute minimum. **Tags:** #BinanceFutures #BFUSD #SPIDER_BNB
### 💎 Maximizing Capital Efficiency: Futures Margin & Yield Optimization
Capital utility is hitting peak performance

. While maintaining a strong, highly funded futures trading book, the portfolio is simultaneously putting idle collateral to work using Binance's latest unified yield products.

### 📊 Portfolio At A Glance
* **Margin Balance:** **$945,327.39 USD**

* **Wallet Balance:** **$878,320.98 USD**

* **Today's Realized PNL:** **+$28,689.22 USD** (**+3.02%** daily gain)

* **Unrealized PNL:** **+$67,006.41 USD**

### 🔍 Collateral Yield Breakdown
Rather than letting passive margin sit idle, the account is capturing multi-layered yield streams directly inside the futures dashboard:

1. **BFUSD Earning (2.40% APR):** Capitalizing on Binance's stable-value margin asset, which utilizes spot/futures delta-hedging to accumulate daily rewards.

2. **LDUSDT Earning (1.52% APR):** Maximizing capital efficiency by using Simple Earn USDT Flexible assets directly as USDⓈ-M trading margin while collecting real-time APR.

3. **RWUSD Earning (3.36% APR):** Leveraging tokenized real-world asset (RWA) treasury yields seamlessly from the USDⓈ-M interface.

### 🛡️ Tactical Focus
With over **$67k in unrealized gains** riding the current trend and a solid **+3.02% realized today**, the risk engine is operating in prime condition.

The 10% BNB fee discount is also toggled on, keeping trade execution costs at an absolute minimum.

**Tags:** #BinanceFutures #BFUSD #SPIDER_BNB
🚨 BINANCE PRE-MARKET ALERT | $MINIMAX 🚨 The countdown has begun. ⏳ $MINIMAX is set to go live on Binance Futures (MINIMAXUSDT Perp) in just a few minutes. 🔥 New listings often bring explosive volatility, but remember: • Don't FOMO into the first candle. • Let the market reveal its direction. • Protect your capital with proper risk management. The biggest opportunities belong to disciplined traders—not the fastest ones. Eyes on $MINIMAX. Trade Smart. Stay Ahead. 📈 #MINIMAX #MINIMAXUSDT #Binance #BinanceFutures #Crypto #cryptotrading #NewListing #Altcoins #Web3 #BinanceSquare
🚨 BINANCE PRE-MARKET ALERT | $MINIMAX 🚨

The countdown has begun. ⏳

$MINIMAX is set to go live on Binance Futures (MINIMAXUSDT Perp) in just a few minutes.

🔥 New listings often bring explosive volatility, but remember: • Don't FOMO into the first candle. • Let the market reveal its direction. • Protect your capital with proper risk management.

The biggest opportunities belong to disciplined traders—not the fastest ones.

Eyes on $MINIMAX . Trade Smart. Stay Ahead. 📈

#MINIMAX #MINIMAXUSDT #Binance #BinanceFutures #Crypto #cryptotrading #NewListing #Altcoins #Web3 #BinanceSquare
Na Krai1788:
Hi
·
--
Bullish
​🔮 Quick Guide for Beginners: How to enter the Futures world on Binance without getting wrecked 📉📈 ​Have you heard about "trading Futures" but the screen looks like a spaceship control panel? 🚀 Don’t worry, I’ll explain it to you in an easy, step-by-step way so you can understand the interface from scratch. ​🛠️ Step 1: Where to find it? ​Before you trade, you need to know where to go. ​Go to the Services menu in your app. ​Look for the Trading category. ​Select the Futures option (the one with the leaf and star icon). ​📊 Step 2: Understanding the trading screen ​When you enter, you’ll see a screen like the one I show below. Don’t panic—these are the 4 key points you need to master: ​1️⃣ The trading pair: On the top-left, choose which coin you’re going to trade. For example, in the image we’re seeing $PIXEL against $USDT (PIXELUSDT in perpetual contracts). 2️⃣ Margin Mode (Cross / Isolated): Just below the pair, you’ll see the "Cross" button. To start, I suggest learning the difference, because Isolated mode limits your risk only to the money you put into that specific trade. 3️⃣ Leverage (20x, etc.): The image shows 20x leverage. Pay close attention here! Leverage multiplies both your gains and your losses. If you’re a beginner, start very low (like 2x or 5x). 4️⃣ Buy (Long) / Sell (Short): ​If you think the price of $PIXEL will go up, you’ll go for Buy / Long (green button). ​If you think the price will fall, you’ll go for Sell / Short (red button). Yes, in futures you can make money even when the market is going down! ​⚠️ THE GOLDEN RULE OF A GOOD TRADER: Never enter a Futures trade without enabling your TP/SL (Take Profit / Stop Loss). This automatically protects your capital if the market moves against you. ​Have you traded in Futures yet, or does the interface still scare you a little? 👇 Drop your questions in the comments and we’ll work through them together! ​#BinanceFutures #PIXEL #USDT #Futuros
​🔮 Quick Guide for Beginners: How to enter the Futures world on Binance without getting wrecked 📉📈

​Have you heard about "trading Futures" but the screen looks like a spaceship control panel? 🚀 Don’t worry, I’ll explain it to you in an easy, step-by-step way so you can understand the interface from scratch.

​🛠️ Step 1: Where to find it?
​Before you trade, you need to know where to go.
​Go to the Services menu in your app.
​Look for the Trading category.
​Select the Futures option (the one with the leaf and star icon).

​📊 Step 2: Understanding the trading screen
​When you enter, you’ll see a screen like the one I show below. Don’t panic—these are the 4 key points you need to master:
​1️⃣ The trading pair: On the top-left, choose which coin you’re going to trade. For example, in the image we’re seeing $PIXEL against $USDT (PIXELUSDT in perpetual contracts).

2️⃣ Margin Mode (Cross / Isolated): Just below the pair, you’ll see the "Cross" button. To start, I suggest learning the difference, because Isolated mode limits your risk only to the money you put into that specific trade.

3️⃣ Leverage (20x, etc.): The image shows 20x leverage. Pay close attention here! Leverage multiplies both your gains and your losses. If you’re a beginner, start very low (like 2x or 5x).

4️⃣ Buy (Long) / Sell (Short):
​If you think the price of $PIXEL will go up, you’ll go for Buy / Long (green button).

​If you think the price will fall, you’ll go for Sell / Short (red button). Yes, in futures you can make money even when the market is going down!

​⚠️ THE GOLDEN RULE OF A GOOD TRADER: Never enter a Futures trade without enabling your TP/SL (Take Profit / Stop Loss). This automatically protects your capital if the market moves against you.

​Have you traded in Futures yet, or does the interface still scare you a little? 👇 Drop your questions in the comments and we’ll work through them together!
#BinanceFutures #PIXEL #USDT #Futuros
Magnus-bf21ea346:
quiero operar en futuros pero nose como empezar
·
--
Bullish
Verified
🚨 New Perpetual Listing Alert! 🚨 Eyes on $MINIMAX! 👀 ⏳ $MINIMAX USDT Perpetual will go live in just: 🕒 13 Hours 46 Minutes New listings often bring sharp volatility and fast-moving opportunities. Whether you're planning to trade the breakout or waiting for the market to settle, make sure your strategy is ready before the countdown ends. ✔️ Manage your risk ✔️ Avoid FOMO entries ✔️ Wait for confirmation before chasing momentum Will $MINIMAX deliver a strong debut, or will patience be the winning move? Share your first target and trading plan below! 👇 #MINIMAX #Perpetual #BinanceFutures #CryptoTrading #DYOR $MINIMAX {future}(MINIMAXUSDT)
🚨 New Perpetual Listing Alert! 🚨

Eyes on $MINIMAX ! 👀

$MINIMAX USDT Perpetual will go live in just: 🕒 13 Hours 46 Minutes

New listings often bring sharp volatility and fast-moving opportunities. Whether you're planning to trade the breakout or waiting for the market to settle, make sure your strategy is ready before the countdown ends.

✔️ Manage your risk ✔️ Avoid FOMO entries ✔️ Wait for confirmation before chasing momentum

Will $MINIMAX deliver a strong debut, or will patience be the winning move?

Share your first target and trading plan below! 👇

#MINIMAX #Perpetual #BinanceFutures #CryptoTrading #DYOR
$MINIMAX
🚨 STOP SCROLLING! A New Beast Is About to Enter the Arena... 🔥 ⏳ $MUUUSDT Perpetual goes LIVE in just a few hours, and smart traders are already preparing their game plan. New listings often bring explosive volatility, fast breakouts, and high-risk/high-reward opportunities. Whether you're hunting longs or waiting for shorts, patience will be your biggest edge. ⚡ Don't chase the first candle. 📈 Wait for confirmation. 🎯 Trade the setup, not the hype. 🛡️ Protect your capital—opportunities never stop. Who's watching $MUUUSDT at launch? 👀🚀 #MUUUSDT #Crypto #BinanceFutures #Perpetual
🚨 STOP SCROLLING! A New Beast Is About to Enter the Arena... 🔥

⏳ $MUUUSDT Perpetual goes LIVE in just a few hours, and smart traders are already preparing their game plan.

New listings often bring explosive volatility, fast breakouts, and high-risk/high-reward opportunities. Whether you're hunting longs or waiting for shorts, patience will be your biggest edge.

⚡ Don't chase the first candle. 📈 Wait for confirmation. 🎯 Trade the setup, not the hype. 🛡️ Protect your capital—opportunities never stop.

Who's watching $MUUUSDT at launch? 👀🚀

#MUUUSDT #Crypto #BinanceFutures #Perpetual
Old dog glanced at the KORUUSDT order book: in the past 24 hours it’s down 10.857%, and the current price is 18.72 bucks. A drop like this isn’t unusual by itself—what’s weird is that the funding rate is still 0.00023593, clearly positive. Even with an open interest of 4.4 million, it hasn’t really backed off much. What does that mean? The longs clearly haven’t given up. They’re eating losses and still paying the funding rate. This kind of structure is something I’ve seen far too many times on TRADIFI_PERPS. In a downtrend, if the funding rate doesn’t turn negative, and the people waiting to catch the knife are still lining up— Why is this particular move worth singling out? On Binance, KORU falls under the “EQUITY chain” style—like that U.S. stock products vibe—there’s nothing to compare it to; it’s basically running on its own. Without sector correlation, its price action is purely a battle of the available positions. Now it’s down more than 10%, yet the funding rate is still longs paying shorts. According to the iron law: if the rate is above zero, longs are crowded. When you’re dropping while the funding stays positive, it means the trapped longs are still adding, not cutting. That’s exactly the setup most likely to trigger a cascading liquidation. Suppose there’s a batch of high-leverage long positions around the 18-dollar area—if price slides another couple of ticks and their liquidation levels get hit, OI could get smashed down forcefully. Then that slow bleed could quickly turn into a faster, uglier drop. I’ve watched KORU for two weeks—its liquidity usually isn’t thick. When big orders hit, the slippage can chew through several price levels. In an environment like this, longs that keep paying positive funding are basically like sitting on a powder keg while smoking. Old dog’s take is pretty straightforward: don’t catch this knife. It’s not that I don’t believe in a rebound. It’s that the setup is just too bad. If later KORU can hold sideways above 17.5, and funding turns negative—then at least it suggests the longs in this move have been cleared out enough. That’s when I’d consider adding a light position to test the long. But if it breaks 17.5 directly and OI is still above 4 million, I won’t even look—that would basically be the ignition point for a long chain explosion by longs. Sure, some people might be betting on an oversold rebound. But when I ran the numbers, the funding cost is eating a little every day— and that’s not even counting the risk that price keeps pushing down. The risk-reward just isn’t worth it at all. My stance is clear: I’m not touching it now. I’ll wait until the two conditions I mentioned show up, then consider a half position for a short-term trade. Otherwise, I’ll just be an observer. Last time, on a similar on-chain U.S. stock derivative, I messed up the same way. I watched it drop 8% and thought the bottom was in. Funding was still positive, so I wanted to buy. Then a sharp drop hit in the middle of the night and pinned me halfway up the mountain. It took three days to get out even. Trading tag: #BinanceFutures #TradFi #USDⓈM #KORU #KORUUSDT $KORU
Old dog glanced at the KORUUSDT order book: in the past 24 hours it’s down 10.857%, and the current price is 18.72 bucks. A drop like this isn’t unusual by itself—what’s weird is that the funding rate is still 0.00023593, clearly positive. Even with an open interest of 4.4 million, it hasn’t really backed off much. What does that mean? The longs clearly haven’t given up. They’re eating losses and still paying the funding rate. This kind of structure is something I’ve seen far too many times on TRADIFI_PERPS. In a downtrend, if the funding rate doesn’t turn negative, and the people waiting to catch the knife are still lining up—

Why is this particular move worth singling out? On Binance, KORU falls under the “EQUITY chain” style—like that U.S. stock products vibe—there’s nothing to compare it to; it’s basically running on its own. Without sector correlation, its price action is purely a battle of the available positions. Now it’s down more than 10%, yet the funding rate is still longs paying shorts. According to the iron law: if the rate is above zero, longs are crowded. When you’re dropping while the funding stays positive, it means the trapped longs are still adding, not cutting. That’s exactly the setup most likely to trigger a cascading liquidation. Suppose there’s a batch of high-leverage long positions around the 18-dollar area—if price slides another couple of ticks and their liquidation levels get hit, OI could get smashed down forcefully. Then that slow bleed could quickly turn into a faster, uglier drop. I’ve watched KORU for two weeks—its liquidity usually isn’t thick. When big orders hit, the slippage can chew through several price levels. In an environment like this, longs that keep paying positive funding are basically like sitting on a powder keg while smoking.

Old dog’s take is pretty straightforward: don’t catch this knife. It’s not that I don’t believe in a rebound. It’s that the setup is just too bad. If later KORU can hold sideways above 17.5, and funding turns negative—then at least it suggests the longs in this move have been cleared out enough. That’s when I’d consider adding a light position to test the long. But if it breaks 17.5 directly and OI is still above 4 million, I won’t even look—that would basically be the ignition point for a long chain explosion by longs. Sure, some people might be betting on an oversold rebound. But when I ran the numbers, the funding cost is eating a little every day— and that’s not even counting the risk that price keeps pushing down. The risk-reward just isn’t worth it at all. My stance is clear: I’m not touching it now. I’ll wait until the two conditions I mentioned show up, then consider a half position for a short-term trade. Otherwise, I’ll just be an observer.

Last time, on a similar on-chain U.S. stock derivative, I messed up the same way. I watched it drop 8% and thought the bottom was in. Funding was still positive, so I wanted to buy. Then a sharp drop hit in the middle of the night and pinned me halfway up the mountain. It took three days to get out even.

Trading tag: #BinanceFutures #TradFi #USDⓈM #KORU #KORUUSDT $KORU
An old dog glanced at WDCUSDT—within 24 hours it was directly smashed down 10.125%. The price got down to around 459. Daily trading volume is 26.94 million U; this volume isn’t small in Binance’s tradfi futures. The current OI is 10147.21. Looking purely at the numbers, it isn’t an all-time high, but as it fell, open interest didn’t drop much. That suggests this wasn’t just profit-taking closures—someone is forcefully hitting it hard. The incoming capital hasn’t yet “taken the car,” so to speak. The funding rate is 0, which is rather subtle: it’s neither a long squeeze caused by crowded longs, nor collective bearish pressure from shorts. More like real sell orders at the spot side are fleeing outward. In the tradfi contracts for the semiconductor category, last night wasn’t all green-to-red across the board, but WDC’s drop is the only one in that sector. The old dog flipped through several benchmark coins roughly—most were just wobbling around 3–4%. Yet WDC face-planted on its own, and it didn’t pull the rest of the sector down with it in any obvious way. That indicates the problem is on WDC itself. There’s no sudden announcement, and no sector-wide news catalyst. This kind of “head-down” dumping usually means either a big wallet is reducing its position, or liquidity suddenly got pulled and market makers didn’t hold up. Judging from the on-chain trade distribution, large sellers are throwing out more aggressively than buyers are taking—within half an hour, there were three sell orders in the seven-figure range, all market orders, with very few limit-price orders. The old dog has watched these tradfi perps for half a year—usually, if it can get smashed like this, it’s not retail. Most likely, addresses that previously accumulated at lower levels are now closing out and sealing up their bags. From the order concentration on the chart, it doesn’t look low. We’ll verify once the on-chain data comes out, but for now, with this structure, anyone trying to catch the bottom needs to weigh whether the counterparty’s selling volume is about to be fully exhausted. Since the funding rate is still sitting at 0 and neither side is being “captured” by the funding mechanism, the drop is fierce, but it hasn’t formed that kind of feedback loop where longs get weaker as price falls, funding turns positive as longs keep getting squeezed, and then a chain explosion happens. In my memory, the last time WDC fell more than 8% in a single day was about two months ago. Back then it stayed bearish for three straight days before stabilizing, and the rebound didn’t break above the previous high. If this time repeats history, it’s likely to grind along for a while along the lower side under 450. My plan is simple: tomorrow morning, if it reclaims above 480 and the OI simultaneously starts climbing again, I’ll take a small long position, with the stop-loss placed below 449—betting it’s just a fake drop. But if it keeps breaking down through 450 and the selling doesn’t slow down, that would mean the money dumping it hasn’t exited cleanly yet. In that case, I won’t touch it at all; I’ll wait until the positions drop to around 8000, then look back. Trading tag: #BinanceFutures #TradFi #USDⓈM #WDC #WDCUSDT $WDC
An old dog glanced at WDCUSDT—within 24 hours it was directly smashed down 10.125%. The price got down to around 459. Daily trading volume is 26.94 million U; this volume isn’t small in Binance’s tradfi futures. The current OI is 10147.21. Looking purely at the numbers, it isn’t an all-time high, but as it fell, open interest didn’t drop much. That suggests this wasn’t just profit-taking closures—someone is forcefully hitting it hard. The incoming capital hasn’t yet “taken the car,” so to speak. The funding rate is 0, which is rather subtle: it’s neither a long squeeze caused by crowded longs, nor collective bearish pressure from shorts. More like real sell orders at the spot side are fleeing outward.

In the tradfi contracts for the semiconductor category, last night wasn’t all green-to-red across the board, but WDC’s drop is the only one in that sector. The old dog flipped through several benchmark coins roughly—most were just wobbling around 3–4%. Yet WDC face-planted on its own, and it didn’t pull the rest of the sector down with it in any obvious way. That indicates the problem is on WDC itself. There’s no sudden announcement, and no sector-wide news catalyst. This kind of “head-down” dumping usually means either a big wallet is reducing its position, or liquidity suddenly got pulled and market makers didn’t hold up. Judging from the on-chain trade distribution, large sellers are throwing out more aggressively than buyers are taking—within half an hour, there were three sell orders in the seven-figure range, all market orders, with very few limit-price orders. The old dog has watched these tradfi perps for half a year—usually, if it can get smashed like this, it’s not retail. Most likely, addresses that previously accumulated at lower levels are now closing out and sealing up their bags. From the order concentration on the chart, it doesn’t look low. We’ll verify once the on-chain data comes out, but for now, with this structure, anyone trying to catch the bottom needs to weigh whether the counterparty’s selling volume is about to be fully exhausted.

Since the funding rate is still sitting at 0 and neither side is being “captured” by the funding mechanism, the drop is fierce, but it hasn’t formed that kind of feedback loop where longs get weaker as price falls, funding turns positive as longs keep getting squeezed, and then a chain explosion happens. In my memory, the last time WDC fell more than 8% in a single day was about two months ago. Back then it stayed bearish for three straight days before stabilizing, and the rebound didn’t break above the previous high. If this time repeats history, it’s likely to grind along for a while along the lower side under 450. My plan is simple: tomorrow morning, if it reclaims above 480 and the OI simultaneously starts climbing again, I’ll take a small long position, with the stop-loss placed below 449—betting it’s just a fake drop. But if it keeps breaking down through 450 and the selling doesn’t slow down, that would mean the money dumping it hasn’t exited cleanly yet. In that case, I won’t touch it at all; I’ll wait until the positions drop to around 8000, then look back.

Trading tag: #BinanceFutures #TradFi #USDⓈM #WDC #WDCUSDT $WDC
Log in to explore more content
Join global crypto users on Binance Square
⚡️ Get latest and useful information about crypto.
💬 Trusted by the world’s largest crypto exchange.
👍 Discover real insights from verified creators.
Email / Phone number