

跟着B哥有肉吃
9.6k Posts

跟着B哥有肉吃
Report
Block User

DOGE Holder
High-Frequency Trader
5.4 Years
791 Following
514 Followers
642 Liked
Posts
All
Quotes
·
--
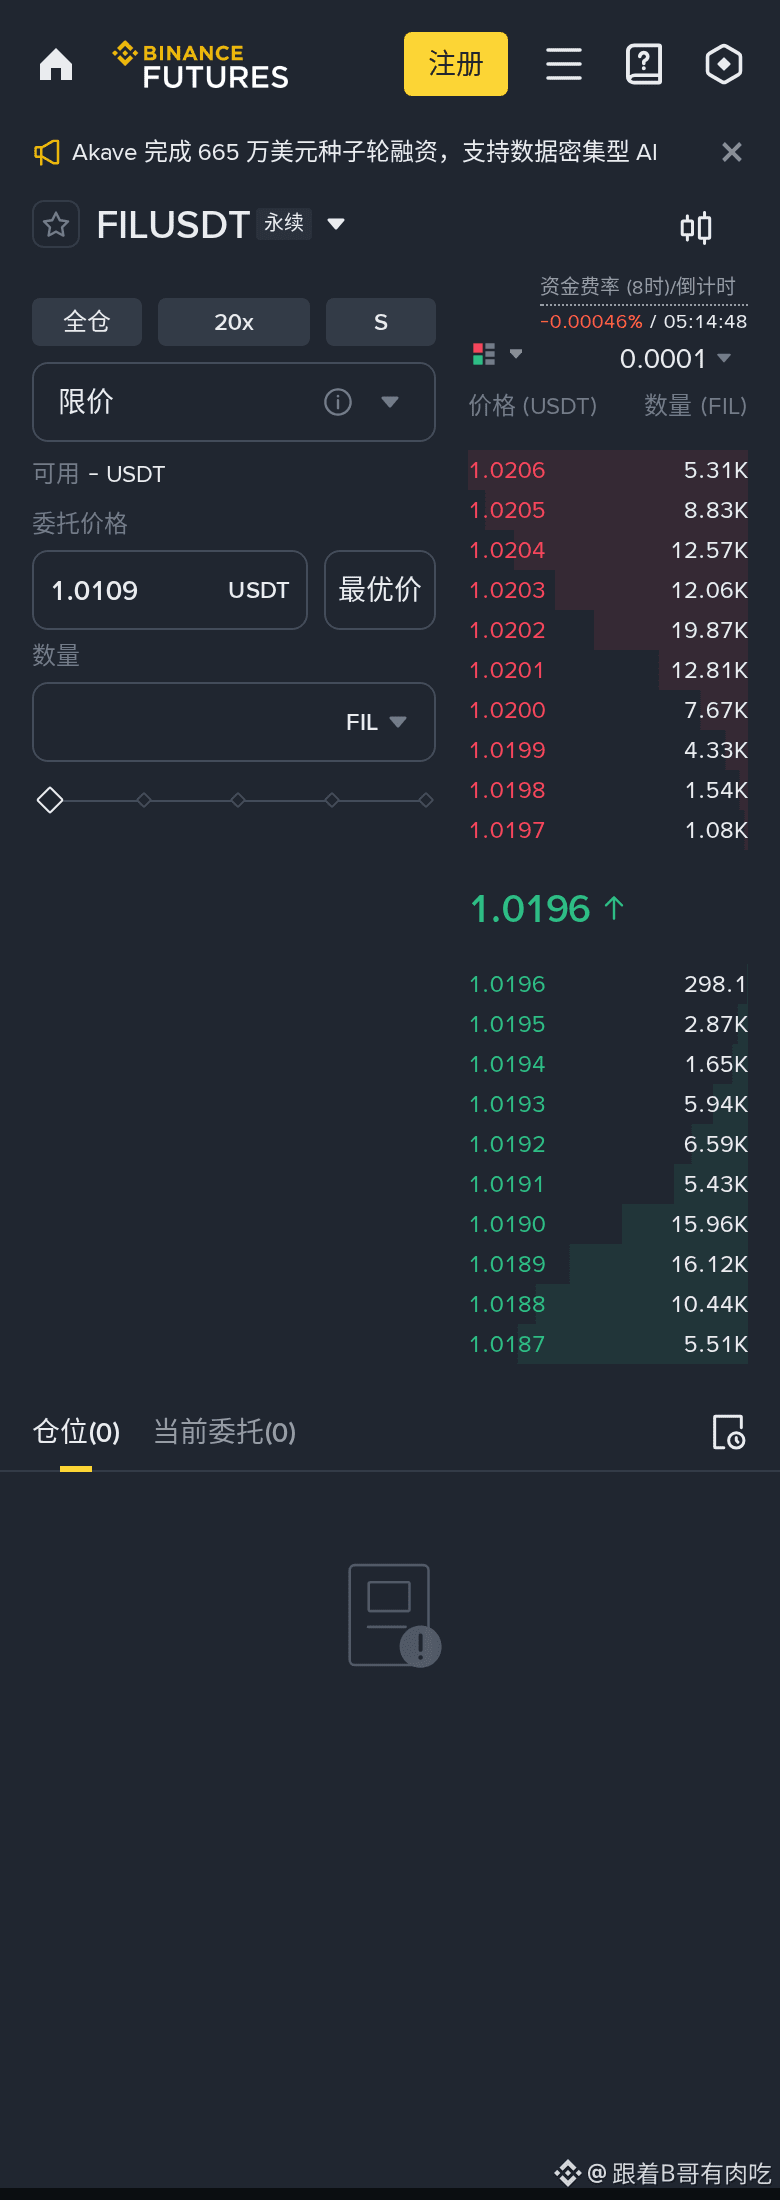
First the conclusion: Go long on FIL, enter at 1.0199, and stop loss at 1.0032.
Look at the chart: 0.9901 is support. If it drops to that area, people will step in, so this is how I set it.
Set your stop loss and keep a light position.
$FIL
First the conclusion: Go long on FIL, enter at 1.0199, and stop loss at 1.0032.
Look at the chart: 0.9901 is support. If it drops to that area, people will step in, so this is how I set it.
Set your stop loss and keep a light position.
$FIL
Look at the chart: 0.9901 is support. If it drops to that area, people will step in, so this is how I set it.
Set your stop loss and keep a light position.
$FIL
22
·
--
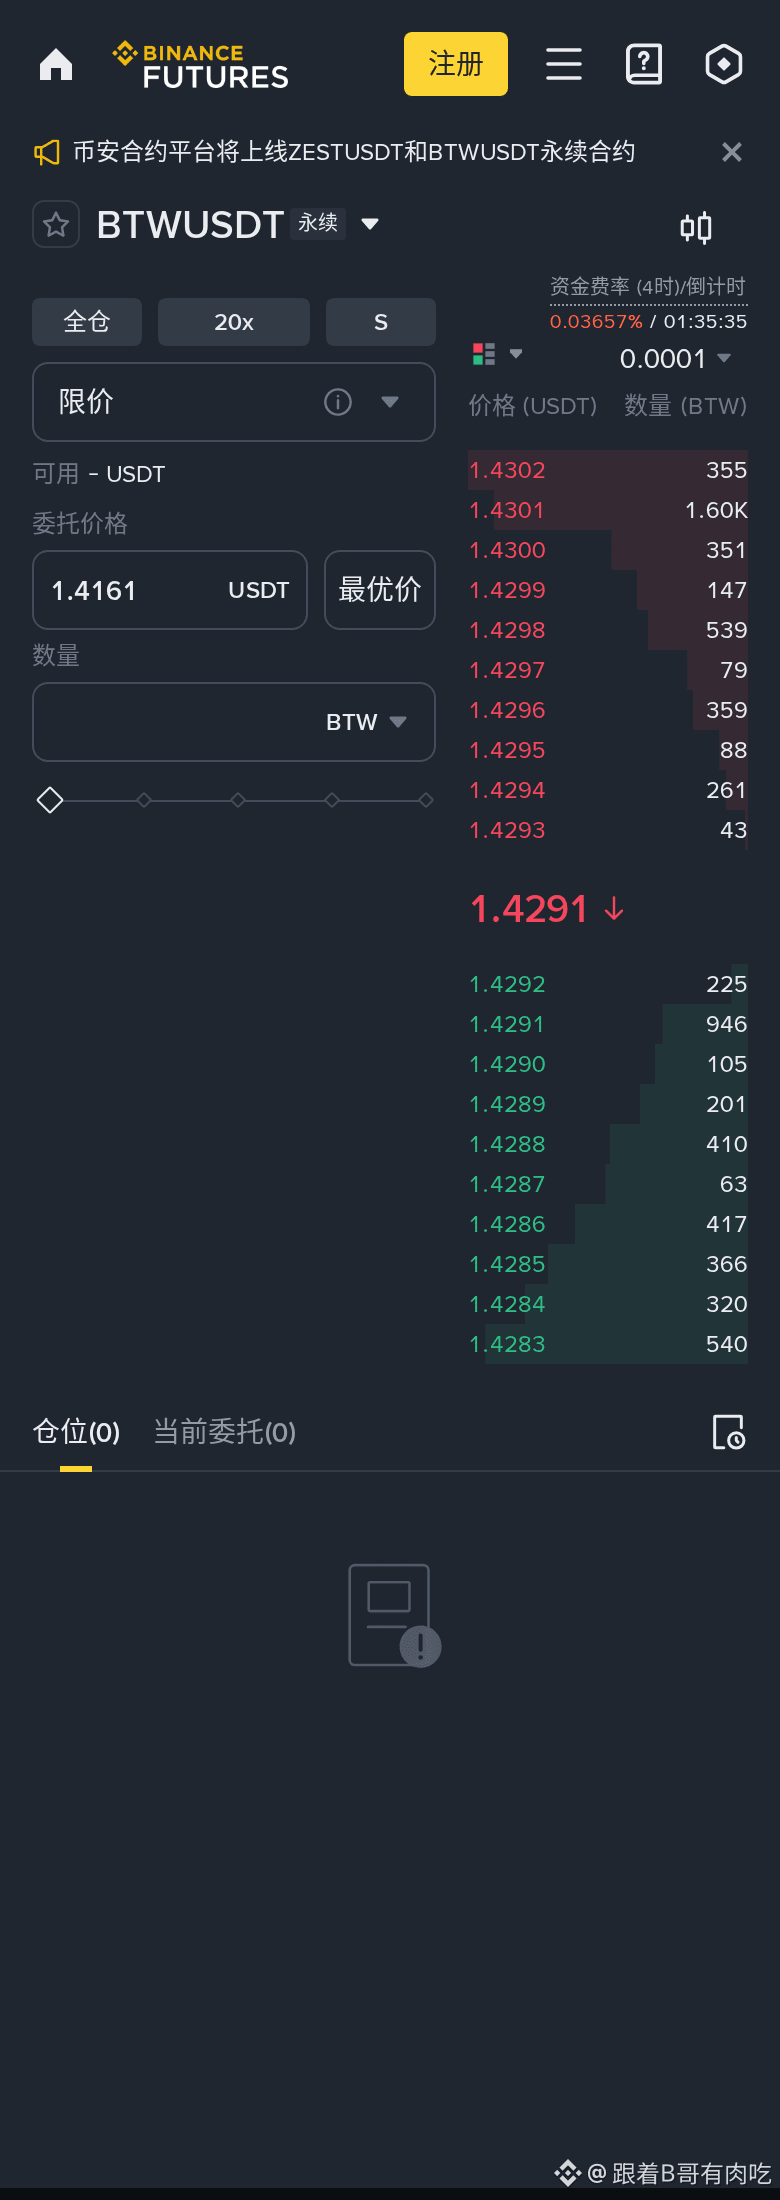
Sell 1.42950000 BTC? Stop loss 1.45996563.
Why? 1.49190000 is a pressure level; if it can't go up, it will move down.
Just focus on the entry price; profits and losses are your responsibility.
$BTW
Sell 1.42950000 BTC? Stop loss 1.45996563.
Why? 1.49190000 is a pressure level; if it can't go up, it will move down.
Just focus on the entry price; profits and losses are your responsibility.
$BTW
Why? 1.49190000 is a pressure level; if it can't go up, it will move down.
Just focus on the entry price; profits and losses are your responsibility.
$BTW
93
·
--
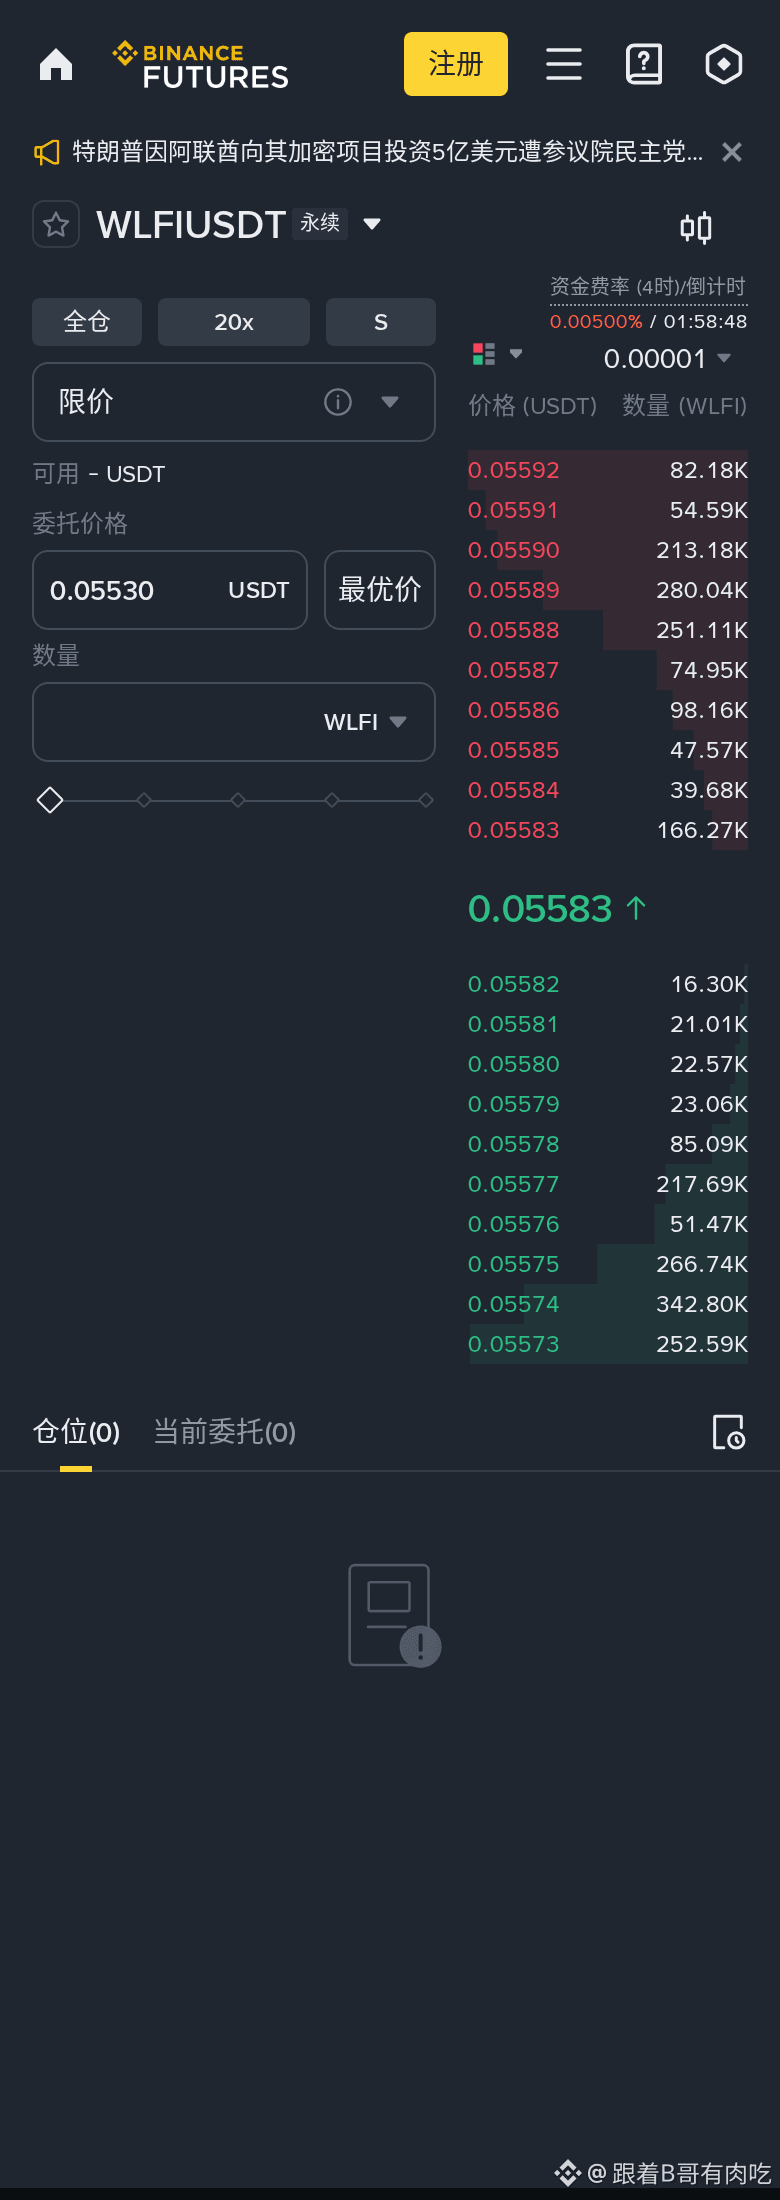
Current price 0.055800—go long WLFI, stop loss 0.054480.
Why? The price is above the 20-day moving average line.
Try a small position first; if it breaks down, accept it.
$WLFI
Current price 0.055800—go long WLFI, stop loss 0.054480.
Why? The price is above the 20-day moving average line.
Try a small position first; if it breaks down, accept it.
$WLFI
Why? The price is above the 20-day moving average line.
Try a small position first; if it breaks down, accept it.
$WLFI
15
·
--
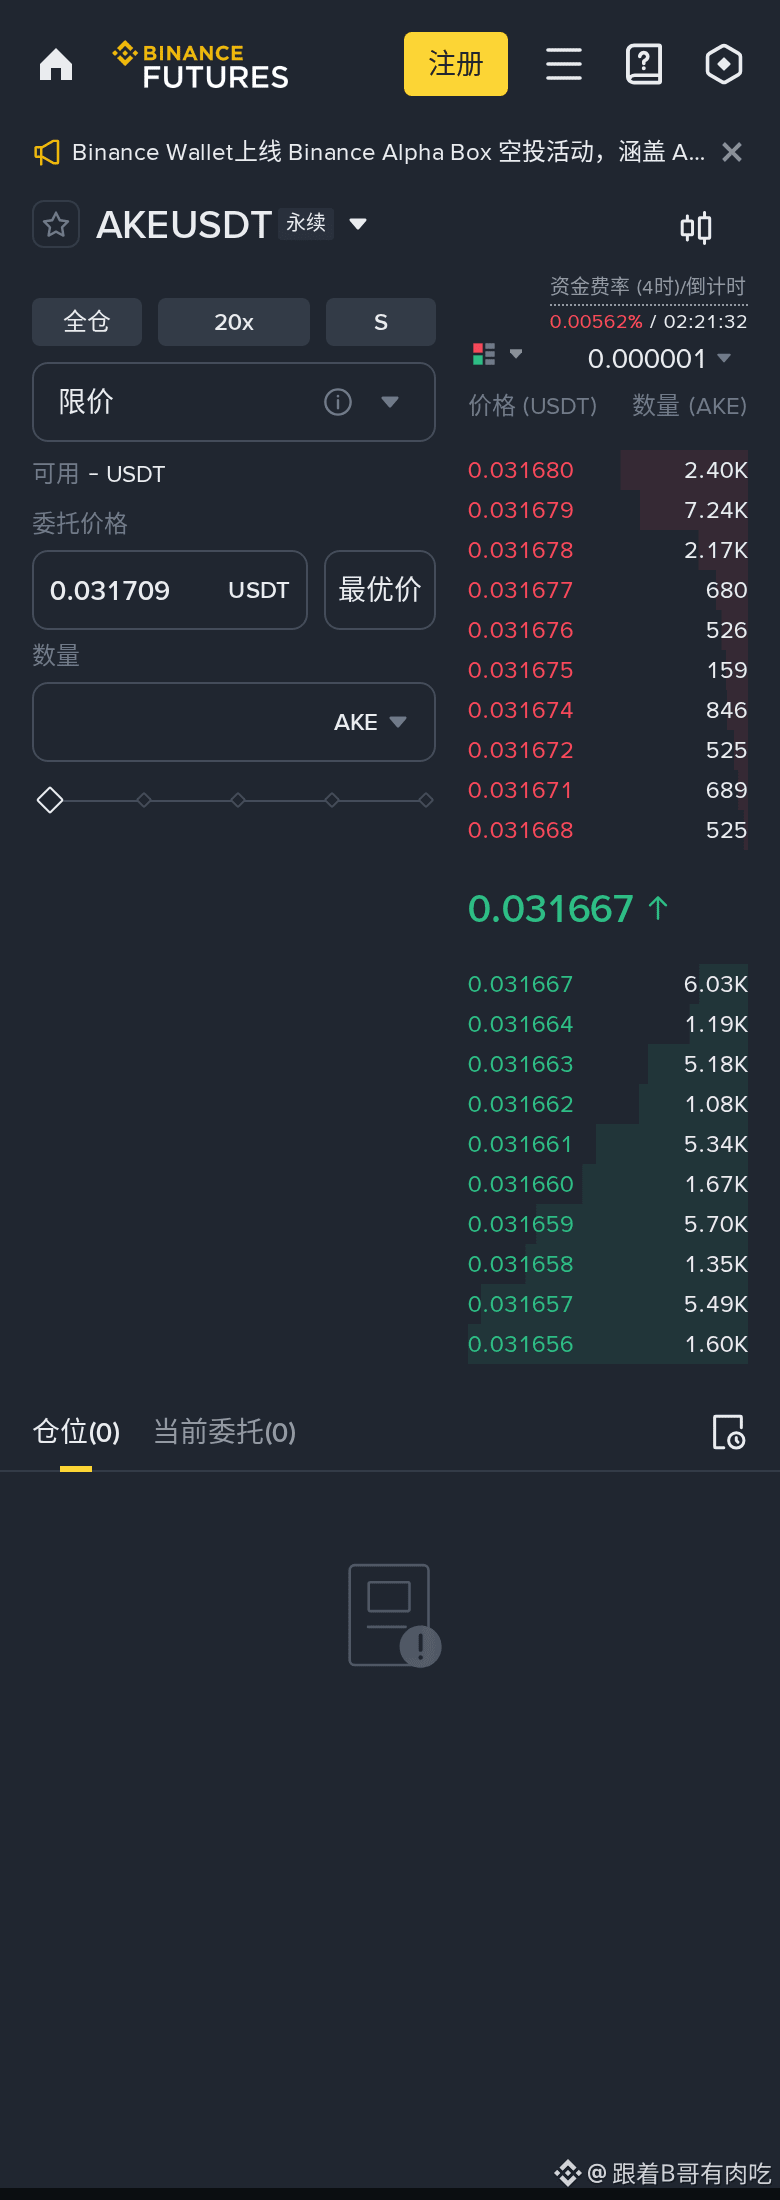
AKE My orders: enter long at 0.031732, loss 0.032294.
Reason: +1.87% in 24h, spiked then pulled back.
Stick to the plan—don’t emotionally add to the position.
$AKE
AKE My orders: enter long at 0.031732, loss 0.032294.
Reason: +1.87% in 24h, spiked then pulled back.
Stick to the plan—don’t emotionally add to the position.
$AKE
Reason: +1.87% in 24h, spiked then pulled back.
Stick to the plan—don’t emotionally add to the position.
$AKE
45
·
--
UNI is rated 30 in my watchlist observation. Chart: it pulled back 5.1% from the high, and a low was defended—forming a hold signal. v6 local low at 8.73 (4 bars ago) held and was not broken, but the current price is 8.935<EMA12 8.97315 and the past 2 consecutive 4H bars have continued to fall. It is still in a downtrend continuation; wait for it to stop falling and turn stronger. Watching doesn’t mean buying immediately—be patient and wait for the signal.
$UNI
UNI is rated 30 in my watchlist observation. Chart: it pulled back 5.1% from the high, and a low was defended—forming a hold signal. v6 local low at 8.73 (4 bars ago) held and was not broken, but the current price is 8.935<EMA12 8.97315 and the past 2 consecutive 4H bars have continued to fall. It is still in a downtrend continuation; wait for it to stop falling and turn stronger. Watching doesn’t mean buying immediately—be patient and wait for the signal.
$UNI
$UNI
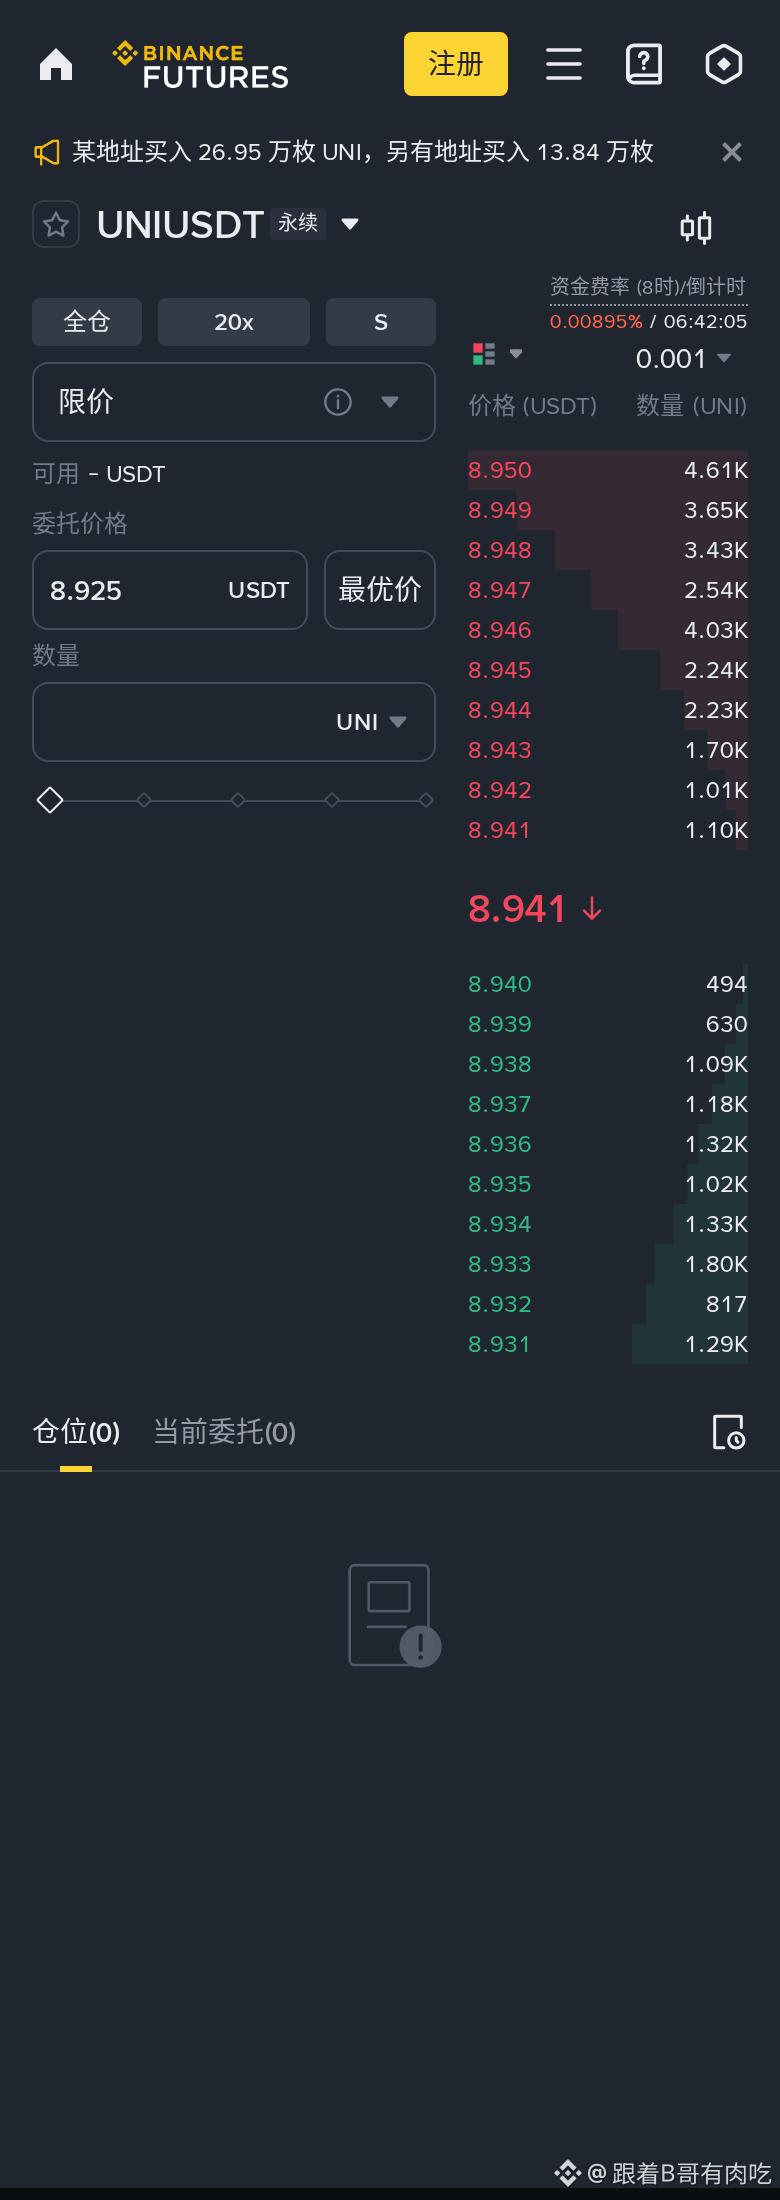
136
·
--
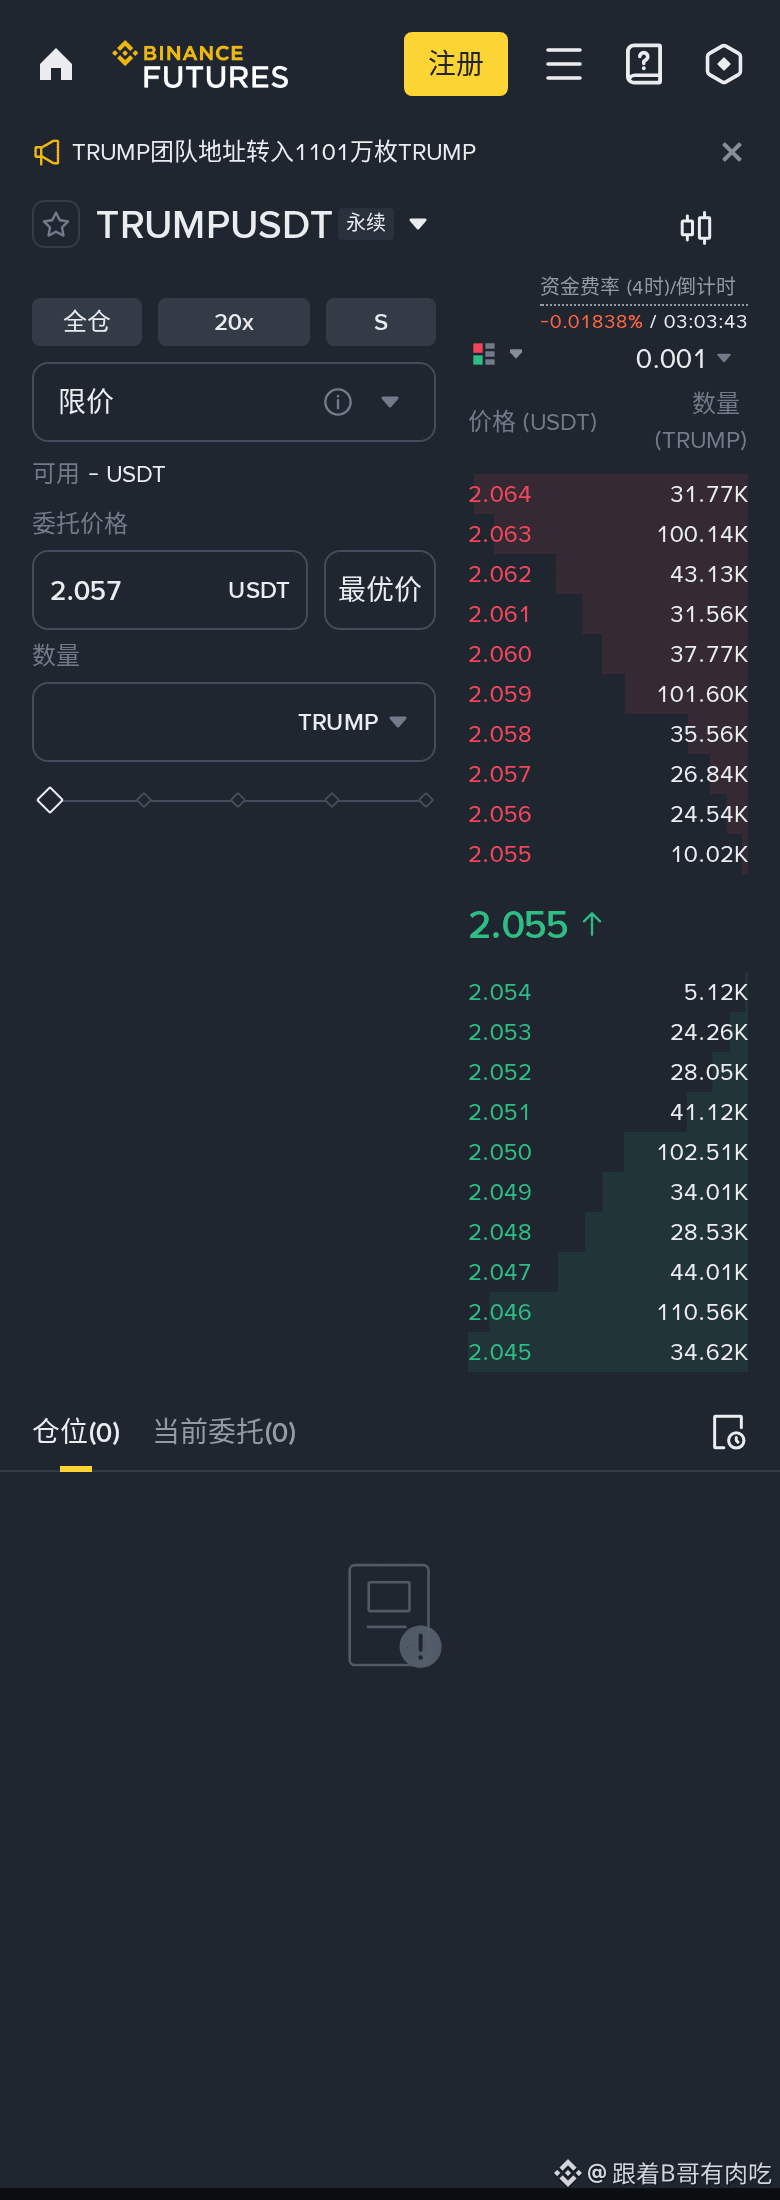
TRUMP now 2.0600, I go short and lose 2.1159—don’t ask why, look at the chart.
Why? 24h -0.19%, spike up and then pull back.
Stop-loss is discipline, not an option.
$TRUMP
TRUMP now 2.0600, I go short and lose 2.1159—don’t ask why, look at the chart.
Why? 24h -0.19%, spike up and then pull back.
Stop-loss is discipline, not an option.
$TRUMP
Why? 24h -0.19%, spike up and then pull back.
Stop-loss is discipline, not an option.
$TRUMP
103
·
--
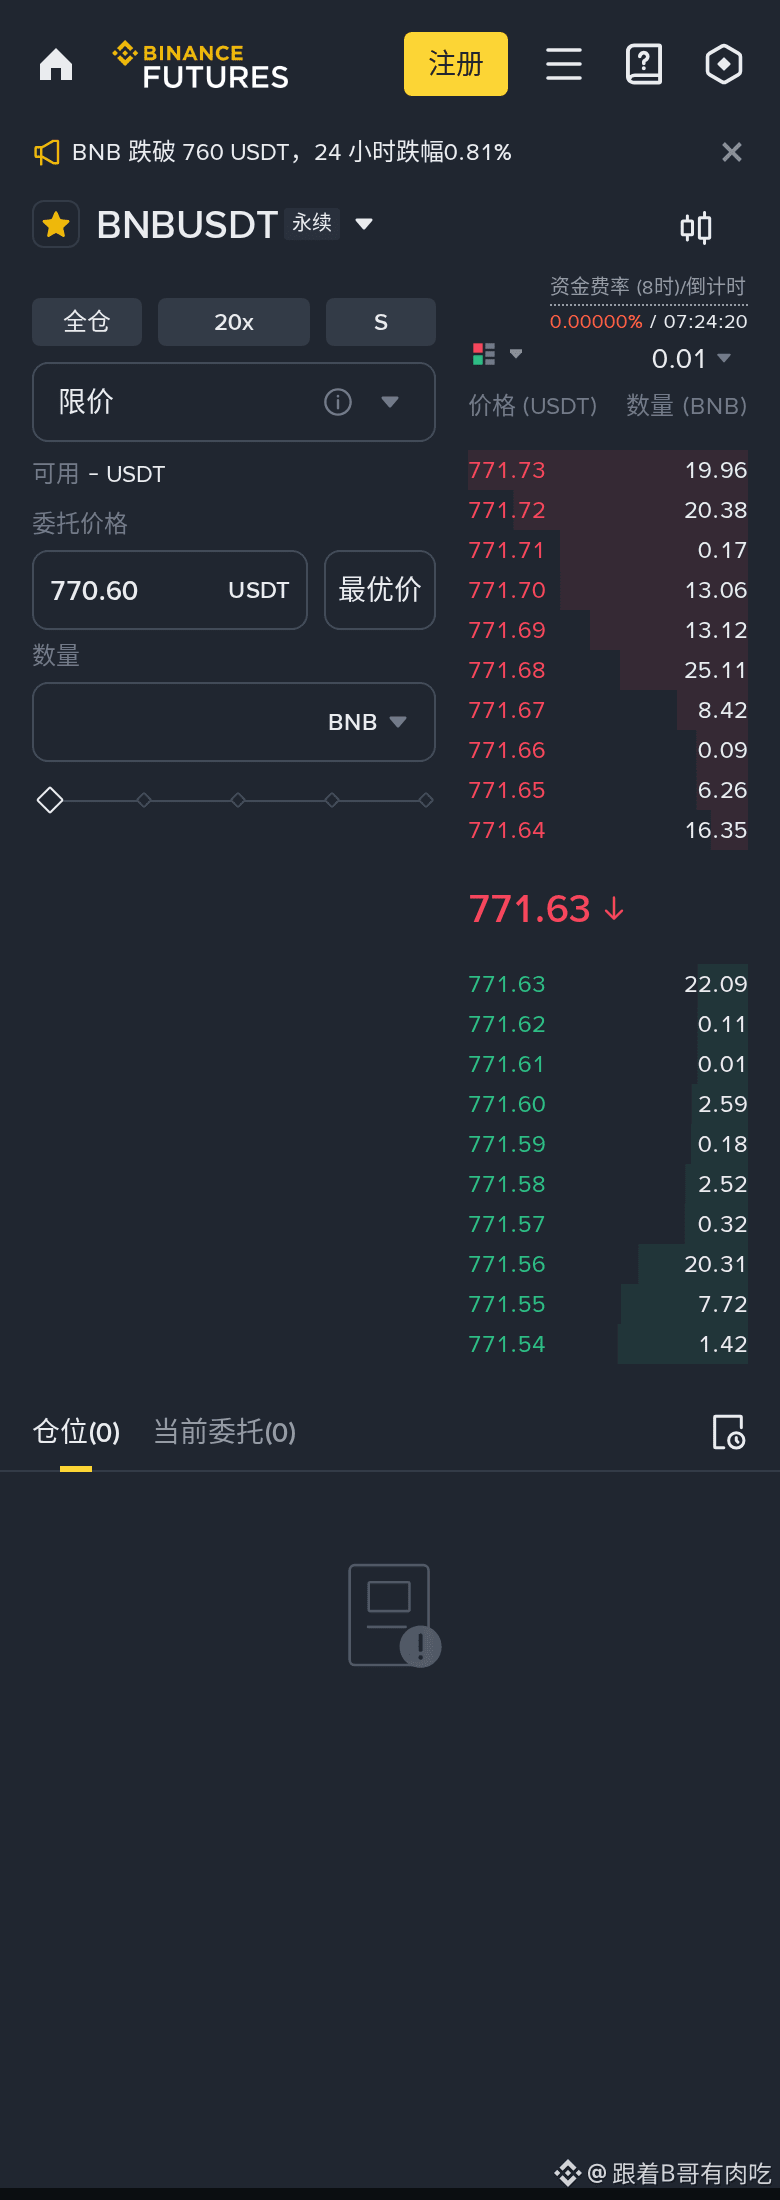
BNB my orders: going long @ 771.20, loss 788.00.
774.48 is a resistance level—if it can’t break through, then it will move down, so I’m standing on this side.
You decide the position size yourself; I only give you the levels.
$BNB
BNB my orders: going long @ 771.20, loss 788.00.
774.48 is a resistance level—if it can’t break through, then it will move down, so I’m standing on this side.
You decide the position size yourself; I only give you the levels.
$BNB
774.48 is a resistance level—if it can’t break through, then it will move down, so I’m standing on this side.
You decide the position size yourself; I only give you the levels.
$BNB
88
·
--
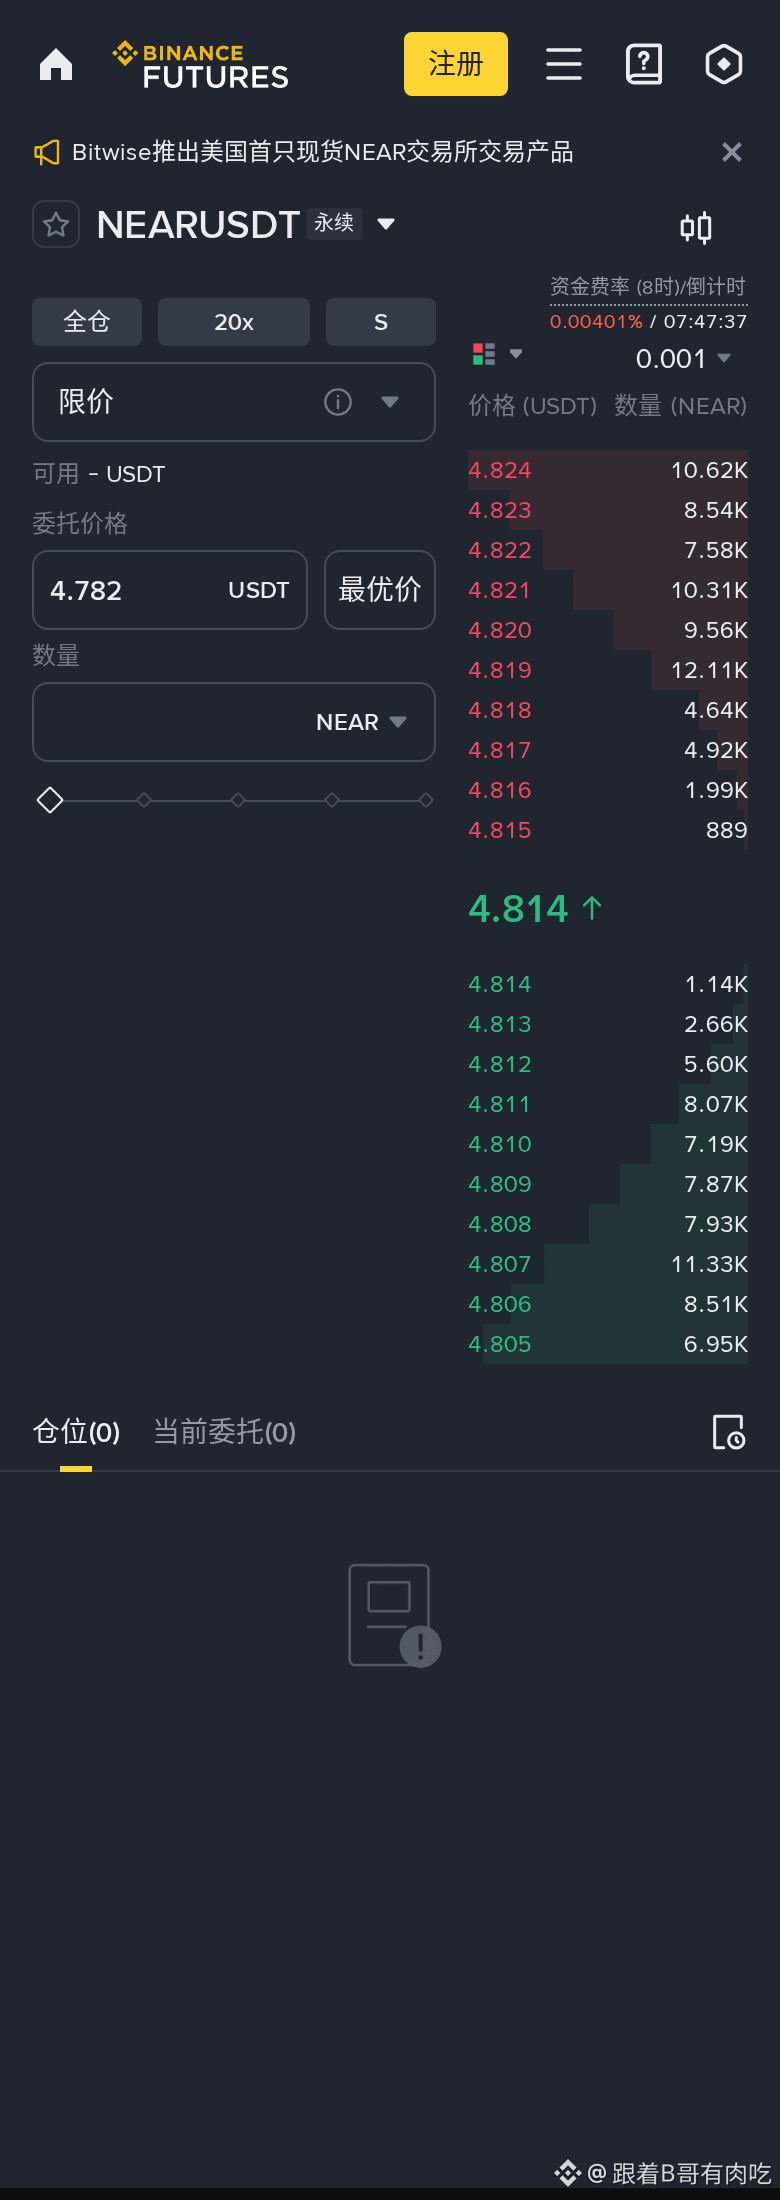
First the conclusion: Go long on NEAR, enter at 4.8170, and stop loss at 4.6468.
I only look at one thing: 4.7420 is support; if it falls to that area, someone is likely to buy it up.
Stop loss is discipline, not an option.
$NEAR
First the conclusion: Go long on NEAR, enter at 4.8170, and stop loss at 4.6468.
I only look at one thing: 4.7420 is support; if it falls to that area, someone is likely to buy it up.
Stop loss is discipline, not an option.
$NEAR
I only look at one thing: 4.7420 is support; if it falls to that area, someone is likely to buy it up.
Stop loss is discipline, not an option.
$NEAR
2
1
139
·
--
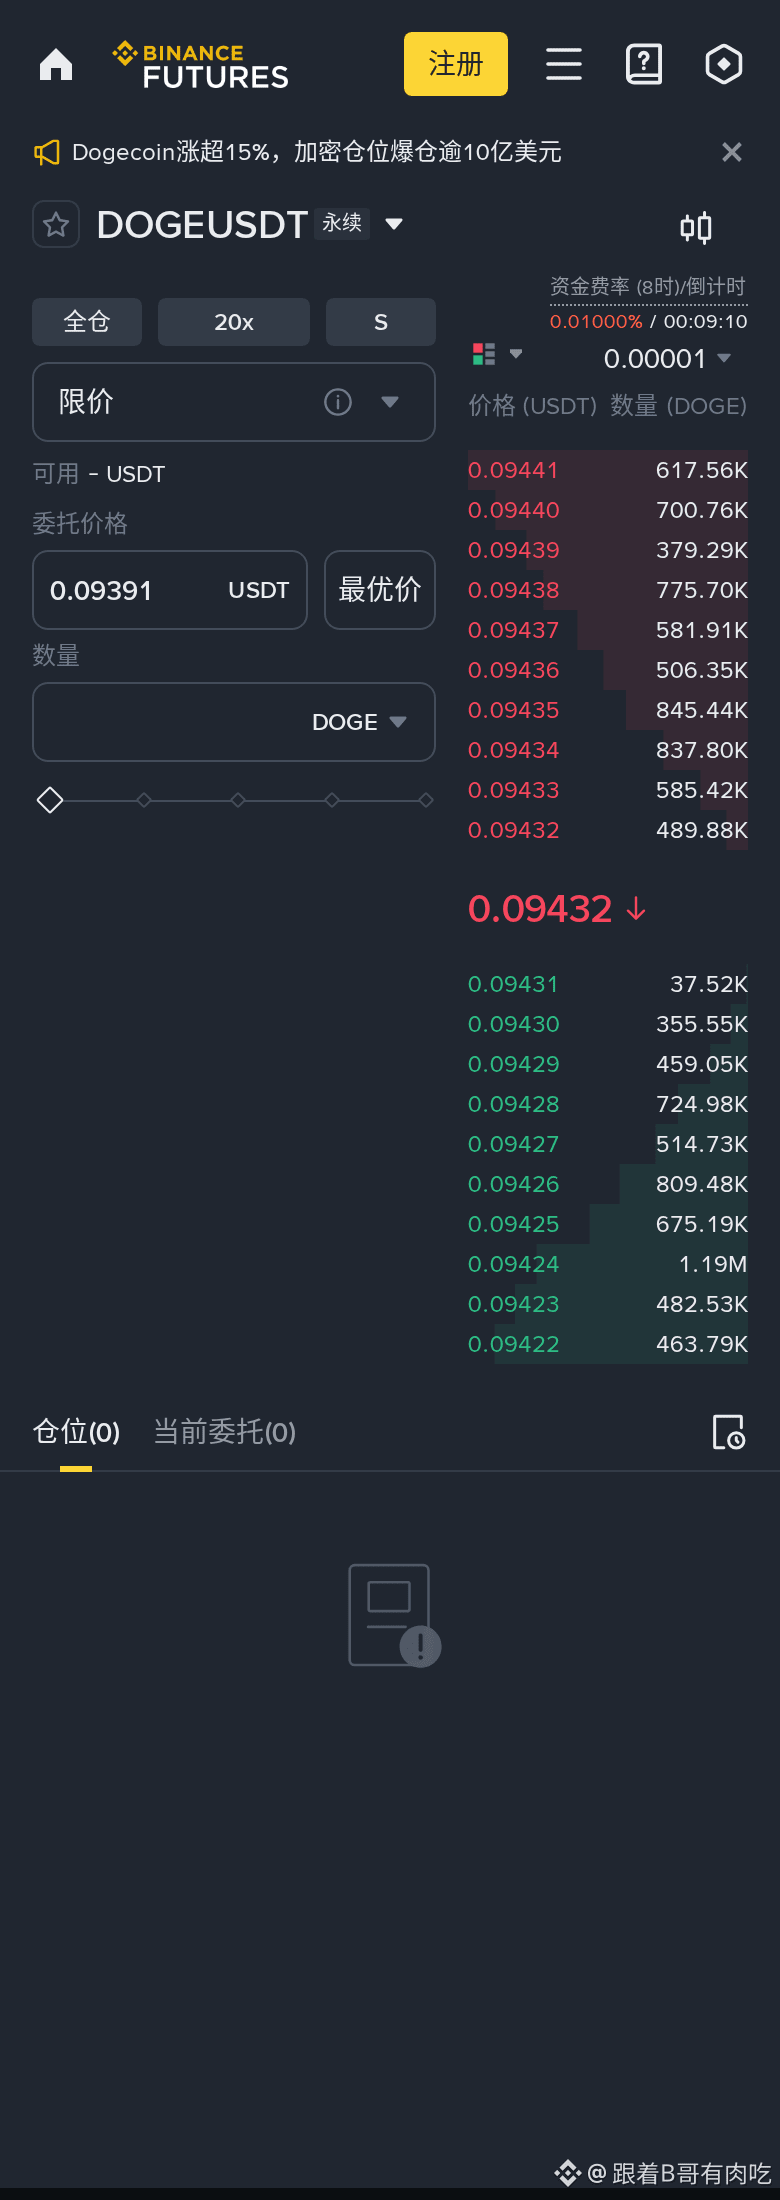
Popular science on my “ambush” strategy! “Ambush” isn’t bargain-hunting—it’s only when both conditions are met: “breakout volume and price standing above the daily EMA200 + weekly is in a bullish trend.” Then I act. For each coin, it won’t exceed 1/5 of the total position; the initial stop-loss is -8%. If the risk-reward ratio isn’t at least 1.5, I don’t do it. This is my own experience—not necessarily correct!
$DOGE
Popular science on my “ambush” strategy! “Ambush” isn’t bargain-hunting—it’s only when both conditions are met: “breakout volume and price standing above the daily EMA200 + weekly is in a bullish trend.” Then I act. For each coin, it won’t exceed 1/5 of the total position; the initial stop-loss is -8%. If the risk-reward ratio isn’t at least 1.5, I don’t do it. This is my own experience—not necessarily correct!
$DOGE
$DOGE
32
·
--
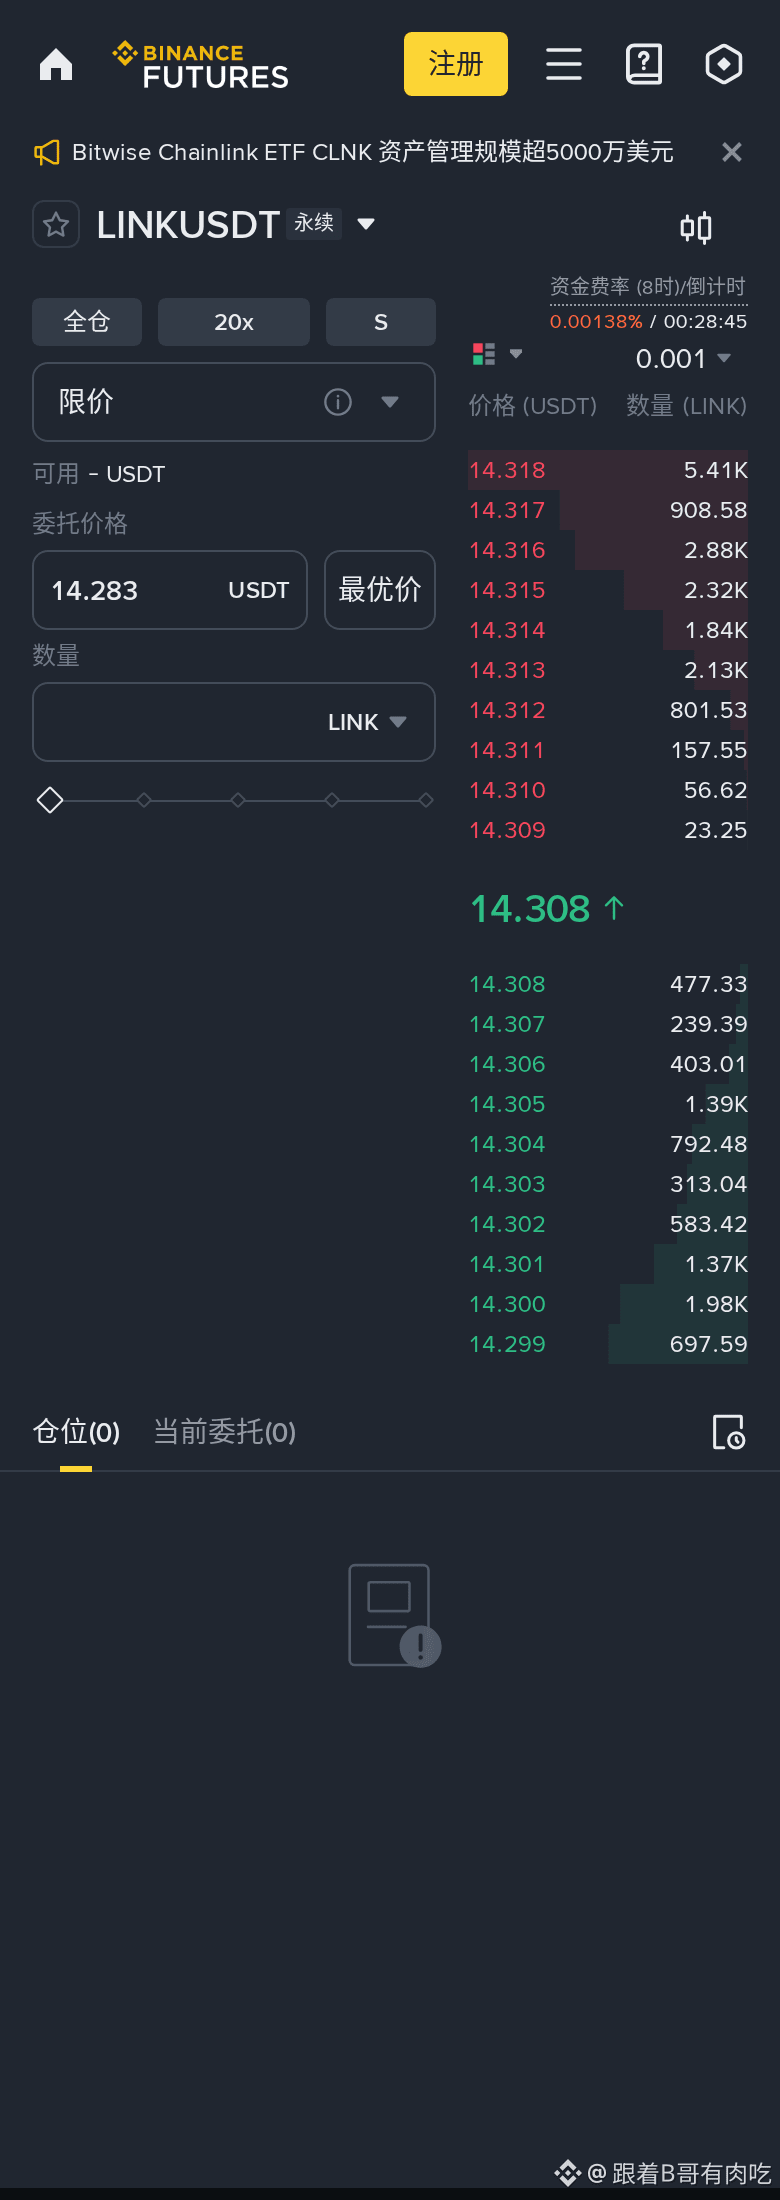
Current price 14.32 go long LINK, stop loss 13.77—my view is very clear.
24h -0.56%. The pullback is already in place. That’s it.
You decide the position sizing—I only provide the levels.
$LINK
Current price 14.32 go long LINK, stop loss 13.77—my view is very clear.
24h -0.56%. The pullback is already in place. That’s it.
You decide the position sizing—I only provide the levels.
$LINK
24h -0.56%. The pullback is already in place. That’s it.
You decide the position sizing—I only provide the levels.
$LINK
17
·
--
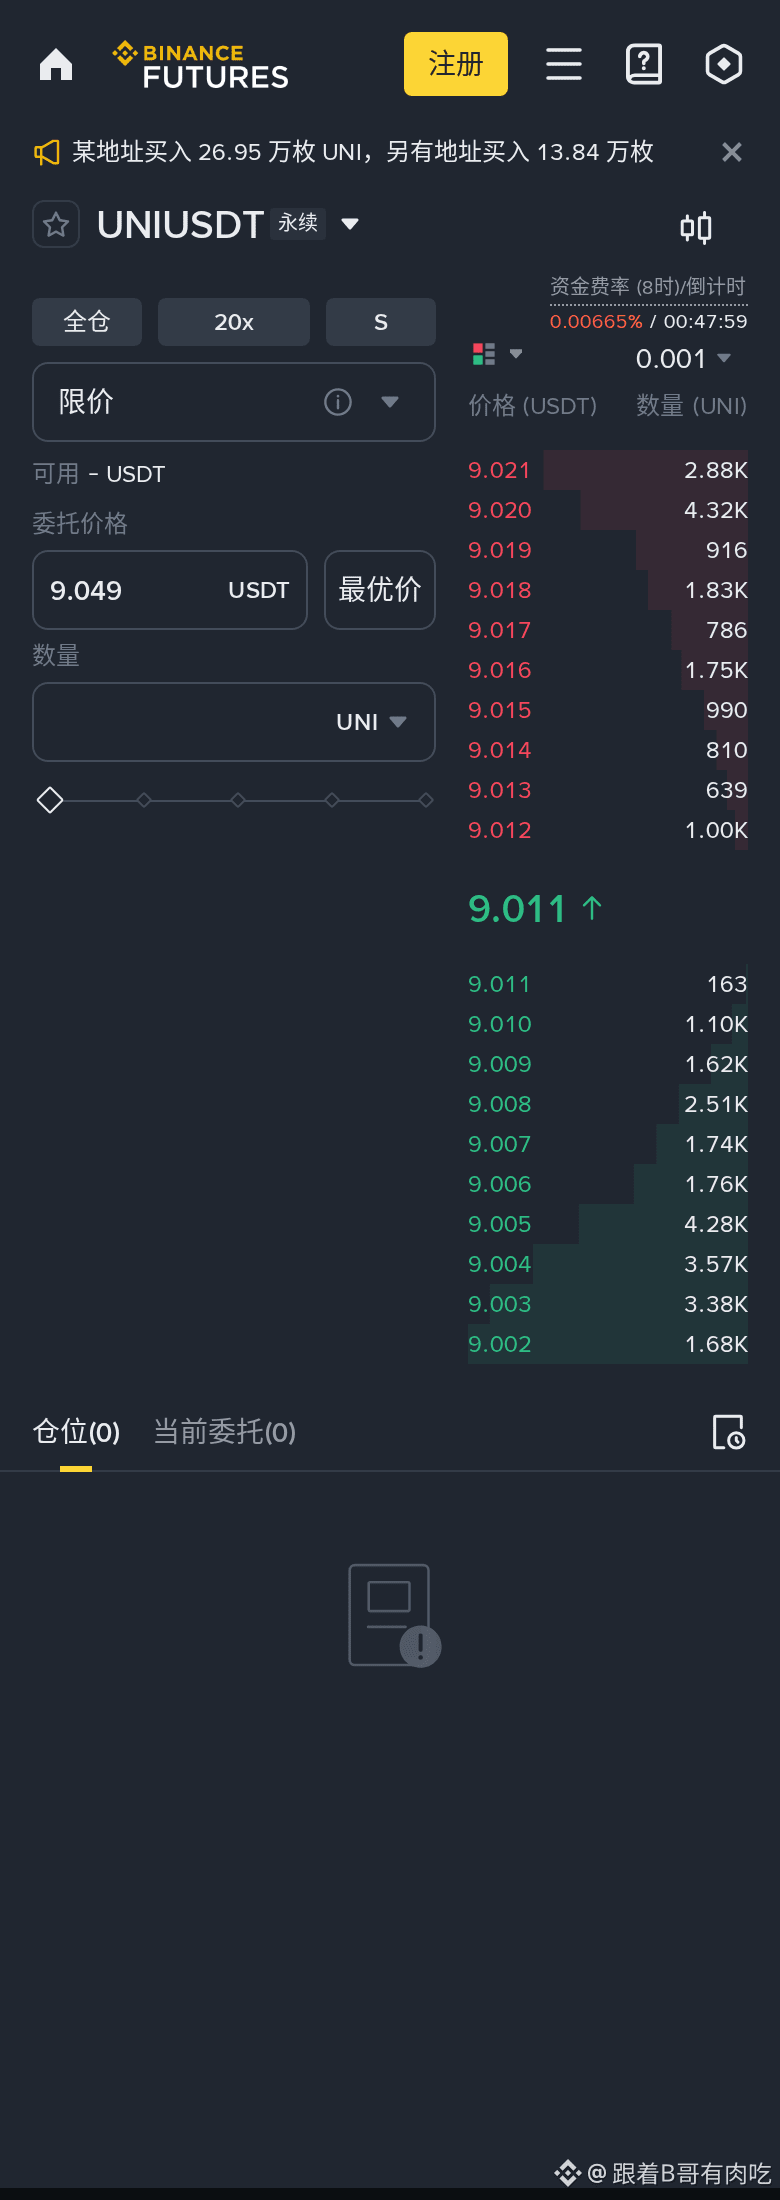
UNI is buying at 9.0090, stop loss at 8.8232.
The reason I’m doing this: 8.7300 is support—if it drops near there, people are taking bids.
Stick to the plan, don’t emotion-chase and add more.
$UNI
UNI is buying at 9.0090, stop loss at 8.8232.
The reason I’m doing this: 8.7300 is support—if it drops near there, people are taking bids.
Stick to the plan, don’t emotion-chase and add more.
$UNI
The reason I’m doing this: 8.7300 is support—if it drops near there, people are taking bids.
Stick to the plan, don’t emotion-chase and add more.
$UNI
26
·
--
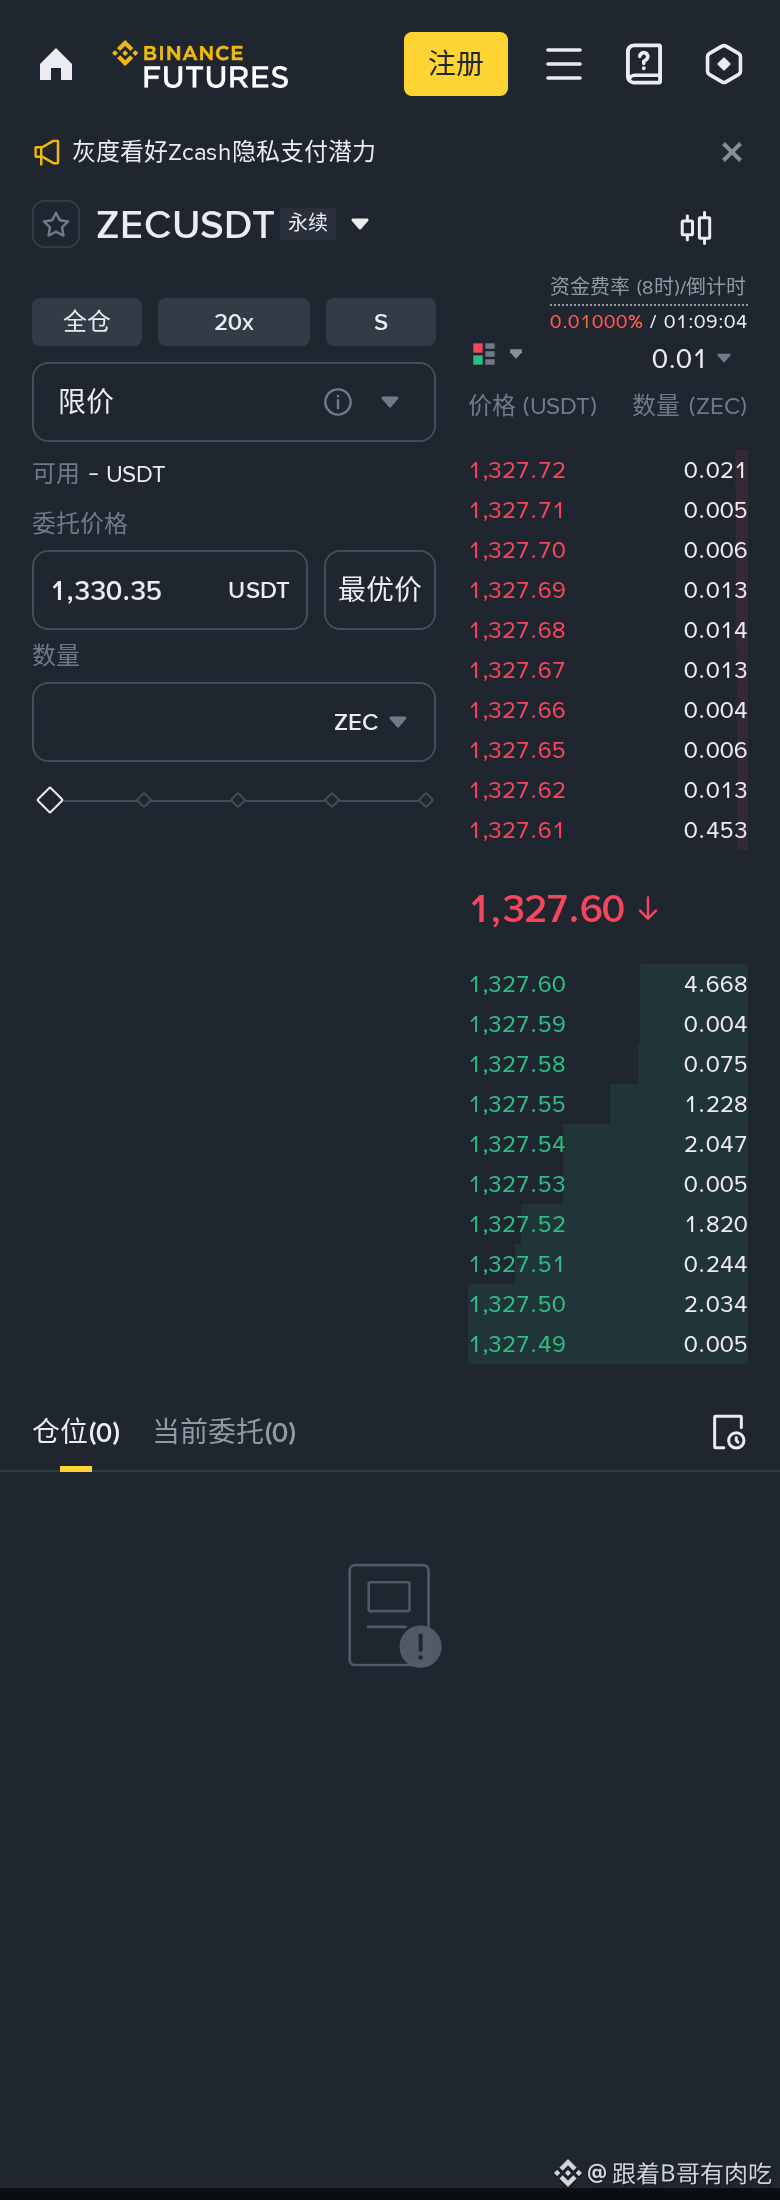
ZEC I entered at 1326.70; 1356.59 is my bottom line.
1449.75 is the pressure level. If it can’t go up, then it will move downward.
Follow the plan—don’t emotionally add more.
$ZEC
ZEC I entered at 1326.70; 1356.59 is my bottom line.
1449.75 is the pressure level. If it can’t go up, then it will move downward.
Follow the plan—don’t emotionally add more.
$ZEC
1449.75 is the pressure level. If it can’t go up, then it will move downward.
Follow the plan—don’t emotionally add more.
$ZEC
115
·
--
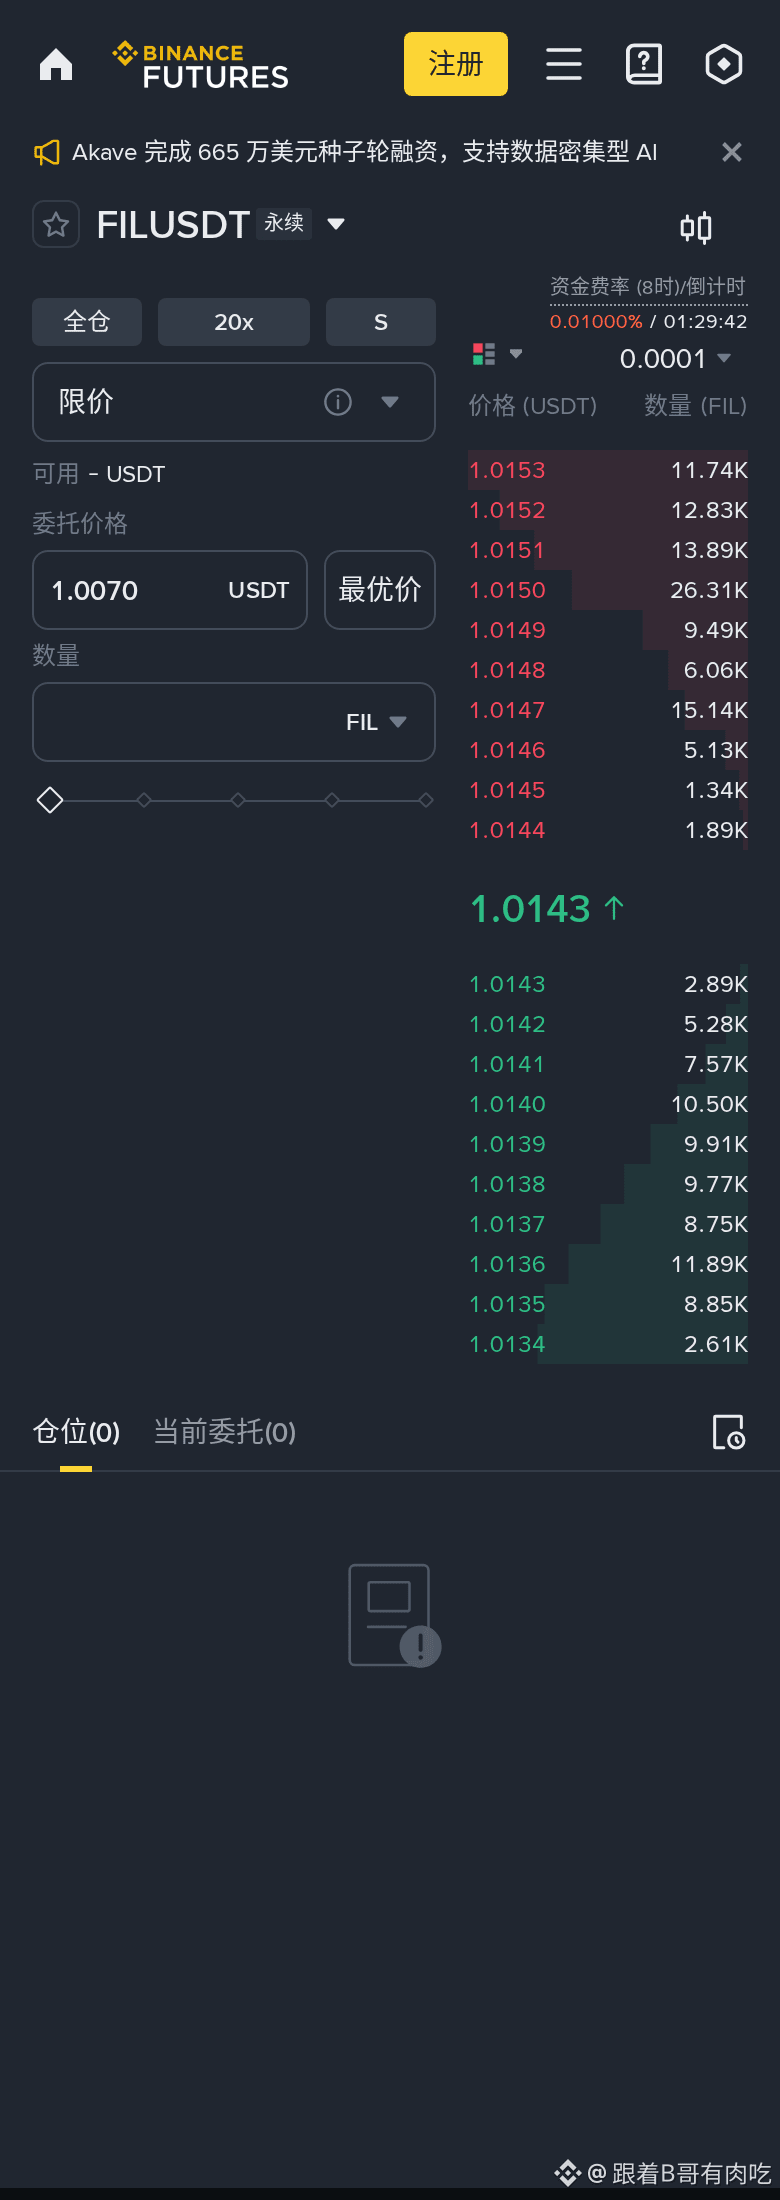
For that much FIL, at 1.0141 this price—I accept it if it breaks below 0.9877.
The logic isn’t complicated: 24h -2.36%, the pullback is in place.
Only do it if losses are controllable—don’t go all-in.
$FIL
For that much FIL, at 1.0141 this price—I accept it if it breaks below 0.9877.
The logic isn’t complicated: 24h -2.36%, the pullback is in place.
Only do it if losses are controllable—don’t go all-in.
$FIL
The logic isn’t complicated: 24h -2.36%, the pullback is in place.
Only do it if losses are controllable—don’t go all-in.
$FIL
58
·
--
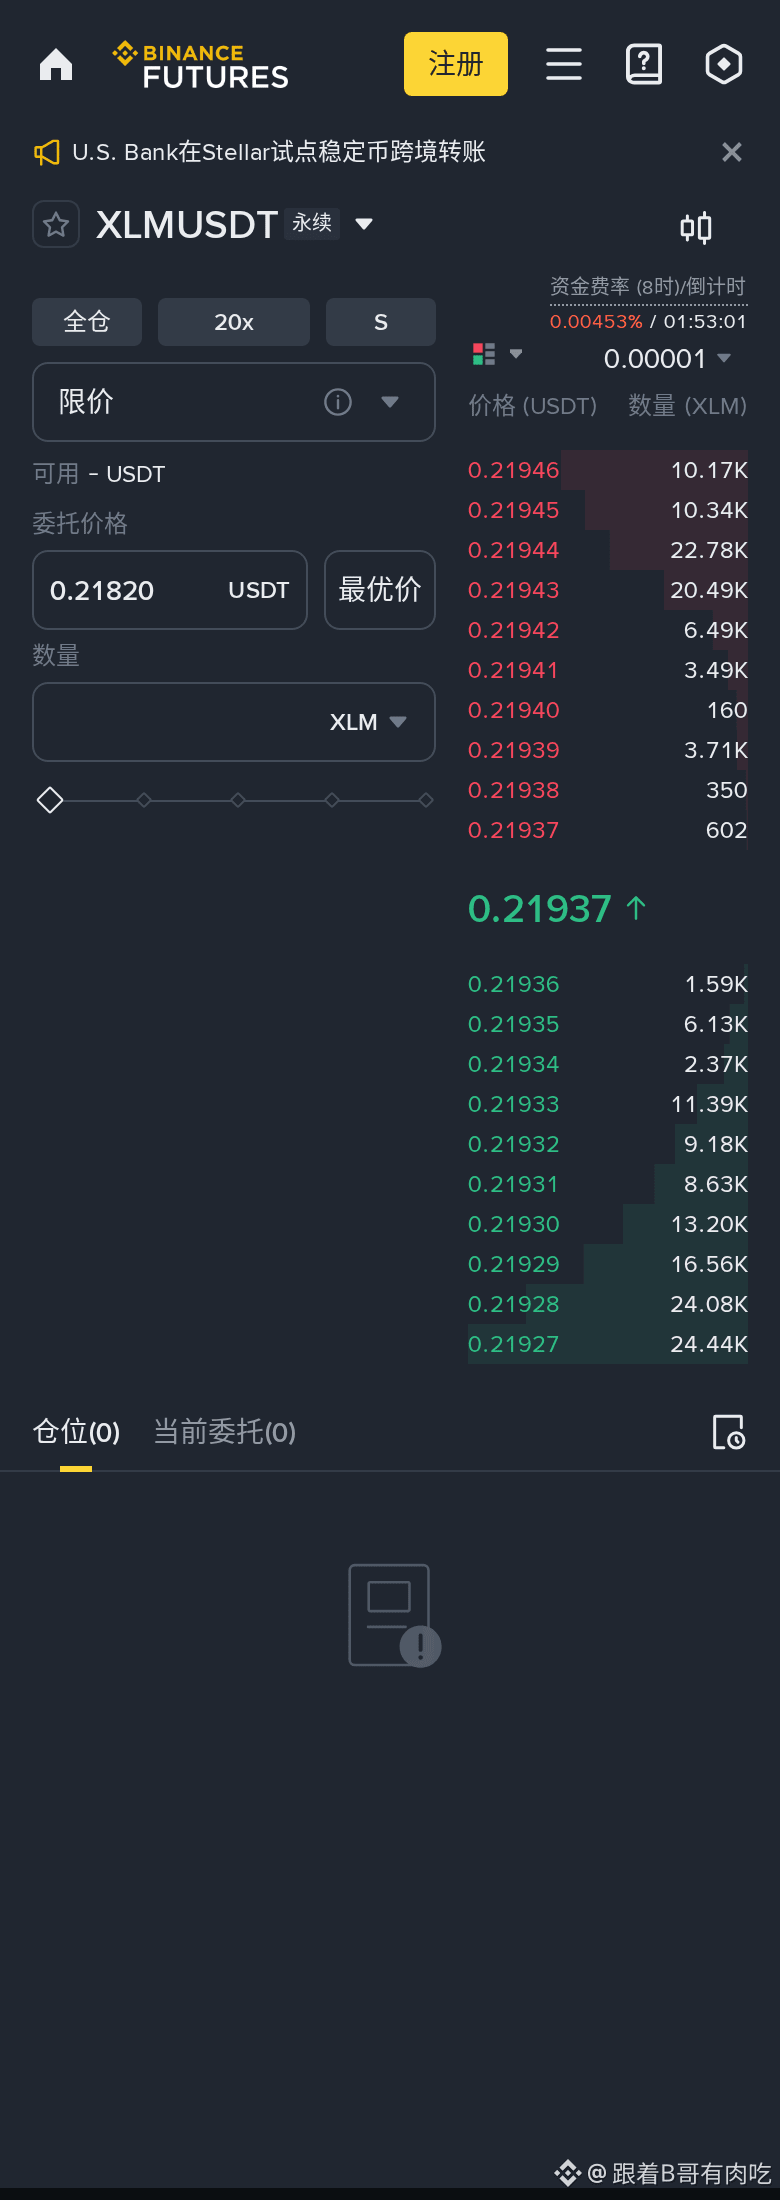
XLM shows a “can’t fall any further” signal, with a score of 53. Focus is on the 1h timeframe. “Can’t fall further” usually means selling pressure has dried up and a second pullback fails to break, which is a sign of stabilization. The chart is interesting—make a note of this.
$XLM
XLM shows a “can’t fall any further” signal, with a score of 53. Focus is on the 1h timeframe. “Can’t fall further” usually means selling pressure has dried up and a second pullback fails to break, which is a sign of stabilization. The chart is interesting—make a note of this.
$XLM
$XLM
10
·
--
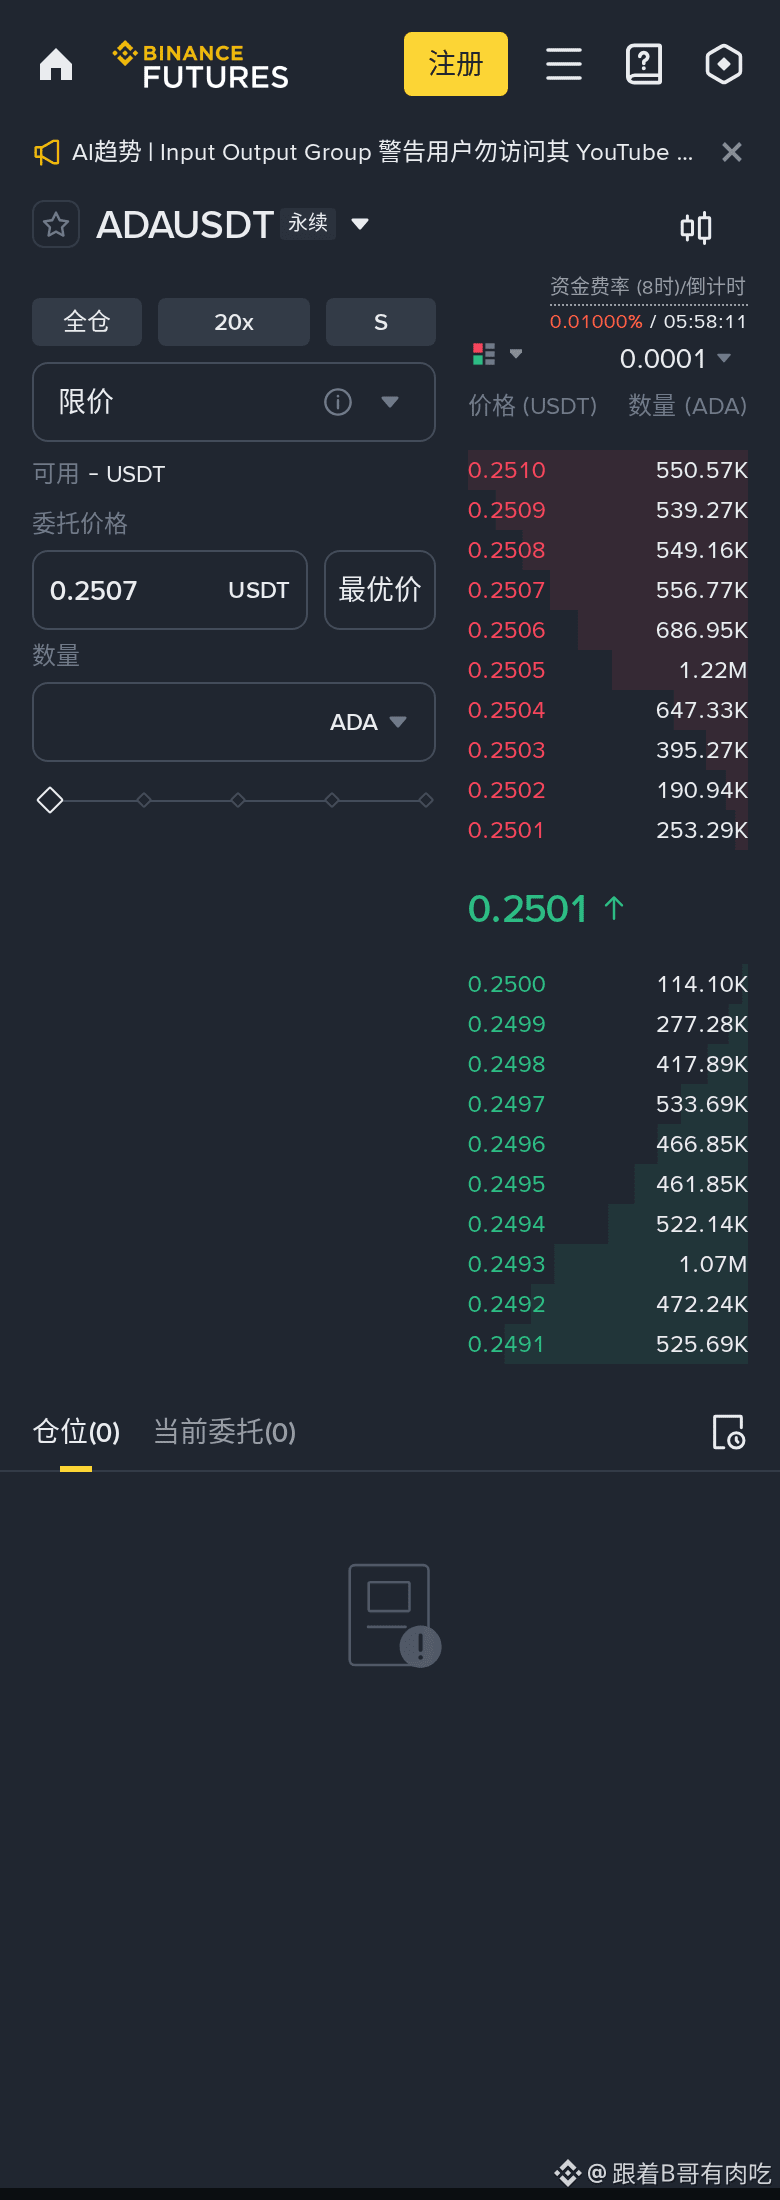
I saw several bloggers discussing ADA, and the views are different. Here’s what I’m saying:
【Long】current price 0.249700, with the rationale below.
No beating around the bush: long at the current price 0.249700; stop-loss at 0.243548—if it breaks down below, admit the mistake.
· Support at 0.2414 below; if it drops there, people are likely to pick it up.
· Resistance at 0.2545 above; if it rises there, it’s likely to be sold off.
How to do it (Long):
· Entry: long directly at 0.249700
· Loss cut: 0.243548 (lose 2.5%, admit it—don’t hold and resist)
· Take profit: 0.268155 (first target; when reached, reduce by half first)
· Position sizing: try with 2–3% of your funds first; don’t go all-in
(Win rate is based on historical data and is not guaranteed; when copying trades, you must use stop-loss and control position size)
I stared at it all night, and this is all I’ve got.
$ADA is currently 0.2497. At this 0.2497 level you definitely need to go long. The moving averages are still in a bullish alignment; pullbacks are an opportunity. The fastest it should start in the next 2–3 weeks. Target: 0.2914. Defense: 0.2435. If it breaks, don’t get stuck—move on.
The price is still above the 20-day line at 0.2480, so the trend hasn’t turned bad. The short-term range is very clear: support 0.2414, resistance 0.2545. For longs, use support as the line of defense.
24h trading volume: 37.0M. The volume is still there, which suggests the money hasn’t left.
I personally entered first with a starter position, set stop-loss at 0.2435, and the rest is up to discipline.
When the first target of 0.2545 is reached, take some off—don’t expect it to go to the moon in one shot. Money is made when you bank profits.
24h: +1.4%.
Let’s do the numbers: down to support 0.2414 is 3.3%, up to resistance 0.2545 is 1.9%. At this spot, the upside range isn’t enough to cover the risk—don’t take action here.
If 0.2545 breaks out with increased volume, then we’d look higher to 0.2581—that would be the next stop.
Different opinions, say them freely—I’m not going to eat anyone.
【Live Scan · $ADA】(1-hour main line + 4H filter)
4H trend: Strong Bullish | 1H pattern: not fully formed yet (keep waiting)
Long/Short score: 9 points (bullish alignment +3 | MACD bullish +1 | above zero-axis +1 | RSI stabilizing +1 | close to EMA20 +1 | bottom-picking signal +2)
Current price 0.2497 RSI 61.88 Support 0.2414 / Resistance 0.2545
Conclusion: Long score is dominant (pattern not fully confirmed) → Bias bullish; wait for a proper pullback before going long
$ADA
I saw several bloggers discussing ADA, and the views are different. Here’s what I’m saying:
【Long】current price 0.249700, with the rationale below.
No beating around the bush: long at the current price 0.249700; stop-loss at 0.243548—if it breaks down below, admit the mistake.
· Support at 0.2414 below; if it drops there, people are likely to pick it up.
· Resistance at 0.2545 above; if it rises there, it’s likely to be sold off.
How to do it (Long):
· Entry: long directly at 0.249700
· Loss cut: 0.243548 (lose 2.5%, admit it—don’t hold and resist)
· Take profit: 0.268155 (first target; when reached, reduce by half first)
· Position sizing: try with 2–3% of your funds first; don’t go all-in
(Win rate is based on historical data and is not guaranteed; when copying trades, you must use stop-loss and control position size)
I stared at it all night, and this is all I’ve got.
$ADA is currently 0.2497. At this 0.2497 level you definitely need to go long. The moving averages are still in a bullish alignment; pullbacks are an opportunity. The fastest it should start in the next 2–3 weeks. Target: 0.2914. Defense: 0.2435. If it breaks, don’t get stuck—move on.
The price is still above the 20-day line at 0.2480, so the trend hasn’t turned bad. The short-term range is very clear: support 0.2414, resistance 0.2545. For longs, use support as the line of defense.
24h trading volume: 37.0M. The volume is still there, which suggests the money hasn’t left.
I personally entered first with a starter position, set stop-loss at 0.2435, and the rest is up to discipline.
When the first target of 0.2545 is reached, take some off—don’t expect it to go to the moon in one shot. Money is made when you bank profits.
24h: +1.4%.
Let’s do the numbers: down to support 0.2414 is 3.3%, up to resistance 0.2545 is 1.9%. At this spot, the upside range isn’t enough to cover the risk—don’t take action here.
If 0.2545 breaks out with increased volume, then we’d look higher to 0.2581—that would be the next stop.
Different opinions, say them freely—I’m not going to eat anyone.
【Live Scan · $ADA 】(1-hour main line + 4H filter)
4H trend: Strong Bullish | 1H pattern: not fully formed yet (keep waiting)
Long/Short score: 9 points (bullish alignment +3 | MACD bullish +1 | above zero-axis +1 | RSI stabilizing +1 | close to EMA20 +1 | bottom-picking signal +2)
Current price 0.2497 RSI 61.88 Support 0.2414 / Resistance 0.2545
Conclusion: Long score is dominant (pattern not fully confirmed) → Bias bullish; wait for a proper pullback before going long
$ADA
【Long】current price 0.249700, with the rationale below.
No beating around the bush: long at the current price 0.249700; stop-loss at 0.243548—if it breaks down below, admit the mistake.
· Support at 0.2414 below; if it drops there, people are likely to pick it up.
· Resistance at 0.2545 above; if it rises there, it’s likely to be sold off.
How to do it (Long):
· Entry: long directly at 0.249700
· Loss cut: 0.243548 (lose 2.5%, admit it—don’t hold and resist)
· Take profit: 0.268155 (first target; when reached, reduce by half first)
· Position sizing: try with 2–3% of your funds first; don’t go all-in
(Win rate is based on historical data and is not guaranteed; when copying trades, you must use stop-loss and control position size)
I stared at it all night, and this is all I’ve got.
$ADA is currently 0.2497. At this 0.2497 level you definitely need to go long. The moving averages are still in a bullish alignment; pullbacks are an opportunity. The fastest it should start in the next 2–3 weeks. Target: 0.2914. Defense: 0.2435. If it breaks, don’t get stuck—move on.
The price is still above the 20-day line at 0.2480, so the trend hasn’t turned bad. The short-term range is very clear: support 0.2414, resistance 0.2545. For longs, use support as the line of defense.
24h trading volume: 37.0M. The volume is still there, which suggests the money hasn’t left.
I personally entered first with a starter position, set stop-loss at 0.2435, and the rest is up to discipline.
When the first target of 0.2545 is reached, take some off—don’t expect it to go to the moon in one shot. Money is made when you bank profits.
24h: +1.4%.
Let’s do the numbers: down to support 0.2414 is 3.3%, up to resistance 0.2545 is 1.9%. At this spot, the upside range isn’t enough to cover the risk—don’t take action here.
If 0.2545 breaks out with increased volume, then we’d look higher to 0.2581—that would be the next stop.
Different opinions, say them freely—I’m not going to eat anyone.
【Live Scan · $ADA 】(1-hour main line + 4H filter)
4H trend: Strong Bullish | 1H pattern: not fully formed yet (keep waiting)
Long/Short score: 9 points (bullish alignment +3 | MACD bullish +1 | above zero-axis +1 | RSI stabilizing +1 | close to EMA20 +1 | bottom-picking signal +2)
Current price 0.2497 RSI 61.88 Support 0.2414 / Resistance 0.2545
Conclusion: Long score is dominant (pattern not fully confirmed) → Bias bullish; wait for a proper pullback before going long
$ADA
31
·
--
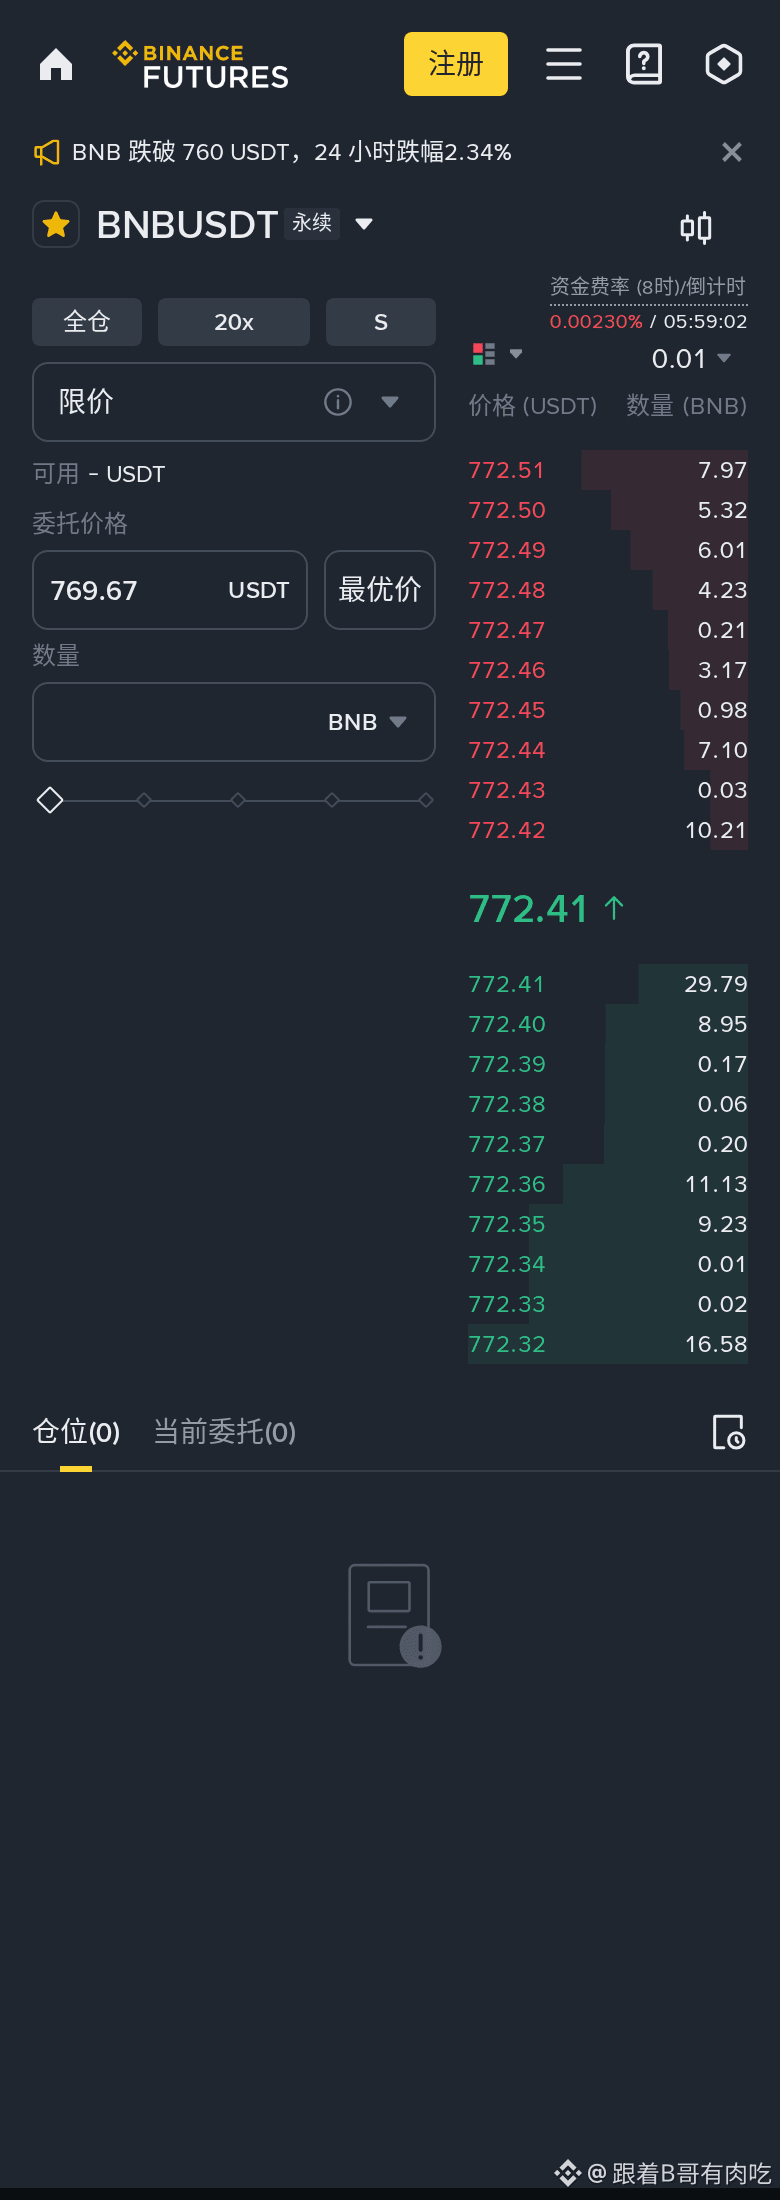
Today I’m using BNB to demonstrate: how to turn direction into orders
【Go Long】Current price 772.66
Key points first: with the current price 772.66, go long directly; set stop loss at 756.58—if it breaks down, admit you’re wrong.
· Support at 763.02 below: if it drops near there, someone will take it; Resistance at 774.48 above: if it rises near there, it’s easy to get sold
How to do it (Go Long):
· Entry: Go long directly at 772.50
· Stop loss: 756.58 (If you’re down 2.1%, accept the loss—don’t hold on)
· Take profit: 820.27 (First target; when it hits, reduce by half first)
· Position: Use only 2–3% of your money to test first; don’t go all-in
(Win rate is based on historical stats and isn’t guaranteed; if you copy trades, always use stop loss and control position size)
In a bull market, the most expensive thing isn’t money—it’s the chips. $BNB current price 772.66. Many people will run after a small rise; once they run, they find they can’t get a fill again. My approach is simple: build a base position first, then add again around 772.66. Stop loss at 756.58, and leave the rest to time.
Trading volume: 67.7M—this volume can support a move.
I personally went in with a base position first, stopped at 756.58, and left the rest to discipline.
If it rises to 774.48, don’t get greedy—take off half the bag first. If it pulls back without breaking, then consider taking it back.
Price is still above the 20-day line at 768.92, so the trend isn’t broken.
Location check: the current price is 1.2% away from support and 0.2% away from resistance. There isn’t enough room to cover the risk—don’t act here. Calculate this trade first, then decide how much to enter.
If 774.48 is broken out with volume, then we look up at 784.55—that’s the next stop.
Anyone who’s made it this far is true love—hit like.
#BNB #币安币 #Market Analysis
【Live Scan · $BNB】(1H main line + 4H filter)
4H trend: Strong bullish|1H structure: Not confirmed yet (keep waiting)
Long/Short score: 9 points (bullish alignment +3 | MACD bullish +1 | Above zero line +1 | RSI stabilizing +1 | Near EMA20 +1 | Dip-buying signal +2)
Current price 772.66 RSI 65.07 Support 763.02 / Resistance 774.48
Conclusion: Long score dominates (pattern not fully confirmed) → Bias bullish; wait for a proper pullback before going long
$BNB
Today I’m using BNB to demonstrate: how to turn direction into orders
【Go Long】Current price 772.66
Key points first: with the current price 772.66, go long directly; set stop loss at 756.58—if it breaks down, admit you’re wrong.
· Support at 763.02 below: if it drops near there, someone will take it; Resistance at 774.48 above: if it rises near there, it’s easy to get sold
How to do it (Go Long):
· Entry: Go long directly at 772.50
· Stop loss: 756.58 (If you’re down 2.1%, accept the loss—don’t hold on)
· Take profit: 820.27 (First target; when it hits, reduce by half first)
· Position: Use only 2–3% of your money to test first; don’t go all-in
(Win rate is based on historical stats and isn’t guaranteed; if you copy trades, always use stop loss and control position size)
In a bull market, the most expensive thing isn’t money—it’s the chips. $BNB current price 772.66. Many people will run after a small rise; once they run, they find they can’t get a fill again. My approach is simple: build a base position first, then add again around 772.66. Stop loss at 756.58, and leave the rest to time.
Trading volume: 67.7M—this volume can support a move.
I personally went in with a base position first, stopped at 756.58, and left the rest to discipline.
If it rises to 774.48, don’t get greedy—take off half the bag first. If it pulls back without breaking, then consider taking it back.
Price is still above the 20-day line at 768.92, so the trend isn’t broken.
Location check: the current price is 1.2% away from support and 0.2% away from resistance. There isn’t enough room to cover the risk—don’t act here. Calculate this trade first, then decide how much to enter.
If 774.48 is broken out with volume, then we look up at 784.55—that’s the next stop.
Anyone who’s made it this far is true love—hit like.
#BNB #币安币 #Market Analysis
【Live Scan · $BNB 】(1H main line + 4H filter)
4H trend: Strong bullish|1H structure: Not confirmed yet (keep waiting)
Long/Short score: 9 points (bullish alignment +3 | MACD bullish +1 | Above zero line +1 | RSI stabilizing +1 | Near EMA20 +1 | Dip-buying signal +2)
Current price 772.66 RSI 65.07 Support 763.02 / Resistance 774.48
Conclusion: Long score dominates (pattern not fully confirmed) → Bias bullish; wait for a proper pullback before going long
$BNB
【Go Long】Current price 772.66
Key points first: with the current price 772.66, go long directly; set stop loss at 756.58—if it breaks down, admit you’re wrong.
· Support at 763.02 below: if it drops near there, someone will take it; Resistance at 774.48 above: if it rises near there, it’s easy to get sold
How to do it (Go Long):
· Entry: Go long directly at 772.50
· Stop loss: 756.58 (If you’re down 2.1%, accept the loss—don’t hold on)
· Take profit: 820.27 (First target; when it hits, reduce by half first)
· Position: Use only 2–3% of your money to test first; don’t go all-in
(Win rate is based on historical stats and isn’t guaranteed; if you copy trades, always use stop loss and control position size)
In a bull market, the most expensive thing isn’t money—it’s the chips. $BNB current price 772.66. Many people will run after a small rise; once they run, they find they can’t get a fill again. My approach is simple: build a base position first, then add again around 772.66. Stop loss at 756.58, and leave the rest to time.
Trading volume: 67.7M—this volume can support a move.
I personally went in with a base position first, stopped at 756.58, and left the rest to discipline.
If it rises to 774.48, don’t get greedy—take off half the bag first. If it pulls back without breaking, then consider taking it back.
Price is still above the 20-day line at 768.92, so the trend isn’t broken.
Location check: the current price is 1.2% away from support and 0.2% away from resistance. There isn’t enough room to cover the risk—don’t act here. Calculate this trade first, then decide how much to enter.
If 774.48 is broken out with volume, then we look up at 784.55—that’s the next stop.
Anyone who’s made it this far is true love—hit like.
#BNB #币安币 #Market Analysis
【Live Scan · $BNB 】(1H main line + 4H filter)
4H trend: Strong bullish|1H structure: Not confirmed yet (keep waiting)
Long/Short score: 9 points (bullish alignment +3 | MACD bullish +1 | Above zero line +1 | RSI stabilizing +1 | Near EMA20 +1 | Dip-buying signal +2)
Current price 772.66 RSI 65.07 Support 763.02 / Resistance 774.48
Conclusion: Long score dominates (pattern not fully confirmed) → Bias bullish; wait for a proper pullback before going long
$BNB
5
·
--
ETH direction is set: going short
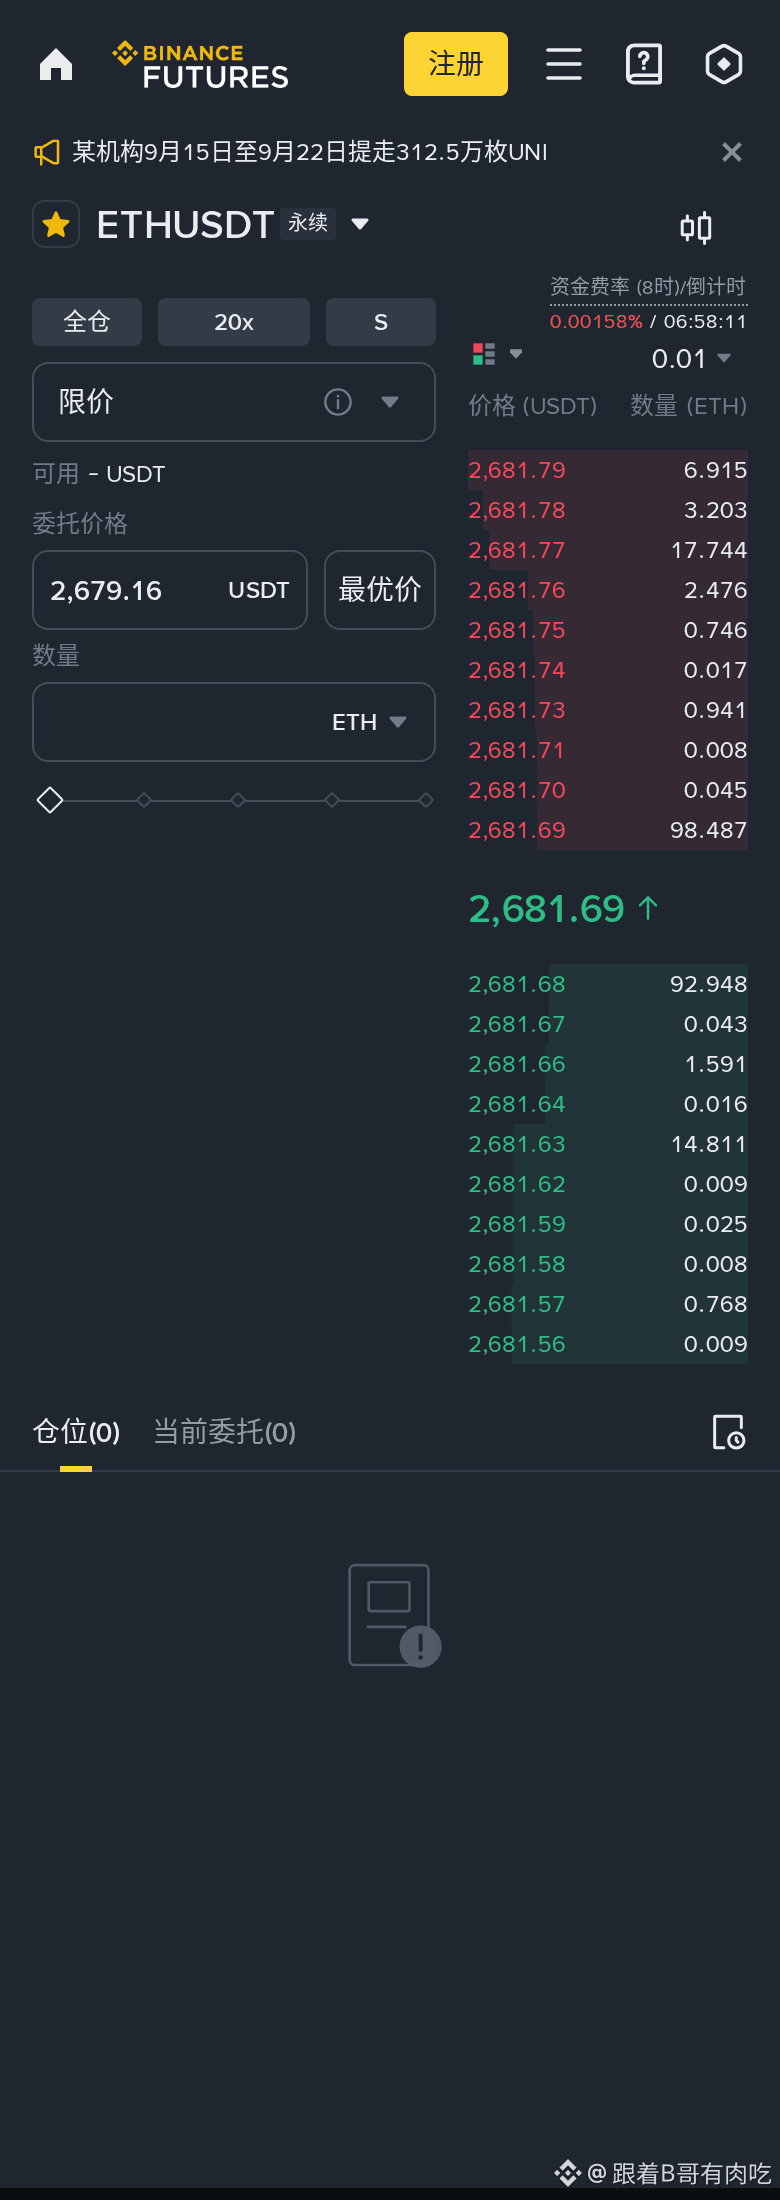
Current price 2,682.38 — how to play this, look down
Plan as follows — at 2,682.38 immediately short, stop loss 2,749.89; if it breaks above, admit the mistake.
· Support at 2,668: if it drops there, someone will likely step in
· Resistance at 2,722: if it rises there, it’s easy to get sold off
How to do it (short):
· Entry: short immediately at 2,682.38
· Stop loss: 2,749.89 (lose ~2.5%, admit and don’t hold/struggle)
· Take profit: 2,479.84 (first target; when it hits, cut half first)
· Position: first use 1–2% of the money to test—don’t go full size
⚠️ The big 4H trend hasn’t fully confirmed yet; this trade is against the smaller timeframe. Cut the position by half and don’t move the stop loss.
(Win rate is based on historical stats and is not guaranteed; if you copy, always set a stop loss and control your position size)
People told me not to say anything, but I still want to make it clear.
Brothers, $ETH , don’t get carried away. This move is a rebound, not a reversal. MACD is still pressed below the 0 axis. Within these two weeks, I’m looking at 2,455—a pullback of at least 8.5%. The short-term range is very clear: support 2,668, resistance 2,722. If going short, treat resistance as the line of defense. The 20-day line at 2,691 is already capping things above your head; if the bounce can’t break through, the shorts are in control. The short order is split into two parts: short 20% at 2,682 first; then add another 20% on the rebound to 2,682—don’t oversize.
Trading volume is 681.5M—this amount can support a move.
If it directly breaks through 2,668, then the short is right. But remember to push the stop loss down to around your cost—don’t let a winning trade turn into a losing one.
24h -0.5%.
Funding rate +0.0016%—longs and shorts are still fairly balanced; not at an extreme.
When it reaches 2,455, cut the position in half first; then decide whether to hold the rest.
Sense of position: the current price is 0.5% away from support and 1.5% away from resistance. There isn’t enough room here to cover the risk—don’t act here; first calculate the account on this trade before deciding how much to place.
If it breaks below 2,668, don’t rush to exit—there’s also a spot at 2,636 below.
Different opinions are welcome; I’m not out here to argue with people.
【Live scan · $ETH】(1-hour main line + 4H filter)
4H trend: neutral bullish | 1-hour structure: not fully formed yet (keep waiting)
Long/short score: 9 points (shorts stacked +3 | MACD bearish +1 | below zero axis +1 | RSI stabilizing +1 | close to EMA20 +1 | top reversal +2)
Conclusion: shorts have the edge (pattern not fully confirmed) → lean bearish; wait for the rebound to the resistance level before shorting
$ETH
ETH direction is set: going short
Current price 2,682.38 — how to play this, look down
Plan as follows — at 2,682.38 immediately short, stop loss 2,749.89; if it breaks above, admit the mistake.
· Support at 2,668: if it drops there, someone will likely step in
· Resistance at 2,722: if it rises there, it’s easy to get sold off
How to do it (short):
· Entry: short immediately at 2,682.38
· Stop loss: 2,749.89 (lose ~2.5%, admit and don’t hold/struggle)
· Take profit: 2,479.84 (first target; when it hits, cut half first)
· Position: first use 1–2% of the money to test—don’t go full size
⚠️ The big 4H trend hasn’t fully confirmed yet; this trade is against the smaller timeframe. Cut the position by half and don’t move the stop loss.
(Win rate is based on historical stats and is not guaranteed; if you copy, always set a stop loss and control your position size)
People told me not to say anything, but I still want to make it clear.
Brothers, $ETH , don’t get carried away. This move is a rebound, not a reversal. MACD is still pressed below the 0 axis. Within these two weeks, I’m looking at 2,455—a pullback of at least 8.5%. The short-term range is very clear: support 2,668, resistance 2,722. If going short, treat resistance as the line of defense. The 20-day line at 2,691 is already capping things above your head; if the bounce can’t break through, the shorts are in control. The short order is split into two parts: short 20% at 2,682 first; then add another 20% on the rebound to 2,682—don’t oversize.
Trading volume is 681.5M—this amount can support a move.
If it directly breaks through 2,668, then the short is right. But remember to push the stop loss down to around your cost—don’t let a winning trade turn into a losing one.
24h -0.5%.
Funding rate +0.0016%—longs and shorts are still fairly balanced; not at an extreme.
When it reaches 2,455, cut the position in half first; then decide whether to hold the rest.
Sense of position: the current price is 0.5% away from support and 1.5% away from resistance. There isn’t enough room here to cover the risk—don’t act here; first calculate the account on this trade before deciding how much to place.
If it breaks below 2,668, don’t rush to exit—there’s also a spot at 2,636 below.
Different opinions are welcome; I’m not out here to argue with people.
【Live scan · $ETH 】(1-hour main line + 4H filter)
4H trend: neutral bullish | 1-hour structure: not fully formed yet (keep waiting)
Long/short score: 9 points (shorts stacked +3 | MACD bearish +1 | below zero axis +1 | RSI stabilizing +1 | close to EMA20 +1 | top reversal +2)
Conclusion: shorts have the edge (pattern not fully confirmed) → lean bearish; wait for the rebound to the resistance level before shorting
$ETH
Current price 2,682.38 — how to play this, look down
Plan as follows — at 2,682.38 immediately short, stop loss 2,749.89; if it breaks above, admit the mistake.
· Support at 2,668: if it drops there, someone will likely step in
· Resistance at 2,722: if it rises there, it’s easy to get sold off
How to do it (short):
· Entry: short immediately at 2,682.38
· Stop loss: 2,749.89 (lose ~2.5%, admit and don’t hold/struggle)
· Take profit: 2,479.84 (first target; when it hits, cut half first)
· Position: first use 1–2% of the money to test—don’t go full size
⚠️ The big 4H trend hasn’t fully confirmed yet; this trade is against the smaller timeframe. Cut the position by half and don’t move the stop loss.
(Win rate is based on historical stats and is not guaranteed; if you copy, always set a stop loss and control your position size)
People told me not to say anything, but I still want to make it clear.
Brothers, $ETH , don’t get carried away. This move is a rebound, not a reversal. MACD is still pressed below the 0 axis. Within these two weeks, I’m looking at 2,455—a pullback of at least 8.5%. The short-term range is very clear: support 2,668, resistance 2,722. If going short, treat resistance as the line of defense. The 20-day line at 2,691 is already capping things above your head; if the bounce can’t break through, the shorts are in control. The short order is split into two parts: short 20% at 2,682 first; then add another 20% on the rebound to 2,682—don’t oversize.
Trading volume is 681.5M—this amount can support a move.
If it directly breaks through 2,668, then the short is right. But remember to push the stop loss down to around your cost—don’t let a winning trade turn into a losing one.
24h -0.5%.
Funding rate +0.0016%—longs and shorts are still fairly balanced; not at an extreme.
When it reaches 2,455, cut the position in half first; then decide whether to hold the rest.
Sense of position: the current price is 0.5% away from support and 1.5% away from resistance. There isn’t enough room here to cover the risk—don’t act here; first calculate the account on this trade before deciding how much to place.
If it breaks below 2,668, don’t rush to exit—there’s also a spot at 2,636 below.
Different opinions are welcome; I’m not out here to argue with people.
【Live scan · $ETH 】(1-hour main line + 4H filter)
4H trend: neutral bullish | 1-hour structure: not fully formed yet (keep waiting)
Long/short score: 9 points (shorts stacked +3 | MACD bearish +1 | below zero axis +1 | RSI stabilizing +1 | close to EMA20 +1 | top reversal +2)
Conclusion: shorts have the edge (pattern not fully confirmed) → lean bearish; wait for the rebound to the resistance level before shorting
$ETH
15
·
--
BTC Today’s takeaway: Go Long
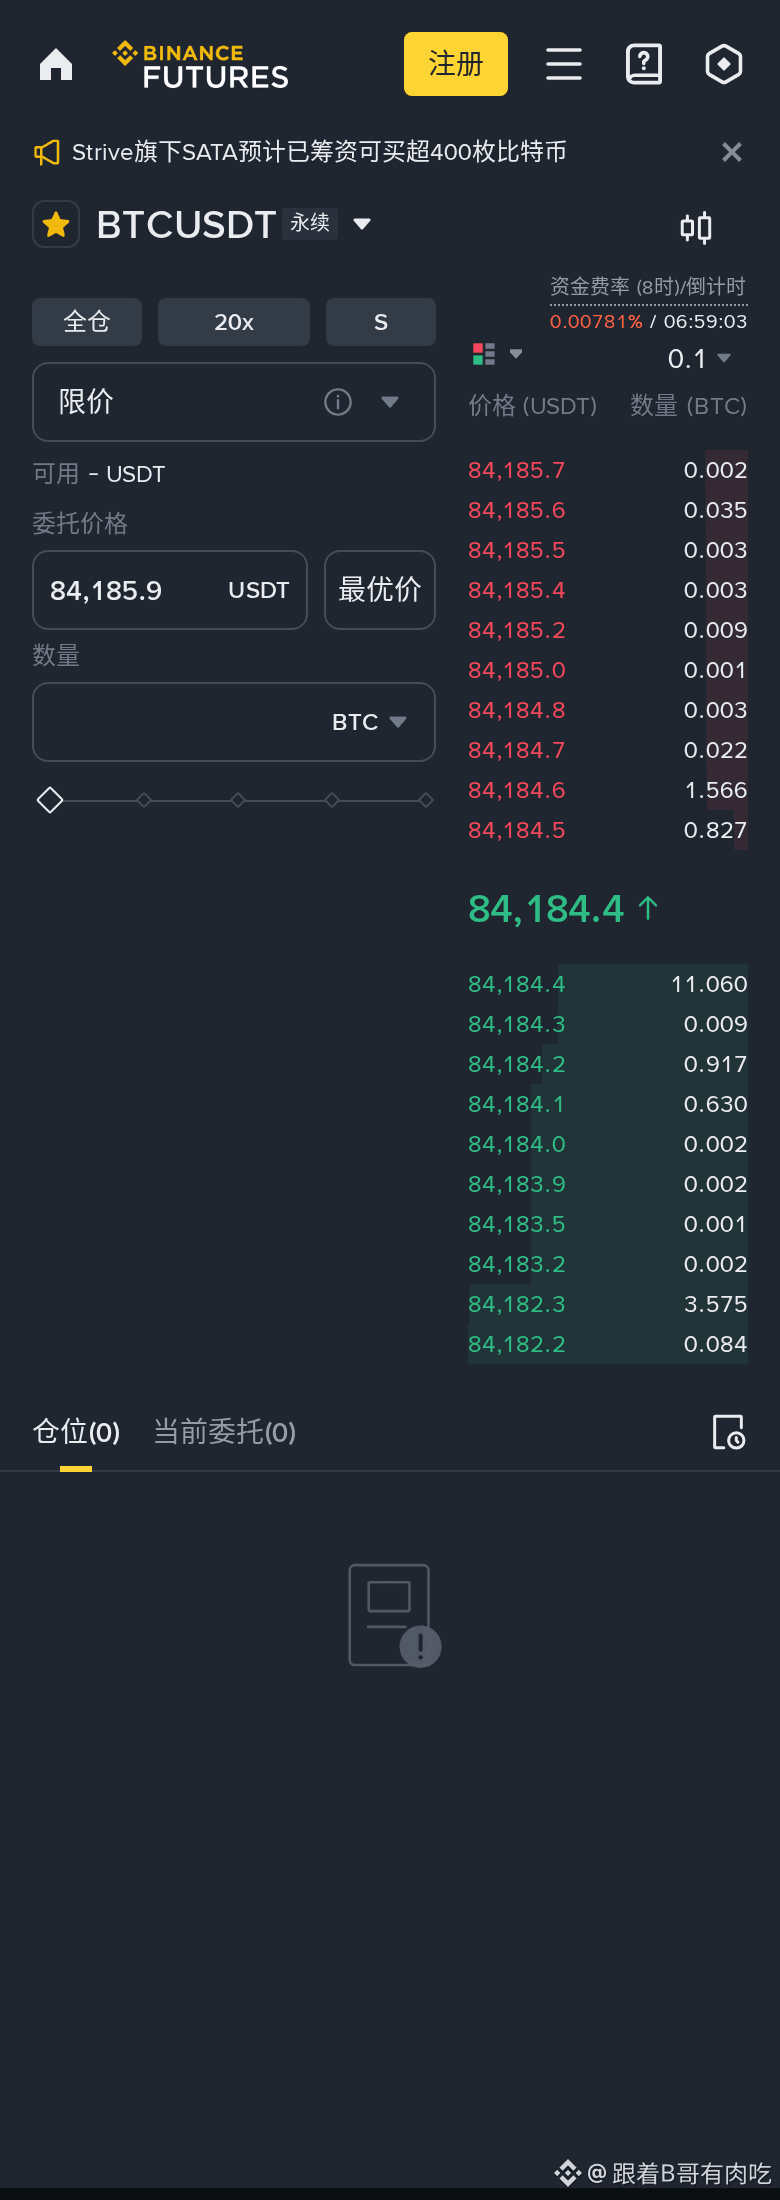
Current price 84,210, how to look ahead
Straight to the point: At 84,210, go long directly. Stop loss 82,397—if it breaks down below, own it and admit the mistake.
· Support at 83,186 below—when it drops near there, people will step in
· Resistance at 84,744 above—if it rises to that area, it’s likely to get sold off
How to do it (go long):
· Entry: Go long directly at 84,210
· Stop loss: 82,397 (if you’re down 2.2%, accept it—don’t hold and “tough it out”)
· Take profit: 89,649 (first target; when you reach it, reduce by half first)
· Position sizing: Try with 2–3% of your funds first; don’t go all-in
(Win rate is based on historical stats and isn’t guaranteed; if you follow trades, you must use a stop loss and control your exposure)
Write the orders you plan to place tonight clearly in advance:
$BTC: Long 84,210, stop loss 82,397, reduce by half at 91,524, fully close at 97,015.
Trading volume: 1340.1M—this amount can support a move.
First target at 84,744: when it hits, trim; don’t expect it to go straight to the moon in one go—taking profit is what matters.
Funding rate +0.0078%—bull and bear are still fairly balanced, not at extremes.
Price is still above the 20-day line at 83,930—trend hasn’t broken; pullbacks are opportunities.
For this Bitcoin move, I personally plan to hold for the long term; if you’re doing short-term T trades, pay attention to your timing.
I already entered with a starter position first; stop loss 82,397. The rest is up to discipline.
Let’s do the math: Down to support 83,186 is 1.2%, up to resistance 84,744 is 0.6%. The room here isn’t enough to cover the risk—don’t trade from this spot.
If 84,744 breaks out with volume, then look higher to 85,650—that’s the next stop.
What do you think?
#BTC #比特币 #K线分析
【Live scan · $BTC】(1H main line + 4H filter)
4H trend: Strong bull | 1H structure: Not fully formed yet (continue waiting)
Bull/Bear score: 9 points (bullish alignment +3 | MACD still bullish +1 | above zero line +1 | RSI stabilizing +1 | near EMA20 +1 | dip-buy signal +2)
Current price 84,210 RSI 66.02 Support 83,186 / Resistance 84,744
Conclusion: Bull score outweighs (pattern not fully confirmed) → Bias bullish; wait for a proper pullback before going long
$BTC
BTC Today’s takeaway: Go Long
Current price 84,210, how to look ahead
Straight to the point: At 84,210, go long directly. Stop loss 82,397—if it breaks down below, own it and admit the mistake.
· Support at 83,186 below—when it drops near there, people will step in
· Resistance at 84,744 above—if it rises to that area, it’s likely to get sold off
How to do it (go long):
· Entry: Go long directly at 84,210
· Stop loss: 82,397 (if you’re down 2.2%, accept it—don’t hold and “tough it out”)
· Take profit: 89,649 (first target; when you reach it, reduce by half first)
· Position sizing: Try with 2–3% of your funds first; don’t go all-in
(Win rate is based on historical stats and isn’t guaranteed; if you follow trades, you must use a stop loss and control your exposure)
Write the orders you plan to place tonight clearly in advance:
$BTC : Long 84,210, stop loss 82,397, reduce by half at 91,524, fully close at 97,015.
Trading volume: 1340.1M—this amount can support a move.
First target at 84,744: when it hits, trim; don’t expect it to go straight to the moon in one go—taking profit is what matters.
Funding rate +0.0078%—bull and bear are still fairly balanced, not at extremes.
Price is still above the 20-day line at 83,930—trend hasn’t broken; pullbacks are opportunities.
For this Bitcoin move, I personally plan to hold for the long term; if you’re doing short-term T trades, pay attention to your timing.
I already entered with a starter position first; stop loss 82,397. The rest is up to discipline.
Let’s do the math: Down to support 83,186 is 1.2%, up to resistance 84,744 is 0.6%. The room here isn’t enough to cover the risk—don’t trade from this spot.
If 84,744 breaks out with volume, then look higher to 85,650—that’s the next stop.
What do you think?
#BTC #比特币 #K线分析
【Live scan · $BTC 】(1H main line + 4H filter)
4H trend: Strong bull | 1H structure: Not fully formed yet (continue waiting)
Bull/Bear score: 9 points (bullish alignment +3 | MACD still bullish +1 | above zero line +1 | RSI stabilizing +1 | near EMA20 +1 | dip-buy signal +2)
Current price 84,210 RSI 66.02 Support 83,186 / Resistance 84,744
Conclusion: Bull score outweighs (pattern not fully confirmed) → Bias bullish; wait for a proper pullback before going long
$BTC
Current price 84,210, how to look ahead
Straight to the point: At 84,210, go long directly. Stop loss 82,397—if it breaks down below, own it and admit the mistake.
· Support at 83,186 below—when it drops near there, people will step in
· Resistance at 84,744 above—if it rises to that area, it’s likely to get sold off
How to do it (go long):
· Entry: Go long directly at 84,210
· Stop loss: 82,397 (if you’re down 2.2%, accept it—don’t hold and “tough it out”)
· Take profit: 89,649 (first target; when you reach it, reduce by half first)
· Position sizing: Try with 2–3% of your funds first; don’t go all-in
(Win rate is based on historical stats and isn’t guaranteed; if you follow trades, you must use a stop loss and control your exposure)
Write the orders you plan to place tonight clearly in advance:
$BTC : Long 84,210, stop loss 82,397, reduce by half at 91,524, fully close at 97,015.
Trading volume: 1340.1M—this amount can support a move.
First target at 84,744: when it hits, trim; don’t expect it to go straight to the moon in one go—taking profit is what matters.
Funding rate +0.0078%—bull and bear are still fairly balanced, not at extremes.
Price is still above the 20-day line at 83,930—trend hasn’t broken; pullbacks are opportunities.
For this Bitcoin move, I personally plan to hold for the long term; if you’re doing short-term T trades, pay attention to your timing.
I already entered with a starter position first; stop loss 82,397. The rest is up to discipline.
Let’s do the math: Down to support 83,186 is 1.2%, up to resistance 84,744 is 0.6%. The room here isn’t enough to cover the risk—don’t trade from this spot.
If 84,744 breaks out with volume, then look higher to 85,650—that’s the next stop.
What do you think?
#BTC #比特币 #K线分析
【Live scan · $BTC 】(1H main line + 4H filter)
4H trend: Strong bull | 1H structure: Not fully formed yet (continue waiting)
Bull/Bear score: 9 points (bullish alignment +3 | MACD still bullish +1 | above zero line +1 | RSI stabilizing +1 | near EMA20 +1 | dip-buy signal +2)
Current price 84,210 RSI 66.02 Support 83,186 / Resistance 84,744
Conclusion: Bull score outweighs (pattern not fully confirmed) → Bias bullish; wait for a proper pullback before going long
$BTC
17
·
--
Someone in the group is asking about SOL again. This time, here’s a direct plan
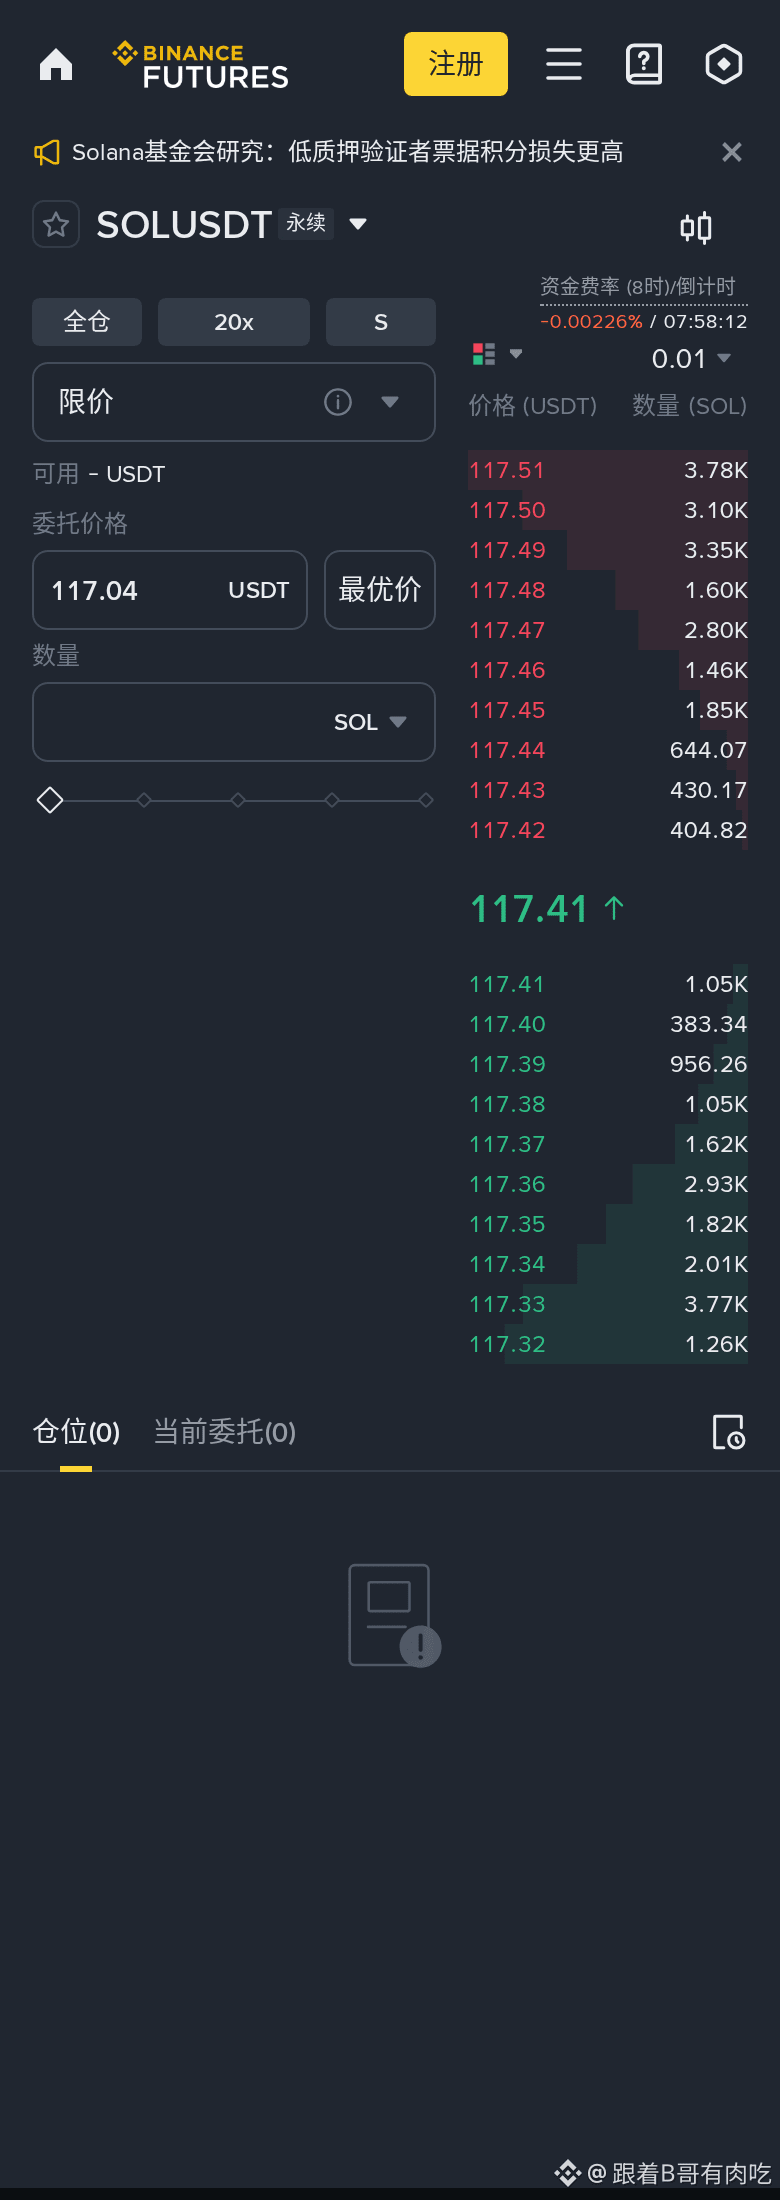
【Short】at the current price 117.39
Trading plan: Short at 117.39 right away; stop loss at 119.63. If it breaks above, admit the mistake.
· Support at 116.73—if it drops near there, people will step in to buy; Resistance at 120.59—if it rises near there, it’s easy to get sold off
How to do it (short):
· Entry: Short at the current price 117.39 immediately
· Loss limit: 119.63 (if you’re down 1.9%, accept it—don’t hold and “tough it out”)
· Take profit: 110.68 (first target—when reached, reduce by half first)
· Position: Try with 1–2% of your money first; don’t go all-in
⚠️ The big-picture direction on the 4H hasn’t been fully established yet. This trade is against the small timeframe: cut the position by half; don’t move the stop loss.
(Win rate is based on historical stats and isn’t guaranteed; if you copy-trade, always use a stop loss and control your position size)
$SOL current price 117.39—looks cheap, but “cheap” isn’t a reason to rise. The market is currently controlled by the bears. All moving averages are sitting above price, and every bounce gets knocked back. If you really want to participate: short once at 117.39; stop loss 119.63; look down to 107.39.
24h turnover 260.8M, and volume is still there, which suggests the funds haven’t left.
The 20-day line at 118.06 is already overhead. If it can’t break through on the rebound, then bears remain in control.
My own trade: I shorted at the current price 117.39 once, with stop loss at 119.63, using a light position.
Near 116.73, reduce by half first; the rest depends on whether it can break—if it breaks, then hold.
24h -1.6%.
The short-term range is very clear: support 116.73, resistance 120.59. If you’re shorting, use resistance as the line in the sand.
Funding rate -0.0023%, long/short is still fairly balanced—nothing extreme.
Let’s do the math: down to support 116.73 is 0.6%; up to resistance 120.59 is 2.7%. The upside/downside space here isn’t enough to cover the risk—don’t do anything at this point.
What do you think? Let’s chat in the comments.
【Live Scan · $SOL】(1-hour main track + 4H filtering)
4H trend: Strong bears | 1H pattern: Not confirmed yet (keep waiting)
Long/short score: 9 points (bears alignment +3 | MACD still bearish +1 | below zero axis +1 | RSI stabilizing +1 | near EMA20 +1 | top reversal +2)
Current price 117.39 RSI 37.84 Support 116.73 / Resistance 120.59
Conclusion: Bearish score is dominant (pattern not fully confirmed) → Prefer a bearish stance; wait to short at the resistance level after a rebound
$SOL
Someone in the group is asking about SOL again. This time, here’s a direct plan
【Short】at the current price 117.39
Trading plan: Short at 117.39 right away; stop loss at 119.63. If it breaks above, admit the mistake.
· Support at 116.73—if it drops near there, people will step in to buy; Resistance at 120.59—if it rises near there, it’s easy to get sold off
How to do it (short):
· Entry: Short at the current price 117.39 immediately
· Loss limit: 119.63 (if you’re down 1.9%, accept it—don’t hold and “tough it out”)
· Take profit: 110.68 (first target—when reached, reduce by half first)
· Position: Try with 1–2% of your money first; don’t go all-in
⚠️ The big-picture direction on the 4H hasn’t been fully established yet. This trade is against the small timeframe: cut the position by half; don’t move the stop loss.
(Win rate is based on historical stats and isn’t guaranteed; if you copy-trade, always use a stop loss and control your position size)
$SOL current price 117.39—looks cheap, but “cheap” isn’t a reason to rise. The market is currently controlled by the bears. All moving averages are sitting above price, and every bounce gets knocked back. If you really want to participate: short once at 117.39; stop loss 119.63; look down to 107.39.
24h turnover 260.8M, and volume is still there, which suggests the funds haven’t left.
The 20-day line at 118.06 is already overhead. If it can’t break through on the rebound, then bears remain in control.
My own trade: I shorted at the current price 117.39 once, with stop loss at 119.63, using a light position.
Near 116.73, reduce by half first; the rest depends on whether it can break—if it breaks, then hold.
24h -1.6%.
The short-term range is very clear: support 116.73, resistance 120.59. If you’re shorting, use resistance as the line in the sand.
Funding rate -0.0023%, long/short is still fairly balanced—nothing extreme.
Let’s do the math: down to support 116.73 is 0.6%; up to resistance 120.59 is 2.7%. The upside/downside space here isn’t enough to cover the risk—don’t do anything at this point.
What do you think? Let’s chat in the comments.
【Live Scan · $SOL 】(1-hour main track + 4H filtering)
4H trend: Strong bears | 1H pattern: Not confirmed yet (keep waiting)
Long/short score: 9 points (bears alignment +3 | MACD still bearish +1 | below zero axis +1 | RSI stabilizing +1 | near EMA20 +1 | top reversal +2)
Current price 117.39 RSI 37.84 Support 116.73 / Resistance 120.59
Conclusion: Bearish score is dominant (pattern not fully confirmed) → Prefer a bearish stance; wait to short at the resistance level after a rebound
$SOL
【Short】at the current price 117.39
Trading plan: Short at 117.39 right away; stop loss at 119.63. If it breaks above, admit the mistake.
· Support at 116.73—if it drops near there, people will step in to buy; Resistance at 120.59—if it rises near there, it’s easy to get sold off
How to do it (short):
· Entry: Short at the current price 117.39 immediately
· Loss limit: 119.63 (if you’re down 1.9%, accept it—don’t hold and “tough it out”)
· Take profit: 110.68 (first target—when reached, reduce by half first)
· Position: Try with 1–2% of your money first; don’t go all-in
⚠️ The big-picture direction on the 4H hasn’t been fully established yet. This trade is against the small timeframe: cut the position by half; don’t move the stop loss.
(Win rate is based on historical stats and isn’t guaranteed; if you copy-trade, always use a stop loss and control your position size)
$SOL current price 117.39—looks cheap, but “cheap” isn’t a reason to rise. The market is currently controlled by the bears. All moving averages are sitting above price, and every bounce gets knocked back. If you really want to participate: short once at 117.39; stop loss 119.63; look down to 107.39.
24h turnover 260.8M, and volume is still there, which suggests the funds haven’t left.
The 20-day line at 118.06 is already overhead. If it can’t break through on the rebound, then bears remain in control.
My own trade: I shorted at the current price 117.39 once, with stop loss at 119.63, using a light position.
Near 116.73, reduce by half first; the rest depends on whether it can break—if it breaks, then hold.
24h -1.6%.
The short-term range is very clear: support 116.73, resistance 120.59. If you’re shorting, use resistance as the line in the sand.
Funding rate -0.0023%, long/short is still fairly balanced—nothing extreme.
Let’s do the math: down to support 116.73 is 0.6%; up to resistance 120.59 is 2.7%. The upside/downside space here isn’t enough to cover the risk—don’t do anything at this point.
What do you think? Let’s chat in the comments.
【Live Scan · $SOL 】(1-hour main track + 4H filtering)
4H trend: Strong bears | 1H pattern: Not confirmed yet (keep waiting)
Long/short score: 9 points (bears alignment +3 | MACD still bearish +1 | below zero axis +1 | RSI stabilizing +1 | near EMA20 +1 | top reversal +2)
Current price 117.39 RSI 37.84 Support 116.73 / Resistance 120.59
Conclusion: Bearish score is dominant (pattern not fully confirmed) → Prefer a bearish stance; wait to short at the resistance level after a rebound
$SOL
13
·
--
Learn to trade BTC with this idea step by step
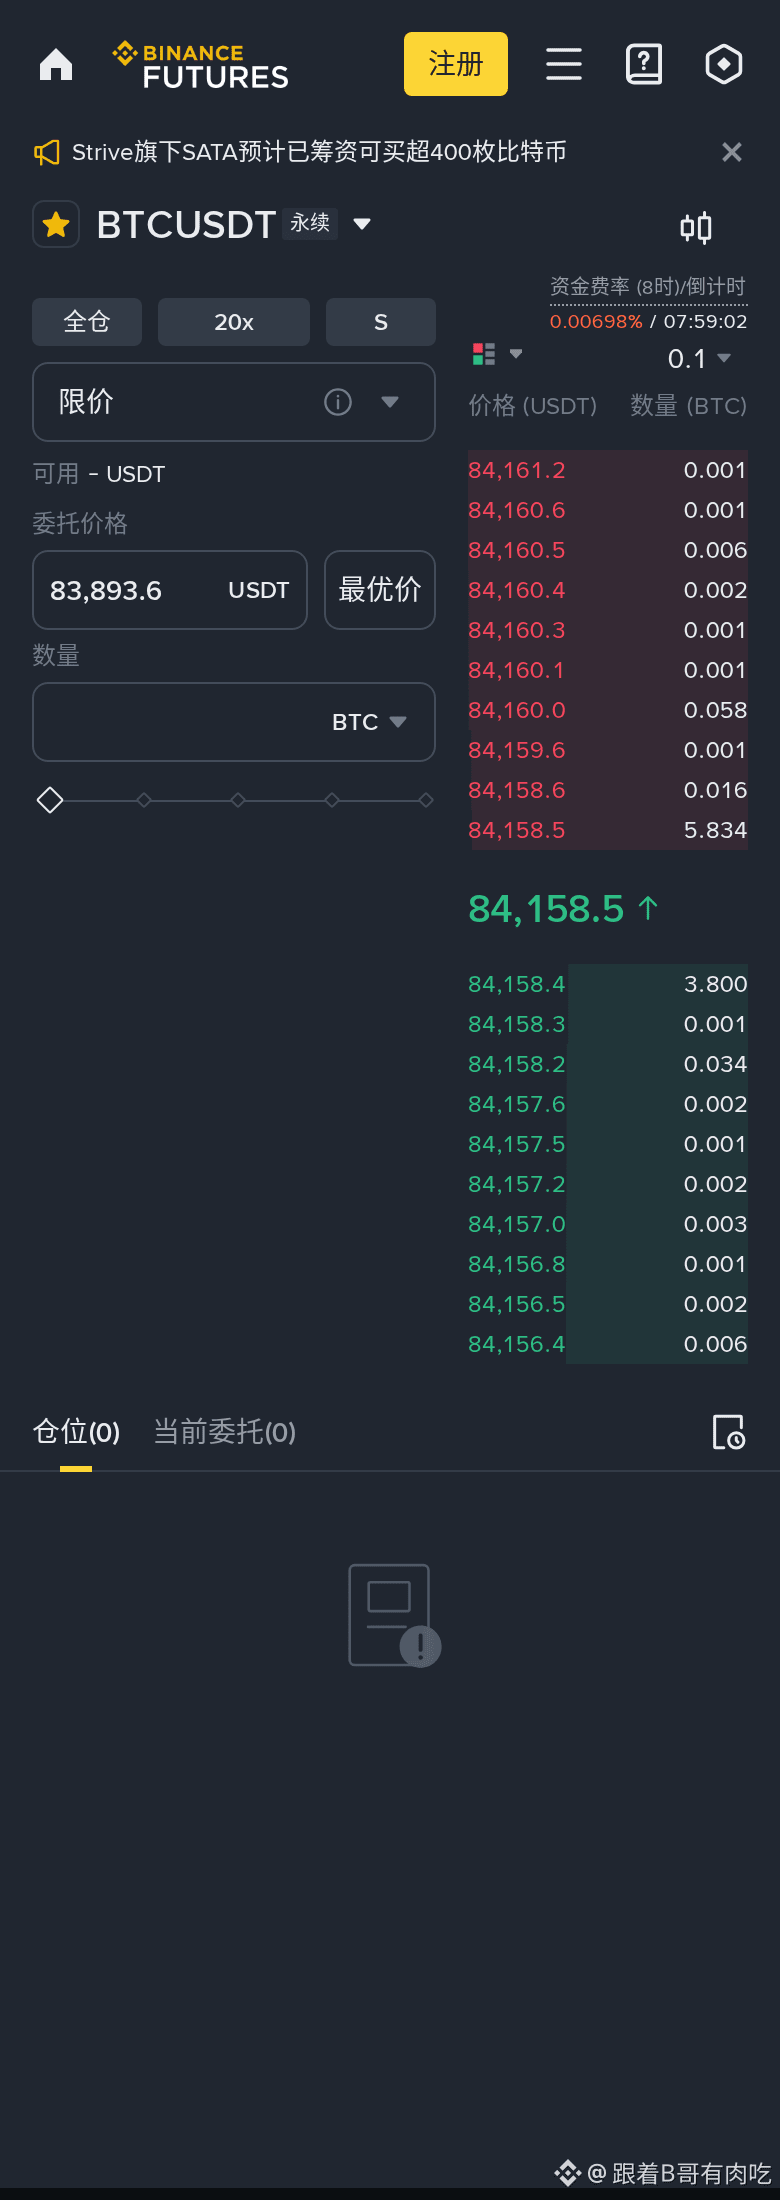
【Go Long】Current price 84,167, take full risk with stop-loss and full take-profit set
Direct plan: Go long at the current price 84,167; stop-loss at 82,502—if it breaks down further, admit you’re wrong.
· Support at 83,186: if it dips to there, someone will likely buy
· Resistance at 84,744: if it rises to there, it’s easy to be sold off
How to trade (Long):
· Entry: Go long directly at 84,167
· Stop-loss: 82,502 (lose 2.0% and accept it—don’t hold and hope)
· Take-profit: 89,162 (first target; when reached, cut half first)
· Position sizing: Start by using 2–3% of your funds to test—don’t go all-in
(Win rate is based on historical statistics; not guaranteed. If you copy trade, always use stop-loss and control your position size.)
RSI: don’t sell just because it’s overbought, and don’t buy just because it’s oversold.
Let’s use $BTC as a ready-made example: Current price 84,167, MACD golden cross is pointing upward. Following the standards above, buy on the pullback to 84,167; stop-loss at 82,502; target 91,524. The short-term range is very clear: support 83,186 and resistance 84,744—going long uses support as the line of defense. Price is still above the 20-day MA at 83,897, so the trend hasn’t broken down.
Funding rate +0.0070%: long and short are relatively balanced—no extremes.
Trading volume is 1324.8M; this volume can support a move.
If it rises to 84,744, don’t get greedy. First drop half, and if it pulls back without breaking, consider buying back.
Location awareness: current price is 1.2% above support and 0.7% below resistance. This room doesn’t cover the risk—don’t act here. Calculate this trade clearly first, then decide how much to put in.
Don’t rush to chase even if it breaks above 84,744—there’s still a level at 85,650 that needs to be passed.
Tell me your thoughts in the comments.
#BTC #Bitcoin
【Live Scan · $BTC】(1-hour main trend + 4H filter)
4H trend: Strong bullish | 1H pattern: Not confirmed yet (keep waiting)
Long/Short score: 9 points (bull alignment +3 | MACD holding longs +1 | Above zero line +1 | RSI stabilizing +1 | Near EMA20 +1 | Dip-buy signal +2)
Current price 84,167 RSI 64.40 Support 83,186 / Resistance 84,744
Conclusion: Long score is dominant (pattern not fully confirmed) → Mildly bullish; wait for a proper pullback before going long
$BTC
Learn to trade BTC with this idea step by step
【Go Long】Current price 84,167, take full risk with stop-loss and full take-profit set
Direct plan: Go long at the current price 84,167; stop-loss at 82,502—if it breaks down further, admit you’re wrong.
· Support at 83,186: if it dips to there, someone will likely buy
· Resistance at 84,744: if it rises to there, it’s easy to be sold off
How to trade (Long):
· Entry: Go long directly at 84,167
· Stop-loss: 82,502 (lose 2.0% and accept it—don’t hold and hope)
· Take-profit: 89,162 (first target; when reached, cut half first)
· Position sizing: Start by using 2–3% of your funds to test—don’t go all-in
(Win rate is based on historical statistics; not guaranteed. If you copy trade, always use stop-loss and control your position size.)
RSI: don’t sell just because it’s overbought, and don’t buy just because it’s oversold.
Let’s use $BTC as a ready-made example: Current price 84,167, MACD golden cross is pointing upward. Following the standards above, buy on the pullback to 84,167; stop-loss at 82,502; target 91,524. The short-term range is very clear: support 83,186 and resistance 84,744—going long uses support as the line of defense. Price is still above the 20-day MA at 83,897, so the trend hasn’t broken down.
Funding rate +0.0070%: long and short are relatively balanced—no extremes.
Trading volume is 1324.8M; this volume can support a move.
If it rises to 84,744, don’t get greedy. First drop half, and if it pulls back without breaking, consider buying back.
Location awareness: current price is 1.2% above support and 0.7% below resistance. This room doesn’t cover the risk—don’t act here. Calculate this trade clearly first, then decide how much to put in.
Don’t rush to chase even if it breaks above 84,744—there’s still a level at 85,650 that needs to be passed.
Tell me your thoughts in the comments.
#BTC #Bitcoin
【Live Scan · $BTC 】(1-hour main trend + 4H filter)
4H trend: Strong bullish | 1H pattern: Not confirmed yet (keep waiting)
Long/Short score: 9 points (bull alignment +3 | MACD holding longs +1 | Above zero line +1 | RSI stabilizing +1 | Near EMA20 +1 | Dip-buy signal +2)
Current price 84,167 RSI 64.40 Support 83,186 / Resistance 84,744
Conclusion: Long score is dominant (pattern not fully confirmed) → Mildly bullish; wait for a proper pullback before going long
$BTC
【Go Long】Current price 84,167, take full risk with stop-loss and full take-profit set
Direct plan: Go long at the current price 84,167; stop-loss at 82,502—if it breaks down further, admit you’re wrong.
· Support at 83,186: if it dips to there, someone will likely buy
· Resistance at 84,744: if it rises to there, it’s easy to be sold off
How to trade (Long):
· Entry: Go long directly at 84,167
· Stop-loss: 82,502 (lose 2.0% and accept it—don’t hold and hope)
· Take-profit: 89,162 (first target; when reached, cut half first)
· Position sizing: Start by using 2–3% of your funds to test—don’t go all-in
(Win rate is based on historical statistics; not guaranteed. If you copy trade, always use stop-loss and control your position size.)
RSI: don’t sell just because it’s overbought, and don’t buy just because it’s oversold.
Let’s use $BTC as a ready-made example: Current price 84,167, MACD golden cross is pointing upward. Following the standards above, buy on the pullback to 84,167; stop-loss at 82,502; target 91,524. The short-term range is very clear: support 83,186 and resistance 84,744—going long uses support as the line of defense. Price is still above the 20-day MA at 83,897, so the trend hasn’t broken down.
Funding rate +0.0070%: long and short are relatively balanced—no extremes.
Trading volume is 1324.8M; this volume can support a move.
If it rises to 84,744, don’t get greedy. First drop half, and if it pulls back without breaking, consider buying back.
Location awareness: current price is 1.2% above support and 0.7% below resistance. This room doesn’t cover the risk—don’t act here. Calculate this trade clearly first, then decide how much to put in.
Don’t rush to chase even if it breaks above 84,744—there’s still a level at 85,650 that needs to be passed.
Tell me your thoughts in the comments.
#BTC #Bitcoin
【Live Scan · $BTC 】(1-hour main trend + 4H filter)
4H trend: Strong bullish | 1H pattern: Not confirmed yet (keep waiting)
Long/Short score: 9 points (bull alignment +3 | MACD holding longs +1 | Above zero line +1 | RSI stabilizing +1 | Near EMA20 +1 | Dip-buy signal +2)
Current price 84,167 RSI 64.40 Support 83,186 / Resistance 84,744
Conclusion: Long score is dominant (pattern not fully confirmed) → Mildly bullish; wait for a proper pullback before going long
$BTC
9
Log in to explore more content
Join global crypto users on Binance Square
⚡️ Get latest and useful information about crypto.
💬 Trusted by the world’s largest crypto exchange.
👍 Discover real insights from verified creators.
Email / Phone number
Trending Topics
NEARFallsToAround$4.70Down14%
376 views
9 Discussing
🚨 $NEAR — FROM ETF HYPE TO A 14% SLAP IN THE FACE.
NEAR has dropped toward $4.70, giving back a big chunk of its recent run after briefly trading above $5.50. The selloff also came as NEAR Intents disclosed a security incident tied to its cross-chain infrastructure, with reported losses around $3.8M. The underlying NEAR blockchain itself was not reported as compromised.
Here’s the part traders should care about:
$4.69–$4.74 is now the key support zone.
Hold it, and this could simply be a violent retest after the September breakout.
Lose it?
The next downside references sit closer to $4.58, then ~$4.30.
And the irony?
The new Bitwise NEAR ETF was still seeing positive inflows around launch week.
So this isn’t a simple “nobody wants NEAR” story.
It’s a battle between:
fresh institutional access
vs.
post-rally profit-taking + security fear.
$NEAR doesn’t need hype right now. It needs $4.70 to hold. 👀
#NEARFallsToAround$4.70Down14% #EvernorthPlansNasdaqListingOct8 #SECProposesCryptoCustodyFramework #IMFApproves$139MDisbursementToElSalvador #AnthropicTargetsIPOAsSoonAsMidNovember
KimHotbae
·0 Likes
·200 views
EthereumFoundationLaunchesZkAPIOnMainnet
0 views
1 Discussing
EvernorthPlansNasdaqListingOct8
491 views
39 Discussing