

#market
market
6.7M views
17,681 Discussing
Hot
Latest

·
--
🚨 MARKET IS RED — BUT LOOK AT THESE DUMPERS 👀
Bitcoin is under pressure today.
Major altcoins are also sliding.
But a few coins are getting hit much harder. 📉
🔻 $NEAR — -12.28%
🔻 $ARB — -12.27%
🔻 $UNI — -9.69%
🔻 $SUI — -8.58%
Big question 👀
Is this just a pullback… or is more downside coming?
No FOMO. No panic.
Watch the market.
$SUI
#Crypto #Altcoins #Market #trading
🚨 MARKET IS RED — BUT LOOK AT THESE DUMPERS 👀
Bitcoin is under pressure today.
Major altcoins are also sliding.
But a few coins are getting hit much harder. 📉
🔻 $NEAR — -12.28%
🔻 $ARB — -12.27%
🔻 $UNI — -9.69%
🔻 $SUI — -8.58%
Big question 👀
Is this just a pullback… or is more downside coming?
No FOMO. No panic.
Watch the market.
$SUI
#Crypto #Altcoins #Market #trading
Bitcoin is under pressure today.
Major altcoins are also sliding.
But a few coins are getting hit much harder. 📉
🔻 $NEAR — -12.28%
🔻 $ARB — -12.27%
🔻 $UNI — -9.69%
🔻 $SUI — -8.58%
Big question 👀
Is this just a pullback… or is more downside coming?
No FOMO. No panic.
Watch the market.
$SUI
#Crypto #Altcoins #Market #trading
4
466

·
--
Net inflow for the single week: $3.55 billion—directly smashing the highest record for 2026. This isn’t a market forecast; it’s simply the buy-order ledger confirmed for the week ending September 29.
Now for an even more extreme detail: out of this massive volume of funds, 97% was accounted for by purchases of U.S. products, which pushed the total size of the global crypto funds to $173 billion.
On one side, retail investors are panicking and speculating about a top during a short-term pullback; on the other, U.S. domestic capital is placing orders at the largest scale within the year. Tens of billions of dollars are concentrating to build positions at this level—what’s being shown isn’t just a quick few-day rebound trade.
The chips are being decisively shifted toward institutions. During the window when the main players are sweeping in with real cash, don’t easily give up your core long-term holdings.
#MARKET
Net inflow for the single week: $3.55 billion—directly smashing the highest record for 2026. This isn’t a market forecast; it’s simply the buy-order ledger confirmed for the week ending September 29.
Now for an even more extreme detail: out of this massive volume of funds, 97% was accounted for by purchases of U.S. products, which pushed the total size of the global crypto funds to $173 billion.
On one side, retail investors are panicking and speculating about a top during a short-term pullback; on the other, U.S. domestic capital is placing orders at the largest scale within the year. Tens of billions of dollars are concentrating to build positions at this level—what’s being shown isn’t just a quick few-day rebound trade.
The chips are being decisively shifted toward institutions. During the window when the main players are sweeping in with real cash, don’t easily give up your core long-term holdings.
#MARKET
Now for an even more extreme detail: out of this massive volume of funds, 97% was accounted for by purchases of U.S. products, which pushed the total size of the global crypto funds to $173 billion.
On one side, retail investors are panicking and speculating about a top during a short-term pullback; on the other, U.S. domestic capital is placing orders at the largest scale within the year. Tens of billions of dollars are concentrating to build positions at this level—what’s being shown isn’t just a quick few-day rebound trade.
The chips are being decisively shifted toward institutions. During the window when the main players are sweeping in with real cash, don’t easily give up your core long-term holdings.
#MARKET
1
135

·
--
Ignore Important News"Republican lawmakers are studying a plan to raise the U.S. debt ceiling during the last weeks of the current Congress, a move intended to deprive the new Democratic majority, if it wins one or both chambers, of an important pressure card in its confrontation with President Donald Trump’s administration."
Ordinary news? Don’t care? Who even cares?!
Ignore Important News
"Republican lawmakers are studying a plan to raise the U.S. debt ceiling during the last weeks of the current Congress, a move intended to deprive the new Democratic majority, if it wins one or both chambers, of an important pressure card in its confrontation with President Donald Trump’s administration."
Ordinary news? Don’t care? Who even cares?!
Ordinary news? Don’t care? Who even cares?!
2
145
·
--
U.S. 30-year Treasury yield hit 5.58%, immediately setting a new high since 2002. Macro funding costs are stuck at elevated levels, while the market is still stubbornly betting on easier liquidity—I don’t buy it.
Historical data is brutally honest: over the past 36 years, whenever the Fed kicked off a rate-hike cycle with 25-basis-point increments, the S&P 500 declined 100% of the time within one month, with an 80% probability of falling within three months. With the money-pricing anchor held high and the peripheral macro environment’s tightening noose already pulling tight.
Don’t take scattered short-term bounces as a lifeline to save the bull market. Underlying liquidity is being mercilessly drained by high interest rates, and any blind optimism to go long at the current market level is just fighting the macro trend head-on.
#MARKET
U.S. 30-year Treasury yield hit 5.58%, immediately setting a new high since 2002. Macro funding costs are stuck at elevated levels, while the market is still stubbornly betting on easier liquidity—I don’t buy it.
Historical data is brutally honest: over the past 36 years, whenever the Fed kicked off a rate-hike cycle with 25-basis-point increments, the S&P 500 declined 100% of the time within one month, with an 80% probability of falling within three months. With the money-pricing anchor held high and the peripheral macro environment’s tightening noose already pulling tight.
Don’t take scattered short-term bounces as a lifeline to save the bull market. Underlying liquidity is being mercilessly drained by high interest rates, and any blind optimism to go long at the current market level is just fighting the macro trend head-on.
#MARKET
Historical data is brutally honest: over the past 36 years, whenever the Fed kicked off a rate-hike cycle with 25-basis-point increments, the S&P 500 declined 100% of the time within one month, with an 80% probability of falling within three months. With the money-pricing anchor held high and the peripheral macro environment’s tightening noose already pulling tight.
Don’t take scattered short-term bounces as a lifeline to save the bull market. Underlying liquidity is being mercilessly drained by high interest rates, and any blind optimism to go long at the current market level is just fighting the macro trend head-on.
#MARKET
SPY-0.25%
TLTETF-0.25%
92
·
--
$420 million long positions liquidated, but the market hasn’t broken into a one-way selloff—instead, it’s just stuck waiting. What’s really worth watching isn’t the liquidation figure, but the fact that even such massive leveraged liquidations didn’t manage to smash out a clear direction.
On one side, we’re waiting for the Iran–US negotiation news to land; on the other, we’re waiting for the answer from the Non-Farm Payrolls and the October rate-hike expectations. The macro variables haven’t disappeared—if anything, they’ve layered on top of each other, making it naturally harder for funds to take a one-way bet.
So I’m more inclined to define the current situation as ranging, rather than rushing to treat a single spike as a trend. Before there’s an answer, volatility is high—but high volatility doesn’t mean the direction has already emerged.
#MARKET
$420 million long positions liquidated, but the market hasn’t broken into a one-way selloff—instead, it’s just stuck waiting. What’s really worth watching isn’t the liquidation figure, but the fact that even such massive leveraged liquidations didn’t manage to smash out a clear direction.
On one side, we’re waiting for the Iran–US negotiation news to land; on the other, we’re waiting for the answer from the Non-Farm Payrolls and the October rate-hike expectations. The macro variables haven’t disappeared—if anything, they’ve layered on top of each other, making it naturally harder for funds to take a one-way bet.
So I’m more inclined to define the current situation as ranging, rather than rushing to treat a single spike as a trend. Before there’s an answer, volatility is high—but high volatility doesn’t mean the direction has already emerged.
#MARKET
On one side, we’re waiting for the Iran–US negotiation news to land; on the other, we’re waiting for the answer from the Non-Farm Payrolls and the October rate-hike expectations. The macro variables haven’t disappeared—if anything, they’ve layered on top of each other, making it naturally harder for funds to take a one-way bet.
So I’m more inclined to define the current situation as ranging, rather than rushing to treat a single spike as a trend. Before there’s an answer, volatility is high—but high volatility doesn’t mean the direction has already emerged.
#MARKET
风中浪客:
这4.2亿爆完还砸不出方向,说明杠杆洗得差不多了,现在就是来回搓、专治手痒。等非农和伊朗那边给答案吧,没落地前追单边容易被两边扇。
1
1.1k


·
--
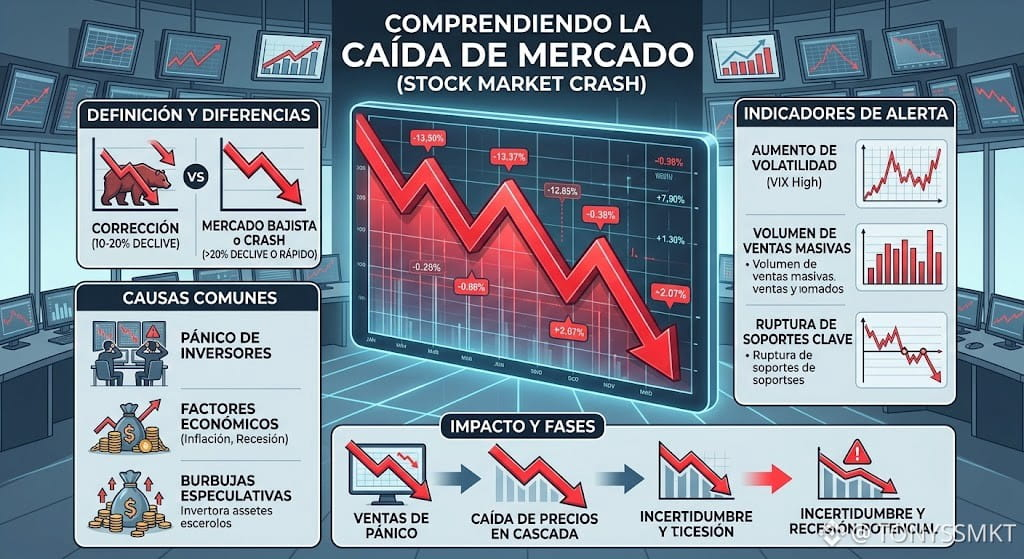
Why do cryptocurrency prices move so much? 📊
The price is affected by many factors, including:
• Supply and demand
• News and project developments
• Global market conditions
• Liquidity and trading volume
• Investor expectations
• Regulatory changes
That’s why there isn’t a single factor that can explain every price movement.
And anyone who says they can predict the market’s movement with certainty, you should treat their words with caution.
#Crypto #Bitcoin #Trading #Market
Why do cryptocurrency prices move so much? 📊
The price is affected by many factors, including:
• Supply and demand
• News and project developments
• Global market conditions
• Liquidity and trading volume
• Investor expectations
• Regulatory changes
That’s why there isn’t a single factor that can explain every price movement.
And anyone who says they can predict the market’s movement with certainty, you should treat their words with caution.
#Crypto #Bitcoin #Trading #Market
The price is affected by many factors, including:
• Supply and demand
• News and project developments
• Global market conditions
• Liquidity and trading volume
• Investor expectations
• Regulatory changes
That’s why there isn’t a single factor that can explain every price movement.
And anyone who says they can predict the market’s movement with certainty, you should treat their words with caution.
#Crypto #Bitcoin #Trading #Market
74

·
--
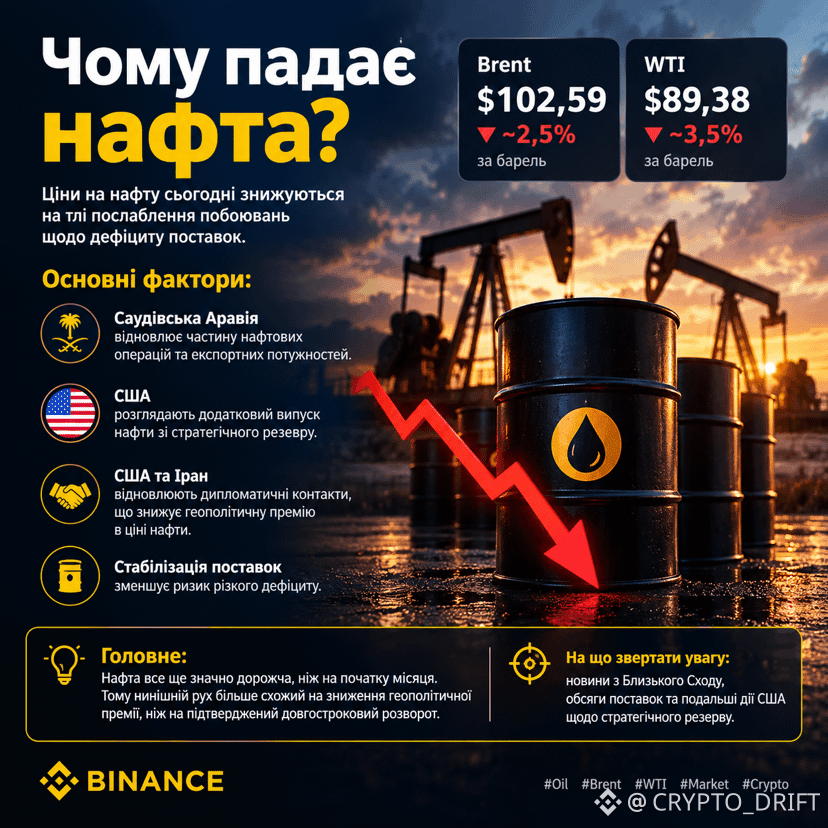
🛢️ Oil резко падает: what’s happening?
Oil prices today are falling amid easing concerns about a supply shortage.
📉 Brent is down below $103 per barrel, and WTI — below $90.
Key factors putting pressure on prices:
• 🇸🇦 Saudi Arabia is resuming some oil operations and export capacity.
• 🇺🇸 The U.S. is considering additional oil releases from the strategic reserve.
• 🤝 The resumption of diplomatic contacts between the U.S. and Iran reduces the geopolitical premium in the price of oil.
• ⛽ Expectations of stabilized supplies lower the risk of a sudden shortage.
At the same time, oil remains significantly more expensive than at the beginning of the month. So the current move looks more like a reduction in the geopolitical premium than a confirmed long-term reversal.
For traders, the key now are news from the Middle East, shipment volumes, and the U.S.’s further actions regarding the strategic reserve.
#oil #market #Crypto
🛢️ Oil резко падает: what’s happening?
Oil prices today are falling amid easing concerns about a supply shortage.
📉 Brent is down below $103 per barrel, and WTI — below $90.
Key factors putting pressure on prices:
• 🇸🇦 Saudi Arabia is resuming some oil operations and export capacity.
• 🇺🇸 The U.S. is considering additional oil releases from the strategic reserve.
• 🤝 The resumption of diplomatic contacts between the U.S. and Iran reduces the geopolitical premium in the price of oil.
• ⛽ Expectations of stabilized supplies lower the risk of a sudden shortage.
At the same time, oil remains significantly more expensive than at the beginning of the month. So the current move looks more like a reduction in the geopolitical premium than a confirmed long-term reversal.
For traders, the key now are news from the Middle East, shipment volumes, and the U.S.’s further actions regarding the strategic reserve.
#oil #market #Crypto
Oil prices today are falling amid easing concerns about a supply shortage.
📉 Brent is down below $103 per barrel, and WTI — below $90.
Key factors putting pressure on prices:
• 🇸🇦 Saudi Arabia is resuming some oil operations and export capacity.
• 🇺🇸 The U.S. is considering additional oil releases from the strategic reserve.
• 🤝 The resumption of diplomatic contacts between the U.S. and Iran reduces the geopolitical premium in the price of oil.
• ⛽ Expectations of stabilized supplies lower the risk of a sudden shortage.
At the same time, oil remains significantly more expensive than at the beginning of the month. So the current move looks more like a reduction in the geopolitical premium than a confirmed long-term reversal.
For traders, the key now are news from the Middle East, shipment volumes, and the U.S.’s further actions regarding the strategic reserve.
#oil #market #Crypto
2
85
·
--
Over 120,000 liquidations in 24 hours; of the $670 million total, $570 million was long positions. After BTC fell below $76,000 and ETH dropped below $2,400 to a recent low—this isn’t evidence of “it dropped too much so it should rebound,” but rather that long leverage is being liquidated in a concentrated sweep.
I care more about this structure: liquidation can wipe out a batch of positions, but it can’t prove that spot selling pressure has ended. Treating liquidation numbers as a bottom signal is misreading forced exits as a return of buying.
Before price regains stable footing and selling pressure truly converges, I remain somewhat bearish on the broader market. This move first shows how crowded the longs were—yet it hasn’t proven the buyer has returned.
#MARKET
Over 120,000 liquidations in 24 hours; of the $670 million total, $570 million was long positions. After BTC fell below $76,000 and ETH dropped below $2,400 to a recent low—this isn’t evidence of “it dropped too much so it should rebound,” but rather that long leverage is being liquidated in a concentrated sweep.
I care more about this structure: liquidation can wipe out a batch of positions, but it can’t prove that spot selling pressure has ended. Treating liquidation numbers as a bottom signal is misreading forced exits as a return of buying.
Before price regains stable footing and selling pressure truly converges, I remain somewhat bearish on the broader market. This move first shows how crowded the longs were—yet it hasn’t proven the buyer has returned.
#MARKET
I care more about this structure: liquidation can wipe out a batch of positions, but it can’t prove that spot selling pressure has ended. Treating liquidation numbers as a bottom signal is misreading forced exits as a return of buying.
Before price regains stable footing and selling pressure truly converges, I remain somewhat bearish on the broader market. This move first shows how crowded the longs were—yet it hasn’t proven the buyer has returned.
#MARKET
315
·
--
In the past, crypto projects feared mentioning “token buybacks.” They were afraid the SEC would label it as a securities-related matter. But now, this red line has moved back.
In its latest Q&A guidance, the SEC has clarified that, provided the network remains available, when a project announces token buybacks or performs network maintenance, it will no longer be automatically viewed as efforts to manage a security. Once the compliance noose is loosened, on-chain buybacks that were previously kept under wraps can finally be pushed forward openly.
Stop using compliance risk as an excuse for being bearish. The underlying rules are changing, and the room for imagination within token economic models has just been genuinely opened up.
#MARKET
In the past, crypto projects feared mentioning “token buybacks.” They were afraid the SEC would label it as a securities-related matter. But now, this red line has moved back.
In its latest Q&A guidance, the SEC has clarified that, provided the network remains available, when a project announces token buybacks or performs network maintenance, it will no longer be automatically viewed as efforts to manage a security. Once the compliance noose is loosened, on-chain buybacks that were previously kept under wraps can finally be pushed forward openly.
Stop using compliance risk as an excuse for being bearish. The underlying rules are changing, and the room for imagination within token economic models has just been genuinely opened up.
#MARKET
In its latest Q&A guidance, the SEC has clarified that, provided the network remains available, when a project announces token buybacks or performs network maintenance, it will no longer be automatically viewed as efforts to manage a security. Once the compliance noose is loosened, on-chain buybacks that were previously kept under wraps can finally be pushed forward openly.
Stop using compliance risk as an excuse for being bearish. The underlying rules are changing, and the room for imagination within token economic models has just been genuinely opened up.
#MARKET
52

·
--

Article
Crypto Market Overview: Reading the Current Cycle2026 has been a year of range-bound volatility rather than a clean trend in either direction. Bitcoin spent much of the summer consolidating in the low-to-mid $60,000s before staging a recovery — by early September, BTC was trading around $79,697, up roughly 25% from where it stood a month earlier, though still well below its level from a year prior. That kind of swing — a sharp bounce off a multi-month base — is the defining pattern of this market right now: sentiment shifting fast in both directions, with no shortage of macro noise driving it.
Fortune
What's Driving the Volatility
Macro sensitivity. Rate expectations, ETF flow data, and broader risk-asset sentiment are moving crypto as much as anything "crypto-native." Bitcoin is trading more like a macro asset than it did in prior cycles.
ETF flows as a swing factor. Institutional inflows and outflows through spot BTC and ETH ETFs have become one of the clearest short-term price signals — sharp outflow periods have coincided with local bottoms, and inflow surges with recoveries.
Altcoin dispersion. Rather than moving in lockstep with BTC, altcoins are showing wider performance gaps — some sectors (AI-linked tokens, tokenized real-world assets) have outperformed, while others lag badly. Dominance is shifting sector by sector, not just coin by coin.
What This Means for Traders
A range-bound, macro-driven market rewards different behavior than a trending one:
Levels matter more than narratives. In a choppy market, key support/resistance zones tend to hold more predictive value than headline-driven hype.
Position sizing over conviction. Sharp reversals punish overleveraged directional bets. Smaller size with wider stops tends to outperform all-in conviction trades in this kind of tape.
Watch flows, not just price. ETF inflow/outflow data and on-chain exchange balances are giving cleaner signals than price action alone right now.
This isn't a market defined by a single dominant narrative — it's defined by volatility around a wide range, with institutional flows increasingly setting the tone. Traders who adapt their strategy to range conditions, rather than forcing a trending-market playbook onto a choppy one, are better positioned regardless of which direction the next breakout comes.
Not financial advice — always do your own research.#Btc #market #CoinMarketCapCompletesCoinglassAcquisition $ETH $BTC
Crypto Market Overview: Reading the Current Cycle
2026 has been a year of range-bound volatility rather than a clean trend in either direction. Bitcoin spent much of the summer consolidating in the low-to-mid $60,000s before staging a recovery — by early September, BTC was trading around $79,697, up roughly 25% from where it stood a month earlier, though still well below its level from a year prior. That kind of swing — a sharp bounce off a multi-month base — is the defining pattern of this market right now: sentiment shifting fast in both directions, with no shortage of macro noise driving it.
Fortune
What's Driving the Volatility
Macro sensitivity. Rate expectations, ETF flow data, and broader risk-asset sentiment are moving crypto as much as anything "crypto-native." Bitcoin is trading more like a macro asset than it did in prior cycles.
ETF flows as a swing factor. Institutional inflows and outflows through spot BTC and ETH ETFs have become one of the clearest short-term price signals — sharp outflow periods have coincided with local bottoms, and inflow surges with recoveries.
Altcoin dispersion. Rather than moving in lockstep with BTC, altcoins are showing wider performance gaps — some sectors (AI-linked tokens, tokenized real-world assets) have outperformed, while others lag badly. Dominance is shifting sector by sector, not just coin by coin.
What This Means for Traders
A range-bound, macro-driven market rewards different behavior than a trending one:
Levels matter more than narratives. In a choppy market, key support/resistance zones tend to hold more predictive value than headline-driven hype.
Position sizing over conviction. Sharp reversals punish overleveraged directional bets. Smaller size with wider stops tends to outperform all-in conviction trades in this kind of tape.
Watch flows, not just price. ETF inflow/outflow data and on-chain exchange balances are giving cleaner signals than price action alone right now.
This isn't a market defined by a single dominant narrative — it's defined by volatility around a wide range, with institutional flows increasingly setting the tone. Traders who adapt their strategy to range conditions, rather than forcing a trending-market playbook onto a choppy one, are better positioned regardless of which direction the next breakout comes.
Not financial advice — always do your own research.#Btc #market #CoinMarketCapCompletesCoinglassAcquisition $ETH $BTC
Fortune
What's Driving the Volatility
Macro sensitivity. Rate expectations, ETF flow data, and broader risk-asset sentiment are moving crypto as much as anything "crypto-native." Bitcoin is trading more like a macro asset than it did in prior cycles.
ETF flows as a swing factor. Institutional inflows and outflows through spot BTC and ETH ETFs have become one of the clearest short-term price signals — sharp outflow periods have coincided with local bottoms, and inflow surges with recoveries.
Altcoin dispersion. Rather than moving in lockstep with BTC, altcoins are showing wider performance gaps — some sectors (AI-linked tokens, tokenized real-world assets) have outperformed, while others lag badly. Dominance is shifting sector by sector, not just coin by coin.
What This Means for Traders
A range-bound, macro-driven market rewards different behavior than a trending one:
Levels matter more than narratives. In a choppy market, key support/resistance zones tend to hold more predictive value than headline-driven hype.
Position sizing over conviction. Sharp reversals punish overleveraged directional bets. Smaller size with wider stops tends to outperform all-in conviction trades in this kind of tape.
Watch flows, not just price. ETF inflow/outflow data and on-chain exchange balances are giving cleaner signals than price action alone right now.
This isn't a market defined by a single dominant narrative — it's defined by volatility around a wide range, with institutional flows increasingly setting the tone. Traders who adapt their strategy to range conditions, rather than forcing a trending-market playbook onto a choppy one, are better positioned regardless of which direction the next breakout comes.
Not financial advice — always do your own research.#Btc #market #CoinMarketCapCompletesCoinglassAcquisition $ETH $BTC
90

·
--
Bullish
Verified
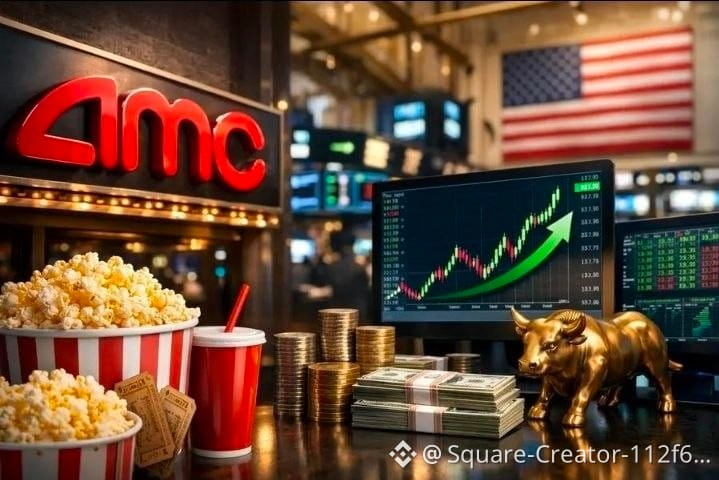
AMC reignites the market! 🎬
AMC’s share rises by about 12% on Monday, driven by accelerating momentum following a debt refinancing plan of nearly $4 billion.
The company aims to restructure its debt maturities and ease refinancing pressure, while the cinema sector also benefits from improved revenues and strong interest in major films.
Are we seeing the start of a new wave for AMC stock?
$AMC #AMC #Stocks #market
AMC reignites the market! 🎬
AMC’s share rises by about 12% on Monday, driven by accelerating momentum following a debt refinancing plan of nearly $4 billion.
The company aims to restructure its debt maturities and ease refinancing pressure, while the cinema sector also benefits from improved revenues and strong interest in major films.
Are we seeing the start of a new wave for AMC stock?
$AMC #AMC #Stocks #market
AMC’s share rises by about 12% on Monday, driven by accelerating momentum following a debt refinancing plan of nearly $4 billion.
The company aims to restructure its debt maturities and ease refinancing pressure, while the cinema sector also benefits from improved revenues and strong interest in major films.
Are we seeing the start of a new wave for AMC stock?
$AMC #AMC #Stocks #market
4
350
·
--
The market that’s being propped up by expectations of “geopolitical de-escalation” has had its foundation completely hollowed out.
Trump promptly and bluntly rejected Iran’s proposal to “reopen the Strait of Hormuz,” and immediately afterward, Iran’s president also refused to meet at the United Nations. Harder nails were driven in next— the Iranian Revolutionary Guard directly unveiled its cards: a protracted war strategy and the deployment of new weapons.
Both sides are exerting maximum pressure, and risk-aversion sentiment will only heat up rapidly. When it comes to real, hands-on conflict, capital’s first reaction is always to pull out. Betting on the crypto market to force a bullish move under this level of risk-off pressure? I don’t buy it.
#MARKET
The market that’s being propped up by expectations of “geopolitical de-escalation” has had its foundation completely hollowed out.
Trump promptly and bluntly rejected Iran’s proposal to “reopen the Strait of Hormuz,” and immediately afterward, Iran’s president also refused to meet at the United Nations. Harder nails were driven in next— the Iranian Revolutionary Guard directly unveiled its cards: a protracted war strategy and the deployment of new weapons.
Both sides are exerting maximum pressure, and risk-aversion sentiment will only heat up rapidly. When it comes to real, hands-on conflict, capital’s first reaction is always to pull out. Betting on the crypto market to force a bullish move under this level of risk-off pressure? I don’t buy it.
#MARKET
Trump promptly and bluntly rejected Iran’s proposal to “reopen the Strait of Hormuz,” and immediately afterward, Iran’s president also refused to meet at the United Nations. Harder nails were driven in next— the Iranian Revolutionary Guard directly unveiled its cards: a protracted war strategy and the deployment of new weapons.
Both sides are exerting maximum pressure, and risk-aversion sentiment will only heat up rapidly. When it comes to real, hands-on conflict, capital’s first reaction is always to pull out. Betting on the crypto market to force a bullish move under this level of risk-off pressure? I don’t buy it.
#MARKET
57
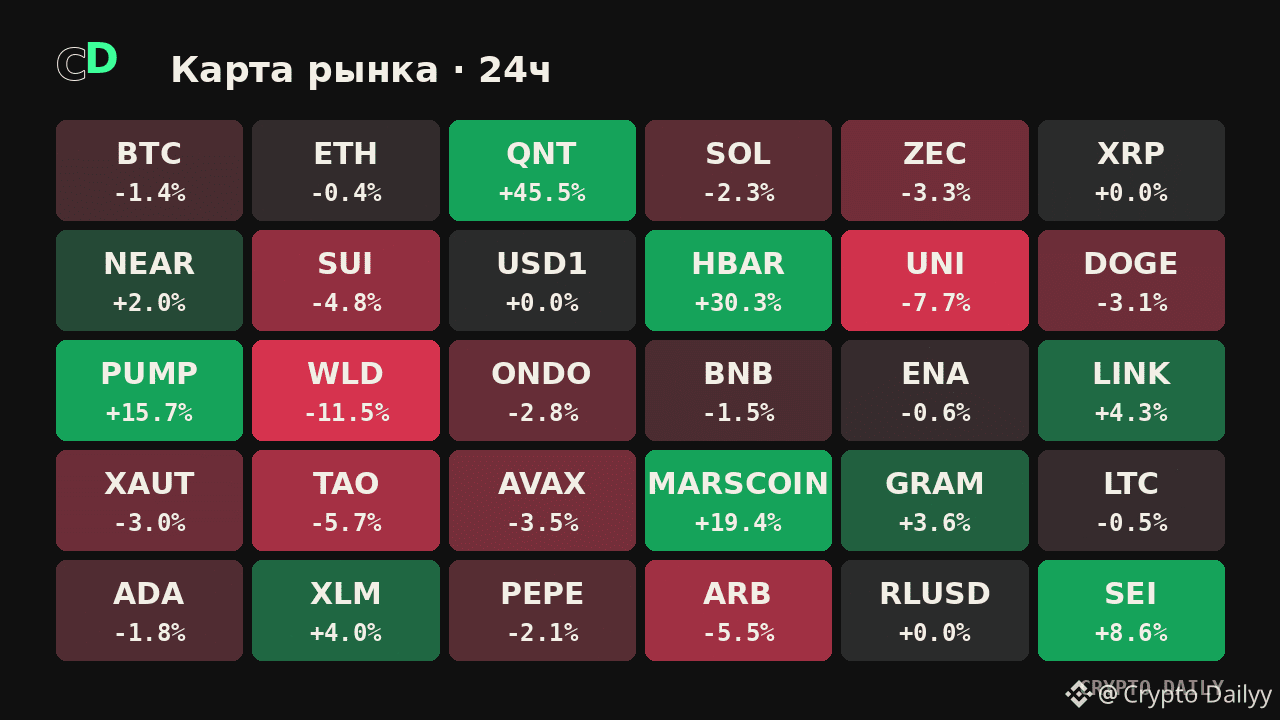
The market today is like a traffic light in rush hour—half are stopped, half are flying 🔥
Out of the top 30 on Binance, only 11 coins are in the green zone, the rest are mourning in red.
$QNT has pumped up by +45.5%, HBAR isn’t lagging with +30.3%, and MARSCOIN has flown off by +19.4%—looks like they decided to go to Mars without any transfers.
But $WLD (-11.5%) and UNI with TAO clearly mistook the rocket for an elevator straight down to the basement.
A classic: some to the moon, others to Earth—the market, as always, has no consensus 🤔
Are you pumping with the whales today, or silently watching the dump? Comment below 👇
#Crypto #Binance #Altcoins #Market
The market today is like a traffic light in rush hour—half are stopped, half are flying 🔥
Out of the top 30 on Binance, only 11 coins are in the green zone, the rest are mourning in red.
$QNT has pumped up by +45.5%, HBAR isn’t lagging with +30.3%, and MARSCOIN has flown off by +19.4%—looks like they decided to go to Mars without any transfers.
But $WLD (-11.5%) and UNI with TAO clearly mistook the rocket for an elevator straight down to the basement.
A classic: some to the moon, others to Earth—the market, as always, has no consensus 🤔
Are you pumping with the whales today, or silently watching the dump? Comment below 👇
#Crypto #Binance #Altcoins #Market
Out of the top 30 on Binance, only 11 coins are in the green zone, the rest are mourning in red.
$QNT has pumped up by +45.5%, HBAR isn’t lagging with +30.3%, and MARSCOIN has flown off by +19.4%—looks like they decided to go to Mars without any transfers.
But $WLD (-11.5%) and UNI with TAO clearly mistook the rocket for an elevator straight down to the basement.
A classic: some to the moon, others to Earth—the market, as always, has no consensus 🤔
Are you pumping with the whales today, or silently watching the dump? Comment below 👇
#Crypto #Binance #Altcoins #Market
407
·
--
Within a single day, market expectations for the Federal Reserve’s October rate hike jumped directly from 53% to 77.5%.
With this hawkish repricing, the U.S. 10-year Treasury yield surged to 5.11%, reaching the highest level since 2007.
Put these two numbers together, and it means the macro liquidity-draining machine has been turned to maximum. When the risk-free yield hits its highest level in more than a decade, there’s simply no reason for funds to keep holding on in the crypto market without fundamental support.
As risk-free rates rise, risk-asset valuations fall—asserting that the bottom has already formed based on just a few rebound candlesticks is something I don’t buy. The heavy pressure from liquidity retreat hasn’t been lifted yet, and reaching out to catch a falling knife is far too early.
#MARKET
Within a single day, market expectations for the Federal Reserve’s October rate hike jumped directly from 53% to 77.5%.
With this hawkish repricing, the U.S. 10-year Treasury yield surged to 5.11%, reaching the highest level since 2007.
Put these two numbers together, and it means the macro liquidity-draining machine has been turned to maximum. When the risk-free yield hits its highest level in more than a decade, there’s simply no reason for funds to keep holding on in the crypto market without fundamental support.
As risk-free rates rise, risk-asset valuations fall—asserting that the bottom has already formed based on just a few rebound candlesticks is something I don’t buy. The heavy pressure from liquidity retreat hasn’t been lifted yet, and reaching out to catch a falling knife is far too early.
#MARKET
With this hawkish repricing, the U.S. 10-year Treasury yield surged to 5.11%, reaching the highest level since 2007.
Put these two numbers together, and it means the macro liquidity-draining machine has been turned to maximum. When the risk-free yield hits its highest level in more than a decade, there’s simply no reason for funds to keep holding on in the crypto market without fundamental support.
As risk-free rates rise, risk-asset valuations fall—asserting that the bottom has already formed based on just a few rebound candlesticks is something I don’t buy. The heavy pressure from liquidity retreat hasn’t been lifted yet, and reaching out to catch a falling knife is far too early.
#MARKET
84

Article
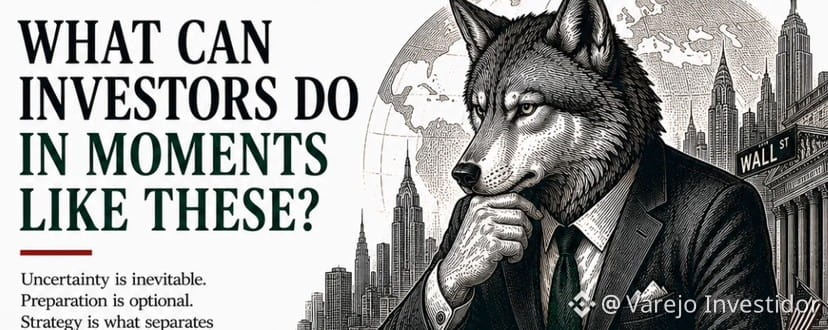
WHY THE DOLLAR SITS AT THE CENTER OF GLOBAL FINANCEThe U.S. dollar’s international role is not based on a single factor. It has developed through decades of trade, financial markets, banking relationships and reserve management.
A major part of the system comes from the fact that international transactions frequently involve dollar-denominated assets and liabilities. Commodities and financial contracts can be priced in dollars, while banks, corporations and governments may hold dollar reserves or borrow in the currency.
This creates a network effect.
GLOBAL TRADE → DOLLAR SETTLEMENT → FINANCIAL MARKETS → RESERVE DEMAND
The more deeply a currency is integrated into international commerce and finance, the more infrastructure exists around it. Banks maintain dollar liquidity, institutions hold dollar assets and companies manage exposures through global currency markets.
That structure also means changes in U.S. monetary conditions can have consequences well beyond the United States. Interest rates, liquidity and the value of the dollar can influence capital flows, emerging markets, commodities and corporate financing conditions.
The important distinction is between the dollar itself and the system built around it.
Reserve currencies are supported not only by economic size, but also by financial infrastructure, market depth, institutional frameworks and international demand.
Understanding that network helps explain why the dollar remains such an important variable in global markets.
#oil #market #finance #economy
$TLTP.ETF
$GLWB
{spot}(GLWBUSDT)
$EEM.ETF
{etf_us}(EEM.ETF)
{stock_us}(UUUU.US)
WHY THE DOLLAR SITS AT THE CENTER OF GLOBAL FINANCE
The U.S. dollar’s international role is not based on a single factor. It has developed through decades of trade, financial markets, banking relationships and reserve management.
A major part of the system comes from the fact that international transactions frequently involve dollar-denominated assets and liabilities. Commodities and financial contracts can be priced in dollars, while banks, corporations and governments may hold dollar reserves or borrow in the currency.
This creates a network effect.
GLOBAL TRADE → DOLLAR SETTLEMENT → FINANCIAL MARKETS → RESERVE DEMAND
The more deeply a currency is integrated into international commerce and finance, the more infrastructure exists around it. Banks maintain dollar liquidity, institutions hold dollar assets and companies manage exposures through global currency markets.
That structure also means changes in U.S. monetary conditions can have consequences well beyond the United States. Interest rates, liquidity and the value of the dollar can influence capital flows, emerging markets, commodities and corporate financing conditions.
The important distinction is between the dollar itself and the system built around it.
Reserve currencies are supported not only by economic size, but also by financial infrastructure, market depth, institutional frameworks and international demand.
Understanding that network helps explain why the dollar remains such an important variable in global markets.
#oil #market #finance #economy
$TLTP.ETF
$GLWB
$EEM.ETF
A major part of the system comes from the fact that international transactions frequently involve dollar-denominated assets and liabilities. Commodities and financial contracts can be priced in dollars, while banks, corporations and governments may hold dollar reserves or borrow in the currency.
This creates a network effect.
GLOBAL TRADE → DOLLAR SETTLEMENT → FINANCIAL MARKETS → RESERVE DEMAND
The more deeply a currency is integrated into international commerce and finance, the more infrastructure exists around it. Banks maintain dollar liquidity, institutions hold dollar assets and companies manage exposures through global currency markets.
That structure also means changes in U.S. monetary conditions can have consequences well beyond the United States. Interest rates, liquidity and the value of the dollar can influence capital flows, emerging markets, commodities and corporate financing conditions.
The important distinction is between the dollar itself and the system built around it.
Reserve currencies are supported not only by economic size, but also by financial infrastructure, market depth, institutional frameworks and international demand.
Understanding that network helps explain why the dollar remains such an important variable in global markets.
#oil #market #finance #economy
$TLTP.ETF
$GLWB
$EEM.ETF
1
42
Article
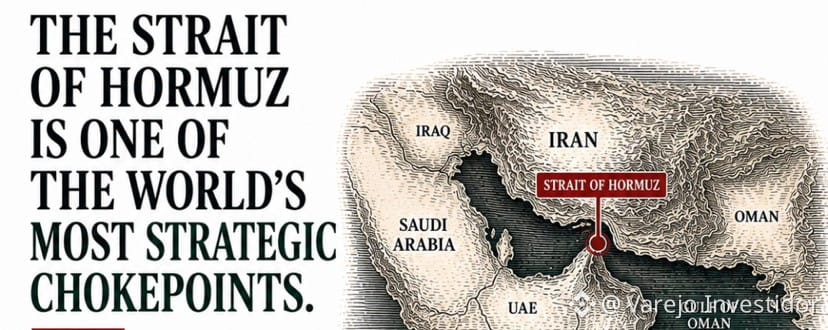
THE WORLD’S ENERGY TRADE PASSES THROUGH A NARROW GATESome of the most important points on the global map are surprisingly small.
The Strait of Hormuz is a narrow maritime passage between Iran and Oman, connecting the Persian Gulf with the Gulf of Oman. Its geographic position gives it an outsized role in the international energy system.
The image highlights a simple chain:
MIDDLE EAST → HORMUZ → GLOBAL ENERGY FLOWS
Large volumes of petroleum products and other energy cargoes move through this corridor toward international markets. That concentration creates a potential vulnerability: when geopolitical tensions rise around a critical shipping route, the consequences can extend well beyond the countries surrounding it.
The first impact may appear in freight and energy markets. From there, higher transportation or energy costs can influence inflation expectations, corporate margins, consumer prices and economic growth.
This is why geography matters to investors.
A shipping lane does not need to be large to become economically important. What matters is what the world depends on moving through it.
The Strait of Hormuz is therefore more than a location on a map. It is part of the infrastructure connecting energy producers with consumers across continents.
In global markets, sometimes the smallest points on the map can carry the largest economic consequences.
#market #oil #trading #economy
$USO.ETF
$XOM.US
{stock_us}(XOM.US)
$CVX.US
{stock_us}(CVX.US)
{future}(XAUUSDT)
THE WORLD’S ENERGY TRADE PASSES THROUGH A NARROW GATE
Some of the most important points on the global map are surprisingly small.
The Strait of Hormuz is a narrow maritime passage between Iran and Oman, connecting the Persian Gulf with the Gulf of Oman. Its geographic position gives it an outsized role in the international energy system.
The image highlights a simple chain:
MIDDLE EAST → HORMUZ → GLOBAL ENERGY FLOWS
Large volumes of petroleum products and other energy cargoes move through this corridor toward international markets. That concentration creates a potential vulnerability: when geopolitical tensions rise around a critical shipping route, the consequences can extend well beyond the countries surrounding it.
The first impact may appear in freight and energy markets. From there, higher transportation or energy costs can influence inflation expectations, corporate margins, consumer prices and economic growth.
This is why geography matters to investors.
A shipping lane does not need to be large to become economically important. What matters is what the world depends on moving through it.
The Strait of Hormuz is therefore more than a location on a map. It is part of the infrastructure connecting energy producers with consumers across continents.
In global markets, sometimes the smallest points on the map can carry the largest economic consequences.
#market #oil #trading #economy
$USO.ETF
$XOM.US
$CVX.US
The Strait of Hormuz is a narrow maritime passage between Iran and Oman, connecting the Persian Gulf with the Gulf of Oman. Its geographic position gives it an outsized role in the international energy system.
The image highlights a simple chain:
MIDDLE EAST → HORMUZ → GLOBAL ENERGY FLOWS
Large volumes of petroleum products and other energy cargoes move through this corridor toward international markets. That concentration creates a potential vulnerability: when geopolitical tensions rise around a critical shipping route, the consequences can extend well beyond the countries surrounding it.
The first impact may appear in freight and energy markets. From there, higher transportation or energy costs can influence inflation expectations, corporate margins, consumer prices and economic growth.
This is why geography matters to investors.
A shipping lane does not need to be large to become economically important. What matters is what the world depends on moving through it.
The Strait of Hormuz is therefore more than a location on a map. It is part of the infrastructure connecting energy producers with consumers across continents.
In global markets, sometimes the smallest points on the map can carry the largest economic consequences.
#market #oil #trading #economy
$USO.ETF
$XOM.US
$CVX.US
2
312
Article
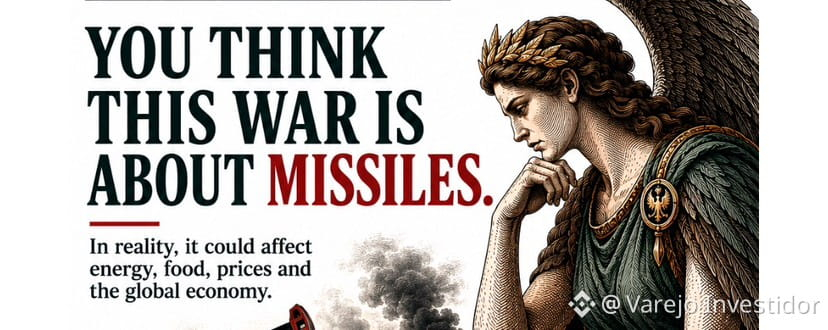
THE REAL BATTLE MAY BE HAPPENING FAR BEYOND THE BATTLEFIELDA conflict around Iran and the Strait of Hormuz is not only a military story. It is also a story about energy, shipping routes, inflation and the global economy.
Hormuz is one of the world’s most strategically important maritime chokepoints. Disruptions or heightened risks in the area can affect how energy moves from producers to consumers, increasing uncertainty across global supply chains.
The market transmission mechanism can be powerful:
GEOPOLITICAL TENSION → ENERGY RISK → SHIPPING COSTS → INFLATION → MARKETS
Higher energy costs can influence transportation, manufacturing and consumer prices. Companies exposed to fuel and logistics may face changing costs, while investors reassess expectations for inflation, interest rates and economic growth.
This is why geopolitical events can move assets far outside the region where the conflict occurs. Oil prices, energy companies, currencies, bonds, commodities and even digital assets can all become part of the market’s response to a major global shock.
The important question is therefore not simply what happens on the battlefield.
It is what happens to the infrastructure connecting the world.
When energy routes, trade flows or strategic chokepoints come under pressure, a regional event can become an international economic issue.
Understanding those connections is essential for reading the market beyond the headlines.
#market #oil #russia #economy $OILK.ETF
$GLDB.ETF
{etf_us}(GLDB.ETF)
$BNOV.ETF
{etf_us}(BNOV.ETF)
{future}(XAUUSDT)
THE REAL BATTLE MAY BE HAPPENING FAR BEYOND THE BATTLEFIELD
A conflict around Iran and the Strait of Hormuz is not only a military story. It is also a story about energy, shipping routes, inflation and the global economy.
Hormuz is one of the world’s most strategically important maritime chokepoints. Disruptions or heightened risks in the area can affect how energy moves from producers to consumers, increasing uncertainty across global supply chains.
The market transmission mechanism can be powerful:
GEOPOLITICAL TENSION → ENERGY RISK → SHIPPING COSTS → INFLATION → MARKETS
Higher energy costs can influence transportation, manufacturing and consumer prices. Companies exposed to fuel and logistics may face changing costs, while investors reassess expectations for inflation, interest rates and economic growth.
This is why geopolitical events can move assets far outside the region where the conflict occurs. Oil prices, energy companies, currencies, bonds, commodities and even digital assets can all become part of the market’s response to a major global shock.
The important question is therefore not simply what happens on the battlefield.
It is what happens to the infrastructure connecting the world.
When energy routes, trade flows or strategic chokepoints come under pressure, a regional event can become an international economic issue.
Understanding those connections is essential for reading the market beyond the headlines.
#market #oil #russia #economy $OILK.ETF
$GLDB.ETF
$BNOV.ETF
Hormuz is one of the world’s most strategically important maritime chokepoints. Disruptions or heightened risks in the area can affect how energy moves from producers to consumers, increasing uncertainty across global supply chains.
The market transmission mechanism can be powerful:
GEOPOLITICAL TENSION → ENERGY RISK → SHIPPING COSTS → INFLATION → MARKETS
Higher energy costs can influence transportation, manufacturing and consumer prices. Companies exposed to fuel and logistics may face changing costs, while investors reassess expectations for inflation, interest rates and economic growth.
This is why geopolitical events can move assets far outside the region where the conflict occurs. Oil prices, energy companies, currencies, bonds, commodities and even digital assets can all become part of the market’s response to a major global shock.
The important question is therefore not simply what happens on the battlefield.
It is what happens to the infrastructure connecting the world.
When energy routes, trade flows or strategic chokepoints come under pressure, a regional event can become an international economic issue.
Understanding those connections is essential for reading the market beyond the headlines.
#market #oil #russia #economy $OILK.ETF
$GLDB.ETF
$BNOV.ETF
1
68
·
--
“A Bank of Japan rate hike equals funds pulling out”—this is muscle memory unmoored from the data. It’s time to change.
On September 18, the Bank of Japan announced a 25-basis-point rate hike, yet the real market chart followed a completely opposite script: the yen not only didn’t strengthen, but instead weakened by nearly 3%; the fear index fell rather than rose, and BTC in the same period surged by 3.5%.
Why did the news and price move in opposite directions? Because a split inside the central bank was exposed by the 7-to-2 voting result, and the U.S.-Japan interest-rate spread didn’t narrow in any meaningful way. A lot of people imagined a liquidation stampede of carry-trade funds—but it simply didn’t happen.
Don’t let a single macro headline scare you into giving up your position. After the so-called negative news was “priced in,” the market backed the bullish case with real money: the foundation is far harder than you think.
#MARKET
“A Bank of Japan rate hike equals funds pulling out”—this is muscle memory unmoored from the data. It’s time to change.
On September 18, the Bank of Japan announced a 25-basis-point rate hike, yet the real market chart followed a completely opposite script: the yen not only didn’t strengthen, but instead weakened by nearly 3%; the fear index fell rather than rose, and BTC in the same period surged by 3.5%.
Why did the news and price move in opposite directions? Because a split inside the central bank was exposed by the 7-to-2 voting result, and the U.S.-Japan interest-rate spread didn’t narrow in any meaningful way. A lot of people imagined a liquidation stampede of carry-trade funds—but it simply didn’t happen.
Don’t let a single macro headline scare you into giving up your position. After the so-called negative news was “priced in,” the market backed the bullish case with real money: the foundation is far harder than you think.
#MARKET
On September 18, the Bank of Japan announced a 25-basis-point rate hike, yet the real market chart followed a completely opposite script: the yen not only didn’t strengthen, but instead weakened by nearly 3%; the fear index fell rather than rose, and BTC in the same period surged by 3.5%.
Why did the news and price move in opposite directions? Because a split inside the central bank was exposed by the 7-to-2 voting result, and the U.S.-Japan interest-rate spread didn’t narrow in any meaningful way. A lot of people imagined a liquidation stampede of carry-trade funds—but it simply didn’t happen.
Don’t let a single macro headline scare you into giving up your position. After the so-called negative news was “priced in,” the market backed the bullish case with real money: the foundation is far harder than you think.
#MARKET
184
Log in to explore more content
Join global crypto users on Binance Square
⚡️ Get latest and useful information about crypto.
💬 Trusted by the world’s largest crypto exchange.
👍 Discover real insights from verified creators.
Email / Phone number
Trending Topics
1
#AmazonPlansToSell$8BNvidiaChips
4 views
5 Discussing
2
#NEARFallsToAround$4.70Down14%
24,538 views
36 Discussing
3
#EthereumFoundationLaunchesZkAPIOnMainnet
16,072 views
272 Discussing
4
#EvernorthPlansNasdaqListingOct8
33,898 views
260 Discussing
5
#SECProposesCryptoCustodyFramework
32,217 views
219 Discussing
6
#IMFApproves$139MDisbursementToElSalvador
22,966 views
17 Discussing
7
#AnthropicTargetsIPOAsSoonAsMidNovember
24,836 views
220 Discussing
8
#EtherGains70.9%InQ3
231,057 views
1,533 Discussing
9
#TreasuryLetsStatesFileStablecoinCertificationsEarly
17,530 views
112 Discussing
10
#US10YearYieldNears5.3%
188,722 views
1,371 Discussing