
#ichimoku
ichimoku
77,110 views
279 Discussing
Hot
Latest

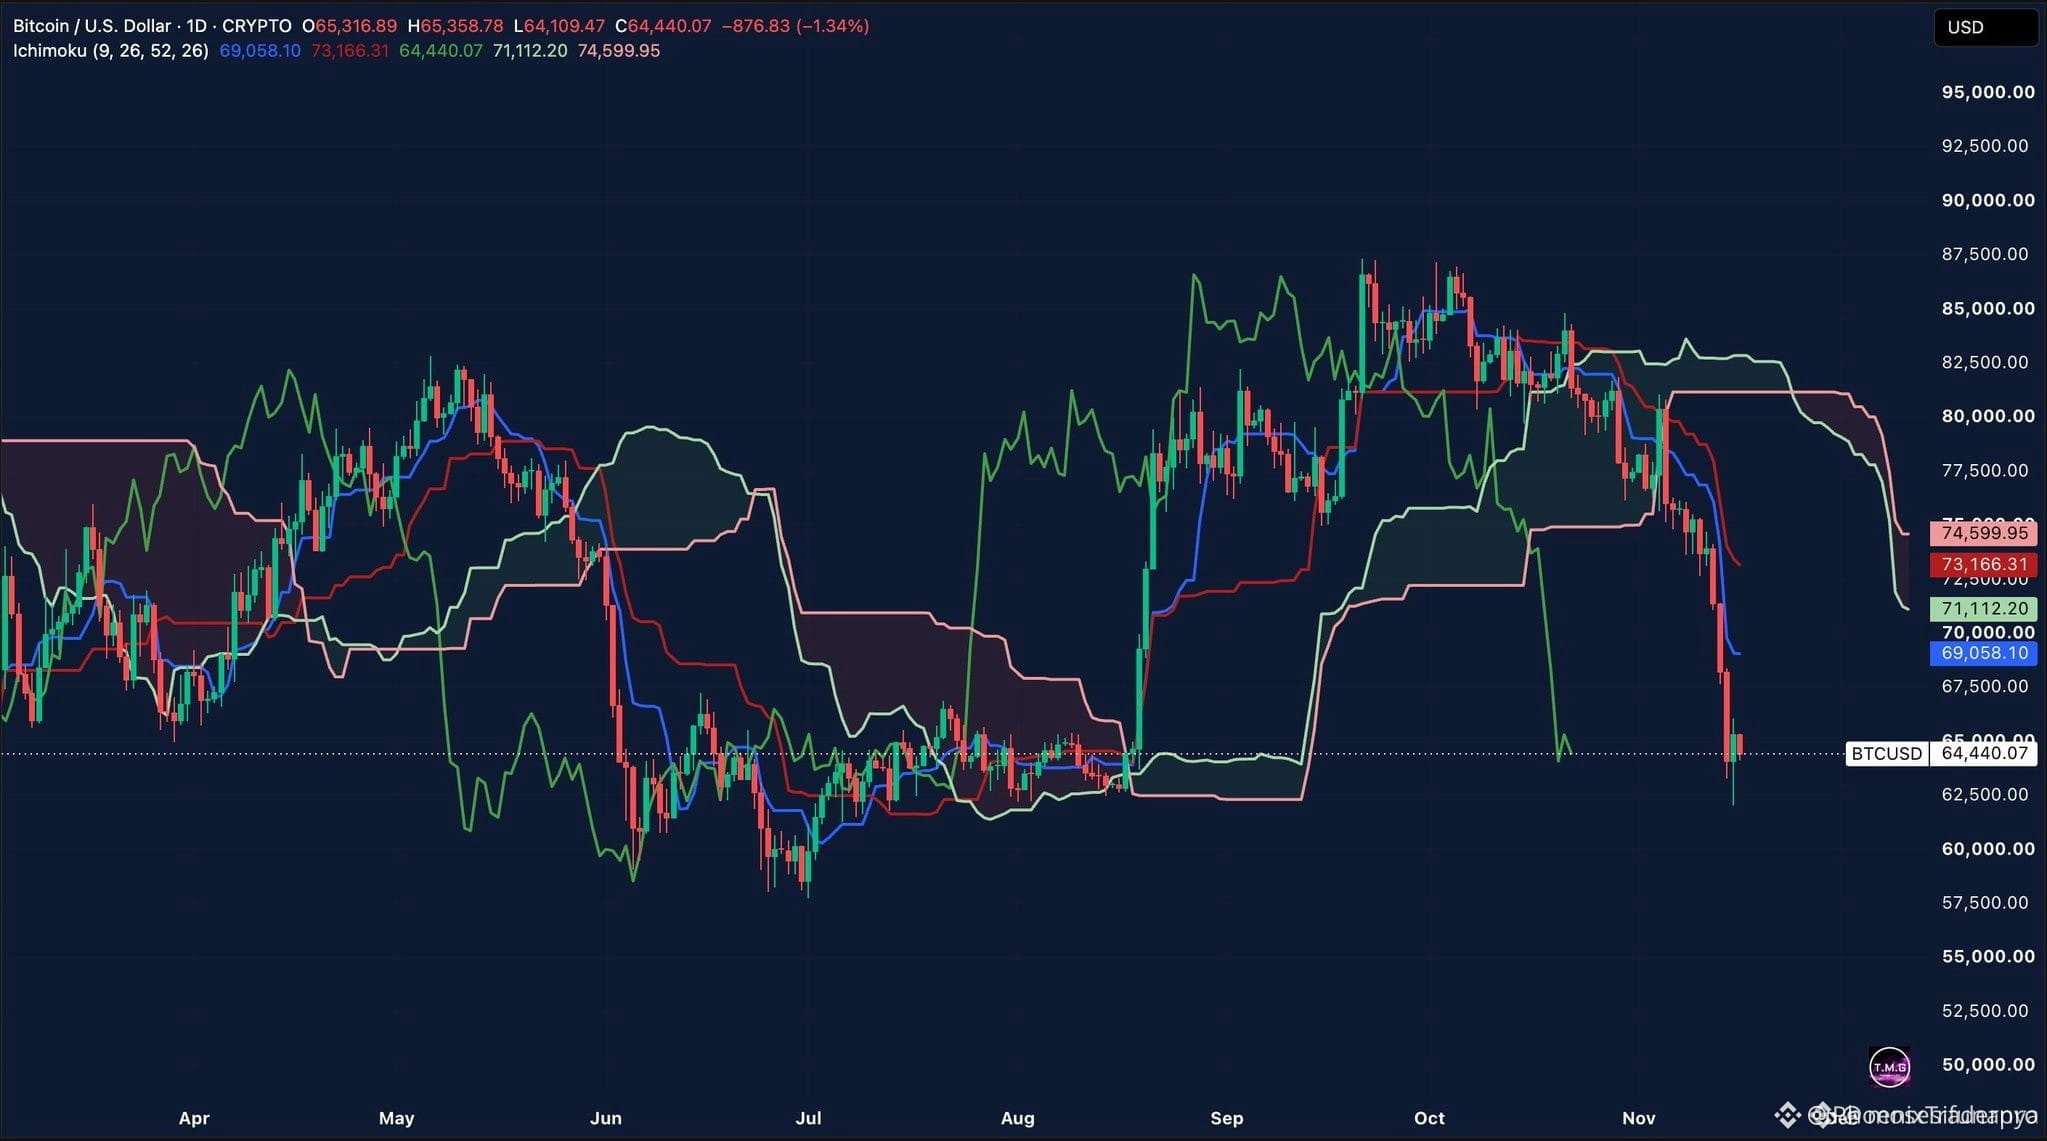
🐻 $BTC BEARS ARE PRESSING HARD BELOW THE DAILY CLOUD 📉
Entry: 64,400 ⚡
Target: 69,000 🚀
Stop Loss: 62,000 ⚠️
The daily Ichimoku structure tells a sobering story of overhead pressure. With price floating below both the Tenkan-sen and Kijun-sen, sellers clearly hold the steering wheel while the massive cloud looms overhead between 71K and 74K. 📊
Patience is the ultimate edge right now. Reclaiming the 69K milestone is the bare minimum ticket for bulls to re-engage, while losing the 64K handle leaves the door wide open toward the 62K liquidity pocket. ⚡
Markets can flip violently from oversold states, but hope is never a valid trading strategy without a confirmed structural reversal. 💡 Are you waiting for a confirmed reclaim above the cloud or preparing to fade the next bounce? 🤔
⚠️ Not financial advice. Always manage your risk. 🛡️
🏷️ #BTC #Bitcoin #Ichimoku #Trading
📉 ⚡
🐻 $BTC BEARS ARE PRESSING HARD BELOW THE DAILY CLOUD 📉
Entry: 64,400 ⚡
Target: 69,000 🚀
Stop Loss: 62,000 ⚠️
The daily Ichimoku structure tells a sobering story of overhead pressure. With price floating below both the Tenkan-sen and Kijun-sen, sellers clearly hold the steering wheel while the massive cloud looms overhead between 71K and 74K. 📊
Patience is the ultimate edge right now. Reclaiming the 69K milestone is the bare minimum ticket for bulls to re-engage, while losing the 64K handle leaves the door wide open toward the 62K liquidity pocket. ⚡
Markets can flip violently from oversold states, but hope is never a valid trading strategy without a confirmed structural reversal. 💡 Are you waiting for a confirmed reclaim above the cloud or preparing to fade the next bounce? 🤔
⚠️ Not financial advice. Always manage your risk. 🛡️
🏷️ #BTC #Bitcoin #Ichimoku #Trading
📉 ⚡
Entry: 64,400 ⚡
Target: 69,000 🚀
Stop Loss: 62,000 ⚠️
The daily Ichimoku structure tells a sobering story of overhead pressure. With price floating below both the Tenkan-sen and Kijun-sen, sellers clearly hold the steering wheel while the massive cloud looms overhead between 71K and 74K. 📊
Patience is the ultimate edge right now. Reclaiming the 69K milestone is the bare minimum ticket for bulls to re-engage, while losing the 64K handle leaves the door wide open toward the 62K liquidity pocket. ⚡
Markets can flip violently from oversold states, but hope is never a valid trading strategy without a confirmed structural reversal. 💡 Are you waiting for a confirmed reclaim above the cloud or preparing to fade the next bounce? 🤔
⚠️ Not financial advice. Always manage your risk. 🛡️
🏷️ #BTC #Bitcoin #Ichimoku #Trading
📉 ⚡
14

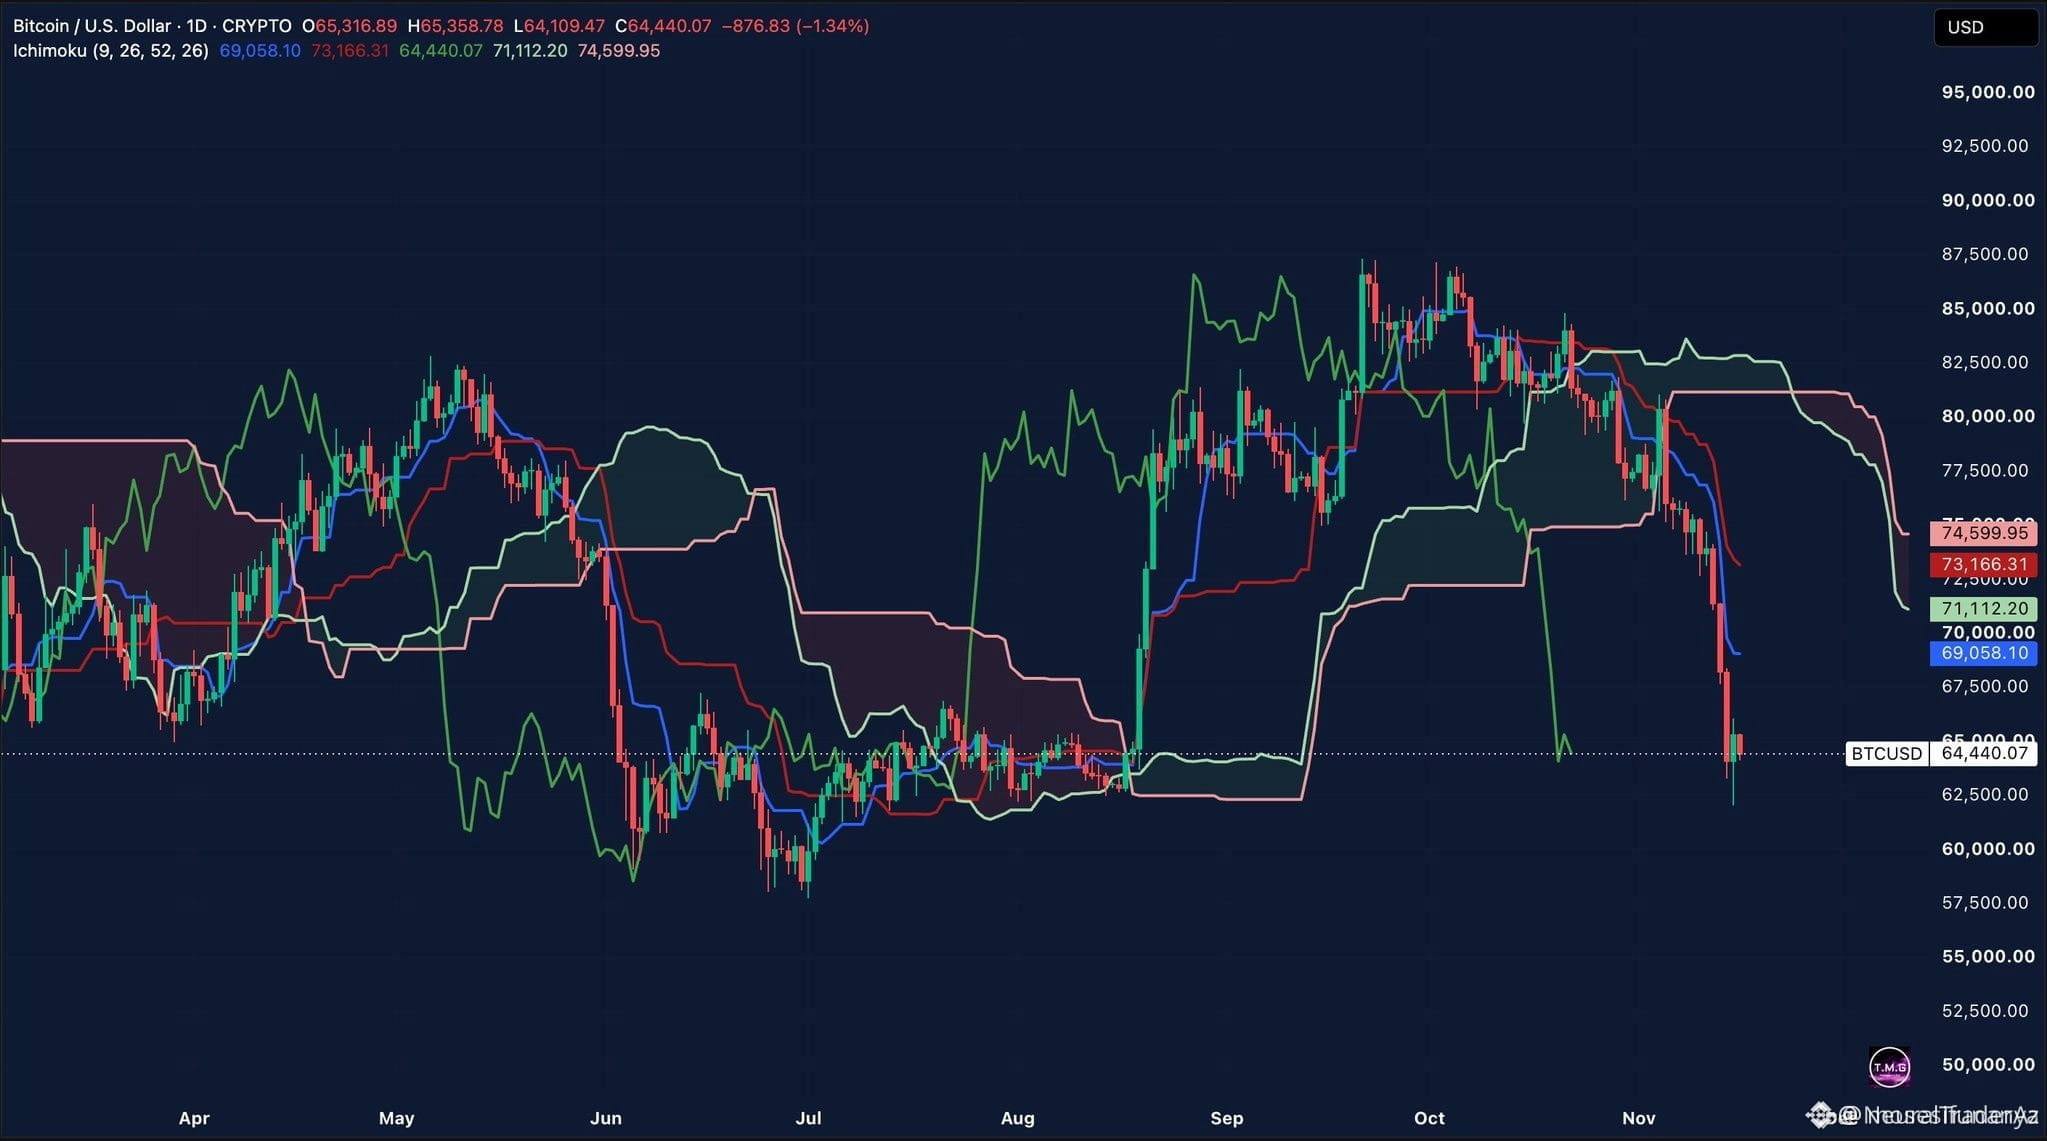
🚨 $BTC DAILY ICHIMOKU CLOUD FLASHES BEARISH WARNING AS OVERHEAD RESISTANCE LOOMS 🐻
Entry: 64,400 ⚡
Target: 62,500 📉
The daily Ichimoku structure remains deeply compressed, with the Tenkan-sen lingering well below the Kijun-sen under heavy overhead pressure 📊. Price action continues to coil around current marks, leaving the lower liquidity pocket vulnerable if immediate structural support fails to hold 🌊.
For institutional buyers to step back in with conviction, a clean reclaim of the 69,000 threshold is mandatory before targeting primary cloud resistance overhead 💡. Until that structural shift occurs, patience is the ultimate edge in this macro environment.
💬 Are you anticipating a defensive hold at current levels or a sweep of the lower liquidity pools? 👇
⚠️ Not financial advice. Always manage your risk. 🛡️
🏷️ #BTC #MarketStructure #Crypto #Ichimoku
📉 🔍
🚨 $BTC DAILY ICHIMOKU CLOUD FLASHES BEARISH WARNING AS OVERHEAD RESISTANCE LOOMS 🐻
Entry: 64,400 ⚡
Target: 62,500 📉
The daily Ichimoku structure remains deeply compressed, with the Tenkan-sen lingering well below the Kijun-sen under heavy overhead pressure 📊. Price action continues to coil around current marks, leaving the lower liquidity pocket vulnerable if immediate structural support fails to hold 🌊.
For institutional buyers to step back in with conviction, a clean reclaim of the 69,000 threshold is mandatory before targeting primary cloud resistance overhead 💡. Until that structural shift occurs, patience is the ultimate edge in this macro environment.
💬 Are you anticipating a defensive hold at current levels or a sweep of the lower liquidity pools? 👇
⚠️ Not financial advice. Always manage your risk. 🛡️
🏷️ #BTC #MarketStructure #Crypto #Ichimoku
📉 🔍
Entry: 64,400 ⚡
Target: 62,500 📉
The daily Ichimoku structure remains deeply compressed, with the Tenkan-sen lingering well below the Kijun-sen under heavy overhead pressure 📊. Price action continues to coil around current marks, leaving the lower liquidity pocket vulnerable if immediate structural support fails to hold 🌊.
For institutional buyers to step back in with conviction, a clean reclaim of the 69,000 threshold is mandatory before targeting primary cloud resistance overhead 💡. Until that structural shift occurs, patience is the ultimate edge in this macro environment.
💬 Are you anticipating a defensive hold at current levels or a sweep of the lower liquidity pools? 👇
⚠️ Not financial advice. Always manage your risk. 🛡️
🏷️ #BTC #MarketStructure #Crypto #Ichimoku
📉 🔍
4

·
--
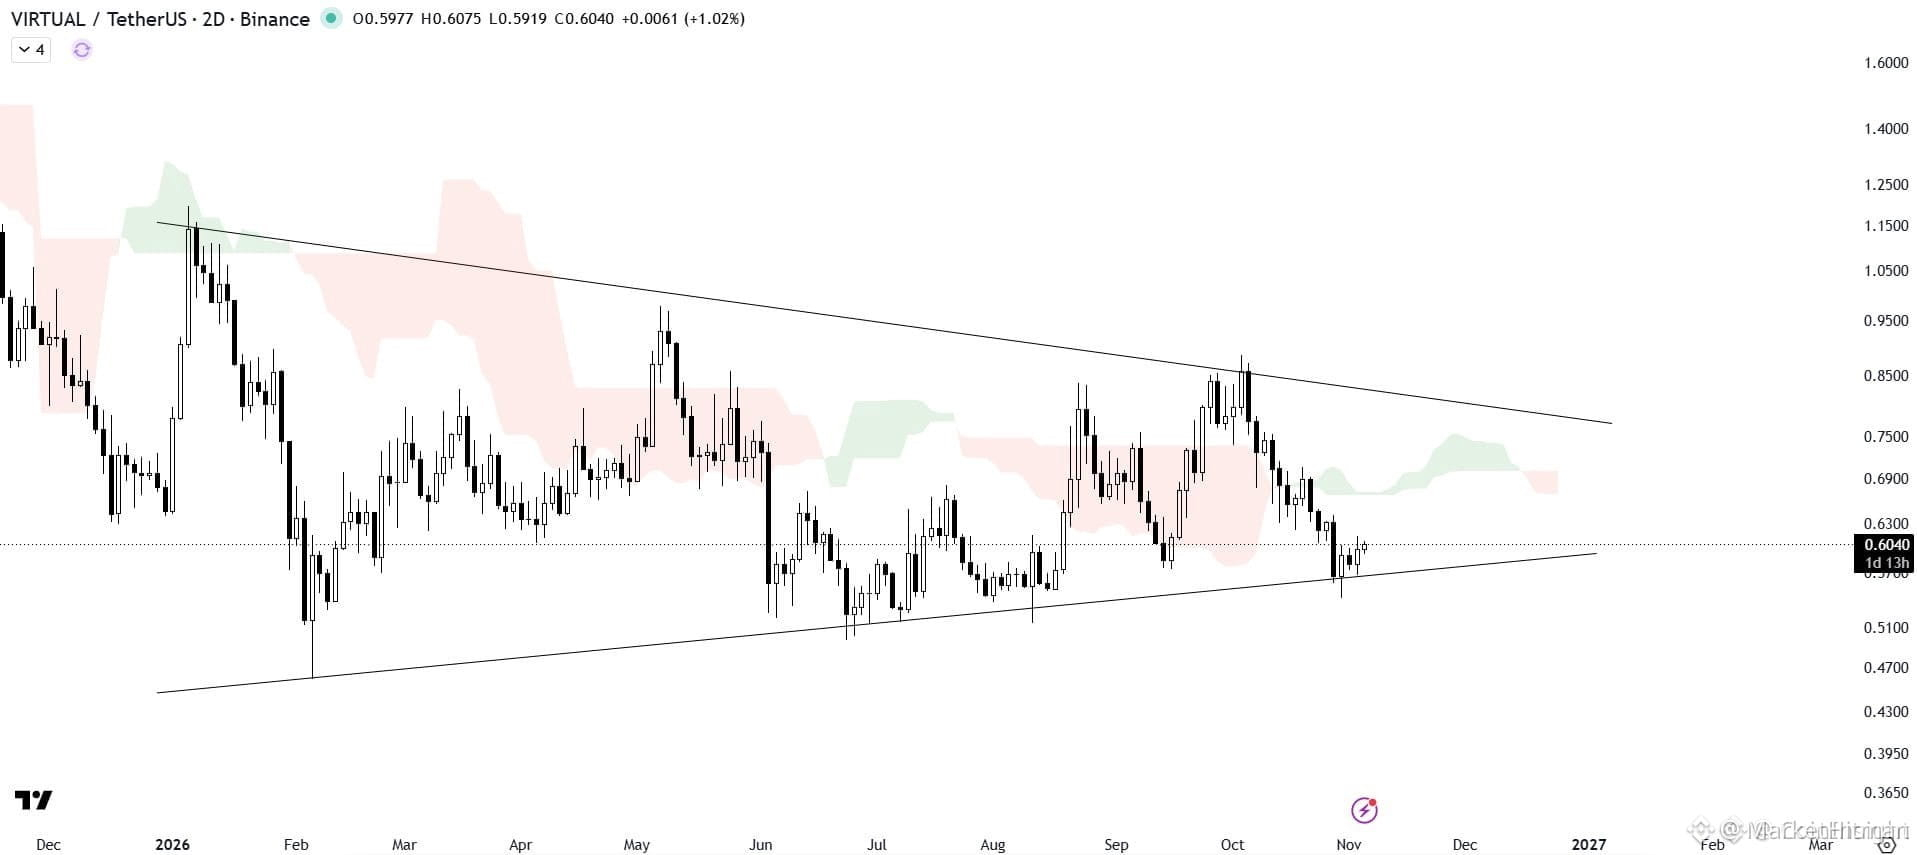
🚀 $VIRTUAL ON THE CUSP OF A POWERFUL BREAKOUT THROUGH THE ICHIMOKU CLOUD! 📈
The Ichimoku cloud now sits as a thick ceiling, acting like a shark‑guarded liquidity wall. 📊 Buyers need a clean punch through to flip the script.
A decisive surge that tears through both the cloud and the triangle resistance would light up the order flow, signaling smart‑money re‑entry and a fresh upward thrust. ⚡🦈
Momentum is stacking, but a false break could dump us back into the fog. 💬 Do you see the price carving a path above the cloud, or are you waiting for a second wave? 👇
⚠️ Not financial advice. Always manage your risk. 🛡️
🏷️ #VIRTUAL #Breakout #Ichimoku #Crypto
🚀 🔥
🚀 $VIRTUAL ON THE CUSP OF A POWERFUL BREAKOUT THROUGH THE ICHIMOKU CLOUD! 📈
The Ichimoku cloud now sits as a thick ceiling, acting like a shark‑guarded liquidity wall. 📊 Buyers need a clean punch through to flip the script.
A decisive surge that tears through both the cloud and the triangle resistance would light up the order flow, signaling smart‑money re‑entry and a fresh upward thrust. ⚡🦈
Momentum is stacking, but a false break could dump us back into the fog. 💬 Do you see the price carving a path above the cloud, or are you waiting for a second wave? 👇
⚠️ Not financial advice. Always manage your risk. 🛡️
🏷️ #VIRTUAL #Breakout #Ichimoku #Crypto
🚀 🔥
The Ichimoku cloud now sits as a thick ceiling, acting like a shark‑guarded liquidity wall. 📊 Buyers need a clean punch through to flip the script.
A decisive surge that tears through both the cloud and the triangle resistance would light up the order flow, signaling smart‑money re‑entry and a fresh upward thrust. ⚡🦈
Momentum is stacking, but a false break could dump us back into the fog. 💬 Do you see the price carving a path above the cloud, or are you waiting for a second wave? 👇
⚠️ Not financial advice. Always manage your risk. 🛡️
🏷️ #VIRTUAL #Breakout #Ichimoku #Crypto
🚀 🔥
11

·
--
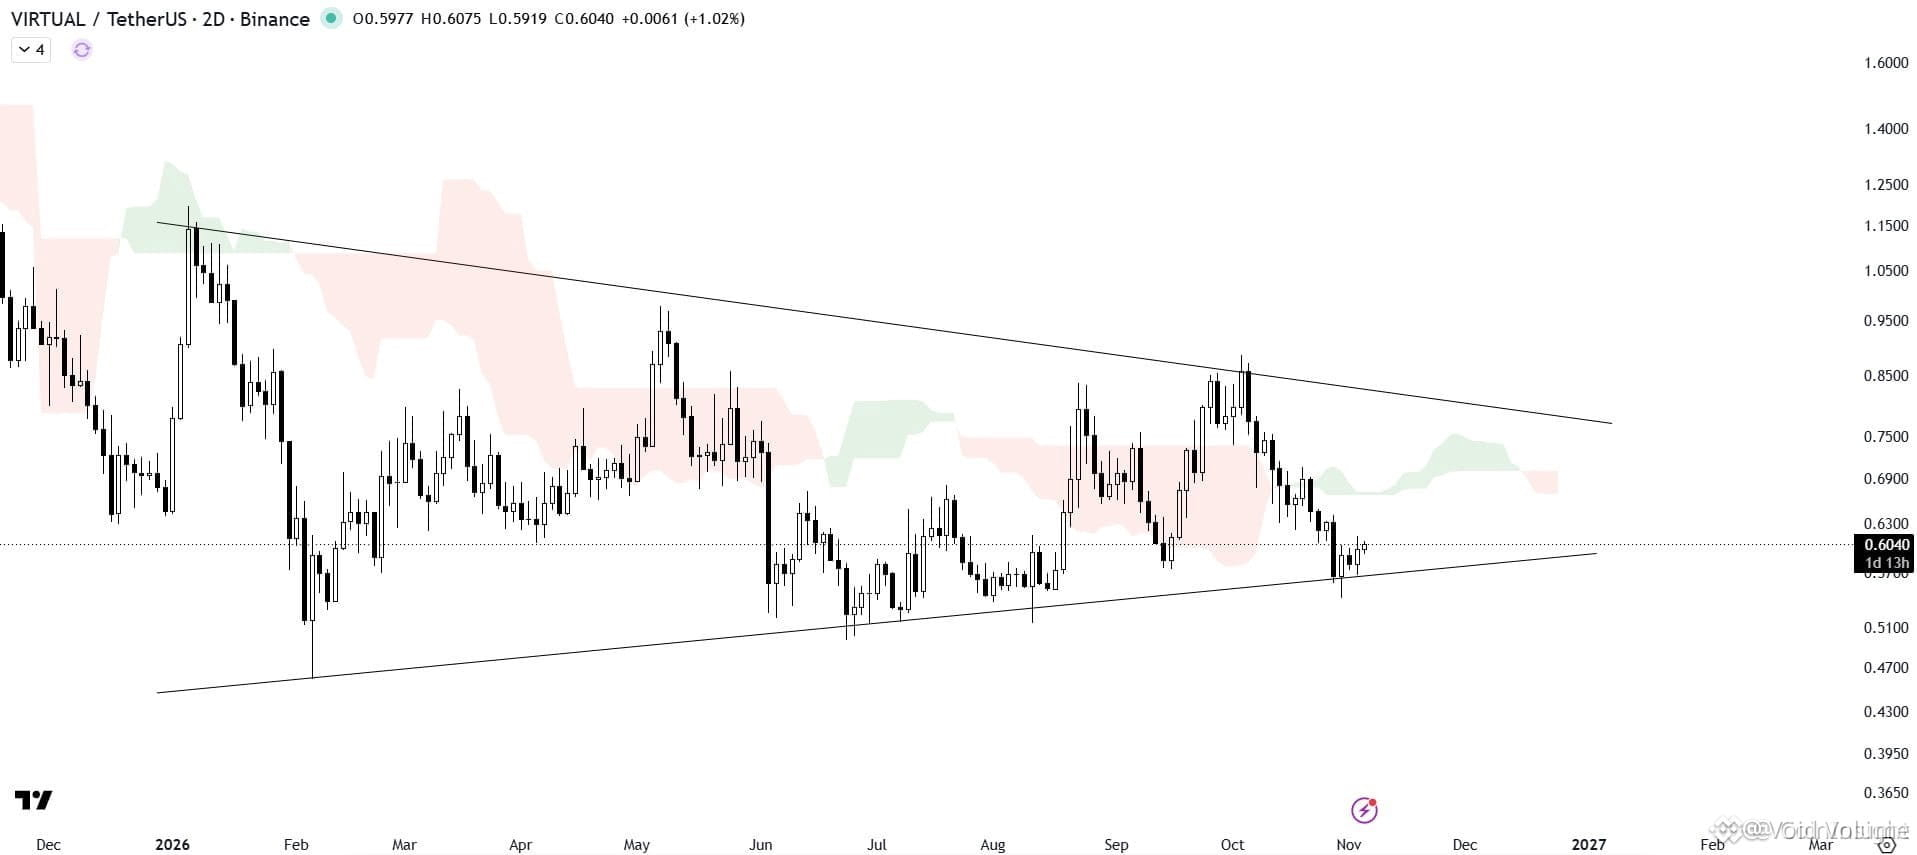
🚀 🦈 $VIRTUAL EYES ICHIMOKU CLOUD BREAKOUT – WILL IT SURGE?
The Ichimoku cloud now acts as the primary resistance ceiling. A decisive break through both the cloud and the descending triangle’s upper trendline would confirm a strong institutional thrust, targeting the liquidity pool perched above. 📊 Volume on the 4‑hour chart is expanding, and the momentum gauge flashes green, hinting at acceleration. 📌 Keep an eye on the cloud’s upper band – a clean breach could unleash the next bullish leg. 🌊
💬 Do you plan to ride the breakout or wait for tighter confirmation? 👇
⚠️ Not financial advice. Always manage your risk. 🛡️
🏷️ #VIRTUAL #Breakout #Ichimoku #SmartMoney
🔥 💎
🚀 🦈 $VIRTUAL EYES ICHIMOKU CLOUD BREAKOUT – WILL IT SURGE?
The Ichimoku cloud now acts as the primary resistance ceiling. A decisive break through both the cloud and the descending triangle’s upper trendline would confirm a strong institutional thrust, targeting the liquidity pool perched above. 📊 Volume on the 4‑hour chart is expanding, and the momentum gauge flashes green, hinting at acceleration. 📌 Keep an eye on the cloud’s upper band – a clean breach could unleash the next bullish leg. 🌊
💬 Do you plan to ride the breakout or wait for tighter confirmation? 👇
⚠️ Not financial advice. Always manage your risk. 🛡️
🏷️ #VIRTUAL #Breakout #Ichimoku #SmartMoney
🔥 💎
The Ichimoku cloud now acts as the primary resistance ceiling. A decisive break through both the cloud and the descending triangle’s upper trendline would confirm a strong institutional thrust, targeting the liquidity pool perched above. 📊 Volume on the 4‑hour chart is expanding, and the momentum gauge flashes green, hinting at acceleration. 📌 Keep an eye on the cloud’s upper band – a clean breach could unleash the next bullish leg. 🌊
💬 Do you plan to ride the breakout or wait for tighter confirmation? 👇
⚠️ Not financial advice. Always manage your risk. 🛡️
🏷️ #VIRTUAL #Breakout #Ichimoku #SmartMoney
🔥 💎
4

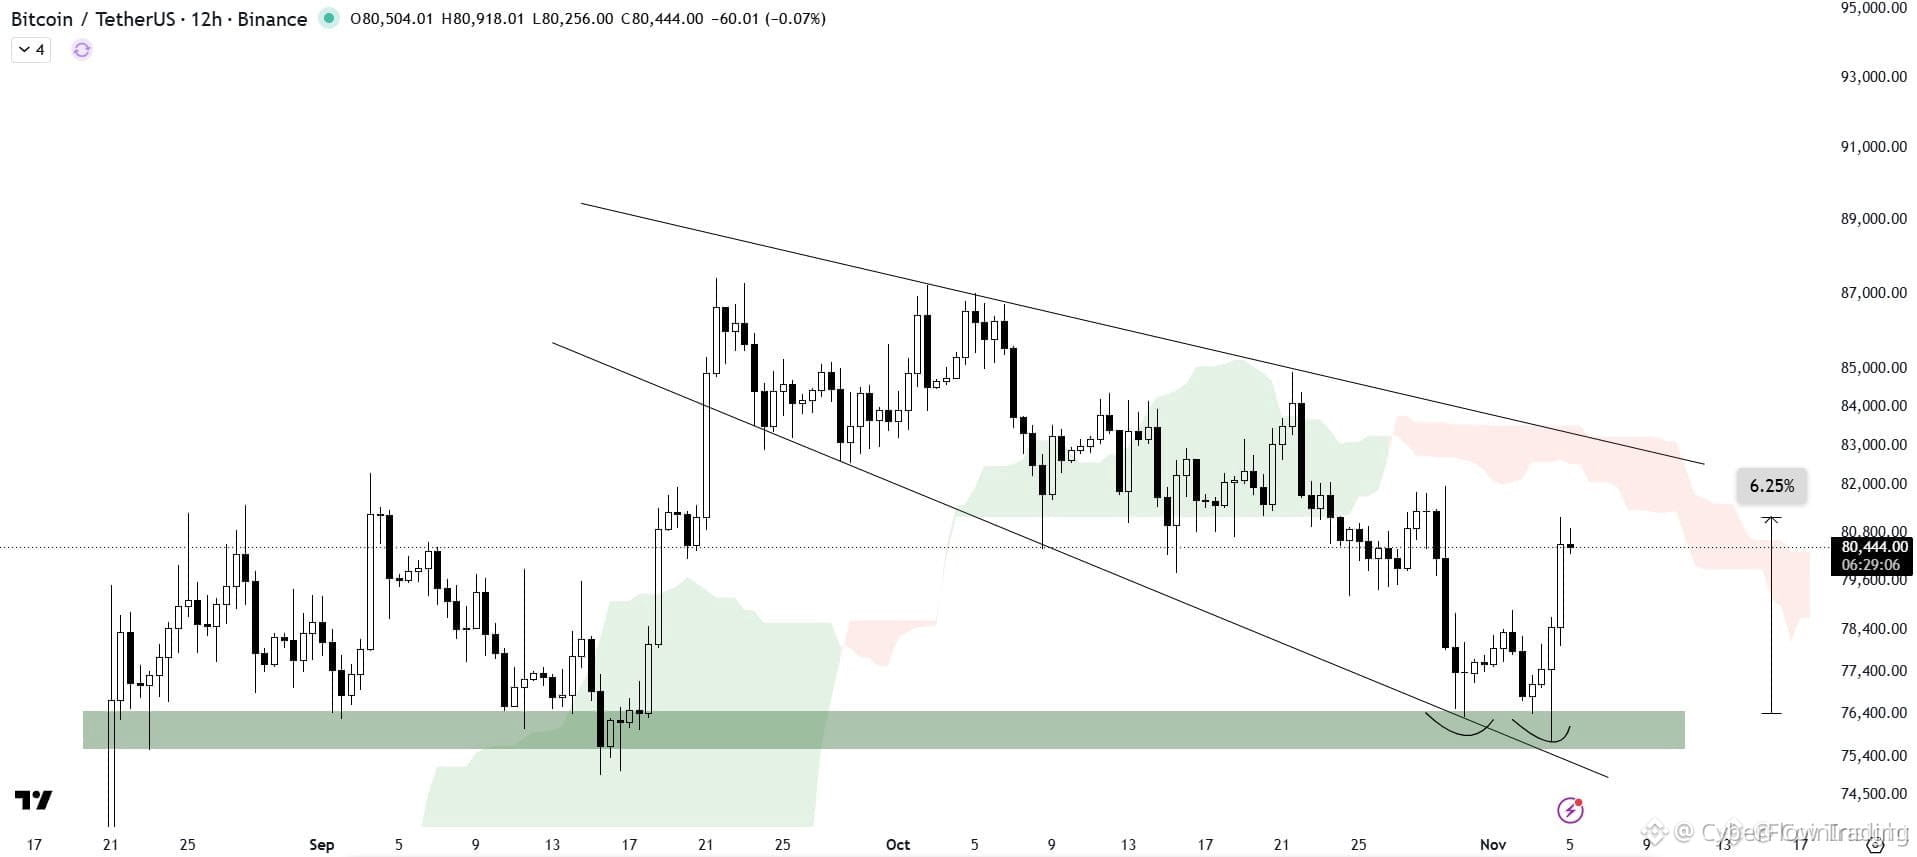
🚀 $BTC RACING THROUGH ICHIMOKU CLOUD TO UNLEASH NEXT SURGE! 🟢
📌 The Ichimoku cloud now sits like a steel wall, capping price while the descending broadening wedge marks a classic supply zone. Smart money is gathering, and every dip is being soaked up like a tide. 📊
⚡ If the bulls pierce that cloud and flip the wedge resistance, we could see a fresh wave of buying that rockets the chart higher. Volume is already humming, hinting at an imminent liquidity sweep. 🌊
💬 Do you think the breakout is imminent, or are you holding back for confirmation? 👇
⚠️ Not financial advice. Always manage your risk. 🛡️
🏷️ #BTC #LongSetup #Ichimoku #Crypto
🔥 💎
🚀 $BTC RACING THROUGH ICHIMOKU CLOUD TO UNLEASH NEXT SURGE! 🟢
📌 The Ichimoku cloud now sits like a steel wall, capping price while the descending broadening wedge marks a classic supply zone. Smart money is gathering, and every dip is being soaked up like a tide. 📊
⚡ If the bulls pierce that cloud and flip the wedge resistance, we could see a fresh wave of buying that rockets the chart higher. Volume is already humming, hinting at an imminent liquidity sweep. 🌊
💬 Do you think the breakout is imminent, or are you holding back for confirmation? 👇
⚠️ Not financial advice. Always manage your risk. 🛡️
🏷️ #BTC #LongSetup #Ichimoku #Crypto
🔥 💎
📌 The Ichimoku cloud now sits like a steel wall, capping price while the descending broadening wedge marks a classic supply zone. Smart money is gathering, and every dip is being soaked up like a tide. 📊
⚡ If the bulls pierce that cloud and flip the wedge resistance, we could see a fresh wave of buying that rockets the chart higher. Volume is already humming, hinting at an imminent liquidity sweep. 🌊
💬 Do you think the breakout is imminent, or are you holding back for confirmation? 👇
⚠️ Not financial advice. Always manage your risk. 🛡️
🏷️ #BTC #LongSetup #Ichimoku #Crypto
🔥 💎
9

·
--
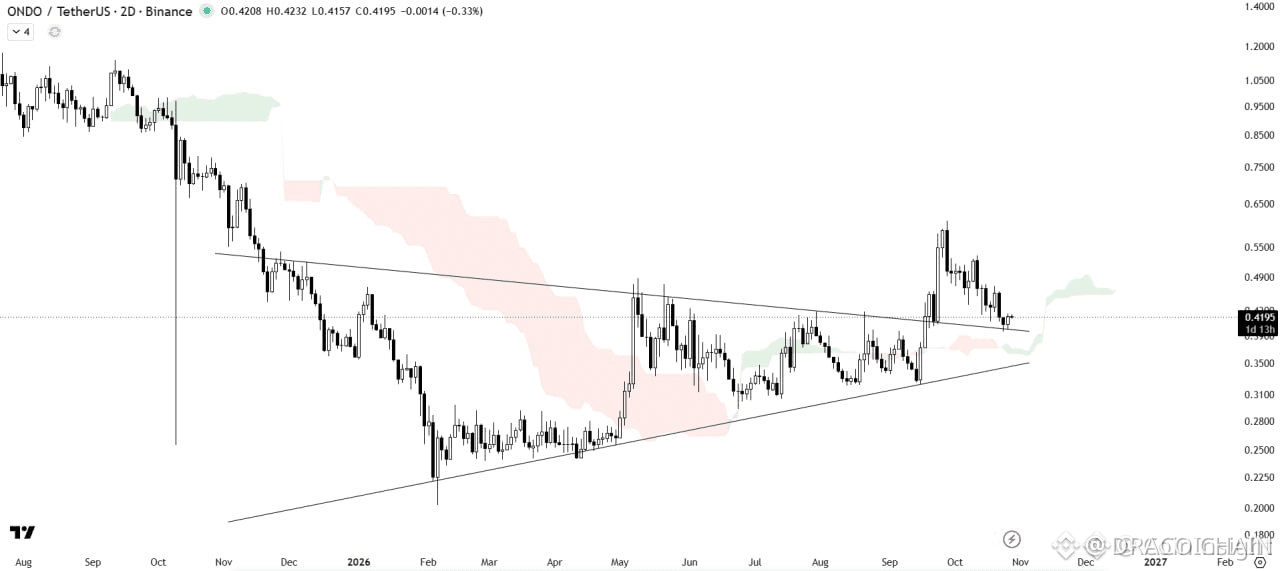
🚀 $ONDO BREAKS SYMMETRIC TRIANGLE WITH HEFTY VOLUME SURGE! 🦈
The symmetric triangle collapsed under a decisive volume push, and the breakout held cleanly on the retest, confirming the bullish thrust. 📊
Ichimoku’s cloud now sits as a firm support band, anchoring price and providing the liquidity cushion smart money thrives on. 🌊🔍
If $ONDO sustains above the breakout threshold, we could see a fresh rally that outpaces the recent swing, making the next leg a prime target for aggressive longs. 📈💡
💬 Will you ride the next wave or wait for a deeper pullback? 👇
⚠️ Not financial advice. Always manage your risk. 🛡️
🏷️ #ONDO #Breakout #Ichimoku #Crypto
🔥 💎
🚀 $ONDO BREAKS SYMMETRIC TRIANGLE WITH HEFTY VOLUME SURGE! 🦈
The symmetric triangle collapsed under a decisive volume push, and the breakout held cleanly on the retest, confirming the bullish thrust. 📊
Ichimoku’s cloud now sits as a firm support band, anchoring price and providing the liquidity cushion smart money thrives on. 🌊🔍
If $ONDO sustains above the breakout threshold, we could see a fresh rally that outpaces the recent swing, making the next leg a prime target for aggressive longs. 📈💡
💬 Will you ride the next wave or wait for a deeper pullback? 👇
⚠️ Not financial advice. Always manage your risk. 🛡️
🏷️ #ONDO #Breakout #Ichimoku #Crypto
🔥 💎
The symmetric triangle collapsed under a decisive volume push, and the breakout held cleanly on the retest, confirming the bullish thrust. 📊
Ichimoku’s cloud now sits as a firm support band, anchoring price and providing the liquidity cushion smart money thrives on. 🌊🔍
If $ONDO sustains above the breakout threshold, we could see a fresh rally that outpaces the recent swing, making the next leg a prime target for aggressive longs. 📈💡
💬 Will you ride the next wave or wait for a deeper pullback? 👇
⚠️ Not financial advice. Always manage your risk. 🛡️
🏷️ #ONDO #Breakout #Ichimoku #Crypto
🔥 💎
11
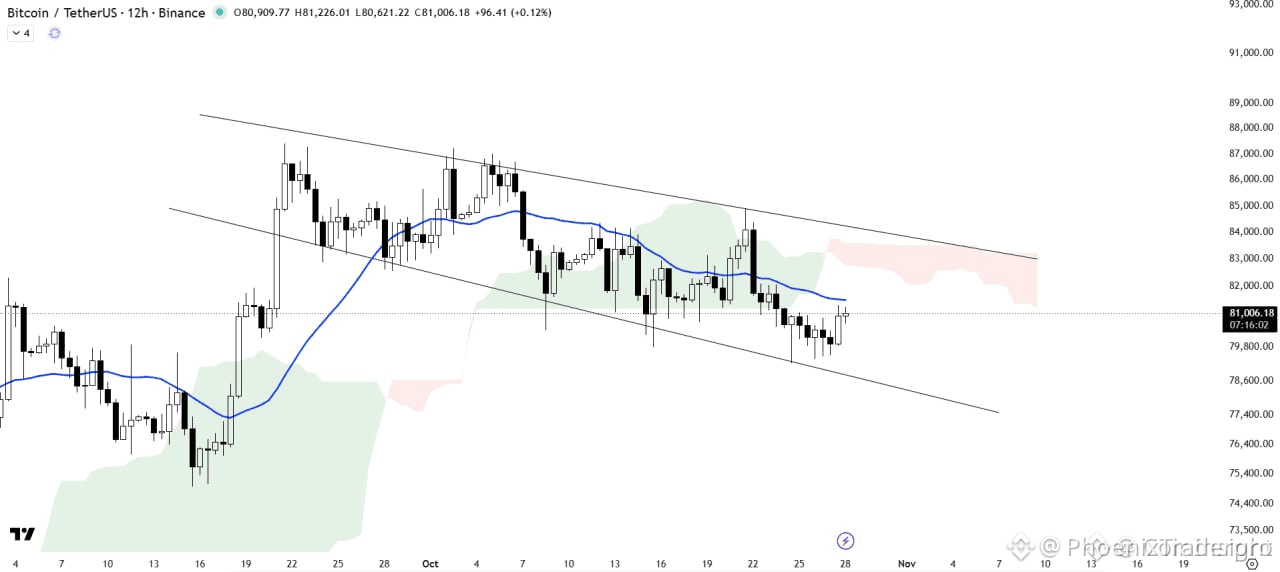
🚀 $BTC EYES BREAKOUT THROUGH ICHIMOKU WALL NOW! 📈
The Ichimoku cloud is now the last line of defense, acting as a thick ceiling that $BTC must pierce. A clean surge above the 21‑period MA would signal the bulls have reclaimed the momentum. 📊
Coupled with the wedge’s upper trendline, the breakout could unleash a wave of buying pressure, feeding the liquidity pool and flipping the market into a steep ascent. ⚡🌊
Watch the 4‑hour chart; a decisive close above the cloud is the green light for a steep rally. 💬 Are you ready to ride the breakout when the cloud shatters?
⚠️ Not financial advice. Always manage your risk. 🛡️
🏷️ #BTC #BullishBreakout #Ichimoku #Crypto
🚀 🔥
🚀 $BTC EYES BREAKOUT THROUGH ICHIMOKU WALL NOW! 📈
The Ichimoku cloud is now the last line of defense, acting as a thick ceiling that $BTC must pierce. A clean surge above the 21‑period MA would signal the bulls have reclaimed the momentum. 📊
Coupled with the wedge’s upper trendline, the breakout could unleash a wave of buying pressure, feeding the liquidity pool and flipping the market into a steep ascent. ⚡🌊
Watch the 4‑hour chart; a decisive close above the cloud is the green light for a steep rally. 💬 Are you ready to ride the breakout when the cloud shatters?
⚠️ Not financial advice. Always manage your risk. 🛡️
🏷️ #BTC #BullishBreakout #Ichimoku #Crypto
🚀 🔥
The Ichimoku cloud is now the last line of defense, acting as a thick ceiling that $BTC must pierce. A clean surge above the 21‑period MA would signal the bulls have reclaimed the momentum. 📊
Coupled with the wedge’s upper trendline, the breakout could unleash a wave of buying pressure, feeding the liquidity pool and flipping the market into a steep ascent. ⚡🌊
Watch the 4‑hour chart; a decisive close above the cloud is the green light for a steep rally. 💬 Are you ready to ride the breakout when the cloud shatters?
⚠️ Not financial advice. Always manage your risk. 🛡️
🏷️ #BTC #BullishBreakout #Ichimoku #Crypto
🚀 🔥
9

🚨 $BTC DOUBLE‑TOP TENSION: WILL IT BREAK THROUGH THE CLOUD? 💥
The chart is carving a textbook double‑top, and sellers are flashing red at the peak, but the Ichimoku cloud holds firm like a steel belt beneath the price. 📈
If buyers can punch through that resistance, the cloud‑backed support could fuel a fresh rally, turning the current rejection into a liquidity sweep for the smart money. 📊🦈⚡
💬 Are you positioning for a breakout or waiting for the next wave?
⚠️ Not financial advice. Always manage your risk. 🛡️
🏷️ #BTC #DoubleTop #Ichimoku #Crypto
🚀 🔥
🚨 $BTC DOUBLE‑TOP TENSION: WILL IT BREAK THROUGH THE CLOUD? 💥
The chart is carving a textbook double‑top, and sellers are flashing red at the peak, but the Ichimoku cloud holds firm like a steel belt beneath the price. 📈
If buyers can punch through that resistance, the cloud‑backed support could fuel a fresh rally, turning the current rejection into a liquidity sweep for the smart money. 📊🦈⚡
💬 Are you positioning for a breakout or waiting for the next wave?
⚠️ Not financial advice. Always manage your risk. 🛡️
🏷️ #BTC #DoubleTop #Ichimoku #Crypto
🚀 🔥
The chart is carving a textbook double‑top, and sellers are flashing red at the peak, but the Ichimoku cloud holds firm like a steel belt beneath the price. 📈
If buyers can punch through that resistance, the cloud‑backed support could fuel a fresh rally, turning the current rejection into a liquidity sweep for the smart money. 📊🦈⚡
💬 Are you positioning for a breakout or waiting for the next wave?
⚠️ Not financial advice. Always manage your risk. 🛡️
🏷️ #BTC #DoubleTop #Ichimoku #Crypto
🚀 🔥
5

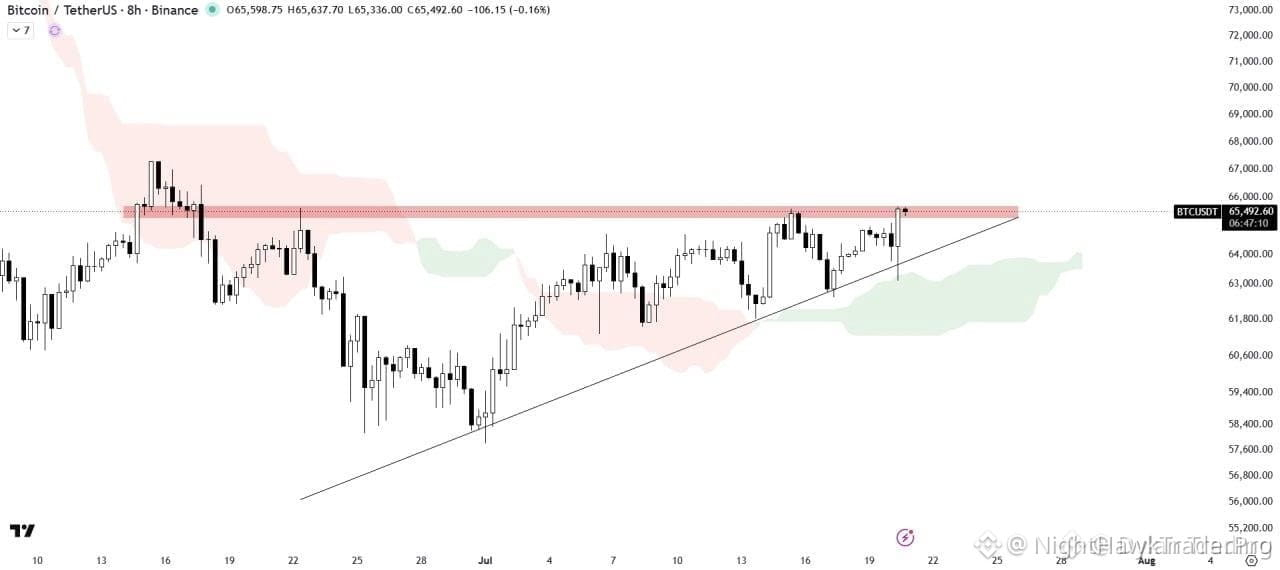
$BTC IS BOUNCING OFF THE ICHIMOKU CLOUD WITH STRUCTURE INTACT 🔥
This is the same support zone that's held the uptrend together for the past two weeks. Bitcoin is pressing against a horizontal supply wall while the cloud keeps acting as a live bid — classic bull market behavior.
The daily chart still shows higher lows and the momentum hasn't rolled over yet. A clean breakout above supply could attract the sidelined capital waiting for confirmation.
Are you waiting for the candle to close or fading this supply zone?
Not financial advice. Always manage your risk.
#BTC #Ichimoku #BullishSetup #Crypto
🔥
$BTC IS BOUNCING OFF THE ICHIMOKU CLOUD WITH STRUCTURE INTACT 🔥
This is the same support zone that's held the uptrend together for the past two weeks. Bitcoin is pressing against a horizontal supply wall while the cloud keeps acting as a live bid — classic bull market behavior.
The daily chart still shows higher lows and the momentum hasn't rolled over yet. A clean breakout above supply could attract the sidelined capital waiting for confirmation.
Are you waiting for the candle to close or fading this supply zone?
Not financial advice. Always manage your risk.
#BTC #Ichimoku #BullishSetup #Crypto
🔥
This is the same support zone that's held the uptrend together for the past two weeks. Bitcoin is pressing against a horizontal supply wall while the cloud keeps acting as a live bid — classic bull market behavior.
The daily chart still shows higher lows and the momentum hasn't rolled over yet. A clean breakout above supply could attract the sidelined capital waiting for confirmation.
Are you waiting for the candle to close or fading this supply zone?
Not financial advice. Always manage your risk.
#BTC #Ichimoku #BullishSetup #Crypto
🔥
46
·
--
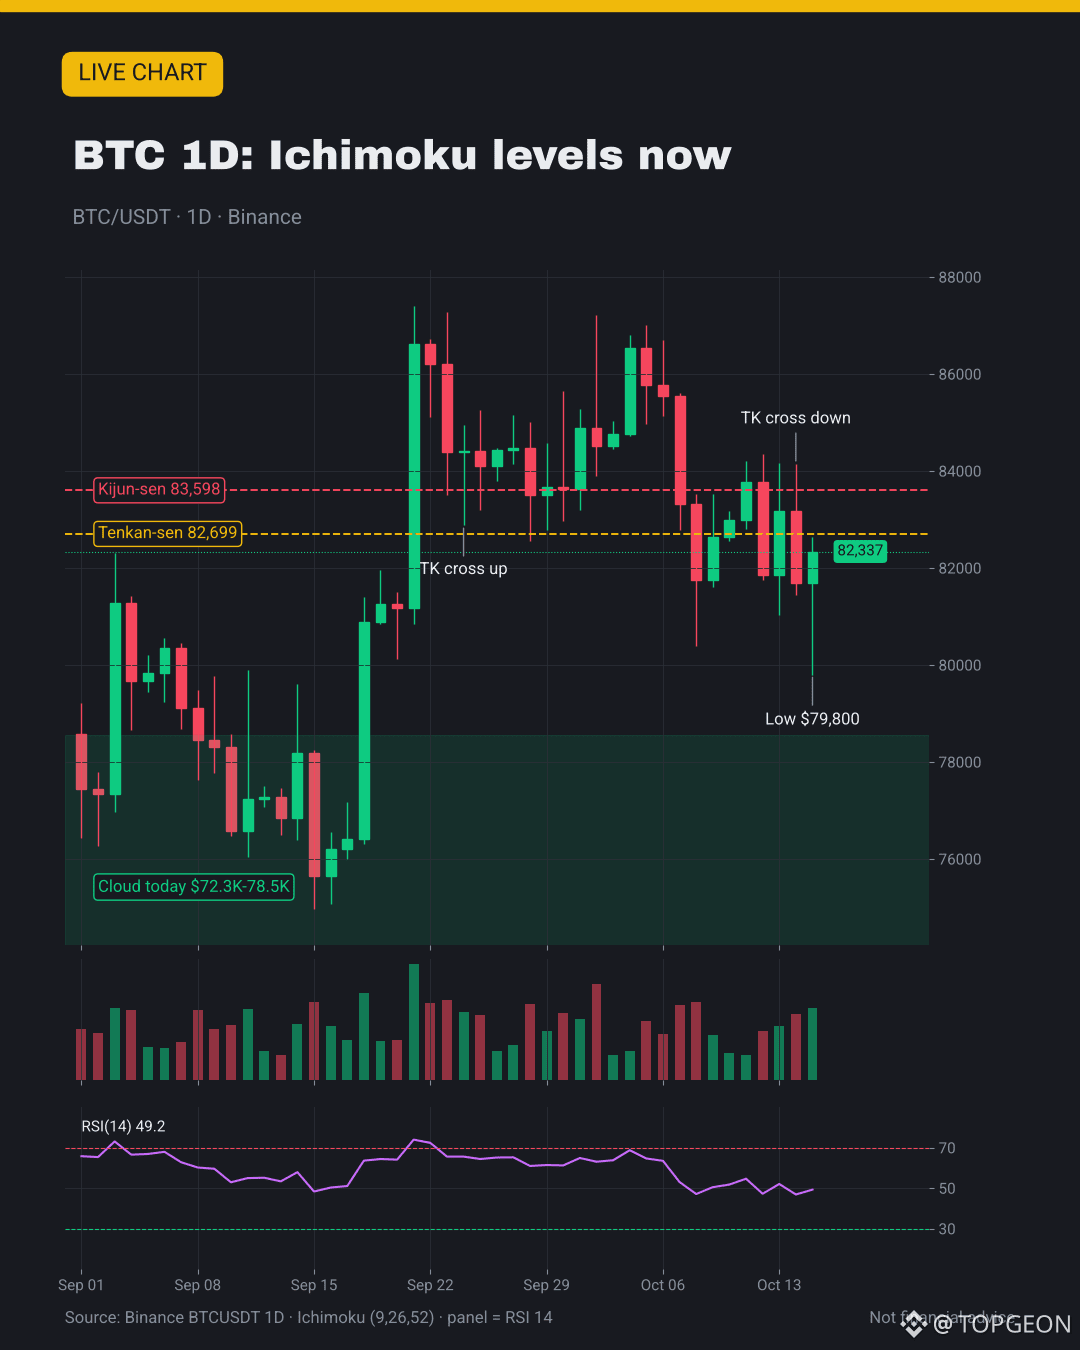
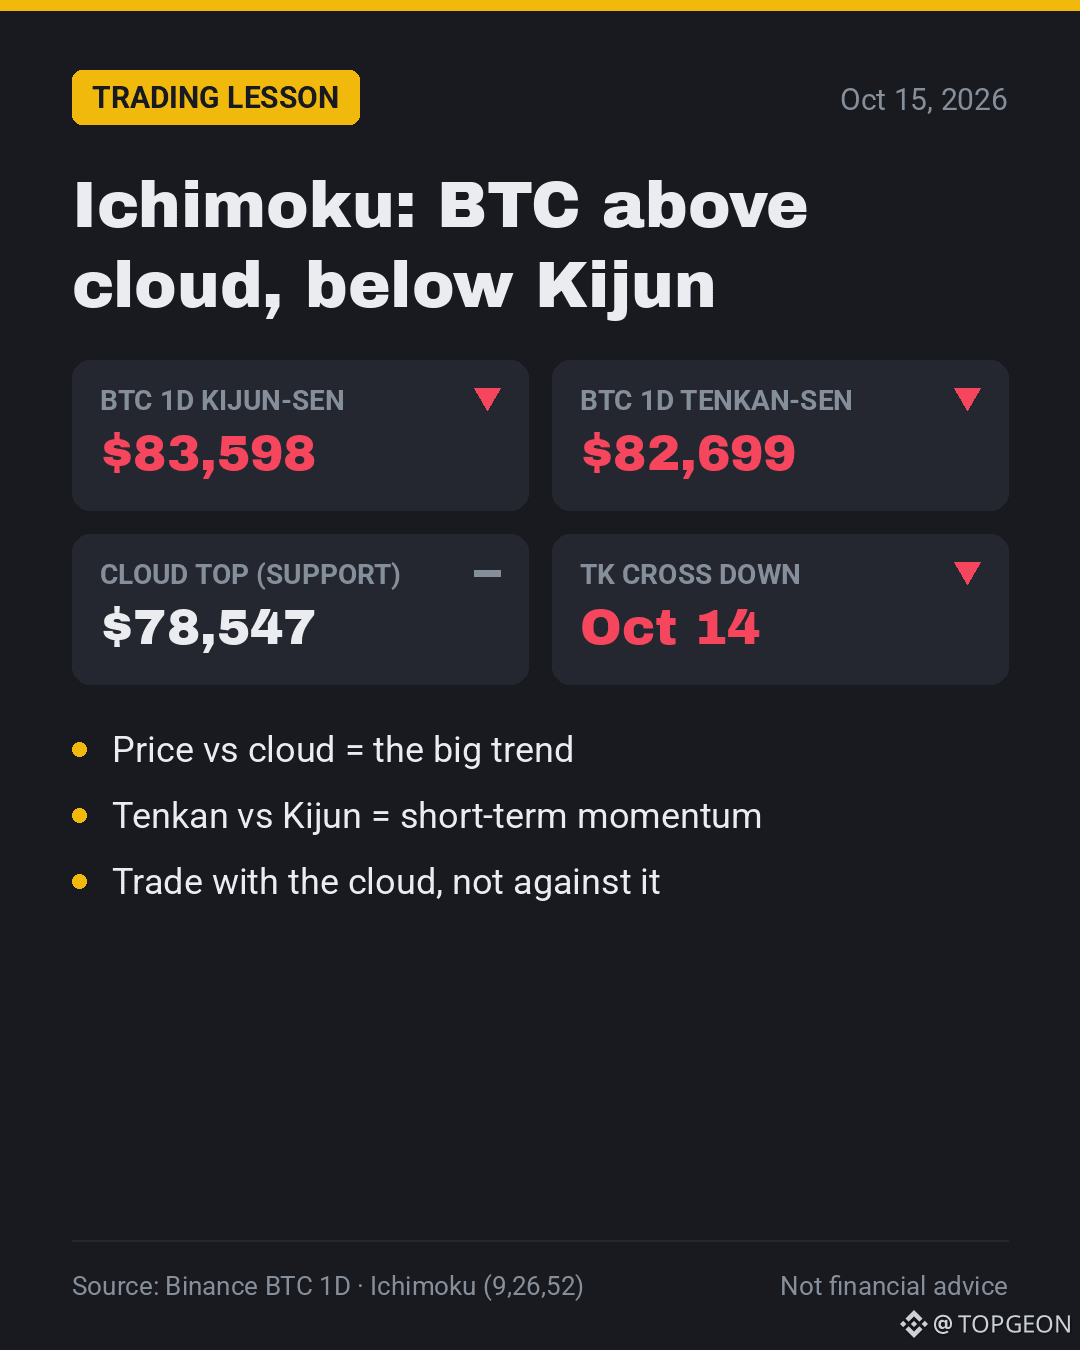
☁️ $BTC is above the Ichimoku cloud but under both fast lines
1️⃣ Cloud today $72.3K-78.5K: big trend still up
2️⃣ Kijun $83,598 and Tenkan $82,699 sit above price
3️⃣ Oct 14 TK cross down, but above the cloud = weak
🎯 My take: daily close over $83.6K resets momentum; $78.5K is the real test
💬 Cloud traders: is this a dip or a trend change? 👇
📖 Full lesson: https://app.binance.com/uni-qr/cart/377646385978512
#Ichimoku #TradingTips #Bitcoin
☁️ $BTC is above the Ichimoku cloud but under both fast lines
1️⃣ Cloud today $72.3K-78.5K: big trend still up
2️⃣ Kijun $83,598 and Tenkan $82,699 sit above price
3️⃣ Oct 14 TK cross down, but above the cloud = weak
🎯 My take: daily close over $83.6K resets momentum; $78.5K is the real test
💬 Cloud traders: is this a dip or a trend change? 👇
📖 Full lesson: https://app.binance.com/uni-qr/cart/377646385978512
#Ichimoku #TradingTips #Bitcoin
1️⃣ Cloud today $72.3K-78.5K: big trend still up
2️⃣ Kijun $83,598 and Tenkan $82,699 sit above price
3️⃣ Oct 14 TK cross down, but above the cloud = weak
🎯 My take: daily close over $83.6K resets momentum; $78.5K is the real test
💬 Cloud traders: is this a dip or a trend change? 👇
📖 Full lesson: https://app.binance.com/uni-qr/cart/377646385978512
#Ichimoku #TradingTips #Bitcoin
15

·
--
Ichimoku looks simple, but it’s actually 5 signals built around 9/26/52-period data, and the cloud alone can trick you badly.
A lot of traders see price holding the cloud and FOMO into $BTC, $ETH, or $BNB like support is guaranteed. The risk is that “dynamic support” works until momentum flips, then the same cloud becomes resistance.
Right now, the Ichimoku Cloud is still acting as dynamic support, which keeps the setup constructive. In plain English: as long as price stays above the cloud, buyers still have the cleaner trend structure, and dips into the cloud can attract bids.
But here’s the warning. If price starts closing inside the cloud, trend clarity drops fast. A clean break below it can signal momentum fading, especially if the Tenkan line loses the Kijun line or the cloud ahead starts thinning. That’s usually where late longs get chopped up or forced to exit badly.
So instead of treating the cloud as a magic entry, I’d watch how price reacts around it: strong bounce, weak grind, or full breakdown. Which one are you seeing on your charts right now?
#CryptoTrading #Ichimoku #OnChainAnalysis
Ichimoku looks simple, but it’s actually 5 signals built around 9/26/52-period data, and the cloud alone can trick you badly.
A lot of traders see price holding the cloud and FOMO into $BTC , $ETH , or $BNB like support is guaranteed. The risk is that “dynamic support” works until momentum flips, then the same cloud becomes resistance.
Right now, the Ichimoku Cloud is still acting as dynamic support, which keeps the setup constructive. In plain English: as long as price stays above the cloud, buyers still have the cleaner trend structure, and dips into the cloud can attract bids.
But here’s the warning. If price starts closing inside the cloud, trend clarity drops fast. A clean break below it can signal momentum fading, especially if the Tenkan line loses the Kijun line or the cloud ahead starts thinning. That’s usually where late longs get chopped up or forced to exit badly.
So instead of treating the cloud as a magic entry, I’d watch how price reacts around it: strong bounce, weak grind, or full breakdown. Which one are you seeing on your charts right now?
#CryptoTrading #Ichimoku #OnChainAnalysis
A lot of traders see price holding the cloud and FOMO into $BTC , $ETH , or $BNB like support is guaranteed. The risk is that “dynamic support” works until momentum flips, then the same cloud becomes resistance.
Right now, the Ichimoku Cloud is still acting as dynamic support, which keeps the setup constructive. In plain English: as long as price stays above the cloud, buyers still have the cleaner trend structure, and dips into the cloud can attract bids.
But here’s the warning. If price starts closing inside the cloud, trend clarity drops fast. A clean break below it can signal momentum fading, especially if the Tenkan line loses the Kijun line or the cloud ahead starts thinning. That’s usually where late longs get chopped up or forced to exit badly.
So instead of treating the cloud as a magic entry, I’d watch how price reacts around it: strong bounce, weak grind, or full breakdown. Which one are you seeing on your charts right now?
#CryptoTrading #Ichimoku #OnChainAnalysis

17

·
--
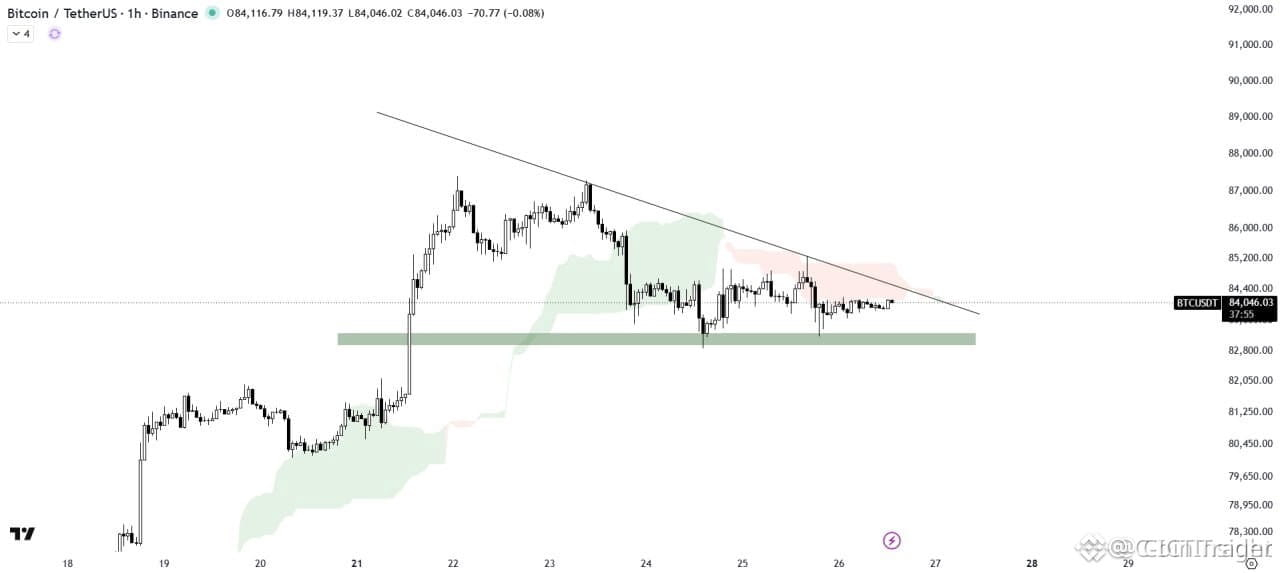
🚨 $BTC COMPRESSING IN A DESCENDING TRIANGLE UNDER HEAVY ICHIMOKU CLOUD RESISTANCE ⚡
$BTC is currently undergoing structural compression inside a descending triangle pattern, trading directly beneath descending trendline resistance. 📊 Institutional order flow remains constrained as the Ichimoku Cloud serves as a formidable overhead barrier capping immediate upside potential.
Smart money protocol dictates patience over prediction inside this tight range. 🔍 We require a decisive displacement—either a high-volume breakout reclaiming overhead resistance or a liquidity breakdown—to confirm the macro direction.
💡 Bidding inside this neutral consolidation offers subpar risk-to-reward while structure remains trapped. 💬 Are you waiting for a confirmed trendline reclaim or expecting a sweep of lower liquidity first? 👇
⚠️ Not financial advice. Always manage your risk. 🛡️
🏷️ #BTC #MarketStructure #Ichimoku #Crypto
🎯 🦈
🚨 $BTC COMPRESSING IN A DESCENDING TRIANGLE UNDER HEAVY ICHIMOKU CLOUD RESISTANCE ⚡
$BTC is currently undergoing structural compression inside a descending triangle pattern, trading directly beneath descending trendline resistance. 📊 Institutional order flow remains constrained as the Ichimoku Cloud serves as a formidable overhead barrier capping immediate upside potential.
Smart money protocol dictates patience over prediction inside this tight range. 🔍 We require a decisive displacement—either a high-volume breakout reclaiming overhead resistance or a liquidity breakdown—to confirm the macro direction.
💡 Bidding inside this neutral consolidation offers subpar risk-to-reward while structure remains trapped. 💬 Are you waiting for a confirmed trendline reclaim or expecting a sweep of lower liquidity first? 👇
⚠️ Not financial advice. Always manage your risk. 🛡️
🏷️ #BTC #MarketStructure #Ichimoku #Crypto
🎯 🦈
$BTC is currently undergoing structural compression inside a descending triangle pattern, trading directly beneath descending trendline resistance. 📊 Institutional order flow remains constrained as the Ichimoku Cloud serves as a formidable overhead barrier capping immediate upside potential.
Smart money protocol dictates patience over prediction inside this tight range. 🔍 We require a decisive displacement—either a high-volume breakout reclaiming overhead resistance or a liquidity breakdown—to confirm the macro direction.
💡 Bidding inside this neutral consolidation offers subpar risk-to-reward while structure remains trapped. 💬 Are you waiting for a confirmed trendline reclaim or expecting a sweep of lower liquidity first? 👇
⚠️ Not financial advice. Always manage your risk. 🛡️
🏷️ #BTC #MarketStructure #Ichimoku #Crypto
🎯 🦈
20

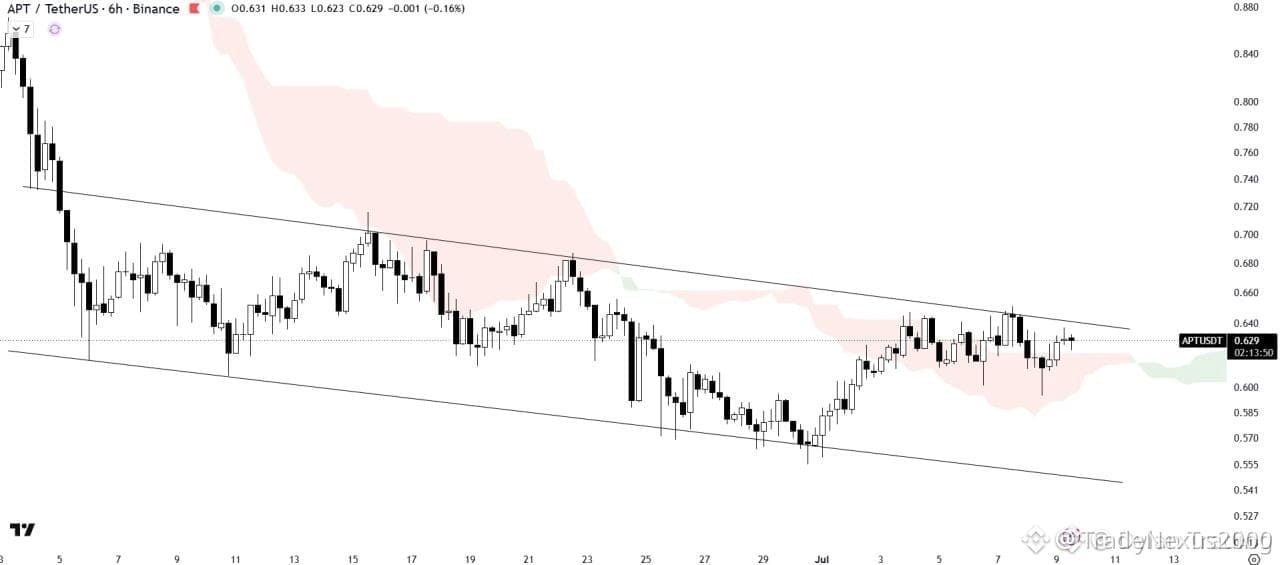
$APT IS TRADING BELOW A KEY RESISTANCE TRENDLINE 🔥
Price is pressing against the descending channel resistance while the Ichimoku cloud beneath offers a solid support base. This is a classic squeeze setup—volume has been declining over the last 48 hours, often a precursor to an explosive move.
If the breakout confirms, momentum could shift quickly in favor of the bulls. The daily chart shows price hugging the cloud, and a close above resistance would flip the structure.
Are you watching for a breakout or a rejection?
Not financial advice. Always manage your risk.
#APT #BreakoutSetup #Ichimoku #CryptoAnalysis
🔥
$APT IS TRADING BELOW A KEY RESISTANCE TRENDLINE 🔥
Price is pressing against the descending channel resistance while the Ichimoku cloud beneath offers a solid support base. This is a classic squeeze setup—volume has been declining over the last 48 hours, often a precursor to an explosive move.
If the breakout confirms, momentum could shift quickly in favor of the bulls. The daily chart shows price hugging the cloud, and a close above resistance would flip the structure.
Are you watching for a breakout or a rejection?
Not financial advice. Always manage your risk.
#APT #BreakoutSetup #Ichimoku #CryptoAnalysis
🔥
Price is pressing against the descending channel resistance while the Ichimoku cloud beneath offers a solid support base. This is a classic squeeze setup—volume has been declining over the last 48 hours, often a precursor to an explosive move.
If the breakout confirms, momentum could shift quickly in favor of the bulls. The daily chart shows price hugging the cloud, and a close above resistance would flip the structure.
Are you watching for a breakout or a rejection?
Not financial advice. Always manage your risk.
#APT #BreakoutSetup #Ichimoku #CryptoAnalysis
🔥
114

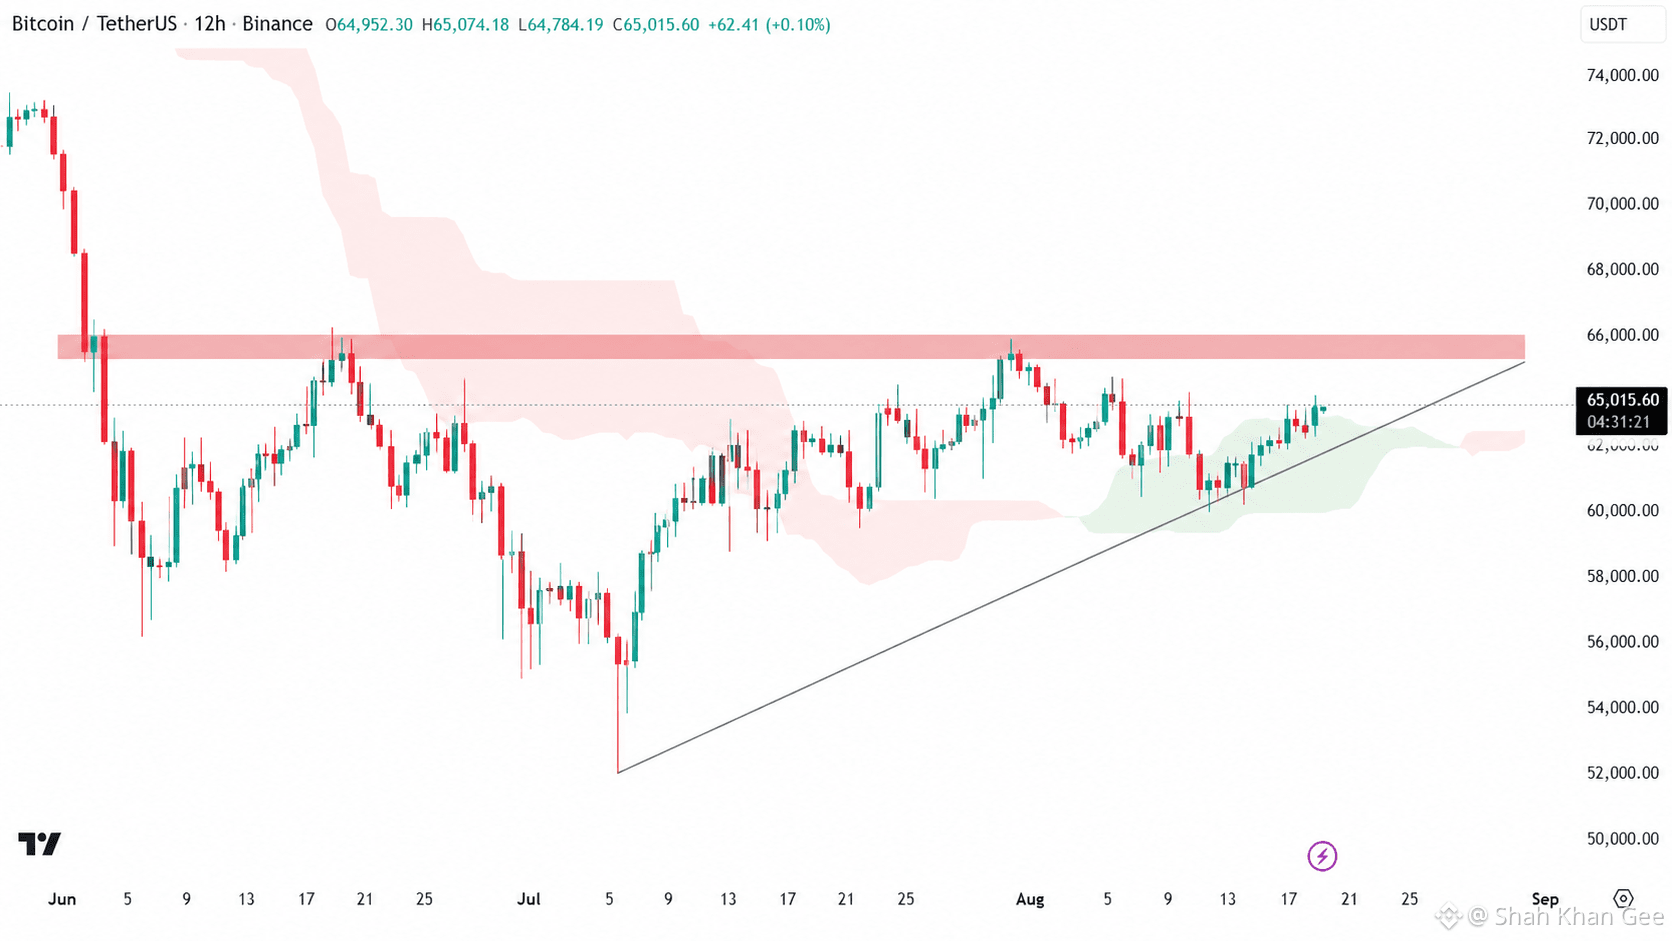
$BTC /USDT ANALYSIS 📈
Bitcoin is showing strength after bouncing from the rising support of the ascending triangle. The overall structure still looks bullish, while the #ichimoku Cloud is providing another layer of support underneath the price.
Now, the key level to watch is the horizontal supply zone. If #BTC☀ breaks and holds above it, we could see a strong move higher and potentially another bullish leg.
#SKHynixToInvest19.1TWonInM17Plant
#BTC🔥🔥🔥🔥🔥
{spot}(BTCUSDT)
$BTC /USDT ANALYSIS 📈
Bitcoin is showing strength after bouncing from the rising support of the ascending triangle. The overall structure still looks bullish, while the #ichimoku Cloud is providing another layer of support underneath the price.
Now, the key level to watch is the horizontal supply zone. If #BTC☀ breaks and holds above it, we could see a strong move higher and potentially another bullish leg.
#SKHynixToInvest19.1TWonInM17Plant
#BTC🔥🔥🔥🔥🔥
Bitcoin is showing strength after bouncing from the rising support of the ascending triangle. The overall structure still looks bullish, while the #ichimoku Cloud is providing another layer of support underneath the price.
Now, the key level to watch is the horizontal supply zone. If #BTC☀ breaks and holds above it, we could see a strong move higher and potentially another bullish leg.
#SKHynixToInvest19.1TWonInM17Plant
#BTC🔥🔥🔥🔥🔥
86

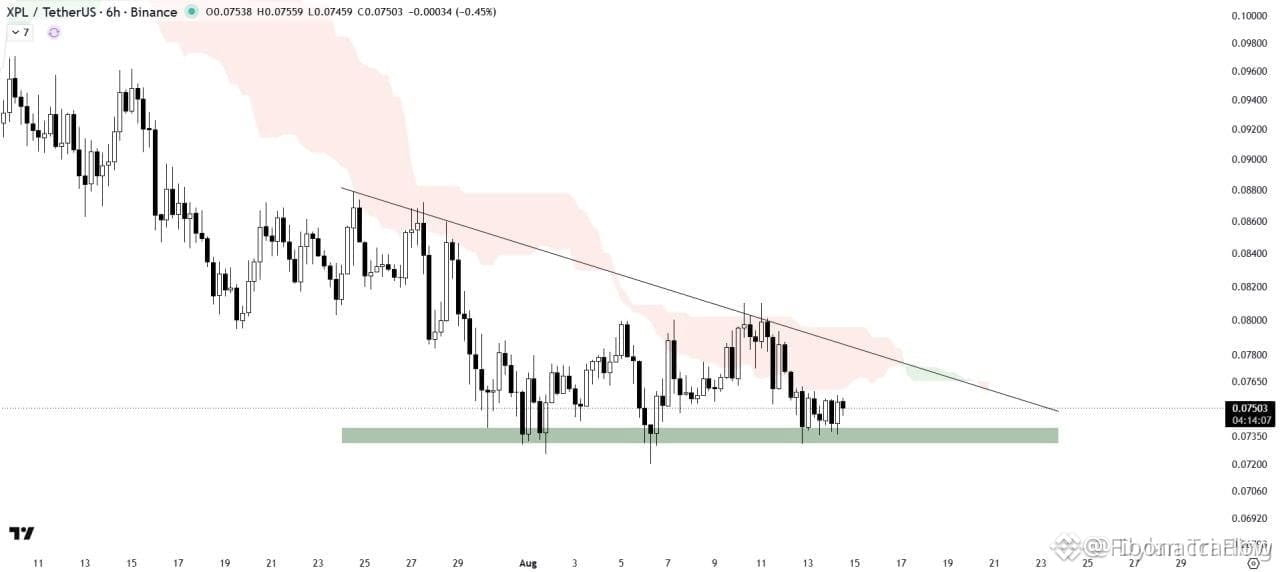
🔻 $XPL PULLING THE PIN ON A DESCENDING TRIANGLE — THE CLOUD DECIDES EVERYTHING 📉
⚔️ There's a silent war brewing on the XPL chart. Price is squeezing tighter inside a descending triangle while the Ichimoku cloud camps overhead like a fortress wall — every rally try gets swallowed before it can breathe. 📊 This isn't a market that rewards hopium; it rewards patience and clean confirmation.
💡 Triangles like this don't stay quiet forever. A decisive breakout above the cloud flips the narrative bullish and open the floodgates for momentum chasers. A breakdown underneath, and the path of least resistance leads south with liquidity waiting below. 🦈 The smart money already positioned themselves — the question is which side they're betting on.
💬 Are you buying the breakout above the cloud or waiting for the breakdown to confirm a short? 👇
⚠️ Not financial advice. Always manage your risk. 🛡️
🏷️ #XPL #DescendingTriangle #Ichimoku #CryptoSignals
⚡ 🔍
🔻 $XPL PULLING THE PIN ON A DESCENDING TRIANGLE — THE CLOUD DECIDES EVERYTHING 📉
⚔️ There's a silent war brewing on the XPL chart. Price is squeezing tighter inside a descending triangle while the Ichimoku cloud camps overhead like a fortress wall — every rally try gets swallowed before it can breathe. 📊 This isn't a market that rewards hopium; it rewards patience and clean confirmation.
💡 Triangles like this don't stay quiet forever. A decisive breakout above the cloud flips the narrative bullish and open the floodgates for momentum chasers. A breakdown underneath, and the path of least resistance leads south with liquidity waiting below. 🦈 The smart money already positioned themselves — the question is which side they're betting on.
💬 Are you buying the breakout above the cloud or waiting for the breakdown to confirm a short? 👇
⚠️ Not financial advice. Always manage your risk. 🛡️
🏷️ #XPL #DescendingTriangle #Ichimoku #CryptoSignals
⚡ 🔍
⚔️ There's a silent war brewing on the XPL chart. Price is squeezing tighter inside a descending triangle while the Ichimoku cloud camps overhead like a fortress wall — every rally try gets swallowed before it can breathe. 📊 This isn't a market that rewards hopium; it rewards patience and clean confirmation.
💡 Triangles like this don't stay quiet forever. A decisive breakout above the cloud flips the narrative bullish and open the floodgates for momentum chasers. A breakdown underneath, and the path of least resistance leads south with liquidity waiting below. 🦈 The smart money already positioned themselves — the question is which side they're betting on.
💬 Are you buying the breakout above the cloud or waiting for the breakdown to confirm a short? 👇
⚠️ Not financial advice. Always manage your risk. 🛡️
🏷️ #XPL #DescendingTriangle #Ichimoku #CryptoSignals
⚡ 🔍
107
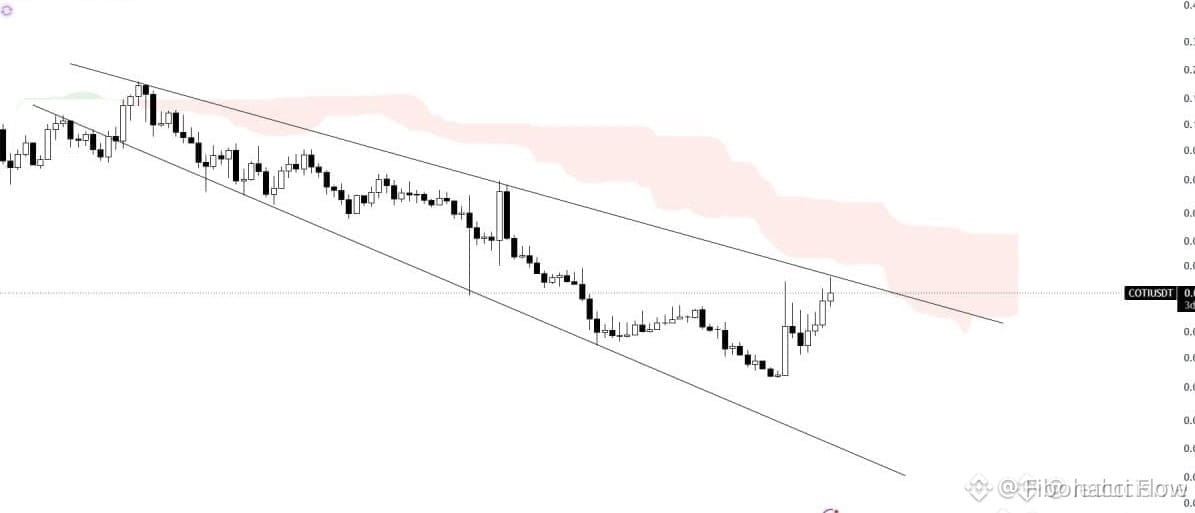
🚀 $COTI SURFING THE ICHIMOKU BARRIER—READY TO BREAK THROUGH! 🟢
📊 The pair is hammering the Ichimoku Kumo’s lower cloud, a classic smart‑money squeeze. Every time $COTI nudges this support, the whales load up, creating a hidden demand wall that’s about to crumble. 🌊
⚡ Once the price punches through, volume is primed to roar, giving a clean 20‑50% upside runway. The swing low acts as a natural stop, keeping risk tight while the upside potential shines. 📌
💬 How are you positioning for the next surge on $COTI ? 👇
⚠️ Not financial advice. Always manage your risk. 🛡️
🏷️ #COTI #LongSetup #Ichimoku #Crypto
🔥 💎
🚀 $COTI SURFING THE ICHIMOKU BARRIER—READY TO BREAK THROUGH! 🟢
📊 The pair is hammering the Ichimoku Kumo’s lower cloud, a classic smart‑money squeeze. Every time $COTI nudges this support, the whales load up, creating a hidden demand wall that’s about to crumble. 🌊
⚡ Once the price punches through, volume is primed to roar, giving a clean 20‑50% upside runway. The swing low acts as a natural stop, keeping risk tight while the upside potential shines. 📌
💬 How are you positioning for the next surge on $COTI ? 👇
⚠️ Not financial advice. Always manage your risk. 🛡️
🏷️ #COTI #LongSetup #Ichimoku #Crypto
🔥 💎
📊 The pair is hammering the Ichimoku Kumo’s lower cloud, a classic smart‑money squeeze. Every time $COTI nudges this support, the whales load up, creating a hidden demand wall that’s about to crumble. 🌊
⚡ Once the price punches through, volume is primed to roar, giving a clean 20‑50% upside runway. The swing low acts as a natural stop, keeping risk tight while the upside potential shines. 📌
💬 How are you positioning for the next surge on $COTI ? 👇
⚠️ Not financial advice. Always manage your risk. 🛡️
🏷️ #COTI #LongSetup #Ichimoku #Crypto
🔥 💎
53
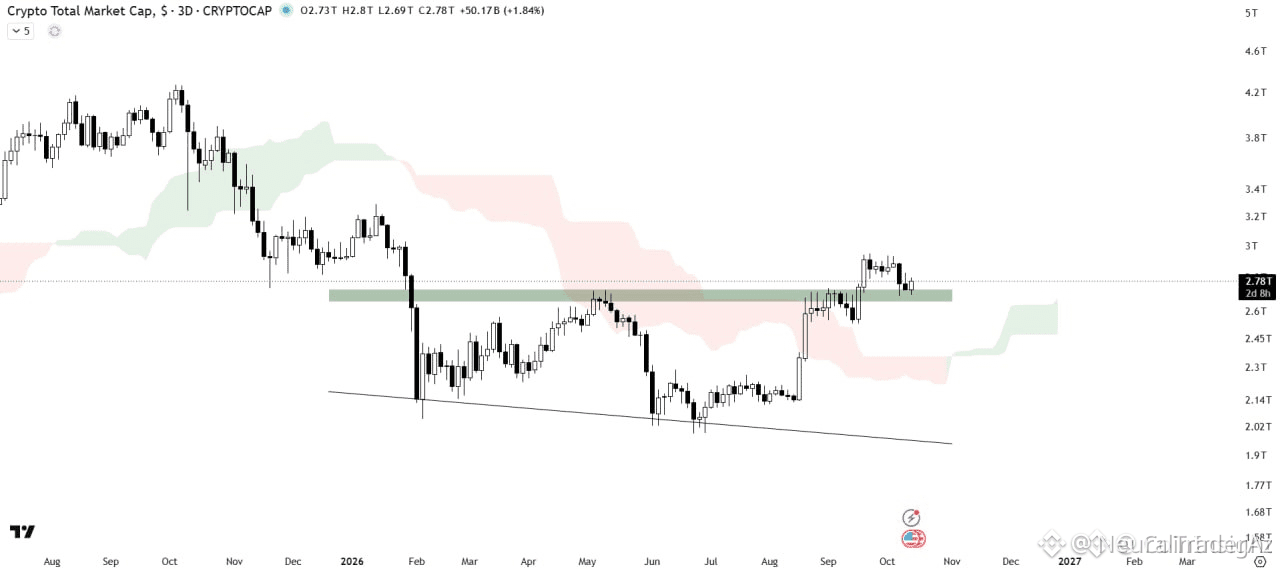
⚡ $TOTAL SECURES CLEAN STRUCTURAL S/R RECLAIM AS CLOUD DEMAND ANCHORS EXPANSION 📈
A methodical retest across horizontal support and resistance has confirmed structural integrity across the macro board. Institutional footprint is unmistakable as price respects the dynamic floor, with the Ichimoku Cloud serving as an anchor of absorption against sell-side liquidity. 🌊
Holding firmly above this structural pivot maintains constructive order flow, signaling continuation rather than distribution. 📊 As long as this reclaimed level defends the baseline, macro expansion remains the path of least resistance. 💡 Are you positioned for the next structural leg upward, or waiting on confirmation? 💬
⚠️ Not financial advice. Always manage your risk. 🛡️
🏷️ #TOTAL #MarketStructure #Ichimoku #CryptoAnalysis
🎯 🦈
⚡ $TOTAL SECURES CLEAN STRUCTURAL S/R RECLAIM AS CLOUD DEMAND ANCHORS EXPANSION 📈
A methodical retest across horizontal support and resistance has confirmed structural integrity across the macro board. Institutional footprint is unmistakable as price respects the dynamic floor, with the Ichimoku Cloud serving as an anchor of absorption against sell-side liquidity. 🌊
Holding firmly above this structural pivot maintains constructive order flow, signaling continuation rather than distribution. 📊 As long as this reclaimed level defends the baseline, macro expansion remains the path of least resistance. 💡 Are you positioned for the next structural leg upward, or waiting on confirmation? 💬
⚠️ Not financial advice. Always manage your risk. 🛡️
🏷️ #TOTAL #MarketStructure #Ichimoku #CryptoAnalysis
🎯 🦈
A methodical retest across horizontal support and resistance has confirmed structural integrity across the macro board. Institutional footprint is unmistakable as price respects the dynamic floor, with the Ichimoku Cloud serving as an anchor of absorption against sell-side liquidity. 🌊
Holding firmly above this structural pivot maintains constructive order flow, signaling continuation rather than distribution. 📊 As long as this reclaimed level defends the baseline, macro expansion remains the path of least resistance. 💡 Are you positioned for the next structural leg upward, or waiting on confirmation? 💬
⚠️ Not financial advice. Always manage your risk. 🛡️
🏷️ #TOTAL #MarketStructure #Ichimoku #CryptoAnalysis
🎯 🦈
7
·
--
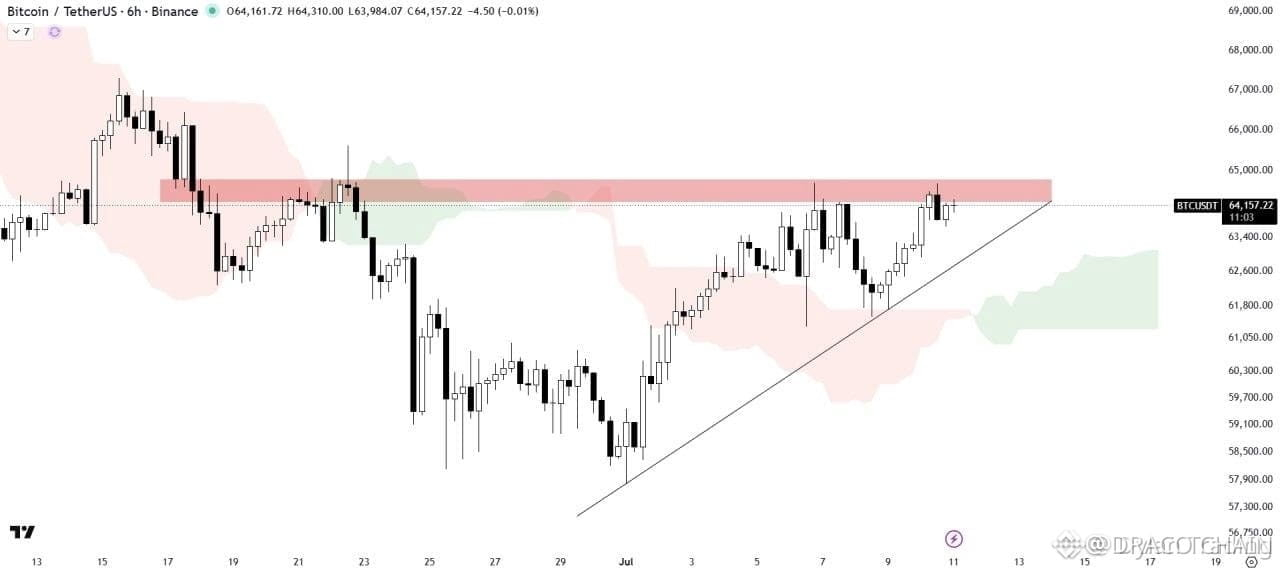
$BTC AT CRITICAL TRIANGLE APEX WITH CLOUD SUPPORT 🔥
Bitcoin is pressing against a defined supply zone inside an ascending triangle on the 4H chart, with the Ichimoku cloud serving as dynamic support at the lower trendline. This narrowing structure typically forces a decisive expansion — either a breakout above resistance or a breakdown through the cloud.
Price action is compressing into the apex, and the market is clearly awaiting a catalyst before committing. The setup itself is clean, but without confirmation, discretion is key.
Are you leaning long or short at this level?
Not financial advice. Always manage your risk.
#BTC #AscendingTriangle #Ichimoku #Crypto
🔥
$BTC AT CRITICAL TRIANGLE APEX WITH CLOUD SUPPORT 🔥
Bitcoin is pressing against a defined supply zone inside an ascending triangle on the 4H chart, with the Ichimoku cloud serving as dynamic support at the lower trendline. This narrowing structure typically forces a decisive expansion — either a breakout above resistance or a breakdown through the cloud.
Price action is compressing into the apex, and the market is clearly awaiting a catalyst before committing. The setup itself is clean, but without confirmation, discretion is key.
Are you leaning long or short at this level?
Not financial advice. Always manage your risk.
#BTC #AscendingTriangle #Ichimoku #Crypto
🔥
Bitcoin is pressing against a defined supply zone inside an ascending triangle on the 4H chart, with the Ichimoku cloud serving as dynamic support at the lower trendline. This narrowing structure typically forces a decisive expansion — either a breakout above resistance or a breakdown through the cloud.
Price action is compressing into the apex, and the market is clearly awaiting a catalyst before committing. The setup itself is clean, but without confirmation, discretion is key.
Are you leaning long or short at this level?
Not financial advice. Always manage your risk.
#BTC #AscendingTriangle #Ichimoku #Crypto
🔥
16
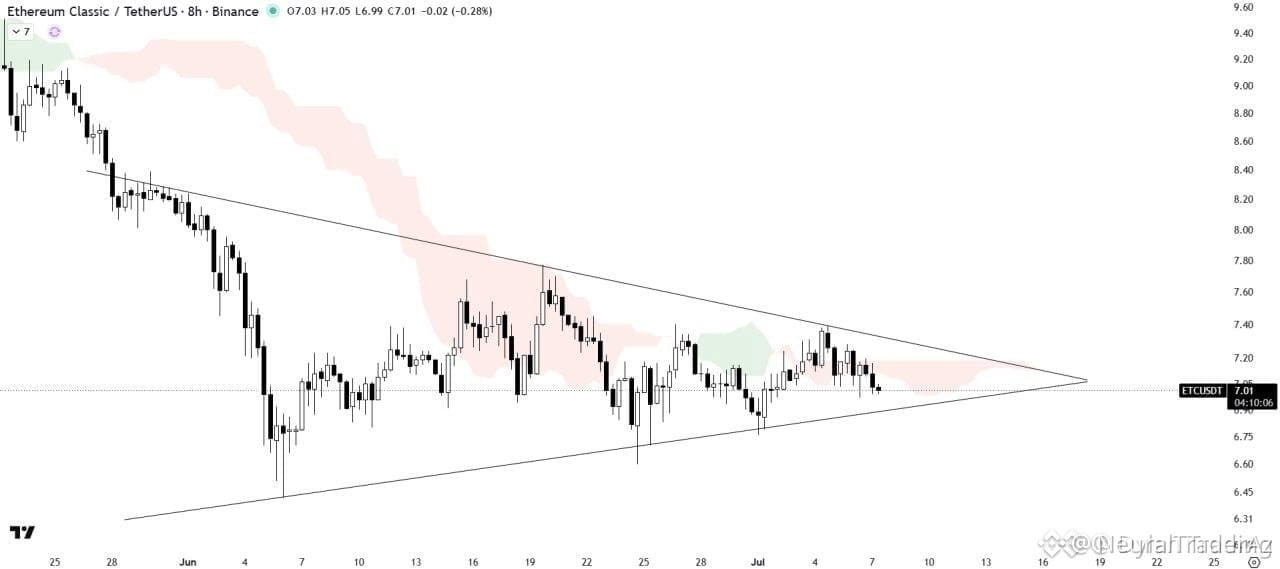
$ETC APPROACHES TRIANGLE APEX WITH ICHIMOKU RESISTANCE IN PLAY ⚡
The symmetrical triangle on ETC/USDT is compressing toward a resolution. Price remains above the ascending support trendline but is capped by the Ichimoku cloud on the 4H timeframe — a classic squeeze setup. Volume is declining as the pattern narrows, suggesting an explosive move is imminent.
Traders are watching closely for a clean break above the cloud or a breakdown below the trendline to define the next directional bias. Which side are you leaning for this leg?
Not financial advice. Always manage your risk.
#ETC #TrianglePattern #Ichimoku #CryptoSetup
⚡
$ETC APPROACHES TRIANGLE APEX WITH ICHIMOKU RESISTANCE IN PLAY ⚡
The symmetrical triangle on ETC/USDT is compressing toward a resolution. Price remains above the ascending support trendline but is capped by the Ichimoku cloud on the 4H timeframe — a classic squeeze setup. Volume is declining as the pattern narrows, suggesting an explosive move is imminent.
Traders are watching closely for a clean break above the cloud or a breakdown below the trendline to define the next directional bias. Which side are you leaning for this leg?
Not financial advice. Always manage your risk.
#ETC #TrianglePattern #Ichimoku #CryptoSetup
⚡
The symmetrical triangle on ETC/USDT is compressing toward a resolution. Price remains above the ascending support trendline but is capped by the Ichimoku cloud on the 4H timeframe — a classic squeeze setup. Volume is declining as the pattern narrows, suggesting an explosive move is imminent.
Traders are watching closely for a clean break above the cloud or a breakdown below the trendline to define the next directional bias. Which side are you leaning for this leg?
Not financial advice. Always manage your risk.
#ETC #TrianglePattern #Ichimoku #CryptoSetup
⚡
20
·
--
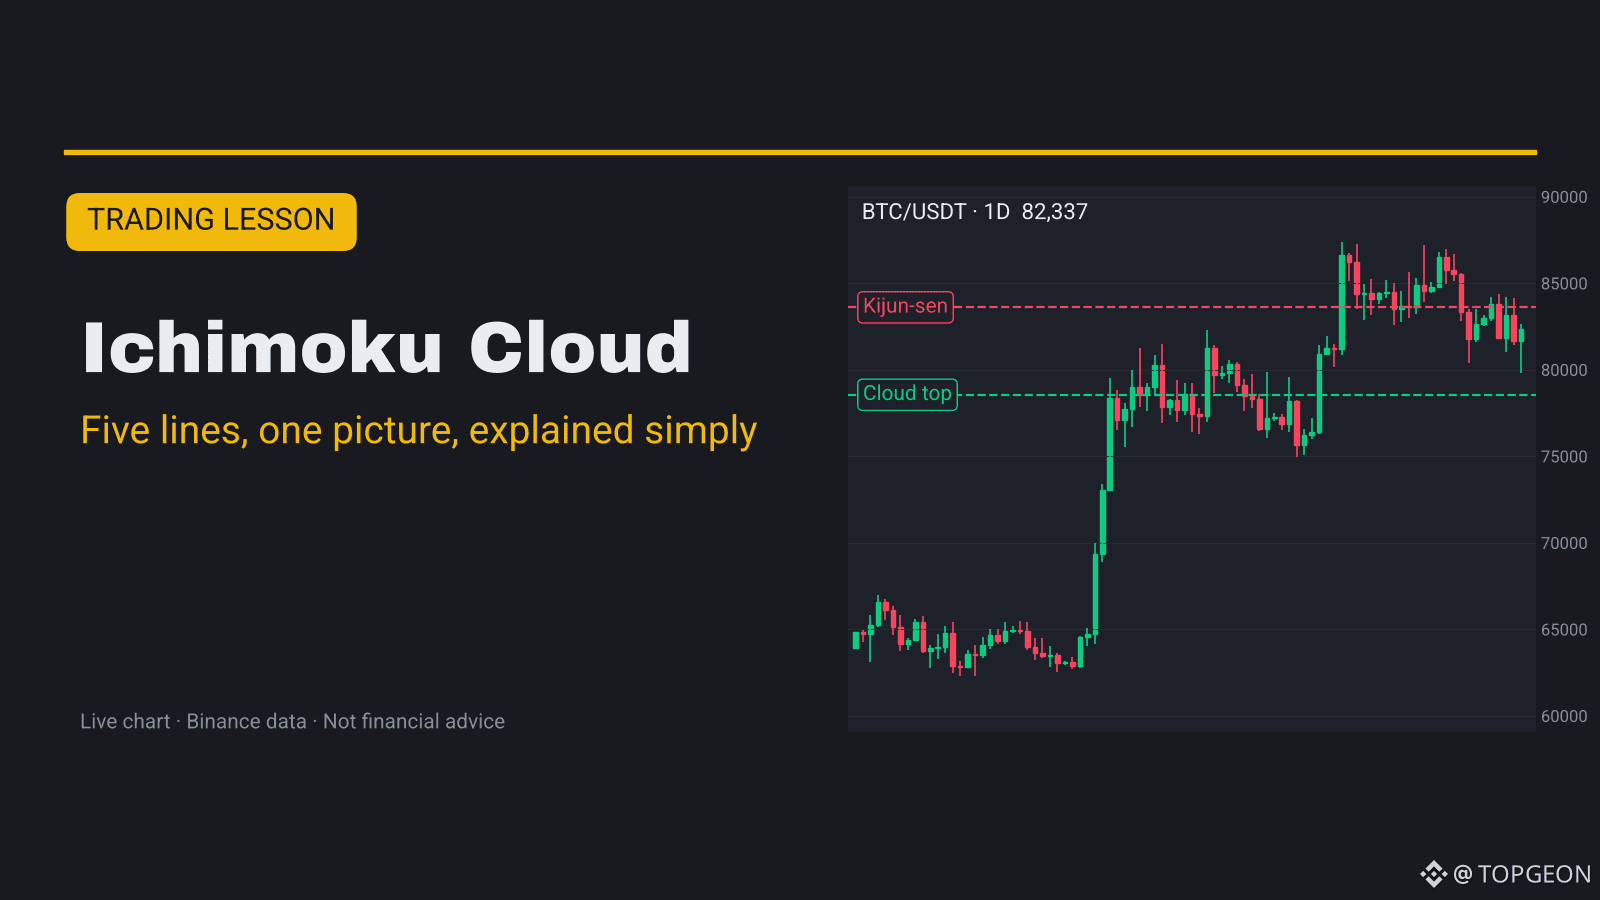
Article
Ichimoku Cloud: Explained Simply📘 What is the Ichimoku Cloud?
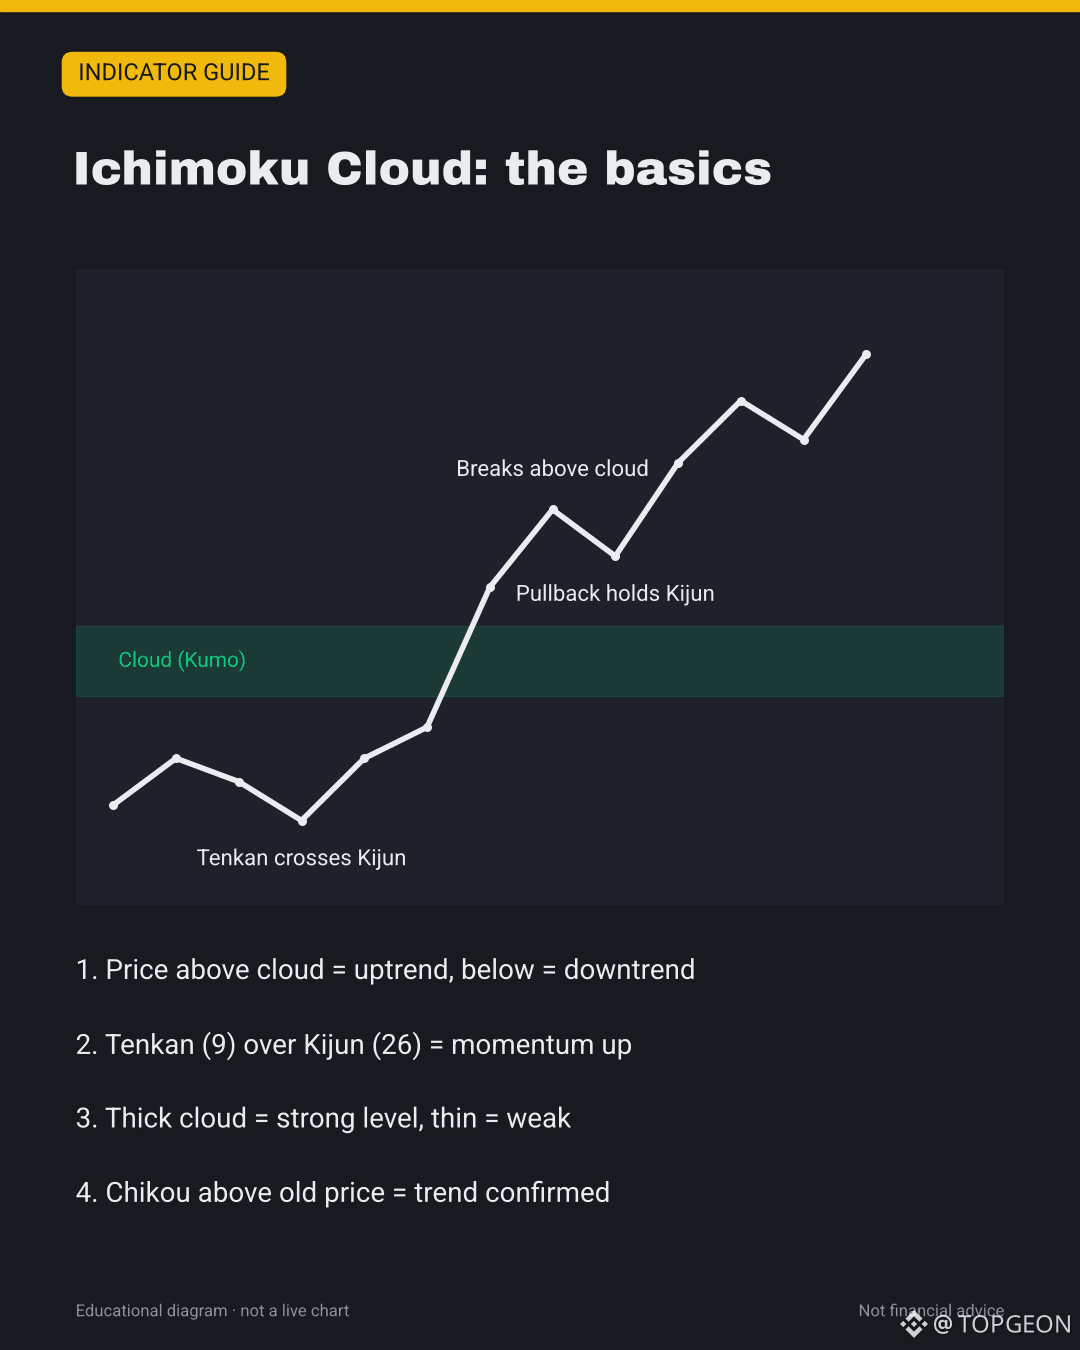
Ichimoku Kinko Hyo means "one-glance equilibrium chart". It puts trend, momentum and support/resistance on one chart with five lines. It looks busy at first, but each line answers one simple question.
The shaded area between two of the lines is the "cloud" (Kumo). Price above the cloud = uptrend. Price below it = downtrend. Price inside it = no clear trend. Right now $BTC shows a useful mixed picture.
📊 Live chart in the cover and in the image post below.
🔍 The five lines (default settings 9, 26, 52)
• Tenkan-sen (conversion line): middle of the highest high and lowest low of the last 9 candles. Fast, short-term balance
• Kijun-sen (base line): the same, but over 26 candles. Slower, often acts as support or resistance
• Senkou Span A: average of Tenkan and Kijun, plotted 26 candles ahead
• Senkou Span B: middle of the 52-candle high and low, plotted 26 candles ahead
• Span A and Span B together form the cloud. Green when A is above B, red when B is above A
• Chikou Span (lagging line): today's close plotted 26 candles back. It shows if price is higher or lower than 26 candles ago
🔍 How to read it
• Price above the cloud: buyers in control. Below: sellers in control
• Tenkan crossing above Kijun (TK cross up): momentum turning up. Crossing below: turning down
• A TK cross above the cloud is stronger than one inside or below it
• Thick cloud = strong support or resistance. Thin cloud = easy to break
• Chikou above the price of 26 candles ago confirms the uptrend
📈 How traders use it
• Entry: price above the cloud, TK cross up, and Chikou above old price. Many traders wait for a pullback to the Kijun to buy
• Stop-loss: under the Kijun or under the cloud, depending on how much room the trade needs
• Target: the last swing high, or trail the stop under the Kijun as price climbs
• Short side: the mirror image below a red cloud
• Filter: when price is inside the cloud, most traders do nothing
🧪 Live example: $BTC 1D
• Price: about $82,300 after a wick to $79,800 today
• Cloud today: $72,288 to $78,547. Price is well above it, so the big trend is still up
• Kijun-sen: $83,598 (middle of the $87,396 Sep 21 top and today's $79,800 low). Price is under it
• Tenkan-sen: $82,699. Price is just under it too
• Oct 14: Tenkan crossed below Kijun. That is a short-term bearish TK cross, but it happened above the cloud, so it is a weak sell signal
• Chikou: today's close is only about 1.3% above the Sep 19 close ($81,250). The confirmation is thin
• Lesson in lag: the last TK cross up came on Sep 24, three days after the $87,396 top. Ichimoku is slow by design
• What to watch: a daily close back above the Kijun ($83.6K) would flip short-term momentum up. A drop into the cloud top ($78.5K) would be the first real test of the uptrend
⚠️ Common mistakes
• Trading every TK cross. Inside the cloud they flip often and fail
• Forgetting the cloud is shifted 26 candles ahead. Look at the cloud under today's candle, not the end of the chart
• Using it on very low timeframes, where it gets noisy
• Using it alone. Check volume, key levels and the bigger trend
✅ Quick checklist
• Is price above, below or inside the cloud?
• Which way is the last TK cross, and where did it happen?
• Is the cloud ahead green or red, thick or thin?
• Is Chikou above or below old price?
• Is your stop set and your risk 1-2% of the account?
💬 Do you use Ichimoku, or does it look too busy for you? 👇
Not financial advice. DYOR.
#TradingTips #Ichimoku #Bitcoin
Ichimoku Cloud: Explained Simply
📘 What is the Ichimoku Cloud?
Ichimoku Kinko Hyo means "one-glance equilibrium chart". It puts trend, momentum and support/resistance on one chart with five lines. It looks busy at first, but each line answers one simple question.
The shaded area between two of the lines is the "cloud" (Kumo). Price above the cloud = uptrend. Price below it = downtrend. Price inside it = no clear trend. Right now $BTC shows a useful mixed picture.
📊 Live chart in the cover and in the image post below.
🔍 The five lines (default settings 9, 26, 52)
• Tenkan-sen (conversion line): middle of the highest high and lowest low of the last 9 candles. Fast, short-term balance
• Kijun-sen (base line): the same, but over 26 candles. Slower, often acts as support or resistance
• Senkou Span A: average of Tenkan and Kijun, plotted 26 candles ahead
• Senkou Span B: middle of the 52-candle high and low, plotted 26 candles ahead
• Span A and Span B together form the cloud. Green when A is above B, red when B is above A
• Chikou Span (lagging line): today's close plotted 26 candles back. It shows if price is higher or lower than 26 candles ago
🔍 How to read it
• Price above the cloud: buyers in control. Below: sellers in control
• Tenkan crossing above Kijun (TK cross up): momentum turning up. Crossing below: turning down
• A TK cross above the cloud is stronger than one inside or below it
• Thick cloud = strong support or resistance. Thin cloud = easy to break
• Chikou above the price of 26 candles ago confirms the uptrend
📈 How traders use it
• Entry: price above the cloud, TK cross up, and Chikou above old price. Many traders wait for a pullback to the Kijun to buy
• Stop-loss: under the Kijun or under the cloud, depending on how much room the trade needs
• Target: the last swing high, or trail the stop under the Kijun as price climbs
• Short side: the mirror image below a red cloud
• Filter: when price is inside the cloud, most traders do nothing
🧪 Live example: $BTC 1D
• Price: about $82,300 after a wick to $79,800 today
• Cloud today: $72,288 to $78,547. Price is well above it, so the big trend is still up
• Kijun-sen: $83,598 (middle of the $87,396 Sep 21 top and today's $79,800 low). Price is under it
• Tenkan-sen: $82,699. Price is just under it too
• Oct 14: Tenkan crossed below Kijun. That is a short-term bearish TK cross, but it happened above the cloud, so it is a weak sell signal
• Chikou: today's close is only about 1.3% above the Sep 19 close ($81,250). The confirmation is thin
• Lesson in lag: the last TK cross up came on Sep 24, three days after the $87,396 top. Ichimoku is slow by design
• What to watch: a daily close back above the Kijun ($83.6K) would flip short-term momentum up. A drop into the cloud top ($78.5K) would be the first real test of the uptrend
⚠️ Common mistakes
• Trading every TK cross. Inside the cloud they flip often and fail
• Forgetting the cloud is shifted 26 candles ahead. Look at the cloud under today's candle, not the end of the chart
• Using it on very low timeframes, where it gets noisy
• Using it alone. Check volume, key levels and the bigger trend
✅ Quick checklist
• Is price above, below or inside the cloud?
• Which way is the last TK cross, and where did it happen?
• Is the cloud ahead green or red, thick or thin?
• Is Chikou above or below old price?
• Is your stop set and your risk 1-2% of the account?
💬 Do you use Ichimoku, or does it look too busy for you? 👇
Not financial advice. DYOR.
#TradingTips #Ichimoku #Bitcoin
Ichimoku Kinko Hyo means "one-glance equilibrium chart". It puts trend, momentum and support/resistance on one chart with five lines. It looks busy at first, but each line answers one simple question.
The shaded area between two of the lines is the "cloud" (Kumo). Price above the cloud = uptrend. Price below it = downtrend. Price inside it = no clear trend. Right now $BTC shows a useful mixed picture.
📊 Live chart in the cover and in the image post below.
🔍 The five lines (default settings 9, 26, 52)
• Tenkan-sen (conversion line): middle of the highest high and lowest low of the last 9 candles. Fast, short-term balance
• Kijun-sen (base line): the same, but over 26 candles. Slower, often acts as support or resistance
• Senkou Span A: average of Tenkan and Kijun, plotted 26 candles ahead
• Senkou Span B: middle of the 52-candle high and low, plotted 26 candles ahead
• Span A and Span B together form the cloud. Green when A is above B, red when B is above A
• Chikou Span (lagging line): today's close plotted 26 candles back. It shows if price is higher or lower than 26 candles ago
🔍 How to read it
• Price above the cloud: buyers in control. Below: sellers in control
• Tenkan crossing above Kijun (TK cross up): momentum turning up. Crossing below: turning down
• A TK cross above the cloud is stronger than one inside or below it
• Thick cloud = strong support or resistance. Thin cloud = easy to break
• Chikou above the price of 26 candles ago confirms the uptrend
📈 How traders use it
• Entry: price above the cloud, TK cross up, and Chikou above old price. Many traders wait for a pullback to the Kijun to buy
• Stop-loss: under the Kijun or under the cloud, depending on how much room the trade needs
• Target: the last swing high, or trail the stop under the Kijun as price climbs
• Short side: the mirror image below a red cloud
• Filter: when price is inside the cloud, most traders do nothing
🧪 Live example: $BTC 1D
• Price: about $82,300 after a wick to $79,800 today
• Cloud today: $72,288 to $78,547. Price is well above it, so the big trend is still up
• Kijun-sen: $83,598 (middle of the $87,396 Sep 21 top and today's $79,800 low). Price is under it
• Tenkan-sen: $82,699. Price is just under it too
• Oct 14: Tenkan crossed below Kijun. That is a short-term bearish TK cross, but it happened above the cloud, so it is a weak sell signal
• Chikou: today's close is only about 1.3% above the Sep 19 close ($81,250). The confirmation is thin
• Lesson in lag: the last TK cross up came on Sep 24, three days after the $87,396 top. Ichimoku is slow by design
• What to watch: a daily close back above the Kijun ($83.6K) would flip short-term momentum up. A drop into the cloud top ($78.5K) would be the first real test of the uptrend
⚠️ Common mistakes
• Trading every TK cross. Inside the cloud they flip often and fail
• Forgetting the cloud is shifted 26 candles ahead. Look at the cloud under today's candle, not the end of the chart
• Using it on very low timeframes, where it gets noisy
• Using it alone. Check volume, key levels and the bigger trend
✅ Quick checklist
• Is price above, below or inside the cloud?
• Which way is the last TK cross, and where did it happen?
• Is the cloud ahead green or red, thick or thin?
• Is Chikou above or below old price?
• Is your stop set and your risk 1-2% of the account?
💬 Do you use Ichimoku, or does it look too busy for you? 👇
Not financial advice. DYOR.
#TradingTips #Ichimoku #Bitcoin
46
Log in to explore more content
Join global crypto users on Binance Square
⚡️ Get latest and useful information about crypto.
💬 Trusted by the world’s largest crypto exchange.
👍 Discover real insights from verified creators.
Email / Phone number
Trending Topics
1
#NvidiaEarningsTonight:AIStocks’NextMove?
20,349 views
356 Discussing
2
#A Packed Week of Earnings and Data Tests Markets
104,709 views
543 Discussing
3
#AnthropicIPOTestsInvestorAppetiteForAI
217,302 views
2,166 Discussing
4
#NvidiaBoardNotConsideringHuang’sReturnasCEO
45,383 views
498 Discussing
5
#AnthropicClearedToListOnNasdaqAsANT
0 views
5 Discussing
6
#WhatInvestmentSignalsDo13FFilingsReveal?
26,936 views
383 Discussing
7
#EvernorthRecords$505MImpairmentOnPreListingXRP
310 views
11 Discussing
8
#GoldmanSachsReports$1.22BInEtherETFHoldings
480 views
7 Discussing
9
#GoldmanSachsAndMillenniumEachHeldOver$1.2BInBitcoinETFs
3,646 views
11 Discussing
10
#InvescoStablecoinReservesFundLaunchesOnEthereum
15,504 views
255 Discussing