
#etc
etc
1.8M views
7,664 Discussing
Hot
Latest

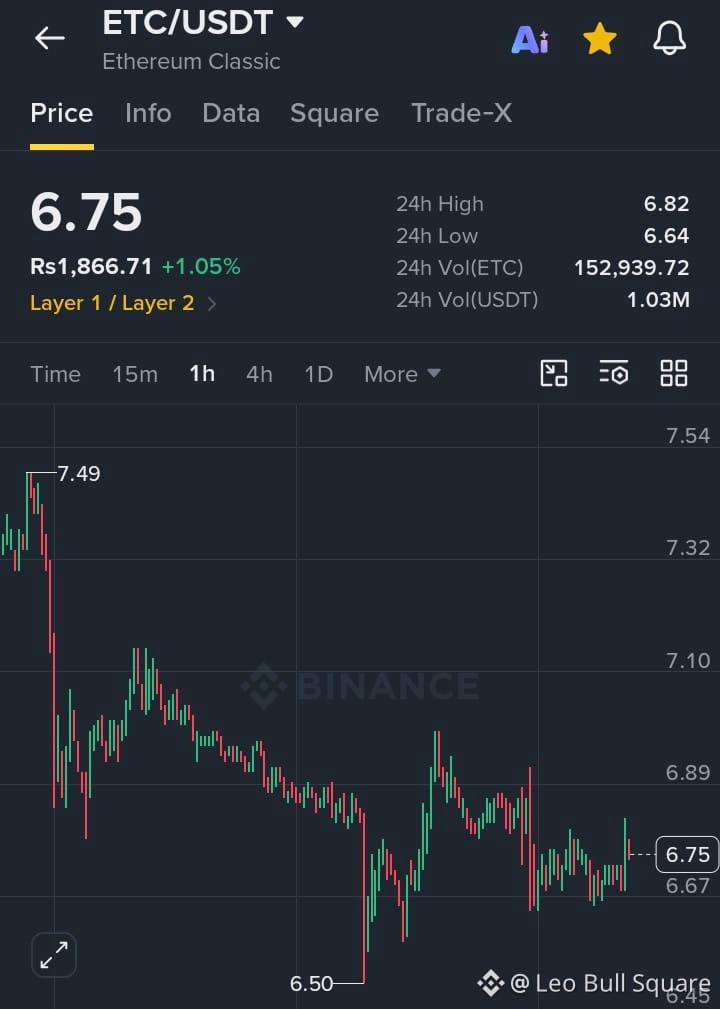
🔥 $ETC /USDT – BEARS STILL IN CONTROL! IS A SHORT SETUP FORMING? ETC is trading around $6.75 on the 1H timeframe, showing a modest recovery after sweeping liquidity near the $6.50 support. However, the broader market structure remains bearish, with lower highs suggesting sellers are still controlling the trend. Watch the $6.82–$6.89 supply zone for a potential liquidity grab and bearish rejection. If price fails to break above resistance and confirms a downside BOS, a short opportunity could develop. Entry Zone: $6.80–$6.88 | TP1: $6.67 | TP2: $6.55 | TP3: $6.50 | Stop Loss: $6.96. Wait for clear rejection and confirmation before entering; a sustained breakout above $6.89 invalidates this bearish setup. Trade smart, manage risk, and follow for more technical setups!
#ETC
{spot}(ETCUSDT)
🔥 $ETC /USDT – BEARS STILL IN CONTROL! IS A SHORT SETUP FORMING? ETC is trading around $6.75 on the 1H timeframe, showing a modest recovery after sweeping liquidity near the $6.50 support. However, the broader market structure remains bearish, with lower highs suggesting sellers are still controlling the trend. Watch the $6.82–$6.89 supply zone for a potential liquidity grab and bearish rejection. If price fails to break above resistance and confirms a downside BOS, a short opportunity could develop. Entry Zone: $6.80–$6.88 | TP1: $6.67 | TP2: $6.55 | TP3: $6.50 | Stop Loss: $6.96. Wait for clear rejection and confirmation before entering; a sustained breakout above $6.89 invalidates this bearish setup. Trade smart, manage risk, and follow for more technical setups!
#ETC
#ETC
1
153


·
--
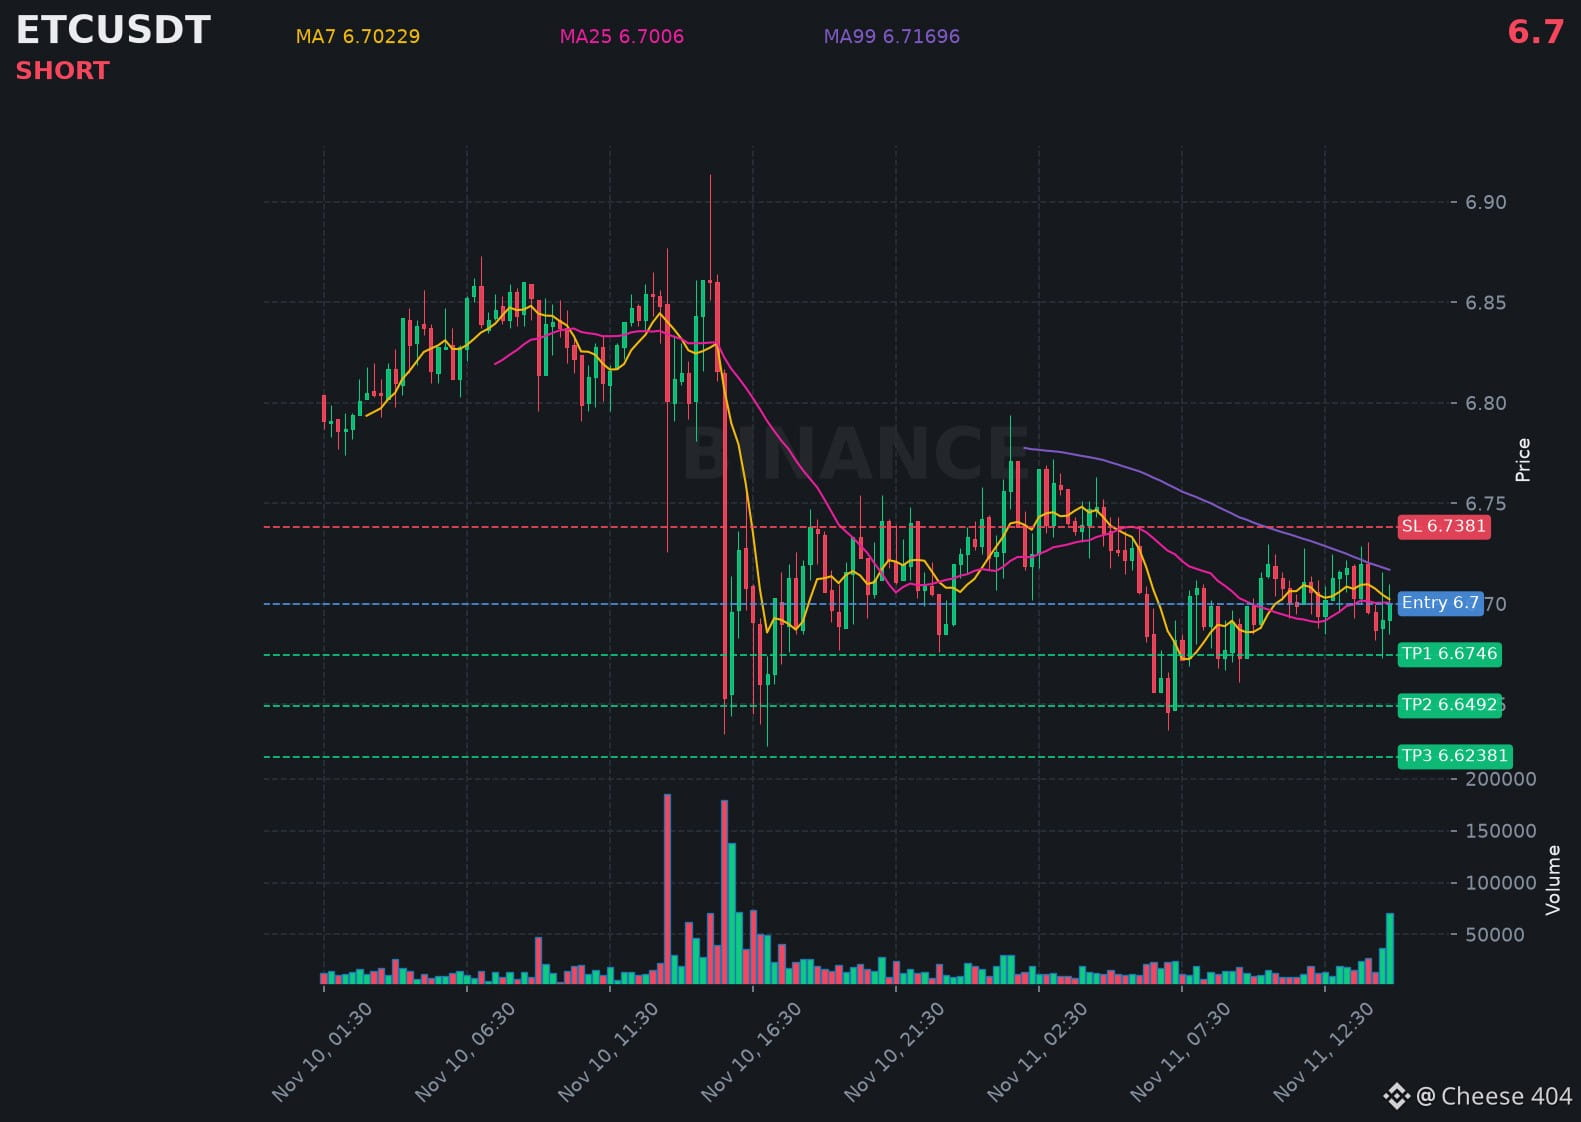
$ETC is struggling below resistance, hinting at another leg down in the coming hours.
📍 @ 6.7 | Volume: 0.47M USD
RSI 49 | EMA20: 6.70218 USD
📈 Trade Plan:
📈 Entry: 6.69238 – 6.70762
🛑 Stop Loss: 6.7381
🎯 TP1: 6.6746
🎯 TP2: 6.6492
🎯 TP3: 6.62381
Waiting for confirmation, then riding the downtrend.
👉 $ETC 👈 Catch it
#ETC
$ETC is struggling below resistance, hinting at another leg down in the coming hours.
📍 @ 6.7 | Volume: 0.47M USD
RSI 49 | EMA20: 6.70218 USD
📈 Trade Plan:
📈 Entry: 6.69238 – 6.70762
🛑 Stop Loss: 6.7381
🎯 TP1: 6.6746
🎯 TP2: 6.6492
🎯 TP3: 6.62381
Waiting for confirmation, then riding the downtrend.
👉 $ETC 👈 Catch it
#ETC
📍 @ 6.7 | Volume: 0.47M USD
RSI 49 | EMA20: 6.70218 USD
📈 Trade Plan:
📈 Entry: 6.69238 – 6.70762
🛑 Stop Loss: 6.7381
🎯 TP1: 6.6746
🎯 TP2: 6.6492
🎯 TP3: 6.62381
Waiting for confirmation, then riding the downtrend.
👉 $ETC 👈 Catch it
#ETC
254


👑 EXCLUSIVE MASTER SIGNAL 👑
Thousands trust this system for a reason. Follow the exact levels and protect your bag.
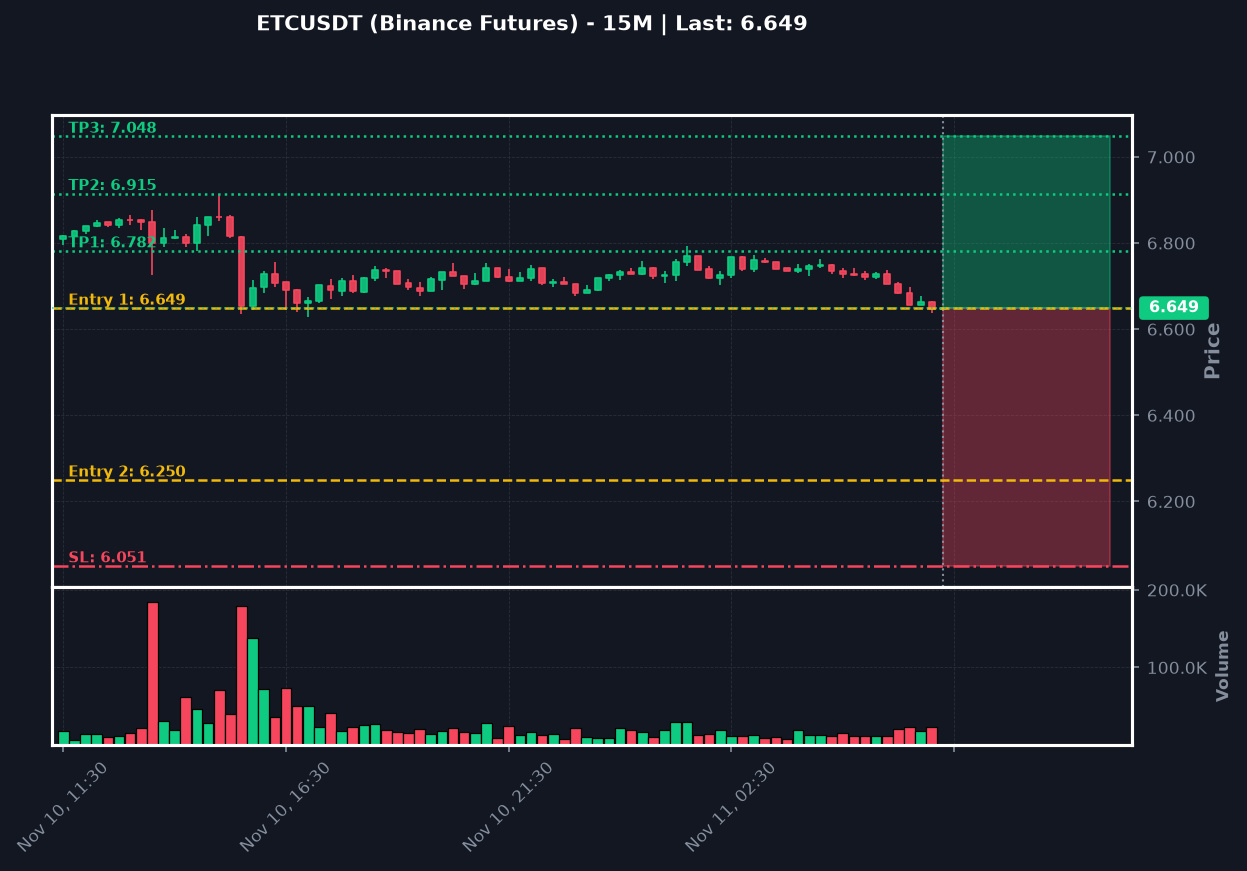
$ETC (15m)
📅 STATUS: LONG 🚀
👉 Entry 1: 6.649
👉 Entry 2: 6.25
🎯 TP 1: 6.782
🎯 TP 2: 6.915
🎯 TP 3: 7.048
⛔ Stop Loss: 6.05059
⚡ Leverage: Cross 20x
🛡️ Protect your portfolio and stick to the plan!
❤️ We treat your account like our own. Patience always pays when you follow true expertise.
#Write2Earn #Binance #BTC #TrendingTopic #ETC
👑 EXCLUSIVE MASTER SIGNAL 👑
Thousands trust this system for a reason. Follow the exact levels and protect your bag.
$ETC (15m)
📅 STATUS: LONG 🚀
👉 Entry 1: 6.649
👉 Entry 2: 6.25
🎯 TP 1: 6.782
🎯 TP 2: 6.915
🎯 TP 3: 7.048
⛔ Stop Loss: 6.05059
⚡ Leverage: Cross 20x
🛡️ Protect your portfolio and stick to the plan!
❤️ We treat your account like our own. Patience always pays when you follow true expertise.
#Write2Earn #Binance #BTC #TrendingTopic #ETC
Thousands trust this system for a reason. Follow the exact levels and protect your bag.
$ETC (15m)
📅 STATUS: LONG 🚀
👉 Entry 1: 6.649
👉 Entry 2: 6.25
🎯 TP 1: 6.782
🎯 TP 2: 6.915
🎯 TP 3: 7.048
⛔ Stop Loss: 6.05059
⚡ Leverage: Cross 20x
🛡️ Protect your portfolio and stick to the plan!
❤️ We treat your account like our own. Patience always pays when you follow true expertise.
#Write2Earn #Binance #BTC #TrendingTopic #ETC
5

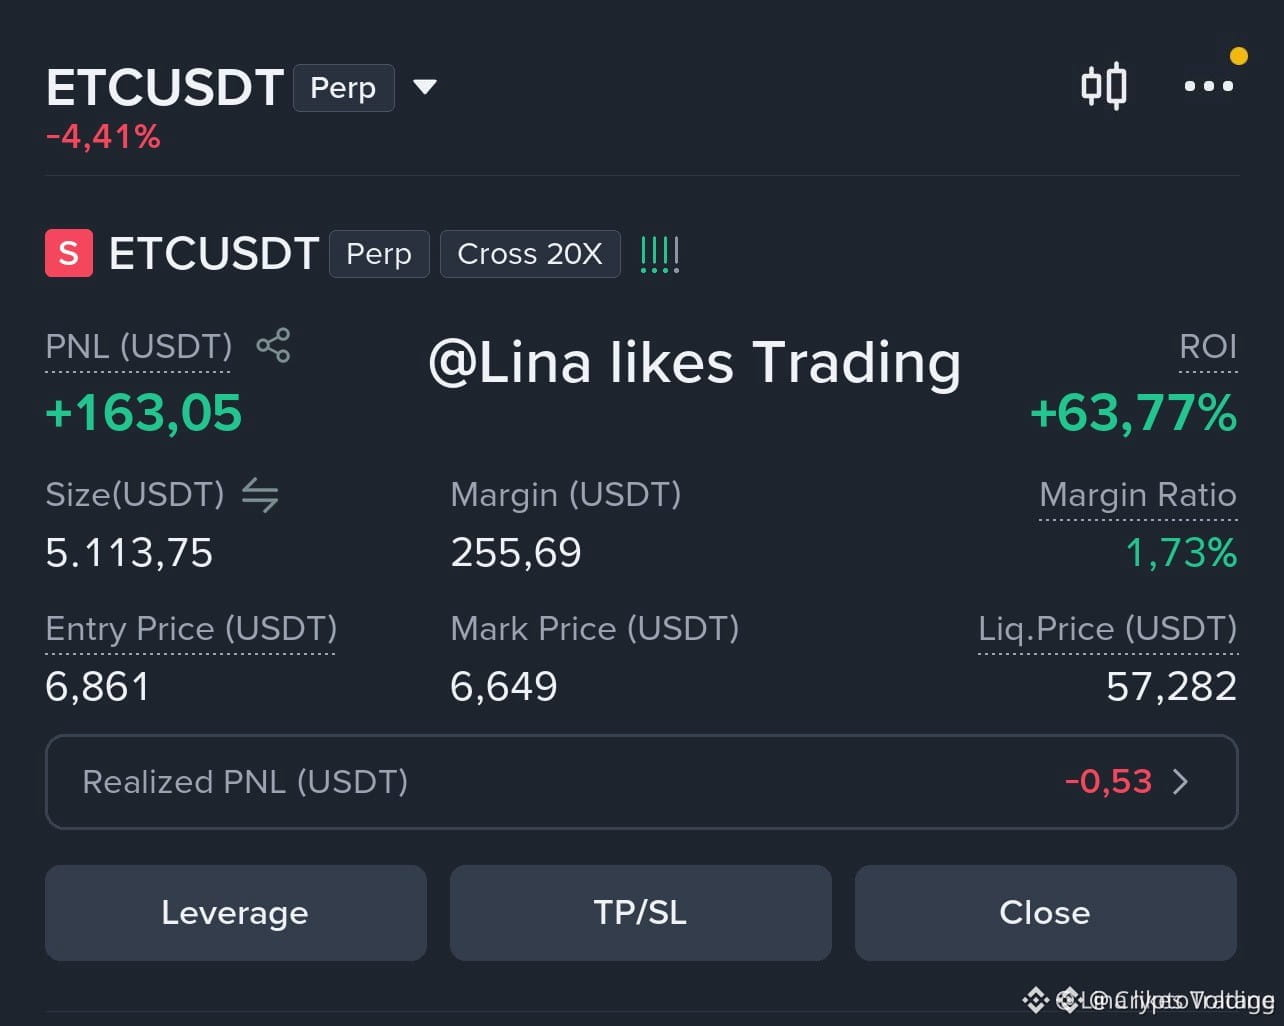
📉 $ETC — BEARISH BREAKDOWN DELIVERS A REPORTED 64% GAIN!
The short setup on Ethereum Classic reportedly captured a strong move after price failed to maintain bullish momentum and broke below key support.
{spot}(ETCUSDT)
$BTC
<badge color="success">Reported gain: 64%</badge>
💰 Reported Profit: $163
The breakdown highlights why support levels and momentum confirmation matter in trading.
A loss of key support can create opportunities for downside continuation, but every setup requires proper risk management.
Are you watching ETC for another bearish opportunity or waiting for a recovery?
⚠️ Past trade results do not guarantee future performance. Always verify trade history and manage risk.
🔔 Follow me @QueenOfCharts for more crypto updates, trending coins, and fresh trading signals. Let's catch the next big move together!
#ETC #EthereumClassic #ShortTrade #cryptotrading #AnthropicRejectsIPODelayValuationinQuestion #BinanceSquare
📉 $ETC — BEARISH BREAKDOWN DELIVERS A REPORTED 64% GAIN!
The short setup on Ethereum Classic reportedly captured a strong move after price failed to maintain bullish momentum and broke below key support.
$BTC
<badge color="success">Reported gain: 64%</badge>
💰 Reported Profit: $163
The breakdown highlights why support levels and momentum confirmation matter in trading.
A loss of key support can create opportunities for downside continuation, but every setup requires proper risk management.
Are you watching ETC for another bearish opportunity or waiting for a recovery?
⚠️ Past trade results do not guarantee future performance. Always verify trade history and manage risk.
🔔 Follow me @CryptoVoltage for more crypto updates, trending coins, and fresh trading signals. Let's catch the next big move together!
#ETC #EthereumClassic #ShortTrade #cryptotrading #AnthropicRejectsIPODelayValuationinQuestion #BinanceSquare
The short setup on Ethereum Classic reportedly captured a strong move after price failed to maintain bullish momentum and broke below key support.
$BTC
<badge color="success">Reported gain: 64%</badge>
💰 Reported Profit: $163
The breakdown highlights why support levels and momentum confirmation matter in trading.
A loss of key support can create opportunities for downside continuation, but every setup requires proper risk management.
Are you watching ETC for another bearish opportunity or waiting for a recovery?
⚠️ Past trade results do not guarantee future performance. Always verify trade history and manage risk.
🔔 Follow me @CryptoVoltage for more crypto updates, trending coins, and fresh trading signals. Let's catch the next big move together!
#ETC #EthereumClassic #ShortTrade #cryptotrading #AnthropicRejectsIPODelayValuationinQuestion #BinanceSquare

66

·
--
Bearish
$DOT
{spot}(DOTUSDT)
$FIL
{spot}(FILUSDT)
$ETC
{spot}(ETCUSDT)
Is the current market crash creating opportunities for new investors?
Many people wait for lower prices, but when the market finally drops, fear stops them from buying.
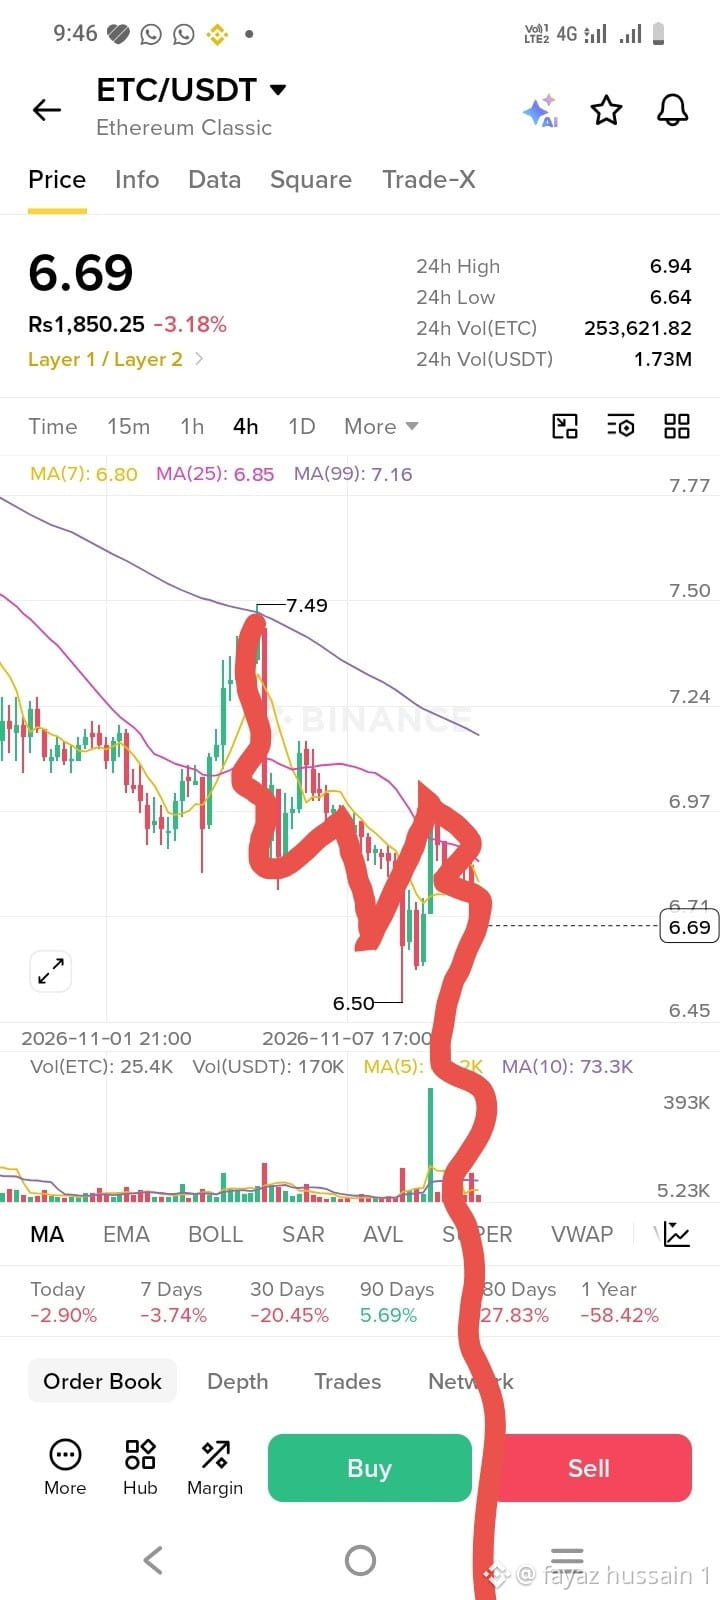
DOT, FIL, and ETC are now at $0.83, $0.74, and $6.64 respectively.
Would you consider these prices, or wait for more confirmation? #fil #dot #ETC
$DOT
$FIL
$ETC
Is the current market crash creating opportunities for new investors?
Many people wait for lower prices, but when the market finally drops, fear stops them from buying.
DOT, FIL, and ETC are now at $0.83, $0.74, and $6.64 respectively.
Would you consider these prices, or wait for more confirmation? #fil #dot #ETC
$FIL
$ETC
Is the current market crash creating opportunities for new investors?
Many people wait for lower prices, but when the market finally drops, fear stops them from buying.
DOT, FIL, and ETC are now at $0.83, $0.74, and $6.64 respectively.
Would you consider these prices, or wait for more confirmation? #fil #dot #ETC
145
·
--
Bearish
$FIL
{spot}(FILUSDT)
$DOT
{spot}(DOTUSDT)
$ETC
{spot}(ETCUSDT)
Beginners often ask one important question: When is the right time to enter crypto?
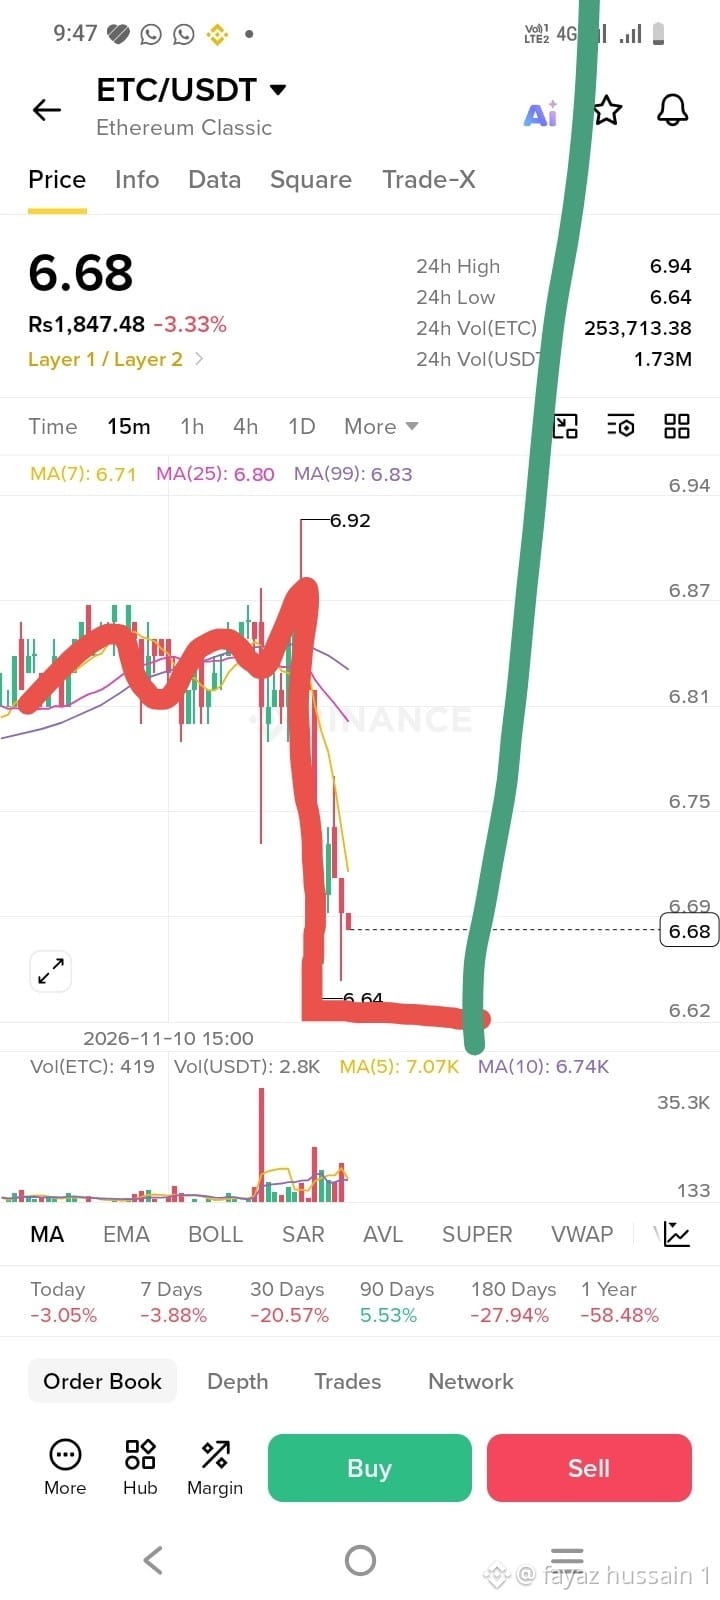
The market is down, and DOT, FIL, and ETC are attracting attention at their current prices.
But buying during a crash requires patience and a clear risk-management plan.
Would you recommend gradual investing rather than buying everything at once? #fil #dot #ETC
$FIL
$DOT
$ETC
Beginners often ask one important question: When is the right time to enter crypto?
The market is down, and DOT, FIL, and ETC are attracting attention at their current prices.
But buying during a crash requires patience and a clear risk-management plan.
Would you recommend gradual investing rather than buying everything at once? #fil #dot #ETC
$DOT
$ETC
Beginners often ask one important question: When is the right time to enter crypto?
The market is down, and DOT, FIL, and ETC are attracting attention at their current prices.
But buying during a crash requires patience and a clear risk-management plan.
Would you recommend gradual investing rather than buying everything at once? #fil #dot #ETC
163
🎯 SURGICAL ACCURACY ZONE 🎯
Do not rush. Wait for our entry, execute cleanly, and let probability do the heavy lifting.
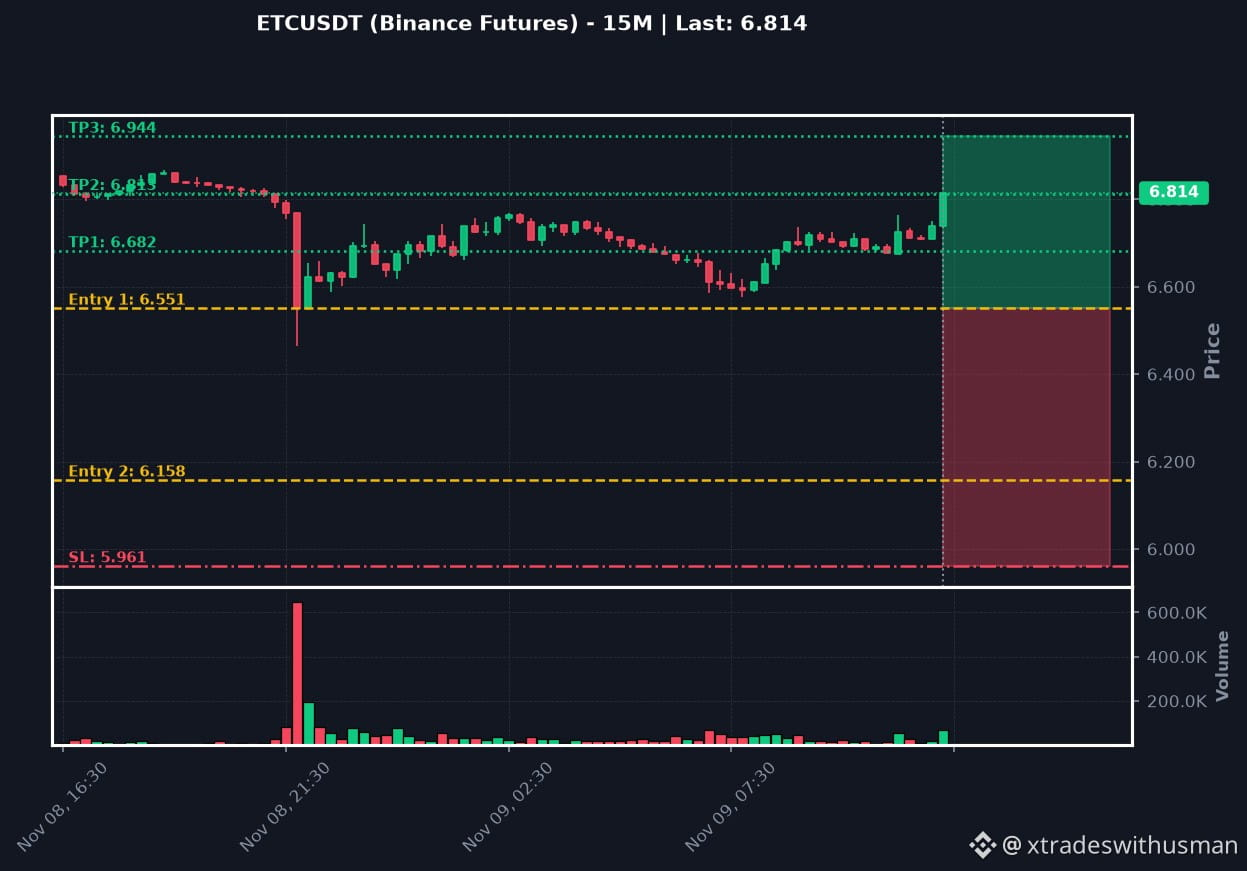
$ETC (15m)
📅 STATUS: LONG 🚀
👉 Entry 1: 6.551
👉 Entry 2: 6.158
🎯 TP 1: 6.682
🎯 TP 2: 6.813
🎯 TP 3: 6.944
⛔ Stop Loss: 5.96141
⚡ Leverage: Cross 20x
🛡️ Protect your portfolio and stick to the plan!
🏆 Together we win, together we grow. Stay loyal to the system and ignore the market noise.
#Write2Earn #Binance #BTC #TrendingTopic #ETC
🎯 SURGICAL ACCURACY ZONE 🎯
Do not rush. Wait for our entry, execute cleanly, and let probability do the heavy lifting.
$ETC (15m)
📅 STATUS: LONG 🚀
👉 Entry 1: 6.551
👉 Entry 2: 6.158
🎯 TP 1: 6.682
🎯 TP 2: 6.813
🎯 TP 3: 6.944
⛔ Stop Loss: 5.96141
⚡ Leverage: Cross 20x
🛡️ Protect your portfolio and stick to the plan!
🏆 Together we win, together we grow. Stay loyal to the system and ignore the market noise.
#Write2Earn #Binance #BTC #TrendingTopic #ETC
Do not rush. Wait for our entry, execute cleanly, and let probability do the heavy lifting.
$ETC (15m)
📅 STATUS: LONG 🚀
👉 Entry 1: 6.551
👉 Entry 2: 6.158
🎯 TP 1: 6.682
🎯 TP 2: 6.813
🎯 TP 3: 6.944
⛔ Stop Loss: 5.96141
⚡ Leverage: Cross 20x
🛡️ Protect your portfolio and stick to the plan!
🏆 Together we win, together we grow. Stay loyal to the system and ignore the market noise.
#Write2Earn #Binance #BTC #TrendingTopic #ETC
2

·
--
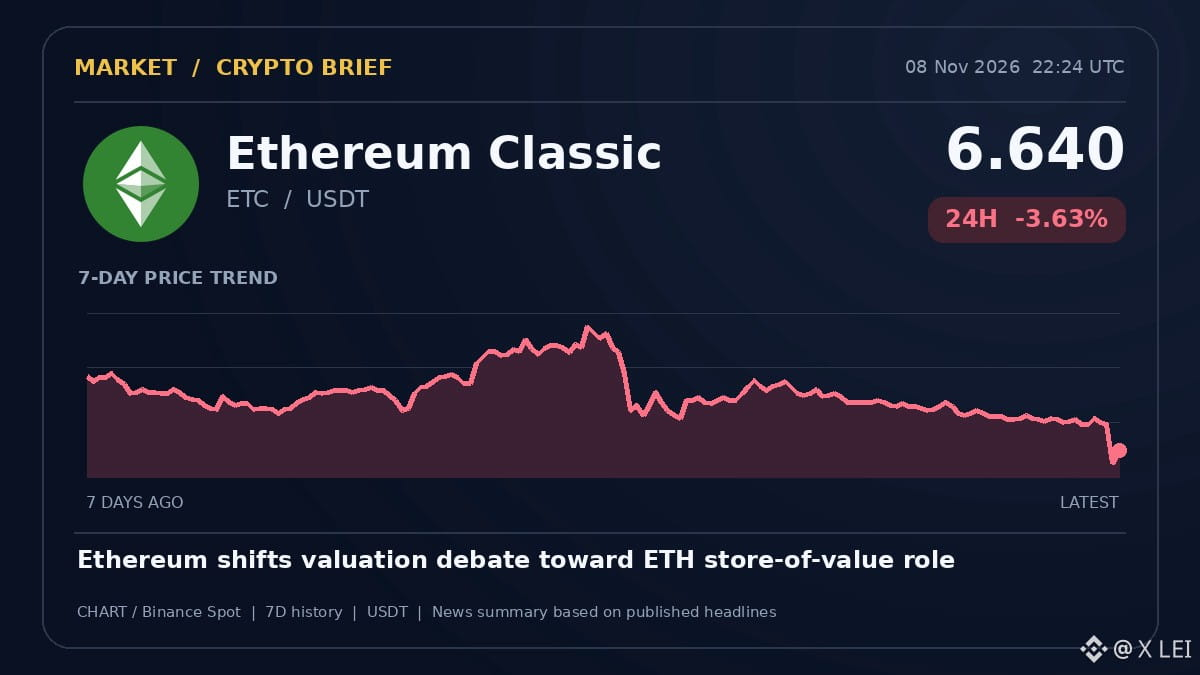
As Ethereum leans further into its store-of-value narrative according to a recent Traders Union report, older proof-of-work alternatives like Ethereum Classic are drawing renewed attention. In current spot markets, $ETC is changing hands at 6.64 USDT, reflecting a 24-hour decline of 3.63%. Market participants continue to monitor how broader ecosystem shifts influence legacy chain valuations. #ETC
As Ethereum leans further into its store-of-value narrative according to a recent Traders Union report, older proof-of-work alternatives like Ethereum Classic are drawing renewed attention. In current spot markets, $ETC is changing hands at 6.64 USDT, reflecting a 24-hour decline of 3.63%. Market participants continue to monitor how broader ecosystem shifts influence legacy chain valuations. #ETC
24

·
--
⛔ $ETC clears buy-side sweep, bearish bias
SHORT · 15M
Entry: $6.848 - $6.855
TP1: $6.77
TP2: $6.692
TP3: $6.63
SL: $6.926
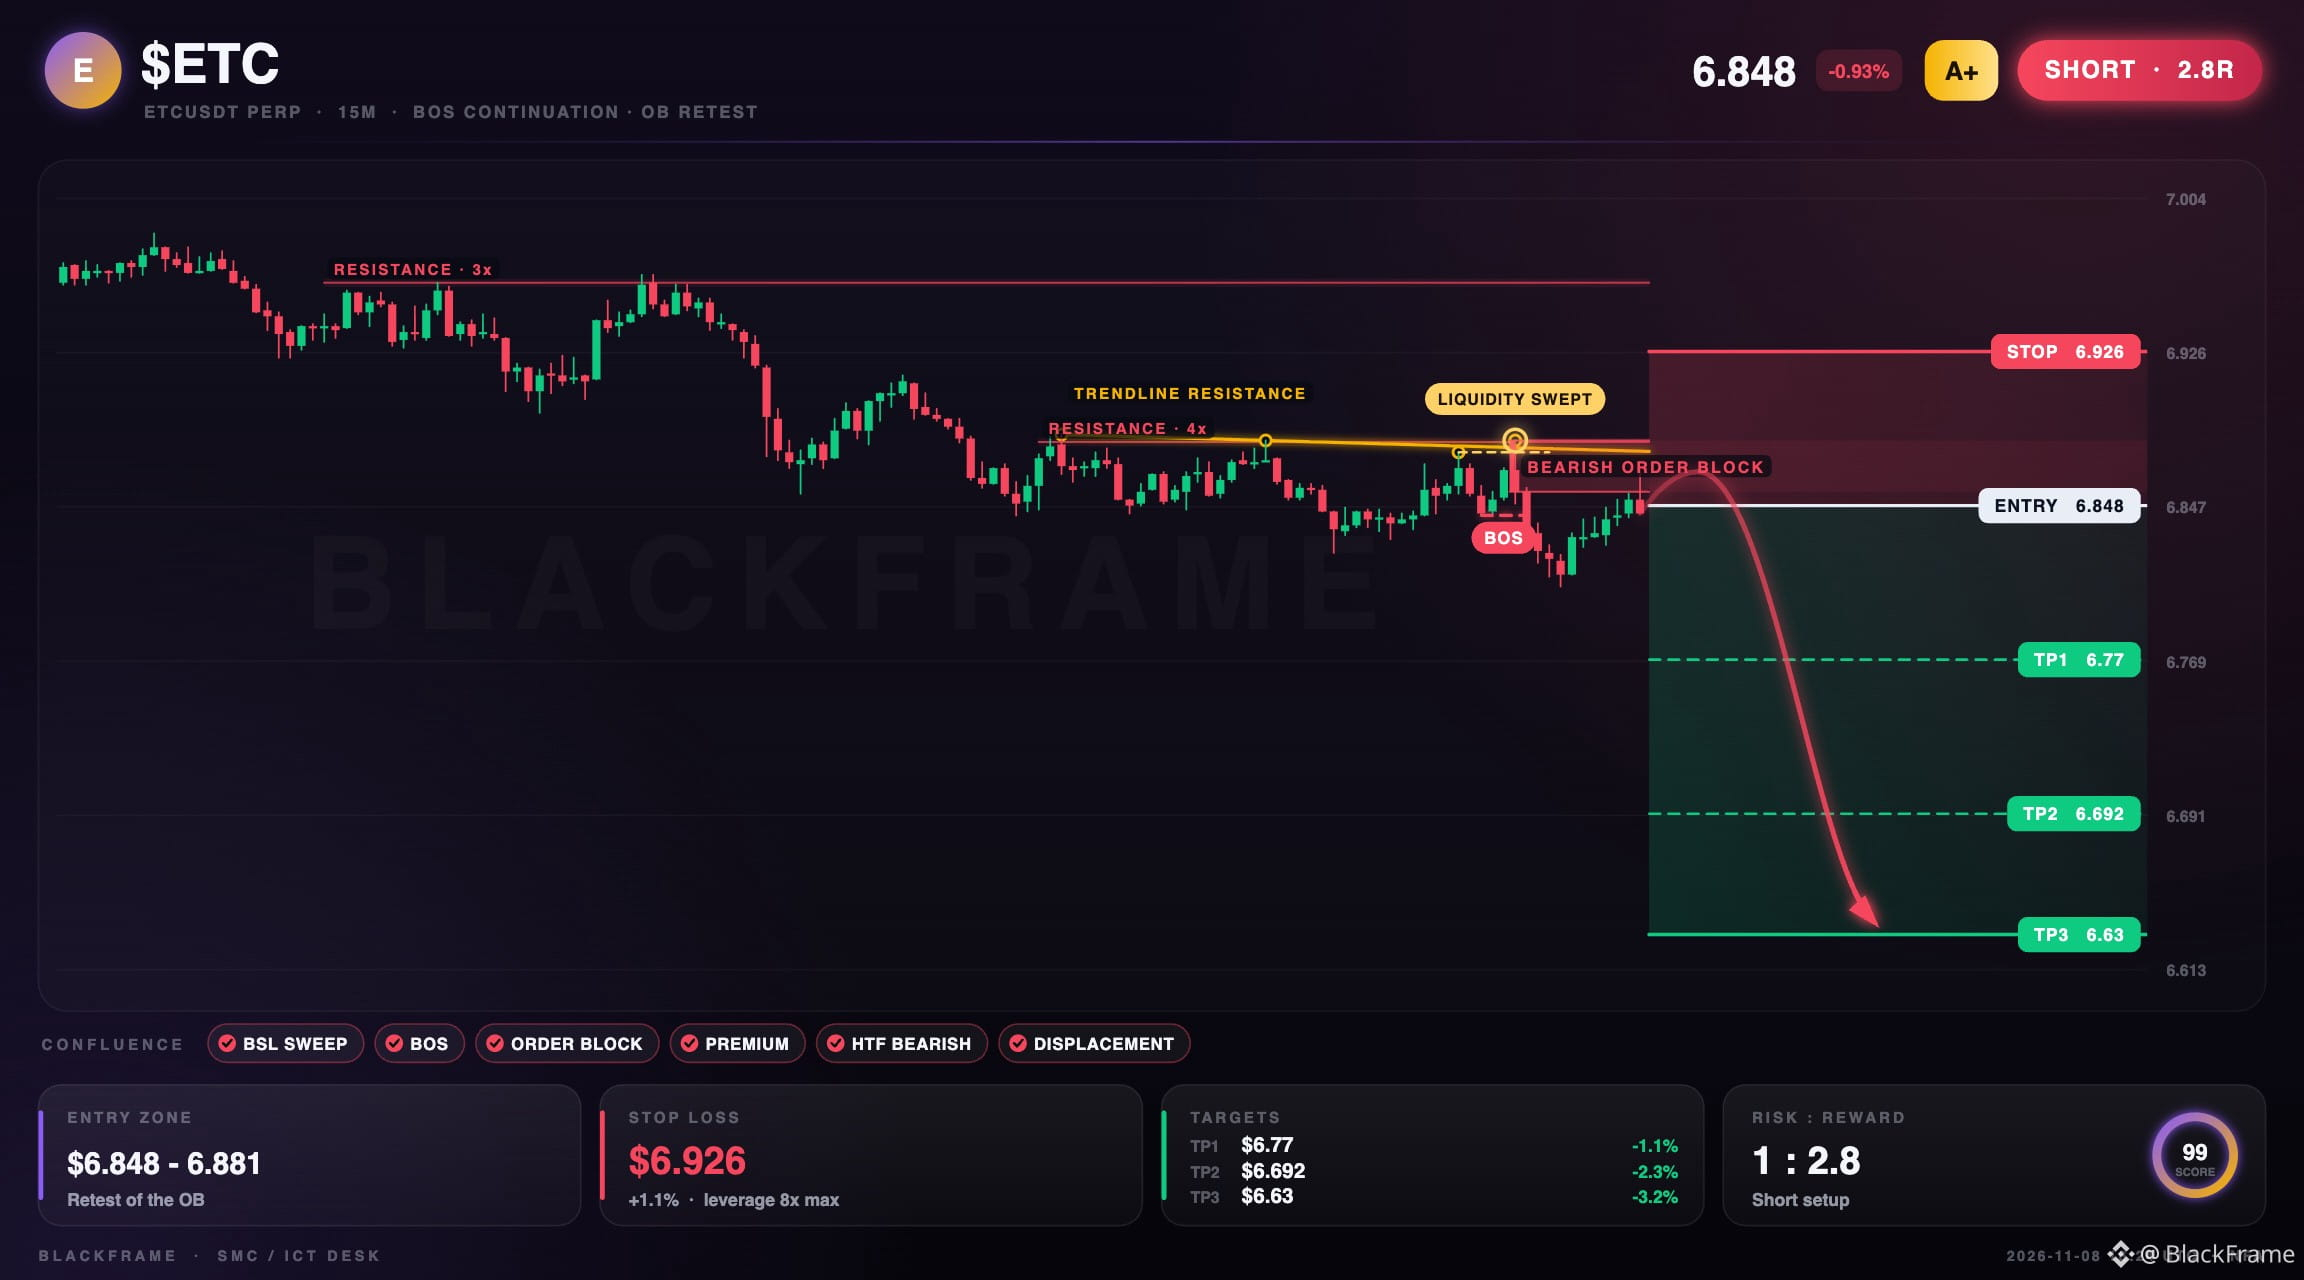
Liquidity swept on the buy side and BOS confirms the downtrend on the 15M. A fresh bearish order block retested, price selling from premium aligns with HTF bias. Target is $6.63; stop above the order block at $6.926.
#ETC #SMC · NFA
⛔ $ETC clears buy-side sweep, bearish bias
SHORT · 15M
Entry: $6.848 - $6.855
TP1: $6.77
TP2: $6.692
TP3: $6.63
SL: $6.926
Liquidity swept on the buy side and BOS confirms the downtrend on the 15M. A fresh bearish order block retested, price selling from premium aligns with HTF bias. Target is $6.63; stop above the order block at $6.926.
#ETC #SMC · NFA
SHORT · 15M
Entry: $6.848 - $6.855
TP1: $6.77
TP2: $6.692
TP3: $6.63
SL: $6.926
Liquidity swept on the buy side and BOS confirms the downtrend on the 15M. A fresh bearish order block retested, price selling from premium aligns with HTF bias. Target is $6.63; stop above the order block at $6.926.
#ETC #SMC · NFA
11

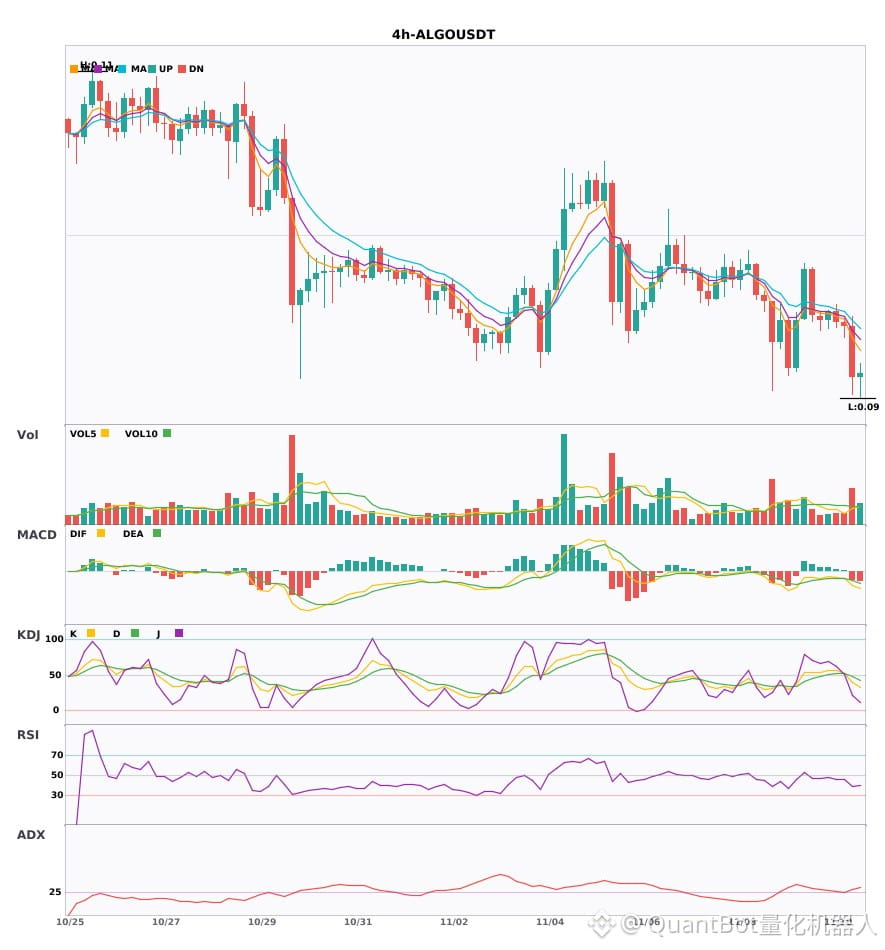
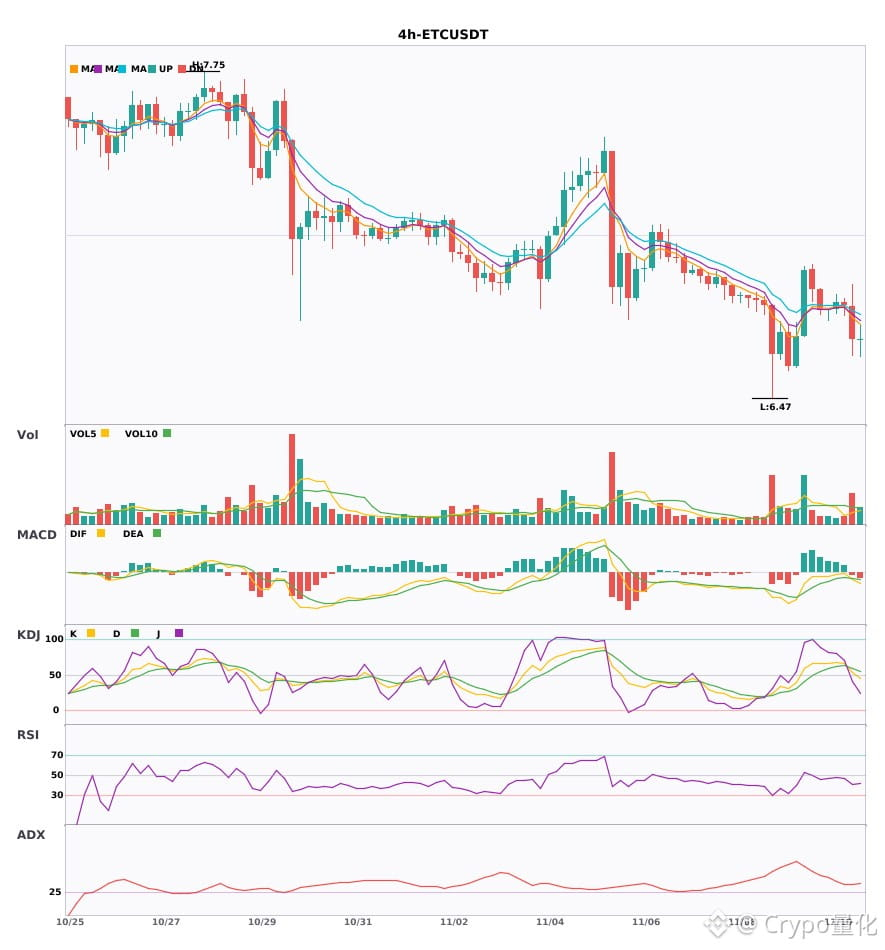
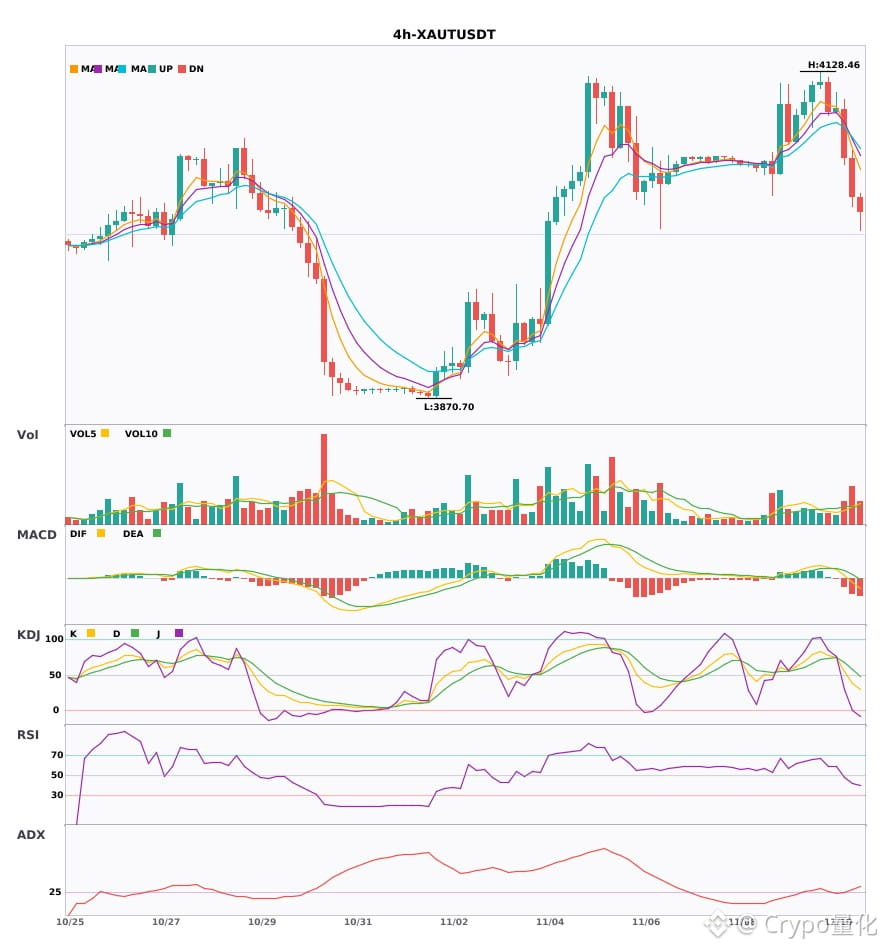
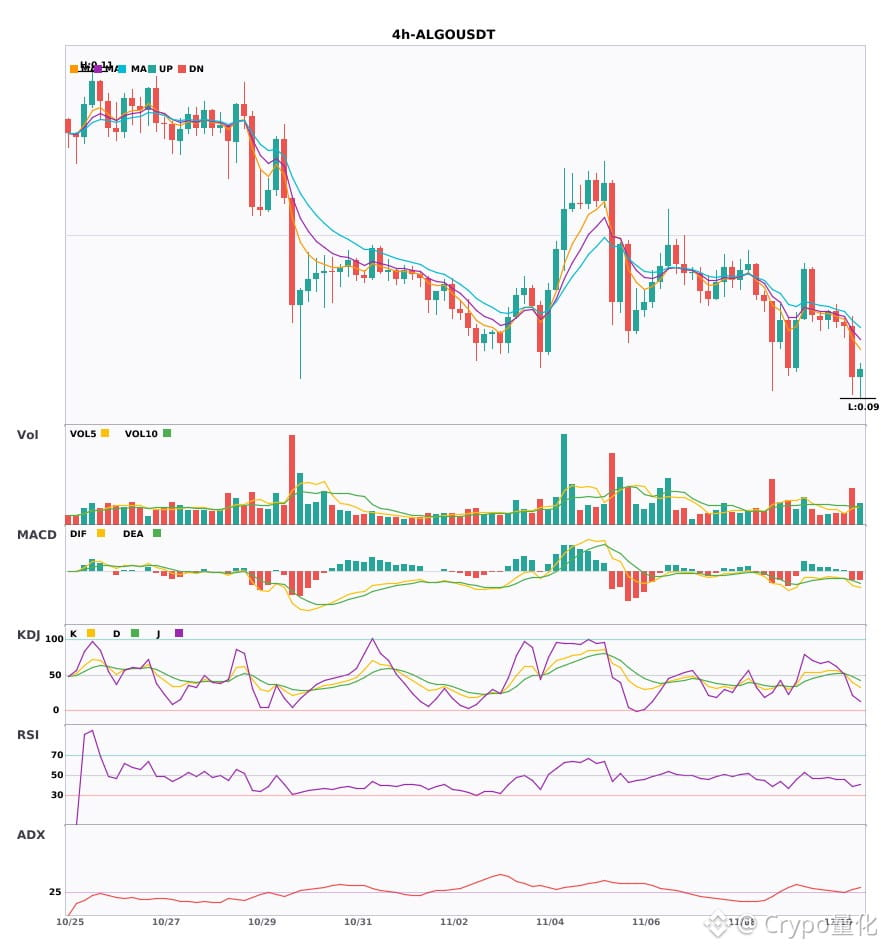
$ETC / $XAUT / $ALGO 4-hour confluence turns bearish, with bearish signals appearing simultaneously
📉 $ETC | 4-hour bearish signal
━━━━━━━━━━━━━━━━━━
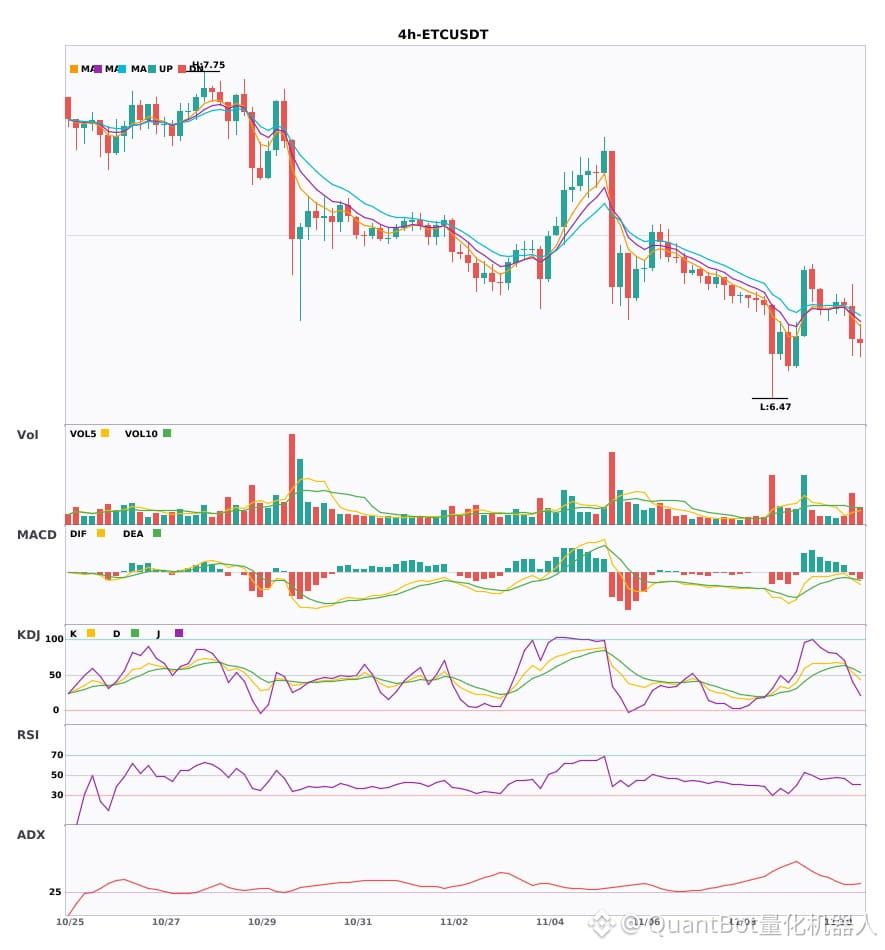
Technical analysis: ADX(32) indicates a clear trend | MACD bearish crossover below zero, bearish momentum accelerating | EMA5 crossed below EMA8, short-term trend turns bearish | KDJ bearish crossover, bearish short-term outlook (K is 53.2, D is 59.7) | Volume increased (1.8x)
Price change: -1.9500%
📉 $XAUT | 4-hour bearish signal
━━━━━━━━━━━━━━━━━━
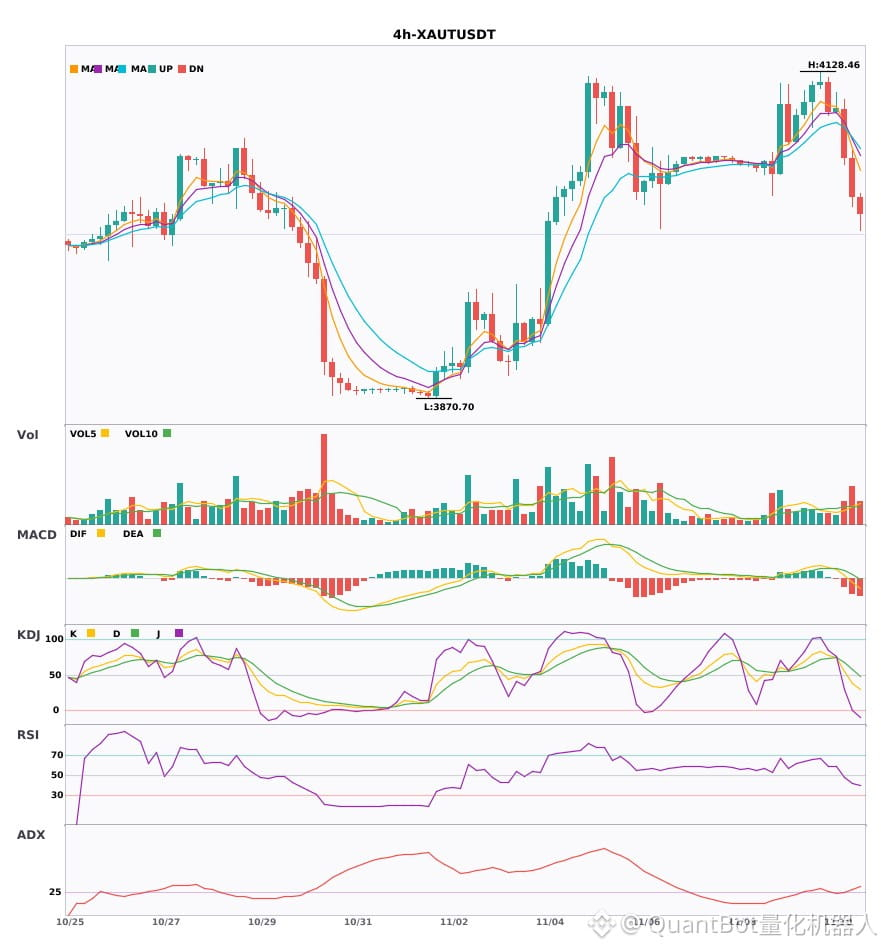
Technical analysis: ADX(31) indicates a clear trend | MACD DIF fell below the zero line, trend turns bearish | EMA5 < EMA8 < EMA13, bearish alignment | Volume increased (2.0x)
Price change: -0.7500%
📉 $ALGO | 4-hour bearish signal
━━━━━━━━━━━━━━━━━━
Technical analysis: ADX(29) indicates a trend is forming and may be traded | MACD bearish crossover below zero, bearish momentum accelerating | EMA5 < EMA8 < EMA13, bearish alignment | KDJ is trending weakly, with bears in control (K is 38.8, D is 47.7) | Volume increased (2.0x)
Price change: -3.2100%
━━━━━━━━━━━━━━━━━━
#技术分析 #ETC #XAUT #ALGO
📌 The above content is for reference only and does not constitute investment advice
$ETC / $XAUT / $ALGO 4-hour confluence turns bearish, with bearish signals appearing simultaneously
📉 $ETC | 4-hour bearish signal
━━━━━━━━━━━━━━━━━━
Technical analysis: ADX(32) indicates a clear trend | MACD bearish crossover below zero, bearish momentum accelerating | EMA5 crossed below EMA8, short-term trend turns bearish | KDJ bearish crossover, bearish short-term outlook (K is 53.2, D is 59.7) | Volume increased (1.8x)
Price change: -1.9500%
📉 $XAUT | 4-hour bearish signal
━━━━━━━━━━━━━━━━━━
Technical analysis: ADX(31) indicates a clear trend | MACD DIF fell below the zero line, trend turns bearish | EMA5 < EMA8 < EMA13, bearish alignment | Volume increased (2.0x)
Price change: -0.7500%
📉 $ALGO | 4-hour bearish signal
━━━━━━━━━━━━━━━━━━
Technical analysis: ADX(29) indicates a trend is forming and may be traded | MACD bearish crossover below zero, bearish momentum accelerating | EMA5 < EMA8 < EMA13, bearish alignment | KDJ is trending weakly, with bears in control (K is 38.8, D is 47.7) | Volume increased (2.0x)
Price change: -3.2100%
━━━━━━━━━━━━━━━━━━
#技术分析 #ETC #XAUT #ALGO
📌 The above content is for reference only and does not constitute investment advice
📉 $ETC | 4-hour bearish signal
━━━━━━━━━━━━━━━━━━
Technical analysis: ADX(32) indicates a clear trend | MACD bearish crossover below zero, bearish momentum accelerating | EMA5 crossed below EMA8, short-term trend turns bearish | KDJ bearish crossover, bearish short-term outlook (K is 53.2, D is 59.7) | Volume increased (1.8x)
Price change: -1.9500%
📉 $XAUT | 4-hour bearish signal
━━━━━━━━━━━━━━━━━━
Technical analysis: ADX(31) indicates a clear trend | MACD DIF fell below the zero line, trend turns bearish | EMA5 < EMA8 < EMA13, bearish alignment | Volume increased (2.0x)
Price change: -0.7500%
📉 $ALGO | 4-hour bearish signal
━━━━━━━━━━━━━━━━━━
Technical analysis: ADX(29) indicates a trend is forming and may be traded | MACD bearish crossover below zero, bearish momentum accelerating | EMA5 < EMA8 < EMA13, bearish alignment | KDJ is trending weakly, with bears in control (K is 38.8, D is 47.7) | Volume increased (2.0x)
Price change: -3.2100%
━━━━━━━━━━━━━━━━━━
#技术分析 #ETC #XAUT #ALGO
📌 The above content is for reference only and does not constitute investment advice
5

·
--
$ETC / $XAUT / $ALGO 4-hour outlook is bearish, under short-term pressure 🔥
════════════════════
🟢 $ETC 4-hour bearish signal
⚠️Technical analysis: ADX(32) indicates a clear trending market | MACD bearish crossover below zero, bearish momentum accelerating | EMA5 crosses below EMA8, short-term outlook turns bearish | KDJ bearish crossover, bearish short-term outlook (K: 53.2, D: 59.7) | Volume increases (1.8x)
════════════════════
🟢 $XAUT 4-hour bearish signal
⚠️Technical analysis: ADX(31) indicates a clear trending market | MACD DIF falls below zero, trend turns bearish | EMA5 < EMA8 < EMA13, bearish alignment | Volume increases (2.0x)
════════════════════
🟢 $ALGO 4-hour bearish signal
⚠️Technical analysis: ADX(29) indicates a trend is forming; an opportunity to participate | MACD bearish crossover below zero, bearish momentum accelerating | EMA5 < EMA8 < EMA13, bearish alignment | KDJ is moving weakly, bears have the upper hand (K: 38.8, D: 47.7) | Volume increases (2.0x)
════════════════════
🔔 Follow for first-hand updates on market movements 🔔
#技术分析 #ETC #XAUT #ALGO
📌 When trading, watch whether the candlestick pattern confirms the signal
$ETC / $XAUT / $ALGO 4-hour outlook is bearish, under short-term pressure 🔥
════════════════════
🟢 $ETC 4-hour bearish signal
⚠️Technical analysis: ADX(32) indicates a clear trending market | MACD bearish crossover below zero, bearish momentum accelerating | EMA5 crosses below EMA8, short-term outlook turns bearish | KDJ bearish crossover, bearish short-term outlook (K: 53.2, D: 59.7) | Volume increases (1.8x)
════════════════════
🟢 $XAUT 4-hour bearish signal
⚠️Technical analysis: ADX(31) indicates a clear trending market | MACD DIF falls below zero, trend turns bearish | EMA5 < EMA8 < EMA13, bearish alignment | Volume increases (2.0x)
════════════════════
🟢 $ALGO 4-hour bearish signal
⚠️Technical analysis: ADX(29) indicates a trend is forming; an opportunity to participate | MACD bearish crossover below zero, bearish momentum accelerating | EMA5 < EMA8 < EMA13, bearish alignment | KDJ is moving weakly, bears have the upper hand (K: 38.8, D: 47.7) | Volume increases (2.0x)
════════════════════
🔔 Follow for first-hand updates on market movements 🔔
#技术分析 #ETC #XAUT #ALGO
📌 When trading, watch whether the candlestick pattern confirms the signal
════════════════════
🟢 $ETC 4-hour bearish signal
⚠️Technical analysis: ADX(32) indicates a clear trending market | MACD bearish crossover below zero, bearish momentum accelerating | EMA5 crosses below EMA8, short-term outlook turns bearish | KDJ bearish crossover, bearish short-term outlook (K: 53.2, D: 59.7) | Volume increases (1.8x)
════════════════════
🟢 $XAUT 4-hour bearish signal
⚠️Technical analysis: ADX(31) indicates a clear trending market | MACD DIF falls below zero, trend turns bearish | EMA5 < EMA8 < EMA13, bearish alignment | Volume increases (2.0x)
════════════════════
🟢 $ALGO 4-hour bearish signal
⚠️Technical analysis: ADX(29) indicates a trend is forming; an opportunity to participate | MACD bearish crossover below zero, bearish momentum accelerating | EMA5 < EMA8 < EMA13, bearish alignment | KDJ is moving weakly, bears have the upper hand (K: 38.8, D: 47.7) | Volume increases (2.0x)
════════════════════
🔔 Follow for first-hand updates on market movements 🔔
#技术分析 #ETC #XAUT #ALGO
📌 When trading, watch whether the candlestick pattern confirms the signal
4

·
--
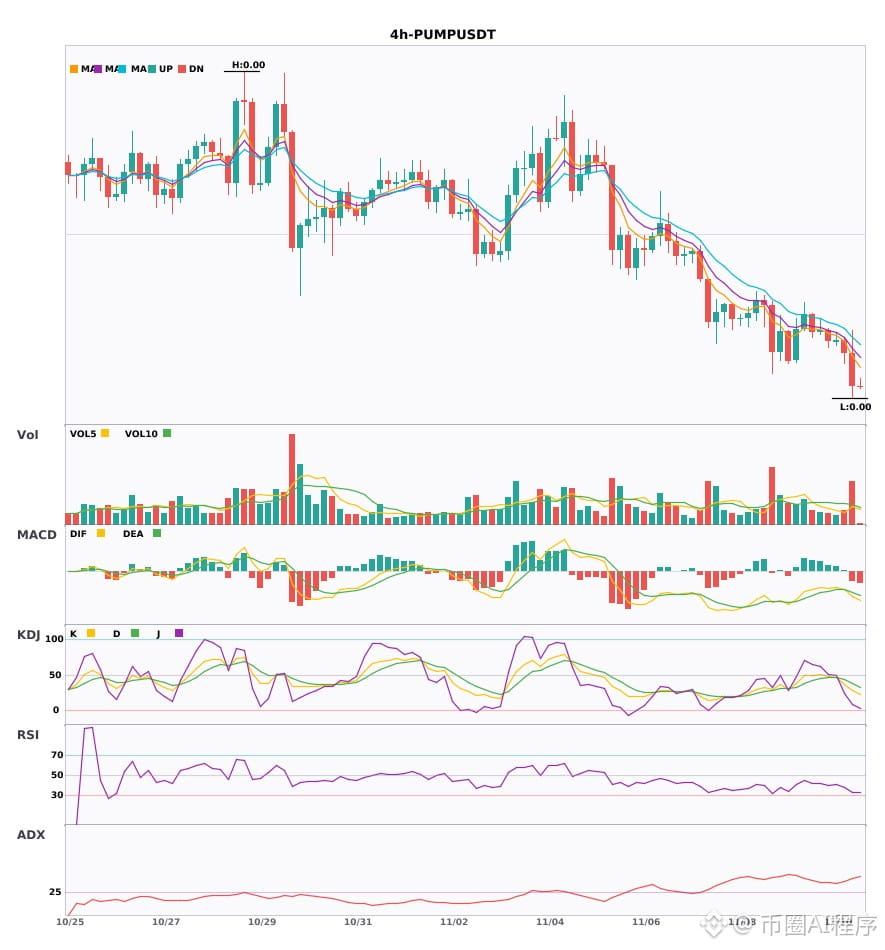
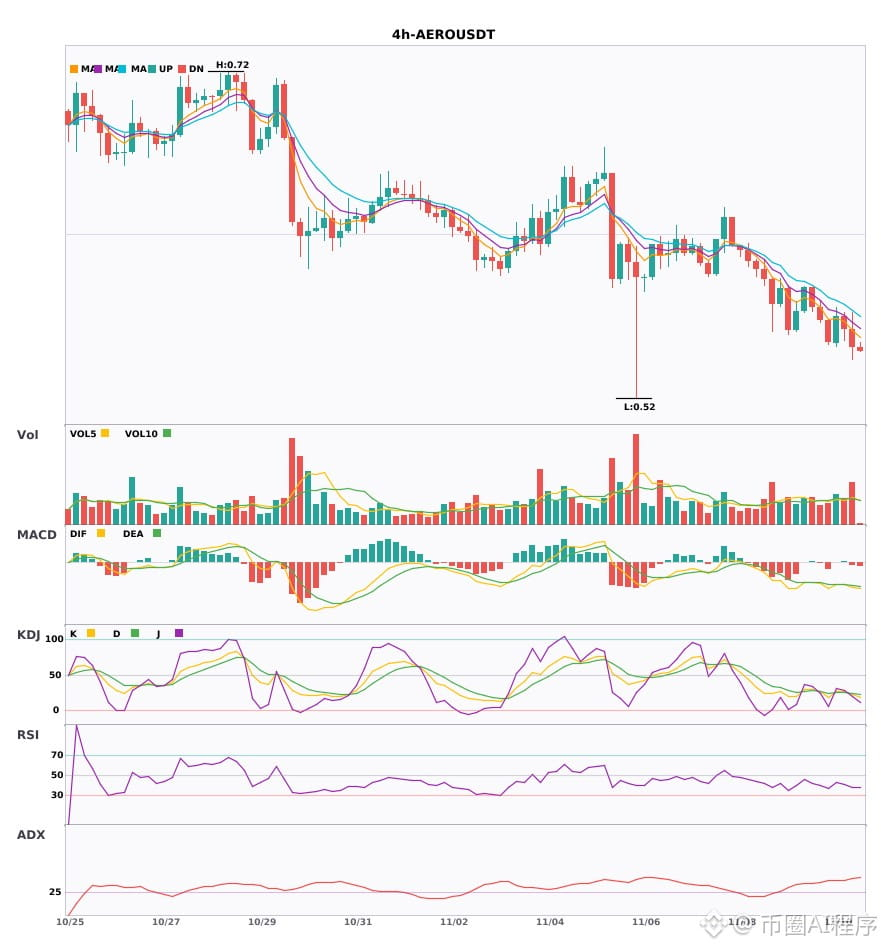
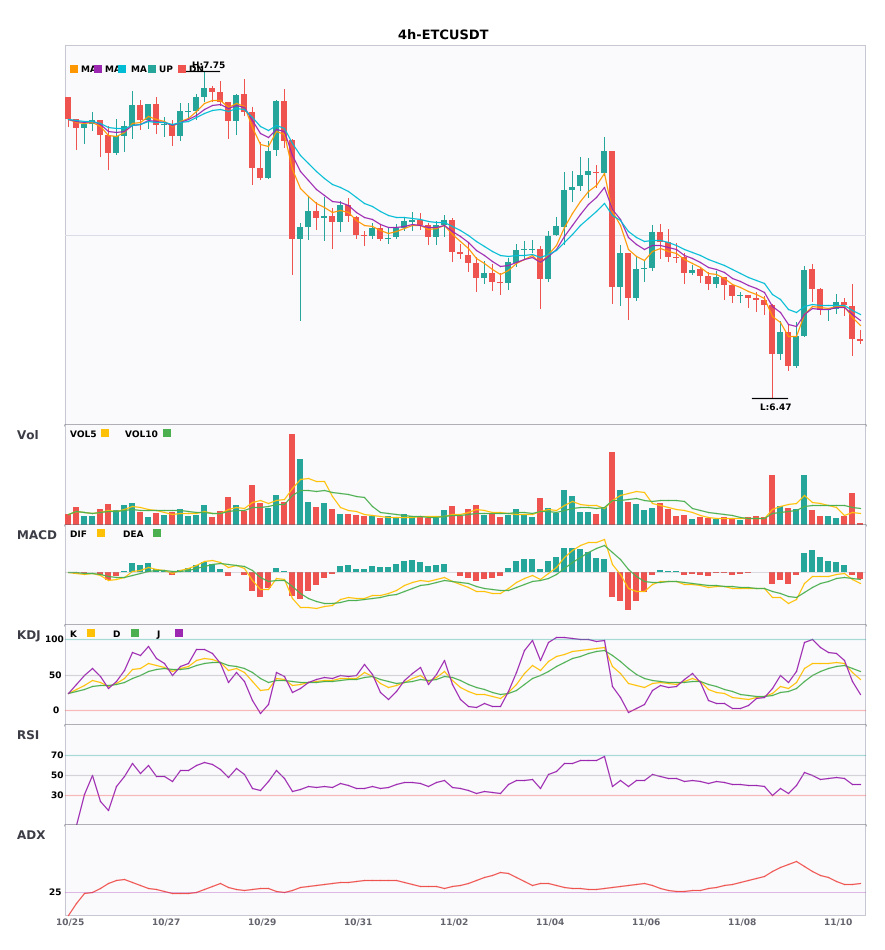
$PUMP / $AERO / $ETC 4-hour bearish + daily bearish alignment, multi-timeframe confluence turns bearish 🔥
════════════════════
🟢 $PUMP 4-hour bearish signal
⚠️Technical analysis: Daily bearish confluence confirmed | 4-hour entry: MACD death cross below zero, bearish momentum accelerating | EMA5 < EMA8 < EMA13, bearish alignment | KDJ weak, bears in control (K: 28.6, D: 38.2) | Volume increased (2.2x)
════════════════════
🟢 $AERO 4-hour bearish signal
⚠️Technical analysis: Daily bearish confluence confirmed | 4-hour entry: MACD death cross below zero, bearish momentum accelerating | EMA5 < EMA8 < EMA13, bearish alignment | KDJ death cross, short-term outlook bearish (K: 22.9, D: 24.7) | Volume increased (1.6x)
📢Market update: Binance Will Support the Velodrome Finance (VELODROME) Token Merge to Aerodrome (AERO) and the AERO Contract Swap
════════════════════
🟢 $ETC 4-hour bearish signal
⚠️Technical analysis: Daily bearish confluence confirmed | 4-hour entry: MACD death cross below zero, bearish momentum accelerating | EMA5 crossed below EMA8, short-term outlook turns bearish | KDJ death cross, short-term outlook bearish (K: 53.2, D: 59.7) | Volume increased (1.8x)
════════════════════
🔔 Follow for the latest market moves 🔔
#多周期共振 #PUMP #AERO #ETC
📌 When trading, watch for confirmation from the candlestick pattern
$PUMP / $AERO / $ETC 4-hour bearish + daily bearish alignment, multi-timeframe confluence turns bearish 🔥
════════════════════
🟢 $PUMP 4-hour bearish signal
⚠️Technical analysis: Daily bearish confluence confirmed | 4-hour entry: MACD death cross below zero, bearish momentum accelerating | EMA5 < EMA8 < EMA13, bearish alignment | KDJ weak, bears in control (K: 28.6, D: 38.2) | Volume increased (2.2x)
════════════════════
🟢 $AERO 4-hour bearish signal
⚠️Technical analysis: Daily bearish confluence confirmed | 4-hour entry: MACD death cross below zero, bearish momentum accelerating | EMA5 < EMA8 < EMA13, bearish alignment | KDJ death cross, short-term outlook bearish (K: 22.9, D: 24.7) | Volume increased (1.6x)
📢Market update: Binance Will Support the Velodrome Finance (VELODROME) Token Merge to Aerodrome (AERO) and the AERO Contract Swap
════════════════════
🟢 $ETC 4-hour bearish signal
⚠️Technical analysis: Daily bearish confluence confirmed | 4-hour entry: MACD death cross below zero, bearish momentum accelerating | EMA5 crossed below EMA8, short-term outlook turns bearish | KDJ death cross, short-term outlook bearish (K: 53.2, D: 59.7) | Volume increased (1.8x)
════════════════════
🔔 Follow for the latest market moves 🔔
#多周期共振 #PUMP #AERO #ETC
📌 When trading, watch for confirmation from the candlestick pattern
════════════════════
🟢 $PUMP 4-hour bearish signal
⚠️Technical analysis: Daily bearish confluence confirmed | 4-hour entry: MACD death cross below zero, bearish momentum accelerating | EMA5 < EMA8 < EMA13, bearish alignment | KDJ weak, bears in control (K: 28.6, D: 38.2) | Volume increased (2.2x)
════════════════════
🟢 $AERO 4-hour bearish signal
⚠️Technical analysis: Daily bearish confluence confirmed | 4-hour entry: MACD death cross below zero, bearish momentum accelerating | EMA5 < EMA8 < EMA13, bearish alignment | KDJ death cross, short-term outlook bearish (K: 22.9, D: 24.7) | Volume increased (1.6x)
📢Market update: Binance Will Support the Velodrome Finance (VELODROME) Token Merge to Aerodrome (AERO) and the AERO Contract Swap
════════════════════
🟢 $ETC 4-hour bearish signal
⚠️Technical analysis: Daily bearish confluence confirmed | 4-hour entry: MACD death cross below zero, bearish momentum accelerating | EMA5 crossed below EMA8, short-term outlook turns bearish | KDJ death cross, short-term outlook bearish (K: 53.2, D: 59.7) | Volume increased (1.8x)
════════════════════
🔔 Follow for the latest market moves 🔔
#多周期共振 #PUMP #AERO #ETC
📌 When trading, watch for confirmation from the candlestick pattern
18

·
--
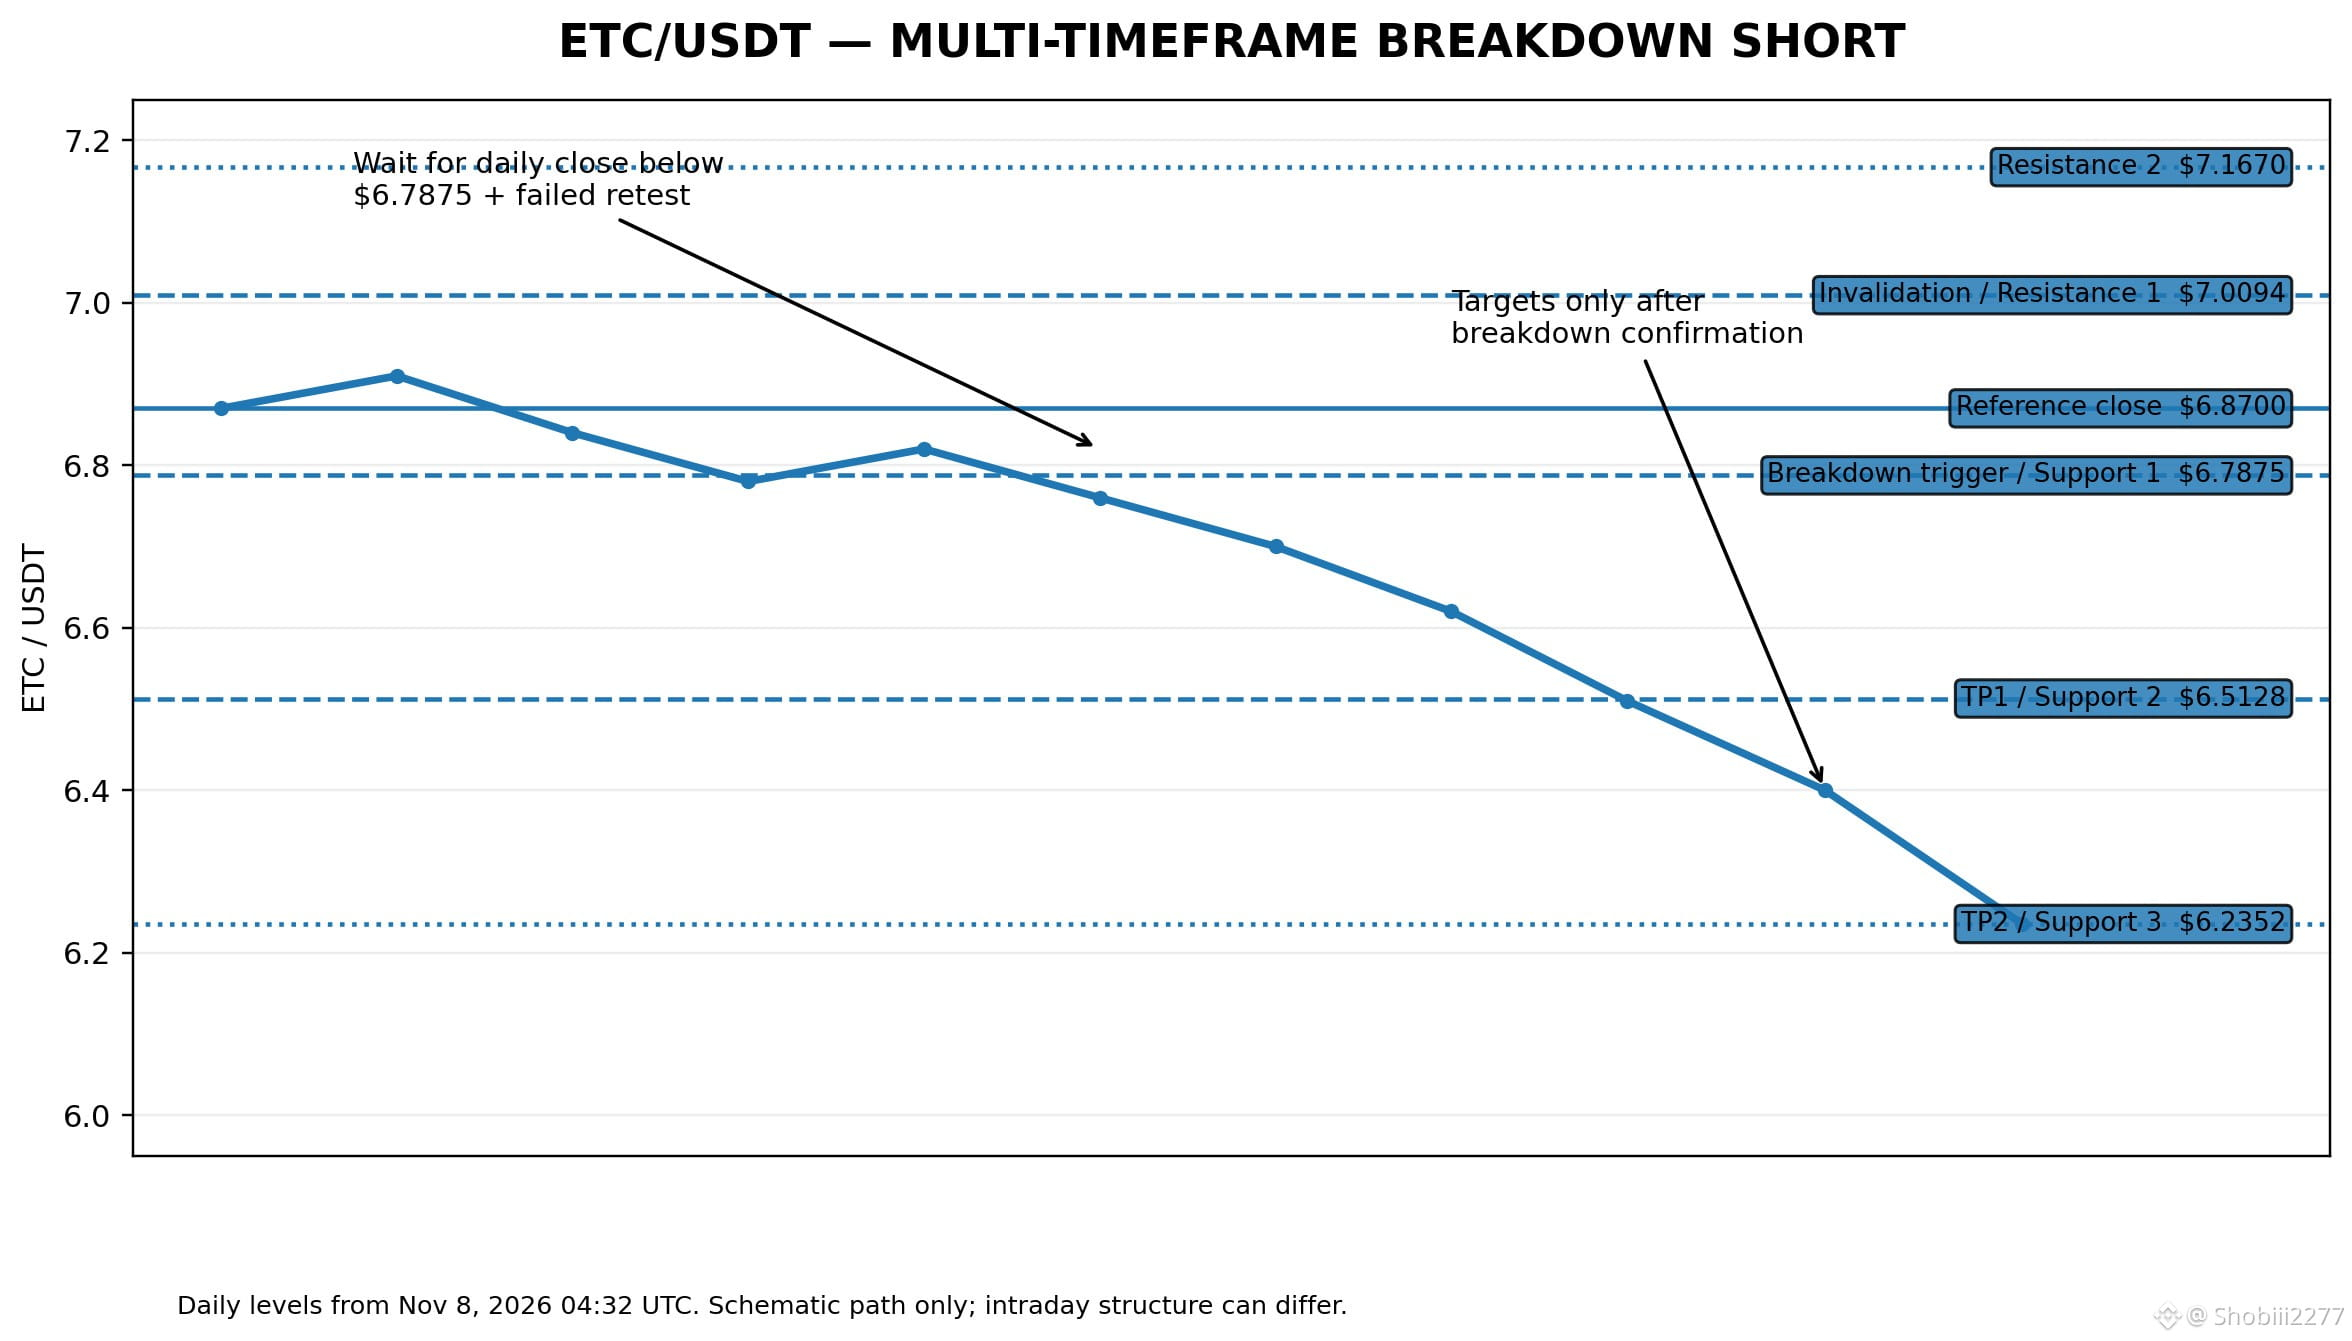
🚨 ETC/USDT — STRONG BEARISH SETUP! 📉🔥
Ethereum Classic is showing bearish alignment across multiple timeframes.
🔴 TRADE DIRECTION: SHORT
📍 ENTRY TRIGGER: Below $6.7875 Retest zone: $6.77–$6.79
🛑 STOP LOSS: $7.0094
🎯 PROFIT TARGETS:
🥇 TP1: $6.5128 🥈 TP2: $6.2352 🥉 Extended: $5.8155
📊 TECHNICAL CONFIRMATION:
✅ Daily RSI: 36.9 ✅ 4H RSI: 40.0 ✅ Weekly RSI: 41.7 ✅ Bearish Supertrend ✅ Price below Ichimoku cloud ✅ Strong bearish multi-timeframe structure
⚡ Strategy: Wait for a confirmed support breakdown and failed retest.
No FOMO. No blind entries. Risk management first.
Are you watching ETC? 👀
Follow for more professional crypto signals and technical analysis!
#ETC #EthereumClassic #cryptosignals #BinanceFutures #TechnicalAnalysis
🚨 ETC/USDT — STRONG BEARISH SETUP! 📉🔥
Ethereum Classic is showing bearish alignment across multiple timeframes.
🔴 TRADE DIRECTION: SHORT
📍 ENTRY TRIGGER: Below $6.7875 Retest zone: $6.77–$6.79
🛑 STOP LOSS: $7.0094
🎯 PROFIT TARGETS:
🥇 TP1: $6.5128 🥈 TP2: $6.2352 🥉 Extended: $5.8155
📊 TECHNICAL CONFIRMATION:
✅ Daily RSI: 36.9 ✅ 4H RSI: 40.0 ✅ Weekly RSI: 41.7 ✅ Bearish Supertrend ✅ Price below Ichimoku cloud ✅ Strong bearish multi-timeframe structure
⚡ Strategy: Wait for a confirmed support breakdown and failed retest.
No FOMO. No blind entries. Risk management first.
Are you watching ETC? 👀
Follow for more professional crypto signals and technical analysis!
#ETC #EthereumClassic #cryptosignals #BinanceFutures #TechnicalAnalysis
Ethereum Classic is showing bearish alignment across multiple timeframes.
🔴 TRADE DIRECTION: SHORT
📍 ENTRY TRIGGER: Below $6.7875 Retest zone: $6.77–$6.79
🛑 STOP LOSS: $7.0094
🎯 PROFIT TARGETS:
🥇 TP1: $6.5128 🥈 TP2: $6.2352 🥉 Extended: $5.8155
📊 TECHNICAL CONFIRMATION:
✅ Daily RSI: 36.9 ✅ 4H RSI: 40.0 ✅ Weekly RSI: 41.7 ✅ Bearish Supertrend ✅ Price below Ichimoku cloud ✅ Strong bearish multi-timeframe structure
⚡ Strategy: Wait for a confirmed support breakdown and failed retest.
No FOMO. No blind entries. Risk management first.
Are you watching ETC? 👀
Follow for more professional crypto signals and technical analysis!
#ETC #EthereumClassic #cryptosignals #BinanceFutures #TechnicalAnalysis
107
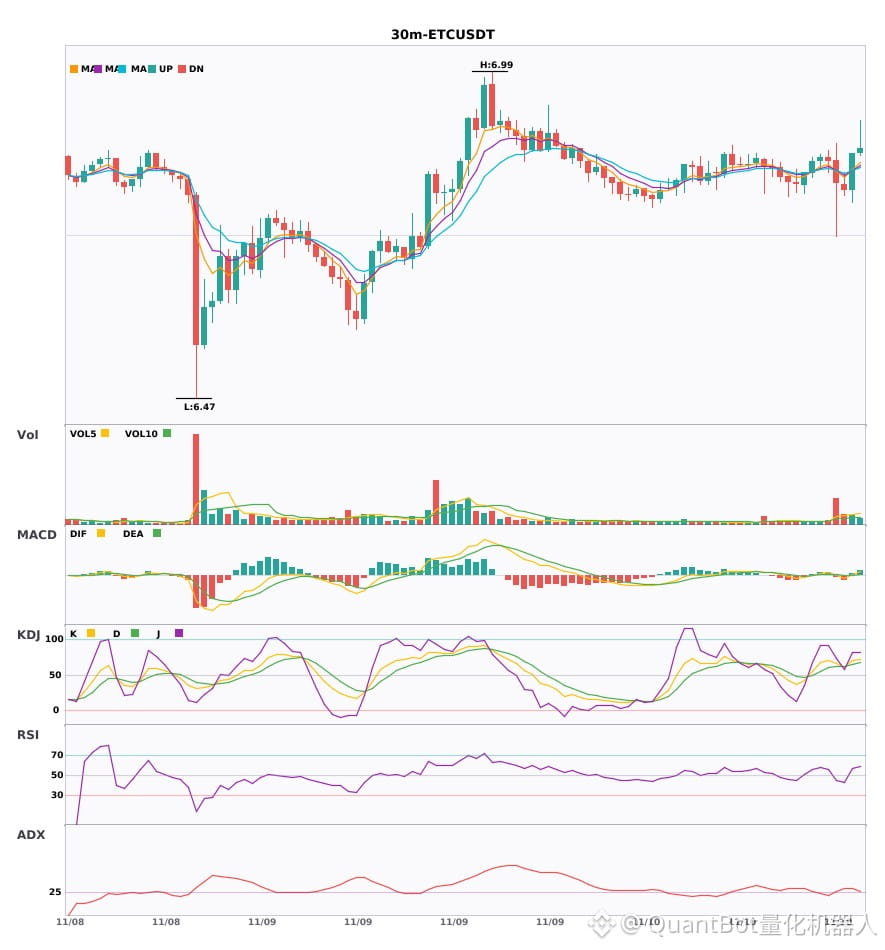
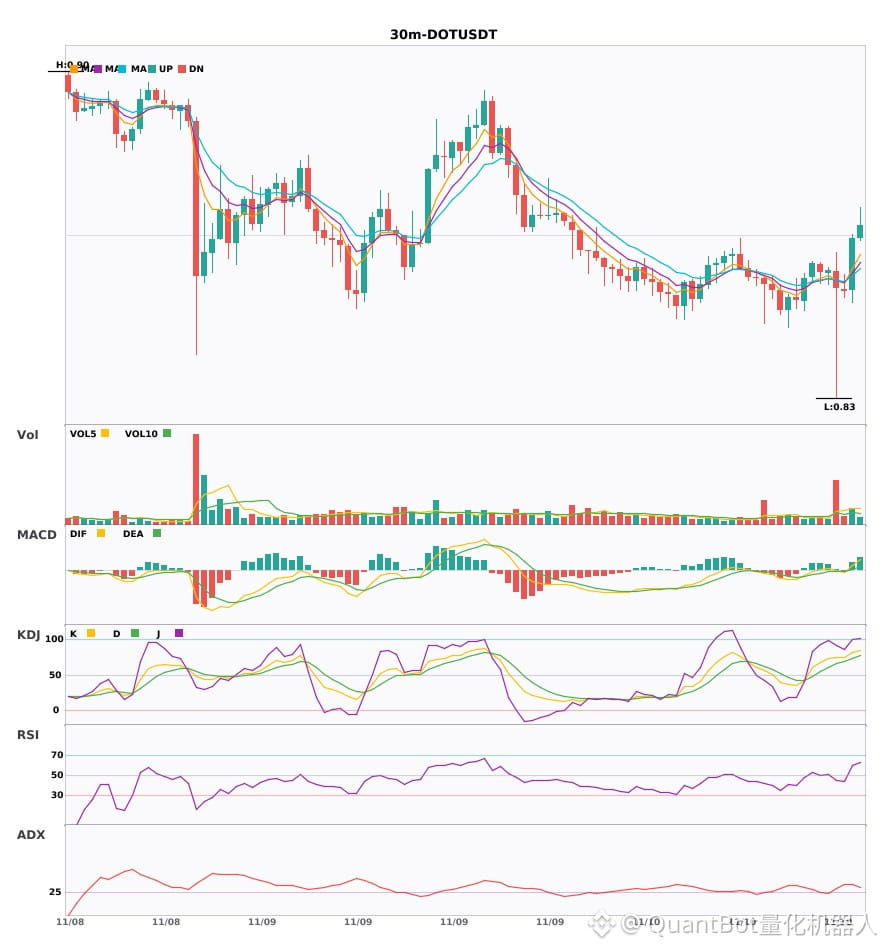
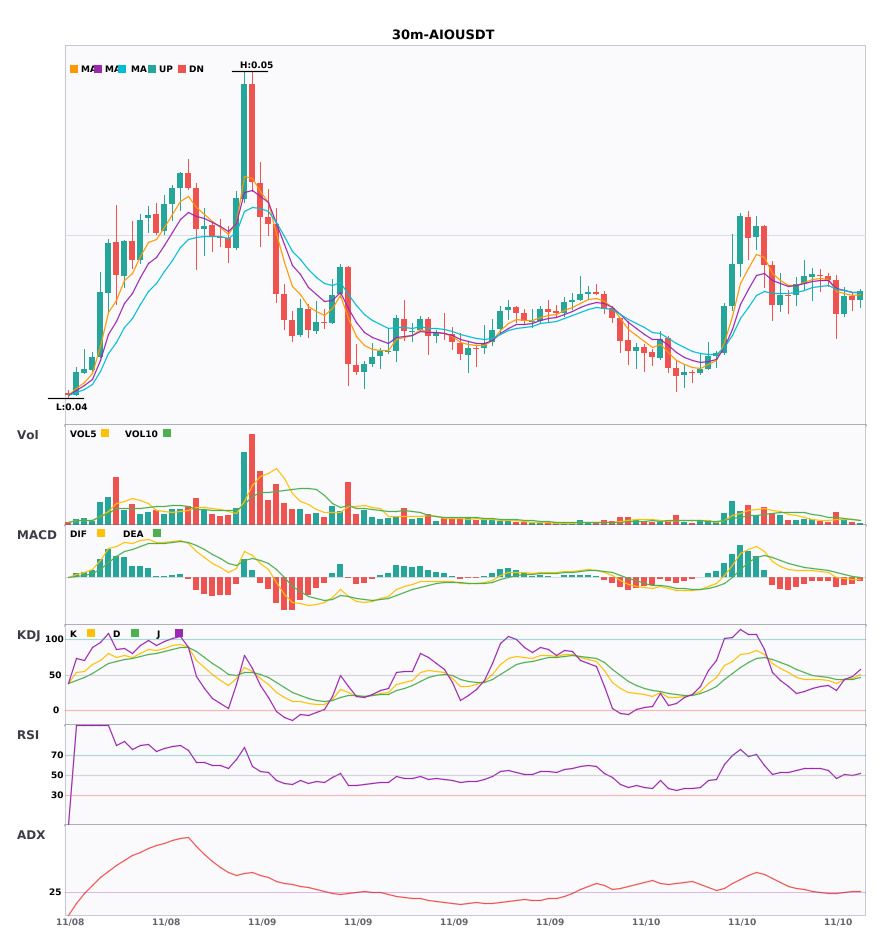
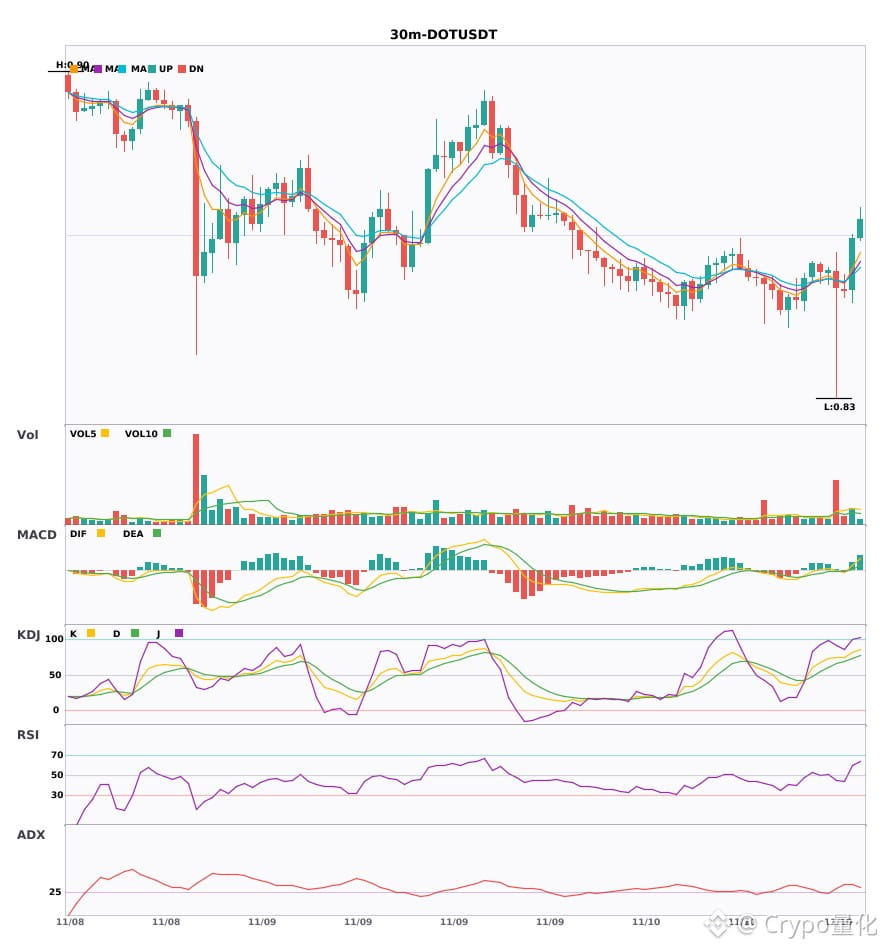
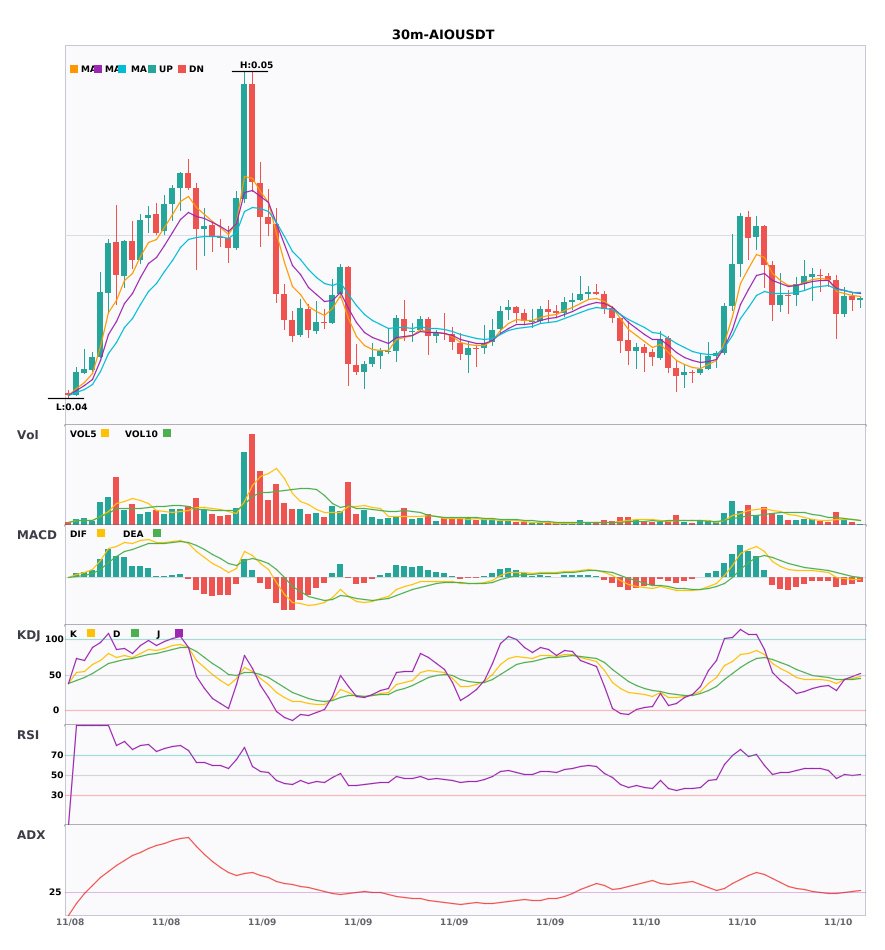
3 30-minute bearish alerts: $ETC / $DOT / $AIO
📉 $ETC | 30-minute bearish signal
━━━━━━━━━━━━━━━━━━
Technical analysis: ADX(33) Clear trending market | MACD bearish, trend weak, momentum strengthening | EMA5 below EMA8 below EMA13, bearish alignment | KDJ death cross, short-term bearish (K is 60.4, D is 61.7) | Volume surge (4.2x)
Price change: -0.1800%
📉 $DOT | 30-minute bearish signal
━━━━━━━━━━━━━━━━━━
Technical analysis: ADX(36) Clear trending market | MACD death cross below zero, bearish momentum accelerating | EMA5 crossed below EMA8, short-term bearish shift | KDJ moving strongly, bulls in control (K is 74.0, D is 68.3) | Volume surge (3.5x)
Price change: -0.0600%
📉 $AIO | 30-minute bearish signal
━━━━━━━━━━━━━━━━━━
Technical analysis: ADX(26) Trend is forming; entry may be considered | MACD DIF fell below the zero line, trend turning bearish | Moving averages converging, poised to choose a direction | KDJ moving weakly, bears in control (K is 43.4, D is 43.5) | Volume increase (1.6x)
Price change: 1.7800%
━━━━━━━━━━━━━━━━━━
#技术分析 #ETC #DOT #AIO
📌 The above content is for reference only and does not constitute investment advice
3 30-minute bearish alerts: $ETC / $DOT / $AIO
📉 $ETC | 30-minute bearish signal
━━━━━━━━━━━━━━━━━━
Technical analysis: ADX(33) Clear trending market | MACD bearish, trend weak, momentum strengthening | EMA5 below EMA8 below EMA13, bearish alignment | KDJ death cross, short-term bearish (K is 60.4, D is 61.7) | Volume surge (4.2x)
Price change: -0.1800%
📉 $DOT | 30-minute bearish signal
━━━━━━━━━━━━━━━━━━
Technical analysis: ADX(36) Clear trending market | MACD death cross below zero, bearish momentum accelerating | EMA5 crossed below EMA8, short-term bearish shift | KDJ moving strongly, bulls in control (K is 74.0, D is 68.3) | Volume surge (3.5x)
Price change: -0.0600%
📉 $AIO | 30-minute bearish signal
━━━━━━━━━━━━━━━━━━
Technical analysis: ADX(26) Trend is forming; entry may be considered | MACD DIF fell below the zero line, trend turning bearish | Moving averages converging, poised to choose a direction | KDJ moving weakly, bears in control (K is 43.4, D is 43.5) | Volume increase (1.6x)
Price change: 1.7800%
━━━━━━━━━━━━━━━━━━
#技术分析 #ETC #DOT #AIO
📌 The above content is for reference only and does not constitute investment advice
📉 $ETC | 30-minute bearish signal
━━━━━━━━━━━━━━━━━━
Technical analysis: ADX(33) Clear trending market | MACD bearish, trend weak, momentum strengthening | EMA5 below EMA8 below EMA13, bearish alignment | KDJ death cross, short-term bearish (K is 60.4, D is 61.7) | Volume surge (4.2x)
Price change: -0.1800%
📉 $DOT | 30-minute bearish signal
━━━━━━━━━━━━━━━━━━
Technical analysis: ADX(36) Clear trending market | MACD death cross below zero, bearish momentum accelerating | EMA5 crossed below EMA8, short-term bearish shift | KDJ moving strongly, bulls in control (K is 74.0, D is 68.3) | Volume surge (3.5x)
Price change: -0.0600%
📉 $AIO | 30-minute bearish signal
━━━━━━━━━━━━━━━━━━
Technical analysis: ADX(26) Trend is forming; entry may be considered | MACD DIF fell below the zero line, trend turning bearish | Moving averages converging, poised to choose a direction | KDJ moving weakly, bears in control (K is 43.4, D is 43.5) | Volume increase (1.6x)
Price change: 1.7800%
━━━━━━━━━━━━━━━━━━
#技术分析 #ETC #DOT #AIO
📌 The above content is for reference only and does not constitute investment advice
14
·
--
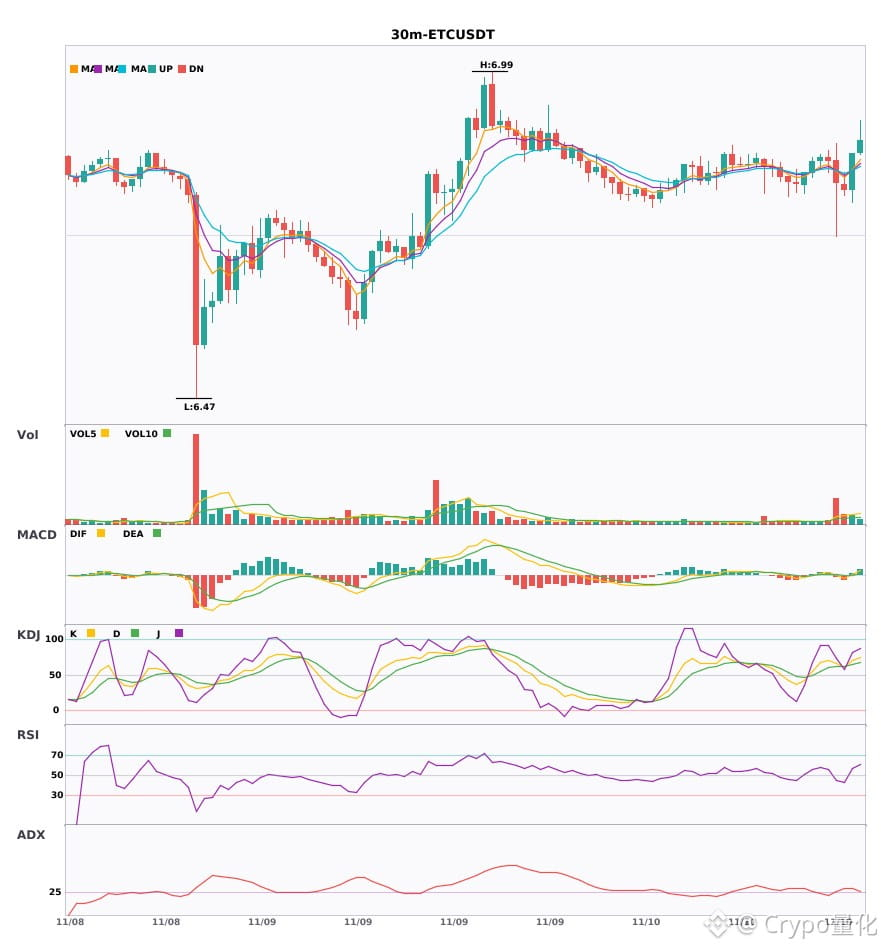
$ETC / $DOT / $AIO 30-minute technical indicators are weakening in tandem. Watch out for risk 🔥
════════════════════
🟢 $ETC 30-minute bearish signal
⚠️Technical: ADX(33) indicates a clear trending market | MACD is bearish; trend is weak, with strengthening momentum | EMA5 < EMA8 < EMA13, bearish alignment | KDJ bearish crossover, short-term outlook is bearish (K: 60.4, D: 61.7) | Volume surge (4.2x)
════════════════════
🟢 $DOT 30-minute bearish signal
⚠️Technical: ADX(36) indicates a clear trending market | MACD bearish crossover below zero, bearish momentum accelerating | EMA5 crossed below EMA8, turning bearish in the short term | KDJ is strong, with bulls in control (K: 74.0, D: 68.3) | Volume surge (3.5x)
════════════════════
🟢 $AIO 30-minute bearish signal
⚠️Technical: ADX(26) indicates a trend is forming; a potential opportunity | MACD DIF has fallen below zero, turning the trend bearish | Moving averages are converging and building momentum; a directional move is imminent | KDJ is weak, with bears in control (K: 43.4, D: 43.5) | Volume increase (1.6x)
════════════════════
🔔 Follow for first-hand market movement alerts 🔔
#技术分析 #ETC #DOT #AIO
📌 When trading, check whether the candlestick pattern confirms the signal
$ETC / $DOT / $AIO 30-minute technical indicators are weakening in tandem. Watch out for risk 🔥
════════════════════
🟢 $ETC 30-minute bearish signal
⚠️Technical: ADX(33) indicates a clear trending market | MACD is bearish; trend is weak, with strengthening momentum | EMA5 < EMA8 < EMA13, bearish alignment | KDJ bearish crossover, short-term outlook is bearish (K: 60.4, D: 61.7) | Volume surge (4.2x)
════════════════════
🟢 $DOT 30-minute bearish signal
⚠️Technical: ADX(36) indicates a clear trending market | MACD bearish crossover below zero, bearish momentum accelerating | EMA5 crossed below EMA8, turning bearish in the short term | KDJ is strong, with bulls in control (K: 74.0, D: 68.3) | Volume surge (3.5x)
════════════════════
🟢 $AIO 30-minute bearish signal
⚠️Technical: ADX(26) indicates a trend is forming; a potential opportunity | MACD DIF has fallen below zero, turning the trend bearish | Moving averages are converging and building momentum; a directional move is imminent | KDJ is weak, with bears in control (K: 43.4, D: 43.5) | Volume increase (1.6x)
════════════════════
🔔 Follow for first-hand market movement alerts 🔔
#技术分析 #ETC #DOT #AIO
📌 When trading, check whether the candlestick pattern confirms the signal
════════════════════
🟢 $ETC 30-minute bearish signal
⚠️Technical: ADX(33) indicates a clear trending market | MACD is bearish; trend is weak, with strengthening momentum | EMA5 < EMA8 < EMA13, bearish alignment | KDJ bearish crossover, short-term outlook is bearish (K: 60.4, D: 61.7) | Volume surge (4.2x)
════════════════════
🟢 $DOT 30-minute bearish signal
⚠️Technical: ADX(36) indicates a clear trending market | MACD bearish crossover below zero, bearish momentum accelerating | EMA5 crossed below EMA8, turning bearish in the short term | KDJ is strong, with bulls in control (K: 74.0, D: 68.3) | Volume surge (3.5x)
════════════════════
🟢 $AIO 30-minute bearish signal
⚠️Technical: ADX(26) indicates a trend is forming; a potential opportunity | MACD DIF has fallen below zero, turning the trend bearish | Moving averages are converging and building momentum; a directional move is imminent | KDJ is weak, with bears in control (K: 43.4, D: 43.5) | Volume increase (1.6x)
════════════════════
🔔 Follow for first-hand market movement alerts 🔔
#技术分析 #ETC #DOT #AIO
📌 When trading, check whether the candlestick pattern confirms the signal
10
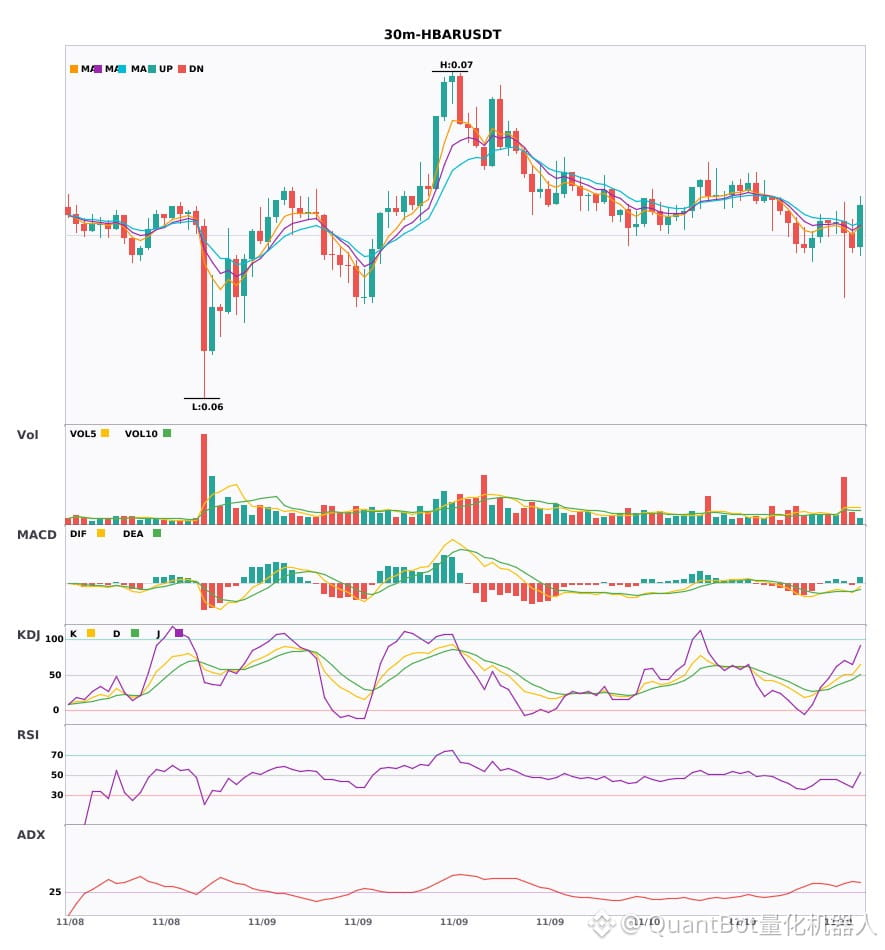
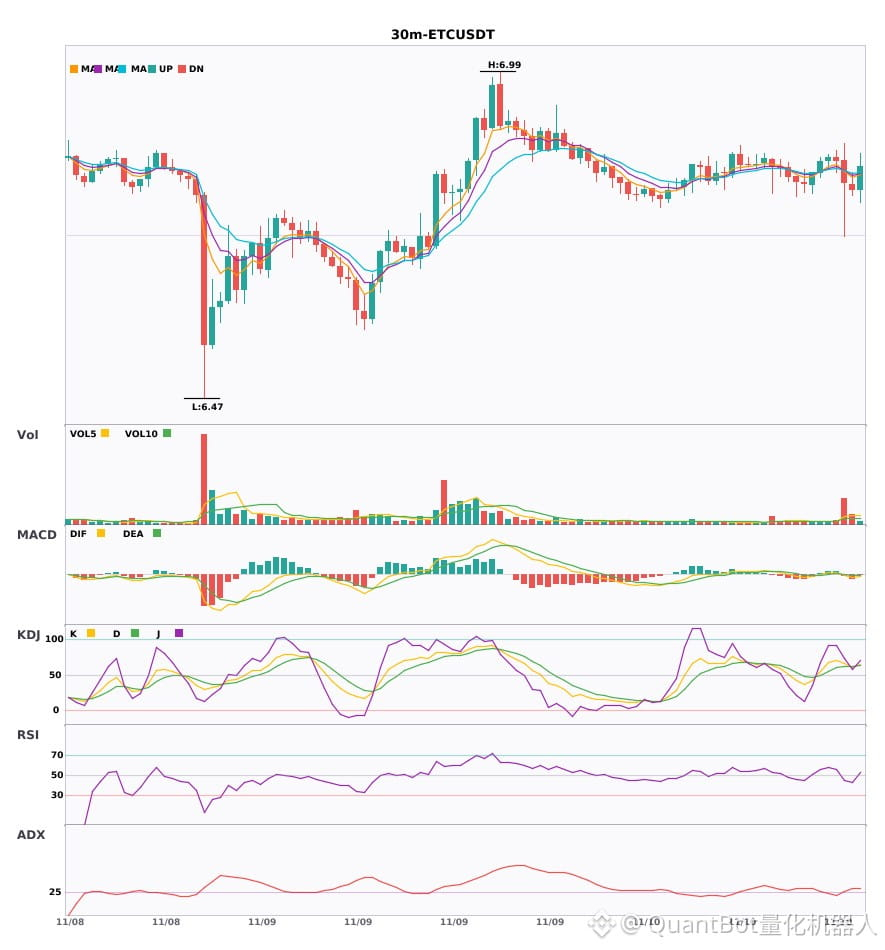
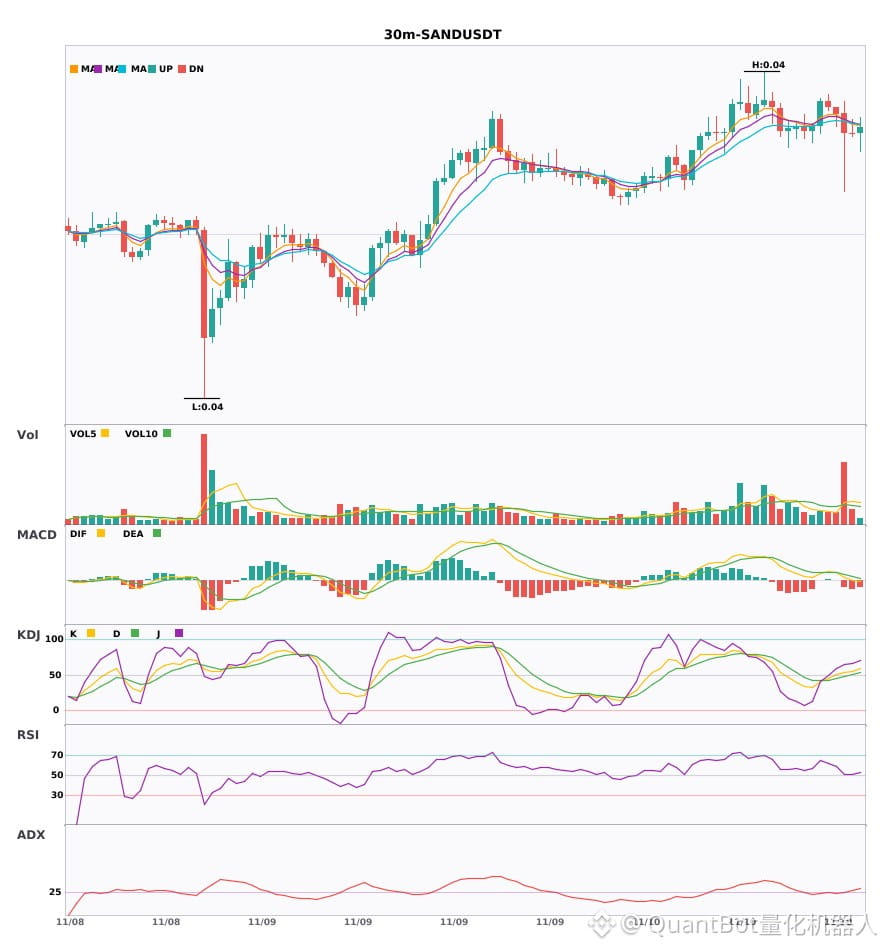
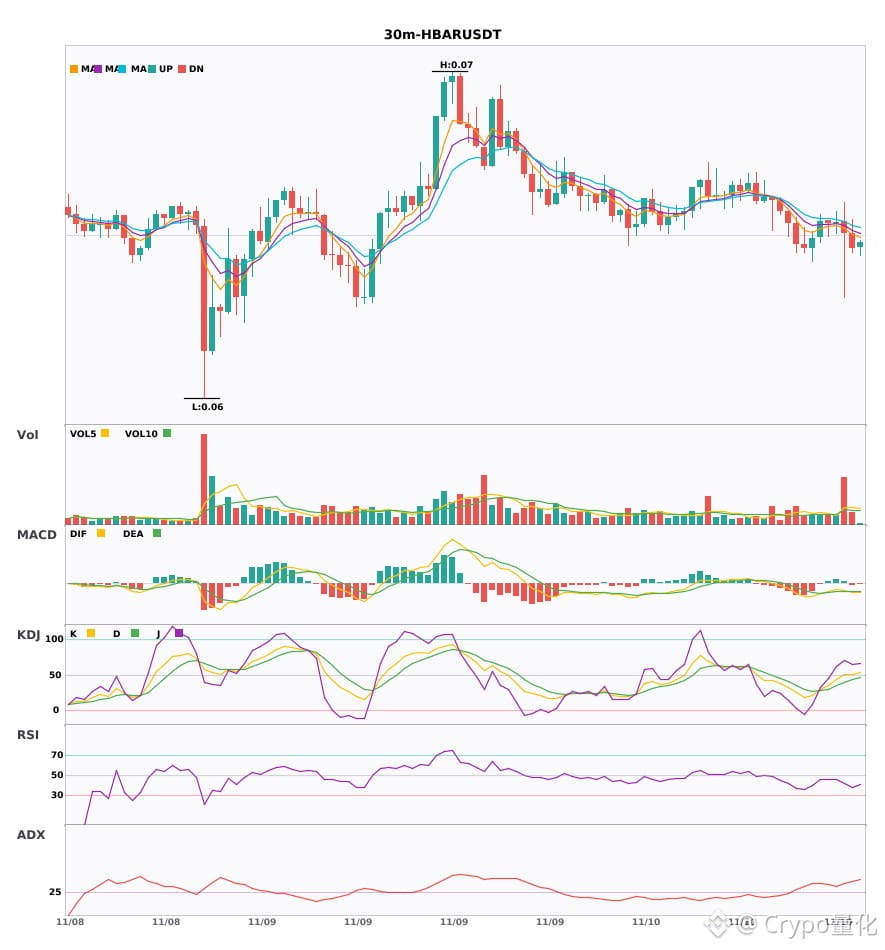
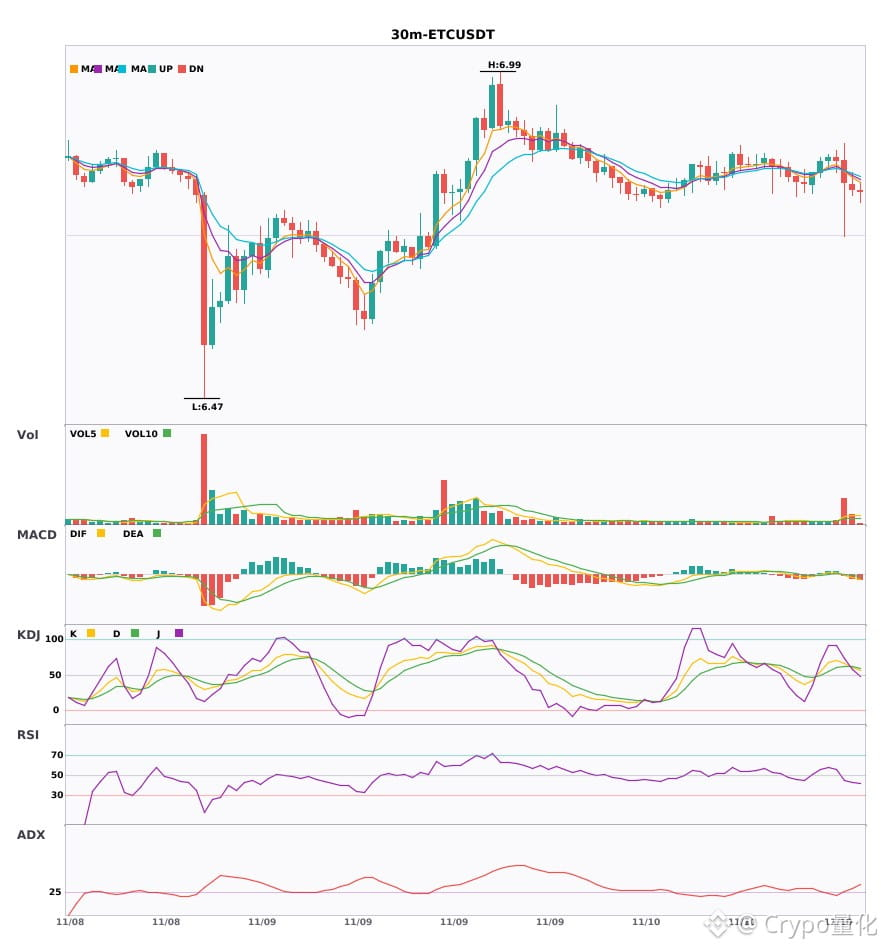
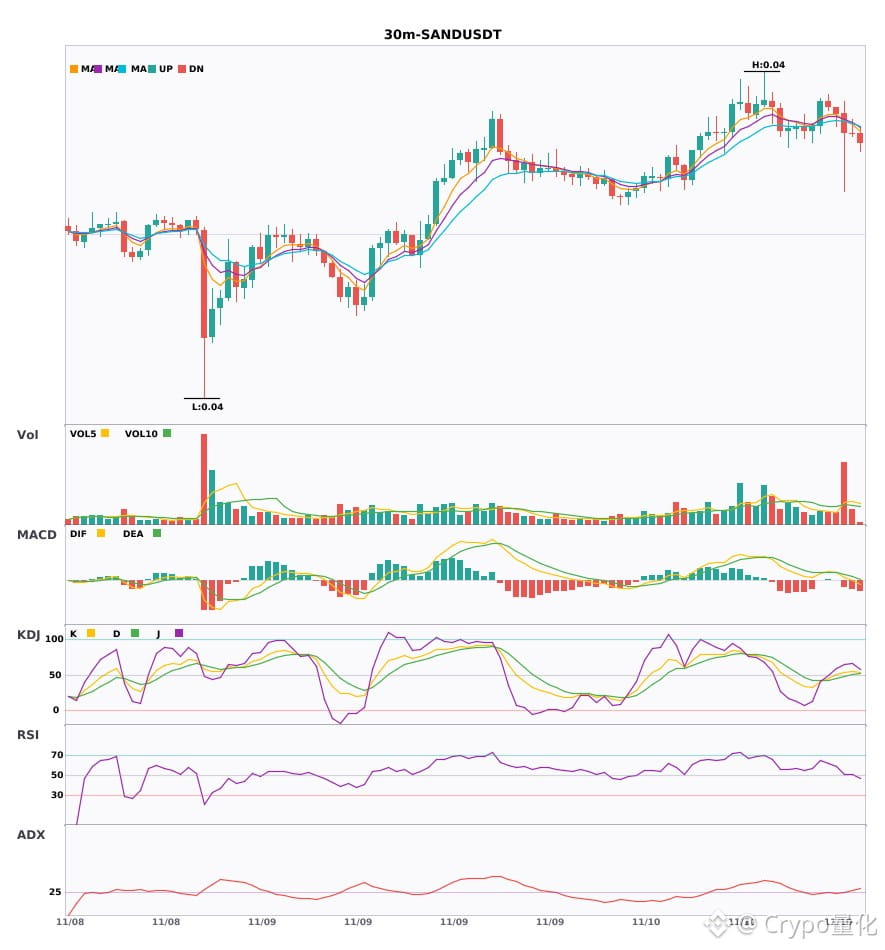
3 30-minute bearish alerts: $HBAR / $ETC / $SAND
📉 $HBAR | 30-minute bearish signal
━━━━━━━━━━━━━━━━━━
Technical analysis: ADX(41) clear trending market | MACD bearish crossover below zero, bearish momentum accelerating | EMA5 < EMA8 < EMA13, bearish alignment | Volume surge (3.2x)
Price change: -0.3200%
📉 $ETC | 30-minute bearish signal
━━━━━━━━━━━━━━━━━━
Technical analysis: ADX(33) clear trending market | MACD bearish, trend is weak, momentum strengthening | EMA5 < EMA8 < EMA13, bearish alignment | KDJ bearish crossover, short-term outlook is bearish (K: 60.4, D: 61.7) | Volume surge (4.2x)
Price change: -0.1800%
📉 $SAND | 30-minute bearish signal
━━━━━━━━━━━━━━━━━━
Technical analysis: ADX(27) Trend is forming; opportunity to participate | MACD DIF has fallen below zero, trend turning bearish | Moving averages are converging and building momentum; a directional move is imminent | KDJ is strong, bulls have the upper hand (K: 55.5, D: 50.5) | Volume surge (3.0x)
Price change: -0.0200%
━━━━━━━━━━━━━━━━━━
#技术分析 #HBAR #ETC #SAND
📌 The above is for reference only and does not constitute investment advice
3 30-minute bearish alerts: $HBAR / $ETC / $SAND
📉 $HBAR | 30-minute bearish signal
━━━━━━━━━━━━━━━━━━
Technical analysis: ADX(41) clear trending market | MACD bearish crossover below zero, bearish momentum accelerating | EMA5 < EMA8 < EMA13, bearish alignment | Volume surge (3.2x)
Price change: -0.3200%
📉 $ETC | 30-minute bearish signal
━━━━━━━━━━━━━━━━━━
Technical analysis: ADX(33) clear trending market | MACD bearish, trend is weak, momentum strengthening | EMA5 < EMA8 < EMA13, bearish alignment | KDJ bearish crossover, short-term outlook is bearish (K: 60.4, D: 61.7) | Volume surge (4.2x)
Price change: -0.1800%
📉 $SAND | 30-minute bearish signal
━━━━━━━━━━━━━━━━━━
Technical analysis: ADX(27) Trend is forming; opportunity to participate | MACD DIF has fallen below zero, trend turning bearish | Moving averages are converging and building momentum; a directional move is imminent | KDJ is strong, bulls have the upper hand (K: 55.5, D: 50.5) | Volume surge (3.0x)
Price change: -0.0200%
━━━━━━━━━━━━━━━━━━
#技术分析 #HBAR #ETC #SAND
📌 The above is for reference only and does not constitute investment advice
📉 $HBAR | 30-minute bearish signal
━━━━━━━━━━━━━━━━━━
Technical analysis: ADX(41) clear trending market | MACD bearish crossover below zero, bearish momentum accelerating | EMA5 < EMA8 < EMA13, bearish alignment | Volume surge (3.2x)
Price change: -0.3200%
📉 $ETC | 30-minute bearish signal
━━━━━━━━━━━━━━━━━━
Technical analysis: ADX(33) clear trending market | MACD bearish, trend is weak, momentum strengthening | EMA5 < EMA8 < EMA13, bearish alignment | KDJ bearish crossover, short-term outlook is bearish (K: 60.4, D: 61.7) | Volume surge (4.2x)
Price change: -0.1800%
📉 $SAND | 30-minute bearish signal
━━━━━━━━━━━━━━━━━━
Technical analysis: ADX(27) Trend is forming; opportunity to participate | MACD DIF has fallen below zero, trend turning bearish | Moving averages are converging and building momentum; a directional move is imminent | KDJ is strong, bulls have the upper hand (K: 55.5, D: 50.5) | Volume surge (3.0x)
Price change: -0.0200%
━━━━━━━━━━━━━━━━━━
#技术分析 #HBAR #ETC #SAND
📌 The above is for reference only and does not constitute investment advice
5
·
--
$HBAR / $ETC / $SAND 30-minute technical indicators have weakened in sync; be mindful of risk 🔥
════════════════════
🟢 $HBAR 30-minute bearish signal
⚠️Technical analysis: ADX(41) indicates a clear trending market | MACD bearish crossover below zero; bearish momentum accelerating | EMA5 < EMA8 < EMA13, bearish alignment | Volume surge (3.2x)
════════════════════
🟢 $ETC 30-minute bearish signal
⚠️Technical analysis: ADX(33) indicates a clear trending market | MACD is bearish; trend is weak, momentum is strengthening | EMA5 < EMA8 < EMA13, bearish alignment | KDJ bearish crossover; short-term outlook is bearish (K: 60.4, D: 61.7) | Volume surge (4.2x)
════════════════════
🟢 $SAND 30-minute bearish signal
⚠️Technical analysis: ADX(27) indicates a trend is forming and may be traded | MACD DIF has fallen below zero; trend has turned bearish | Moving averages are converging and building momentum; a direction may be chosen soon | KDJ is running strong, with bulls in control (K: 55.5, D: 50.5) | Volume surge (3.0x)
════════════════════
🔔 Follow for first-hand market updates 🔔
#技术分析 #HBAR #ETC #SAND
📌 When trading, pay attention to whether the candlestick pattern confirms the signal
$HBAR / $ETC / $SAND 30-minute technical indicators have weakened in sync; be mindful of risk 🔥
════════════════════
🟢 $HBAR 30-minute bearish signal
⚠️Technical analysis: ADX(41) indicates a clear trending market | MACD bearish crossover below zero; bearish momentum accelerating | EMA5 < EMA8 < EMA13, bearish alignment | Volume surge (3.2x)
════════════════════
🟢 $ETC 30-minute bearish signal
⚠️Technical analysis: ADX(33) indicates a clear trending market | MACD is bearish; trend is weak, momentum is strengthening | EMA5 < EMA8 < EMA13, bearish alignment | KDJ bearish crossover; short-term outlook is bearish (K: 60.4, D: 61.7) | Volume surge (4.2x)
════════════════════
🟢 $SAND 30-minute bearish signal
⚠️Technical analysis: ADX(27) indicates a trend is forming and may be traded | MACD DIF has fallen below zero; trend has turned bearish | Moving averages are converging and building momentum; a direction may be chosen soon | KDJ is running strong, with bulls in control (K: 55.5, D: 50.5) | Volume surge (3.0x)
════════════════════
🔔 Follow for first-hand market updates 🔔
#技术分析 #HBAR #ETC #SAND
📌 When trading, pay attention to whether the candlestick pattern confirms the signal
════════════════════
🟢 $HBAR 30-minute bearish signal
⚠️Technical analysis: ADX(41) indicates a clear trending market | MACD bearish crossover below zero; bearish momentum accelerating | EMA5 < EMA8 < EMA13, bearish alignment | Volume surge (3.2x)
════════════════════
🟢 $ETC 30-minute bearish signal
⚠️Technical analysis: ADX(33) indicates a clear trending market | MACD is bearish; trend is weak, momentum is strengthening | EMA5 < EMA8 < EMA13, bearish alignment | KDJ bearish crossover; short-term outlook is bearish (K: 60.4, D: 61.7) | Volume surge (4.2x)
════════════════════
🟢 $SAND 30-minute bearish signal
⚠️Technical analysis: ADX(27) indicates a trend is forming and may be traded | MACD DIF has fallen below zero; trend has turned bearish | Moving averages are converging and building momentum; a direction may be chosen soon | KDJ is running strong, with bulls in control (K: 55.5, D: 50.5) | Volume surge (3.0x)
════════════════════
🔔 Follow for first-hand market updates 🔔
#技术分析 #HBAR #ETC #SAND
📌 When trading, pay attention to whether the candlestick pattern confirms the signal
7

·
--
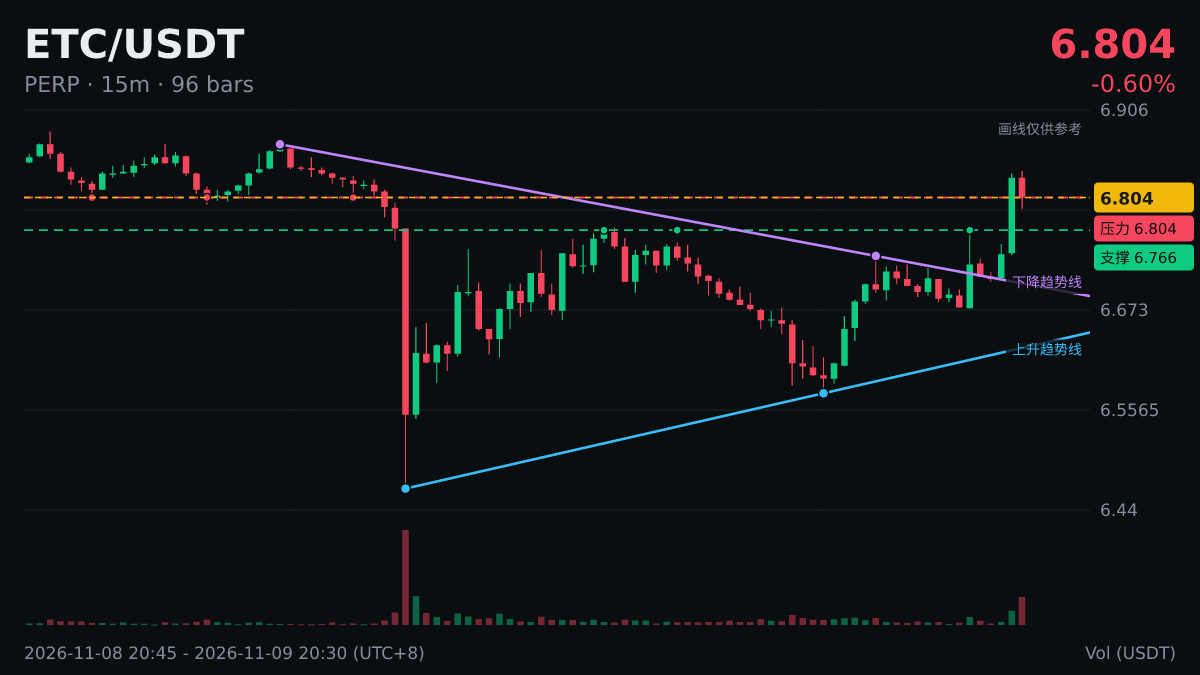
$ETC Is big money on the move?
5-minute trading volume suddenly surged 15.7x ($1.09 million), while the price fell 0.4%.
Volume is up, price is down, and sellers are in control. Be careful—could a whale be distributing?
Keep a close eye on it.
#ETC
I'm just chatting, don't take this as advice.
$ETC Is big money on the move?
5-minute trading volume suddenly surged 15.7x ($1.09 million), while the price fell 0.4%.
Volume is up, price is down, and sellers are in control. Be careful—could a whale be distributing?
Keep a close eye on it.
#ETC
I'm just chatting, don't take this as advice.
5-minute trading volume suddenly surged 15.7x ($1.09 million), while the price fell 0.4%.
Volume is up, price is down, and sellers are in control. Be careful—could a whale be distributing?
Keep a close eye on it.
#ETC
I'm just chatting, don't take this as advice.
11

·
--
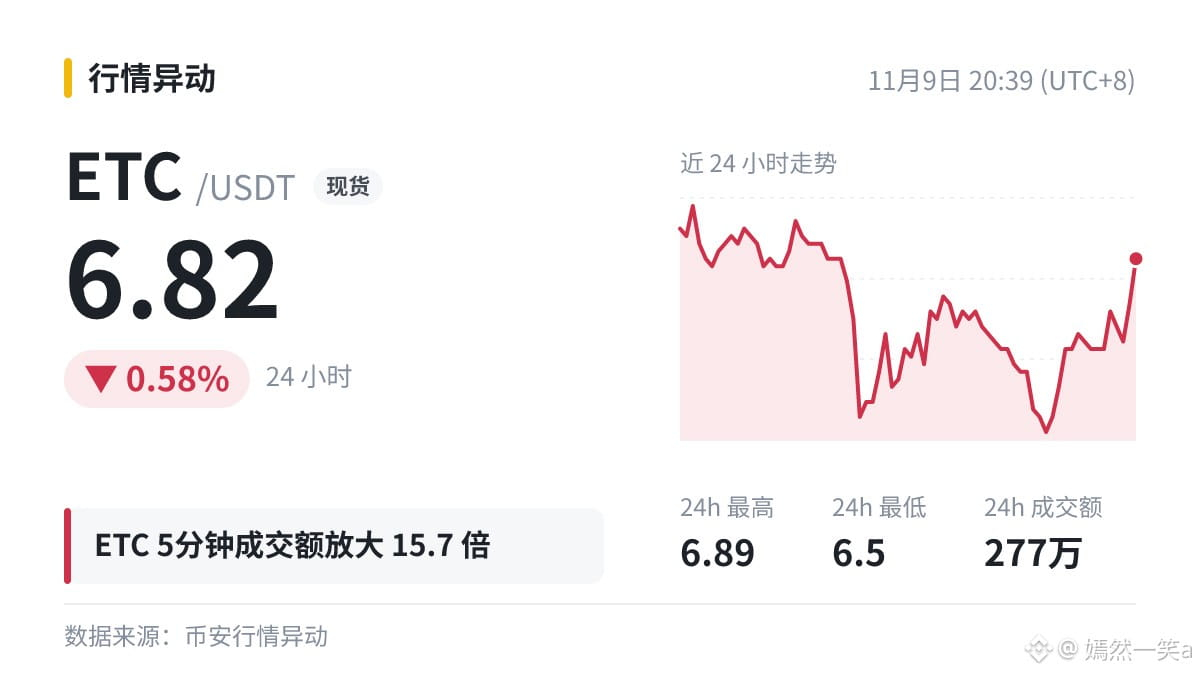
🐋 The trading volume over $ETC 5 minutes suddenly surged to 15.7 times the average, then fell 0.4%.
When large orders are clustered, it often means a major player is making a statement. As before, first figure out whether they’re buying or selling.
#ETC
🐋 The trading volume over $ETC 5 minutes suddenly surged to 15.7 times the average, then fell 0.4%.
When large orders are clustered, it often means a major player is making a statement. As before, first figure out whether they’re buying or selling.
#ETC
When large orders are clustered, it often means a major player is making a statement. As before, first figure out whether they’re buying or selling.
#ETC
7
Log in to explore more content
Join global crypto users on Binance Square
⚡️ Get latest and useful information about crypto.
💬 Trusted by the world’s largest crypto exchange.
👍 Discover real insights from verified creators.
Email / Phone number
Trending Topics
1
#HotCPIDecemberHikePriced
334,545 views
3,280 Discussing
2
#ZcashFallsBelow$1000ForFirstTimeSinceSeptember
11,038 views
64 Discussing
3
#StrategyFaces$2.8BSelloffRiskFromMSCIRemoval
21,531 views
141 Discussing
4
#AnthropicRejectsIPODelayValuationinQuestion
366,467 views
3,227 Discussing
5
#BitcoinETFsLose$1.6BInNovember
9,406 views
48 Discussing
6
#AnthropicDisclosesOver$10BNewComputeDeals
1,887 views
31 Discussing
7
#CoreWeaveJumps10%On168%RevenueGrowth
23,298 views
471 Discussing
8
#CanNvidiaEarningsEaseMarketConcerns?
110,437 views
1,402 Discussing
9
#BarclaysRaisesBlackRockBitcoinETFStake48%
19,951 views
346 Discussing
10
#BitmineReports$6.3BFiscal2026Loss
7,697 views
24 Discussing