
#bitcoin
bitcoin
348.7M views
853,146 Discussing
Hot
Latest


·
--
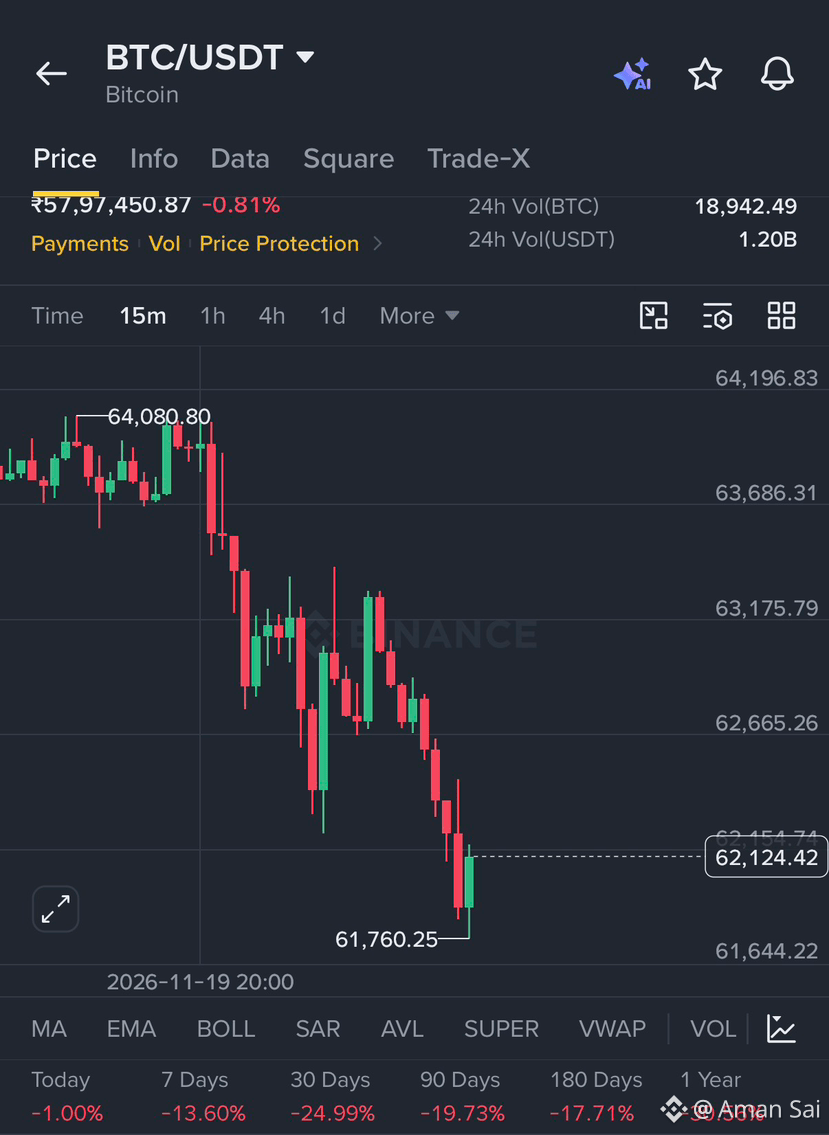
🚨 BITCOIN JUST LOST $62,000.
The market is sending a warning signal and the next move could be critical.
BTC’s breakdown puts $60K in focus, with the possibility of deeper downside if buyers fail to step in.
• $62K 👉 Immediate reclaim level
• $64K–$65K 👉Recovery target zone
Is this a temporary liquidity flush, or the beginning of a deeper correction?
Watch spot volume, ETF flows and price acceptance around $60K. The reaction matters more than the headlines.
No blind dip-buying. No emotional trading. Let price confirm.
Are we heading to $55K, or will bulls reclaim $62K?
I am waiting for the big dip 😎
#Bitcoin $BTC
🚨 BITCOIN JUST LOST $62,000.
The market is sending a warning signal and the next move could be critical.
BTC’s breakdown puts $60K in focus, with the possibility of deeper downside if buyers fail to step in.
• $62K 👉 Immediate reclaim level
• $64K–$65K 👉Recovery target zone
Is this a temporary liquidity flush, or the beginning of a deeper correction?
Watch spot volume, ETF flows and price acceptance around $60K. The reaction matters more than the headlines.
No blind dip-buying. No emotional trading. Let price confirm.
Are we heading to $55K, or will bulls reclaim $62K?
I am waiting for the big dip 😎
#Bitcoin $BTC
The market is sending a warning signal and the next move could be critical.
BTC’s breakdown puts $60K in focus, with the possibility of deeper downside if buyers fail to step in.
• $62K 👉 Immediate reclaim level
• $64K–$65K 👉Recovery target zone
Is this a temporary liquidity flush, or the beginning of a deeper correction?
Watch spot volume, ETF flows and price acceptance around $60K. The reaction matters more than the headlines.
No blind dip-buying. No emotional trading. Let price confirm.
Are we heading to $55K, or will bulls reclaim $62K?
I am waiting for the big dip 😎
#Bitcoin $BTC
1
689

$BTC is back at the origin of the whole rally, and $62K is the line to watch. 📉
{future}(BTCUSDT)
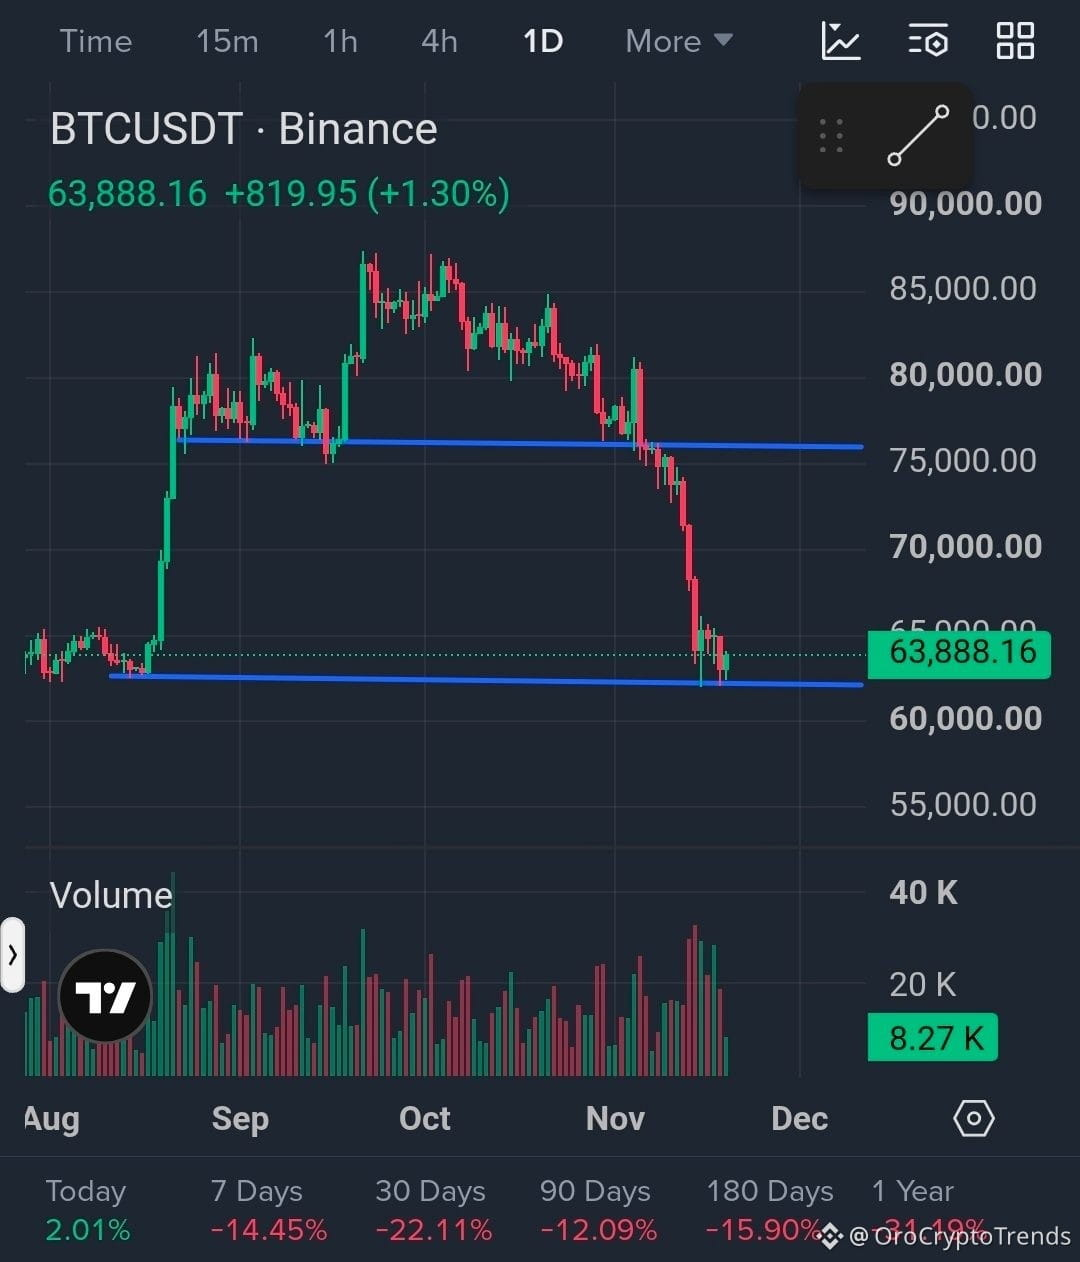
Bitcoin has given back its entire move from the August base, and price is now testing that level again. According to Binance’s BTC/USDT daily chart, BTC trades near $63,888, up about 2% today but still down about 14% over 7 days and 22% over 30 days.
What the chart shows:
🔻 Full retrace: BTC rallied from about $62K to $87K, ranged for roughly two months, and is now back at the starting point.
🔻 Range breakdown: The $76K base of the range failed in November. It is now resistance.
🔻 Measured move: The range was about $11K tall. Projected down from the $76K break, the target lands near $64K-$65K, and price has already reached it.
🔻 Momentum: The drop from $76K to $64K came as a run of large red candles with very little pullback. That is momentum selling.
🔻 Buyers defending: A high-volume green candle with a long lower wick appeared near $62K, which suggests buyers stepped in at the August base.
Key levels to watch:
🟥 Resistance: $65K-$66K, $68K-$70K, $76K
🟩 Support: $62K, then $60K, then $55K
Two scenarios:
Bullish: A daily close above $65K-$66K on rising volume would show the $62K defense is working, with $68K-$70K as the next area. Only a reclaim of $76K changes the trend structure.
Bearish: A daily close below $62K would break the August base and open the way to $60K, then likely $55K, since there is little structure between.
What I’m watching: the daily close relative to $62K, and whether this bounce comes on rising or fading volume. Today’s volume is still light, so I’m not treating it as confirmation yet. A bounce at support inside a downtrend is not a reversal.
No hype and no prediction, just levels and conditions. Let the chart confirm the move.
⚠️ This is a chart read, not financial advice. Support levels can fail, so manage your risk and do your own research.
What’s your read: does the August base hold or break? 👇
#BTC #Bitcoin #OroCryptoTrends
$BTC is back at the origin of the whole rally, and $62K is the line to watch. 📉
Bitcoin has given back its entire move from the August base, and price is now testing that level again. According to Binance’s BTC/USDT daily chart, BTC trades near $63,888, up about 2% today but still down about 14% over 7 days and 22% over 30 days.
What the chart shows:
🔻 Full retrace: BTC rallied from about $62K to $87K, ranged for roughly two months, and is now back at the starting point.
🔻 Range breakdown: The $76K base of the range failed in November. It is now resistance.
🔻 Measured move: The range was about $11K tall. Projected down from the $76K break, the target lands near $64K-$65K, and price has already reached it.
🔻 Momentum: The drop from $76K to $64K came as a run of large red candles with very little pullback. That is momentum selling.
🔻 Buyers defending: A high-volume green candle with a long lower wick appeared near $62K, which suggests buyers stepped in at the August base.
Key levels to watch:
🟥 Resistance: $65K-$66K, $68K-$70K, $76K
🟩 Support: $62K, then $60K, then $55K
Two scenarios:
Bullish: A daily close above $65K-$66K on rising volume would show the $62K defense is working, with $68K-$70K as the next area. Only a reclaim of $76K changes the trend structure.
Bearish: A daily close below $62K would break the August base and open the way to $60K, then likely $55K, since there is little structure between.
What I’m watching: the daily close relative to $62K, and whether this bounce comes on rising or fading volume. Today’s volume is still light, so I’m not treating it as confirmation yet. A bounce at support inside a downtrend is not a reversal.
No hype and no prediction, just levels and conditions. Let the chart confirm the move.
⚠️ This is a chart read, not financial advice. Support levels can fail, so manage your risk and do your own research.
What’s your read: does the August base hold or break? 👇
#BTC #Bitcoin #OroCryptoTrends
Bitcoin has given back its entire move from the August base, and price is now testing that level again. According to Binance’s BTC/USDT daily chart, BTC trades near $63,888, up about 2% today but still down about 14% over 7 days and 22% over 30 days.
What the chart shows:
🔻 Full retrace: BTC rallied from about $62K to $87K, ranged for roughly two months, and is now back at the starting point.
🔻 Range breakdown: The $76K base of the range failed in November. It is now resistance.
🔻 Measured move: The range was about $11K tall. Projected down from the $76K break, the target lands near $64K-$65K, and price has already reached it.
🔻 Momentum: The drop from $76K to $64K came as a run of large red candles with very little pullback. That is momentum selling.
🔻 Buyers defending: A high-volume green candle with a long lower wick appeared near $62K, which suggests buyers stepped in at the August base.
Key levels to watch:
🟥 Resistance: $65K-$66K, $68K-$70K, $76K
🟩 Support: $62K, then $60K, then $55K
Two scenarios:
Bullish: A daily close above $65K-$66K on rising volume would show the $62K defense is working, with $68K-$70K as the next area. Only a reclaim of $76K changes the trend structure.
Bearish: A daily close below $62K would break the August base and open the way to $60K, then likely $55K, since there is little structure between.
What I’m watching: the daily close relative to $62K, and whether this bounce comes on rising or fading volume. Today’s volume is still light, so I’m not treating it as confirmation yet. A bounce at support inside a downtrend is not a reversal.
No hype and no prediction, just levels and conditions. Let the chart confirm the move.
⚠️ This is a chart read, not financial advice. Support levels can fail, so manage your risk and do your own research.
What’s your read: does the August base hold or break? 👇
#BTC #Bitcoin #OroCryptoTrends
Trader M08:
The 62K base has now held three times on Binance spot daily candles: 62,006 on Nov 15, 62,063 yesterday and 62,389 today. Your volume point checks out too, with about 10.8K BTC traded today so far against roughly 29K on Nov 15, and the push to 64,081 has already faded back near 63,100. Agree that 65K to 66K is the first real test, since the best daily close since Nov 14 is only 65,351.
1
6
3.3k

·
--
$BTC — $62,200 UNDER PRESSURE: WILL BUYERS DEFEND OR BREAK?
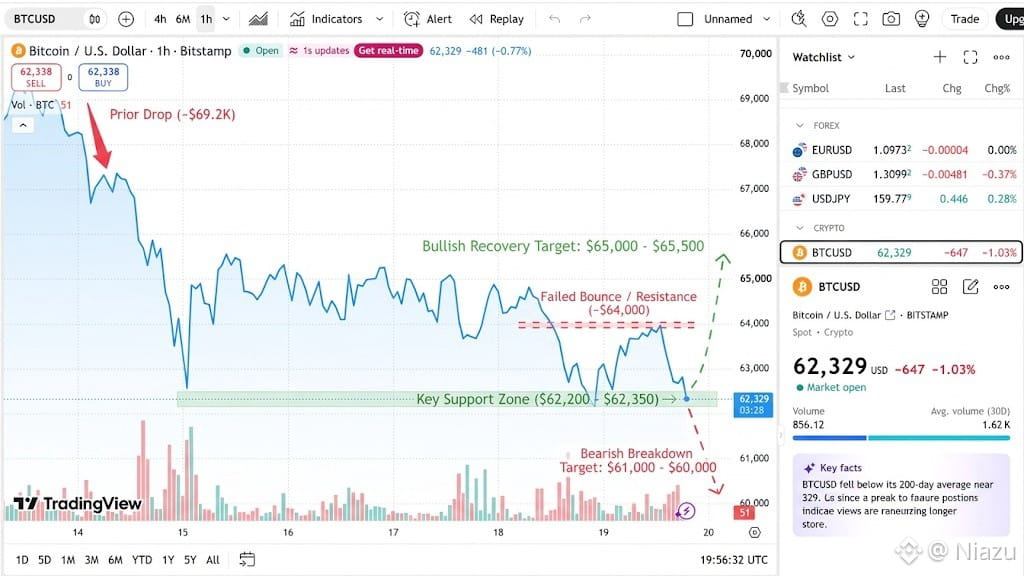
BTC/USDT is around $62,329, down 1.03% on the day. After a sell-off from the $69,000 area and a failed bounce near $64,000, price is testing the $62,200–$62,350 support zone.
My trading map
- Bearish scenario: A decisive 1H close below $62,200 with sustained volume, followed by a failed retest, could open a move toward $61,000 and then $60,000.
- Bullish scenario: Buyers defend $62,250 and reclaim $63,900–$64,000 with rising green volume. A successful retest could target $65,000–$65,500.
- Invalidation: A 1H close below $62,200 weakens the short-term recovery; until $64,000 flips into support, bounces remain counter-trend.
My take
This is a support-test setup, not a confirmed reversal. The recent bounce toward $64,000 came with weak buying volume, so I’m not buying directly into support or shorting before the level breaks.
I need a confirmed 1H candle close and retest before considering a position. Any setup must offer at least 1.5R to the next meaningful level after fees and slippage, with a stop based on the actual retest structure.
Levels are approximate—confirm with candlesticks.
Status: conditional plan.
💬 Will BTC defend $62,200, or break toward $60,000? Drop your view below 👇
$BTC #Bitcoin #CryptoTrading #BinanceSquare
$BTC — $62,200 UNDER PRESSURE: WILL BUYERS DEFEND OR BREAK?
BTC/USDT is around $62,329, down 1.03% on the day. After a sell-off from the $69,000 area and a failed bounce near $64,000, price is testing the $62,200–$62,350 support zone.
My trading map
- Bearish scenario: A decisive 1H close below $62,200 with sustained volume, followed by a failed retest, could open a move toward $61,000 and then $60,000.
- Bullish scenario: Buyers defend $62,250 and reclaim $63,900–$64,000 with rising green volume. A successful retest could target $65,000–$65,500.
- Invalidation: A 1H close below $62,200 weakens the short-term recovery; until $64,000 flips into support, bounces remain counter-trend.
My take
This is a support-test setup, not a confirmed reversal. The recent bounce toward $64,000 came with weak buying volume, so I’m not buying directly into support or shorting before the level breaks.
I need a confirmed 1H candle close and retest before considering a position. Any setup must offer at least 1.5R to the next meaningful level after fees and slippage, with a stop based on the actual retest structure.
Levels are approximate—confirm with candlesticks.
Status: conditional plan.
💬 Will BTC defend $62,200, or break toward $60,000? Drop your view below 👇
$BTC #Bitcoin #CryptoTrading #BinanceSquare
BTC/USDT is around $62,329, down 1.03% on the day. After a sell-off from the $69,000 area and a failed bounce near $64,000, price is testing the $62,200–$62,350 support zone.
My trading map
- Bearish scenario: A decisive 1H close below $62,200 with sustained volume, followed by a failed retest, could open a move toward $61,000 and then $60,000.
- Bullish scenario: Buyers defend $62,250 and reclaim $63,900–$64,000 with rising green volume. A successful retest could target $65,000–$65,500.
- Invalidation: A 1H close below $62,200 weakens the short-term recovery; until $64,000 flips into support, bounces remain counter-trend.
My take
This is a support-test setup, not a confirmed reversal. The recent bounce toward $64,000 came with weak buying volume, so I’m not buying directly into support or shorting before the level breaks.
I need a confirmed 1H candle close and retest before considering a position. Any setup must offer at least 1.5R to the next meaningful level after fees and slippage, with a stop based on the actual retest structure.
Levels are approximate—confirm with candlesticks.
Status: conditional plan.
💬 Will BTC defend $62,200, or break toward $60,000? Drop your view below 👇
$BTC #Bitcoin #CryptoTrading #BinanceSquare
583

·
--
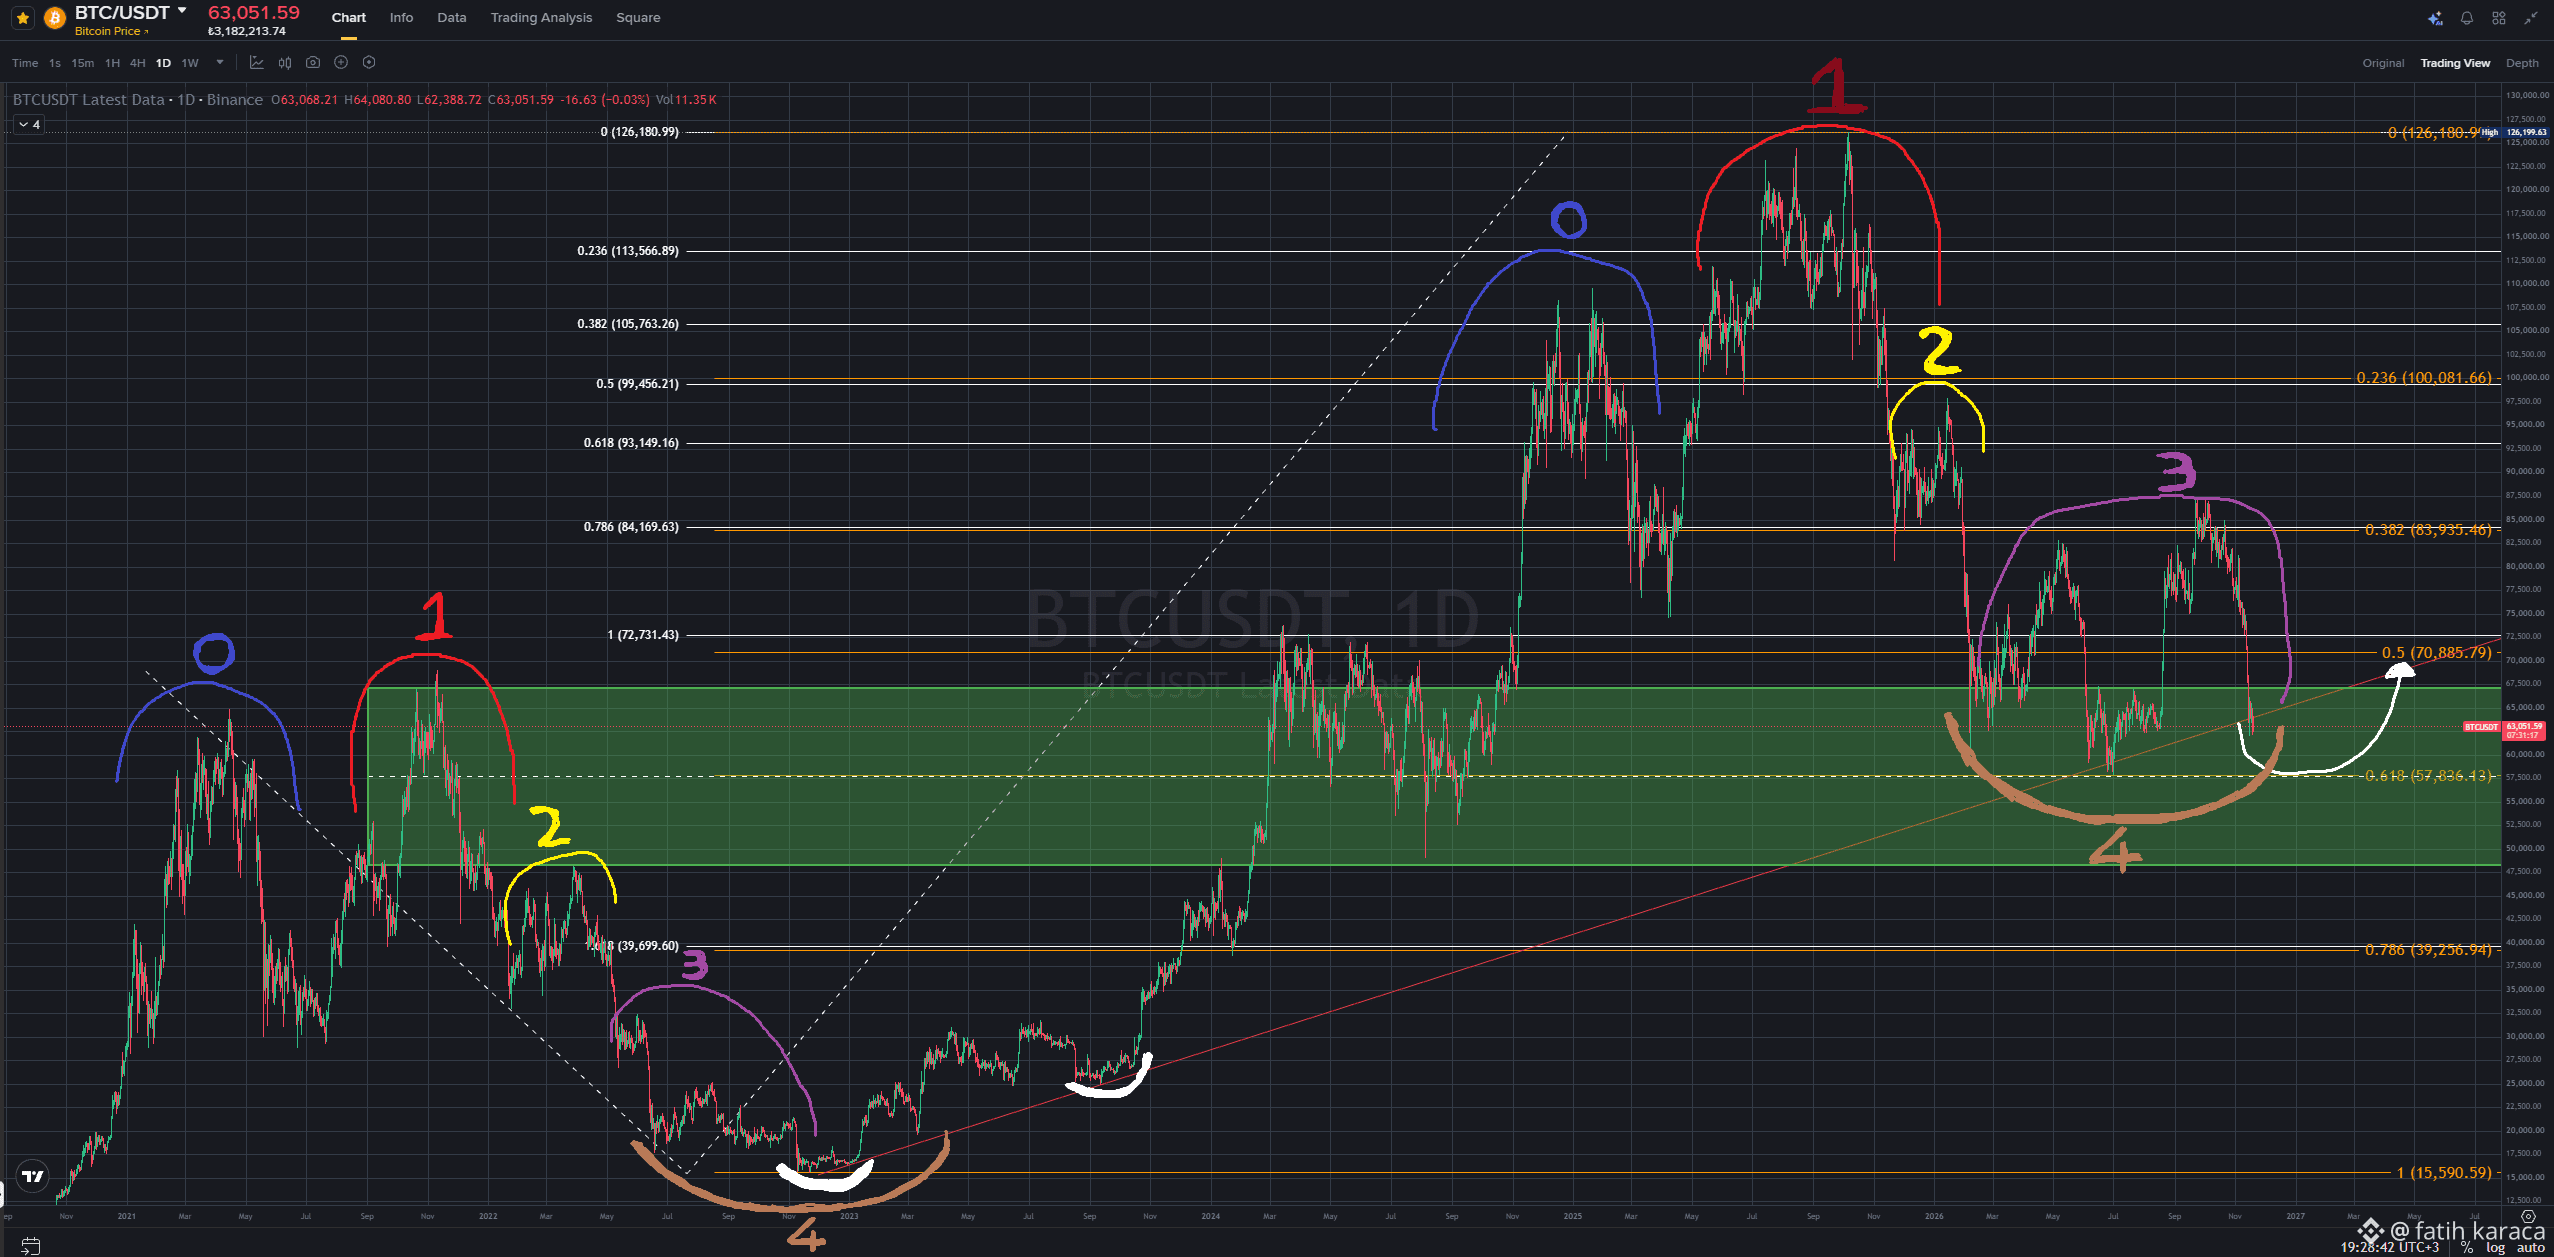
Pay close attention to the harmony of colors and shapes !!!
History is the mirror of the future. We are in a consolidation phase; after a long red candle to the downside, I think the uptrend will start—this is just my expectation.
We might drop down to around 50k–48k (the green zone), though this drop will likely be sharp. If it bounces from here, I’ve tried to explain everything on the chart. You’d better take notes.
If you want to send a tip/gift for the effort put into this chart, I’ll never say no. Love you all.
May your profits be plenty and your wallets heavy :)
[support](https://www.binance.com/en-TR/download?_dp=L21wL2FwcD9hcHBJZD1NcERFNnVBalc3TEJzeGk5WFVubjdvJnNjZW5lVmFsdWU9MTMwMCZzdGFydFBhZ2VQYXRoPWNHRm5aWE12Y21WalpXbDJaUzF5WlhGMVpYTjBMMmx1WkdWNCZzdGFydFBhZ2VRdWVyeT1ZbWxzYkU5eVpHVnlTV1E5TkRZMk5UVTBOalF6TnpRNE5UUTBOVEV5Sm1KcGJHeFVlWEJsUFhKbGNYVmxjM1JmWVY5d1lYbHRaVzUw)
$BTC #btc #eth #bitcoin
Key levels to watch
Support : 57.500
Sharp drop brake : 47.500
Breakout to the safe zone : 70.800-85.000
Bullish reversal : 87.500-92.500-100.000-112.500
{spot}(BTCUSDT)
Pay close attention to the harmony of colors and shapes !!!
History is the mirror of the future. We are in a consolidation phase; after a long red candle to the downside, I think the uptrend will start—this is just my expectation.
We might drop down to around 50k–48k (the green zone), though this drop will likely be sharp. If it bounces from here, I’ve tried to explain everything on the chart. You’d better take notes.
If you want to send a tip/gift for the effort put into this chart, I’ll never say no. Love you all.
May your profits be plenty and your wallets heavy :)
support
$BTC #btc #eth #bitcoin
Key levels to watch
Support : 57.500
Sharp drop brake : 47.500
Breakout to the safe zone : 70.800-85.000
Bullish reversal : 87.500-92.500-100.000-112.500
History is the mirror of the future. We are in a consolidation phase; after a long red candle to the downside, I think the uptrend will start—this is just my expectation.
We might drop down to around 50k–48k (the green zone), though this drop will likely be sharp. If it bounces from here, I’ve tried to explain everything on the chart. You’d better take notes.
If you want to send a tip/gift for the effort put into this chart, I’ll never say no. Love you all.
May your profits be plenty and your wallets heavy :)
support
$BTC #btc #eth #bitcoin
Key levels to watch
Support : 57.500
Sharp drop brake : 47.500
Breakout to the safe zone : 70.800-85.000
Bullish reversal : 87.500-92.500-100.000-112.500
1
833

$BTC BITCOIN IN TROUBLE? HAWKISH FED SIGNALS COULD TRIGGER ANOTHER DROP!
👉 What does it mean?
The Fed’s hawkish tone suggests interest rates may stay higher for longer. That strengthens the dollar and puts pressure on risky assets like Bitcoin.
🔮 WHAT'S NEXT?
BTC could retest $62K. A breakdown may expose $60K, while reclaiming $65K–$66K could spark a recovery.
🙋♂️ My take: Don't rush to buy the dip. Watch Fed signals and ETF flows!
{future}(BTCUSDT)
#BTC #Bitcoin #btcremainsunderpressureafterhawkishfomcminutes
$BTC BITCOIN IN TROUBLE? HAWKISH FED SIGNALS COULD TRIGGER ANOTHER DROP!
👉 What does it mean?
The Fed’s hawkish tone suggests interest rates may stay higher for longer. That strengthens the dollar and puts pressure on risky assets like Bitcoin.
🔮 WHAT'S NEXT?
BTC could retest $62K. A breakdown may expose $60K, while reclaiming $65K–$66K could spark a recovery.
🙋♂️ My take: Don't rush to buy the dip. Watch Fed signals and ETF flows!
#BTC #Bitcoin #btcremainsunderpressureafterhawkishfomcminutes
👉 What does it mean?
The Fed’s hawkish tone suggests interest rates may stay higher for longer. That strengthens the dollar and puts pressure on risky assets like Bitcoin.
🔮 WHAT'S NEXT?
BTC could retest $62K. A breakdown may expose $60K, while reclaiming $65K–$66K could spark a recovery.
🙋♂️ My take: Don't rush to buy the dip. Watch Fed signals and ETF flows!
#BTC #Bitcoin #btcremainsunderpressureafterhawkishfomcminutes
DopamineGLOBAL:
62k already tested wed tbh, 65k reclaim is the real signal
9
3
4k

·
--
📡 BTC Breaks Below 62K As Tech Selloff Deepens
BTC slipped below 62,000 overnight, touching near 61,400, its weakest level since July. The slide extends a drop of about 24% in a month from near 81,800 in mid October.
Tech stocks led the risk off move. Anthropic shares opened about 34% above their IPO price, then gave up gains, and BTC moved with stocks while the Fed stays hawkish.
Spot BTC ETFs keep bleeding. Wednesday saw about 306 million in net outflows, the second straight heavy session after 240 million on Tuesday, taking November outflows near 2.9 billion. Assets held by the funds fell to a three month low near 77.7 billion.
ETH trades near 1,754 and SOL near 73, both down about 1% in a day. Total crypto market value sits near 2.15 trillion, down about 3% in 24 hours, and about 528 million in positions were liquidated. Fear and Greed reads 10, deep in extreme fear.
👀 Support sits near 61,000 and 60,000. Resistance sits near 63,000 and 65,000. BTC options expire today, which could add to volatility into the close.
📌 Personal opinion, not financial advice. DYOR.
#BTC #Crypto #CryptoMarket #Bitcoin
$BTCUSDT $ETHUSDT $SOLUSDT
📡 BTC Breaks Below 62K As Tech Selloff Deepens
BTC slipped below 62,000 overnight, touching near 61,400, its weakest level since July. The slide extends a drop of about 24% in a month from near 81,800 in mid October.
Tech stocks led the risk off move. Anthropic shares opened about 34% above their IPO price, then gave up gains, and BTC moved with stocks while the Fed stays hawkish.
Spot BTC ETFs keep bleeding. Wednesday saw about 306 million in net outflows, the second straight heavy session after 240 million on Tuesday, taking November outflows near 2.9 billion. Assets held by the funds fell to a three month low near 77.7 billion.
ETH trades near 1,754 and SOL near 73, both down about 1% in a day. Total crypto market value sits near 2.15 trillion, down about 3% in 24 hours, and about 528 million in positions were liquidated. Fear and Greed reads 10, deep in extreme fear.
👀 Support sits near 61,000 and 60,000. Resistance sits near 63,000 and 65,000. BTC options expire today, which could add to volatility into the close.
📌 Personal opinion, not financial advice. DYOR.
#BTC #Crypto #CryptoMarket #Bitcoin
$BTCUSDT $ETHUSDT $SOLUSDT
BTC slipped below 62,000 overnight, touching near 61,400, its weakest level since July. The slide extends a drop of about 24% in a month from near 81,800 in mid October.
Tech stocks led the risk off move. Anthropic shares opened about 34% above their IPO price, then gave up gains, and BTC moved with stocks while the Fed stays hawkish.
Spot BTC ETFs keep bleeding. Wednesday saw about 306 million in net outflows, the second straight heavy session after 240 million on Tuesday, taking November outflows near 2.9 billion. Assets held by the funds fell to a three month low near 77.7 billion.
ETH trades near 1,754 and SOL near 73, both down about 1% in a day. Total crypto market value sits near 2.15 trillion, down about 3% in 24 hours, and about 528 million in positions were liquidated. Fear and Greed reads 10, deep in extreme fear.
👀 Support sits near 61,000 and 60,000. Resistance sits near 63,000 and 65,000. BTC options expire today, which could add to volatility into the close.
📌 Personal opinion, not financial advice. DYOR.
#BTC #Crypto #CryptoMarket #Bitcoin
$BTCUSDT $ETHUSDT $SOLUSDT

Trong_Hatachi:
$306M in ETF outflows plus Fear & Greed at 10 really shows how risk-off sentiment has become. What are you watching most closely today? Follow me back if you’d like to keep the conversation going.
1
1
677

·
--
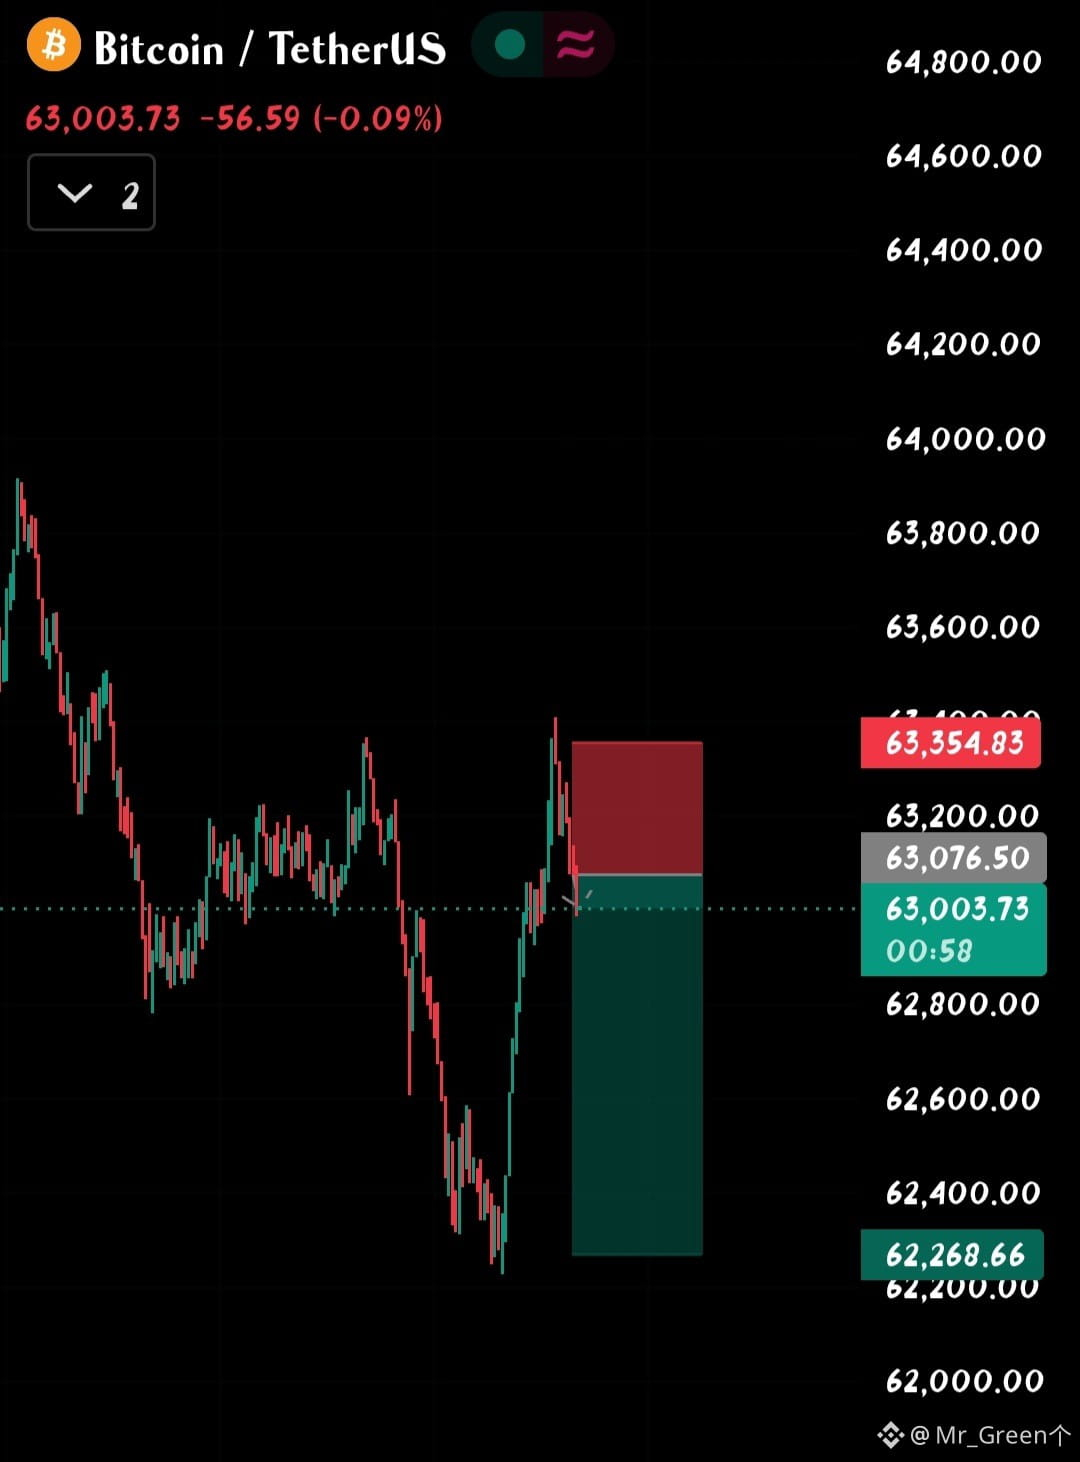
$BTC SHORT SETUP 🔴
Bitcoin bounced strongly from the $62.3K area, but the recovery is facing rejection near the $63.2K–$63.35K resistance zone.
I'm watching for downside continuation if sellers maintain control.
📍 Entry: $63,076
🛑 Stop Loss: $63,355
🎯 Take Profit: $62,269
A break below $62.8K could add momentum to the downside. If BTC reclaims $63.35K, the short setup is invalidated.
No chasing — wait for confirmation and manage risk.
#BTC #Bitcoin #CryptoTrading
{future}(BTCUSDT)
$EVAA
{future}(EVAAUSDT)
$BTC SHORT SETUP 🔴
Bitcoin bounced strongly from the $62.3K area, but the recovery is facing rejection near the $63.2K–$63.35K resistance zone.
I'm watching for downside continuation if sellers maintain control.
📍 Entry: $63,076
🛑 Stop Loss: $63,355
🎯 Take Profit: $62,269
A break below $62.8K could add momentum to the downside. If BTC reclaims $63.35K, the short setup is invalidated.
No chasing — wait for confirmation and manage risk.
#BTC #Bitcoin #CryptoTrading
$EVAA
Bitcoin bounced strongly from the $62.3K area, but the recovery is facing rejection near the $63.2K–$63.35K resistance zone.
I'm watching for downside continuation if sellers maintain control.
📍 Entry: $63,076
🛑 Stop Loss: $63,355
🎯 Take Profit: $62,269
A break below $62.8K could add momentum to the downside. If BTC reclaims $63.35K, the short setup is invalidated.
No chasing — wait for confirmation and manage risk.
#BTC #Bitcoin #CryptoTrading
$EVAA
407

🚨 $BTC /USDT – Bitcoin Trading Signal
📊 Current Price: ~$62,900
🔴 Market Trend: Bearish
Key Levels:
Support: $62,244
Resistance: $63,797
Bullish confirmation: Above $63,797
Bearish continuation: Below $62,244
⚠️ Wait for confirmation before entry. Manage risk carefully.
#BTC #Bitcoin #BinanceSquare #CryptoTrading #BTCSignal
🚨 $BTC /USDT – Bitcoin Trading Signal
📊 Current Price: ~$62,900
🔴 Market Trend: Bearish
Key Levels:
Support: $62,244
Resistance: $63,797
Bullish confirmation: Above $63,797
Bearish continuation: Below $62,244
⚠️ Wait for confirmation before entry. Manage risk carefully.
#BTC #Bitcoin #BinanceSquare #CryptoTrading #BTCSignal
📊 Current Price: ~$62,900
🔴 Market Trend: Bearish
Key Levels:
Support: $62,244
Resistance: $63,797
Bullish confirmation: Above $63,797
Bearish continuation: Below $62,244
⚠️ Wait for confirmation before entry. Manage risk carefully.
#BTC #Bitcoin #BinanceSquare #CryptoTrading #BTCSignal
2
103

·
--
🚀 Anthropic opens 34% above IPO price in Nasdaq debut
Anthropic (ANT) began trading at $111.50, a 34% jump from its $83 IPO price that implies a valuation above $2 trillion. Together with a $26 billion private placement involving Nvidia, Microsoft and Google, the $81 billion IPO brings total funds raised to $107 billion. The Nasdaq later turned 0.6% lower, and bitcoin also gave back gains to trade below $63,000.
⭐ The mega-IPO has been blamed for pulling money out of crypto as investors sell coins to buy ANT, though some analysts call the timing a coincidence amid an existing downtrend.
#Anthropic #IPO #Bitcoin #Markets
🚀 Anthropic opens 34% above IPO price in Nasdaq debut
Anthropic (ANT) began trading at $111.50, a 34% jump from its $83 IPO price that implies a valuation above $2 trillion. Together with a $26 billion private placement involving Nvidia, Microsoft and Google, the $81 billion IPO brings total funds raised to $107 billion. The Nasdaq later turned 0.6% lower, and bitcoin also gave back gains to trade below $63,000.
⭐ The mega-IPO has been blamed for pulling money out of crypto as investors sell coins to buy ANT, though some analysts call the timing a coincidence amid an existing downtrend.
#Anthropic #IPO #Bitcoin #Markets
Anthropic (ANT) began trading at $111.50, a 34% jump from its $83 IPO price that implies a valuation above $2 trillion. Together with a $26 billion private placement involving Nvidia, Microsoft and Google, the $81 billion IPO brings total funds raised to $107 billion. The Nasdaq later turned 0.6% lower, and bitcoin also gave back gains to trade below $63,000.
⭐ The mega-IPO has been blamed for pulling money out of crypto as investors sell coins to buy ANT, though some analysts call the timing a coincidence amid an existing downtrend.
#Anthropic #IPO #Bitcoin #Markets

550
·
--
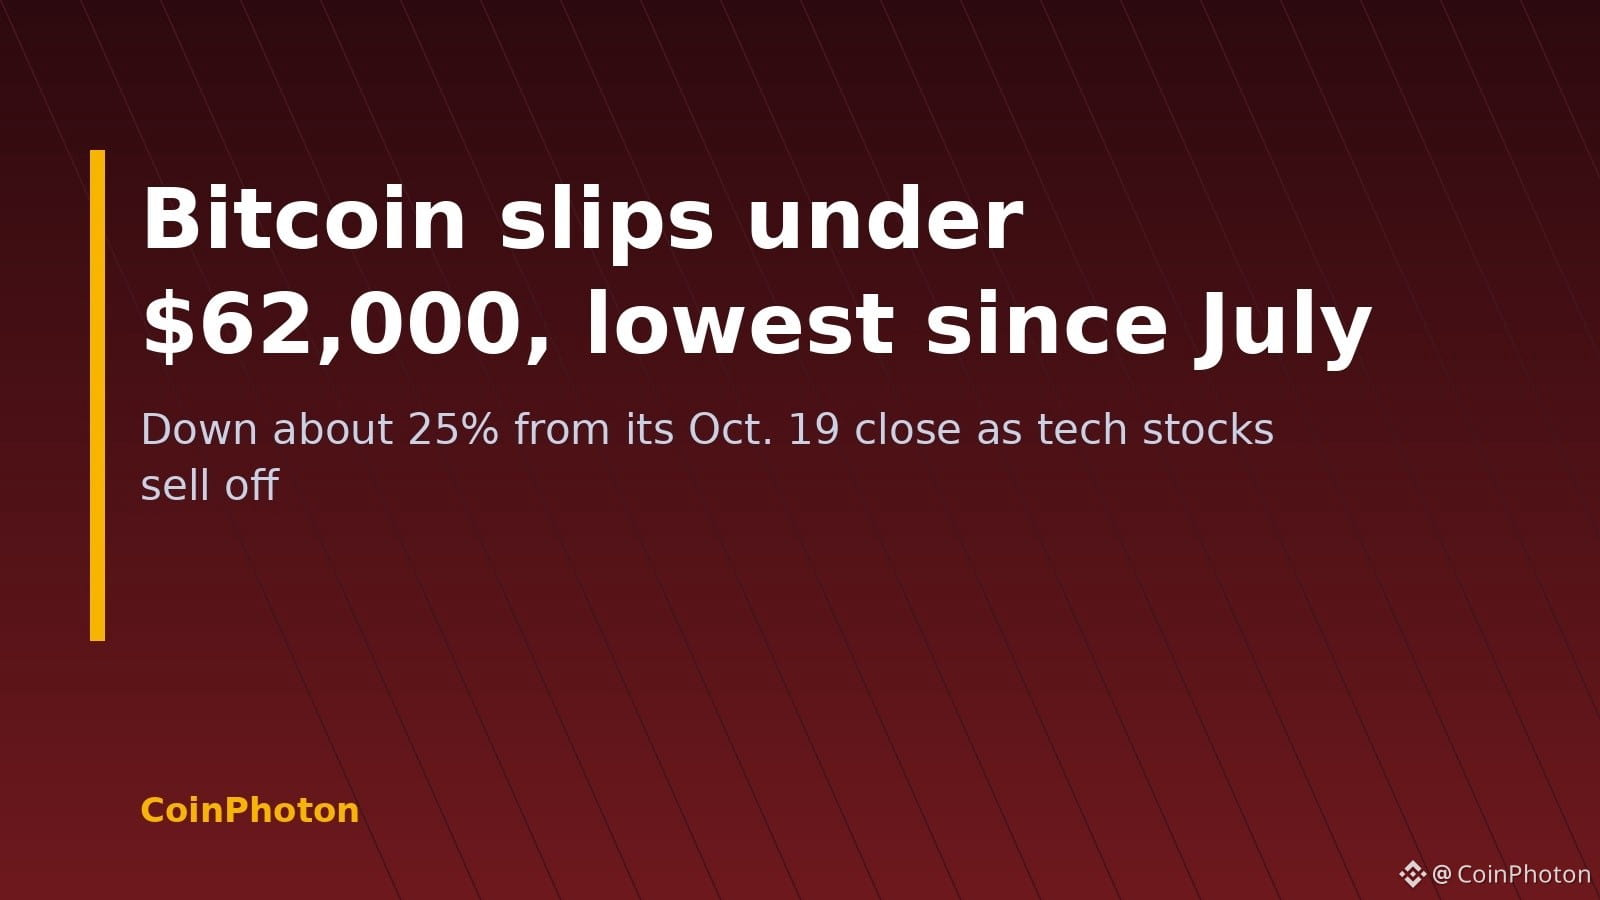
📉 Bitcoin slips under $62,000 to its lowest level since July
Bitcoin hit roughly $61,650 on Thursday before settling near $62,200, about 25% below its Oct. 19 close near $81,800. The drop tracked a broad tech selloff after Anthropic's Nasdaq debut: the Nasdaq fell about 2% and the VIX rose to its highest since March. Strategy shares lost about 4% to near $86.70, while Galaxy Digital dropped about 6.9%.
⭐ BTC is on course for a seventh straight weekly loss, and growing bets on a December Fed rate hike keep weighing on risk assets.
#Bitcoin #BTC #CryptoMarket
📉 Bitcoin slips under $62,000 to its lowest level since July
Bitcoin hit roughly $61,650 on Thursday before settling near $62,200, about 25% below its Oct. 19 close near $81,800. The drop tracked a broad tech selloff after Anthropic's Nasdaq debut: the Nasdaq fell about 2% and the VIX rose to its highest since March. Strategy shares lost about 4% to near $86.70, while Galaxy Digital dropped about 6.9%.
⭐ BTC is on course for a seventh straight weekly loss, and growing bets on a December Fed rate hike keep weighing on risk assets.
#Bitcoin #BTC #CryptoMarket
Bitcoin hit roughly $61,650 on Thursday before settling near $62,200, about 25% below its Oct. 19 close near $81,800. The drop tracked a broad tech selloff after Anthropic's Nasdaq debut: the Nasdaq fell about 2% and the VIX rose to its highest since March. Strategy shares lost about 4% to near $86.70, while Galaxy Digital dropped about 6.9%.
⭐ BTC is on course for a seventh straight weekly loss, and growing bets on a December Fed rate hike keep weighing on risk assets.
#Bitcoin #BTC #CryptoMarket
445

🚨 I don't think Bitcoin is done dropping.
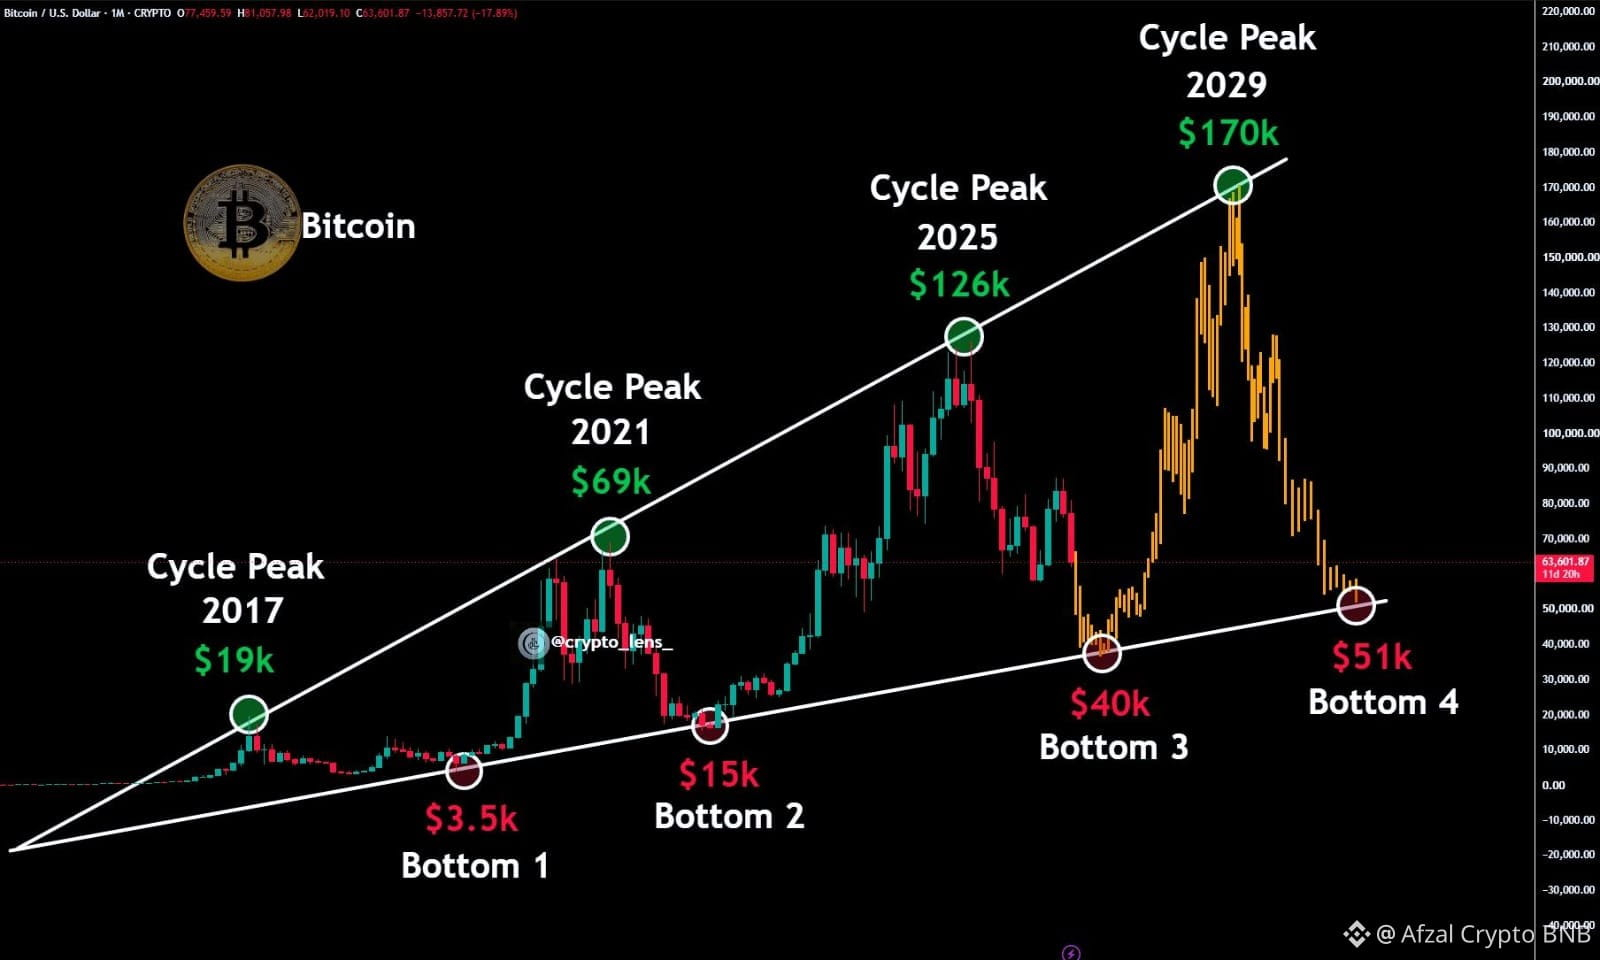
Back on November 5, I said BTC hadn't bottomed yet. Nothing on the chart has changed my mind. If anything, I'm more convinced now.
I'd be careful about longing here. The 4-year cycle has played out every time so far, and the path I'm watching is $63K, then a flush down to around $40K (what I'm calling Bottom 3), and only after that a real run toward $170K.
Save this post so you can look back at it. The last thing you want is to be the one providing exit liquidity.
I'll post my next update here first, so follow and turn on notifications if you want it in real time.
Protect your capital out there.
Not financial advice. DYOR.
$BTC #Bitcoin #Crypto #BTC
{future}(BTCUSDT)
🚨 I don't think Bitcoin is done dropping.
Back on November 5, I said BTC hadn't bottomed yet. Nothing on the chart has changed my mind. If anything, I'm more convinced now.
I'd be careful about longing here. The 4-year cycle has played out every time so far, and the path I'm watching is $63K, then a flush down to around $40K (what I'm calling Bottom 3), and only after that a real run toward $170K.
Save this post so you can look back at it. The last thing you want is to be the one providing exit liquidity.
I'll post my next update here first, so follow and turn on notifications if you want it in real time.
Protect your capital out there.
Not financial advice. DYOR.
$BTC #Bitcoin #Crypto #BTC
Back on November 5, I said BTC hadn't bottomed yet. Nothing on the chart has changed my mind. If anything, I'm more convinced now.
I'd be careful about longing here. The 4-year cycle has played out every time so far, and the path I'm watching is $63K, then a flush down to around $40K (what I'm calling Bottom 3), and only after that a real run toward $170K.
Save this post so you can look back at it. The last thing you want is to be the one providing exit liquidity.
I'll post my next update here first, so follow and turn on notifications if you want it in real time.
Protect your capital out there.
Not financial advice. DYOR.
$BTC #Bitcoin #Crypto #BTC
1
333

$BTC Is Trying to Recover — What Comes Next?
Bitcoin bounced after testing the $62K area. Buyers are showing interest, but the recovery still needs confirmation.
A move above resistance could improve sentiment. Another rejection may bring fresh selling pressure.
Do you think BTC can regain $65K?
$BTC #bitcoin #crypto #MarketAnalysis
{spot}(BTCUSDT)
$BTC Is Trying to Recover — What Comes Next?
Bitcoin bounced after testing the $62K area. Buyers are showing interest, but the recovery still needs confirmation.
A move above resistance could improve sentiment. Another rejection may bring fresh selling pressure.
Do you think BTC can regain $65K?
$BTC #bitcoin #crypto #MarketAnalysis
Bitcoin bounced after testing the $62K area. Buyers are showing interest, but the recovery still needs confirmation.
A move above resistance could improve sentiment. Another rejection may bring fresh selling pressure.
Do you think BTC can regain $65K?
$BTC #bitcoin #crypto #MarketAnalysis
35


BITCOIN IS ABOUT TO MELT FACES! 📈🔥
$BTC is coiling like a loaded spring at $64K. When this thing finally explodes, there will be ZERO second chances to buy at these prices.
Pick your side before the next massive candle hits:
$BTC
{spot}(BTCUSDT)
#bitcoin #BTC #LearnWithLedgerLumina
BITCOIN IS ABOUT TO MELT FACES! 📈🔥
$BTC is coiling like a loaded spring at $64K. When this thing finally explodes, there will be ZERO second chances to buy at these prices.
Pick your side before the next massive candle hits:
$BTC
#bitcoin #BTC #LearnWithLedgerLumina
$BTC is coiling like a loaded spring at $64K. When this thing finally explodes, there will be ZERO second chances to buy at these prices.
Pick your side before the next massive candle hits:
$BTC
#bitcoin #BTC #LearnWithLedgerLumina
🚀 $100K+ BY YEAR-END
💎 $80K BREAKOUT
🐻 $55K TRAP
6 day(s) left
3
179


Article
Bitcoin Bear Market Nearing Its End? A Massive Bull Run Could Be Ahead! 🚀Bitcoin's long-term monthly chart is showing an interesting structure that deserves attention.
Looking at previous market cycles, BTC has experienced major corrections followed by powerful bullish expansions. The current price movement could potentially be another important phase in this long-term cycle.
Why Could Bitcoin Be Preparing for Another Bull Run?
📈 1. Long-Term Ascending Channel
Bitcoin has been moving within a broad upward channel over multiple market cycles. The lower boundary could act as an important long-term support zone.
📉 2. Bear Market Exhaustion
After a significant correction, selling pressure may gradually weaken. If buyers regain control and Bitcoin confirms a reversal, the current bearish phase could be approaching its end.
3. The Next 2–3 Years
If historical cycle behavior continues, the next 2–3 years could bring substantial upside potential.
Long-Term Bullish Target: $250K–$500K
A move toward $500,000 is an ambitious long-term scenario, not a guaranteed outcome. It would require strong demand, favorable market conditions, and sustained institutional and investor interest.
My Perspective
I believe Bitcoin deserves serious attention at these long-term levels. Instead of focusing only on short-term volatility, investors should watch the bigger picture.
The bear market may be nearing its final stages, but confirmation is essential.
Stay patient. Manage risk. Think long term.
The next major Bitcoin expansion could be closer than many expect.
#Bitcoin #BTC #Crypto #BullRun #BTC500K #BitcoinAnalysis $BTC
{future}(BTCUSDT)
Bitcoin Bear Market Nearing Its End? A Massive Bull Run Could Be Ahead! 🚀
Bitcoin's long-term monthly chart is showing an interesting structure that deserves attention.
Looking at previous market cycles, BTC has experienced major corrections followed by powerful bullish expansions. The current price movement could potentially be another important phase in this long-term cycle.
Why Could Bitcoin Be Preparing for Another Bull Run?
📈 1. Long-Term Ascending Channel
Bitcoin has been moving within a broad upward channel over multiple market cycles. The lower boundary could act as an important long-term support zone.
📉 2. Bear Market Exhaustion
After a significant correction, selling pressure may gradually weaken. If buyers regain control and Bitcoin confirms a reversal, the current bearish phase could be approaching its end.
3. The Next 2–3 Years
If historical cycle behavior continues, the next 2–3 years could bring substantial upside potential.
Long-Term Bullish Target: $250K–$500K
A move toward $500,000 is an ambitious long-term scenario, not a guaranteed outcome. It would require strong demand, favorable market conditions, and sustained institutional and investor interest.
My Perspective
I believe Bitcoin deserves serious attention at these long-term levels. Instead of focusing only on short-term volatility, investors should watch the bigger picture.
The bear market may be nearing its final stages, but confirmation is essential.
Stay patient. Manage risk. Think long term.
The next major Bitcoin expansion could be closer than many expect.
#Bitcoin #BTC #Crypto #BullRun #BTC500K #BitcoinAnalysis $BTC
Looking at previous market cycles, BTC has experienced major corrections followed by powerful bullish expansions. The current price movement could potentially be another important phase in this long-term cycle.
Why Could Bitcoin Be Preparing for Another Bull Run?
📈 1. Long-Term Ascending Channel
Bitcoin has been moving within a broad upward channel over multiple market cycles. The lower boundary could act as an important long-term support zone.
📉 2. Bear Market Exhaustion
After a significant correction, selling pressure may gradually weaken. If buyers regain control and Bitcoin confirms a reversal, the current bearish phase could be approaching its end.
3. The Next 2–3 Years
If historical cycle behavior continues, the next 2–3 years could bring substantial upside potential.
Long-Term Bullish Target: $250K–$500K
A move toward $500,000 is an ambitious long-term scenario, not a guaranteed outcome. It would require strong demand, favorable market conditions, and sustained institutional and investor interest.
My Perspective
I believe Bitcoin deserves serious attention at these long-term levels. Instead of focusing only on short-term volatility, investors should watch the bigger picture.
The bear market may be nearing its final stages, but confirmation is essential.
Stay patient. Manage risk. Think long term.
The next major Bitcoin expansion could be closer than many expect.
#Bitcoin #BTC #Crypto #BullRun #BTC500K #BitcoinAnalysis $BTC
3
196



·
--
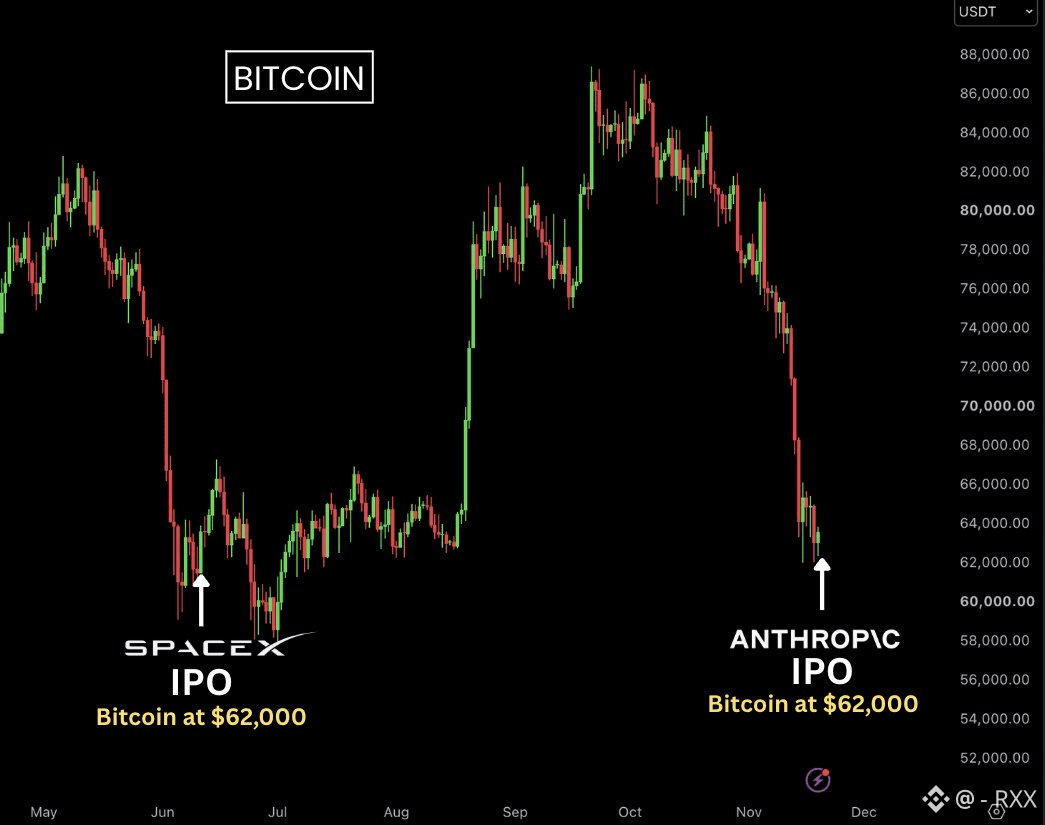
🧩 The last time the chart looked like this…
Ash Crypto compared Bitcoin’s Nov. 19 dip with an earlier setup around a major IPO. When two charts look alike, find the first level where the comparison could fall apart.
Open $BTC on the daily chart. Mark the high and low of the range that formed after the dip, then watch where the next close lands. Check $ETH and $EVAA over the same stretch. Have they started reclaiming their own ranges, or are they still putting in lower highs?
Which would make you take the BTC setup more seriously: a daily close above the range, or both alts breaking out with it?
#Bitcoin #TechnicalAnalysis #PriceAction
🧩 The last time the chart looked like this…
Ash Crypto compared Bitcoin’s Nov. 19 dip with an earlier setup around a major IPO. When two charts look alike, find the first level where the comparison could fall apart.
Open $BTC on the daily chart. Mark the high and low of the range that formed after the dip, then watch where the next close lands. Check $ETH and $EVAA over the same stretch. Have they started reclaiming their own ranges, or are they still putting in lower highs?
Which would make you take the BTC setup more seriously: a daily close above the range, or both alts breaking out with it?
#Bitcoin #TechnicalAnalysis #PriceAction
Ash Crypto compared Bitcoin’s Nov. 19 dip with an earlier setup around a major IPO. When two charts look alike, find the first level where the comparison could fall apart.
Open $BTC on the daily chart. Mark the high and low of the range that formed after the dip, then watch where the next close lands. Check $ETH and $EVAA over the same stretch. Have they started reclaiming their own ranges, or are they still putting in lower highs?
Which would make you take the BTC setup more seriously: a daily close above the range, or both alts breaking out with it?
#Bitcoin #TechnicalAnalysis #PriceAction
1
462

·
--
#BTC – LATEST MARKET ANALYSIS
Bitcoin is trading near $61,823, showing signs of short-term weakness. Sellers are still putting pressure on the market, but buyers may defend the lower support zone.
📊 My Technical Outlook:
Current Price: $61,823
Support Zone: $61,000 – $60,000
Resistance Zone: $63,000 – $64,000
Market Bias: Cautiously Bearish
📉 Bearish Scenario: If BTC loses $60,000, further downside pressure could develop.
📈 Bullish Scenario: A strong breakout and sustained close above $64,000 could signal a recovery.
My Strategy: I would wait for confirmation before taking a trade. Risk management is essential in this volatile market.
#bitcoin n #BTC #CryptoAnalys #CryptoMarket
{spot}(BTCUSDT)
#BTC – LATEST MARKET ANALYSIS
Bitcoin is trading near $61,823, showing signs of short-term weakness. Sellers are still putting pressure on the market, but buyers may defend the lower support zone.
📊 My Technical Outlook:
Current Price: $61,823
Support Zone: $61,000 – $60,000
Resistance Zone: $63,000 – $64,000
Market Bias: Cautiously Bearish
📉 Bearish Scenario: If BTC loses $60,000, further downside pressure could develop.
📈 Bullish Scenario: A strong breakout and sustained close above $64,000 could signal a recovery.
My Strategy: I would wait for confirmation before taking a trade. Risk management is essential in this volatile market.
#bitcoin n #BTC #CryptoAnalys #CryptoMarket
Bitcoin is trading near $61,823, showing signs of short-term weakness. Sellers are still putting pressure on the market, but buyers may defend the lower support zone.
📊 My Technical Outlook:
Current Price: $61,823
Support Zone: $61,000 – $60,000
Resistance Zone: $63,000 – $64,000
Market Bias: Cautiously Bearish
📉 Bearish Scenario: If BTC loses $60,000, further downside pressure could develop.
📈 Bullish Scenario: A strong breakout and sustained close above $64,000 could signal a recovery.
My Strategy: I would wait for confirmation before taking a trade. Risk management is essential in this volatile market.
#bitcoin n #BTC #CryptoAnalys #CryptoMarket

82

$BTC has a potential forced seller to keep an eye on into month-end. CoinDesk reports Trump Media (DJT) could face cash repayment demands of up to $883.5M on Nov 30 from holders of the convertible notes it used to buy bitcoin.
The company already bought back $100M of the notes at a discount and says it wants to pay the rest with cash and credit, not by selling coins or issuing shares. But per CoinDesk it had $393M in cash and short-term investments as of Sept 30, its bitcoin is worth just under $1B, and it warns it may have to sell digital assets if other financing falls short.
I don't think this is a market-breaker on its own, but in a tape with extreme fear, even the headline "treasury company sells $BTC" could hit sentiment hard. Nov 30 is now on my calendar.
Do you think they manage to avoid selling, or does at least part of that bitcoin hit the market?
NFA, just watching the risks.
Source: CoinDesk
#BTC #TrumpMedia #CryptoNews #Bitcoin
$BTC has a potential forced seller to keep an eye on into month-end. CoinDesk reports Trump Media (DJT) could face cash repayment demands of up to $883.5M on Nov 30 from holders of the convertible notes it used to buy bitcoin.
The company already bought back $100M of the notes at a discount and says it wants to pay the rest with cash and credit, not by selling coins or issuing shares. But per CoinDesk it had $393M in cash and short-term investments as of Sept 30, its bitcoin is worth just under $1B, and it warns it may have to sell digital assets if other financing falls short.
I don't think this is a market-breaker on its own, but in a tape with extreme fear, even the headline "treasury company sells $BTC " could hit sentiment hard. Nov 30 is now on my calendar.
Do you think they manage to avoid selling, or does at least part of that bitcoin hit the market?
NFA, just watching the risks.
Source: CoinDesk
#BTC #TrumpMedia #CryptoNews #Bitcoin
The company already bought back $100M of the notes at a discount and says it wants to pay the rest with cash and credit, not by selling coins or issuing shares. But per CoinDesk it had $393M in cash and short-term investments as of Sept 30, its bitcoin is worth just under $1B, and it warns it may have to sell digital assets if other financing falls short.
I don't think this is a market-breaker on its own, but in a tape with extreme fear, even the headline "treasury company sells $BTC " could hit sentiment hard. Nov 30 is now on my calendar.
Do you think they manage to avoid selling, or does at least part of that bitcoin hit the market?
NFA, just watching the risks.
Source: CoinDesk
#BTC #TrumpMedia #CryptoNews #Bitcoin
82

·
--
Bearish
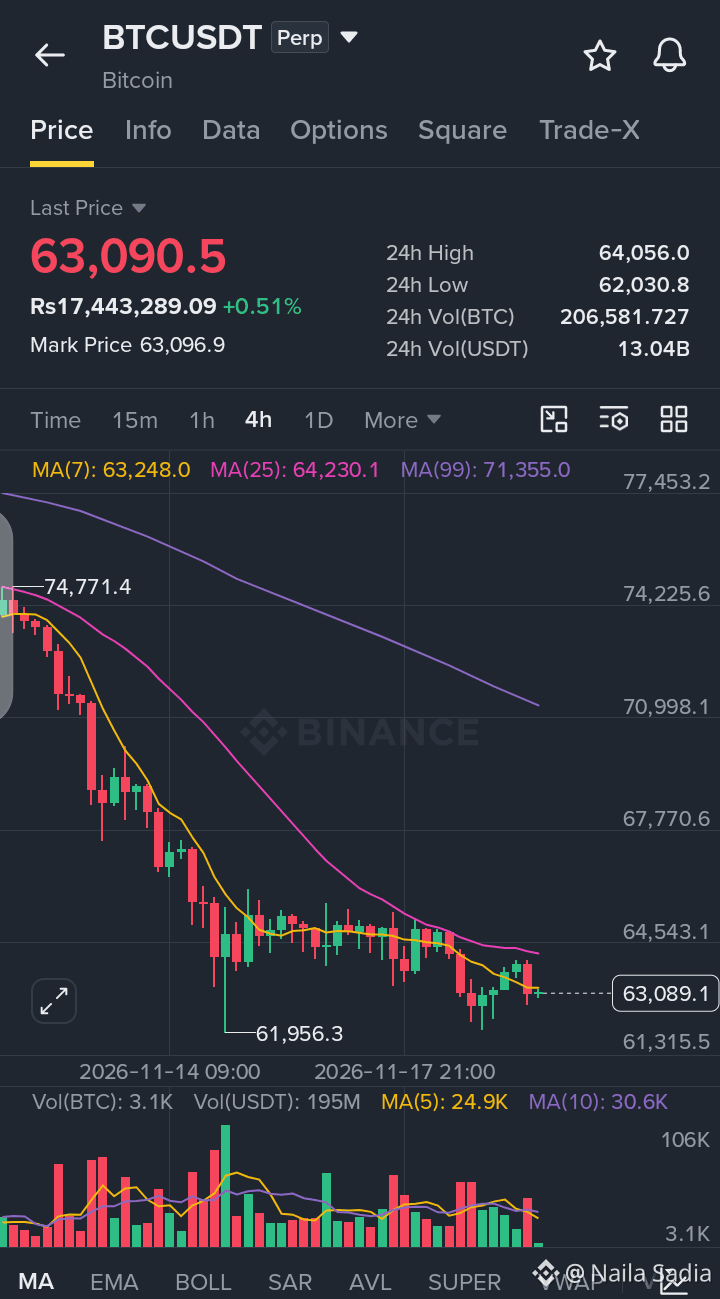
🚨 BTC HOVERING NEAR $63K! WILL SUPPORT HOLD OR CRACK?
$BTC is trading near $63,090.5, up 0.51%. The 4H chart shows price still below all major moving averages (MA 7 at $63,248.0, MA 25 at $64,230.1, and MA 99 at $71,355.0).
📉 Market Outlook: Overall 4H structure stays under pressure below the moving averages. A break below the $62,030.8 low could open further downside toward the $61,956.3 swing low, while reclaiming $64,056.0 resistance may spark a relief bounce.
🎯 TRADE PLAN – SHORT
Entry: $63,300.00–$64,000.00
TP1: $62,100.00
TP2: $61,300.00
SL: $64,600.00
💬 Will $BTC hold above $62K or slide lower from here?
👇 CLICK HERE FOR TRADE
$BTC
{future}(BTCUSDT)
#BTC #bitcoin #CryptoAnalysis #BinanceSquare
🚨 BTC HOVERING NEAR $63K! WILL SUPPORT HOLD OR CRACK?
$BTC is trading near $63,090.5, up 0.51%. The 4H chart shows price still below all major moving averages (MA 7 at $63,248.0, MA 25 at $64,230.1, and MA 99 at $71,355.0).
📉 Market Outlook: Overall 4H structure stays under pressure below the moving averages. A break below the $62,030.8 low could open further downside toward the $61,956.3 swing low, while reclaiming $64,056.0 resistance may spark a relief bounce.
🎯 TRADE PLAN – SHORT
Entry: $63,300.00–$64,000.00
TP1: $62,100.00
TP2: $61,300.00
SL: $64,600.00
💬 Will $BTC hold above $62K or slide lower from here?
👇 CLICK HERE FOR TRADE
$BTC
#BTC #bitcoin #CryptoAnalysis #BinanceSquare
$BTC is trading near $63,090.5, up 0.51%. The 4H chart shows price still below all major moving averages (MA 7 at $63,248.0, MA 25 at $64,230.1, and MA 99 at $71,355.0).
📉 Market Outlook: Overall 4H structure stays under pressure below the moving averages. A break below the $62,030.8 low could open further downside toward the $61,956.3 swing low, while reclaiming $64,056.0 resistance may spark a relief bounce.
🎯 TRADE PLAN – SHORT
Entry: $63,300.00–$64,000.00
TP1: $62,100.00
TP2: $61,300.00
SL: $64,600.00
💬 Will $BTC hold above $62K or slide lower from here?
👇 CLICK HERE FOR TRADE
$BTC
#BTC #bitcoin #CryptoAnalysis #BinanceSquare
99
Log in to explore more content
Join global crypto users on Binance Square
⚡️ Get latest and useful information about crypto.
💬 Trusted by the world’s largest crypto exchange.
👍 Discover real insights from verified creators.
Email / Phone number
Trending Topics
1
#IsAnthropic’s$1.5TMarketCapJustified?
27,142 views
154 Discussing
2
#BTCBelow$62KAmidHikeFearsAndShiftToAnthropic
236 views
4 Discussing
3
#NvidiaBoardReportedlySplitOverHuang’sReturn
152,675 views
1,271 Discussing
4
#CanGTA6'sLaunchLiftTTWOShares?
118,113 views
926 Discussing
5
#LedgerProbesTamperedWalletsInBerlinAndDubai
73 views
10 Discussing
6
#13FInstitutionsBitcoinSpotETPHoldingsHitRecord
4,200 views
77 Discussing
7
#BTCRemainsUnderPressureAfterHawkishFOMCMinutes
308,940 views
2,282 Discussing
8
#StrategySTRCPreferredSlips3.65%Below$100Par
10,840 views
94 Discussing
9
#MASToUpgradeSGDTestnetToSGDigitalLedger
34,176 views
349 Discussing
10
#Solana2027RoadmapTargetsDoubleComputeCapacity
15,987 views
189 Discussing