
#7
7
73,767 views
602 Discussing
Hot
Latest


·
--
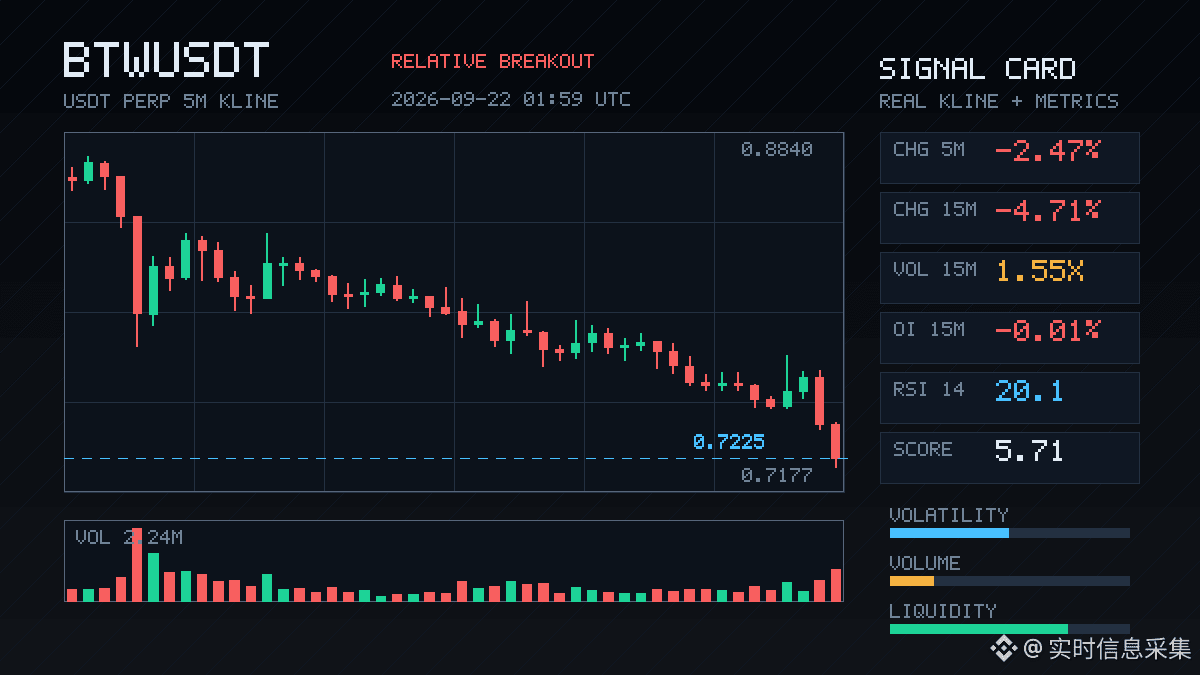
$BTW This 15m move down is pretty sharp—-4.71%. Volume jumped to 1.55x, and it directly broke through the lower edges of nearly 20 consecutive 5m bars.
What’s interesting is the OI: the 15m contract is only -0.01%, while the notional still moved by 5.16M; the 1h contract is even more extreme—-8.82M (-8.07%). When price falls and OI drops, this is the classic deleveraging by longs, not new short positions pressing the move down.
The passive-vs-active trade difference is -10.6%, the buy/sell ratio is 0.81—there is sell pressure, but it’s not that panicky.
The abnormal percentile of OI is 93.1%. In the whole pool, abnormal #7 and notional change #3. Put these data in the entire pool, and it ranks quite high.
My take: it looks more like a drop caused by stop-losses and position contraction, not a trend-driven shorting. In the last 24h, there’s still 167M in trading value, so liquidity is fine. It has hit the boundary of the range—let’s first see if it can hold here.
$BTW This 15m move down is pretty sharp—-4.71%. Volume jumped to 1.55x, and it directly broke through the lower edges of nearly 20 consecutive 5m bars.
What’s interesting is the OI: the 15m contract is only -0.01%, while the notional still moved by 5.16M; the 1h contract is even more extreme—-8.82M (-8.07%). When price falls and OI drops, this is the classic deleveraging by longs, not new short positions pressing the move down.
The passive-vs-active trade difference is -10.6%, the buy/sell ratio is 0.81—there is sell pressure, but it’s not that panicky.
The abnormal percentile of OI is 93.1%. In the whole pool, abnormal #7 and notional change #3. Put these data in the entire pool, and it ranks quite high.
My take: it looks more like a drop caused by stop-losses and position contraction, not a trend-driven shorting. In the last 24h, there’s still 167M in trading value, so liquidity is fine. It has hit the boundary of the range—let’s first see if it can hold here.
What’s interesting is the OI: the 15m contract is only -0.01%, while the notional still moved by 5.16M; the 1h contract is even more extreme—-8.82M (-8.07%). When price falls and OI drops, this is the classic deleveraging by longs, not new short positions pressing the move down.
The passive-vs-active trade difference is -10.6%, the buy/sell ratio is 0.81—there is sell pressure, but it’s not that panicky.
The abnormal percentile of OI is 93.1%. In the whole pool, abnormal #7 and notional change #3. Put these data in the entire pool, and it ranks quite high.
My take: it looks more like a drop caused by stop-losses and position contraction, not a trend-driven shorting. In the last 24h, there’s still 167M in trading value, so liquidity is fine. It has hit the boundary of the range—let’s first see if it can hold here.
36
·
--
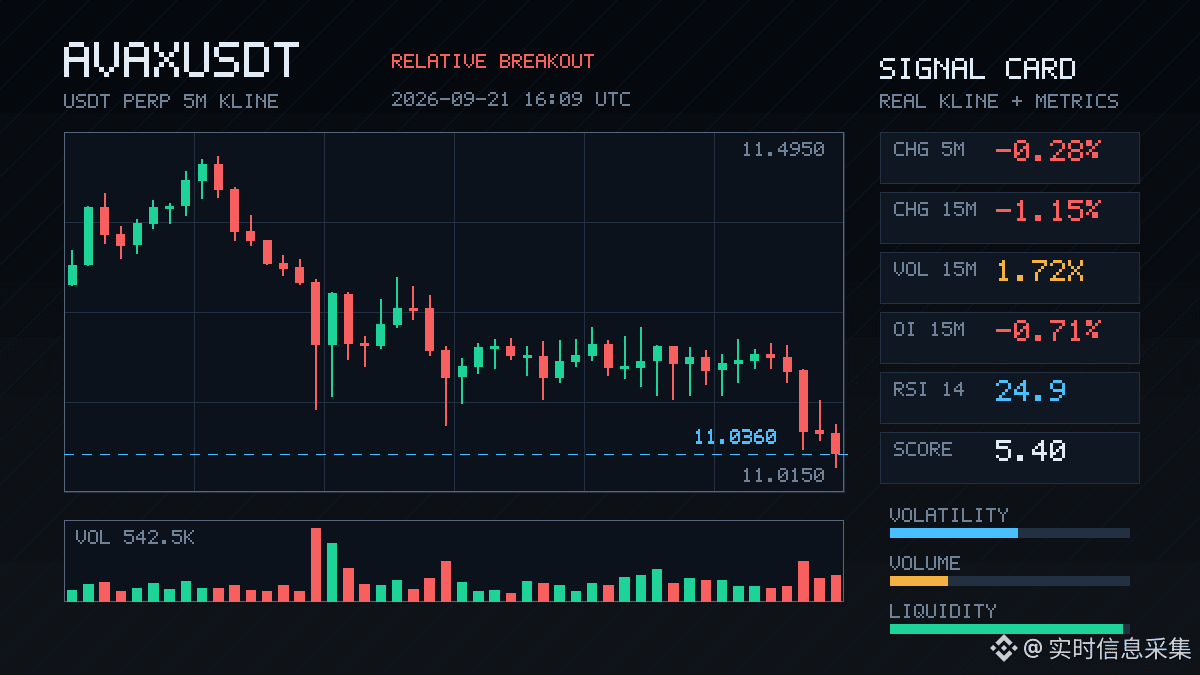
This drop in AVAX doesn’t really look like panic selling and dumping—it looks more like the longs quietly pulled out first.
The 15m timeframe is down 1.15%, and the volume hit 1.72x. Price has broken below the lower band of the last 20 5m candles. But the key thing to notice is OI: 15m -0.71%, 1h -1.90%, with a notional change of -3.91M. Price is down while open interest is also falling. This isn’t fresh shorts entering—it’s older longs de-leveraging, cutting losses, and reducing positions.
The active trade ratio is down -18.9%, the buy/sell ratio is 0.68, and sell pressure does seem to be more aggressive. But overall it looks more like position clearing than a trend-driven short.
The abnormal percentile is 87.3%, ranking #23 in the full pool, notional change #7, and it has continued across multiple consecutive periods. In this kind of structure, I’d wait for OI to stop falling and see whether there’s a rebound opportunity, rather than chasing shorts right now.
This drop in AVAX doesn’t really look like panic selling and dumping—it looks more like the longs quietly pulled out first.
The 15m timeframe is down 1.15%, and the volume hit 1.72x. Price has broken below the lower band of the last 20 5m candles. But the key thing to notice is OI: 15m -0.71%, 1h -1.90%, with a notional change of -3.91M. Price is down while open interest is also falling. This isn’t fresh shorts entering—it’s older longs de-leveraging, cutting losses, and reducing positions.
The active trade ratio is down -18.9%, the buy/sell ratio is 0.68, and sell pressure does seem to be more aggressive. But overall it looks more like position clearing than a trend-driven short.
The abnormal percentile is 87.3%, ranking #23 in the full pool, notional change #7, and it has continued across multiple consecutive periods. In this kind of structure, I’d wait for OI to stop falling and see whether there’s a rebound opportunity, rather than chasing shorts right now.
The 15m timeframe is down 1.15%, and the volume hit 1.72x. Price has broken below the lower band of the last 20 5m candles. But the key thing to notice is OI: 15m -0.71%, 1h -1.90%, with a notional change of -3.91M. Price is down while open interest is also falling. This isn’t fresh shorts entering—it’s older longs de-leveraging, cutting losses, and reducing positions.
The active trade ratio is down -18.9%, the buy/sell ratio is 0.68, and sell pressure does seem to be more aggressive. But overall it looks more like position clearing than a trend-driven short.
The abnormal percentile is 87.3%, ranking #23 in the full pool, notional change #7, and it has continued across multiple consecutive periods. In this kind of structure, I’d wait for OI to stop falling and see whether there’s a rebound opportunity, rather than chasing shorts right now.
197

·
--
See translation
$SPX 这波有点意思,15m 直接拉了 3.12%,量干到 3.94 倍,Z 值 3.76,不是那种阴跌之后的反抽,是带量往上打的。
盯一眼结构:价格涨 + OI 同步增,15m 合约 +1.40%,新增 220K U,典型的杠杆多头进场,不是空头回补硬拉。主动买卖比 1.44,主动成交差 18.2%,买盘有偏向,收盘还站上了近 20 根 5m 的上沿。
更在意的是 OI 异常分位干到 100%,全池异常 #7,而且连续多个周期在延续——这种位置要么是启动前的深水确认,要么就是给追多的人埋雷。
资金费率已经在近期高分位了,多头有点挤。24h 成交额才 10.63M,池子还不算深,真起来容易被推着走,反过来踩踏也快。
我不过度解读,先看能不能站稳这个突破位,站不稳就是假动作,站稳了再谈延续。别 FOMO,仓位留点余地。
$SPX 这波有点意思,15m 直接拉了 3.12%,量干到 3.94 倍,Z 值 3.76,不是那种阴跌之后的反抽,是带量往上打的。
盯一眼结构:价格涨 + OI 同步增,15m 合约 +1.40%,新增 220K U,典型的杠杆多头进场,不是空头回补硬拉。主动买卖比 1.44,主动成交差 18.2%,买盘有偏向,收盘还站上了近 20 根 5m 的上沿。
更在意的是 OI 异常分位干到 100%,全池异常 #7,而且连续多个周期在延续——这种位置要么是启动前的深水确认,要么就是给追多的人埋雷。
资金费率已经在近期高分位了,多头有点挤。24h 成交额才 10.63M,池子还不算深,真起来容易被推着走,反过来踩踏也快。
我不过度解读,先看能不能站稳这个突破位,站不稳就是假动作,站稳了再谈延续。别 FOMO,仓位留点余地。
盯一眼结构:价格涨 + OI 同步增,15m 合约 +1.40%,新增 220K U,典型的杠杆多头进场,不是空头回补硬拉。主动买卖比 1.44,主动成交差 18.2%,买盘有偏向,收盘还站上了近 20 根 5m 的上沿。
更在意的是 OI 异常分位干到 100%,全池异常 #7,而且连续多个周期在延续——这种位置要么是启动前的深水确认,要么就是给追多的人埋雷。
资金费率已经在近期高分位了,多头有点挤。24h 成交额才 10.63M,池子还不算深,真起来容易被推着走,反过来踩踏也快。
我不过度解读,先看能不能站稳这个突破位,站不稳就是假动作,站稳了再谈延续。别 FOMO,仓位留点余地。
3
·
--
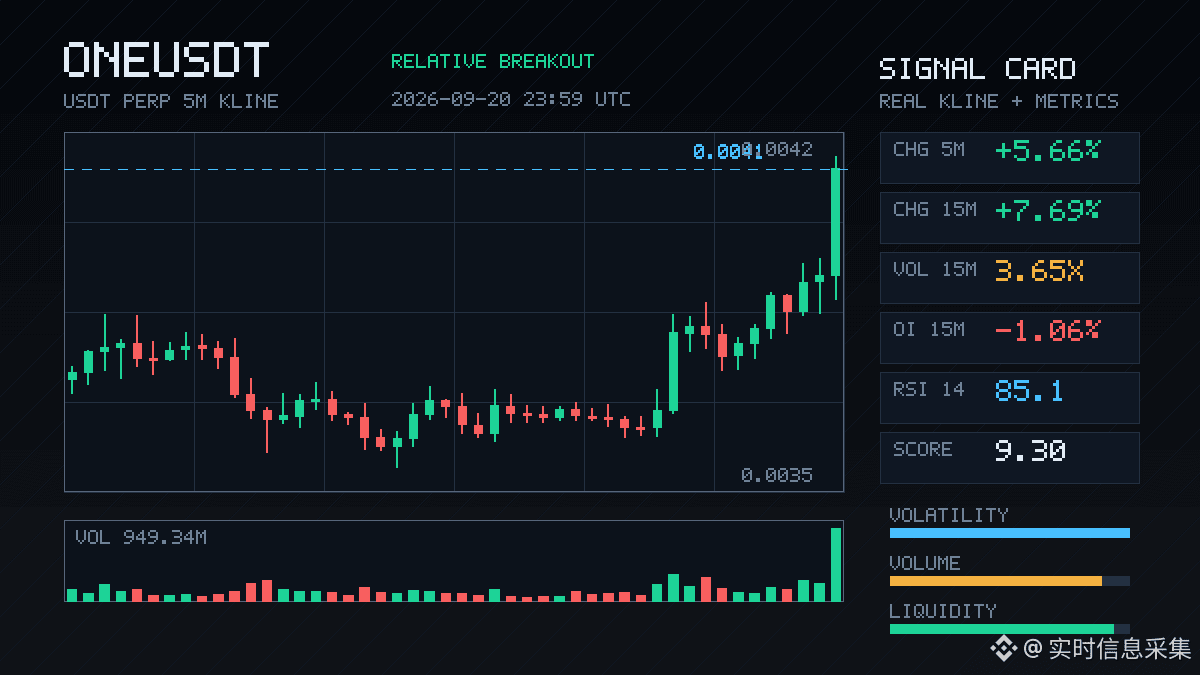
$ONE This move in the 15m timeframe is up 7.69%. Volume surged directly to 3.65x, with a Z-value of 3.99—typical abnormal activity.
But here’s what’s interesting: OI is falling—15m -1.06%, 1h -1.04%. As price moves up, the contract open interest actually decreases. This structure is very likely short-covering pushing prices higher, not fresh long entries. The buy/sell ratio is 1.21, and the trade gap is 9.5%. Buyers are definitely absorbing, but it feels more like a squeeze than genuine new longs.
The close has already broken above the upper band of the last 20 consecutive 5m candles. In the past 24h, turnover is 616 million, and the depth is sufficient. The anomaly for the whole pool ranks #7, with nominal change #6—this isn’t small-scale.
In this kind of short-covering move, chasing higher needs caution. Once the shorts are fully covered, the momentum could quickly run out. Let’s see whether it can hold above the upper band first.
$ONE This move in the 15m timeframe is up 7.69%. Volume surged directly to 3.65x, with a Z-value of 3.99—typical abnormal activity.
But here’s what’s interesting: OI is falling—15m -1.06%, 1h -1.04%. As price moves up, the contract open interest actually decreases. This structure is very likely short-covering pushing prices higher, not fresh long entries. The buy/sell ratio is 1.21, and the trade gap is 9.5%. Buyers are definitely absorbing, but it feels more like a squeeze than genuine new longs.
The close has already broken above the upper band of the last 20 consecutive 5m candles. In the past 24h, turnover is 616 million, and the depth is sufficient. The anomaly for the whole pool ranks #7, with nominal change #6—this isn’t small-scale.
In this kind of short-covering move, chasing higher needs caution. Once the shorts are fully covered, the momentum could quickly run out. Let’s see whether it can hold above the upper band first.
But here’s what’s interesting: OI is falling—15m -1.06%, 1h -1.04%. As price moves up, the contract open interest actually decreases. This structure is very likely short-covering pushing prices higher, not fresh long entries. The buy/sell ratio is 1.21, and the trade gap is 9.5%. Buyers are definitely absorbing, but it feels more like a squeeze than genuine new longs.
The close has already broken above the upper band of the last 20 consecutive 5m candles. In the past 24h, turnover is 616 million, and the depth is sufficient. The anomaly for the whole pool ranks #7, with nominal change #6—this isn’t small-scale.
In this kind of short-covering move, chasing higher needs caution. Once the shorts are fully covered, the momentum could quickly run out. Let’s see whether it can hold above the upper band first.
76
·
--
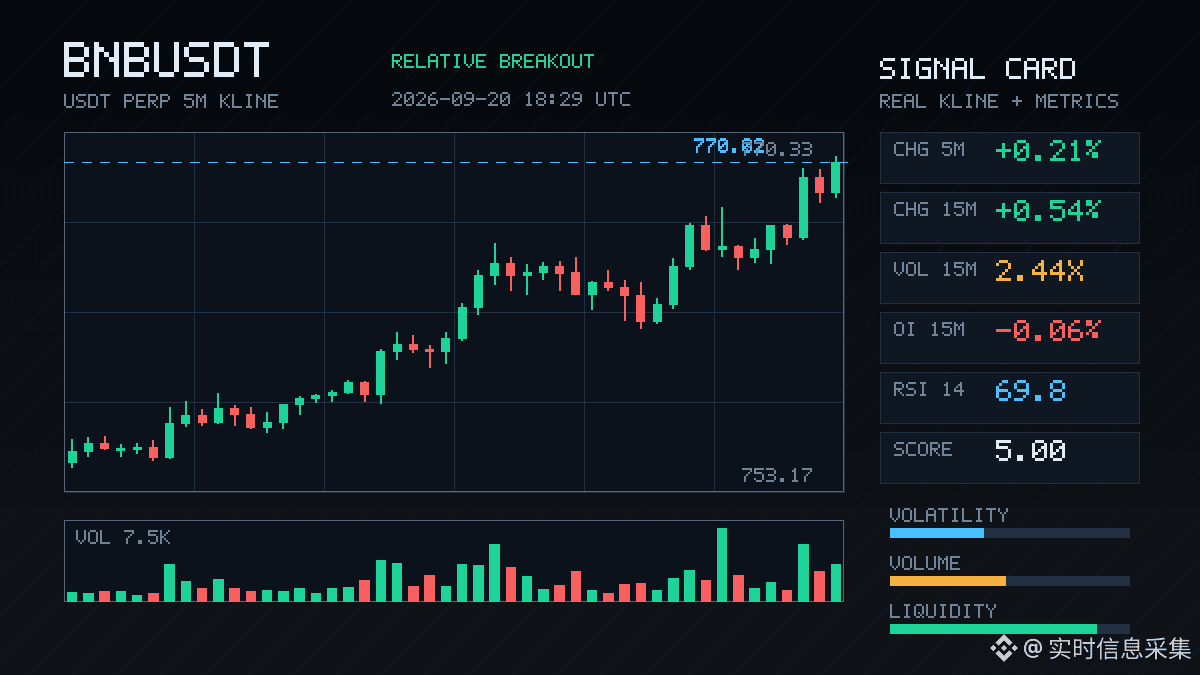
BNB—this 15m has something going on.
The move went straight to 2.44x. Price broke above the upper bound of nearly 20 prior 5m candles. The aggressive buy/sell ratio is 1.34, with the bids noticeably heavier. But what’s interesting is the OI: the 15m contract is -0.06%, while the notional is still slightly up; only after 1h does it turn +0.72%. As price pushes higher, positions aren’t piling on alongside it. The structure looks more like shorts are being pushed to cover, rather than brand-new longs entering.
At an abnormal percentile of 92.5%, the overall pool’s notional change ranks #7. Over the past 24h, turnover is 376 million, and the order book depth is sufficient.
This isn’t the kind of single-wick spike situation. It’s a market that got pushed upward on short-covering—once it holds, then we’ll see the next leg. $BNB
BNB—this 15m has something going on.
The move went straight to 2.44x. Price broke above the upper bound of nearly 20 prior 5m candles. The aggressive buy/sell ratio is 1.34, with the bids noticeably heavier. But what’s interesting is the OI: the 15m contract is -0.06%, while the notional is still slightly up; only after 1h does it turn +0.72%. As price pushes higher, positions aren’t piling on alongside it. The structure looks more like shorts are being pushed to cover, rather than brand-new longs entering.
At an abnormal percentile of 92.5%, the overall pool’s notional change ranks #7. Over the past 24h, turnover is 376 million, and the order book depth is sufficient.
This isn’t the kind of single-wick spike situation. It’s a market that got pushed upward on short-covering—once it holds, then we’ll see the next leg. $BNB
The move went straight to 2.44x. Price broke above the upper bound of nearly 20 prior 5m candles. The aggressive buy/sell ratio is 1.34, with the bids noticeably heavier. But what’s interesting is the OI: the 15m contract is -0.06%, while the notional is still slightly up; only after 1h does it turn +0.72%. As price pushes higher, positions aren’t piling on alongside it. The structure looks more like shorts are being pushed to cover, rather than brand-new longs entering.
At an abnormal percentile of 92.5%, the overall pool’s notional change ranks #7. Over the past 24h, turnover is 376 million, and the order book depth is sufficient.
This isn’t the kind of single-wick spike situation. It’s a market that got pushed upward on short-covering—once it holds, then we’ll see the next leg. $BNB
12

·
--
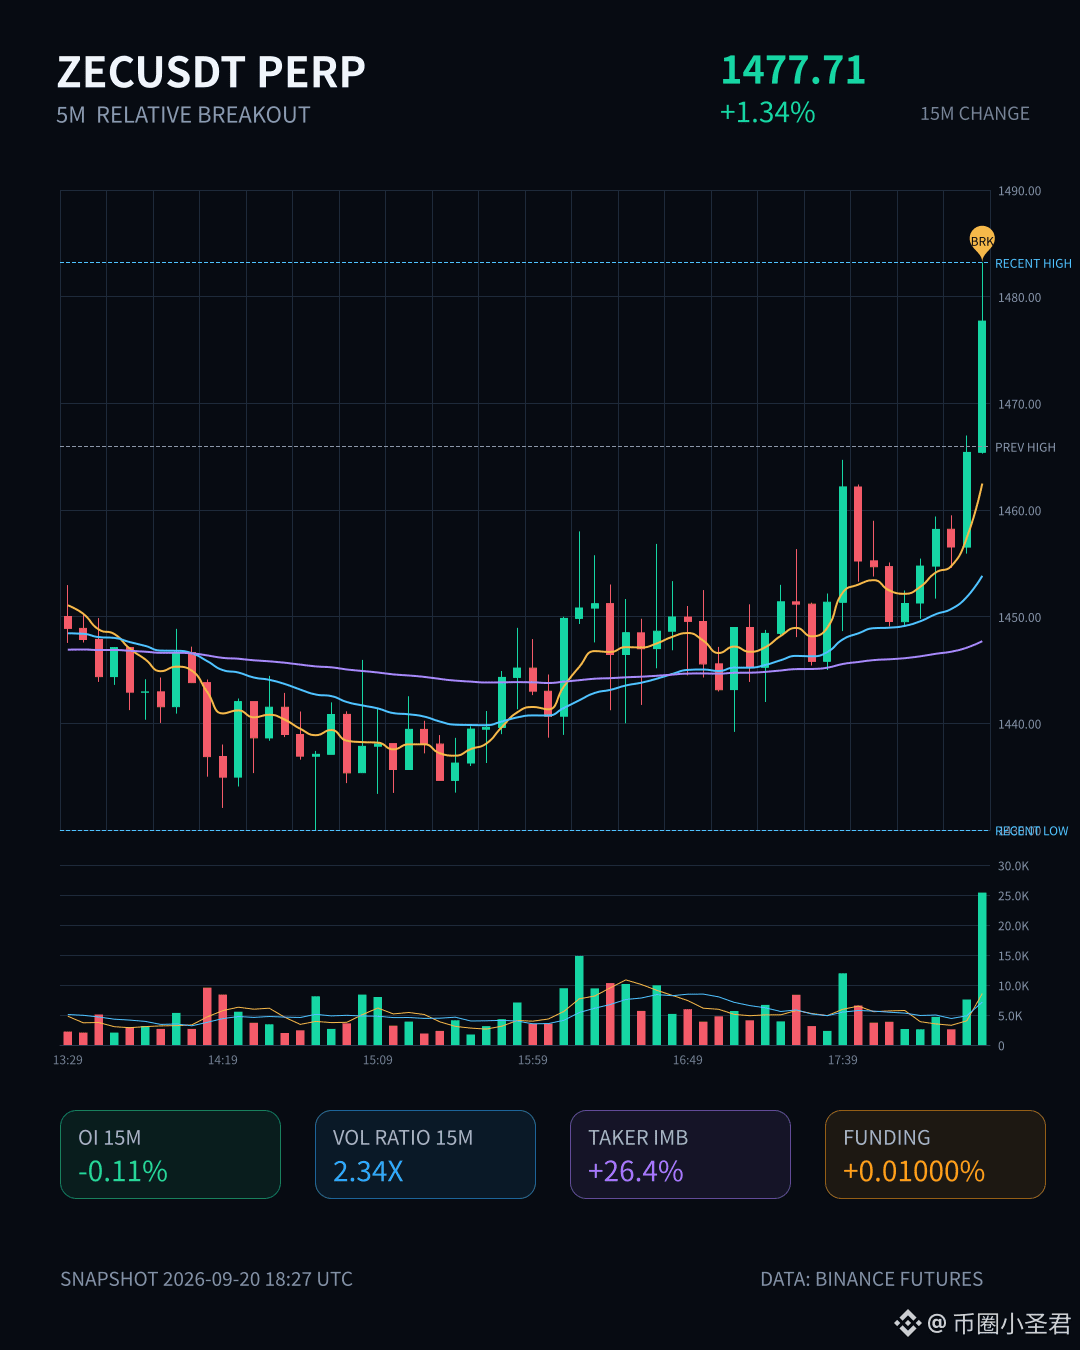
20 pieces, the top edge of the 5m box was just eaten. ZEC came in with 2.34 times the amount, and the Z value surged to 3.82.
What’s interesting is the OI: over 15m it’s down 0.11%, yet the notional is +8.61M. It only flipped to positive at +0.19% after 1h. Price is moving upward while contracts are declining—this isn’t fresh longs entering; it’s shorts being pulled along to cover.
Aggressive buying makes up 26.4%, the buy/sell ratio is 1.72, and the single-direction intent is very clear. Volume is higher than normal—across the whole pool the abnormality ranks #7, notional change ranks #3, in the 96.4 percentile. The 24h turnover of +1.93 billion is propping this up, which shows this isn’t just small-scale action.
Just a reminder: a covering-type move is fast, and it also retraces fast. I won’t chase at this position—let it pull back to the top edge and confirm before we talk.
20 pieces, the top edge of the 5m box was just eaten. ZEC came in with 2.34 times the amount, and the Z value surged to 3.82.
What’s interesting is the OI: over 15m it’s down 0.11%, yet the notional is +8.61M. It only flipped to positive at +0.19% after 1h. Price is moving upward while contracts are declining—this isn’t fresh longs entering; it’s shorts being pulled along to cover.
Aggressive buying makes up 26.4%, the buy/sell ratio is 1.72, and the single-direction intent is very clear. Volume is higher than normal—across the whole pool the abnormality ranks #7, notional change ranks #3, in the 96.4 percentile. The 24h turnover of +1.93 billion is propping this up, which shows this isn’t just small-scale action.
Just a reminder: a covering-type move is fast, and it also retraces fast. I won’t chase at this position—let it pull back to the top edge and confirm before we talk.
What’s interesting is the OI: over 15m it’s down 0.11%, yet the notional is +8.61M. It only flipped to positive at +0.19% after 1h. Price is moving upward while contracts are declining—this isn’t fresh longs entering; it’s shorts being pulled along to cover.
Aggressive buying makes up 26.4%, the buy/sell ratio is 1.72, and the single-direction intent is very clear. Volume is higher than normal—across the whole pool the abnormality ranks #7, notional change ranks #3, in the 96.4 percentile. The 24h turnover of +1.93 billion is propping this up, which shows this isn’t just small-scale action.
Just a reminder: a covering-type move is fast, and it also retraces fast. I won’t chase at this position—let it pull back to the top edge and confirm before we talk.
227
·
--
$MORPHO This move is a bit too fast. In 15 minutes it pushed directly up 2.86%, with volume reaching 4.92 times the usual level; the volatility Z-value is 5.09. This kind of volume-price coordination can’t be created just by slapping in random orders.
What’s interesting is that OI is actually dropping. For the 15m contract, OI is -0.24%, and for 1h it’s -0.33%—though the notional is still positive. Price is rising while OI falls, which forms the classic short-covering structure: it’s not fresh longs opening positions—it’s shorts being forced to close. After breaking above the recent upper boundary of about 20 consecutive 5m candles, active traded volume is ahead by 8.1%, the buy-sell ratio is 1.18, and the buy side really is chasing.
OI percentile is at 99%, the entire pool’s anomaly is #7, and the funding rate is also near a high percentile recently—suggesting that longs are already a bit crowded at this point. The 24h trading value is close to 20 million, and the depth is there. But whether this 15m burst of volume at this level is the start of something or the final push depends on whether it can hold steady going forward.
A market pushed up by short covering often moves quickly and sharply, but its staying power depends on whether new money keeps buying. Keep an eye on it—don’t rush to chase.
$MORPHO This move is a bit too fast. In 15 minutes it pushed directly up 2.86%, with volume reaching 4.92 times the usual level; the volatility Z-value is 5.09. This kind of volume-price coordination can’t be created just by slapping in random orders.
What’s interesting is that OI is actually dropping. For the 15m contract, OI is -0.24%, and for 1h it’s -0.33%—though the notional is still positive. Price is rising while OI falls, which forms the classic short-covering structure: it’s not fresh longs opening positions—it’s shorts being forced to close. After breaking above the recent upper boundary of about 20 consecutive 5m candles, active traded volume is ahead by 8.1%, the buy-sell ratio is 1.18, and the buy side really is chasing.
OI percentile is at 99%, the entire pool’s anomaly is #7, and the funding rate is also near a high percentile recently—suggesting that longs are already a bit crowded at this point. The 24h trading value is close to 20 million, and the depth is there. But whether this 15m burst of volume at this level is the start of something or the final push depends on whether it can hold steady going forward.
A market pushed up by short covering often moves quickly and sharply, but its staying power depends on whether new money keeps buying. Keep an eye on it—don’t rush to chase.
What’s interesting is that OI is actually dropping. For the 15m contract, OI is -0.24%, and for 1h it’s -0.33%—though the notional is still positive. Price is rising while OI falls, which forms the classic short-covering structure: it’s not fresh longs opening positions—it’s shorts being forced to close. After breaking above the recent upper boundary of about 20 consecutive 5m candles, active traded volume is ahead by 8.1%, the buy-sell ratio is 1.18, and the buy side really is chasing.
OI percentile is at 99%, the entire pool’s anomaly is #7, and the funding rate is also near a high percentile recently—suggesting that longs are already a bit crowded at this point. The 24h trading value is close to 20 million, and the depth is there. But whether this 15m burst of volume at this level is the start of something or the final push depends on whether it can hold steady going forward.
A market pushed up by short covering often moves quickly and sharply, but its staying power depends on whether new money keeps buying. Keep an eye on it—don’t rush to chase.
9

·
--
$AVAX This is a bit interesting. On the 15m, it’s up 1.48% on volume of 1.71x, with the active buy/sell ratio at 1.39. It breaks above the upper edge of the past 20 5m bars—no fake-out like a one-and-done trick.
More importantly is OI: on the 15m, +0.71%; on the 1h, +0.45%. The nominal changes are all at the 2M+ level. The abnormal percentile reaches 95.4%, ranking #7 in the whole pool. Price rises together with OI, and new leveraged long positions are added—this isn’t the kind of move that comes from shorts covering in one burst.
The continuation across multiple consecutive cycles is there, and the funding rate has also climbed to a high percentile recently. Emotionally it does show signs of getting overheated, but as long as the structure hasn’t turned bad, I’m inclined to respect the trend.
Keep watching whether it can hold the upper edge of this range. If it can’t, that’s another story.
$AVAX This is a bit interesting. On the 15m, it’s up 1.48% on volume of 1.71x, with the active buy/sell ratio at 1.39. It breaks above the upper edge of the past 20 5m bars—no fake-out like a one-and-done trick.
More importantly is OI: on the 15m, +0.71%; on the 1h, +0.45%. The nominal changes are all at the 2M+ level. The abnormal percentile reaches 95.4%, ranking #7 in the whole pool. Price rises together with OI, and new leveraged long positions are added—this isn’t the kind of move that comes from shorts covering in one burst.
The continuation across multiple consecutive cycles is there, and the funding rate has also climbed to a high percentile recently. Emotionally it does show signs of getting overheated, but as long as the structure hasn’t turned bad, I’m inclined to respect the trend.
Keep watching whether it can hold the upper edge of this range. If it can’t, that’s another story.
More importantly is OI: on the 15m, +0.71%; on the 1h, +0.45%. The nominal changes are all at the 2M+ level. The abnormal percentile reaches 95.4%, ranking #7 in the whole pool. Price rises together with OI, and new leveraged long positions are added—this isn’t the kind of move that comes from shorts covering in one burst.
The continuation across multiple consecutive cycles is there, and the funding rate has also climbed to a high percentile recently. Emotionally it does show signs of getting overheated, but as long as the structure hasn’t turned bad, I’m inclined to respect the trend.
Keep watching whether it can hold the upper edge of this range. If it can’t, that’s another story.
8

Article
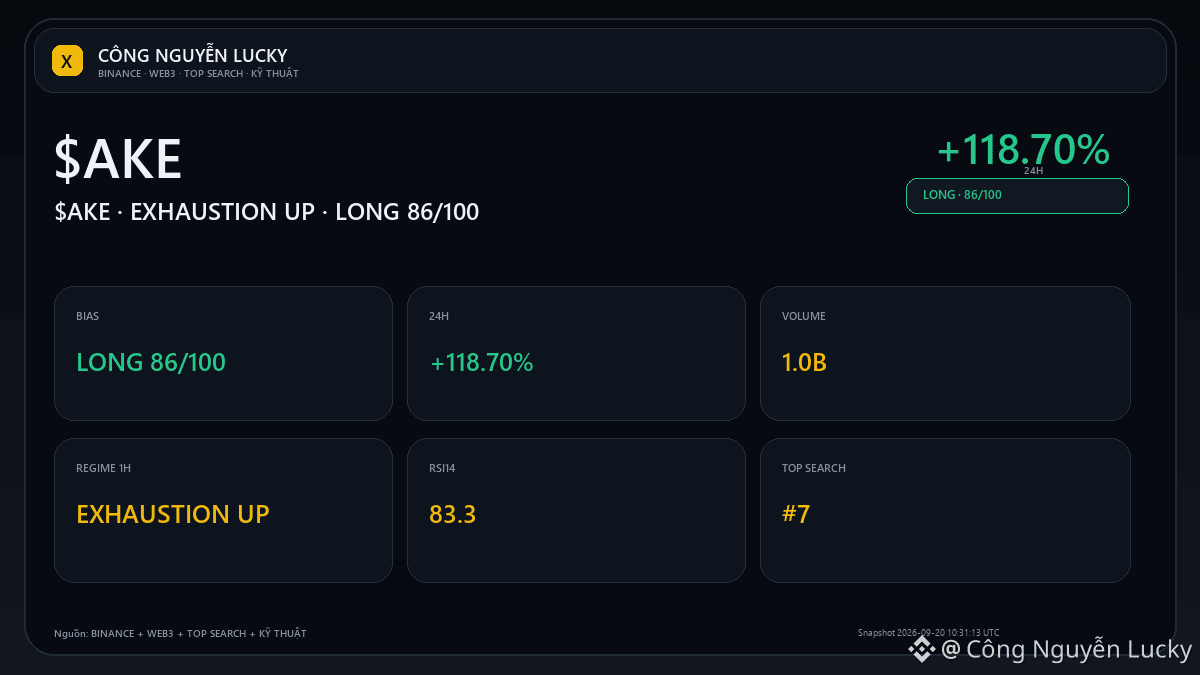
$AKE: price action none reliable?🔥 $AKE đang +118.70% — but the percentage increase/decrease isn’t enough to call this a good setup yet. Market: 0.141323 · 24h +118.70% · volume ~1,003.0M USDT · 16,129,874 trades.
Technical bias LONG 99/100 · support 0.05501 · resistance 0.0885. The candlestick pattern is only meaningful when it appears in the correct structural position and is confirmed by the next candle/volume; if not, ignore it. The technical levels are selected according to the prevailing regime:
$AKE: price action none reliable?
🔥 $AKE đang +118.70% — but the percentage increase/decrease isn’t enough to call this a good setup yet. Market: 0.141323 · 24h +118.70% · volume ~1,003.0M USDT · 16,129,874 trades.
Technical bias LONG 99/100 · support 0.05501 · resistance 0.0885. The candlestick pattern is only meaningful when it appears in the correct structural position and is confirmed by the next candle/volume; if not, ignore it. The technical levels are selected according to the prevailing regime:
Technical bias LONG 99/100 · support 0.05501 · resistance 0.0885. The candlestick pattern is only meaningful when it appears in the correct structural position and is confirmed by the next candle/volume; if not, ignore it. The technical levels are selected according to the prevailing regime:
26
·
--
$MORPHO This move has something to it.
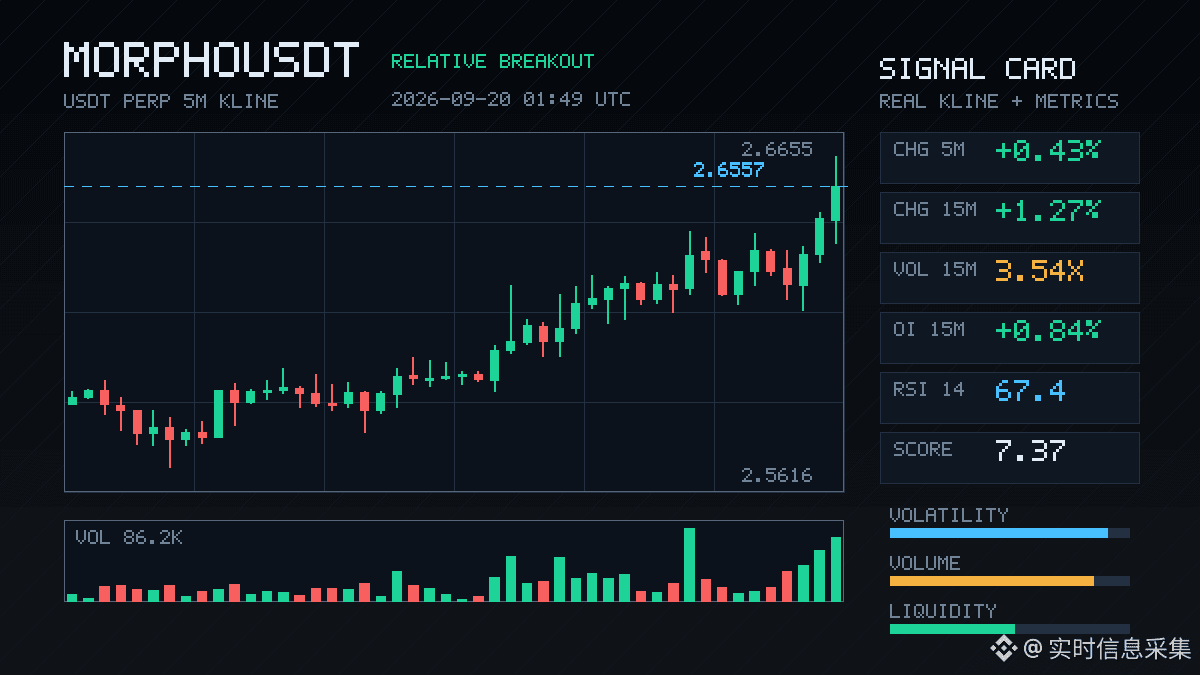
On the 15m chart it rose 1.27%, and the volume directly hit 3.54x, with a Z value of 3.62—this isn’t the kind of slow, steady grind upward; there’s real money pushing it. The close also broke above the upper boundary of the recent 20 5m candles.
More importantly, OI: on the 15m +0.84%, on the 1h +0.98%. The notional changes have been increasing all the way, with an abnormal percentile of 98.4%, ranking #7 across the entire pool. Price is rising while OI is rising—this is classic incremental-leverage longs entering, not the “shorts covering” playbook.
Active trade imbalance is -22.9%, the buy/sell ratio is 1.59, and the funding rate is also pushed up to a recent high percentile—the long-side sentiment is already crowded. If several consecutive cycles keep extending, the fundamentals that should be confirmed in the depth confirmation are probably all in place.
Approaching its own historical extreme range: at a spot like this, it either accelerates, or it’s setting up a mine for later. Keep a close eye on it.
$MORPHO This move has something to it.
On the 15m chart it rose 1.27%, and the volume directly hit 3.54x, with a Z value of 3.62—this isn’t the kind of slow, steady grind upward; there’s real money pushing it. The close also broke above the upper boundary of the recent 20 5m candles.
More importantly, OI: on the 15m +0.84%, on the 1h +0.98%. The notional changes have been increasing all the way, with an abnormal percentile of 98.4%, ranking #7 across the entire pool. Price is rising while OI is rising—this is classic incremental-leverage longs entering, not the “shorts covering” playbook.
Active trade imbalance is -22.9%, the buy/sell ratio is 1.59, and the funding rate is also pushed up to a recent high percentile—the long-side sentiment is already crowded. If several consecutive cycles keep extending, the fundamentals that should be confirmed in the depth confirmation are probably all in place.
Approaching its own historical extreme range: at a spot like this, it either accelerates, or it’s setting up a mine for later. Keep a close eye on it.
On the 15m chart it rose 1.27%, and the volume directly hit 3.54x, with a Z value of 3.62—this isn’t the kind of slow, steady grind upward; there’s real money pushing it. The close also broke above the upper boundary of the recent 20 5m candles.
More importantly, OI: on the 15m +0.84%, on the 1h +0.98%. The notional changes have been increasing all the way, with an abnormal percentile of 98.4%, ranking #7 across the entire pool. Price is rising while OI is rising—this is classic incremental-leverage longs entering, not the “shorts covering” playbook.
Active trade imbalance is -22.9%, the buy/sell ratio is 1.59, and the funding rate is also pushed up to a recent high percentile—the long-side sentiment is already crowded. If several consecutive cycles keep extending, the fundamentals that should be confirmed in the depth confirmation are probably all in place.
Approaching its own historical extreme range: at a spot like this, it either accelerates, or it’s setting up a mine for later. Keep a close eye on it.
50

·
--
$LA This drop doesn’t look like new shorts just entering; it looks more like longs de-leveraging.
On the 15m timeframe, it’s down 0.89%, and volume has expanded to 2.06x, but OI is also falling—15m -0.41%, 1h -1.53%, with notional down by 160k U. Price has broken through the lower edge of the recent 5m range spanning about 20 candles; active trade volume is down -25.4%, the buy/sell ratio is 0.60, and sell pressure is in control, yet positions are shrinking. This setup looks more like stop-losses getting triggered and positions running for cover, rather than someone placing a large short build at this level.
The OI percentile is 91.5%, pool #7, and the depth has been confirmed. First, see whether this de-leveraging move can stabilize near the lower edge of the range; if it can’t, there’s still another leg ahead.
$LA This drop doesn’t look like new shorts just entering; it looks more like longs de-leveraging.
On the 15m timeframe, it’s down 0.89%, and volume has expanded to 2.06x, but OI is also falling—15m -0.41%, 1h -1.53%, with notional down by 160k U. Price has broken through the lower edge of the recent 5m range spanning about 20 candles; active trade volume is down -25.4%, the buy/sell ratio is 0.60, and sell pressure is in control, yet positions are shrinking. This setup looks more like stop-losses getting triggered and positions running for cover, rather than someone placing a large short build at this level.
The OI percentile is 91.5%, pool #7, and the depth has been confirmed. First, see whether this de-leveraging move can stabilize near the lower edge of the range; if it can’t, there’s still another leg ahead.
On the 15m timeframe, it’s down 0.89%, and volume has expanded to 2.06x, but OI is also falling—15m -0.41%, 1h -1.53%, with notional down by 160k U. Price has broken through the lower edge of the recent 5m range spanning about 20 candles; active trade volume is down -25.4%, the buy/sell ratio is 0.60, and sell pressure is in control, yet positions are shrinking. This setup looks more like stop-losses getting triggered and positions running for cover, rather than someone placing a large short build at this level.
The OI percentile is 91.5%, pool #7, and the depth has been confirmed. First, see whether this de-leveraging move can stabilize near the lower edge of the range; if it can’t, there’s still another leg ahead.
30
·
--
$F This hit is a bit brutal.
In 15m, it directly dropped 2.94%—the volume spiked to 8.17x, with a Z value of 4.80. This isn’t normal fluctuation; someone was running for the exits first.
More importantly, look at OI: in the 15m contracts, open interest fell -4.83%, notional change -376K. It also dropped by 2.47% in the 1h. Price down while OI is also down—this is classic deleveraging. It’s not fresh shorts coming in to smash the market; it’s longs themselves backing out, cutting losses, and getting liquidated.
Aggressive volume was down -29.2%, buy/sell ratio 0.55—sell pressure clearly dominates. Even at close, it broke below the lower edge of the last ~20 5m K-bars. The recent range has been cleanly breached. Funding rate is still in the high percentile lately—before, longs were overcrowded; now, they’re feeling miserable.
24h trading value is 89M. Liquidity isn’t too bad, but the OI percentile is abnormally high at 96.2%—the whole pool’s anomaly is #7. This suggests the magnitude of this position contraction is among the most significant in the pool.
See if this move can be contained first—don’t rush to catch it. In the second half of a deleveraging, it’s usually quieter than the first, but it’s also more painful than the first.
$F This hit is a bit brutal.
In 15m, it directly dropped 2.94%—the volume spiked to 8.17x, with a Z value of 4.80. This isn’t normal fluctuation; someone was running for the exits first.
More importantly, look at OI: in the 15m contracts, open interest fell -4.83%, notional change -376K. It also dropped by 2.47% in the 1h. Price down while OI is also down—this is classic deleveraging. It’s not fresh shorts coming in to smash the market; it’s longs themselves backing out, cutting losses, and getting liquidated.
Aggressive volume was down -29.2%, buy/sell ratio 0.55—sell pressure clearly dominates. Even at close, it broke below the lower edge of the last ~20 5m K-bars. The recent range has been cleanly breached. Funding rate is still in the high percentile lately—before, longs were overcrowded; now, they’re feeling miserable.
24h trading value is 89M. Liquidity isn’t too bad, but the OI percentile is abnormally high at 96.2%—the whole pool’s anomaly is #7. This suggests the magnitude of this position contraction is among the most significant in the pool.
See if this move can be contained first—don’t rush to catch it. In the second half of a deleveraging, it’s usually quieter than the first, but it’s also more painful than the first.
In 15m, it directly dropped 2.94%—the volume spiked to 8.17x, with a Z value of 4.80. This isn’t normal fluctuation; someone was running for the exits first.
More importantly, look at OI: in the 15m contracts, open interest fell -4.83%, notional change -376K. It also dropped by 2.47% in the 1h. Price down while OI is also down—this is classic deleveraging. It’s not fresh shorts coming in to smash the market; it’s longs themselves backing out, cutting losses, and getting liquidated.
Aggressive volume was down -29.2%, buy/sell ratio 0.55—sell pressure clearly dominates. Even at close, it broke below the lower edge of the last ~20 5m K-bars. The recent range has been cleanly breached. Funding rate is still in the high percentile lately—before, longs were overcrowded; now, they’re feeling miserable.
24h trading value is 89M. Liquidity isn’t too bad, but the OI percentile is abnormally high at 96.2%—the whole pool’s anomaly is #7. This suggests the magnitude of this position contraction is among the most significant in the pool.
See if this move can be contained first—don’t rush to catch it. In the second half of a deleveraging, it’s usually quieter than the first, but it’s also more painful than the first.
41

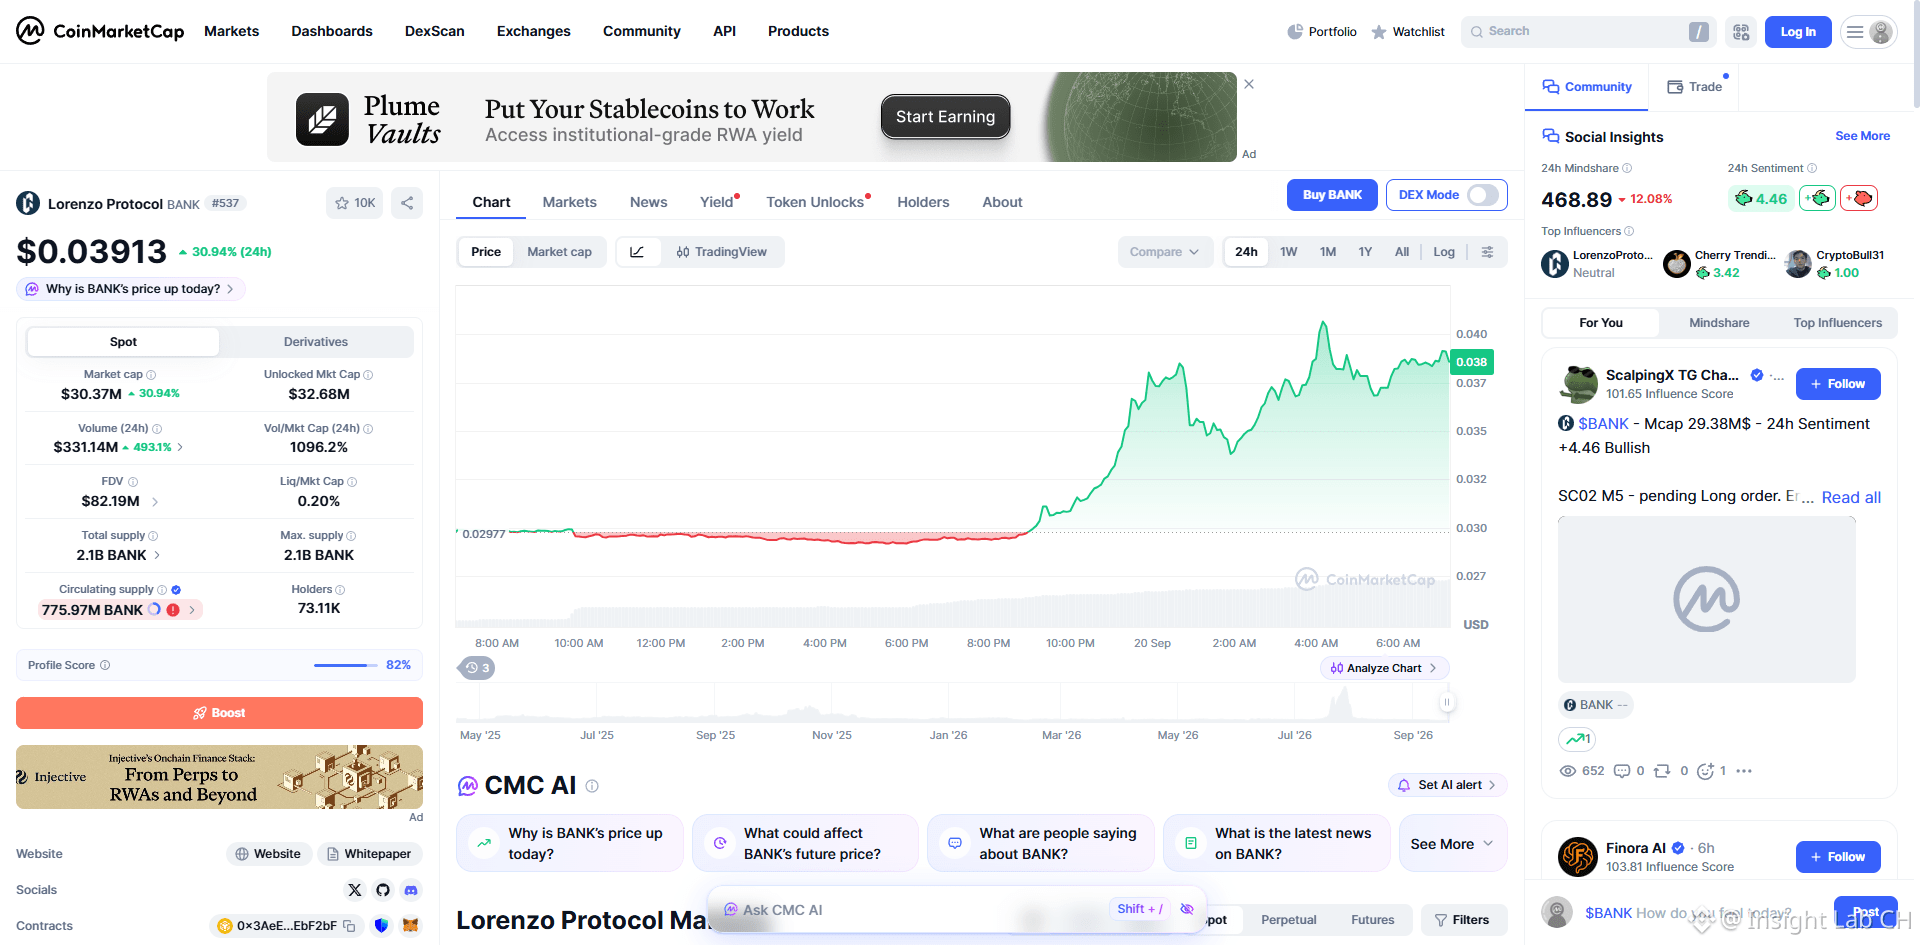
It has been observed that the Lorenzo Protocol ($BANK) has now entered CoinMarketCap’s Trending list at #7. In periods where the macro financial environment remains tightening and liquidity is limited, popularity driven by speculative sentiment is often accompanied by a higher risk of valuation pullbacks. In the face of such high-risk assets used for short-term ranking surges, investors need to remain vigilant and strictly control exposure.📉 #LorenzoProtocol #DeFi
It has been observed that the Lorenzo Protocol ($BANK ) has now entered CoinMarketCap’s Trending list at #7. In periods where the macro financial environment remains tightening and liquidity is limited, popularity driven by speculative sentiment is often accompanied by a higher risk of valuation pullbacks. In the face of such high-risk assets used for short-term ranking surges, investors need to remain vigilant and strictly control exposure.📉 #LorenzoProtocol #DeFi
217
·
--
$RAYSOL This drop is kind of interesting.
The price fell 1.96%, but OI also dropped (15m -2.87%, 1h -2.26%). This suggests it’s not fresh shorts being heavily hammered; it looks more like longs are de-leveraging on their own, cutting positions and getting out. Active volume difference is -38.9%, the buy-sell ratio is 0.44, and selling pressure is real. But coupled with OI contraction, it feels more like passive stop-loss selling, not like someone is aggressively building short positions.
With OI being at the 96.4% abnormal percentile—across the whole pool, #7, and continuing for several consecutive intervals—signals like this aren’t common. The price has already broken below the lower bound of the most recent ~20 5m K-bars. Volume is 2.01x, and the decline is confirmed by depth.
My take: In this kind of structure, once de-leveraging is done, there’s often a rebound. But if OI continues to shrink while price fails to stabilize, there’s still room downward. Chasing shorts right now isn’t a great deal; better to wait until the long side has cleared its leverage, then reassess.
$RAYSOL This drop is kind of interesting.
The price fell 1.96%, but OI also dropped (15m -2.87%, 1h -2.26%). This suggests it’s not fresh shorts being heavily hammered; it looks more like longs are de-leveraging on their own, cutting positions and getting out. Active volume difference is -38.9%, the buy-sell ratio is 0.44, and selling pressure is real. But coupled with OI contraction, it feels more like passive stop-loss selling, not like someone is aggressively building short positions.
With OI being at the 96.4% abnormal percentile—across the whole pool, #7, and continuing for several consecutive intervals—signals like this aren’t common. The price has already broken below the lower bound of the most recent ~20 5m K-bars. Volume is 2.01x, and the decline is confirmed by depth.
My take: In this kind of structure, once de-leveraging is done, there’s often a rebound. But if OI continues to shrink while price fails to stabilize, there’s still room downward. Chasing shorts right now isn’t a great deal; better to wait until the long side has cleared its leverage, then reassess.
The price fell 1.96%, but OI also dropped (15m -2.87%, 1h -2.26%). This suggests it’s not fresh shorts being heavily hammered; it looks more like longs are de-leveraging on their own, cutting positions and getting out. Active volume difference is -38.9%, the buy-sell ratio is 0.44, and selling pressure is real. But coupled with OI contraction, it feels more like passive stop-loss selling, not like someone is aggressively building short positions.
With OI being at the 96.4% abnormal percentile—across the whole pool, #7, and continuing for several consecutive intervals—signals like this aren’t common. The price has already broken below the lower bound of the most recent ~20 5m K-bars. Volume is 2.01x, and the decline is confirmed by depth.
My take: In this kind of structure, once de-leveraging is done, there’s often a rebound. But if OI continues to shrink while price fails to stabilize, there’s still room downward. Chasing shorts right now isn’t a great deal; better to wait until the long side has cleared its leverage, then reassess.
1
·
--
$ZEN The taste of this bullish deleveraging is very strong.
On the 15m timeframe, it directly dumped out a 2.28x volume, with the price down 0.98%. OI also fell 2.08%, and the notional 327K USDT was directly withdrawn—not new shorts entering, but old longs getting liquidated. Active trade slippage is -24.5%, buy/sell ratio is 0.61, and sellers are clearly in control.
Even more noteworthy: the OI abnormal percentile has already reached 95%, across the whole pool #7. It has been continuing through several consecutive cycles. The funding rate is still in a high percentile recently, suggesting that the longs were previously piled up heavily and are only starting to unwind now.
In this kind of structure, the downside usually isn’t a one-off move. Deleveraging is a process. 24h trading volume is 60M—liquidity is there, but once the direction is confirmed, the panic selling will happen quickly.
Don’t rush to bottom-buy. First, watch when OI stabilizes.
$ZEN The taste of this bullish deleveraging is very strong.
On the 15m timeframe, it directly dumped out a 2.28x volume, with the price down 0.98%. OI also fell 2.08%, and the notional 327K USDT was directly withdrawn—not new shorts entering, but old longs getting liquidated. Active trade slippage is -24.5%, buy/sell ratio is 0.61, and sellers are clearly in control.
Even more noteworthy: the OI abnormal percentile has already reached 95%, across the whole pool #7. It has been continuing through several consecutive cycles. The funding rate is still in a high percentile recently, suggesting that the longs were previously piled up heavily and are only starting to unwind now.
In this kind of structure, the downside usually isn’t a one-off move. Deleveraging is a process. 24h trading volume is 60M—liquidity is there, but once the direction is confirmed, the panic selling will happen quickly.
Don’t rush to bottom-buy. First, watch when OI stabilizes.
On the 15m timeframe, it directly dumped out a 2.28x volume, with the price down 0.98%. OI also fell 2.08%, and the notional 327K USDT was directly withdrawn—not new shorts entering, but old longs getting liquidated. Active trade slippage is -24.5%, buy/sell ratio is 0.61, and sellers are clearly in control.
Even more noteworthy: the OI abnormal percentile has already reached 95%, across the whole pool #7. It has been continuing through several consecutive cycles. The funding rate is still in a high percentile recently, suggesting that the longs were previously piled up heavily and are only starting to unwind now.
In this kind of structure, the downside usually isn’t a one-off move. Deleveraging is a process. 24h trading volume is 60M—liquidity is there, but once the direction is confirmed, the panic selling will happen quickly.
Don’t rush to bottom-buy. First, watch when OI stabilizes.
5
·
--
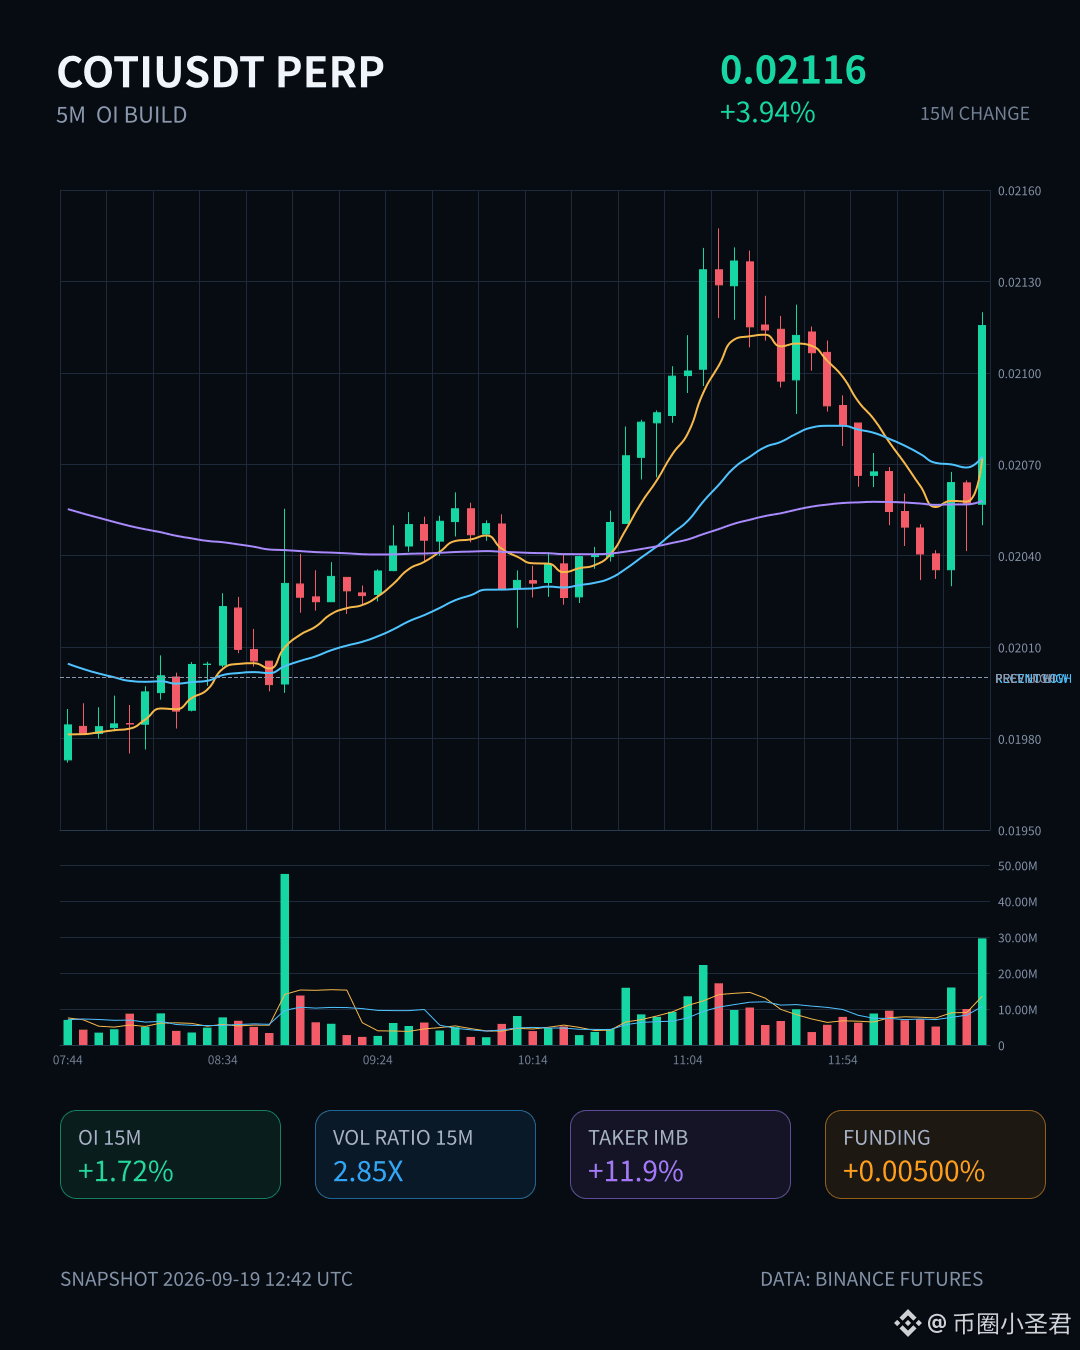
$COTI This 15 minutes moved a bit fast, +3.94%. Trading volume directly surged to 2.85x, with a Z-score of 3.88—this isn’t one of those slow, lukewarm moves.
OI is even more interesting. On the 15-minute contracts, +1.72%; on the 1-hour, +2.52%. The nominal change is only a few hundred thousand U, but the abnormal percentile has already climbed to 95.4%, ranking #7 across the whole pool. It’s not about the absolute amount being huge—it’s the relative volatility compared to its usual pool. This move has already pressed right up against the extreme range.
Active trades are down 11.9%, buy/sell ratio is 1.27—clearly bullish. Price rises and OI also rises. Structurally, it looks more like new leveraged longs are entering, not just shorts getting squeezed. But the issue is: when this kind of volume-price alignment shows up at the 95th percentile, anyone chasing in needs to think it through—are you here to ride the trend, or are you picking up the last baton?
24h turnover is 41.87M. Liquidity depth checks out—no problems. For a rig like $COTI , once leveraged longs start to crowd, the pullback can be very decisive. Watch first. No need to rush into choosing sides.
$COTI This 15 minutes moved a bit fast, +3.94%. Trading volume directly surged to 2.85x, with a Z-score of 3.88—this isn’t one of those slow, lukewarm moves.
OI is even more interesting. On the 15-minute contracts, +1.72%; on the 1-hour, +2.52%. The nominal change is only a few hundred thousand U, but the abnormal percentile has already climbed to 95.4%, ranking #7 across the whole pool. It’s not about the absolute amount being huge—it’s the relative volatility compared to its usual pool. This move has already pressed right up against the extreme range.
Active trades are down 11.9%, buy/sell ratio is 1.27—clearly bullish. Price rises and OI also rises. Structurally, it looks more like new leveraged longs are entering, not just shorts getting squeezed. But the issue is: when this kind of volume-price alignment shows up at the 95th percentile, anyone chasing in needs to think it through—are you here to ride the trend, or are you picking up the last baton?
24h turnover is 41.87M. Liquidity depth checks out—no problems. For a rig like $COTI , once leveraged longs start to crowd, the pullback can be very decisive. Watch first. No need to rush into choosing sides.
OI is even more interesting. On the 15-minute contracts, +1.72%; on the 1-hour, +2.52%. The nominal change is only a few hundred thousand U, but the abnormal percentile has already climbed to 95.4%, ranking #7 across the whole pool. It’s not about the absolute amount being huge—it’s the relative volatility compared to its usual pool. This move has already pressed right up against the extreme range.
Active trades are down 11.9%, buy/sell ratio is 1.27—clearly bullish. Price rises and OI also rises. Structurally, it looks more like new leveraged longs are entering, not just shorts getting squeezed. But the issue is: when this kind of volume-price alignment shows up at the 95th percentile, anyone chasing in needs to think it through—are you here to ride the trend, or are you picking up the last baton?
24h turnover is 41.87M. Liquidity depth checks out—no problems. For a rig like $COTI , once leveraged longs start to crowd, the pullback can be very decisive. Watch first. No need to rush into choosing sides.
75
·
--
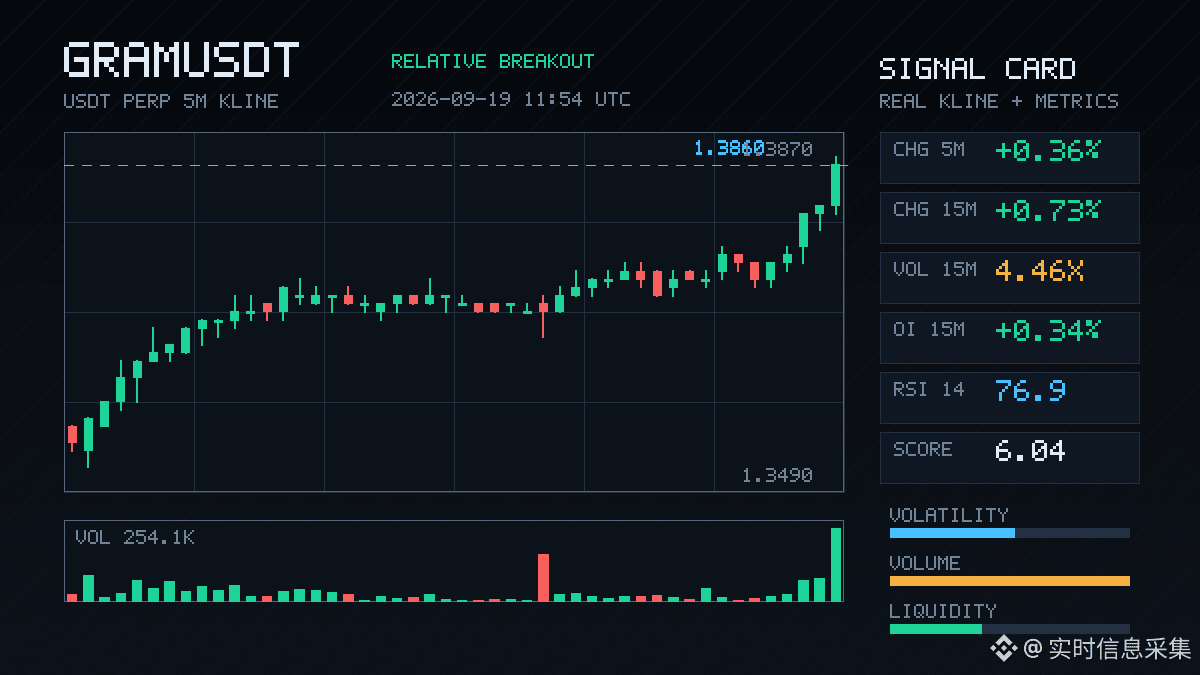
GRAM This set has something going on.
In the 15m window, volume expanded with a 4.46x increase; the aggressive buy/sell ratio is 1.44. The price closed right at the upper edge of the recent 20 five-minute-bar range—not a low-volume breakout that’s just pretending. Real money is pushing it.
Even more interesting is the OI. In 15m, it’s up 0.34%; in 1h, up 0.42%. The nominal change isn’t huge, but the abnormal percentile jumped to 97%, and the whole pool rank is #7. Translation: it’s not the old long-only crowd adding more positions—new leverage is moving in. This kind of structure usually means there’s more to come; it’s not a one-wave move.
The 24h trading value is 13.76M. Liquidity is deep enough, so slippage shouldn’t be too outrageous.
At this level, it’s exactly touching the historical extreme range. Several consecutive cycles have been extending it. Either there will be a breakout with acceleration, or this is where market sentiment peaks. I lean toward watching whether it can hold and stand firm on this upper edge first.
Don’t chase. Wait for a pullback to confirm.
GRAM This set has something going on.
In the 15m window, volume expanded with a 4.46x increase; the aggressive buy/sell ratio is 1.44. The price closed right at the upper edge of the recent 20 five-minute-bar range—not a low-volume breakout that’s just pretending. Real money is pushing it.
Even more interesting is the OI. In 15m, it’s up 0.34%; in 1h, up 0.42%. The nominal change isn’t huge, but the abnormal percentile jumped to 97%, and the whole pool rank is #7. Translation: it’s not the old long-only crowd adding more positions—new leverage is moving in. This kind of structure usually means there’s more to come; it’s not a one-wave move.
The 24h trading value is 13.76M. Liquidity is deep enough, so slippage shouldn’t be too outrageous.
At this level, it’s exactly touching the historical extreme range. Several consecutive cycles have been extending it. Either there will be a breakout with acceleration, or this is where market sentiment peaks. I lean toward watching whether it can hold and stand firm on this upper edge first.
Don’t chase. Wait for a pullback to confirm.
In the 15m window, volume expanded with a 4.46x increase; the aggressive buy/sell ratio is 1.44. The price closed right at the upper edge of the recent 20 five-minute-bar range—not a low-volume breakout that’s just pretending. Real money is pushing it.
Even more interesting is the OI. In 15m, it’s up 0.34%; in 1h, up 0.42%. The nominal change isn’t huge, but the abnormal percentile jumped to 97%, and the whole pool rank is #7. Translation: it’s not the old long-only crowd adding more positions—new leverage is moving in. This kind of structure usually means there’s more to come; it’s not a one-wave move.
The 24h trading value is 13.76M. Liquidity is deep enough, so slippage shouldn’t be too outrageous.
At this level, it’s exactly touching the historical extreme range. Several consecutive cycles have been extending it. Either there will be a breakout with acceleration, or this is where market sentiment peaks. I lean toward watching whether it can hold and stand firm on this upper edge first.
Don’t chase. Wait for a pullback to confirm.
2
·
--
$XMR 15 minutes: this strong bearish candle with high volume doesn’t look quite right.
A drop of 2.34% isn’t that dramatic by itself, but the trading volume immediately surged to 4.93 times, the Z-score is 3.56, and the passive-to-active order imbalance is -9.7%. The buy/sell ratio is 0.82, suggesting that real people are actively dumping—not a slide caused by liquidity simply being pulled.
The price broke below the lower edge of the recent 20-candle 5m range, crossing two key integer levels at once. The break was pretty decisive.
What’s especially important is that OI is dropping in sync: 15m -1.62%, 1h -1.50%, with a nominal reduction of 2.17M. When price falls while OI declines, this combo doesn’t look like fresh short positions being opened—it more resembles longs de-leveraging, getting stopped out, or reducing exposure. The anomalous OI percentile has already topped out at 98%; in the whole pool, anomalous #2 and nominal change #7. This has continued across multiple consecutive cycles, and the depth confirmation has also passed.
I’m watching because it’s approaching its own historical extreme zone. Positions like this often trigger emotion-driven acceleration—either a quick wick (a shakeout) or a direct volume-based move to select a direction. Right now, the 24h trading amount is 137.72M, and the volume is sufficient.
No need to rush into picking a side. First, see whether this 15m candle can close back above the lower bound of the range. If it can’t reclaim it, the next leg may still have a de-leveraging tail. If it does reclaim it, then it’s probably a fake drop that washes people out. My own bias is that the latter is more likely—but my position has already been cut by half. At this level, I’d rather make a little less than stubbornly hold on.
$XMR 15 minutes: this strong bearish candle with high volume doesn’t look quite right.
A drop of 2.34% isn’t that dramatic by itself, but the trading volume immediately surged to 4.93 times, the Z-score is 3.56, and the passive-to-active order imbalance is -9.7%. The buy/sell ratio is 0.82, suggesting that real people are actively dumping—not a slide caused by liquidity simply being pulled.
The price broke below the lower edge of the recent 20-candle 5m range, crossing two key integer levels at once. The break was pretty decisive.
What’s especially important is that OI is dropping in sync: 15m -1.62%, 1h -1.50%, with a nominal reduction of 2.17M. When price falls while OI declines, this combo doesn’t look like fresh short positions being opened—it more resembles longs de-leveraging, getting stopped out, or reducing exposure. The anomalous OI percentile has already topped out at 98%; in the whole pool, anomalous #2 and nominal change #7. This has continued across multiple consecutive cycles, and the depth confirmation has also passed.
I’m watching because it’s approaching its own historical extreme zone. Positions like this often trigger emotion-driven acceleration—either a quick wick (a shakeout) or a direct volume-based move to select a direction. Right now, the 24h trading amount is 137.72M, and the volume is sufficient.
No need to rush into picking a side. First, see whether this 15m candle can close back above the lower bound of the range. If it can’t reclaim it, the next leg may still have a de-leveraging tail. If it does reclaim it, then it’s probably a fake drop that washes people out. My own bias is that the latter is more likely—but my position has already been cut by half. At this level, I’d rather make a little less than stubbornly hold on.
A drop of 2.34% isn’t that dramatic by itself, but the trading volume immediately surged to 4.93 times, the Z-score is 3.56, and the passive-to-active order imbalance is -9.7%. The buy/sell ratio is 0.82, suggesting that real people are actively dumping—not a slide caused by liquidity simply being pulled.
The price broke below the lower edge of the recent 20-candle 5m range, crossing two key integer levels at once. The break was pretty decisive.
What’s especially important is that OI is dropping in sync: 15m -1.62%, 1h -1.50%, with a nominal reduction of 2.17M. When price falls while OI declines, this combo doesn’t look like fresh short positions being opened—it more resembles longs de-leveraging, getting stopped out, or reducing exposure. The anomalous OI percentile has already topped out at 98%; in the whole pool, anomalous #2 and nominal change #7. This has continued across multiple consecutive cycles, and the depth confirmation has also passed.
I’m watching because it’s approaching its own historical extreme zone. Positions like this often trigger emotion-driven acceleration—either a quick wick (a shakeout) or a direct volume-based move to select a direction. Right now, the 24h trading amount is 137.72M, and the volume is sufficient.
No need to rush into picking a side. First, see whether this 15m candle can close back above the lower bound of the range. If it can’t reclaim it, the next leg may still have a de-leveraging tail. If it does reclaim it, then it’s probably a fake drop that washes people out. My own bias is that the latter is more likely—but my position has already been cut by half. At this level, I’d rather make a little less than stubbornly hold on.
7
·
--
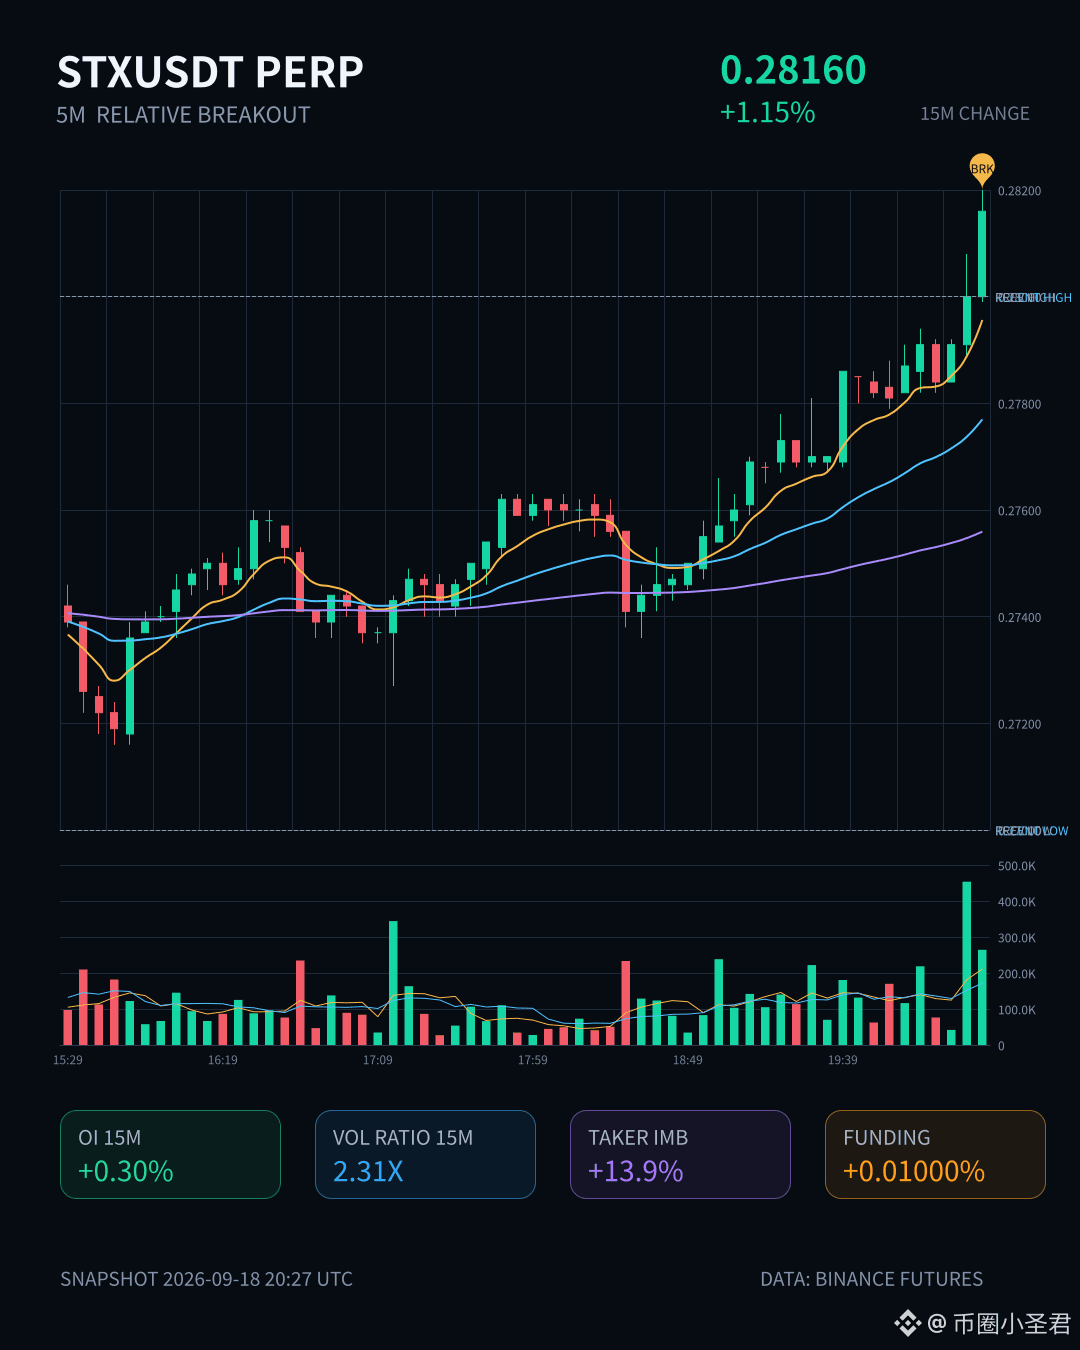
$STX This move is kind of interesting.
On the 15m chart, it’s up 1.15%—and the volume directly hit 2.31×, with a Z value of 3.27. This isn’t one of those low-volume breakout-for-the-sake-of-it situations. The key point is that OI is rising in sync—15m +0.30%, 1h +0.75%, abnormal percentile at 96.4%, ranking #7 in the whole pool. Price is up, open interest is up too, and the feel is strongly that newly added leveraged long positions are being entered.
The closing price has already broken above the upper band of the last ~20 5m candles. Active volume is weaker by 13.9%, but the buy-sell ratio is 1.32, with buy orders actively pushing upward.
However, over the past 24h, the turnover is only 12.53M, so the pool isn’t very deep. At this position, when it runs it can move fast, and a pullback may come just as quickly. With OI reaching the 96.4th percentile, it means leverage has already piled up to a fairly extreme level. Short-term momentum is still there, but don’t chase it when sentiment is at its fullest.
First, see whether it can hold above this zone’s upper band. If it can’t, then it’s just a single impulse candle.
$STX This move is kind of interesting.
On the 15m chart, it’s up 1.15%—and the volume directly hit 2.31×, with a Z value of 3.27. This isn’t one of those low-volume breakout-for-the-sake-of-it situations. The key point is that OI is rising in sync—15m +0.30%, 1h +0.75%, abnormal percentile at 96.4%, ranking #7 in the whole pool. Price is up, open interest is up too, and the feel is strongly that newly added leveraged long positions are being entered.
The closing price has already broken above the upper band of the last ~20 5m candles. Active volume is weaker by 13.9%, but the buy-sell ratio is 1.32, with buy orders actively pushing upward.
However, over the past 24h, the turnover is only 12.53M, so the pool isn’t very deep. At this position, when it runs it can move fast, and a pullback may come just as quickly. With OI reaching the 96.4th percentile, it means leverage has already piled up to a fairly extreme level. Short-term momentum is still there, but don’t chase it when sentiment is at its fullest.
First, see whether it can hold above this zone’s upper band. If it can’t, then it’s just a single impulse candle.
On the 15m chart, it’s up 1.15%—and the volume directly hit 2.31×, with a Z value of 3.27. This isn’t one of those low-volume breakout-for-the-sake-of-it situations. The key point is that OI is rising in sync—15m +0.30%, 1h +0.75%, abnormal percentile at 96.4%, ranking #7 in the whole pool. Price is up, open interest is up too, and the feel is strongly that newly added leveraged long positions are being entered.
The closing price has already broken above the upper band of the last ~20 5m candles. Active volume is weaker by 13.9%, but the buy-sell ratio is 1.32, with buy orders actively pushing upward.
However, over the past 24h, the turnover is only 12.53M, so the pool isn’t very deep. At this position, when it runs it can move fast, and a pullback may come just as quickly. With OI reaching the 96.4th percentile, it means leverage has already piled up to a fairly extreme level. Short-term momentum is still there, but don’t chase it when sentiment is at its fullest.
First, see whether it can hold above this zone’s upper band. If it can’t, then it’s just a single impulse candle.
6
Log in to explore more content
Join global crypto users on Binance Square
⚡️ Get latest and useful information about crypto.
💬 Trusted by the world’s largest crypto exchange.
👍 Discover real insights from verified creators.
Email / Phone number
Trending Topics
1
#XRPRises8%
951 views
124 Discussing
2
#AppleGoogleSeekStablecoinTokenizedDepositTalent
447 views
83 Discussing
3
#NvidiaToBuyAnother$1.5BSBEnergySharesPreIPO
176 views
11 Discussing
4
#AgoraGetsPreliminaryOCCApprovalForTrustBank
236 views
41 Discussing
5
#NEARRisesNearly80%InAWeek
53,981 views
1,093 Discussing
6
#MultiversXPlansHardForkRecovery
44,695 views
831 Discussing
7
#CircleLaunchesInstitutionalBTCBackedBorrowing
40,987 views
850 Discussing
8
#BitcoinHits$85K
55,987 views
320 Discussing
9
#ZetaChainVotesToMigrateZETAToSolana
28,420 views
555 Discussing
10
#ECBStartsBlockchainEuroSettlement
55,610 views
837 Discussing