
#23
23
47,950 views
140 Discussing
Hot
Latest

·
--
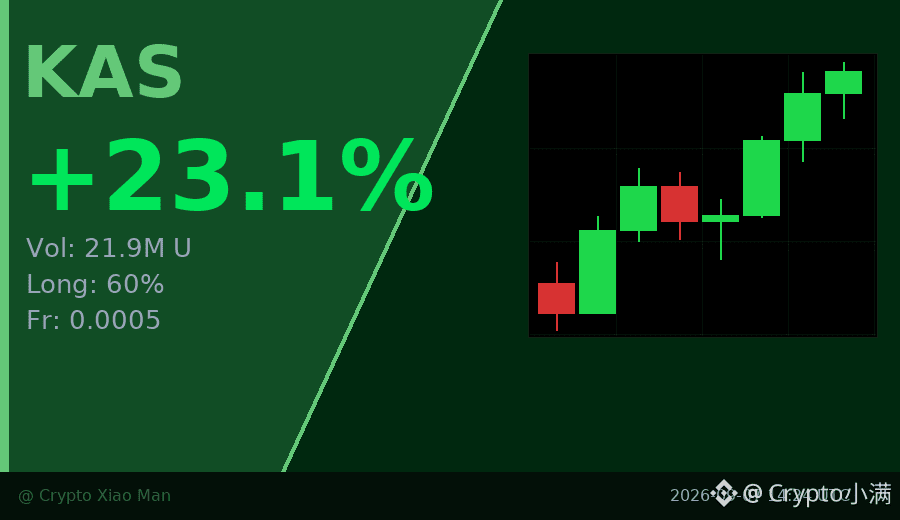
23% rise in percentage, trading volume surged to 21.90 million U, and this rally in KAS is kind of interesting.
More importantly, the funding rate is only 0.0005. The long side makes up 60%, but it’s not extremely crowded. Compared with coins whose funding rates jump above 0.01, KAS’s upward resistance is actually smaller.
The hourly chart has already seen three consecutive bullish candles—pushing steadily from around 0.03 up to 0.037. The buying momentum is very stable. This kind of volume-price alignment paired with a moderate funding rate is often more durable than a pull-up driven by overheated sentiment.
$KAS #KAS #23.09
Click the small card below to quickly check the market trend👇
23% rise in percentage, trading volume surged to 21.90 million U, and this rally in KAS is kind of interesting.
More importantly, the funding rate is only 0.0005. The long side makes up 60%, but it’s not extremely crowded. Compared with coins whose funding rates jump above 0.01, KAS’s upward resistance is actually smaller.
The hourly chart has already seen three consecutive bullish candles—pushing steadily from around 0.03 up to 0.037. The buying momentum is very stable. This kind of volume-price alignment paired with a moderate funding rate is often more durable than a pull-up driven by overheated sentiment.
$KAS #KAS #23.09
Click the small card below to quickly check the market trend👇
More importantly, the funding rate is only 0.0005. The long side makes up 60%, but it’s not extremely crowded. Compared with coins whose funding rates jump above 0.01, KAS’s upward resistance is actually smaller.
The hourly chart has already seen three consecutive bullish candles—pushing steadily from around 0.03 up to 0.037. The buying momentum is very stable. This kind of volume-price alignment paired with a moderate funding rate is often more durable than a pull-up driven by overheated sentiment.
$KAS #KAS #23.09
Click the small card below to quickly check the market trend👇
49

$BCH (Bitcoin Cash) update: Currently trading at $271.03, +2% in the last 24 hours, and +21% over the past 7 days. Today's trading range was $261.8 to $273.01. Market cap stands at $5416625663, ranking #23 globally, with a 24h market cap change of 2%. Fully diluted valuation: $5416634087. 24h trading volume: $330031206. All-time high: $3785.82 (-93% from peak, reached 2017-12-19T16:00:00.000Z); all-time low: $76.93 (reached 2018-12-15T16:00:00.000Z). Circulating supply: 20092515.52165077 BCH, total supply: 20092562.39665077 BCH. Last updated 2026-09-22T11:17:20.000Z. (CoinGecko data, informational only) #BCH #Crypto #Altcoins
$BCH (Bitcoin Cash) update: Currently trading at $271.03, +2% in the last 24 hours, and +21% over the past 7 days. Today's trading range was $261.8 to $273.01. Market cap stands at $5416625663, ranking #23 globally, with a 24h market cap change of 2%. Fully diluted valuation: $5416634087. 24h trading volume: $330031206. All-time high: $3785.82 (-93% from peak, reached 2017-12-19T16:00:00.000Z); all-time low: $76.93 (reached 2018-12-15T16:00:00.000Z). Circulating supply: 20092515.52165077 BCH, total supply: 20092562.39665077 BCH. Last updated 2026-09-22T11:17:20.000Z. (CoinGecko data, informational only) #BCH #Crypto #Altcoins
27

·
--
$ENA This move has some substance. In 15m it pulled up 3 points; the volume directly hit 2.56x, with a Z value of 4.18. It’s not one of those slow, tepid rebounds.
The key is that OI is following along. On 15m: +0.23%, on 1h: +0.27%. Combined with the notional change, that’s around 7 million U—an abnormal percentile of 93.1%, and it ranks #23 in the whole pool. Price is up, OI is up too. This is fresh money entering and adding leverage, not short-covering panic dumping.
The closing price has already pierced through the upper bound of the past ~20 five-minute candles. Active trade volume is up 13%, and the buy/sell ratio is 1.3. Funding rate has also pushed to the higher end of recent ranges. The flavor is intense—bullish sentiment is a bit overheated in the short term.
24h trading volume is 417 million U. Liquidity depth is there; it’s not a fake breakout in some small pool.
My take: this kind of structure either rides the momentum to surge a bit more, or it’s a high-level “lesson” for the people chasing longs. With the fee rate this high, I wouldn’t blindly chase here. I’ll wait for a pullback to see how it holds, or I might just let it run first.
What do you think—ENA is this a real breakout, or just another round of bait?
$ENA This move has some substance. In 15m it pulled up 3 points; the volume directly hit 2.56x, with a Z value of 4.18. It’s not one of those slow, tepid rebounds.
The key is that OI is following along. On 15m: +0.23%, on 1h: +0.27%. Combined with the notional change, that’s around 7 million U—an abnormal percentile of 93.1%, and it ranks #23 in the whole pool. Price is up, OI is up too. This is fresh money entering and adding leverage, not short-covering panic dumping.
The closing price has already pierced through the upper bound of the past ~20 five-minute candles. Active trade volume is up 13%, and the buy/sell ratio is 1.3. Funding rate has also pushed to the higher end of recent ranges. The flavor is intense—bullish sentiment is a bit overheated in the short term.
24h trading volume is 417 million U. Liquidity depth is there; it’s not a fake breakout in some small pool.
My take: this kind of structure either rides the momentum to surge a bit more, or it’s a high-level “lesson” for the people chasing longs. With the fee rate this high, I wouldn’t blindly chase here. I’ll wait for a pullback to see how it holds, or I might just let it run first.
What do you think—ENA is this a real breakout, or just another round of bait?
The key is that OI is following along. On 15m: +0.23%, on 1h: +0.27%. Combined with the notional change, that’s around 7 million U—an abnormal percentile of 93.1%, and it ranks #23 in the whole pool. Price is up, OI is up too. This is fresh money entering and adding leverage, not short-covering panic dumping.
The closing price has already pierced through the upper bound of the past ~20 five-minute candles. Active trade volume is up 13%, and the buy/sell ratio is 1.3. Funding rate has also pushed to the higher end of recent ranges. The flavor is intense—bullish sentiment is a bit overheated in the short term.
24h trading volume is 417 million U. Liquidity depth is there; it’s not a fake breakout in some small pool.
My take: this kind of structure either rides the momentum to surge a bit more, or it’s a high-level “lesson” for the people chasing longs. With the fee rate this high, I wouldn’t blindly chase here. I’ll wait for a pullback to see how it holds, or I might just let it run first.
What do you think—ENA is this a real breakout, or just another round of bait?
7

·
--
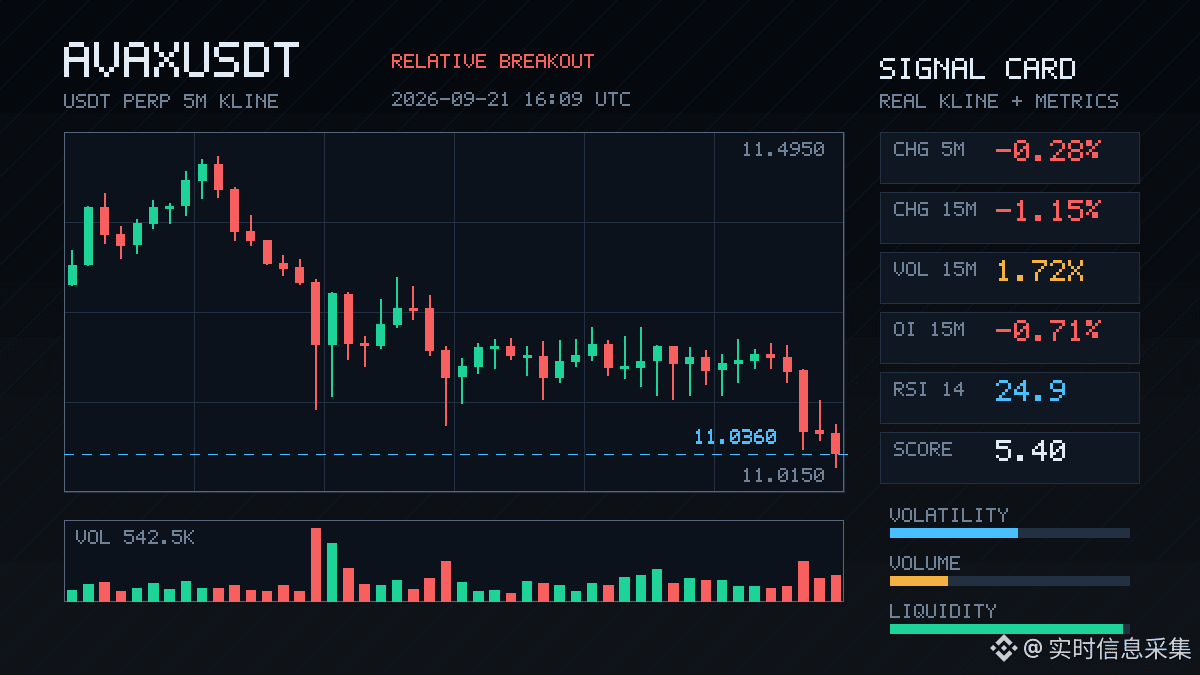
This drop in AVAX doesn’t really look like panic selling and dumping—it looks more like the longs quietly pulled out first.
The 15m timeframe is down 1.15%, and the volume hit 1.72x. Price has broken below the lower band of the last 20 5m candles. But the key thing to notice is OI: 15m -0.71%, 1h -1.90%, with a notional change of -3.91M. Price is down while open interest is also falling. This isn’t fresh shorts entering—it’s older longs de-leveraging, cutting losses, and reducing positions.
The active trade ratio is down -18.9%, the buy/sell ratio is 0.68, and sell pressure does seem to be more aggressive. But overall it looks more like position clearing than a trend-driven short.
The abnormal percentile is 87.3%, ranking #23 in the full pool, notional change #7, and it has continued across multiple consecutive periods. In this kind of structure, I’d wait for OI to stop falling and see whether there’s a rebound opportunity, rather than chasing shorts right now.
This drop in AVAX doesn’t really look like panic selling and dumping—it looks more like the longs quietly pulled out first.
The 15m timeframe is down 1.15%, and the volume hit 1.72x. Price has broken below the lower band of the last 20 5m candles. But the key thing to notice is OI: 15m -0.71%, 1h -1.90%, with a notional change of -3.91M. Price is down while open interest is also falling. This isn’t fresh shorts entering—it’s older longs de-leveraging, cutting losses, and reducing positions.
The active trade ratio is down -18.9%, the buy/sell ratio is 0.68, and sell pressure does seem to be more aggressive. But overall it looks more like position clearing than a trend-driven short.
The abnormal percentile is 87.3%, ranking #23 in the full pool, notional change #7, and it has continued across multiple consecutive periods. In this kind of structure, I’d wait for OI to stop falling and see whether there’s a rebound opportunity, rather than chasing shorts right now.
The 15m timeframe is down 1.15%, and the volume hit 1.72x. Price has broken below the lower band of the last 20 5m candles. But the key thing to notice is OI: 15m -0.71%, 1h -1.90%, with a notional change of -3.91M. Price is down while open interest is also falling. This isn’t fresh shorts entering—it’s older longs de-leveraging, cutting losses, and reducing positions.
The active trade ratio is down -18.9%, the buy/sell ratio is 0.68, and sell pressure does seem to be more aggressive. But overall it looks more like position clearing than a trend-driven short.
The abnormal percentile is 87.3%, ranking #23 in the full pool, notional change #7, and it has continued across multiple consecutive periods. In this kind of structure, I’d wait for OI to stop falling and see whether there’s a rebound opportunity, rather than chasing shorts right now.
199
·
--
$BANK This wave on the 15m ran up 4.52%. Volume directly hit 3.35x. Volatility Z reached 9.06, and the closing price pierced above the upper band of the last 20 5m candles.
What’s interesting is the OI—on 15m: -0.36%, on 1h: -2.40%. Price is up while open interest is down: a textbook short-covering script. Passive trades down +8.4%, buy/sell ratio 1.18. It’s not retail FOMO—someone is being forced to close positions.
The OI at the 96th percentile is abnormal across the whole pool #23, and it has persisted for several consecutive intervals. This kind of structure is either the very start of a short liquidation cascade, or it’s the final push of a bull-trap. With only $32M in 24h volume and the order book sitting there as it is, don’t chase the price.
$BANK This wave on the 15m ran up 4.52%. Volume directly hit 3.35x. Volatility Z reached 9.06, and the closing price pierced above the upper band of the last 20 5m candles.
What’s interesting is the OI—on 15m: -0.36%, on 1h: -2.40%. Price is up while open interest is down: a textbook short-covering script. Passive trades down +8.4%, buy/sell ratio 1.18. It’s not retail FOMO—someone is being forced to close positions.
The OI at the 96th percentile is abnormal across the whole pool #23, and it has persisted for several consecutive intervals. This kind of structure is either the very start of a short liquidation cascade, or it’s the final push of a bull-trap. With only $32M in 24h volume and the order book sitting there as it is, don’t chase the price.
What’s interesting is the OI—on 15m: -0.36%, on 1h: -2.40%. Price is up while open interest is down: a textbook short-covering script. Passive trades down +8.4%, buy/sell ratio 1.18. It’s not retail FOMO—someone is being forced to close positions.
The OI at the 96th percentile is abnormal across the whole pool #23, and it has persisted for several consecutive intervals. This kind of structure is either the very start of a short liquidation cascade, or it’s the final push of a bull-trap. With only $32M in 24h volume and the order book sitting there as it is, don’t chase the price.
5

·
--
$STRK This move has something to it.
On the 15m chart, it rallies 2.15%, with volume directly surging to 2.5x, and the closing price punches through the upper boundary of roughly the last 20 consecutive 5m candles. It’s not the kind of fake feint “needle” insertion.
The key is OI—15m +0.83%, 1h +2.03%, with notional change of 1.11M. Price is rising, positions are rising too, and new leveraged longs are entering the market. This isn’t hard-tucked short covering.
Taker/active trade volume is worse by 15.2%, buy/sell ratio is 1.36, and the funding rate has also pushed up to a high percentile recently.
Across the whole pool, anomalies #23 and notional change #21— not the most eye-catching one, but the depth confirms it’s a pass.
Watch whether it can hold steady at the top of this range. If it can’t, it’s a false breakout. If it can, upside space opens up.
Not investment advice—make your own judgment.
$STRK This move has something to it.
On the 15m chart, it rallies 2.15%, with volume directly surging to 2.5x, and the closing price punches through the upper boundary of roughly the last 20 consecutive 5m candles. It’s not the kind of fake feint “needle” insertion.
The key is OI—15m +0.83%, 1h +2.03%, with notional change of 1.11M. Price is rising, positions are rising too, and new leveraged longs are entering the market. This isn’t hard-tucked short covering.
Taker/active trade volume is worse by 15.2%, buy/sell ratio is 1.36, and the funding rate has also pushed up to a high percentile recently.
Across the whole pool, anomalies #23 and notional change #21— not the most eye-catching one, but the depth confirms it’s a pass.
Watch whether it can hold steady at the top of this range. If it can’t, it’s a false breakout. If it can, upside space opens up.
Not investment advice—make your own judgment.
On the 15m chart, it rallies 2.15%, with volume directly surging to 2.5x, and the closing price punches through the upper boundary of roughly the last 20 consecutive 5m candles. It’s not the kind of fake feint “needle” insertion.
The key is OI—15m +0.83%, 1h +2.03%, with notional change of 1.11M. Price is rising, positions are rising too, and new leveraged longs are entering the market. This isn’t hard-tucked short covering.
Taker/active trade volume is worse by 15.2%, buy/sell ratio is 1.36, and the funding rate has also pushed up to a high percentile recently.
Across the whole pool, anomalies #23 and notional change #21— not the most eye-catching one, but the depth confirms it’s a pass.
Watch whether it can hold steady at the top of this range. If it can’t, it’s a false breakout. If it can, upside space opens up.
Not investment advice—make your own judgment.
8

·
--
See translation
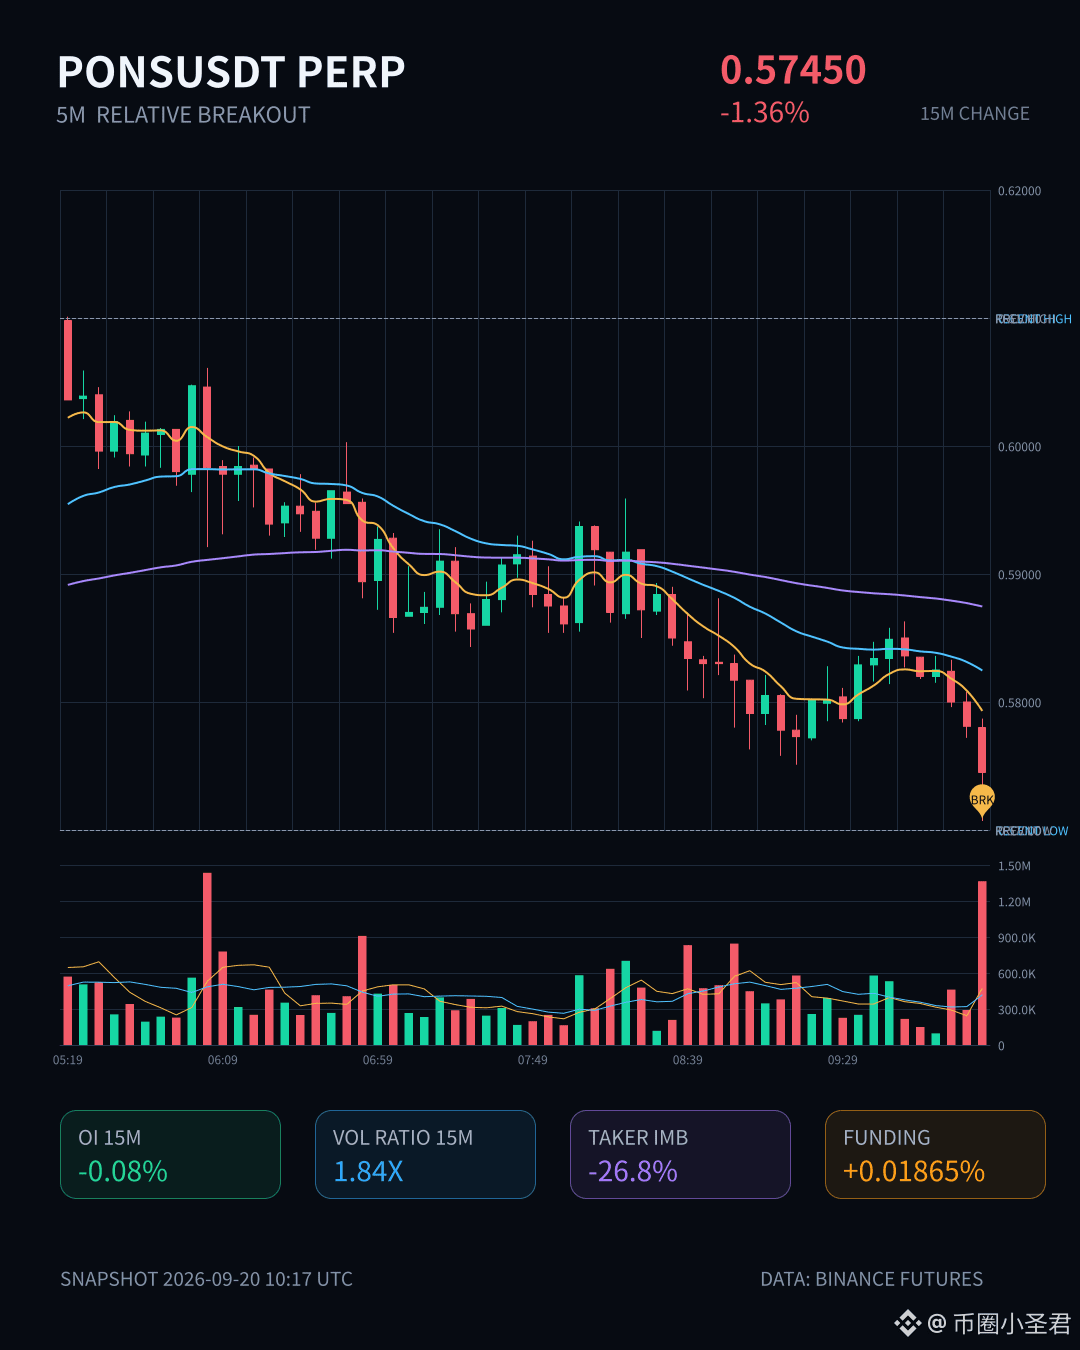
$PONS 这波跌得不算猛,但结构挺难看。
15m 直接跌破近 20 根 5m K 的下沿,量能放到 1.84 倍,买卖比只有 0.58,主动成交偏空很明显。关键是 OI 没往上顶,反而小幅缩——1h 名义 −0.03%,15m −0.80%,全池名义变化排名倒挺靠前(#23)。
这更像多头去杠杆,不是新空进场砸盘。止损、减仓、被动收缩,一路推着价格往下走。
24h 还有 107M 成交额撑着,但现在这个位置追空性价比一般。等 OI 稳住、主动成交回正再看,别急着接刀。
$PONS 这波跌得不算猛,但结构挺难看。
15m 直接跌破近 20 根 5m K 的下沿,量能放到 1.84 倍,买卖比只有 0.58,主动成交偏空很明显。关键是 OI 没往上顶,反而小幅缩——1h 名义 −0.03%,15m −0.80%,全池名义变化排名倒挺靠前(#23)。
这更像多头去杠杆,不是新空进场砸盘。止损、减仓、被动收缩,一路推着价格往下走。
24h 还有 107M 成交额撑着,但现在这个位置追空性价比一般。等 OI 稳住、主动成交回正再看,别急着接刀。
15m 直接跌破近 20 根 5m K 的下沿,量能放到 1.84 倍,买卖比只有 0.58,主动成交偏空很明显。关键是 OI 没往上顶,反而小幅缩——1h 名义 −0.03%,15m −0.80%,全池名义变化排名倒挺靠前(#23)。
这更像多头去杠杆,不是新空进场砸盘。止损、减仓、被动收缩,一路推着价格往下走。
24h 还有 107M 成交额撑着,但现在这个位置追空性价比一般。等 OI 稳住、主动成交回正再看,别急着接刀。
8
·
--
See translation
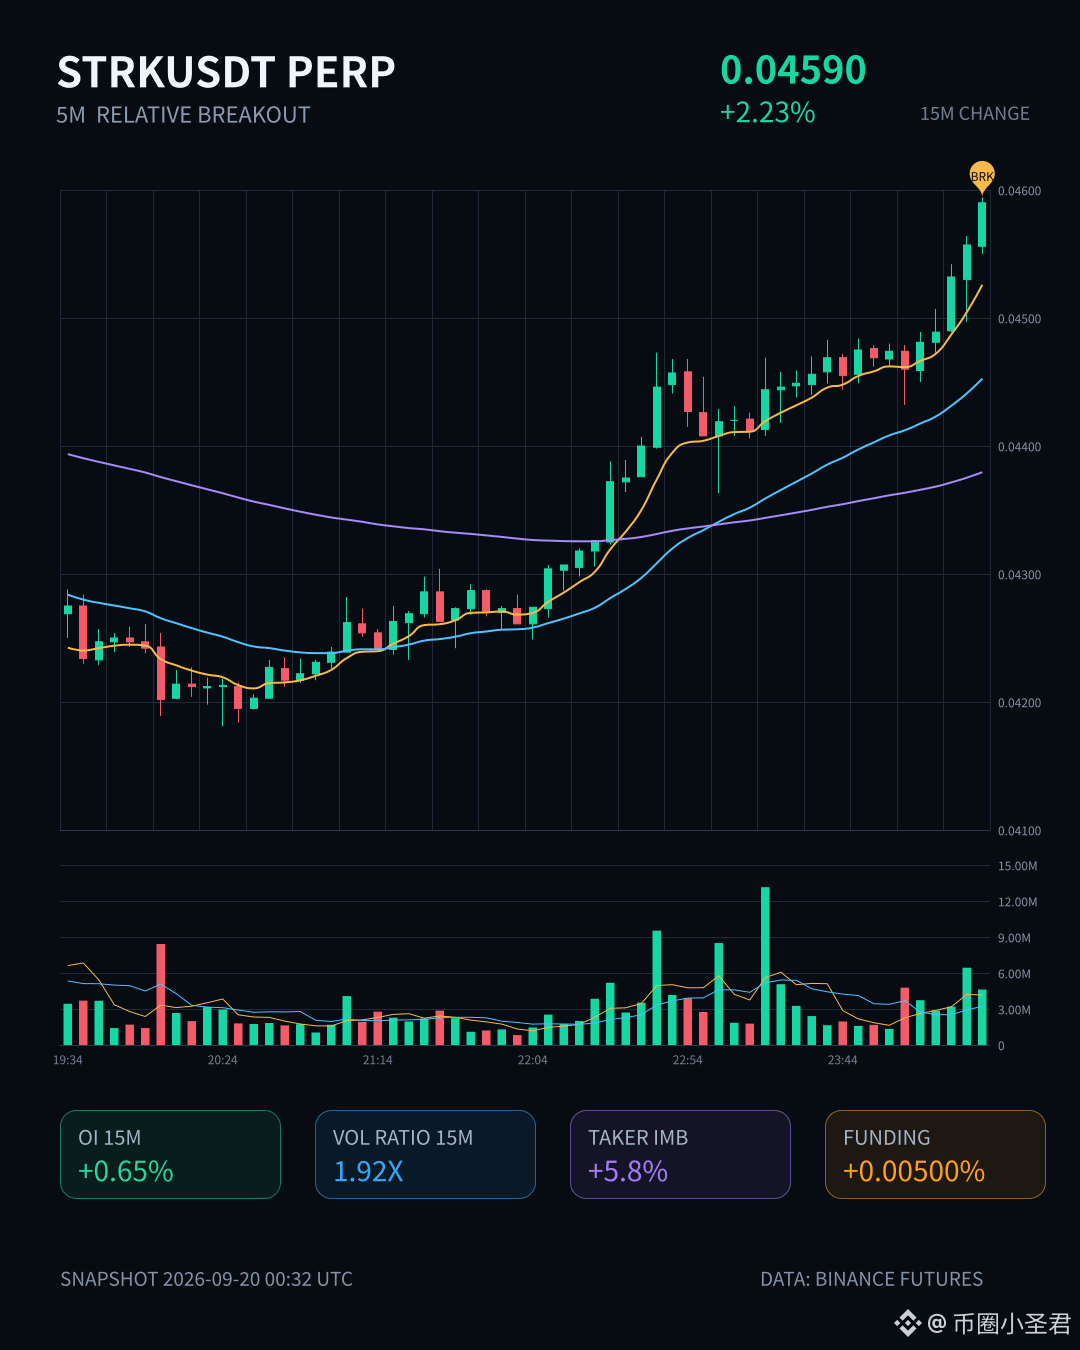
$STRK 这波有点意思。
15m 拉了 2.23%,量能直接干到 1.92x,Z 值 3.40,价格刚刚收了近 20 根 5m 的上沿。关键不是单纯拉盘——OI 1h 跟着涨了 1.46%,名义 665K 进来,异常分位 83.9%,全池排到 #23。这是新增杠杆多头在推,不是空头回补那种虚火。
主动成交差 5.8%,买卖比 1.12,资金费率也顶到近期高分位了。24h 成交额 140M,深度够,不是薄池子插针。
结构上属于上涨 + OI 升的组合,比单纯拉爆空头健康一些,但费率这个位置也得留个心眼,别在情绪最热的时候无脑追。先看能不能站稳这个区间上沿,回踩不破就是好事。
$STRK 这波有点意思。
15m 拉了 2.23%,量能直接干到 1.92x,Z 值 3.40,价格刚刚收了近 20 根 5m 的上沿。关键不是单纯拉盘——OI 1h 跟着涨了 1.46%,名义 665K 进来,异常分位 83.9%,全池排到 #23。这是新增杠杆多头在推,不是空头回补那种虚火。
主动成交差 5.8%,买卖比 1.12,资金费率也顶到近期高分位了。24h 成交额 140M,深度够,不是薄池子插针。
结构上属于上涨 + OI 升的组合,比单纯拉爆空头健康一些,但费率这个位置也得留个心眼,别在情绪最热的时候无脑追。先看能不能站稳这个区间上沿,回踩不破就是好事。
15m 拉了 2.23%,量能直接干到 1.92x,Z 值 3.40,价格刚刚收了近 20 根 5m 的上沿。关键不是单纯拉盘——OI 1h 跟着涨了 1.46%,名义 665K 进来,异常分位 83.9%,全池排到 #23。这是新增杠杆多头在推,不是空头回补那种虚火。
主动成交差 5.8%,买卖比 1.12,资金费率也顶到近期高分位了。24h 成交额 140M,深度够,不是薄池子插针。
结构上属于上涨 + OI 升的组合,比单纯拉爆空头健康一些,但费率这个位置也得留个心眼,别在情绪最热的时候无脑追。先看能不能站稳这个区间上沿,回踩不破就是好事。
61
·
--
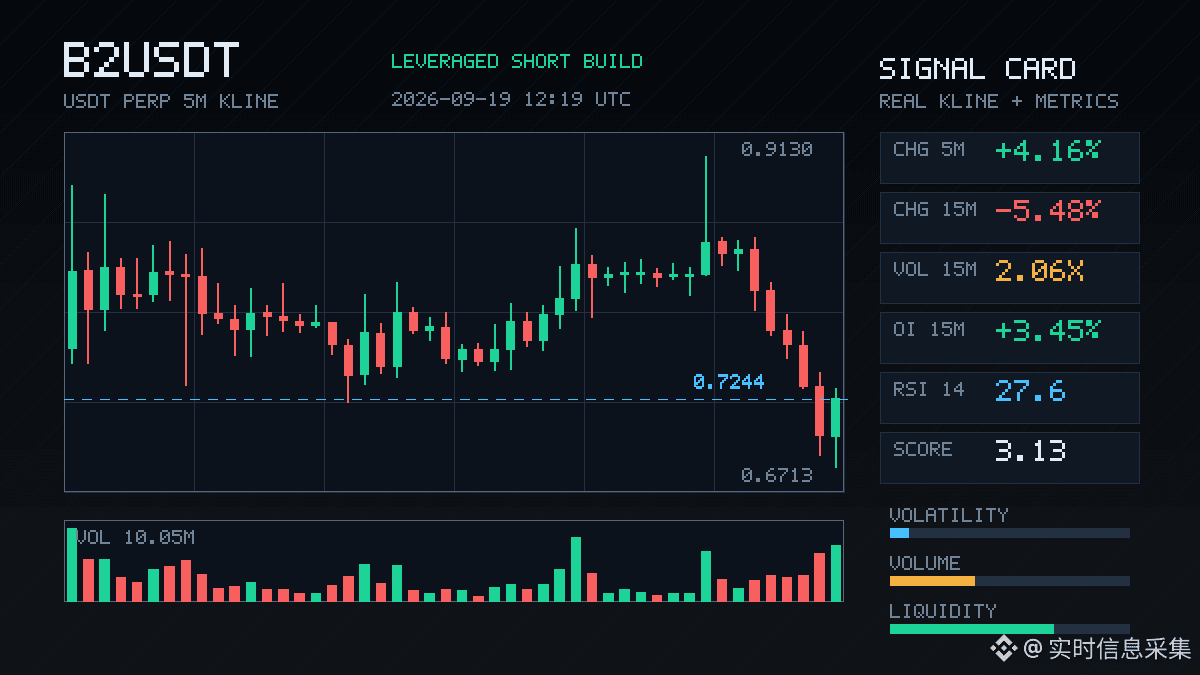
$B2 This sell-off has some substance. In the 15m chart, the price dropped directly by 5.48%, and volume surged to 2.06x—but it’s not just pure panic selling. OI on the 15m actually increased by 3.45%, a typical pattern of price down and positions up. New leveraged short orders are entering; it’s not just old longs getting pushed out.
What’s interesting is that the 1h OI is -1.02%, with a nominal change of -12.92%, suggesting that over this hour overall positions are being reduced. But in the most recent 15 minutes, suddenly someone added shorts. The abnormal percentile is 92.9%, ranking #23 across the whole pool, and it has persisted across several consecutive intervals—so this signal quality isn’t low.
Aggressive trades are down by -3.3%, buy/sell ratio is 0.94: sell pressure is dominant but not to an extreme level. The 24h trading volume is 109M—liquidity is deep enough; this isn’t some fake move from a small pool.
The current question is: are these new shorts jumping the gun, or are they catching the falling knife? If OI keeps rising while price keeps dropping, but the subsequent volume can’t keep up, then short covering would be the fuel for a rebound. If it continues to sell off with increasing volume and breaks lower, then the trend is confirmed. Watch the OI change on the next 15m candle—if the logic of adding shorts is still continuing, it won’t be a good time to step in.
$B2 This sell-off has some substance. In the 15m chart, the price dropped directly by 5.48%, and volume surged to 2.06x—but it’s not just pure panic selling. OI on the 15m actually increased by 3.45%, a typical pattern of price down and positions up. New leveraged short orders are entering; it’s not just old longs getting pushed out.
What’s interesting is that the 1h OI is -1.02%, with a nominal change of -12.92%, suggesting that over this hour overall positions are being reduced. But in the most recent 15 minutes, suddenly someone added shorts. The abnormal percentile is 92.9%, ranking #23 across the whole pool, and it has persisted across several consecutive intervals—so this signal quality isn’t low.
Aggressive trades are down by -3.3%, buy/sell ratio is 0.94: sell pressure is dominant but not to an extreme level. The 24h trading volume is 109M—liquidity is deep enough; this isn’t some fake move from a small pool.
The current question is: are these new shorts jumping the gun, or are they catching the falling knife? If OI keeps rising while price keeps dropping, but the subsequent volume can’t keep up, then short covering would be the fuel for a rebound. If it continues to sell off with increasing volume and breaks lower, then the trend is confirmed. Watch the OI change on the next 15m candle—if the logic of adding shorts is still continuing, it won’t be a good time to step in.
What’s interesting is that the 1h OI is -1.02%, with a nominal change of -12.92%, suggesting that over this hour overall positions are being reduced. But in the most recent 15 minutes, suddenly someone added shorts. The abnormal percentile is 92.9%, ranking #23 across the whole pool, and it has persisted across several consecutive intervals—so this signal quality isn’t low.
Aggressive trades are down by -3.3%, buy/sell ratio is 0.94: sell pressure is dominant but not to an extreme level. The 24h trading volume is 109M—liquidity is deep enough; this isn’t some fake move from a small pool.
The current question is: are these new shorts jumping the gun, or are they catching the falling knife? If OI keeps rising while price keeps dropping, but the subsequent volume can’t keep up, then short covering would be the fuel for a rebound. If it continues to sell off with increasing volume and breaks lower, then the trend is confirmed. Watch the OI change on the next 15m candle—if the logic of adding shorts is still continuing, it won’t be a good time to step in.
193
·
--
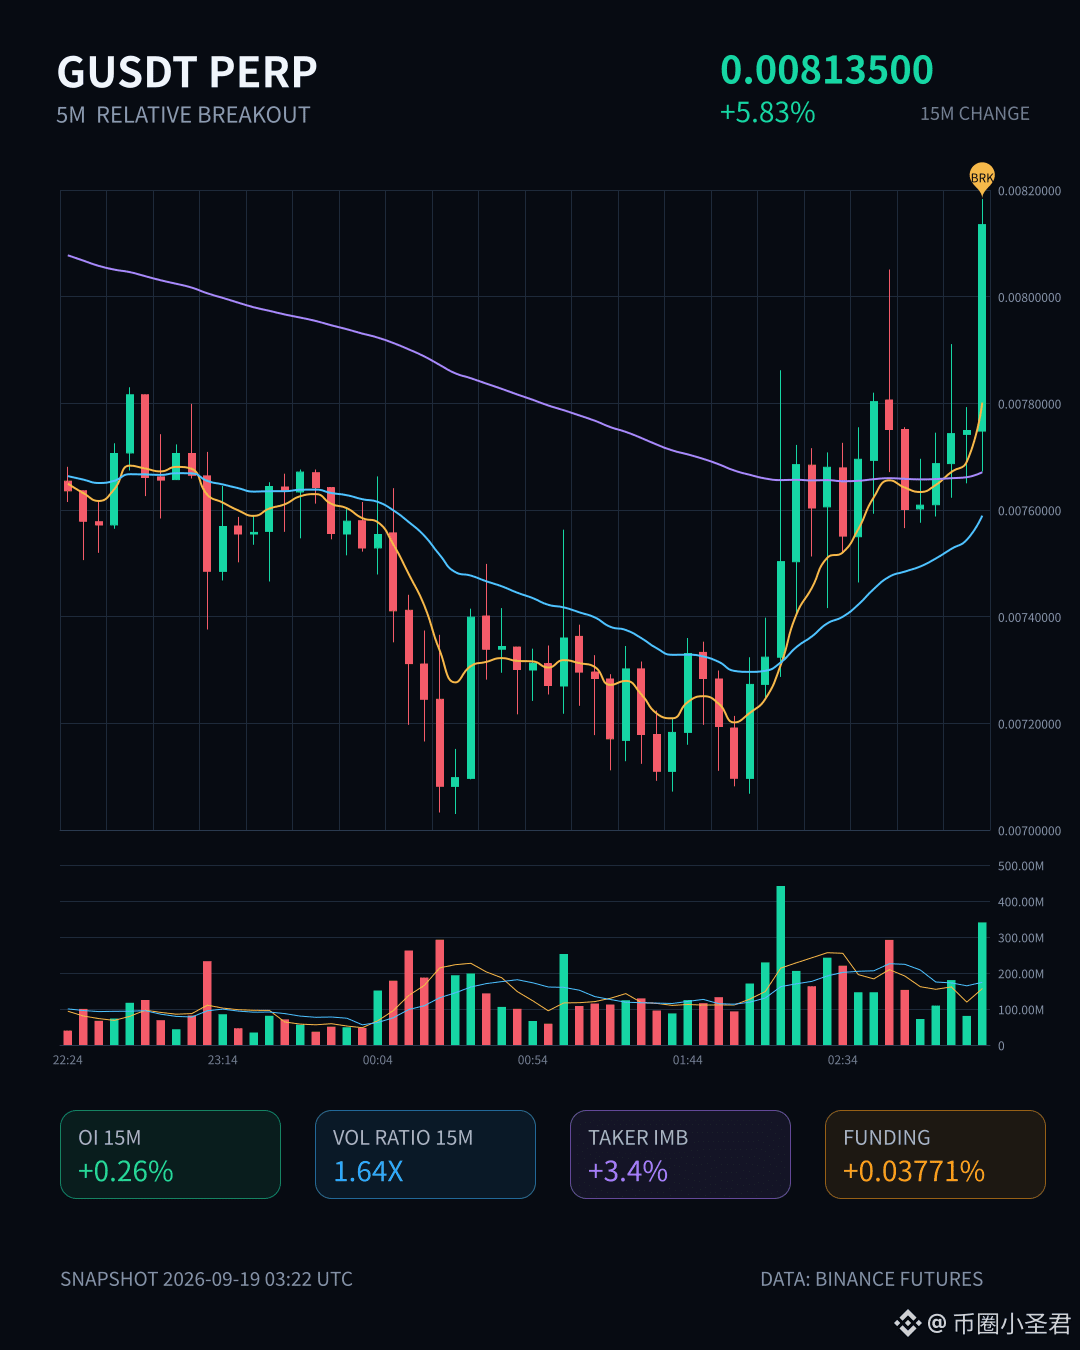
$G This move is a bit interesting.
In 15m, it’s up 5.83%; volume is 1.64x. It directly broke through the upper edge of the recent ~20 consecutive 5m candles. The key is that OI is rising along with it—on 15m, OI +0.26%, nominal +936K; on the 1h timeframe, nominal also added 860K. Price is rising along with OI—this doesn’t look like a short-squeeze kind of fakeout; it looks more like someone is opening fresh longs.
Anomaly percentile is 88.5%, total pool #23, nominal change #14. Depth has been confirmed.
24h trading value is 707M, which isn’t small in the pool.
Active trade gap is 3.4%, buy/sell ratio is 1.07—bullish, but not overheated.
First, see whether it can hold above this range’s upper edge. If it’s a false breakout, OI will speak first.
$G This move is a bit interesting.
In 15m, it’s up 5.83%; volume is 1.64x. It directly broke through the upper edge of the recent ~20 consecutive 5m candles. The key is that OI is rising along with it—on 15m, OI +0.26%, nominal +936K; on the 1h timeframe, nominal also added 860K. Price is rising along with OI—this doesn’t look like a short-squeeze kind of fakeout; it looks more like someone is opening fresh longs.
Anomaly percentile is 88.5%, total pool #23, nominal change #14. Depth has been confirmed.
24h trading value is 707M, which isn’t small in the pool.
Active trade gap is 3.4%, buy/sell ratio is 1.07—bullish, but not overheated.
First, see whether it can hold above this range’s upper edge. If it’s a false breakout, OI will speak first.
In 15m, it’s up 5.83%; volume is 1.64x. It directly broke through the upper edge of the recent ~20 consecutive 5m candles. The key is that OI is rising along with it—on 15m, OI +0.26%, nominal +936K; on the 1h timeframe, nominal also added 860K. Price is rising along with OI—this doesn’t look like a short-squeeze kind of fakeout; it looks more like someone is opening fresh longs.
Anomaly percentile is 88.5%, total pool #23, nominal change #14. Depth has been confirmed.
24h trading value is 707M, which isn’t small in the pool.
Active trade gap is 3.4%, buy/sell ratio is 1.07—bullish, but not overheated.
First, see whether it can hold above this range’s upper edge. If it’s a false breakout, OI will speak first.
26

·
--
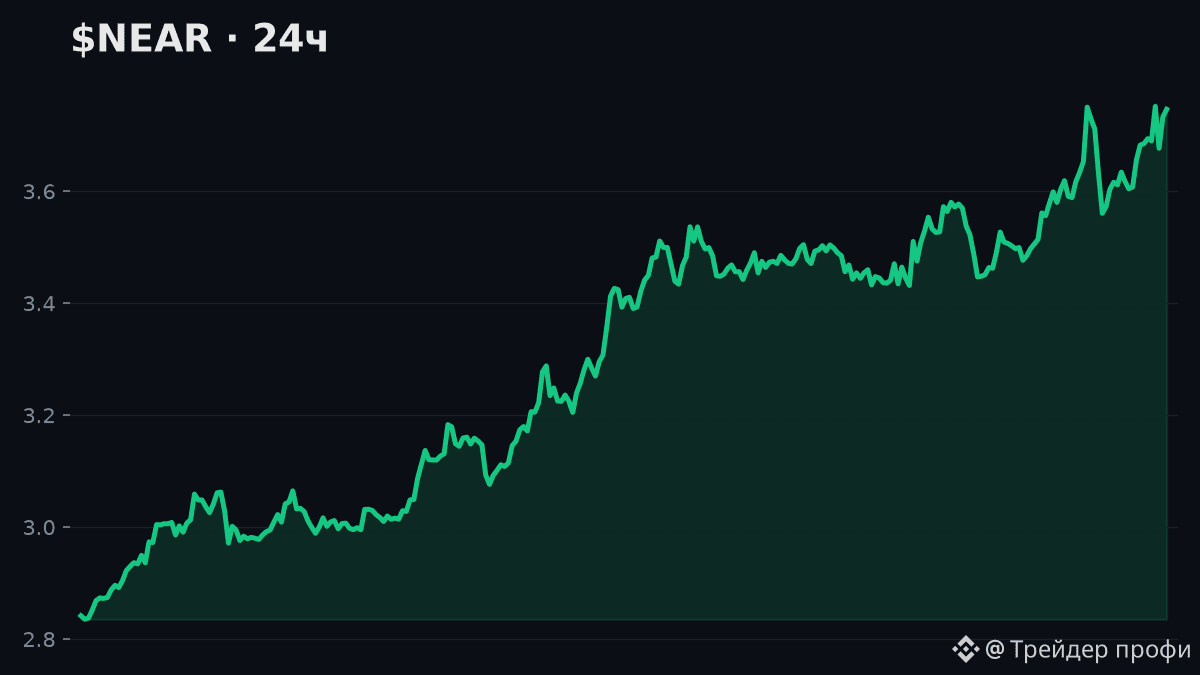
“%20+ Daily Gains – What’s the Secret Behind NEAR’s Fast Jump from 3.7$ to 4.5$?”NEAR Protocol (NEARUSDT) is trending right now!
Rank: #23
Seeing a %20+ increase within a single day makes most traders wonder, “Is it a pump or a dump?” Here’s the surprising reality: NEAR ( ) has the potential to jump from 3.726 USDT to 4.5 USDT in just 24 hours, and it’s already filling the liquidity pool with a $336 M volume. I don’t just view this move as a simple “momentum spike”; it signals a new integration of Layer‑2 scaling solutions. **Daily Data Breakdown** - **NEARUSDT**: +20.349% rise, last price 3.726 USDT, 336.6 M USDT volume. Opened at 3.096 USDT, high 3.835 USDT, low 3.063 USDT. - **SOLUSDT**: +11.789% increase, 113.22 USDT, 511.8 M USDT volume. A strong uptrend from 101.28 USDT to 113.22 USDT. - **UNIUSDT**: +15.414% increase, 8.873 USDT, 206.7 M USDT volume. A rise in liquidity, alongside the testnet launch of Uniswap V4. - **ADAUSDT** and **ATOMUSDT** also show gains of 12.4% and 11.3% respectively, proving they’ve regained interest in “alt‑layer” ecosystems. **My Alpha Call** - **NEAR**: A 4.5 USDT target (≈+21% higher) is reasonable within 48 hours. “Ape in” on open positions, and keep the stop‑loss at 3.45 USDT. - **SOL**: Break above 118 USDT, then aim for 125 USDT. The DCA (Dollar‑Cost‑Average) strategy works well during low‑volatility periods. - **UNI**: A “pump” is expected from the 9.5 USDT level, but to reduce the risk of a “dump,” set up a “sell‑the‑news” plan at 8.3 USDT. **Contrary View** Many analysts think this NEAR rally is a “one-time
“%20+ Daily Gains – What’s the Secret Behind NEAR’s Fast Jump from 3.7$ to 4.5$?”
NEAR Protocol (NEARUSDT) is trending right now!
Rank: #23
Seeing a %20+ increase within a single day makes most traders wonder, “Is it a pump or a dump?” Here’s the surprising reality: NEAR ( ) has the potential to jump from 3.726 USDT to 4.5 USDT in just 24 hours, and it’s already filling the liquidity pool with a $336 M volume. I don’t just view this move as a simple “momentum spike”; it signals a new integration of Layer‑2 scaling solutions. **Daily Data Breakdown** - **NEARUSDT**: +20.349% rise, last price 3.726 USDT, 336.6 M USDT volume. Opened at 3.096 USDT, high 3.835 USDT, low 3.063 USDT. - **SOLUSDT**: +11.789% increase, 113.22 USDT, 511.8 M USDT volume. A strong uptrend from 101.28 USDT to 113.22 USDT. - **UNIUSDT**: +15.414% increase, 8.873 USDT, 206.7 M USDT volume. A rise in liquidity, alongside the testnet launch of Uniswap V4. - **ADAUSDT** and **ATOMUSDT** also show gains of 12.4% and 11.3% respectively, proving they’ve regained interest in “alt‑layer” ecosystems. **My Alpha Call** - **NEAR**: A 4.5 USDT target (≈+21% higher) is reasonable within 48 hours. “Ape in” on open positions, and keep the stop‑loss at 3.45 USDT. - **SOL**: Break above 118 USDT, then aim for 125 USDT. The DCA (Dollar‑Cost‑Average) strategy works well during low‑volatility periods. - **UNI**: A “pump” is expected from the 9.5 USDT level, but to reduce the risk of a “dump,” set up a “sell‑the‑news” plan at 8.3 USDT. **Contrary View** Many analysts think this NEAR rally is a “one-time
Rank: #23
Seeing a %20+ increase within a single day makes most traders wonder, “Is it a pump or a dump?” Here’s the surprising reality: NEAR ( ) has the potential to jump from 3.726 USDT to 4.5 USDT in just 24 hours, and it’s already filling the liquidity pool with a $336 M volume. I don’t just view this move as a simple “momentum spike”; it signals a new integration of Layer‑2 scaling solutions. **Daily Data Breakdown** - **NEARUSDT**: +20.349% rise, last price 3.726 USDT, 336.6 M USDT volume. Opened at 3.096 USDT, high 3.835 USDT, low 3.063 USDT. - **SOLUSDT**: +11.789% increase, 113.22 USDT, 511.8 M USDT volume. A strong uptrend from 101.28 USDT to 113.22 USDT. - **UNIUSDT**: +15.414% increase, 8.873 USDT, 206.7 M USDT volume. A rise in liquidity, alongside the testnet launch of Uniswap V4. - **ADAUSDT** and **ATOMUSDT** also show gains of 12.4% and 11.3% respectively, proving they’ve regained interest in “alt‑layer” ecosystems. **My Alpha Call** - **NEAR**: A 4.5 USDT target (≈+21% higher) is reasonable within 48 hours. “Ape in” on open positions, and keep the stop‑loss at 3.45 USDT. - **SOL**: Break above 118 USDT, then aim for 125 USDT. The DCA (Dollar‑Cost‑Average) strategy works well during low‑volatility periods. - **UNI**: A “pump” is expected from the 9.5 USDT level, but to reduce the risk of a “dump,” set up a “sell‑the‑news” plan at 8.3 USDT. **Contrary View** Many analysts think this NEAR rally is a “one-time
68

Article
$NEAR +31.5% in 24h — turned into a rocket — the strongest in the top-100!🚀 $NEAR +31.5% in 24h — turned into a rocket — the strongest in the top-100!
The market today doesn’t spare the boring. 👀
🧭 Summary: movement is in line with the broader trend — 7D and 30D in the same direction; confirmed by high trading volume.
🌍 Market context: out of 73 major coins with notable movement over the past 24h — 🔼 69 went up, 🔽 4 fell
$NEAR +31.5% in 24h — turned into a rocket — the strongest in the top-100!
🚀 $NEAR +31.5% in 24h — turned into a rocket — the strongest in the top-100!
The market today doesn’t spare the boring. 👀
🧭 Summary: movement is in line with the broader trend — 7D and 30D in the same direction; confirmed by high trading volume.
🌍 Market context: out of 73 major coins with notable movement over the past 24h — 🔼 69 went up, 🔽 4 fell
The market today doesn’t spare the boring. 👀
🧭 Summary: movement is in line with the broader trend — 7D and 30D in the same direction; confirmed by high trading volume.
🌍 Market context: out of 73 major coins with notable movement over the past 24h — 🔼 69 went up, 🔽 4 fell
163
·
--
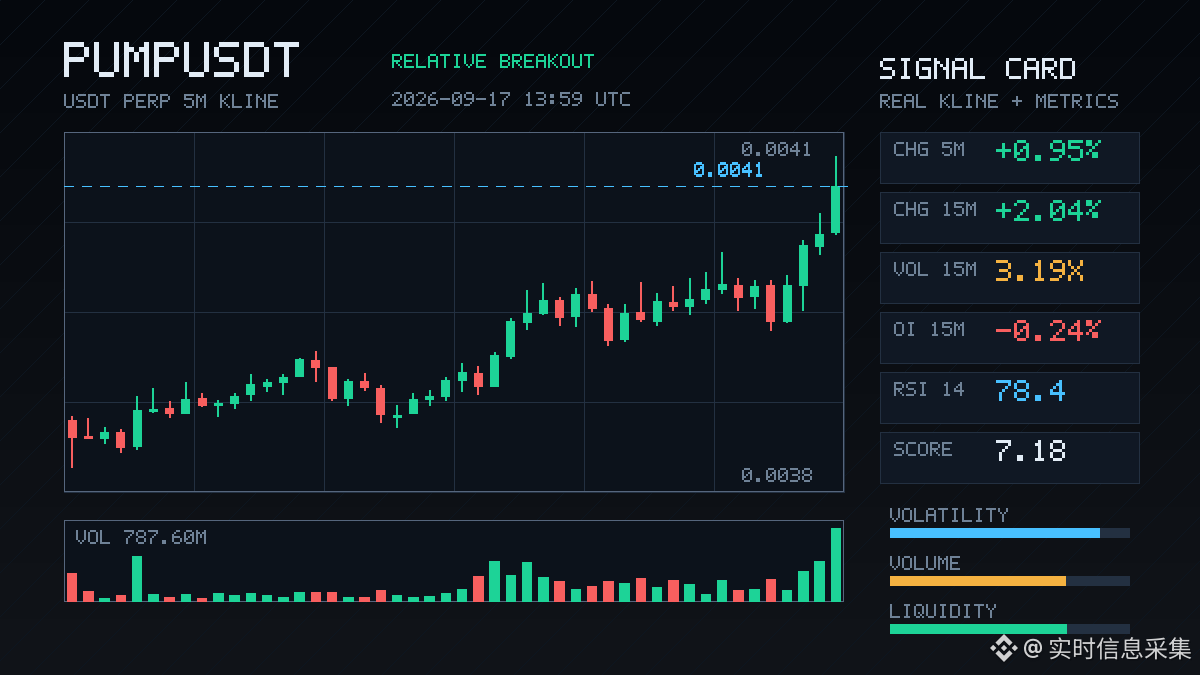
$PUMP This spot is kind of interesting.
In 15m, it pulled up 2%. Volume directly reached 3.19×, the volatility Z hit 3.49, and the closing price broke above the upper band of the last ~20 5m candles. Active trade imbalance is +19.2%, with buy/sell ratio at 1.48—clearly, funds are pushing upward.
But OI is falling—15m -0.24%, 1h -0.59%, while the notional is still increasing. Price is rising while OI is declining, which smells more like short covering than a fresh bullish surge. Funding rates are in the high percentile recently; OI is at an extreme percentile of 96.8%, Pool #23, notional change #10. The trend has been continuing across several consecutive cycles.
24h trading volume is 158 million, and the depth is sufficient. What matters now is whether this short-covering move can open up room to the upside—or whether it hits an extreme zone and then fizzles out.
High level, high funding, OI divergence—I’m inclined to watch first and not rush to chase.
$PUMP This spot is kind of interesting.
In 15m, it pulled up 2%. Volume directly reached 3.19×, the volatility Z hit 3.49, and the closing price broke above the upper band of the last ~20 5m candles. Active trade imbalance is +19.2%, with buy/sell ratio at 1.48—clearly, funds are pushing upward.
But OI is falling—15m -0.24%, 1h -0.59%, while the notional is still increasing. Price is rising while OI is declining, which smells more like short covering than a fresh bullish surge. Funding rates are in the high percentile recently; OI is at an extreme percentile of 96.8%, Pool #23, notional change #10. The trend has been continuing across several consecutive cycles.
24h trading volume is 158 million, and the depth is sufficient. What matters now is whether this short-covering move can open up room to the upside—or whether it hits an extreme zone and then fizzles out.
High level, high funding, OI divergence—I’m inclined to watch first and not rush to chase.
In 15m, it pulled up 2%. Volume directly reached 3.19×, the volatility Z hit 3.49, and the closing price broke above the upper band of the last ~20 5m candles. Active trade imbalance is +19.2%, with buy/sell ratio at 1.48—clearly, funds are pushing upward.
But OI is falling—15m -0.24%, 1h -0.59%, while the notional is still increasing. Price is rising while OI is declining, which smells more like short covering than a fresh bullish surge. Funding rates are in the high percentile recently; OI is at an extreme percentile of 96.8%, Pool #23, notional change #10. The trend has been continuing across several consecutive cycles.
24h trading volume is 158 million, and the depth is sufficient. What matters now is whether this short-covering move can open up room to the upside—or whether it hits an extreme zone and then fizzles out.
High level, high funding, OI divergence—I’m inclined to watch first and not rush to chase.
3

·
--
XRP hasn’t dropped all that much on this 15m move—only 0.87%, but volume surged to 2.43x, with a Z-score of 2.48. This kind of volume-accompanied sell-off, paired with an order-flow imbalance of Active Trades difference -12.5% and the buy/sell ratio at 0.78, clearly favors the sellers.
More importantly, look at OI: the 15m contract is -0.08%, with a notional change of -3.79M. The 1h contract is +0.01%, but its notional change is -5.86M, down 1.5%. With price falling while OI also falls, this is typical of leveraged longs being liquidated—either stop-outs or active de-risking/position shrinking, not fresh shorts coming in to smash the market.
The close price has already broken below the lower edge of the recent 5m K-zone for nearly 20 candles. OI’s abnormal percentile is 98.4%; within the whole pool, the abnormality ranks #23, with notional change at #5. In such an extreme percentile, this relative breakdown is worth watching: will it continue deleveraging, or will it stabilize? 24h trading volume is 1.32B U—liquidity is sufficient—but the active direction remains bearish. Don’t rush to catch it.
XRP hasn’t dropped all that much on this 15m move—only 0.87%, but volume surged to 2.43x, with a Z-score of 2.48. This kind of volume-accompanied sell-off, paired with an order-flow imbalance of Active Trades difference -12.5% and the buy/sell ratio at 0.78, clearly favors the sellers.
More importantly, look at OI: the 15m contract is -0.08%, with a notional change of -3.79M. The 1h contract is +0.01%, but its notional change is -5.86M, down 1.5%. With price falling while OI also falls, this is typical of leveraged longs being liquidated—either stop-outs or active de-risking/position shrinking, not fresh shorts coming in to smash the market.
The close price has already broken below the lower edge of the recent 5m K-zone for nearly 20 candles. OI’s abnormal percentile is 98.4%; within the whole pool, the abnormality ranks #23, with notional change at #5. In such an extreme percentile, this relative breakdown is worth watching: will it continue deleveraging, or will it stabilize? 24h trading volume is 1.32B U—liquidity is sufficient—but the active direction remains bearish. Don’t rush to catch it.
More importantly, look at OI: the 15m contract is -0.08%, with a notional change of -3.79M. The 1h contract is +0.01%, but its notional change is -5.86M, down 1.5%. With price falling while OI also falls, this is typical of leveraged longs being liquidated—either stop-outs or active de-risking/position shrinking, not fresh shorts coming in to smash the market.
The close price has already broken below the lower edge of the recent 5m K-zone for nearly 20 candles. OI’s abnormal percentile is 98.4%; within the whole pool, the abnormality ranks #23, with notional change at #5. In such an extreme percentile, this relative breakdown is worth watching: will it continue deleveraging, or will it stabilize? 24h trading volume is 1.32B U—liquidity is sufficient—but the active direction remains bearish. Don’t rush to catch it.
1
·
--
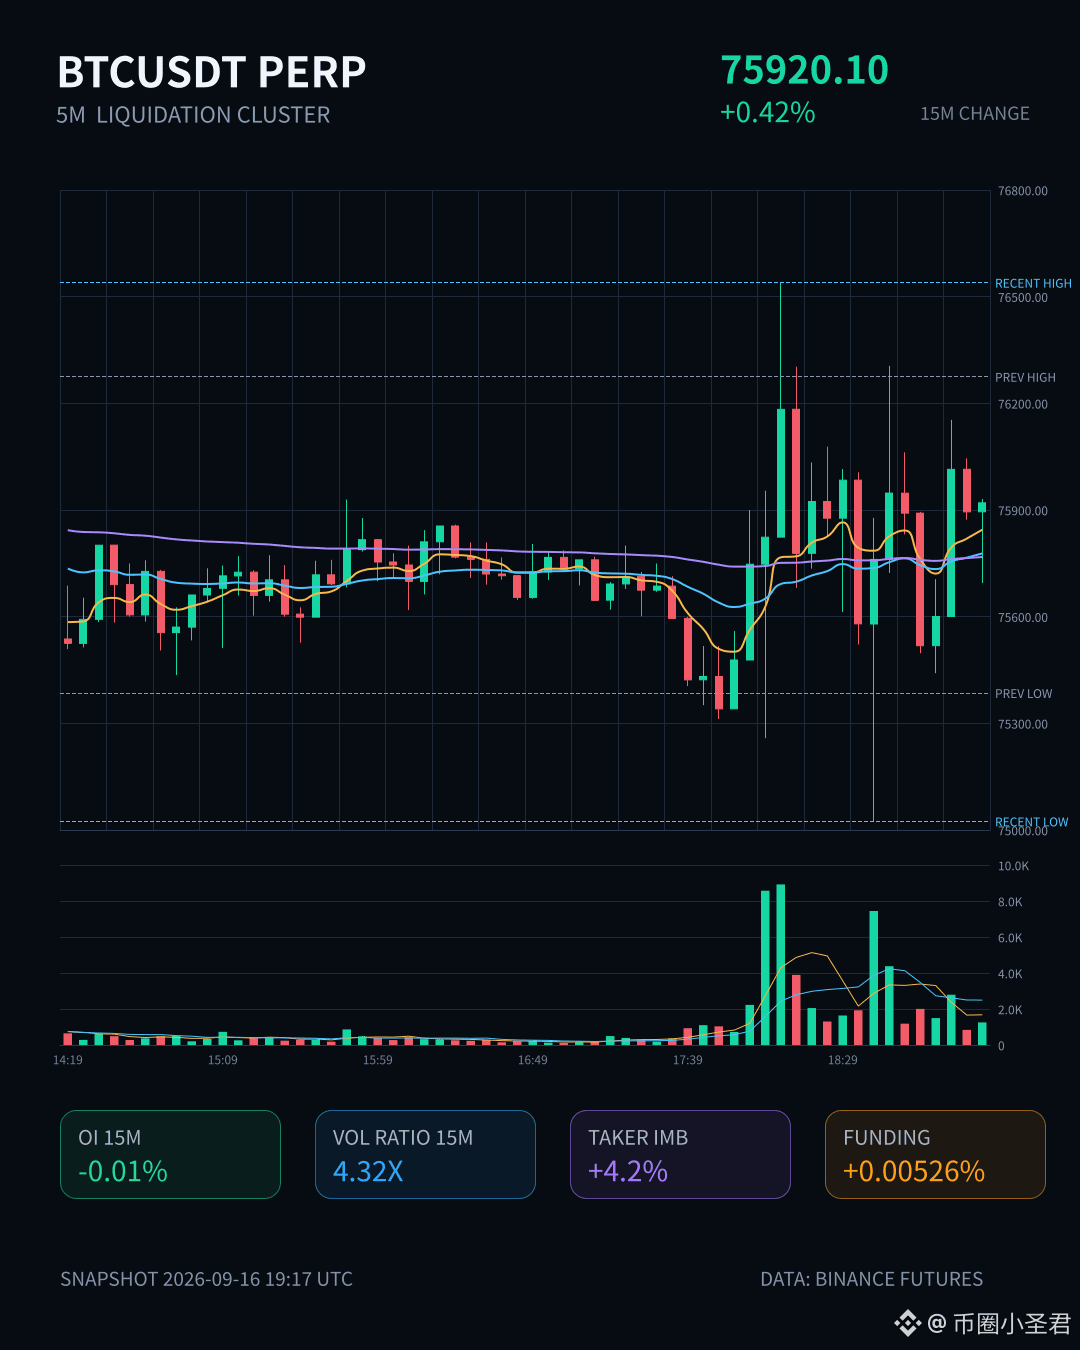
3:30 a.m. — this wave doesn’t taste right.
The price is up 0.42%, volume surged to 4.32x, yet OI actually dips slightly at the 15m level. Still, the notional change jumped to the #1 in the whole pool. In plain terms: the price is rising, but the open interest hasn’t caught up. This isn’t fresh long-side money entering—this looks like shorts getting lifted off.
On Binance at the 5m level, forced-liquidation agents are at 450K, clearly concentrated on the buy side—too obvious a sign of short covering. Active fills are 4.2% lower, the buy/sell ratio is 1.09. Simply put: someone is catching orders up top, but they’re not catching aggressively.
At the 1h level, OI is still positive at +0.93%, and there’s a 90M increase sitting there, so don’t rush to shout "multi-kill mode is over" or "it’s going to waterfall." This is more like a round of position covering, not the starting point of a trend reversal.
The real signal isn’t in the percentage move—it’s in the structure. Price up + OI down. I’ve seen this combo way too many times: either the shorts get beaten into taking a break, or it’s just handover/rotation before the next leg. Anomaly quantile at 88.3%, pool #23, continuation across multiple consecutive cycles—on the data side, it’s definitely a legit anomaly.
My stance: don’t chase, just watch. Once the liquidation pressure cluster has fully released, the direction will show itself for real. $BTC
3:30 a.m. — this wave doesn’t taste right.
The price is up 0.42%, volume surged to 4.32x, yet OI actually dips slightly at the 15m level. Still, the notional change jumped to the #1 in the whole pool. In plain terms: the price is rising, but the open interest hasn’t caught up. This isn’t fresh long-side money entering—this looks like shorts getting lifted off.
On Binance at the 5m level, forced-liquidation agents are at 450K, clearly concentrated on the buy side—too obvious a sign of short covering. Active fills are 4.2% lower, the buy/sell ratio is 1.09. Simply put: someone is catching orders up top, but they’re not catching aggressively.
At the 1h level, OI is still positive at +0.93%, and there’s a 90M increase sitting there, so don’t rush to shout "multi-kill mode is over" or "it’s going to waterfall." This is more like a round of position covering, not the starting point of a trend reversal.
The real signal isn’t in the percentage move—it’s in the structure. Price up + OI down. I’ve seen this combo way too many times: either the shorts get beaten into taking a break, or it’s just handover/rotation before the next leg. Anomaly quantile at 88.3%, pool #23, continuation across multiple consecutive cycles—on the data side, it’s definitely a legit anomaly.
My stance: don’t chase, just watch. Once the liquidation pressure cluster has fully released, the direction will show itself for real. $BTC
The price is up 0.42%, volume surged to 4.32x, yet OI actually dips slightly at the 15m level. Still, the notional change jumped to the #1 in the whole pool. In plain terms: the price is rising, but the open interest hasn’t caught up. This isn’t fresh long-side money entering—this looks like shorts getting lifted off.
On Binance at the 5m level, forced-liquidation agents are at 450K, clearly concentrated on the buy side—too obvious a sign of short covering. Active fills are 4.2% lower, the buy/sell ratio is 1.09. Simply put: someone is catching orders up top, but they’re not catching aggressively.
At the 1h level, OI is still positive at +0.93%, and there’s a 90M increase sitting there, so don’t rush to shout "multi-kill mode is over" or "it’s going to waterfall." This is more like a round of position covering, not the starting point of a trend reversal.
The real signal isn’t in the percentage move—it’s in the structure. Price up + OI down. I’ve seen this combo way too many times: either the shorts get beaten into taking a break, or it’s just handover/rotation before the next leg. Anomaly quantile at 88.3%, pool #23, continuation across multiple consecutive cycles—on the data side, it’s definitely a legit anomaly.
My stance: don’t chase, just watch. Once the liquidation pressure cluster has fully released, the direction will show itself for real. $BTC
225
·
--
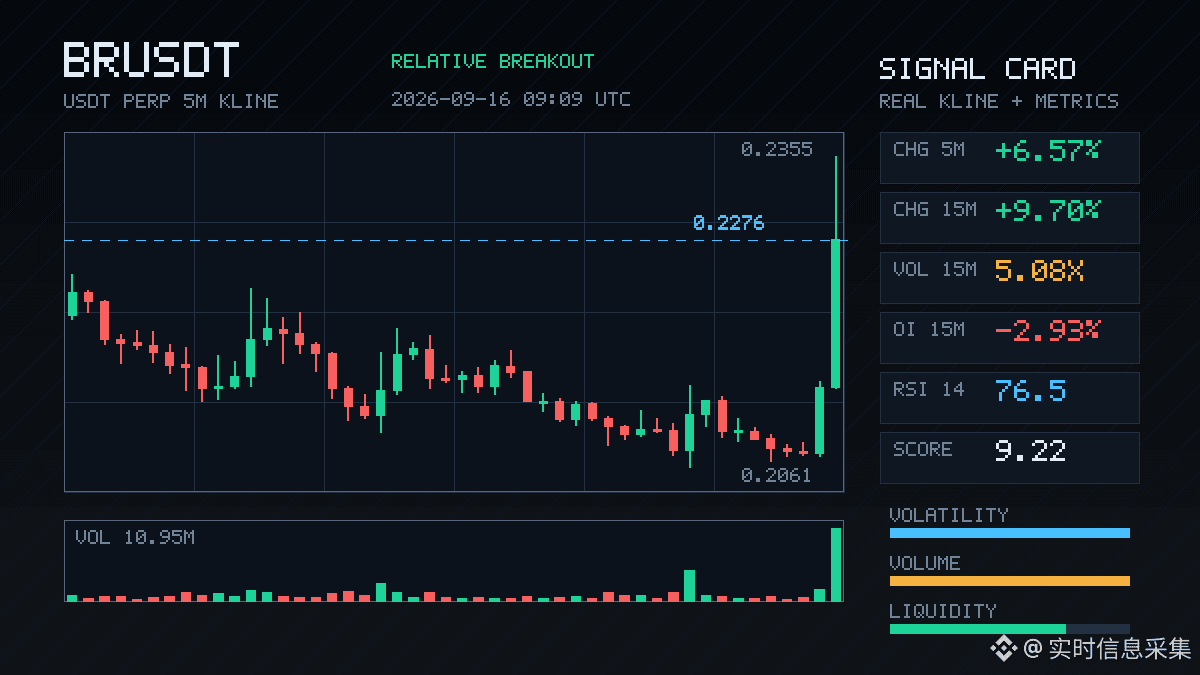
$BR This rally is a bit intense—on the 15m timeframe it straight-up surged +9.7%. The volume expanded to more than 5 times, the Z-value is 7.48, and it’s no longer ordinary volatility. Price broke above the upper band of nearly 20 consecutive 5m candles, with buy orders showing relative strength. The buy/sell ratio is 1.35—it looks like there’s capital actively pushing.
But there’s an interesting detail: with the price rising like this, OI is actually declining. The 15m contract is -2.93%, 1h is -1.07%, and nominal changes are still increasing. This structure looks more like shorts getting squeezed and positions being unwound, pushing price higher, rather than fresh longs aggressively opening new positions. Short-covering squeezes often come fast and go fast too—if you chase the move, keep your eyes open.
Abnormal ranking in the whole pool is #23, nominal change is #12. In the past 24h, turnover is 155M, and both momentum and liquidity are online. At this point, the key is whether the pullback can hold the upper edge of the breakout zone you just saw. If it holds, there may be a second wave; if it doesn’t, then it’s likely just a one-off short squeeze.
$BR This rally is a bit intense—on the 15m timeframe it straight-up surged +9.7%. The volume expanded to more than 5 times, the Z-value is 7.48, and it’s no longer ordinary volatility. Price broke above the upper band of nearly 20 consecutive 5m candles, with buy orders showing relative strength. The buy/sell ratio is 1.35—it looks like there’s capital actively pushing.
But there’s an interesting detail: with the price rising like this, OI is actually declining. The 15m contract is -2.93%, 1h is -1.07%, and nominal changes are still increasing. This structure looks more like shorts getting squeezed and positions being unwound, pushing price higher, rather than fresh longs aggressively opening new positions. Short-covering squeezes often come fast and go fast too—if you chase the move, keep your eyes open.
Abnormal ranking in the whole pool is #23, nominal change is #12. In the past 24h, turnover is 155M, and both momentum and liquidity are online. At this point, the key is whether the pullback can hold the upper edge of the breakout zone you just saw. If it holds, there may be a second wave; if it doesn’t, then it’s likely just a one-off short squeeze.
But there’s an interesting detail: with the price rising like this, OI is actually declining. The 15m contract is -2.93%, 1h is -1.07%, and nominal changes are still increasing. This structure looks more like shorts getting squeezed and positions being unwound, pushing price higher, rather than fresh longs aggressively opening new positions. Short-covering squeezes often come fast and go fast too—if you chase the move, keep your eyes open.
Abnormal ranking in the whole pool is #23, nominal change is #12. In the past 24h, turnover is 155M, and both momentum and liquidity are online. At this point, the key is whether the pullback can hold the upper edge of the breakout zone you just saw. If it holds, there may be a second wave; if it doesn’t, then it’s likely just a one-off short squeeze.
4
·
--
ASTER This 15m move is kind of interesting. The price fell 0.72%, and volume surged to 3.28x. The aggressive trade gap is -24.7%, the buy-sell ratio is 0.60, and the close even broke below the lower edge of the past 20-plus 5m candles.
But OI didn’t drop along with it—1h notional change is only -341K, basically flat. Price moves down and leverage doesn’t retreat, which feels more like new shorts entering to push rather than longs capitulating with that kind of liquidation.
The pool’s notional change ranks #23, with an abnormal percentile of 67.9%. Not extreme, but the direction is pretty clear. 24h turnover is 50.92M, and the market is still holding up.
With this kind of structure, I usually don’t rush to take a side. First, I’ll see whether the breakdown of the lower band can accelerate—if shorts add size but still can’t knock it down, then that’s when you really need to be careful.
ASTER This 15m move is kind of interesting. The price fell 0.72%, and volume surged to 3.28x. The aggressive trade gap is -24.7%, the buy-sell ratio is 0.60, and the close even broke below the lower edge of the past 20-plus 5m candles.
But OI didn’t drop along with it—1h notional change is only -341K, basically flat. Price moves down and leverage doesn’t retreat, which feels more like new shorts entering to push rather than longs capitulating with that kind of liquidation.
The pool’s notional change ranks #23, with an abnormal percentile of 67.9%. Not extreme, but the direction is pretty clear. 24h turnover is 50.92M, and the market is still holding up.
With this kind of structure, I usually don’t rush to take a side. First, I’ll see whether the breakdown of the lower band can accelerate—if shorts add size but still can’t knock it down, then that’s when you really need to be careful.
But OI didn’t drop along with it—1h notional change is only -341K, basically flat. Price moves down and leverage doesn’t retreat, which feels more like new shorts entering to push rather than longs capitulating with that kind of liquidation.
The pool’s notional change ranks #23, with an abnormal percentile of 67.9%. Not extreme, but the direction is pretty clear. 24h turnover is 50.92M, and the market is still holding up.
With this kind of structure, I usually don’t rush to take a side. First, I’ll see whether the breakdown of the lower band can accelerate—if shorts add size but still can’t knock it down, then that’s when you really need to be careful.
14
·
--
$REZ This is a bit interesting.
In 15m, it only pulled less than 2 points, but the OI has been piling upward for several consecutive cycles. The 1h contract is +3.72%, and the notional increase is also over 270k U. Price is rising while open interest rises in sync—this looks like a typical leveraged long building positions, not just a simple short-covering pulse.
Volume expanded to 3x. The aggressive buy/sell ratio is 1.78, and the difference in aggressive trades is 28%, clearly leaning bullish. The abnormal percentile is 92.7%; in the whole pool it ranks #13 by order book, and the notional change ranks #23. It’s not the very top batch, but the strength comes from continuity and strong confirmation with depth.
In the last 24h, turnover is a little over 42M. The market’s not big; if OI continues making these consecutive moves, short-term volatility can easily be amplified. When longs add leverage, price often moves quite smoothly—but the issue is that once incremental buying stalls, reflexivity can hit just as fast.
First, watch whether OI keeps stacking. We’ll talk after it stops piling.
$REZ This is a bit interesting.
In 15m, it only pulled less than 2 points, but the OI has been piling upward for several consecutive cycles. The 1h contract is +3.72%, and the notional increase is also over 270k U. Price is rising while open interest rises in sync—this looks like a typical leveraged long building positions, not just a simple short-covering pulse.
Volume expanded to 3x. The aggressive buy/sell ratio is 1.78, and the difference in aggressive trades is 28%, clearly leaning bullish. The abnormal percentile is 92.7%; in the whole pool it ranks #13 by order book, and the notional change ranks #23. It’s not the very top batch, but the strength comes from continuity and strong confirmation with depth.
In the last 24h, turnover is a little over 42M. The market’s not big; if OI continues making these consecutive moves, short-term volatility can easily be amplified. When longs add leverage, price often moves quite smoothly—but the issue is that once incremental buying stalls, reflexivity can hit just as fast.
First, watch whether OI keeps stacking. We’ll talk after it stops piling.
In 15m, it only pulled less than 2 points, but the OI has been piling upward for several consecutive cycles. The 1h contract is +3.72%, and the notional increase is also over 270k U. Price is rising while open interest rises in sync—this looks like a typical leveraged long building positions, not just a simple short-covering pulse.
Volume expanded to 3x. The aggressive buy/sell ratio is 1.78, and the difference in aggressive trades is 28%, clearly leaning bullish. The abnormal percentile is 92.7%; in the whole pool it ranks #13 by order book, and the notional change ranks #23. It’s not the very top batch, but the strength comes from continuity and strong confirmation with depth.
In the last 24h, turnover is a little over 42M. The market’s not big; if OI continues making these consecutive moves, short-term volatility can easily be amplified. When longs add leverage, price often moves quite smoothly—but the issue is that once incremental buying stalls, reflexivity can hit just as fast.
First, watch whether OI keeps stacking. We’ll talk after it stops piling.
4
·
--
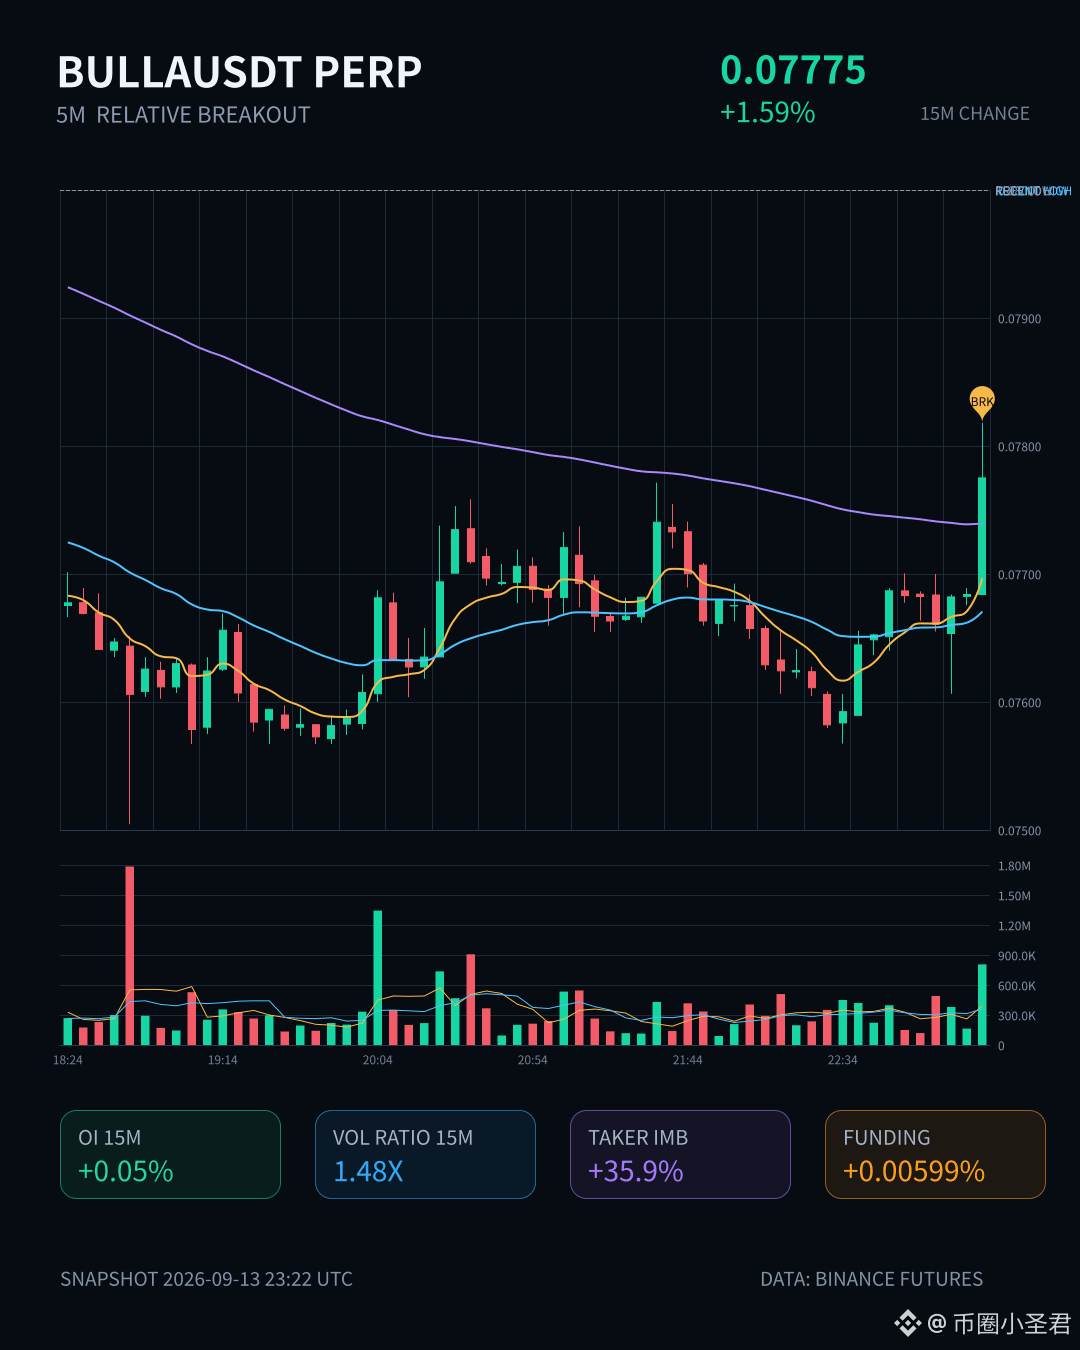
$BULLA This 15m move is kind of interesting. A 1.59% gain isn’t violent, but paired with the OI hourly +0.23% and notional +2.2%—it feels more like fresh leverage is slowly entering the market rather than old longs adding and just spinning.
The active trades are off by 35.9%, the buy-sell ratio is 2.12. The 5m closing price stands above the top of the recent range over nearly 20 intervals. If you chase the breakout from here, your stop-loss room is actually pretty clear, but don’t chase into the 15m candle’s upper wick with 1.48x volume.
Abnormal in the whole pool: #23, change in notional: #19. BULLA isn’t really the star today, but depth confirmation + net active buying are solid; the short-term structure is fine.
$BULLA This 15m move is kind of interesting. A 1.59% gain isn’t violent, but paired with the OI hourly +0.23% and notional +2.2%—it feels more like fresh leverage is slowly entering the market rather than old longs adding and just spinning.
The active trades are off by 35.9%, the buy-sell ratio is 2.12. The 5m closing price stands above the top of the recent range over nearly 20 intervals. If you chase the breakout from here, your stop-loss room is actually pretty clear, but don’t chase into the 15m candle’s upper wick with 1.48x volume.
Abnormal in the whole pool: #23, change in notional: #19. BULLA isn’t really the star today, but depth confirmation + net active buying are solid; the short-term structure is fine.
The active trades are off by 35.9%, the buy-sell ratio is 2.12. The 5m closing price stands above the top of the recent range over nearly 20 intervals. If you chase the breakout from here, your stop-loss room is actually pretty clear, but don’t chase into the 15m candle’s upper wick with 1.48x volume.
Abnormal in the whole pool: #23, change in notional: #19. BULLA isn’t really the star today, but depth confirmation + net active buying are solid; the short-term structure is fine.
113
·
--
$WLD at dawn this move is a bit interesting.
On the 15m timeframe, it dropped 0.76%. Volume expanded straight to 1.99x. The close fell below the lower bound of the last 20+ 5m candles. Active taker volume imbalance is -42.9%, and the buy/sell ratio is 0.40—meaning the selling pressure is real and not just a wick.
But OI is rising: 15m +0.13%, 1h +0.05%. The percentile is abnormal at 78.4%, and the overall pool ranks #23 by abnormality. Price is down while OI is up, yet the notional change is negative (-270K / -650K). This isn’t just a simple liquidation of long positions—more like new leveraged shorts moving in and “buying tickets.”
In the last 24h, turnover is 79M. This abnormality level in the pool is relatively high.
My view: the break below the lower end of the range is a fact, but shorts shouldn’t celebrate too early—OI is rising while notional shrinks, suggesting this leg of the short is more of a light-position probe. If it’s going to continue, we need to see whether there’s incremental volume coming in to keep pushing it higher; if volume fades back, then this drop may just be a one-off shakeout during a period of thinner liquidity.
For now, leave it alone—don’t chase. This kind of structure at dawn often gives you a second answer in the morning.
$WLD at dawn this move is a bit interesting.
On the 15m timeframe, it dropped 0.76%. Volume expanded straight to 1.99x. The close fell below the lower bound of the last 20+ 5m candles. Active taker volume imbalance is -42.9%, and the buy/sell ratio is 0.40—meaning the selling pressure is real and not just a wick.
But OI is rising: 15m +0.13%, 1h +0.05%. The percentile is abnormal at 78.4%, and the overall pool ranks #23 by abnormality. Price is down while OI is up, yet the notional change is negative (-270K / -650K). This isn’t just a simple liquidation of long positions—more like new leveraged shorts moving in and “buying tickets.”
In the last 24h, turnover is 79M. This abnormality level in the pool is relatively high.
My view: the break below the lower end of the range is a fact, but shorts shouldn’t celebrate too early—OI is rising while notional shrinks, suggesting this leg of the short is more of a light-position probe. If it’s going to continue, we need to see whether there’s incremental volume coming in to keep pushing it higher; if volume fades back, then this drop may just be a one-off shakeout during a period of thinner liquidity.
For now, leave it alone—don’t chase. This kind of structure at dawn often gives you a second answer in the morning.
On the 15m timeframe, it dropped 0.76%. Volume expanded straight to 1.99x. The close fell below the lower bound of the last 20+ 5m candles. Active taker volume imbalance is -42.9%, and the buy/sell ratio is 0.40—meaning the selling pressure is real and not just a wick.
But OI is rising: 15m +0.13%, 1h +0.05%. The percentile is abnormal at 78.4%, and the overall pool ranks #23 by abnormality. Price is down while OI is up, yet the notional change is negative (-270K / -650K). This isn’t just a simple liquidation of long positions—more like new leveraged shorts moving in and “buying tickets.”
In the last 24h, turnover is 79M. This abnormality level in the pool is relatively high.
My view: the break below the lower end of the range is a fact, but shorts shouldn’t celebrate too early—OI is rising while notional shrinks, suggesting this leg of the short is more of a light-position probe. If it’s going to continue, we need to see whether there’s incremental volume coming in to keep pushing it higher; if volume fades back, then this drop may just be a one-off shakeout during a period of thinner liquidity.
For now, leave it alone—don’t chase. This kind of structure at dawn often gives you a second answer in the morning.
5
Log in to explore more content
Join global crypto users on Binance Square
⚡️ Get latest and useful information about crypto.
💬 Trusted by the world’s largest crypto exchange.
👍 Discover real insights from verified creators.
Email / Phone number
Trending Topics
1
#AIStocksWhatNext
254,457 views
2,552 Discussing
2
#BitcoinBreaksAboveMayHighNears$86K
9,304 views
154 Discussing
3
#DogecoinRises15%
25,082 views
809 Discussing
4
#$14BBitcoinOptionsExpireFriday
1,848 views
69 Discussing
5
#BNBMarketCapPassesBNYMellon
18,017 views
606 Discussing
6
#CryptoMarketCapReclaims$3Trillion
2,366 views
61 Discussing
7
#MuseOvertakesChatGPTAsTopFreeIOSApp
11,375 views
467 Discussing
8
#TokenizedStockPlatformsCouldLaunchNextQuarter
17,868 views
531 Discussing
9
#StrategyAdds950Bitcoin
23,327 views
588 Discussing
10
#CardanoAddedToX402KitForADAPayments
23,316 views
610 Discussing