
#20
20
144,930 views
212 Discussing
Hot
Latest

·
--
$FRAG This one was posted by the project team themselves: in the group, the points that can be discussed are very clear—this isn’t just shouting slogans; it’s the Week 20 buyback.
The verifiable wording comes from Fragmetric’s official statement: “Weekly Buyback #20, 411,069 $FRAG was purchased on the open market and transferred to the FRAG Treasury Wallet.”
In plain language, it means: the project used the protocol fees from that period to buy 411,069 $FRAG on the open market, then transferred them into the Treasury Wallet.
The most interesting part of this isn’t the words “purchased” or “buy”—it’s the extra sentence: “Backed by 100% of protocol fees during the period.”
So the buyback funding for this cycle is anchored to “100% of protocol fees during the period.” The community will therefore focus on two things: whether the protocol actually continues to generate revenue, and whether those revenues are still used for buybacks into treasury.
For retail sentiment, this kind of weekly buyback is more like giving the community a fixed checkpoint.
How the price moves is another matter, but at least this time the on-chain gossip has concrete numbers: 411,069 $FRAG, purchased on the open market, and sent to the Treasury Wallet.
Next, we’ll see whether Fragmetric can keep turning “Weekly Buyback” into an ongoing series.
$FRAG #链上吃瓜 #Retail sentiment
Generated with Claude Fable 5. AI may be inaccurate; information is for reference only.
$FRAG This one was posted by the project team themselves: in the group, the points that can be discussed are very clear—this isn’t just shouting slogans; it’s the Week 20 buyback.
The verifiable wording comes from Fragmetric’s official statement: “Weekly Buyback #20, 411,069 $FRAG was purchased on the open market and transferred to the FRAG Treasury Wallet.”
In plain language, it means: the project used the protocol fees from that period to buy 411,069 $FRAG on the open market, then transferred them into the Treasury Wallet.
The most interesting part of this isn’t the words “purchased” or “buy”—it’s the extra sentence: “Backed by 100% of protocol fees during the period.”
So the buyback funding for this cycle is anchored to “100% of protocol fees during the period.” The community will therefore focus on two things: whether the protocol actually continues to generate revenue, and whether those revenues are still used for buybacks into treasury.
For retail sentiment, this kind of weekly buyback is more like giving the community a fixed checkpoint.
How the price moves is another matter, but at least this time the on-chain gossip has concrete numbers: 411,069 $FRAG, purchased on the open market, and sent to the Treasury Wallet.
Next, we’ll see whether Fragmetric can keep turning “Weekly Buyback” into an ongoing series.
$FRAG #链上吃瓜 #Retail sentiment
Generated with Claude Fable 5. AI may be inaccurate; information is for reference only.
The verifiable wording comes from Fragmetric’s official statement: “Weekly Buyback #20, 411,069 $FRAG was purchased on the open market and transferred to the FRAG Treasury Wallet.”
In plain language, it means: the project used the protocol fees from that period to buy 411,069 $FRAG on the open market, then transferred them into the Treasury Wallet.
The most interesting part of this isn’t the words “purchased” or “buy”—it’s the extra sentence: “Backed by 100% of protocol fees during the period.”
So the buyback funding for this cycle is anchored to “100% of protocol fees during the period.” The community will therefore focus on two things: whether the protocol actually continues to generate revenue, and whether those revenues are still used for buybacks into treasury.
For retail sentiment, this kind of weekly buyback is more like giving the community a fixed checkpoint.
How the price moves is another matter, but at least this time the on-chain gossip has concrete numbers: 411,069 $FRAG, purchased on the open market, and sent to the Treasury Wallet.
Next, we’ll see whether Fragmetric can keep turning “Weekly Buyback” into an ongoing series.
$FRAG #链上吃瓜 #Retail sentiment
Generated with Claude Fable 5. AI may be inaccurate; information is for reference only.

30

·
--
See translation
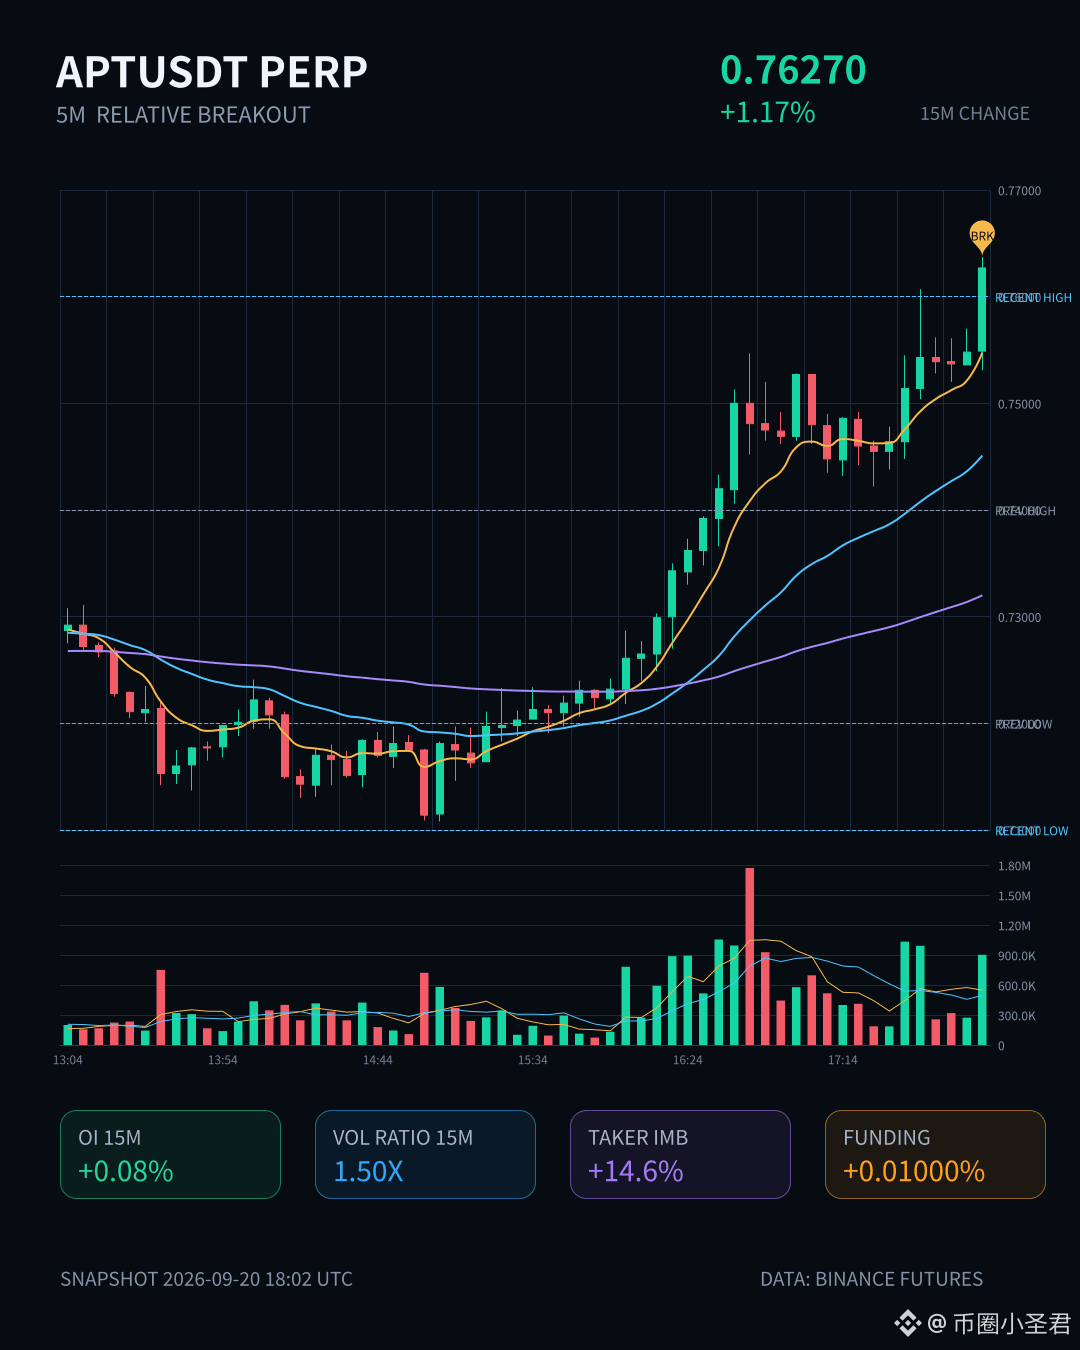
APT 这波有点意思。
15m 拉了 1.17%,量能 1.5 倍,收盘价直接啃掉近 20 根 5m 的上沿。主动成交差 +14.6%,买卖比 1.34,买盘是带着方向来的,不是那种挂单撑出来的假突破。
更关键的是 OI 在同步抬。15m +0.08%,1h +0.68%,名义增了 50 多万 U。价格涨、持仓涨,典型的增量杠杆多头进场,而不是空头回补推的。异常分位 83.5%,全池排 #20,名义变化 #32,不算最炸的那一档,但放在 APT 这种流动性里,这个量够看了。
24h 成交额 64.6M,深度确认没问题,量比常态高,边界的突破也不是插针。
当然,1h OI 才增 0.68%,说明杠杆进得还算克制,不是那种一口气冲上天的结构。后面能不能延续,得看这根 5m 上沿突破之后有没有回踩确认,别一开盘就被反手打回去。
先盯着,别追高。
APT 这波有点意思。
15m 拉了 1.17%,量能 1.5 倍,收盘价直接啃掉近 20 根 5m 的上沿。主动成交差 +14.6%,买卖比 1.34,买盘是带着方向来的,不是那种挂单撑出来的假突破。
更关键的是 OI 在同步抬。15m +0.08%,1h +0.68%,名义增了 50 多万 U。价格涨、持仓涨,典型的增量杠杆多头进场,而不是空头回补推的。异常分位 83.5%,全池排 #20,名义变化 #32,不算最炸的那一档,但放在 APT 这种流动性里,这个量够看了。
24h 成交额 64.6M,深度确认没问题,量比常态高,边界的突破也不是插针。
当然,1h OI 才增 0.68%,说明杠杆进得还算克制,不是那种一口气冲上天的结构。后面能不能延续,得看这根 5m 上沿突破之后有没有回踩确认,别一开盘就被反手打回去。
先盯着,别追高。
15m 拉了 1.17%,量能 1.5 倍,收盘价直接啃掉近 20 根 5m 的上沿。主动成交差 +14.6%,买卖比 1.34,买盘是带着方向来的,不是那种挂单撑出来的假突破。
更关键的是 OI 在同步抬。15m +0.08%,1h +0.68%,名义增了 50 多万 U。价格涨、持仓涨,典型的增量杠杆多头进场,而不是空头回补推的。异常分位 83.5%,全池排 #20,名义变化 #32,不算最炸的那一档,但放在 APT 这种流动性里,这个量够看了。
24h 成交额 64.6M,深度确认没问题,量比常态高,边界的突破也不是插针。
当然,1h OI 才增 0.68%,说明杠杆进得还算克制,不是那种一口气冲上天的结构。后面能不能延续,得看这根 5m 上沿突破之后有没有回踩确认,别一开盘就被反手打回去。
先盯着,别追高。
2

See translation
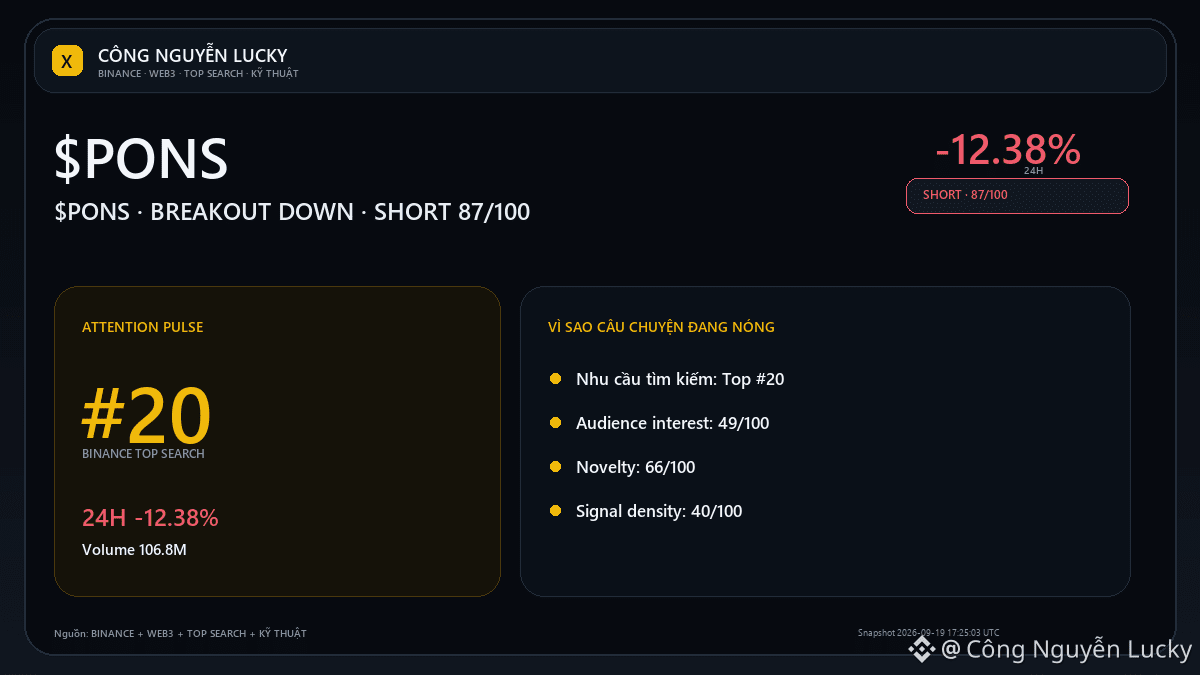
🚨 $PONS đang ở trạng thái BREAKOUT DOWN — breakout thật hay cú phá vỡ dễ bị kéo ngược? Thị trường: 0.5911 · 24h -12.38% · khối lượng ~106.8M USDT · 920,976 giao dịch.
Location: 5/100 trong biên ngày · cách high ~16.0%. Tiếp diễn cần: Phá 0.5855 với khối lượng mở rộng sẽ làm kịch bản giảm tiếp diễn đáng tin hơn.
Hạ nhiệt nếu: Không giữ được vùng thấp và lấy lại trung điểm 0.64445 sẽ làm áp lực giảm yếu đi. 📌 Góc nhìn LONG/SHORT: **SHORT · MẠNH · 87/100**.
Cơ sở chính: giá 24h -12.38%; giá nằm 5/100 trong biên 24h; yếu hơn BTC -13.34 điểm %.
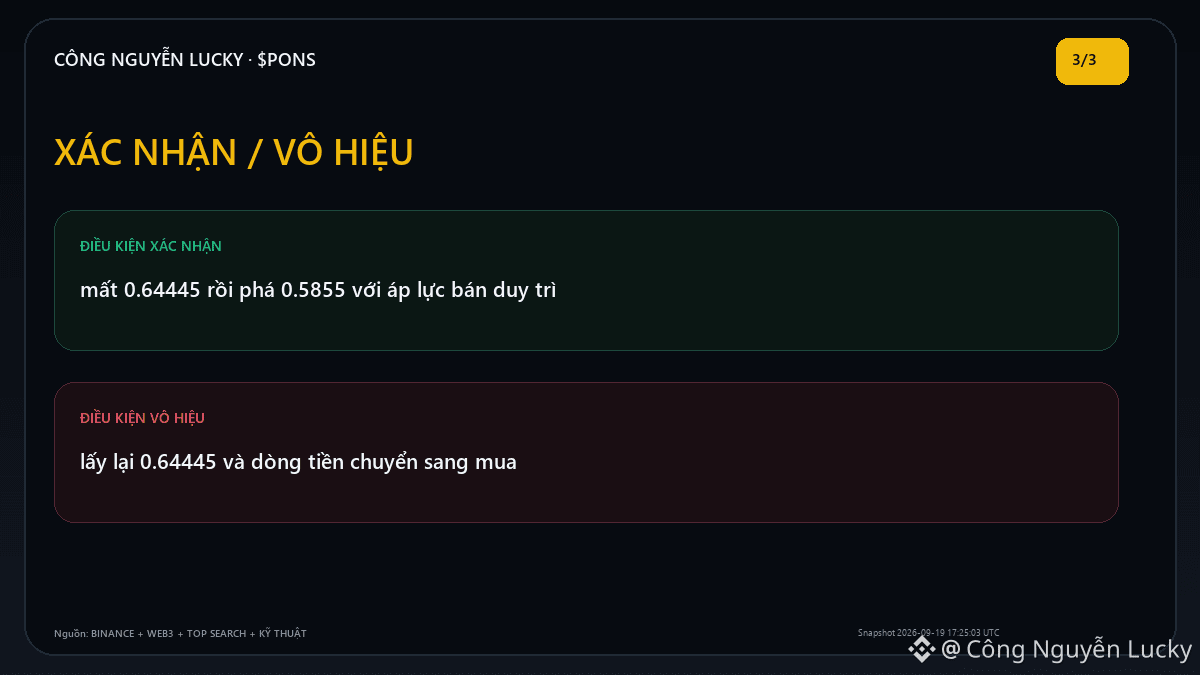
Xác nhận thêm khi: mất 0.64445 rồi phá 0.5855 với áp lực bán duy trì.
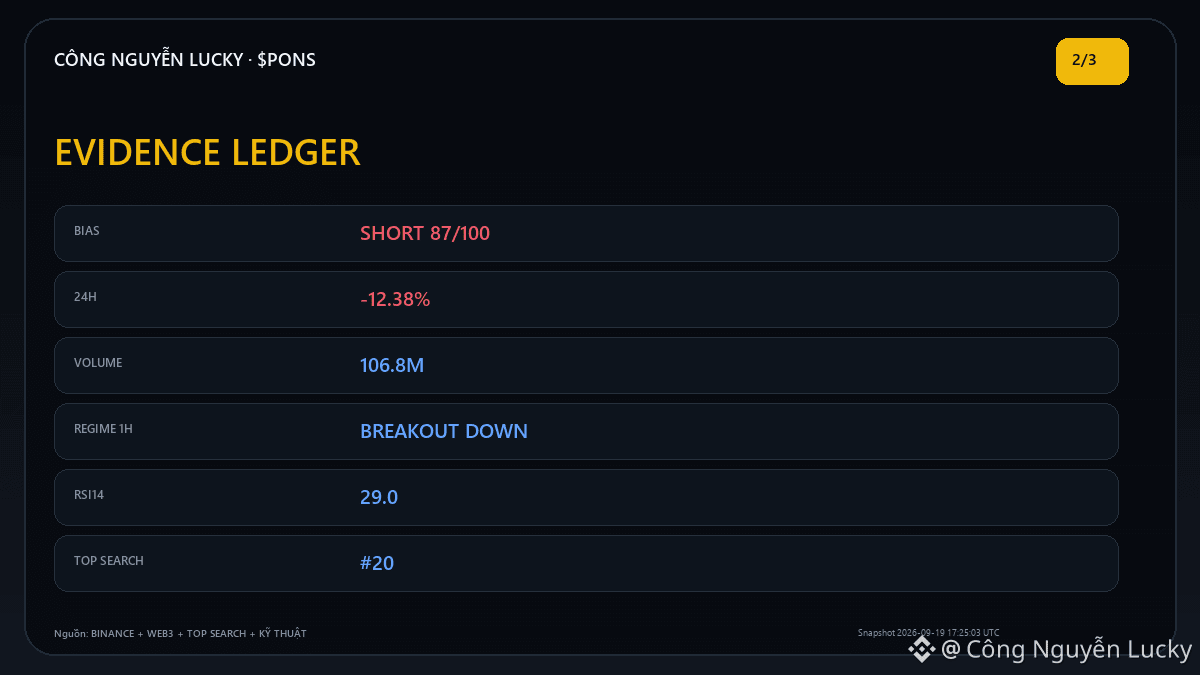
Hạ/hủy định hướng nếu: lấy lại 0.64445 và dòng tiền chuyển sang mua. 💬 Với $PONS, anh/chị đang đặt trọng số cao hơn cho giá/khối lượng hay dòng tiền/định vị? 📌 Nếu đang theo dõi $PONS, mở cashtag để tự kiểm tra giá, thanh khoản và bối cảnh thị trường hiện tại trước khi quyết định. 🔎 **Evidence check — SHORT 87/100**
• 1H: BREAKOUT DOWN; RSI14 29.0; confluence 62/100.
• Kỹ thuật nổi bật: Breakdown 20 nến có volume; MACD histogram âm/mở rộng.
• Giá 0.5911; 24h -12.38%; volume 106.8M.
• Binance Top Search #20. 🧭 **Mốc cần theo dõi:** Hỗ trợ 0.6005 · kháng cự 0.7034 · xác nhận: mất 0.64445 rồi phá 0.5855 với áp lực bán duy trì · vô hiệu: lấy lại 0.64445 và dòng tiền chuyển sang mua Nguồn đối chiếu: Binance Futures Market + Binance Web3 Trending + Binance Top Search + Binance Klines / Technical · snapshot 2026-09-19 17:25:03 UTC
💬 **Góc thảo luận:** Anh em cần tín hiệu xác nhận nào trước khi coi nhịp $PONS này là thật thay vì nhiễu?
⚠️ Phân tích thị trường mang tính tham khảo, không phải cam kết lợi nhuận. Mỗi người tự nghiên cứu (DYOR), tự quản trị rủi ro và tự chịu trách nhiệm với quyết định giao dịch. $PONS $BTC
🚨 $PONS đang ở trạng thái BREAKOUT DOWN — breakout thật hay cú phá vỡ dễ bị kéo ngược? Thị trường: 0.5911 · 24h -12.38% · khối lượng ~106.8M USDT · 920,976 giao dịch.
Location: 5/100 trong biên ngày · cách high ~16.0%. Tiếp diễn cần: Phá 0.5855 với khối lượng mở rộng sẽ làm kịch bản giảm tiếp diễn đáng tin hơn.
Hạ nhiệt nếu: Không giữ được vùng thấp và lấy lại trung điểm 0.64445 sẽ làm áp lực giảm yếu đi. 📌 Góc nhìn LONG/SHORT: **SHORT · MẠNH · 87/100**.
Cơ sở chính: giá 24h -12.38%; giá nằm 5/100 trong biên 24h; yếu hơn BTC -13.34 điểm %.
Xác nhận thêm khi: mất 0.64445 rồi phá 0.5855 với áp lực bán duy trì.
Hạ/hủy định hướng nếu: lấy lại 0.64445 và dòng tiền chuyển sang mua. 💬 Với $PONS , anh/chị đang đặt trọng số cao hơn cho giá/khối lượng hay dòng tiền/định vị? 📌 Nếu đang theo dõi $PONS , mở cashtag để tự kiểm tra giá, thanh khoản và bối cảnh thị trường hiện tại trước khi quyết định. 🔎 **Evidence check — SHORT 87/100**
• 1H: BREAKOUT DOWN; RSI14 29.0; confluence 62/100.
• Kỹ thuật nổi bật: Breakdown 20 nến có volume; MACD histogram âm/mở rộng.
• Giá 0.5911; 24h -12.38%; volume 106.8M.
• Binance Top Search #20. 🧭 **Mốc cần theo dõi:** Hỗ trợ 0.6005 · kháng cự 0.7034 · xác nhận: mất 0.64445 rồi phá 0.5855 với áp lực bán duy trì · vô hiệu: lấy lại 0.64445 và dòng tiền chuyển sang mua Nguồn đối chiếu: Binance Futures Market + Binance Web3 Trending + Binance Top Search + Binance Klines / Technical · snapshot 2026-09-19 17:25:03 UTC
💬 **Góc thảo luận:** Anh em cần tín hiệu xác nhận nào trước khi coi nhịp $PONS này là thật thay vì nhiễu?
⚠️ Phân tích thị trường mang tính tham khảo, không phải cam kết lợi nhuận. Mỗi người tự nghiên cứu (DYOR), tự quản trị rủi ro và tự chịu trách nhiệm với quyết định giao dịch. $PONS $BTC
Location: 5/100 trong biên ngày · cách high ~16.0%. Tiếp diễn cần: Phá 0.5855 với khối lượng mở rộng sẽ làm kịch bản giảm tiếp diễn đáng tin hơn.
Hạ nhiệt nếu: Không giữ được vùng thấp và lấy lại trung điểm 0.64445 sẽ làm áp lực giảm yếu đi. 📌 Góc nhìn LONG/SHORT: **SHORT · MẠNH · 87/100**.
Cơ sở chính: giá 24h -12.38%; giá nằm 5/100 trong biên 24h; yếu hơn BTC -13.34 điểm %.
Xác nhận thêm khi: mất 0.64445 rồi phá 0.5855 với áp lực bán duy trì.
Hạ/hủy định hướng nếu: lấy lại 0.64445 và dòng tiền chuyển sang mua. 💬 Với $PONS , anh/chị đang đặt trọng số cao hơn cho giá/khối lượng hay dòng tiền/định vị? 📌 Nếu đang theo dõi $PONS , mở cashtag để tự kiểm tra giá, thanh khoản và bối cảnh thị trường hiện tại trước khi quyết định. 🔎 **Evidence check — SHORT 87/100**
• 1H: BREAKOUT DOWN; RSI14 29.0; confluence 62/100.
• Kỹ thuật nổi bật: Breakdown 20 nến có volume; MACD histogram âm/mở rộng.
• Giá 0.5911; 24h -12.38%; volume 106.8M.
• Binance Top Search #20. 🧭 **Mốc cần theo dõi:** Hỗ trợ 0.6005 · kháng cự 0.7034 · xác nhận: mất 0.64445 rồi phá 0.5855 với áp lực bán duy trì · vô hiệu: lấy lại 0.64445 và dòng tiền chuyển sang mua Nguồn đối chiếu: Binance Futures Market + Binance Web3 Trending + Binance Top Search + Binance Klines / Technical · snapshot 2026-09-19 17:25:03 UTC
💬 **Góc thảo luận:** Anh em cần tín hiệu xác nhận nào trước khi coi nhịp $PONS này là thật thay vì nhiễu?
⚠️ Phân tích thị trường mang tính tham khảo, không phải cam kết lợi nhuận. Mỗi người tự nghiên cứu (DYOR), tự quản trị rủi ro và tự chịu trách nhiệm với quyết định giao dịch. $PONS $BTC
192

·
--
$UAI This spot is kind of interesting.
At the 15m interval, one pull moved up 1.24%. Volume directly spiked to 1.92x, and the closing price broke above the upper edge of nearly 20 consecutive 5m candles. The proactive turnover was down 20.3%, the buy-to-sell ratio was 1.51, and the buy orders are genuinely pushing forward.
But if you switch to OI, it’s a different story—both the 15m and 1h contract OI are falling. While the price is moving up, open interest is actually being withdrawn. This combination usually isn’t a relay from fresh long buyers. More like shorts getting stopped out and then being forced into passive covering, pushing the price up.
The abnormal percentile in the whole pool is 78.8%, ranked #20. Depth and transaction direction are both confirmed. However, the total turnover over 24h is only 14.3M—the pool is too shallow. At this kind of scale, you don’t need much volume to push out one bullish candle, and the reversal can be quick.
Don’t get tricked by this candle into jumping in as a bag-holder. First, see whether OI can turn back to positive. If it’s purely a short-covering move, once volume stops, the illusion will be exposed.
$UAI This spot is kind of interesting.
At the 15m interval, one pull moved up 1.24%. Volume directly spiked to 1.92x, and the closing price broke above the upper edge of nearly 20 consecutive 5m candles. The proactive turnover was down 20.3%, the buy-to-sell ratio was 1.51, and the buy orders are genuinely pushing forward.
But if you switch to OI, it’s a different story—both the 15m and 1h contract OI are falling. While the price is moving up, open interest is actually being withdrawn. This combination usually isn’t a relay from fresh long buyers. More like shorts getting stopped out and then being forced into passive covering, pushing the price up.
The abnormal percentile in the whole pool is 78.8%, ranked #20. Depth and transaction direction are both confirmed. However, the total turnover over 24h is only 14.3M—the pool is too shallow. At this kind of scale, you don’t need much volume to push out one bullish candle, and the reversal can be quick.
Don’t get tricked by this candle into jumping in as a bag-holder. First, see whether OI can turn back to positive. If it’s purely a short-covering move, once volume stops, the illusion will be exposed.
At the 15m interval, one pull moved up 1.24%. Volume directly spiked to 1.92x, and the closing price broke above the upper edge of nearly 20 consecutive 5m candles. The proactive turnover was down 20.3%, the buy-to-sell ratio was 1.51, and the buy orders are genuinely pushing forward.
But if you switch to OI, it’s a different story—both the 15m and 1h contract OI are falling. While the price is moving up, open interest is actually being withdrawn. This combination usually isn’t a relay from fresh long buyers. More like shorts getting stopped out and then being forced into passive covering, pushing the price up.
The abnormal percentile in the whole pool is 78.8%, ranked #20. Depth and transaction direction are both confirmed. However, the total turnover over 24h is only 14.3M—the pool is too shallow. At this kind of scale, you don’t need much volume to push out one bullish candle, and the reversal can be quick.
Don’t get tricked by this candle into jumping in as a bag-holder. First, see whether OI can turn back to positive. If it’s purely a short-covering move, once volume stops, the illusion will be exposed.
7

·
--
$CHIP This spot is kind of interesting.
In 15m, it directly surged 2.4%. Volume reached 2.17×, the Z value is 3.49, and the close even pushed through the upper edge of nearly 20 of the 5m candles. This isn’t that slow, grinding kind of move—there’s capital actively pushing it.
More importantly, it’s OI—price is rising while OI rises in sync. The nominal changes for the whole pool rank all the way up to #20; the abnormal percentile is 96.2%, and the whole pool’s abnormality is #6. This combo leans more toward new long positions adding leverage and entering, rather than shorts being forced to cover.
The主动成交差 (active trade differential) is 29.5%, and the buy/sell ratio is 1.84—active buying is clearly dominant. The funding rate is also pushed to a high recent percentile.
The 24h traded value is only 29M, so the float isn’t that large. Once this kind of volume comes in, the upside elasticity should be very direct. A high funding rate is a double-edged sword: it means long sentiment is already very hot. If you chase, don’t get carried away—but as long as the structure hasn’t broken, don’t lightly stand on the other side.
First, see whether this breakout level can be held. If it holds, it continues; if it doesn’t, it’s a pin-bar fakeout. Watch OI—so long as it’s still increasing and price hasn’t collapsed, the longs still have the say.
$CHIP This spot is kind of interesting.
In 15m, it directly surged 2.4%. Volume reached 2.17×, the Z value is 3.49, and the close even pushed through the upper edge of nearly 20 of the 5m candles. This isn’t that slow, grinding kind of move—there’s capital actively pushing it.
More importantly, it’s OI—price is rising while OI rises in sync. The nominal changes for the whole pool rank all the way up to #20; the abnormal percentile is 96.2%, and the whole pool’s abnormality is #6. This combo leans more toward new long positions adding leverage and entering, rather than shorts being forced to cover.
The主动成交差 (active trade differential) is 29.5%, and the buy/sell ratio is 1.84—active buying is clearly dominant. The funding rate is also pushed to a high recent percentile.
The 24h traded value is only 29M, so the float isn’t that large. Once this kind of volume comes in, the upside elasticity should be very direct. A high funding rate is a double-edged sword: it means long sentiment is already very hot. If you chase, don’t get carried away—but as long as the structure hasn’t broken, don’t lightly stand on the other side.
First, see whether this breakout level can be held. If it holds, it continues; if it doesn’t, it’s a pin-bar fakeout. Watch OI—so long as it’s still increasing and price hasn’t collapsed, the longs still have the say.
In 15m, it directly surged 2.4%. Volume reached 2.17×, the Z value is 3.49, and the close even pushed through the upper edge of nearly 20 of the 5m candles. This isn’t that slow, grinding kind of move—there’s capital actively pushing it.
More importantly, it’s OI—price is rising while OI rises in sync. The nominal changes for the whole pool rank all the way up to #20; the abnormal percentile is 96.2%, and the whole pool’s abnormality is #6. This combo leans more toward new long positions adding leverage and entering, rather than shorts being forced to cover.
The主动成交差 (active trade differential) is 29.5%, and the buy/sell ratio is 1.84—active buying is clearly dominant. The funding rate is also pushed to a high recent percentile.
The 24h traded value is only 29M, so the float isn’t that large. Once this kind of volume comes in, the upside elasticity should be very direct. A high funding rate is a double-edged sword: it means long sentiment is already very hot. If you chase, don’t get carried away—but as long as the structure hasn’t broken, don’t lightly stand on the other side.
First, see whether this breakout level can be held. If it holds, it continues; if it doesn’t, it’s a pin-bar fakeout. Watch OI—so long as it’s still increasing and price hasn’t collapsed, the longs still have the say.
7


·
--
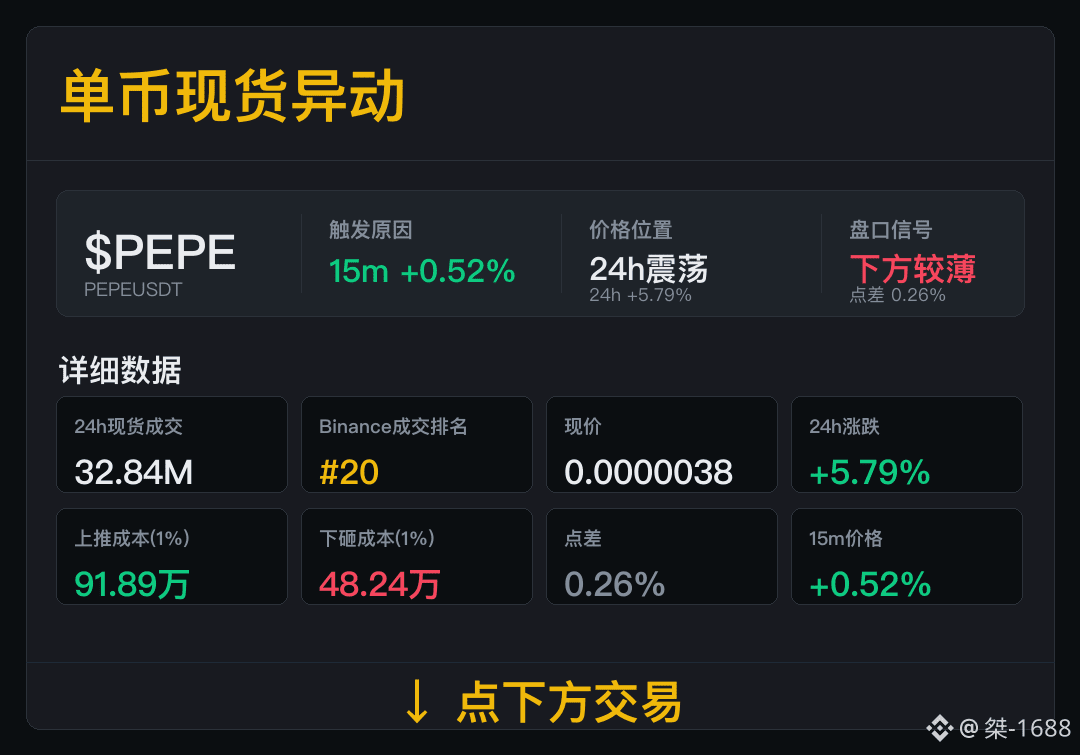
$PEPE Intraday volatility is amplified; the成交和点差 (trading volume and bid-ask spread) need to be considered together.
Spot trading volume: 32.84M, Binance trading rank #20. Once the trading volume ranking moves into the top tier, the next wave of volume still needs to be further confirmed.
Current 24h performance: +5.79%; spread: 0.26%. Upward (buy-side) costs are 0.9189M, downward (sell-side) costs are 0.4824M. The spot trading volume and the order book cost levels match up—only then do the short-term signals feel more solid.
Next, focus on the spread and trading volume. If the spread holds steady and trading volume keeps coming, we can talk about the next leg.
$PEPE Intraday volatility is amplified; the成交和点差 (trading volume and bid-ask spread) need to be considered together.
Spot trading volume: 32.84M, Binance trading rank #20. Once the trading volume ranking moves into the top tier, the next wave of volume still needs to be further confirmed.
Current 24h performance: +5.79%; spread: 0.26%. Upward (buy-side) costs are 0.9189M, downward (sell-side) costs are 0.4824M. The spot trading volume and the order book cost levels match up—only then do the short-term signals feel more solid.
Next, focus on the spread and trading volume. If the spread holds steady and trading volume keeps coming, we can talk about the next leg.
Spot trading volume: 32.84M, Binance trading rank #20. Once the trading volume ranking moves into the top tier, the next wave of volume still needs to be further confirmed.
Current 24h performance: +5.79%; spread: 0.26%. Upward (buy-side) costs are 0.9189M, downward (sell-side) costs are 0.4824M. The spot trading volume and the order book cost levels match up—only then do the short-term signals feel more solid.
Next, focus on the spread and trading volume. If the spread holds steady and trading volume keeps coming, we can talk about the next leg.
1
194
·
--
$ZRO This move is quite decisive. In the 15m timeframe it directly broke through the top of the 5m range by nearly 20 lines; the trading volume spiked to 1.76x, with the buy-to-sell ratio at 2.64.
But OI is falling—15m -0.69%, 1h -0.84%. Price is up while positions are down, a typical short-covering pattern, not new longs entering.
The funding rate has already been in the high percentile recently: the rate is at 92.9%, an abnormal percentile, and the entire pool ranks #20. This setup is most afraid of chasing price. Shorts cover, and the funding is also expensive—who’s going to take the next baton?
Watch whether it can hold steady at this breakout level. If it can’t, it’s only a matter of one needle-like wick.
$ZRO This move is quite decisive. In the 15m timeframe it directly broke through the top of the 5m range by nearly 20 lines; the trading volume spiked to 1.76x, with the buy-to-sell ratio at 2.64.
But OI is falling—15m -0.69%, 1h -0.84%. Price is up while positions are down, a typical short-covering pattern, not new longs entering.
The funding rate has already been in the high percentile recently: the rate is at 92.9%, an abnormal percentile, and the entire pool ranks #20. This setup is most afraid of chasing price. Shorts cover, and the funding is also expensive—who’s going to take the next baton?
Watch whether it can hold steady at this breakout level. If it can’t, it’s only a matter of one needle-like wick.
But OI is falling—15m -0.69%, 1h -0.84%. Price is up while positions are down, a typical short-covering pattern, not new longs entering.
The funding rate has already been in the high percentile recently: the rate is at 92.9%, an abnormal percentile, and the entire pool ranks #20. This setup is most afraid of chasing price. Shorts cover, and the funding is also expensive—who’s going to take the next baton?
Watch whether it can hold steady at this breakout level. If it can’t, it’s only a matter of one needle-like wick.
29
·
--
$VVV Over these 15 minutes, something doesn’t feel right.
The price dropped by 2.27%, volume rose to 1.58x, and it directly broke below the lower bound of the past ~20 5-minute candles. Active trading volume discrepancy is -18.1%, buy/sell ratio is 0.69, and selling pressure is clearly dominant.
What’s interesting is the OI: the 15m contract is +0.33%, but the nominal value is -530K; the 1h contract is -1.37%, with nominal -1.36M. Price is falling while OI is rising—there’s a strong smell of fresh leveraged shorts entering. The abnormal percentile is 92.7%, the whole pool is #13, nominal change is #20, and it’s continued across multiple consecutive periods.
24h trading value is 77.6M, and the order depth confirms it. I generally wouldn’t rush to take this setup. If shorts add to their position, after the lower-band breakdown there could still be another leg. Let’s wait for the OI to cool off, or for active buying to come back.
Just watch for now.
$VVV Over these 15 minutes, something doesn’t feel right.
The price dropped by 2.27%, volume rose to 1.58x, and it directly broke below the lower bound of the past ~20 5-minute candles. Active trading volume discrepancy is -18.1%, buy/sell ratio is 0.69, and selling pressure is clearly dominant.
What’s interesting is the OI: the 15m contract is +0.33%, but the nominal value is -530K; the 1h contract is -1.37%, with nominal -1.36M. Price is falling while OI is rising—there’s a strong smell of fresh leveraged shorts entering. The abnormal percentile is 92.7%, the whole pool is #13, nominal change is #20, and it’s continued across multiple consecutive periods.
24h trading value is 77.6M, and the order depth confirms it. I generally wouldn’t rush to take this setup. If shorts add to their position, after the lower-band breakdown there could still be another leg. Let’s wait for the OI to cool off, or for active buying to come back.
Just watch for now.
The price dropped by 2.27%, volume rose to 1.58x, and it directly broke below the lower bound of the past ~20 5-minute candles. Active trading volume discrepancy is -18.1%, buy/sell ratio is 0.69, and selling pressure is clearly dominant.
What’s interesting is the OI: the 15m contract is +0.33%, but the nominal value is -530K; the 1h contract is -1.37%, with nominal -1.36M. Price is falling while OI is rising—there’s a strong smell of fresh leveraged shorts entering. The abnormal percentile is 92.7%, the whole pool is #13, nominal change is #20, and it’s continued across multiple consecutive periods.
24h trading value is 77.6M, and the order depth confirms it. I generally wouldn’t rush to take this setup. If shorts add to their position, after the lower-band breakdown there could still be another leg. Let’s wait for the OI to cool off, or for active buying to come back.
Just watch for now.
4
·
--
ONE This move is a bit interesting.
In 15m, it rose 4.39%, with volume up 1.6x. OI jumped +4.84% in 1h, and nominal value saw 1.92M in inflows. Price is up, positions are up—this is typical leveraged longs adding, not shorts getting squeezed.
Anomaly percentile is 89.9%, within the whole pool #20, nominal change #14—this isn’t the absolute top, but it’s already in the front row. The funding rate has also reached a high percentile recently, suggesting long sentiment isn’t low.
In 24h, turnover is 603M, buy/sell ratio 1.04. Active buying is slightly dominant, but not extreme.
The question now is: OI is rising faster than price, and the leverage is stacking a bit quickly. If it can hold here, it becomes the upper boundary of a new range; if it can’t, it becomes fuel for a wave of longs getting forced liquidated.
First, see whether it can hold the 4.39% move on the 15m timeframe.
ONE This move is a bit interesting.
In 15m, it rose 4.39%, with volume up 1.6x. OI jumped +4.84% in 1h, and nominal value saw 1.92M in inflows. Price is up, positions are up—this is typical leveraged longs adding, not shorts getting squeezed.
Anomaly percentile is 89.9%, within the whole pool #20, nominal change #14—this isn’t the absolute top, but it’s already in the front row. The funding rate has also reached a high percentile recently, suggesting long sentiment isn’t low.
In 24h, turnover is 603M, buy/sell ratio 1.04. Active buying is slightly dominant, but not extreme.
The question now is: OI is rising faster than price, and the leverage is stacking a bit quickly. If it can hold here, it becomes the upper boundary of a new range; if it can’t, it becomes fuel for a wave of longs getting forced liquidated.
First, see whether it can hold the 4.39% move on the 15m timeframe.
In 15m, it rose 4.39%, with volume up 1.6x. OI jumped +4.84% in 1h, and nominal value saw 1.92M in inflows. Price is up, positions are up—this is typical leveraged longs adding, not shorts getting squeezed.
Anomaly percentile is 89.9%, within the whole pool #20, nominal change #14—this isn’t the absolute top, but it’s already in the front row. The funding rate has also reached a high percentile recently, suggesting long sentiment isn’t low.
In 24h, turnover is 603M, buy/sell ratio 1.04. Active buying is slightly dominant, but not extreme.
The question now is: OI is rising faster than price, and the leverage is stacking a bit quickly. If it can hold here, it becomes the upper boundary of a new range; if it can’t, it becomes fuel for a wave of longs getting forced liquidated.
First, see whether it can hold the 4.39% move on the 15m timeframe.
12

·
--
ZEC: This move is a bit too rushed. In the 15m timeframe it’s already +1.63%, but if you look closely, OI is actually trending downward—15m -0.12%, 1h -0.29%. As the price rises, the positions are decreasing instead.
In plain terms, this structure is shorts getting squeezed into covering—not fresh long capital really pouring in. On the 5m Binance side, the liquidation agent at 172K is prominent, and buy-side orders are clearly denser. Combined with the funding rate being at a high percentile recently, it gives a strong squeeze/buyback vibe.
That said, the position is indeed not low. The OI abnormal percentile has already reached 93.3%; across the whole pool, the abnormal rank is #20, and the notional change is directly #3—meaning this market-wide anomaly is definitely significant. 24h turnover is over 4.4B; the taker buy/sell ratio is 1.10, and taker execution is off by 4.9%. The bids are still slightly more proactive.
My view: If OI doesn’t catch up with the price rebound, it usually won’t go far. It’s more like a squeeze-driven, compress-and-cover rebound rather than the start of a real trend. If you’re thinking of going long, be careful—wait for a pullback and see whether the longs are willing to add back into positions. $ZEC
ZEC: This move is a bit too rushed. In the 15m timeframe it’s already +1.63%, but if you look closely, OI is actually trending downward—15m -0.12%, 1h -0.29%. As the price rises, the positions are decreasing instead.
In plain terms, this structure is shorts getting squeezed into covering—not fresh long capital really pouring in. On the 5m Binance side, the liquidation agent at 172K is prominent, and buy-side orders are clearly denser. Combined with the funding rate being at a high percentile recently, it gives a strong squeeze/buyback vibe.
That said, the position is indeed not low. The OI abnormal percentile has already reached 93.3%; across the whole pool, the abnormal rank is #20, and the notional change is directly #3—meaning this market-wide anomaly is definitely significant. 24h turnover is over 4.4B; the taker buy/sell ratio is 1.10, and taker execution is off by 4.9%. The bids are still slightly more proactive.
My view: If OI doesn’t catch up with the price rebound, it usually won’t go far. It’s more like a squeeze-driven, compress-and-cover rebound rather than the start of a real trend. If you’re thinking of going long, be careful—wait for a pullback and see whether the longs are willing to add back into positions. $ZEC
In plain terms, this structure is shorts getting squeezed into covering—not fresh long capital really pouring in. On the 5m Binance side, the liquidation agent at 172K is prominent, and buy-side orders are clearly denser. Combined with the funding rate being at a high percentile recently, it gives a strong squeeze/buyback vibe.
That said, the position is indeed not low. The OI abnormal percentile has already reached 93.3%; across the whole pool, the abnormal rank is #20, and the notional change is directly #3—meaning this market-wide anomaly is definitely significant. 24h turnover is over 4.4B; the taker buy/sell ratio is 1.10, and taker execution is off by 4.9%. The bids are still slightly more proactive.
My view: If OI doesn’t catch up with the price rebound, it usually won’t go far. It’s more like a squeeze-driven, compress-and-cover rebound rather than the start of a real trend. If you’re thinking of going long, be careful—wait for a pullback and see whether the longs are willing to add back into positions. $ZEC
101


Article
$XLM +8.7% in 24h — hit the maximum gain in the top 100!🔥 $XLM +8.7% in 24h — hit the maximum gain in the top 100!
Did you see that?
🧭 Summary: the move is within a broader trend — 7D and 30D in the same direction; volume is low — the movement may be unstable.
🌍 Market context: out of 53 major coins with noticeable movement over 24h — 🔼 35 went up, 🔽 18 fell
📈 Star of the day: $XLM +8.7% in 24h
$XLM +8.7% in 24h — hit the maximum gain in the top 100!
🔥 $XLM +8.7% in 24h — hit the maximum gain in the top 100!
Did you see that?
🧭 Summary: the move is within a broader trend — 7D and 30D in the same direction; volume is low — the movement may be unstable.
🌍 Market context: out of 53 major coins with noticeable movement over 24h — 🔼 35 went up, 🔽 18 fell
📈 Star of the day: $XLM +8.7% in 24h
Did you see that?
🧭 Summary: the move is within a broader trend — 7D and 30D in the same direction; volume is low — the movement may be unstable.
🌍 Market context: out of 53 major coins with noticeable movement over 24h — 🔼 35 went up, 🔽 18 fell
📈 Star of the day: $XLM +8.7% in 24h
374

·
--
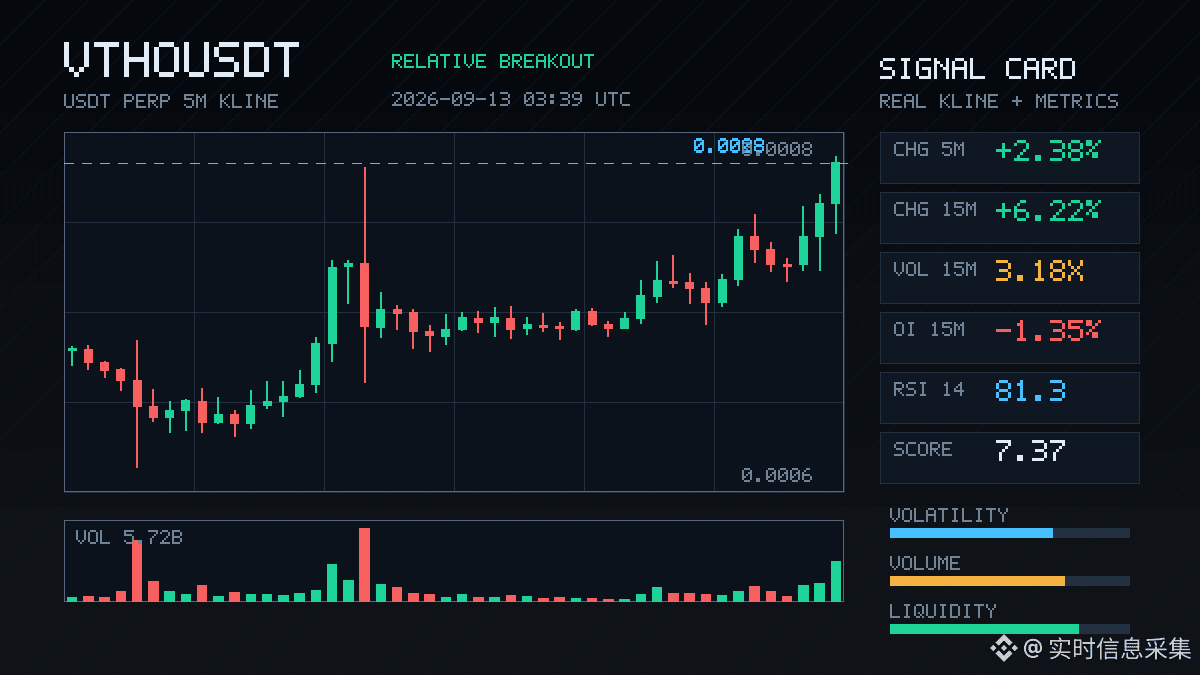
$VTHO This move is a bit interesting.
In 15m, it directly surged 6.22%. Volume hit more than 3 times the usual level, and the price closed outside the upper edge of the last ~20 five-minute candles. But the OI is trending downward—15m -1.35%, 1h -1.23%. Yet nominal changes are actually rising.
This kind of structure usually isn’t driven by fresh longs entering. It looks more like shorts are being forced to cover, or existing positions are being reduced. Active trade imbalance is +7%, and the buy/sell ratio is 1.15. Buyers are indeed chasing, but they’re chasing liquidity—not adding new positions.
The OI abnormal percentile is 94.6%. It ranks #20 across the whole pool by OI anomaly, and nominal change ranks #28. The location itself is also close to a historical extreme zone.
In the past 24h, trading value is 229 million—definitely not small. In a breakout where volume/price are diverging, chasing in can easily mean catching the end of a covering cycle. I’d rather first see whether it can hold steady above the breakout level; if OI doesn’t come back, the continuity will be very much in question.
$VTHO This move is a bit interesting.
In 15m, it directly surged 6.22%. Volume hit more than 3 times the usual level, and the price closed outside the upper edge of the last ~20 five-minute candles. But the OI is trending downward—15m -1.35%, 1h -1.23%. Yet nominal changes are actually rising.
This kind of structure usually isn’t driven by fresh longs entering. It looks more like shorts are being forced to cover, or existing positions are being reduced. Active trade imbalance is +7%, and the buy/sell ratio is 1.15. Buyers are indeed chasing, but they’re chasing liquidity—not adding new positions.
The OI abnormal percentile is 94.6%. It ranks #20 across the whole pool by OI anomaly, and nominal change ranks #28. The location itself is also close to a historical extreme zone.
In the past 24h, trading value is 229 million—definitely not small. In a breakout where volume/price are diverging, chasing in can easily mean catching the end of a covering cycle. I’d rather first see whether it can hold steady above the breakout level; if OI doesn’t come back, the continuity will be very much in question.
In 15m, it directly surged 6.22%. Volume hit more than 3 times the usual level, and the price closed outside the upper edge of the last ~20 five-minute candles. But the OI is trending downward—15m -1.35%, 1h -1.23%. Yet nominal changes are actually rising.
This kind of structure usually isn’t driven by fresh longs entering. It looks more like shorts are being forced to cover, or existing positions are being reduced. Active trade imbalance is +7%, and the buy/sell ratio is 1.15. Buyers are indeed chasing, but they’re chasing liquidity—not adding new positions.
The OI abnormal percentile is 94.6%. It ranks #20 across the whole pool by OI anomaly, and nominal change ranks #28. The location itself is also close to a historical extreme zone.
In the past 24h, trading value is 229 million—definitely not small. In a breakout where volume/price are diverging, chasing in can easily mean catching the end of a covering cycle. I’d rather first see whether it can hold steady above the breakout level; if OI doesn’t come back, the continuity will be very much in question.
23
·
--
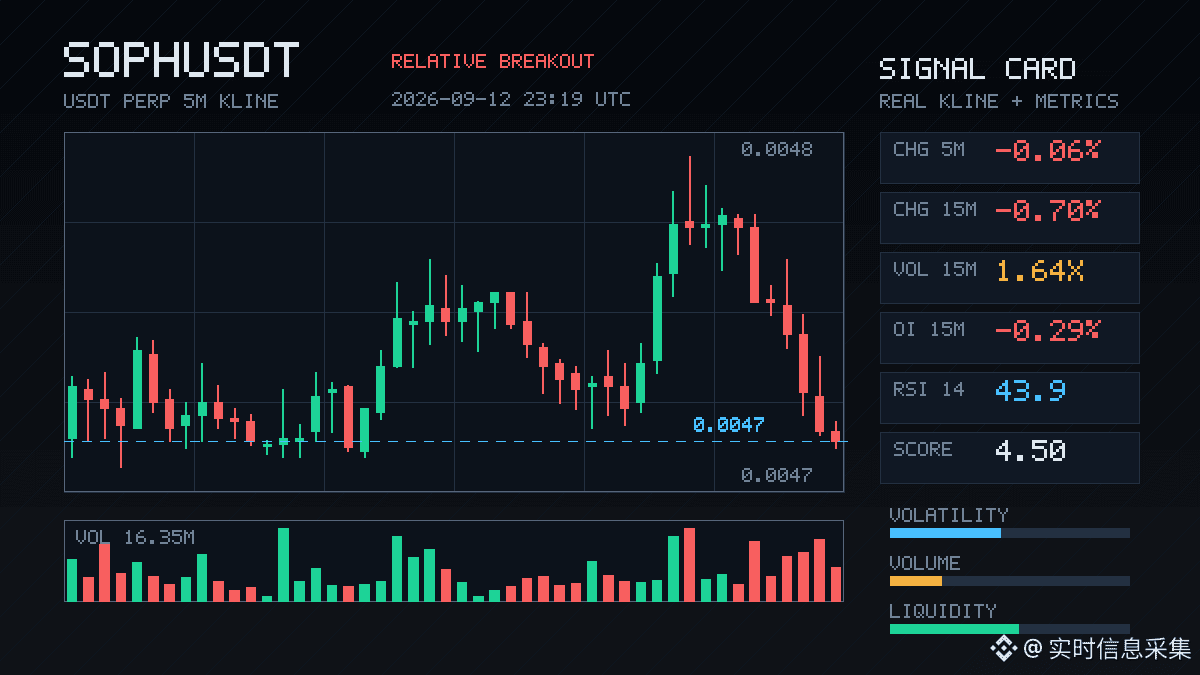
$SOPH This drop is kind of interesting: the price fell 0.7%, but OI also dropped. Both the 15m and 1h are reducing positions, and the notional change isn’t much—around 82K. This is typical of leverage being withdrawn, not of the shorts aggressively dumping.
Trading volume is up to 1.64x. The aggressive trade gap is -13.7%, and the buy/sell ratio is 0.76—sell pressure is showing up, but the magnitude isn’t that extreme. The key level is that the price broke below the lower edge of the past ~20 5m candles. This breakdown, together with the shrinking OI, looks more like longs cutting losses or de-leveraging themselves, rather than new short pressure.
The abnormal percentile is 72.2%, and it ranks #20 in the whole pool. It’s not like it’s especially chaotic, but within the current structure it’s worth keeping an eye on. If OI continues to fall and the price can’t hold, there may be another leg of deleveraging; if OI starts to rebound while price doesn’t drop, then this area may just be a washout. $SOPH
$SOPH This drop is kind of interesting: the price fell 0.7%, but OI also dropped. Both the 15m and 1h are reducing positions, and the notional change isn’t much—around 82K. This is typical of leverage being withdrawn, not of the shorts aggressively dumping.
Trading volume is up to 1.64x. The aggressive trade gap is -13.7%, and the buy/sell ratio is 0.76—sell pressure is showing up, but the magnitude isn’t that extreme. The key level is that the price broke below the lower edge of the past ~20 5m candles. This breakdown, together with the shrinking OI, looks more like longs cutting losses or de-leveraging themselves, rather than new short pressure.
The abnormal percentile is 72.2%, and it ranks #20 in the whole pool. It’s not like it’s especially chaotic, but within the current structure it’s worth keeping an eye on. If OI continues to fall and the price can’t hold, there may be another leg of deleveraging; if OI starts to rebound while price doesn’t drop, then this area may just be a washout. $SOPH
Trading volume is up to 1.64x. The aggressive trade gap is -13.7%, and the buy/sell ratio is 0.76—sell pressure is showing up, but the magnitude isn’t that extreme. The key level is that the price broke below the lower edge of the past ~20 5m candles. This breakdown, together with the shrinking OI, looks more like longs cutting losses or de-leveraging themselves, rather than new short pressure.
The abnormal percentile is 72.2%, and it ranks #20 in the whole pool. It’s not like it’s especially chaotic, but within the current structure it’s worth keeping an eye on. If OI continues to fall and the price can’t hold, there may be another leg of deleveraging; if OI starts to rebound while price doesn’t drop, then this area may just be a washout. $SOPH
9
·
--
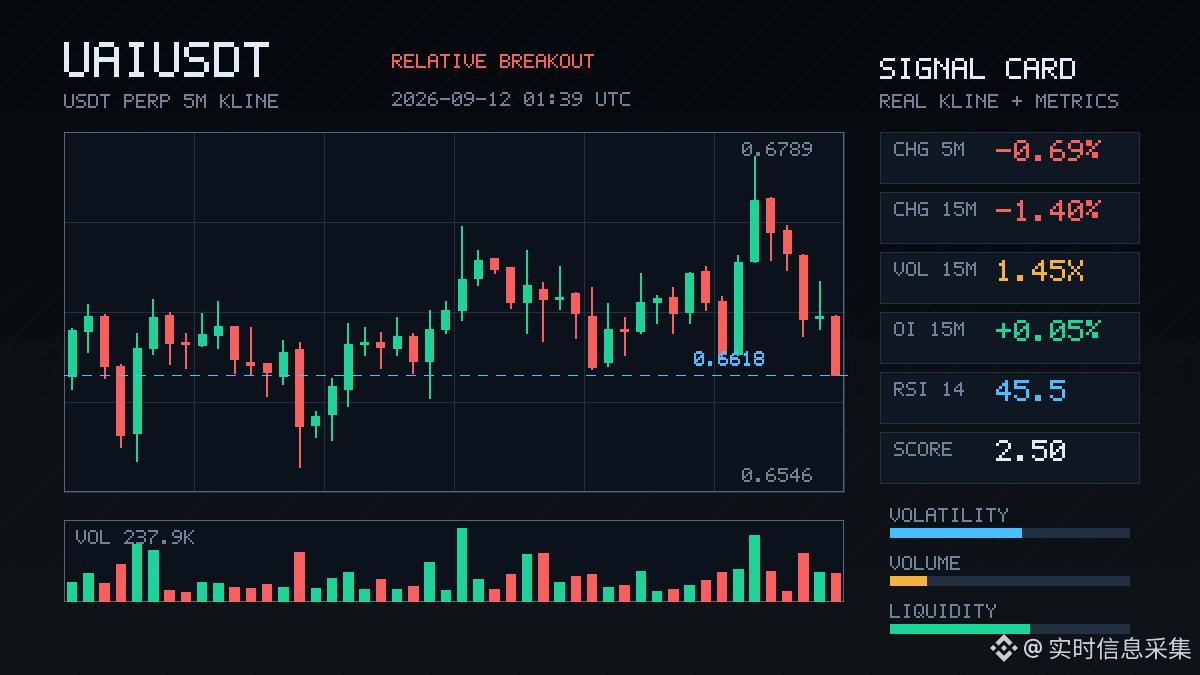
UAI, this move—if they say it’s a drop, it’s better described as testing who lets go first.
On the 15m chart, it’s down 1.40%. Volume rose to 1.45x, the Z value is 2.18, and the close directly kicked through the lower boundary of the last ~20 five-minute ranges. On the surface it looks like a breakdown, but OI didn’t move much—15m is only +0.05%, and the notional even decreased by 365K. The 1h chart is also barely up, with notional shrinking. That suggests this isn’t the kind of panic shorting where everyone rushes in. It looks more like someone steadily adding leverage short while hugging the lower range—liquidity is rotating/turning over, and the entire pool is abnormally compressed into around #20, with notional changes moving into the top 10.
What’s interesting is that passive/initiative trade imbalance is 13.8%, with buy/sell ratio at 1.32. The price broke down, but the active buy-side isn’t weak. The disagreement here is worth watching closely: are the shorts hitting and then retreating, or are there buyers on the spot side picking up during the breakdown? This 15m candle can’t tell us for sure.
24h volume is 55.5M, and the order book depth is thick enough—when the real direction appears, it won’t stay suppressed. At this level, chasing shorts is easy to get snapped back, and bottom-fishing has to wait for the right-side confirmation. First, see whether it can quickly reclaim the area near the lower bound. If it can’t, then the anomaly around the 78th percentile may be just starting to play out.
UAI, this move—if they say it’s a drop, it’s better described as testing who lets go first.
On the 15m chart, it’s down 1.40%. Volume rose to 1.45x, the Z value is 2.18, and the close directly kicked through the lower boundary of the last ~20 five-minute ranges. On the surface it looks like a breakdown, but OI didn’t move much—15m is only +0.05%, and the notional even decreased by 365K. The 1h chart is also barely up, with notional shrinking. That suggests this isn’t the kind of panic shorting where everyone rushes in. It looks more like someone steadily adding leverage short while hugging the lower range—liquidity is rotating/turning over, and the entire pool is abnormally compressed into around #20, with notional changes moving into the top 10.
What’s interesting is that passive/initiative trade imbalance is 13.8%, with buy/sell ratio at 1.32. The price broke down, but the active buy-side isn’t weak. The disagreement here is worth watching closely: are the shorts hitting and then retreating, or are there buyers on the spot side picking up during the breakdown? This 15m candle can’t tell us for sure.
24h volume is 55.5M, and the order book depth is thick enough—when the real direction appears, it won’t stay suppressed. At this level, chasing shorts is easy to get snapped back, and bottom-fishing has to wait for the right-side confirmation. First, see whether it can quickly reclaim the area near the lower bound. If it can’t, then the anomaly around the 78th percentile may be just starting to play out.
On the 15m chart, it’s down 1.40%. Volume rose to 1.45x, the Z value is 2.18, and the close directly kicked through the lower boundary of the last ~20 five-minute ranges. On the surface it looks like a breakdown, but OI didn’t move much—15m is only +0.05%, and the notional even decreased by 365K. The 1h chart is also barely up, with notional shrinking. That suggests this isn’t the kind of panic shorting where everyone rushes in. It looks more like someone steadily adding leverage short while hugging the lower range—liquidity is rotating/turning over, and the entire pool is abnormally compressed into around #20, with notional changes moving into the top 10.
What’s interesting is that passive/initiative trade imbalance is 13.8%, with buy/sell ratio at 1.32. The price broke down, but the active buy-side isn’t weak. The disagreement here is worth watching closely: are the shorts hitting and then retreating, or are there buyers on the spot side picking up during the breakdown? This 15m candle can’t tell us for sure.
24h volume is 55.5M, and the order book depth is thick enough—when the real direction appears, it won’t stay suppressed. At this level, chasing shorts is easy to get snapped back, and bottom-fishing has to wait for the right-side confirmation. First, see whether it can quickly reclaim the area near the lower bound. If it can’t, then the anomaly around the 78th percentile may be just starting to play out.
166
·
--
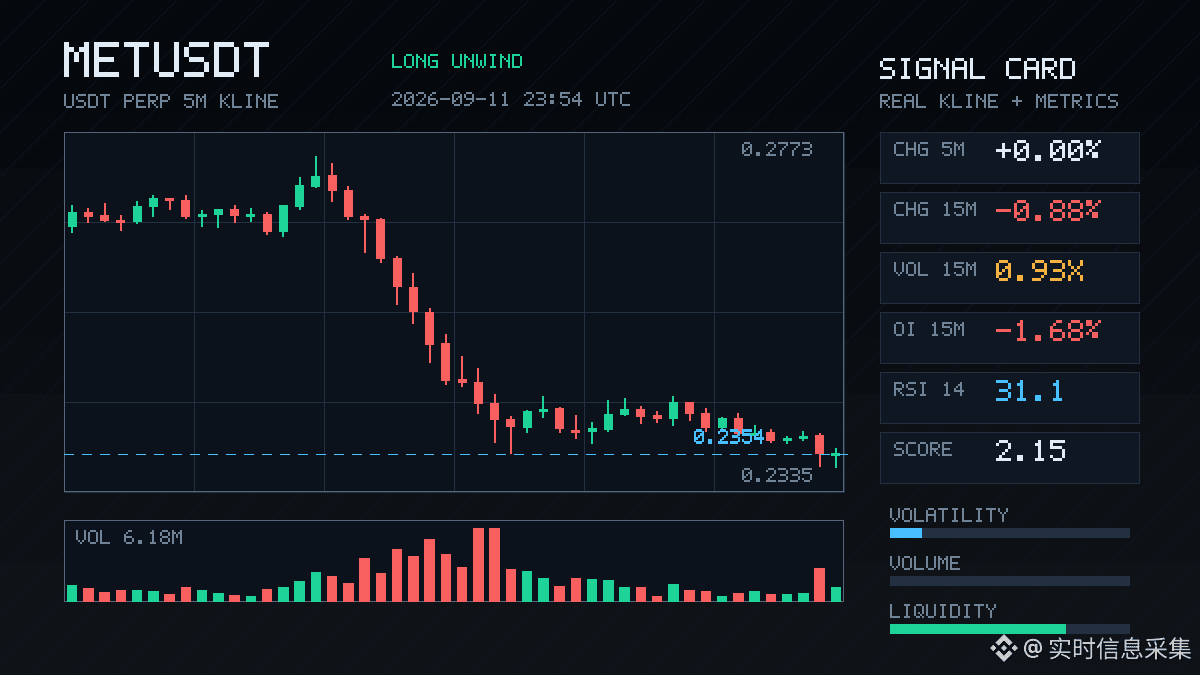
$MET This 15m drop isn’t that harsh, -0.88%, but the contract side moved much more than the price. OI over 1h dropped by 4.62% right away—its notional shrank by more than 420k U. Even on 15m it’s still decreasing, -1.68%. Price is falling + OI is dropping = typical longs are withdrawing: stop-losses or actively reducing positions, not a fresh short entry smashing it down.
Funding rates are still in the high percentile recently—interesting. If the rate is expensive and longs can’t hold, then after a small dip it’s easy to trigger deleveraging. Active trading is down about -4%, the buy/sell ratio is 0.92. Sell-side is slightly dominant, but not to the level of panic. Volume is 0.93x, basically normal, and volatility Z is only 0.52.
Abnormal percentile across the pool is 81.3%, ranking #20; notional change is #29. It’s not the most eye-catching, but combined with the funding rate being high, the long crowding really should get released a bit. 24h turnover is 156M—liquidity is still there, so there’s no need to worry too much about depth.
With this kind of structure, I generally wouldn’t rush to step in. I’d wait for OI to stabilize and for the funding rate to fall before looking again. The process of longs deleveraging often doesn’t end with just one needle-like move.
$MET This 15m drop isn’t that harsh, -0.88%, but the contract side moved much more than the price. OI over 1h dropped by 4.62% right away—its notional shrank by more than 420k U. Even on 15m it’s still decreasing, -1.68%. Price is falling + OI is dropping = typical longs are withdrawing: stop-losses or actively reducing positions, not a fresh short entry smashing it down.
Funding rates are still in the high percentile recently—interesting. If the rate is expensive and longs can’t hold, then after a small dip it’s easy to trigger deleveraging. Active trading is down about -4%, the buy/sell ratio is 0.92. Sell-side is slightly dominant, but not to the level of panic. Volume is 0.93x, basically normal, and volatility Z is only 0.52.
Abnormal percentile across the pool is 81.3%, ranking #20; notional change is #29. It’s not the most eye-catching, but combined with the funding rate being high, the long crowding really should get released a bit. 24h turnover is 156M—liquidity is still there, so there’s no need to worry too much about depth.
With this kind of structure, I generally wouldn’t rush to step in. I’d wait for OI to stabilize and for the funding rate to fall before looking again. The process of longs deleveraging often doesn’t end with just one needle-like move.
Funding rates are still in the high percentile recently—interesting. If the rate is expensive and longs can’t hold, then after a small dip it’s easy to trigger deleveraging. Active trading is down about -4%, the buy/sell ratio is 0.92. Sell-side is slightly dominant, but not to the level of panic. Volume is 0.93x, basically normal, and volatility Z is only 0.52.
Abnormal percentile across the pool is 81.3%, ranking #20; notional change is #29. It’s not the most eye-catching, but combined with the funding rate being high, the long crowding really should get released a bit. 24h turnover is 156M—liquidity is still there, so there’s no need to worry too much about depth.
With this kind of structure, I generally wouldn’t rush to step in. I’d wait for OI to stabilize and for the funding rate to fall before looking again. The process of longs deleveraging often doesn’t end with just one needle-like move.
16
·
--
$VTHO This drop isn’t especially brutal, but the flavor doesn’t feel right.
On the 15m timeframe, price is down -1.71% and volume is only 1.37x; volatility isn’t big either. But OI is shrinking at the same time—15m contracts are down -2.29%, notional -305K, and the 1h chart is falling too. Price drops alongside falling open interest—typical long de-leveraging. This isn’t a brand-new short squeeze being piled on; it looks like someone already backed out first.
Aggressive trades are -10.3%, buy/sell ratio is 0.81, and the sell side is dominating. Funding rate is still stuck in the high percentile recently, which suggests longs weren’t exactly undercrowded beforehand. Now with the OI shrinking more like -2.29% (volume contraction), it looks more like stop-losses getting triggered rather than panic selling.
Over the past 24h, trading value is still 675M, so liquidity hasn’t collapsed. But the pool’s anomalous percentile is 79.4%, and notional change ranks #20—funds are clearly pulling back at this level.
In one sentence: longs are reducing positions, not shorts adding. If the funding rate doesn’t cool down, this show may still have a second half.
$VTHO This drop isn’t especially brutal, but the flavor doesn’t feel right.
On the 15m timeframe, price is down -1.71% and volume is only 1.37x; volatility isn’t big either. But OI is shrinking at the same time—15m contracts are down -2.29%, notional -305K, and the 1h chart is falling too. Price drops alongside falling open interest—typical long de-leveraging. This isn’t a brand-new short squeeze being piled on; it looks like someone already backed out first.
Aggressive trades are -10.3%, buy/sell ratio is 0.81, and the sell side is dominating. Funding rate is still stuck in the high percentile recently, which suggests longs weren’t exactly undercrowded beforehand. Now with the OI shrinking more like -2.29% (volume contraction), it looks more like stop-losses getting triggered rather than panic selling.
Over the past 24h, trading value is still 675M, so liquidity hasn’t collapsed. But the pool’s anomalous percentile is 79.4%, and notional change ranks #20—funds are clearly pulling back at this level.
In one sentence: longs are reducing positions, not shorts adding. If the funding rate doesn’t cool down, this show may still have a second half.
On the 15m timeframe, price is down -1.71% and volume is only 1.37x; volatility isn’t big either. But OI is shrinking at the same time—15m contracts are down -2.29%, notional -305K, and the 1h chart is falling too. Price drops alongside falling open interest—typical long de-leveraging. This isn’t a brand-new short squeeze being piled on; it looks like someone already backed out first.
Aggressive trades are -10.3%, buy/sell ratio is 0.81, and the sell side is dominating. Funding rate is still stuck in the high percentile recently, which suggests longs weren’t exactly undercrowded beforehand. Now with the OI shrinking more like -2.29% (volume contraction), it looks more like stop-losses getting triggered rather than panic selling.
Over the past 24h, trading value is still 675M, so liquidity hasn’t collapsed. But the pool’s anomalous percentile is 79.4%, and notional change ranks #20—funds are clearly pulling back at this level.
In one sentence: longs are reducing positions, not shorts adding. If the funding rate doesn’t cool down, this show may still have a second half.
67
·
--
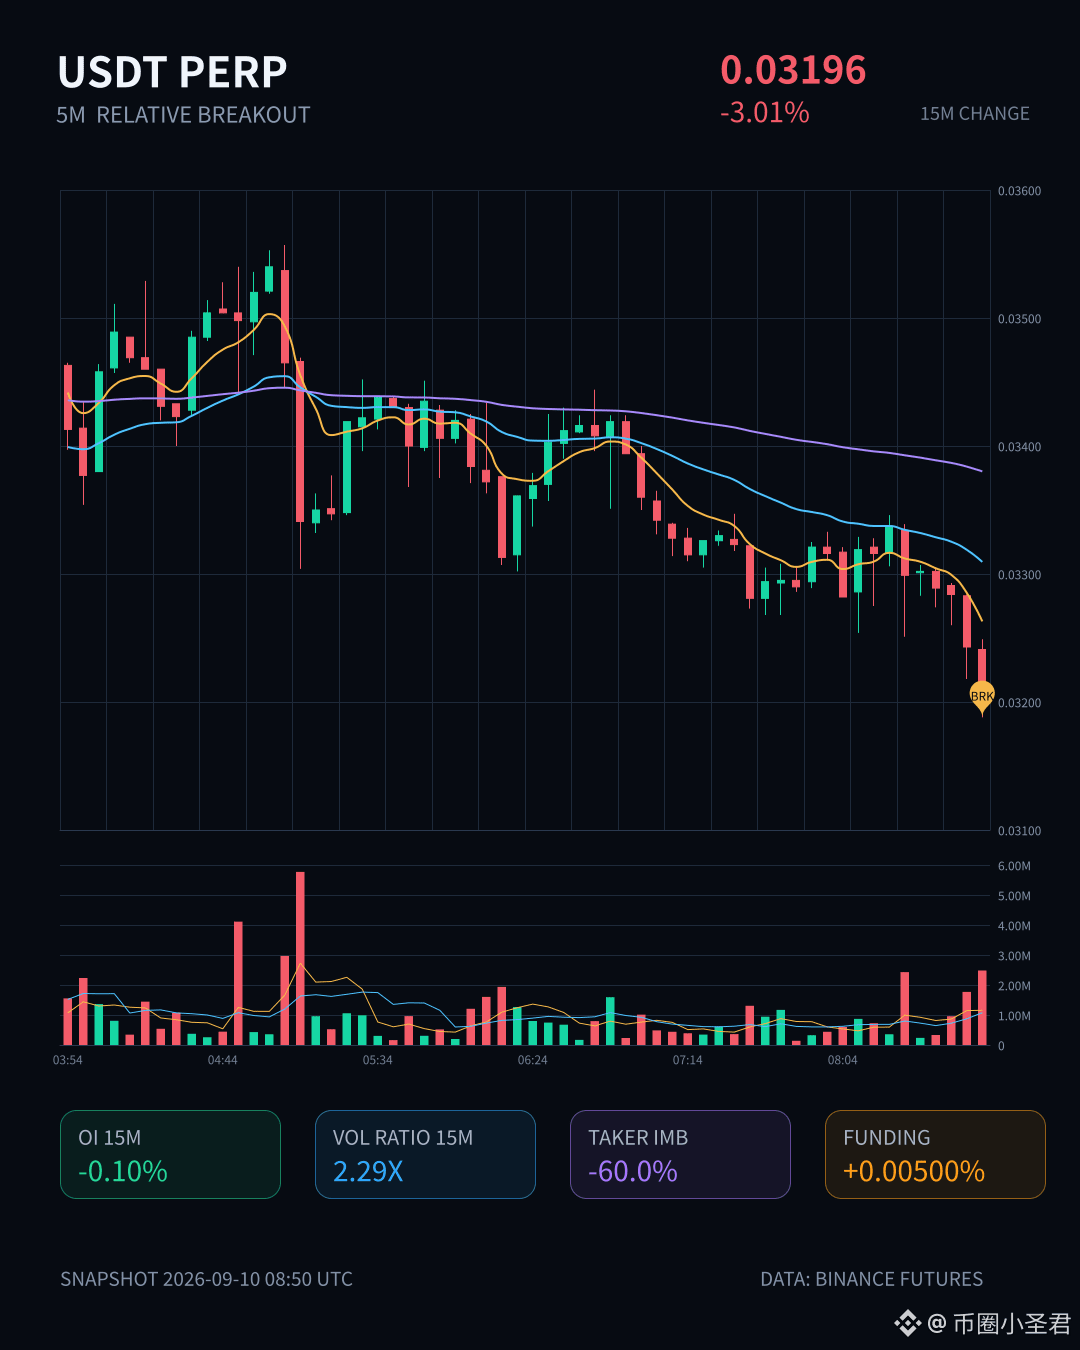
$ HAKIMI This drop is a bit too fast.
In just 15 minutes it dumped 3 percentage points, with volume spiking to 2.29x—breaking through the lower edge of the last 20 five-minute ranges. The aggressive trade difference is -60%, buy/sell ratio is 0.25—basically, sell orders are chasing and hitting.
But interestingly, OI didn’t move much: 15m is only -0.10%, and 1h is still positive. Nominal change is around -130k U—more like long positions are being passively de-leveraged and stopped out, rather than new shorts aggressively entering. The pool’s abnormal percentile is 68.8%, ranking at #20; depth definitely shows funds are moving.
Over the last 24h, turnover is 24.86 million, and the heat is still there. Now it’s a question of whether this is just a shakeout or if it’s really going to keep searching for lower support.
$ HAKIMI This drop is a bit too fast.
In just 15 minutes it dumped 3 percentage points, with volume spiking to 2.29x—breaking through the lower edge of the last 20 five-minute ranges. The aggressive trade difference is -60%, buy/sell ratio is 0.25—basically, sell orders are chasing and hitting.
But interestingly, OI didn’t move much: 15m is only -0.10%, and 1h is still positive. Nominal change is around -130k U—more like long positions are being passively de-leveraged and stopped out, rather than new shorts aggressively entering. The pool’s abnormal percentile is 68.8%, ranking at #20; depth definitely shows funds are moving.
Over the last 24h, turnover is 24.86 million, and the heat is still there. Now it’s a question of whether this is just a shakeout or if it’s really going to keep searching for lower support.
In just 15 minutes it dumped 3 percentage points, with volume spiking to 2.29x—breaking through the lower edge of the last 20 five-minute ranges. The aggressive trade difference is -60%, buy/sell ratio is 0.25—basically, sell orders are chasing and hitting.
But interestingly, OI didn’t move much: 15m is only -0.10%, and 1h is still positive. Nominal change is around -130k U—more like long positions are being passively de-leveraged and stopped out, rather than new shorts aggressively entering. The pool’s abnormal percentile is 68.8%, ranking at #20; depth definitely shows funds are moving.
Over the last 24h, turnover is 24.86 million, and the heat is still there. Now it’s a question of whether this is just a shakeout or if it’s really going to keep searching for lower support.
78

·
--
EVAA Abnormal Movement AnalysisEVAA This drop is pretty vicious. In 24 hours it’s down 20.7%, and it wasn’t a one-time dump—it’s a continued sell-off. It’s been in waves of 60; the initial push already lasted 5.3 hours. The 5m is still -7.5%, and the 1h is -3.1%. The short-term chart clearly hasn’t stabilized. If you rush in now, you’re basically just catching a flying knife.
Look at the volume: vol is 11.5x. This is a volume-backed decline, not a low-volume, slow fade. A volume dump indicates real selling pressure—there are holders fleeing for their lives. With volume like this, don’t fantasize about some kind of V-shaped reversal. More importantly, the OI dropped 8.7% and open interest is decreasing, meaning the longs are being liquidated and cleared out. It’s not as simple as new shorts entering—it's that the longs themselves can’t take it and are cutting losses. Bottom-picking in this situation is like lifting the sedan for the liquidation crowd.
EVAA Abnormal Movement Analysis
EVAA This drop is pretty vicious. In 24 hours it’s down 20.7%, and it wasn’t a one-time dump—it’s a continued sell-off. It’s been in waves of 60; the initial push already lasted 5.3 hours. The 5m is still -7.5%, and the 1h is -3.1%. The short-term chart clearly hasn’t stabilized. If you rush in now, you’re basically just catching a flying knife.
Look at the volume: vol is 11.5x. This is a volume-backed decline, not a low-volume, slow fade. A volume dump indicates real selling pressure—there are holders fleeing for their lives. With volume like this, don’t fantasize about some kind of V-shaped reversal. More importantly, the OI dropped 8.7% and open interest is decreasing, meaning the longs are being liquidated and cleared out. It’s not as simple as new shorts entering—it's that the longs themselves can’t take it and are cutting losses. Bottom-picking in this situation is like lifting the sedan for the liquidation crowd.
Look at the volume: vol is 11.5x. This is a volume-backed decline, not a low-volume, slow fade. A volume dump indicates real selling pressure—there are holders fleeing for their lives. With volume like this, don’t fantasize about some kind of V-shaped reversal. More importantly, the OI dropped 8.7% and open interest is decreasing, meaning the longs are being liquidated and cleared out. It’s not as simple as new shorts entering—it's that the longs themselves can’t take it and are cutting losses. Bottom-picking in this situation is like lifting the sedan for the liquidation crowd.
75
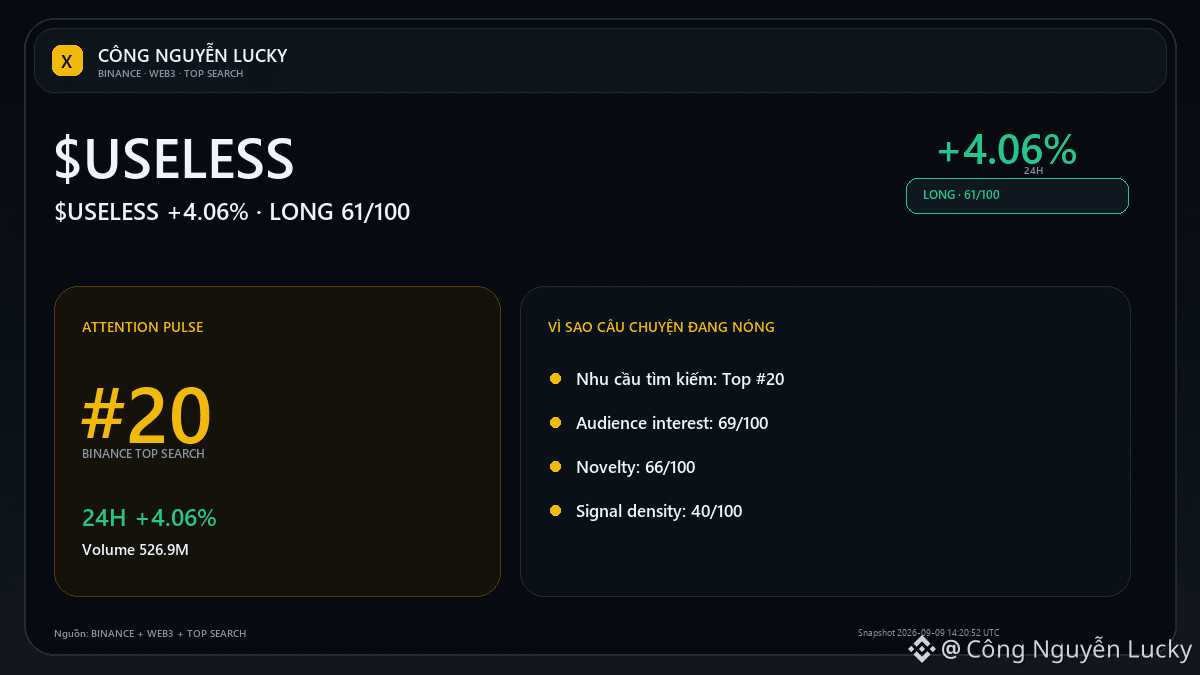
🗣️ $USELESS is seeing unusually strong social discussion on Binance Web3. Current sentiment: Positive.
Market: 0.30163 · 24h +4.06% · volume ~526.9M USDT · 7,594,611 trades.
Social context: USELESS listed on Bithumb, USELESS listed on Upbit, Market Cap surges.
Social attention can drive price, but it can also be latecomers piling in.
Confirmation: A break above 0.33728 with expanding volume will make the continuation scenario more credible.
Invalidation: Failing to hold the high and dropping back below the midpoint 0.301665 will make the cooldown scenario more obvious.
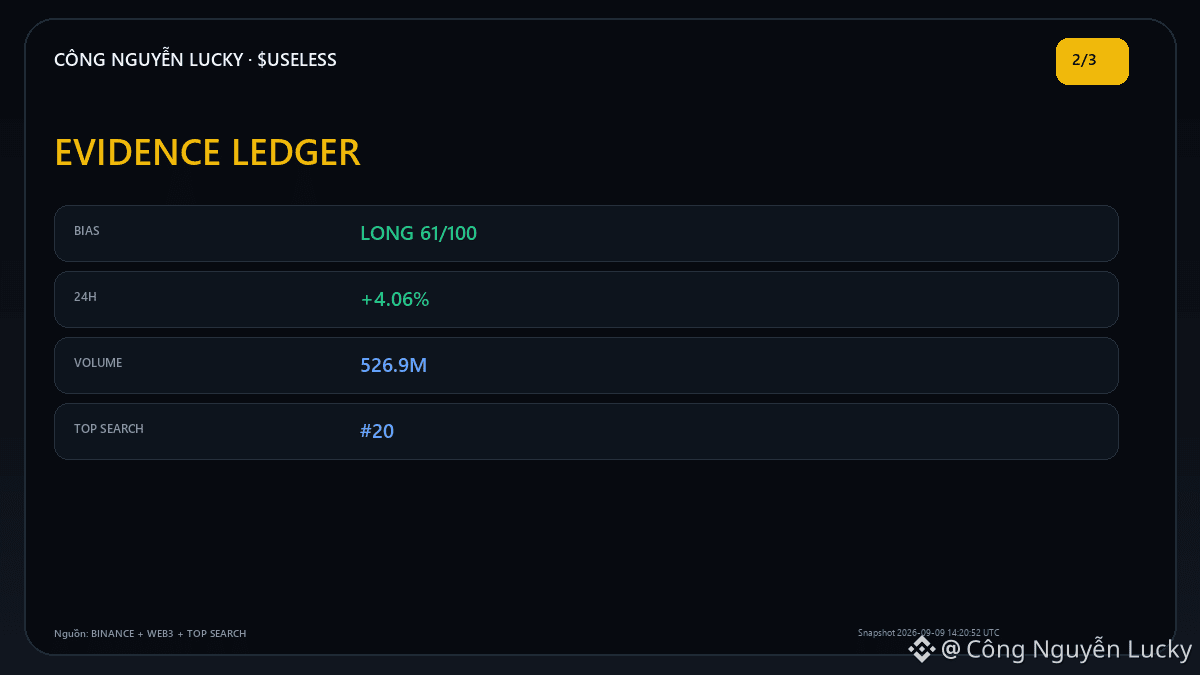
🧭 Current outlook: **LONG · LIGHT · 61/100**.
Main basis: price 24h +4.06%.
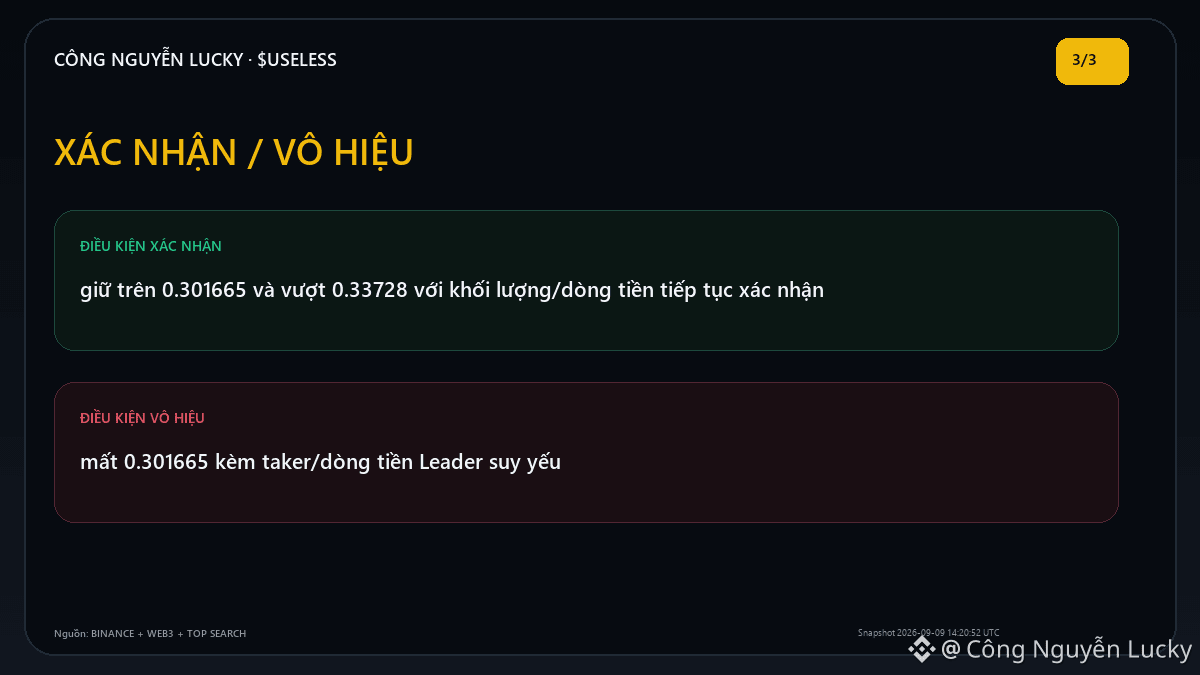
Additional confirmation when: holding above 0.301665 and breaking 0.33728 with volume/flow continuing to confirm.
Lower/void the bias if: losing 0.301665 with taker/leader flow weakening.
💬 With $USELESS, are you weighting price/volume more, or flow/positioning?
🔎 **Evidence check — LONG 61/100**
• Price 0.30163; 24h +4.06%; volume 526.9M.
• Binance Top Search #20.
🧭 **Key levels to watch:** confirmation: hold above 0.301665 and break 0.33728 with volume/flow continuing to confirm · invalidation: lose 0.301665 with taker/leader flow weakening
Reference sources: Binance Futures Market + Binance Web3 Trending + Binance Top Search + Binance Social Hype · snapshot 2026-09-09 14:20:52 UTC
⚠️ This market analysis is for reference only, not a commitment to profits. Everyone should do their own research (DYOR), manage risk independently, and take full responsibility for their trading decisions.
$USELESS
🗣️ $USELESS is seeing unusually strong social discussion on Binance Web3. Current sentiment: Positive.
Market: 0.30163 · 24h +4.06% · volume ~526.9M USDT · 7,594,611 trades.
Social context: USELESS listed on Bithumb, USELESS listed on Upbit, Market Cap surges.
Social attention can drive price, but it can also be latecomers piling in.
Confirmation: A break above 0.33728 with expanding volume will make the continuation scenario more credible.
Invalidation: Failing to hold the high and dropping back below the midpoint 0.301665 will make the cooldown scenario more obvious.
🧭 Current outlook: **LONG · LIGHT · 61/100**.
Main basis: price 24h +4.06%.
Additional confirmation when: holding above 0.301665 and breaking 0.33728 with volume/flow continuing to confirm.
Lower/void the bias if: losing 0.301665 with taker/leader flow weakening.
💬 With $USELESS , are you weighting price/volume more, or flow/positioning?
🔎 **Evidence check — LONG 61/100**
• Price 0.30163; 24h +4.06%; volume 526.9M.
• Binance Top Search #20.
🧭 **Key levels to watch:** confirmation: hold above 0.301665 and break 0.33728 with volume/flow continuing to confirm · invalidation: lose 0.301665 with taker/leader flow weakening
Reference sources: Binance Futures Market + Binance Web3 Trending + Binance Top Search + Binance Social Hype · snapshot 2026-09-09 14:20:52 UTC
⚠️ This market analysis is for reference only, not a commitment to profits. Everyone should do their own research (DYOR), manage risk independently, and take full responsibility for their trading decisions.
$USELESS
Market: 0.30163 · 24h +4.06% · volume ~526.9M USDT · 7,594,611 trades.
Social context: USELESS listed on Bithumb, USELESS listed on Upbit, Market Cap surges.
Social attention can drive price, but it can also be latecomers piling in.
Confirmation: A break above 0.33728 with expanding volume will make the continuation scenario more credible.
Invalidation: Failing to hold the high and dropping back below the midpoint 0.301665 will make the cooldown scenario more obvious.
🧭 Current outlook: **LONG · LIGHT · 61/100**.
Main basis: price 24h +4.06%.
Additional confirmation when: holding above 0.301665 and breaking 0.33728 with volume/flow continuing to confirm.
Lower/void the bias if: losing 0.301665 with taker/leader flow weakening.
💬 With $USELESS , are you weighting price/volume more, or flow/positioning?
🔎 **Evidence check — LONG 61/100**
• Price 0.30163; 24h +4.06%; volume 526.9M.
• Binance Top Search #20.
🧭 **Key levels to watch:** confirmation: hold above 0.301665 and break 0.33728 with volume/flow continuing to confirm · invalidation: lose 0.301665 with taker/leader flow weakening
Reference sources: Binance Futures Market + Binance Web3 Trending + Binance Top Search + Binance Social Hype · snapshot 2026-09-09 14:20:52 UTC
⚠️ This market analysis is for reference only, not a commitment to profits. Everyone should do their own research (DYOR), manage risk independently, and take full responsibility for their trading decisions.
$USELESS
73
Article
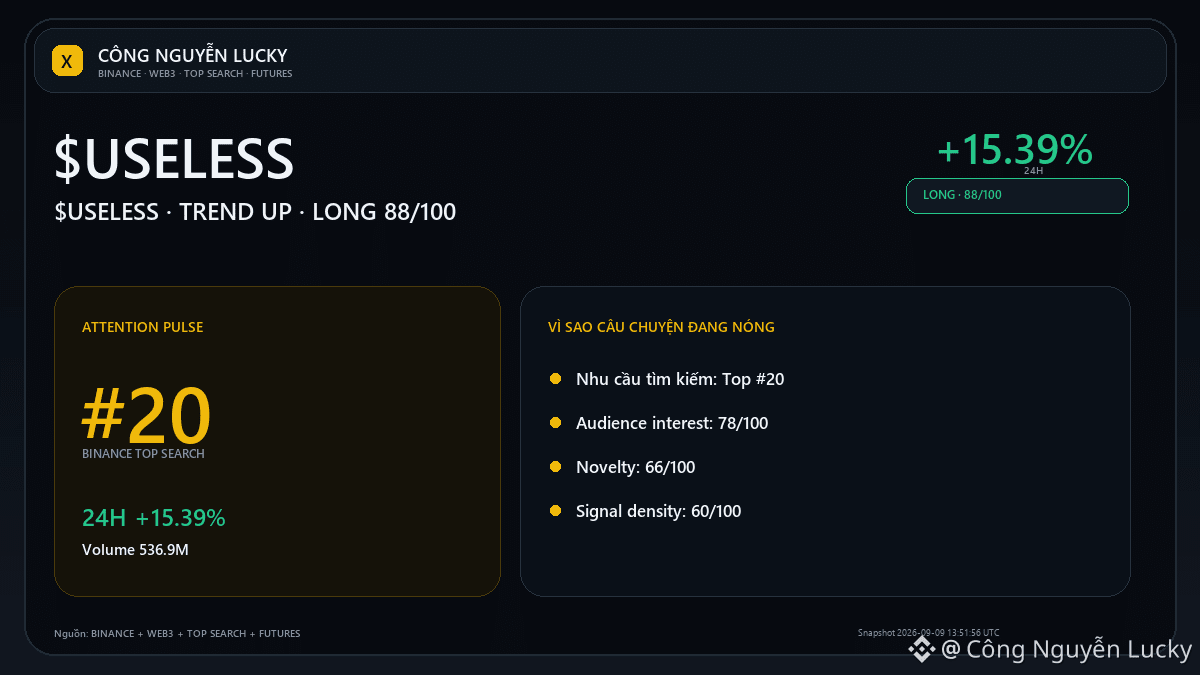
$USELESS · TREND UP: real breakout or just a 24h fluctuation?🧩 $USELESS: price +15.39% while OI -5.70%. I read this pair data before looking at the volatile headline.
Market: 0.30787 · 24h +15.39% · volume ~536.9M USDT · 7,669,642 trades.
Funding: +0.03%.
Scenario:
A) If price/OI continue in agreement: Breaking above 0.33728 with expanded open interest will make the continuation scenario more credible.
B) If leverage increases but price doesn’t move: Failing to hold the high and dropping back below the midpoint 0.301665 will make the cooling-off scenario more evident.
$USELESS · TREND UP: real breakout or just a 24h fluctuation?
🧩 $USELESS : price +15.39% while OI -5.70%. I read this pair data before looking at the volatile headline.
Market: 0.30787 · 24h +15.39% · volume ~536.9M USDT · 7,669,642 trades.
Funding: +0.03%.
Scenario:
A) If price/OI continue in agreement: Breaking above 0.33728 with expanded open interest will make the continuation scenario more credible.
B) If leverage increases but price doesn’t move: Failing to hold the high and dropping back below the midpoint 0.301665 will make the cooling-off scenario more evident.
Market: 0.30787 · 24h +15.39% · volume ~536.9M USDT · 7,669,642 trades.
Funding: +0.03%.
Scenario:
A) If price/OI continue in agreement: Breaking above 0.33728 with expanded open interest will make the continuation scenario more credible.
B) If leverage increases but price doesn’t move: Failing to hold the high and dropping back below the midpoint 0.301665 will make the cooling-off scenario more evident.
48
Log in to explore more content
Join global crypto users on Binance Square
⚡️ Get latest and useful information about crypto.
💬 Trusted by the world’s largest crypto exchange.
👍 Discover real insights from verified creators.
Email / Phone number
Trending Topics
1
#SaylorHintsStrategyBitcoinBuy
2.2M views
11,886 Discussing
2
#BOJRaisesRatesTo31YearHigh
206,834 views
2,954 Discussing
3
#BuffettStepsDownAsBerkshireChairman
100,095 views
1,561 Discussing
4
#XRPExchangeReservesHitSevenYearLow
107,606 views
1,378 Discussing
5
#HKCompletesFirstHKDStablecoinUseCase
135,907 views
1,763 Discussing
6
#VietnamPlansFirstCryptoLicensesIn2026
85,274 views
1,187 Discussing
7
#BTCBreaks80K
493,577 views
5,540 Discussing
8
#BitcoinMarketCapTopsTesla
118,345 views
1,344 Discussing
9
#SOLJumpsAbout10%
119,691 views
1,220 Discussing
10
#EthereumReclaims$2600
10,565 views
138 Discussing