
#21
21
35,313 views
185 Discussing
Hot
Latest

·
--
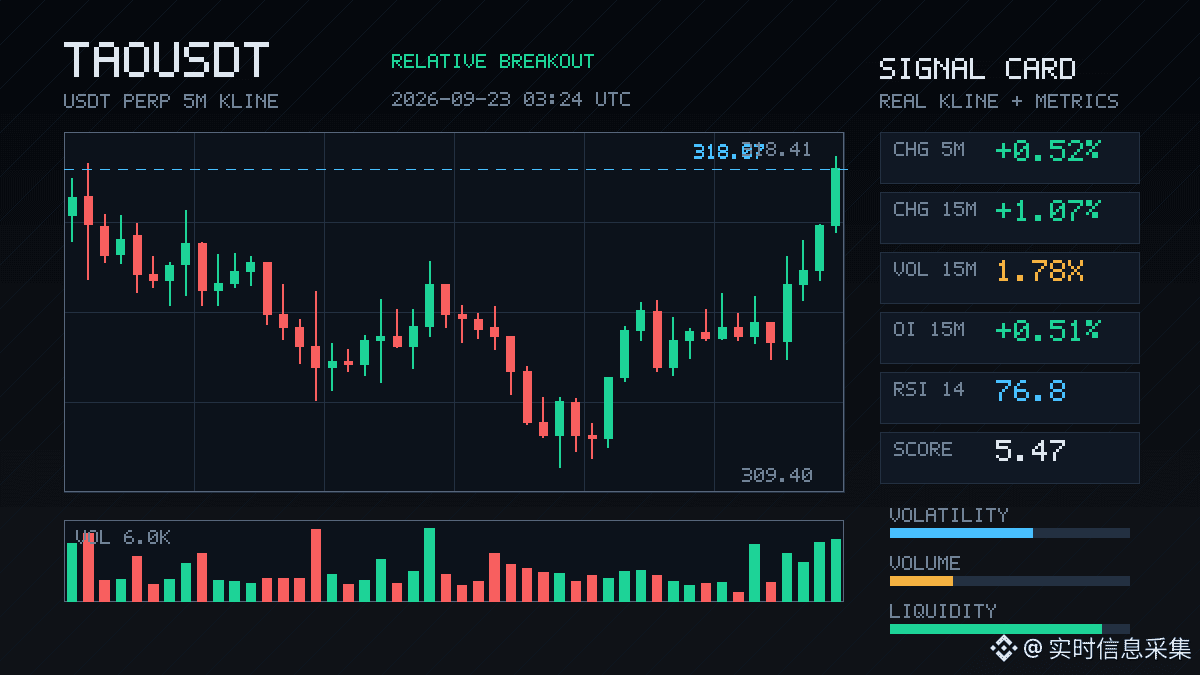
$TAO This move is a bit interesting.
On the 15m close, it directly broke above the prior 20 bars’ 5m upper level. Volume was 1.78x, and the active buy/sell ratio was 1.60. This isn’t the kind of fake breakout where it just jabs and retreats—the bid is truly being eaten up.
The key is the OI. Both the 15m and 1h cycles are adding; the nominal net increase is around 1.6 million U. The abnormal percentile is up to 84.9%, and the whole pool ranks at #21. Price is rising along with OI—this is a typical leveraged long entry structure, not a passive squeeze where shorts are forced up.
I don’t really like chasing the first leg, but I’ll watch for the pullback. If the pullback doesn’t break the upper edge of that just-mentioned range, and it can stay sideways before the funding rate gets overheated, then the second leg is often cleaner than the first.
The funding rate is already in the high percentile recently. That’s the only thing I’m a bit cautious about. When longs get crowded, don’t cram yourself in and become extra fuel.
Let’s see if it can hold tonight.
$TAO This move is a bit interesting.
On the 15m close, it directly broke above the prior 20 bars’ 5m upper level. Volume was 1.78x, and the active buy/sell ratio was 1.60. This isn’t the kind of fake breakout where it just jabs and retreats—the bid is truly being eaten up.
The key is the OI. Both the 15m and 1h cycles are adding; the nominal net increase is around 1.6 million U. The abnormal percentile is up to 84.9%, and the whole pool ranks at #21. Price is rising along with OI—this is a typical leveraged long entry structure, not a passive squeeze where shorts are forced up.
I don’t really like chasing the first leg, but I’ll watch for the pullback. If the pullback doesn’t break the upper edge of that just-mentioned range, and it can stay sideways before the funding rate gets overheated, then the second leg is often cleaner than the first.
The funding rate is already in the high percentile recently. That’s the only thing I’m a bit cautious about. When longs get crowded, don’t cram yourself in and become extra fuel.
Let’s see if it can hold tonight.
On the 15m close, it directly broke above the prior 20 bars’ 5m upper level. Volume was 1.78x, and the active buy/sell ratio was 1.60. This isn’t the kind of fake breakout where it just jabs and retreats—the bid is truly being eaten up.
The key is the OI. Both the 15m and 1h cycles are adding; the nominal net increase is around 1.6 million U. The abnormal percentile is up to 84.9%, and the whole pool ranks at #21. Price is rising along with OI—this is a typical leveraged long entry structure, not a passive squeeze where shorts are forced up.
I don’t really like chasing the first leg, but I’ll watch for the pullback. If the pullback doesn’t break the upper edge of that just-mentioned range, and it can stay sideways before the funding rate gets overheated, then the second leg is often cleaner than the first.
The funding rate is already in the high percentile recently. That’s the only thing I’m a bit cautious about. When longs get crowded, don’t cram yourself in and become extra fuel.
Let’s see if it can hold tonight.
13

·
--
$PONS In these 15m, there’s something here.
A single bullish candle pulled up 2.58%. The volume directly pushed to 3.98x, with a Z value of 2.89—this isn’t something retail hand-speed can “crank out.” The key is that OI is moving in sync with the rise: the 15m contract +0.38%, with a notional entry of 720K. Structurally, this looks like new long positions adding leverage—not a short liquidation/trailing slam.
Active trades are up by 35.5%, buy/sell ratio is 2.1, and the buy orders are very decisive.
The closing price has already broken above the upper band of nearly 20 consecutive 5m candles—the breakout is real.
But pay attention to one detail: the 1h OI is -0.42%, which suggests this move has just started and isn’t a sustained pile-up. There’s short-term breakout power, but whether it can continue depends on whether the next 15m candle can hold this level.
The abnormal percentile across the whole pool is 86.1%. The notional change ranks #21, and among the 24h turnover universe (85M+), the volume isn’t small compared to the broader set. Watch it for now—don’t rush to chase the price.
$PONS In these 15m, there’s something here.
A single bullish candle pulled up 2.58%. The volume directly pushed to 3.98x, with a Z value of 2.89—this isn’t something retail hand-speed can “crank out.” The key is that OI is moving in sync with the rise: the 15m contract +0.38%, with a notional entry of 720K. Structurally, this looks like new long positions adding leverage—not a short liquidation/trailing slam.
Active trades are up by 35.5%, buy/sell ratio is 2.1, and the buy orders are very decisive.
The closing price has already broken above the upper band of nearly 20 consecutive 5m candles—the breakout is real.
But pay attention to one detail: the 1h OI is -0.42%, which suggests this move has just started and isn’t a sustained pile-up. There’s short-term breakout power, but whether it can continue depends on whether the next 15m candle can hold this level.
The abnormal percentile across the whole pool is 86.1%. The notional change ranks #21, and among the 24h turnover universe (85M+), the volume isn’t small compared to the broader set. Watch it for now—don’t rush to chase the price.
A single bullish candle pulled up 2.58%. The volume directly pushed to 3.98x, with a Z value of 2.89—this isn’t something retail hand-speed can “crank out.” The key is that OI is moving in sync with the rise: the 15m contract +0.38%, with a notional entry of 720K. Structurally, this looks like new long positions adding leverage—not a short liquidation/trailing slam.
Active trades are up by 35.5%, buy/sell ratio is 2.1, and the buy orders are very decisive.
The closing price has already broken above the upper band of nearly 20 consecutive 5m candles—the breakout is real.
But pay attention to one detail: the 1h OI is -0.42%, which suggests this move has just started and isn’t a sustained pile-up. There’s short-term breakout power, but whether it can continue depends on whether the next 15m candle can hold this level.
The abnormal percentile across the whole pool is 86.1%. The notional change ranks #21, and among the 24h turnover universe (85M+), the volume isn’t small compared to the broader set. Watch it for now—don’t rush to chase the price.
16
·
--
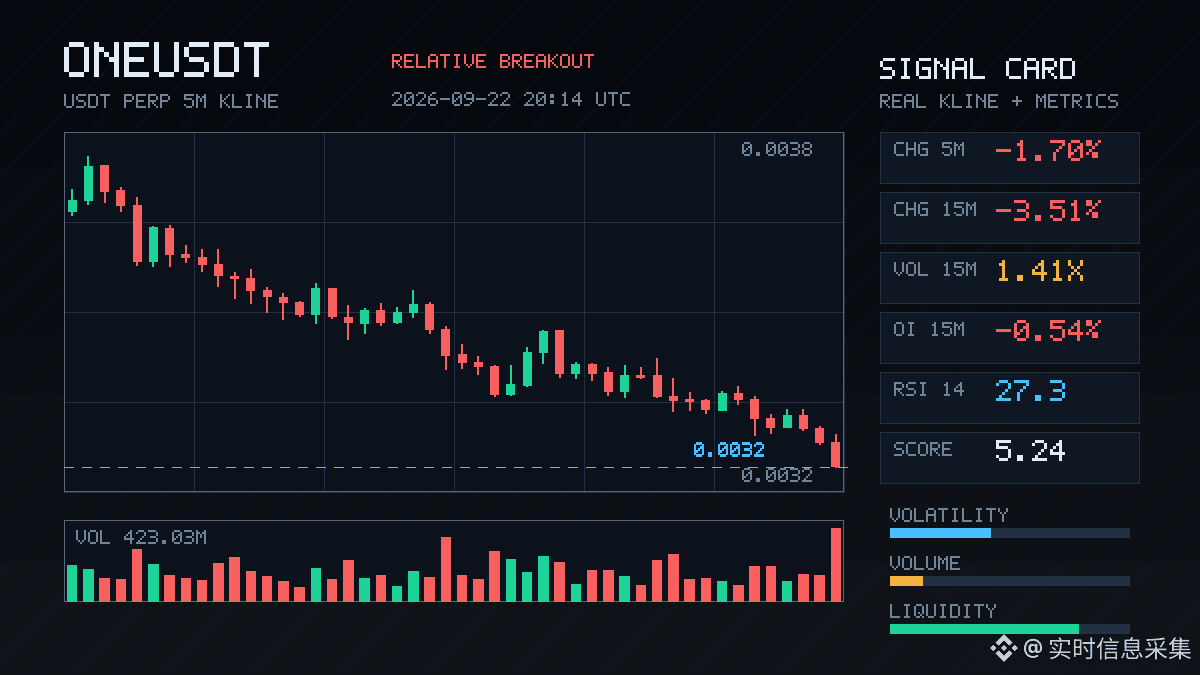
$ONE This 15m candle looks a bit ugly.
The current price has directly broken below the lower edge of about 20 five-minute candles. The 15m is down 3.51%, and volume has expanded to 1.41x. The buy/sell ratio is 0.69 on active orders—sell pressure is really being slammed into the order book, not just a fake move.
But what’s interesting is the OI: the 15m OI is -0.54%, and the nominal change in the 1h is -5.31%. Price is falling while OI is also dropping. This doesn’t look like fresh shorts entering; it looks more like longs deleveraging, with stop-losses causing them to pass the baton. In the whole pool, abnormal rank #24 and nominal change rank #21 suggest that some capital is contracting—this isn’t purely an emotion-driven selloff.
Based on my experience with this kind of structure: either it quickly pokes through and then snaps back, or it grinds lower while clearing leverage before choosing a direction. The 24h traded value is still about 230M, so liquidity is fine. Don’t rush to buy yet—first see whether the next 15m can reclaim the lower bound of the range. If it can’t, that becomes an effective breakdown, and there’s more room below.
$ONE This 15m candle looks a bit ugly.
The current price has directly broken below the lower edge of about 20 five-minute candles. The 15m is down 3.51%, and volume has expanded to 1.41x. The buy/sell ratio is 0.69 on active orders—sell pressure is really being slammed into the order book, not just a fake move.
But what’s interesting is the OI: the 15m OI is -0.54%, and the nominal change in the 1h is -5.31%. Price is falling while OI is also dropping. This doesn’t look like fresh shorts entering; it looks more like longs deleveraging, with stop-losses causing them to pass the baton. In the whole pool, abnormal rank #24 and nominal change rank #21 suggest that some capital is contracting—this isn’t purely an emotion-driven selloff.
Based on my experience with this kind of structure: either it quickly pokes through and then snaps back, or it grinds lower while clearing leverage before choosing a direction. The 24h traded value is still about 230M, so liquidity is fine. Don’t rush to buy yet—first see whether the next 15m can reclaim the lower bound of the range. If it can’t, that becomes an effective breakdown, and there’s more room below.
The current price has directly broken below the lower edge of about 20 five-minute candles. The 15m is down 3.51%, and volume has expanded to 1.41x. The buy/sell ratio is 0.69 on active orders—sell pressure is really being slammed into the order book, not just a fake move.
But what’s interesting is the OI: the 15m OI is -0.54%, and the nominal change in the 1h is -5.31%. Price is falling while OI is also dropping. This doesn’t look like fresh shorts entering; it looks more like longs deleveraging, with stop-losses causing them to pass the baton. In the whole pool, abnormal rank #24 and nominal change rank #21 suggest that some capital is contracting—this isn’t purely an emotion-driven selloff.
Based on my experience with this kind of structure: either it quickly pokes through and then snaps back, or it grinds lower while clearing leverage before choosing a direction. The 24h traded value is still about 230M, so liquidity is fine. Don’t rush to buy yet—first see whether the next 15m can reclaim the lower bound of the range. If it can’t, that becomes an effective breakdown, and there’s more room below.
6

·
--
** + 0.84% and 6K… Why This Low Volatility Is a Buy Signal Now?NEAR Protocol (NEARUSDT) is trending right now!
Rank: #21
** Shocking number: 24 hours saw it settle at the **6,026.81** level with only a **%0.837** increase. A 2.17B volume shows that liquidity in the market is still solid. Most traders say “BTC is now rekt,” but I think ****’s this tight move is an accumulation before a “pump.” In the altcoin space, meanwhile, **** surged **%10.369** to **.609**. A 65.9M NEAR volume (≈ 83M) is truly an “ape-in” opportunity. **** rose **%5.3** to **/bin/sh.09874**, with a daily volume of 3.1M — “doge moon” rumors are still alive. On the other hand, **** fell **%5.262** back to **0.82**, and **** dropped **%3.724** to **0.49**. These losses are a good time for those looking to balance risk-on/risk-off to reconsider buying “short.” **Alpha call:** - ****: Play a “range-bound” between 86K–90K; do DCA within 86.5K–87.5K. Volatility is low, and a “buy-the-dip” strategy makes sense. - ****: I’m expecting a “breakout” between 4.4–4.7. Open a long with a 10% stop-loss above 4.5; keep the position tight against the risk of a short-term “pump-and-dump.” - ****: There’s a “range swing” in the 0.095–0.105 band. Buy a “scalp” from 0.0985 and take profit when it reaches 0.102. **Education corner:** Liquidity pools and “order-book depth” analysis are critical for confirming price movement alongside the 24h volume. ’s 2.17B volume supports the **0.8%** price increase as “institutional” buying backing
** + 0.84% and 6K… Why This Low Volatility Is a Buy Signal Now?
NEAR Protocol (NEARUSDT) is trending right now!
Rank: #21
** Shocking number: 24 hours saw it settle at the **6,026.81** level with only a **%0.837** increase. A 2.17B volume shows that liquidity in the market is still solid. Most traders say “BTC is now rekt,” but I think ****’s this tight move is an accumulation before a “pump.” In the altcoin space, meanwhile, **** surged **%10.369** to **.609**. A 65.9M NEAR volume (≈ 83M) is truly an “ape-in” opportunity. **** rose **%5.3** to **/bin/sh.09874**, with a daily volume of 3.1M — “doge moon” rumors are still alive. On the other hand, **** fell **%5.262** back to **0.82**, and **** dropped **%3.724** to **0.49**. These losses are a good time for those looking to balance risk-on/risk-off to reconsider buying “short.” **Alpha call:** - ****: Play a “range-bound” between 86K–90K; do DCA within 86.5K–87.5K. Volatility is low, and a “buy-the-dip” strategy makes sense. - ****: I’m expecting a “breakout” between 4.4–4.7. Open a long with a 10% stop-loss above 4.5; keep the position tight against the risk of a short-term “pump-and-dump.” - ****: There’s a “range swing” in the 0.095–0.105 band. Buy a “scalp” from 0.0985 and take profit when it reaches 0.102. **Education corner:** Liquidity pools and “order-book depth” analysis are critical for confirming price movement alongside the 24h volume. ’s 2.17B volume supports the **0.8%** price increase as “institutional” buying backing
Rank: #21
** Shocking number: 24 hours saw it settle at the **6,026.81** level with only a **%0.837** increase. A 2.17B volume shows that liquidity in the market is still solid. Most traders say “BTC is now rekt,” but I think ****’s this tight move is an accumulation before a “pump.” In the altcoin space, meanwhile, **** surged **%10.369** to **.609**. A 65.9M NEAR volume (≈ 83M) is truly an “ape-in” opportunity. **** rose **%5.3** to **/bin/sh.09874**, with a daily volume of 3.1M — “doge moon” rumors are still alive. On the other hand, **** fell **%5.262** back to **0.82**, and **** dropped **%3.724** to **0.49**. These losses are a good time for those looking to balance risk-on/risk-off to reconsider buying “short.” **Alpha call:** - ****: Play a “range-bound” between 86K–90K; do DCA within 86.5K–87.5K. Volatility is low, and a “buy-the-dip” strategy makes sense. - ****: I’m expecting a “breakout” between 4.4–4.7. Open a long with a 10% stop-loss above 4.5; keep the position tight against the risk of a short-term “pump-and-dump.” - ****: There’s a “range swing” in the 0.095–0.105 band. Buy a “scalp” from 0.0985 and take profit when it reaches 0.102. **Education corner:** Liquidity pools and “order-book depth” analysis are critical for confirming price movement alongside the 24h volume. ’s 2.17B volume supports the **0.8%** price increase as “institutional” buying backing
16

·
--
#21
The yellow flowers I want to receive
#21
The yellow flowers I want to receive
The yellow flowers I want to receive

Marylee Shebchuk P9qE:
muy buenos días
3
1
15
1.3k

·
--
$ETHFI This drop is kind of interesting.
The price went down 1.33%, yet the OI is still pushing upward: the 1h contract open interest is +0.19%, the percentile is 91.3%, and the whole pool ranks at #21.
This isn’t a sell-off liquidation dump that drives the drop; it looks more like someone is actively adding short positions at this level.
Passive trading gap is -13.9%, buy/sell ratio is 0.76—direction is clearly skewed. The close also broke below the lower bound of the recent 20 consecutive 5m candles, so on the short term it’s a broken structure.
But pay attention to one detail: the nominal change is negative, -323K USDT. The OI number of contracts is rising while the nominal notional amount is shrinking—this suggests the size of these newly added leveraged shorts isn’t that large; it’s more like tentative opening rather than a one-shot crushing move.
The funding rate is still at a high percentile recently. If shorts keep adding at this point, either they’re certain there will be another leg down, or the overcrowding of shorts is beginning to rise—meaning a rebound could educate them at any moment.
With 33M in daily traded value, the order book isn’t that thick. If things really heat up, slippage will teach you a lesson. Whether you’re catching knives on the left or chasing shorts on the right, neither side feels comfortable right now.
$ETHFI This drop is kind of interesting.
The price went down 1.33%, yet the OI is still pushing upward: the 1h contract open interest is +0.19%, the percentile is 91.3%, and the whole pool ranks at #21.
This isn’t a sell-off liquidation dump that drives the drop; it looks more like someone is actively adding short positions at this level.
Passive trading gap is -13.9%, buy/sell ratio is 0.76—direction is clearly skewed. The close also broke below the lower bound of the recent 20 consecutive 5m candles, so on the short term it’s a broken structure.
But pay attention to one detail: the nominal change is negative, -323K USDT. The OI number of contracts is rising while the nominal notional amount is shrinking—this suggests the size of these newly added leveraged shorts isn’t that large; it’s more like tentative opening rather than a one-shot crushing move.
The funding rate is still at a high percentile recently. If shorts keep adding at this point, either they’re certain there will be another leg down, or the overcrowding of shorts is beginning to rise—meaning a rebound could educate them at any moment.
With 33M in daily traded value, the order book isn’t that thick. If things really heat up, slippage will teach you a lesson. Whether you’re catching knives on the left or chasing shorts on the right, neither side feels comfortable right now.
The price went down 1.33%, yet the OI is still pushing upward: the 1h contract open interest is +0.19%, the percentile is 91.3%, and the whole pool ranks at #21.
This isn’t a sell-off liquidation dump that drives the drop; it looks more like someone is actively adding short positions at this level.
Passive trading gap is -13.9%, buy/sell ratio is 0.76—direction is clearly skewed. The close also broke below the lower bound of the recent 20 consecutive 5m candles, so on the short term it’s a broken structure.
But pay attention to one detail: the nominal change is negative, -323K USDT. The OI number of contracts is rising while the nominal notional amount is shrinking—this suggests the size of these newly added leveraged shorts isn’t that large; it’s more like tentative opening rather than a one-shot crushing move.
The funding rate is still at a high percentile recently. If shorts keep adding at this point, either they’re certain there will be another leg down, or the overcrowding of shorts is beginning to rise—meaning a rebound could educate them at any moment.
With 33M in daily traded value, the order book isn’t that thick. If things really heat up, slippage will teach you a lesson. Whether you’re catching knives on the left or chasing shorts on the right, neither side feels comfortable right now.
52

·
--
In the last 24 hours, it surged 26.7%. Spot trading volume reached $380 million, with the current price at 4.413. On CoinGecko’s Hotness ranking, it’s ranked #21 by market cap, but what’s pushing it isn’t NEAR’s own narrative—it’s the flow spillover from Zcash cross-chain conversions. In the same period, ZEC only rose 5.2%, and its market cap is ranked #9, which suggests the money isn’t coming in for the sake of Zcash’s price. Instead, people are genuinely using private transactions, and that flow ends up in NEAR’s cross-chain channel. When I traced this path, I noticed that BTC only rose 1.1% over the same period, with a trading volume of $900 million. Meanwhile, a coin with a market cap of #21 produced $380 million in trading volume—so the ratio is off. So don’t treat this NEAR move as a positive development driven by NEAR itself. It’s more like an outlet where Zcash’s privacy demand is finding a way out. How long that outlet can stay open depends on whether Zcash’s conversion volume can keep up. $NEAR $ZEC
In the last 24 hours, it surged 26.7%. Spot trading volume reached $380 million, with the current price at 4.413. On CoinGecko’s Hotness ranking, it’s ranked #21 by market cap, but what’s pushing it isn’t NEAR’s own narrative—it’s the flow spillover from Zcash cross-chain conversions. In the same period, ZEC only rose 5.2%, and its market cap is ranked #9, which suggests the money isn’t coming in for the sake of Zcash’s price. Instead, people are genuinely using private transactions, and that flow ends up in NEAR’s cross-chain channel. When I traced this path, I noticed that BTC only rose 1.1% over the same period, with a trading volume of $900 million. Meanwhile, a coin with a market cap of #21 produced $380 million in trading volume—so the ratio is off. So don’t treat this NEAR move as a positive development driven by NEAR itself. It’s more like an outlet where Zcash’s privacy demand is finding a way out. How long that outlet can stay open depends on whether Zcash’s conversion volume can keep up. $NEAR $ZEC
280

·
--
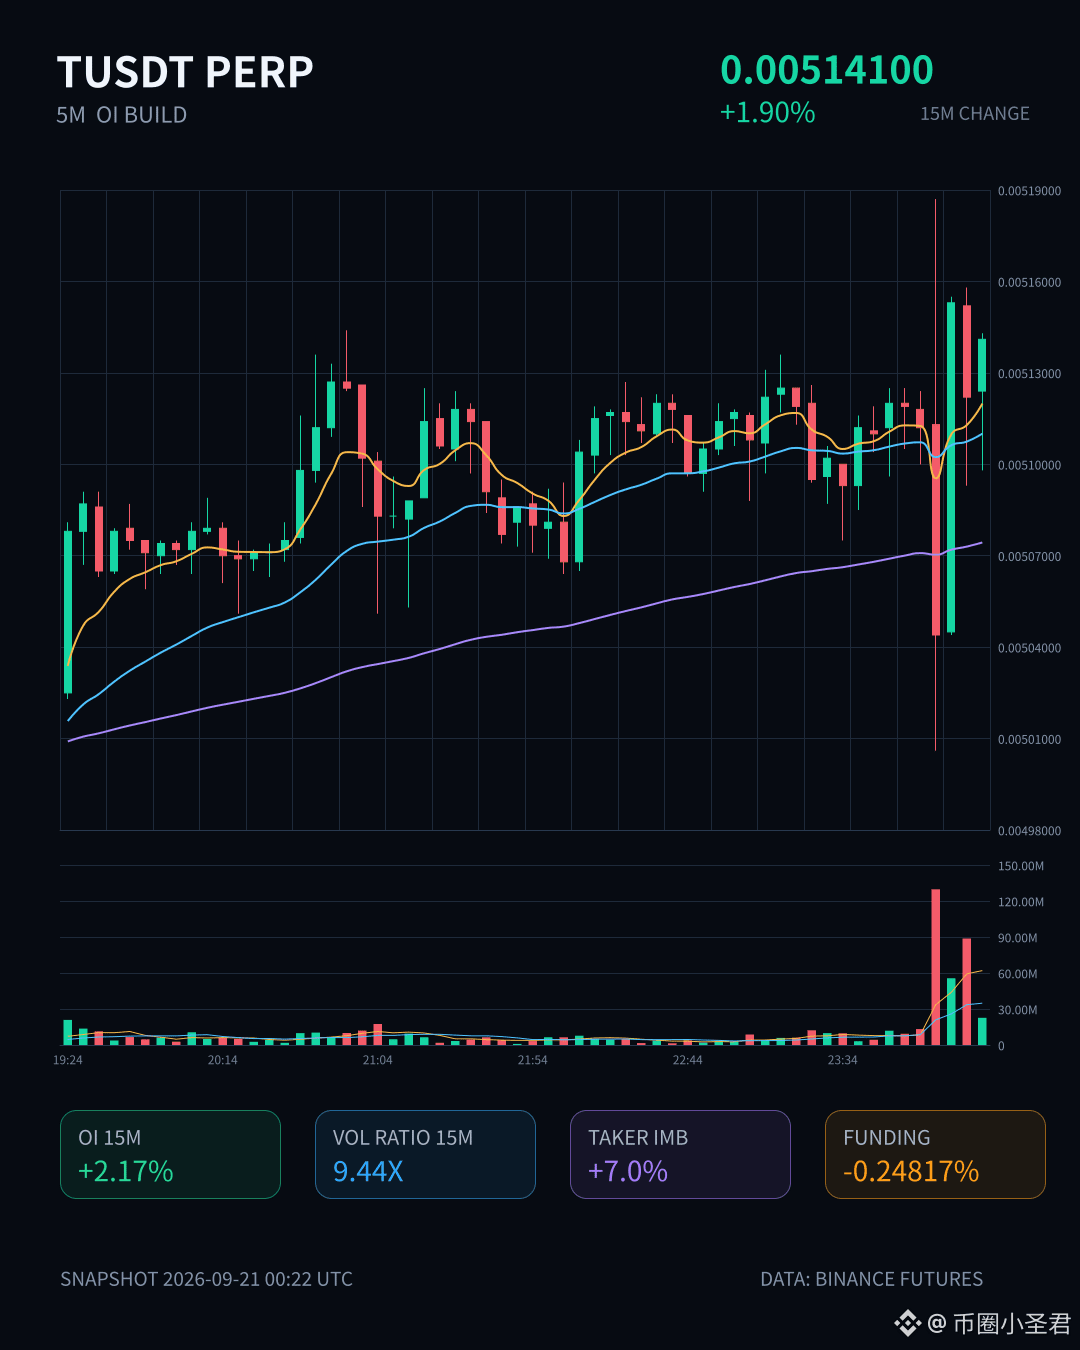
$T This market has some interesting dynamics.
In 15m it surged up 1.9%, with volume jumping straight to 9.44 times—this isn’t slow and steady, it’s real capital pushing in. OI moves in sync: 1h +5%, 15m +2.17%. The percentile is already at 95.8%—it’s starting to lift up from the lower bound of its own historical extreme range.
Most importantly, the structure: price rises + OI rises. This isn’t shorts getting buried; it’s newly added leveraged long positions rushing in. The aggressive buy/sell ratio is 1.15, a 7% difference—slightly buy-leaning, but not out of control. Funding rates are also at a high percentile recently, indicating longs have already started paying.
Several consecutive cycles are continuing—abnormal condition in the whole pool #21—suggesting it’s not just T moving; sideways participants are showing up too.
This kind of structure can easily keep trending for a while, but don’t chase in places where funding gets crowded. A breakout confirmation is a good thing; the key question is who will take over the relay afterward.
$T This market has some interesting dynamics.
In 15m it surged up 1.9%, with volume jumping straight to 9.44 times—this isn’t slow and steady, it’s real capital pushing in. OI moves in sync: 1h +5%, 15m +2.17%. The percentile is already at 95.8%—it’s starting to lift up from the lower bound of its own historical extreme range.
Most importantly, the structure: price rises + OI rises. This isn’t shorts getting buried; it’s newly added leveraged long positions rushing in. The aggressive buy/sell ratio is 1.15, a 7% difference—slightly buy-leaning, but not out of control. Funding rates are also at a high percentile recently, indicating longs have already started paying.
Several consecutive cycles are continuing—abnormal condition in the whole pool #21—suggesting it’s not just T moving; sideways participants are showing up too.
This kind of structure can easily keep trending for a while, but don’t chase in places where funding gets crowded. A breakout confirmation is a good thing; the key question is who will take over the relay afterward.
In 15m it surged up 1.9%, with volume jumping straight to 9.44 times—this isn’t slow and steady, it’s real capital pushing in. OI moves in sync: 1h +5%, 15m +2.17%. The percentile is already at 95.8%—it’s starting to lift up from the lower bound of its own historical extreme range.
Most importantly, the structure: price rises + OI rises. This isn’t shorts getting buried; it’s newly added leveraged long positions rushing in. The aggressive buy/sell ratio is 1.15, a 7% difference—slightly buy-leaning, but not out of control. Funding rates are also at a high percentile recently, indicating longs have already started paying.
Several consecutive cycles are continuing—abnormal condition in the whole pool #21—suggesting it’s not just T moving; sideways participants are showing up too.
This kind of structure can easily keep trending for a while, but don’t chase in places where funding gets crowded. A breakout confirmation is a good thing; the key question is who will take over the relay afterward.
94
·
--
BTC rockets 4.123% to 1.2K – AVAX leads the charge!Uniswap (UNIUSDT) is trending right now!
Rank: #21
🚀 BTC just pumped **4.123%** to **1,223** and is roaring with a **5.452%** surge to **,640**. I’m seeing a strong risk‑on vibe –
#bitcoin #ethereum #crypto
BTC rockets 4.123% to 1.2K – AVAX leads the charge!
33

·
--
$STRK This move has something to it.
On the 15m chart, it rallies 2.15%, with volume directly surging to 2.5x, and the closing price punches through the upper boundary of roughly the last 20 consecutive 5m candles. It’s not the kind of fake feint “needle” insertion.
The key is OI—15m +0.83%, 1h +2.03%, with notional change of 1.11M. Price is rising, positions are rising too, and new leveraged longs are entering the market. This isn’t hard-tucked short covering.
Taker/active trade volume is worse by 15.2%, buy/sell ratio is 1.36, and the funding rate has also pushed up to a high percentile recently.
Across the whole pool, anomalies #23 and notional change #21— not the most eye-catching one, but the depth confirms it’s a pass.
Watch whether it can hold steady at the top of this range. If it can’t, it’s a false breakout. If it can, upside space opens up.
Not investment advice—make your own judgment.
$STRK This move has something to it.
On the 15m chart, it rallies 2.15%, with volume directly surging to 2.5x, and the closing price punches through the upper boundary of roughly the last 20 consecutive 5m candles. It’s not the kind of fake feint “needle” insertion.
The key is OI—15m +0.83%, 1h +2.03%, with notional change of 1.11M. Price is rising, positions are rising too, and new leveraged longs are entering the market. This isn’t hard-tucked short covering.
Taker/active trade volume is worse by 15.2%, buy/sell ratio is 1.36, and the funding rate has also pushed up to a high percentile recently.
Across the whole pool, anomalies #23 and notional change #21— not the most eye-catching one, but the depth confirms it’s a pass.
Watch whether it can hold steady at the top of this range. If it can’t, it’s a false breakout. If it can, upside space opens up.
Not investment advice—make your own judgment.
On the 15m chart, it rallies 2.15%, with volume directly surging to 2.5x, and the closing price punches through the upper boundary of roughly the last 20 consecutive 5m candles. It’s not the kind of fake feint “needle” insertion.
The key is OI—15m +0.83%, 1h +2.03%, with notional change of 1.11M. Price is rising, positions are rising too, and new leveraged longs are entering the market. This isn’t hard-tucked short covering.
Taker/active trade volume is worse by 15.2%, buy/sell ratio is 1.36, and the funding rate has also pushed up to a high percentile recently.
Across the whole pool, anomalies #23 and notional change #21— not the most eye-catching one, but the depth confirms it’s a pass.
Watch whether it can hold steady at the top of this range. If it can’t, it’s a false breakout. If it can, upside space opens up.
Not investment advice—make your own judgment.
10

·
--
UNI SURGES INTO NEW HIGH 🚀📈
The $UNI price ripped through the $9.3928 resistance zone, snapping the $9.4400 24‑hour high and igniting a 33.9% surge on $198.8 M of volume. 📈 CoinGecko’s jump to #21 spotlights a fresh inflow of retail capital, while Uniswap’s total value locked has climbed 12% week‑over‑week, confirming deeper liquidity pool participation. Optimized LP incentives are pulling large‑scale providers back onto core smart‑contract pools, sharpening order‑book depth and fueling the upside bias. The surge also aligns with a broader DeFi rally, reinforcing $UNI’s role as the liquidity backbone.
Momentum remains bullish as the price trades just above the $9.3928 ceiling, with the next hurdle at the $9.80‑$10.10 corridor where cross‑chain yield farms could add fresh pressure. A clean break of the $9.44 pivot would likely trigger algorithmic buying from LP‑rebalancers, pushing $UNI toward a new all‑time high. Institutional allocators are now eyeing the protocol’s fee‑share upgrades, adding another catalyst for upside. Should volume hold above $200 M, the structure suggests a multi‑day rally rather than a fleeting spike. 📊
DYOR
Follow for Updates
#UNI #DEFI #CryptoTrending #BinanceSquare
UNI SURGES INTO NEW HIGH 🚀📈
The $UNI price ripped through the $9.3928 resistance zone, snapping the $9.4400 24‑hour high and igniting a 33.9% surge on $198.8 M of volume. 📈 CoinGecko’s jump to #21 spotlights a fresh inflow of retail capital, while Uniswap’s total value locked has climbed 12% week‑over‑week, confirming deeper liquidity pool participation. Optimized LP incentives are pulling large‑scale providers back onto core smart‑contract pools, sharpening order‑book depth and fueling the upside bias. The surge also aligns with a broader DeFi rally, reinforcing $UNI ’s role as the liquidity backbone.
Momentum remains bullish as the price trades just above the $9.3928 ceiling, with the next hurdle at the $9.80‑$10.10 corridor where cross‑chain yield farms could add fresh pressure. A clean break of the $9.44 pivot would likely trigger algorithmic buying from LP‑rebalancers, pushing $UNI toward a new all‑time high. Institutional allocators are now eyeing the protocol’s fee‑share upgrades, adding another catalyst for upside. Should volume hold above $200 M, the structure suggests a multi‑day rally rather than a fleeting spike. 📊
DYOR
Follow for Updates
#UNI #DEFI #CryptoTrending #BinanceSquare
The $UNI price ripped through the $9.3928 resistance zone, snapping the $9.4400 24‑hour high and igniting a 33.9% surge on $198.8 M of volume. 📈 CoinGecko’s jump to #21 spotlights a fresh inflow of retail capital, while Uniswap’s total value locked has climbed 12% week‑over‑week, confirming deeper liquidity pool participation. Optimized LP incentives are pulling large‑scale providers back onto core smart‑contract pools, sharpening order‑book depth and fueling the upside bias. The surge also aligns with a broader DeFi rally, reinforcing $UNI ’s role as the liquidity backbone.
Momentum remains bullish as the price trades just above the $9.3928 ceiling, with the next hurdle at the $9.80‑$10.10 corridor where cross‑chain yield farms could add fresh pressure. A clean break of the $9.44 pivot would likely trigger algorithmic buying from LP‑rebalancers, pushing $UNI toward a new all‑time high. Institutional allocators are now eyeing the protocol’s fee‑share upgrades, adding another catalyst for upside. Should volume hold above $200 M, the structure suggests a multi‑day rally rather than a fleeting spike. 📊
DYOR
Follow for Updates
#UNI #DEFI #CryptoTrending #BinanceSquare
5
·
--
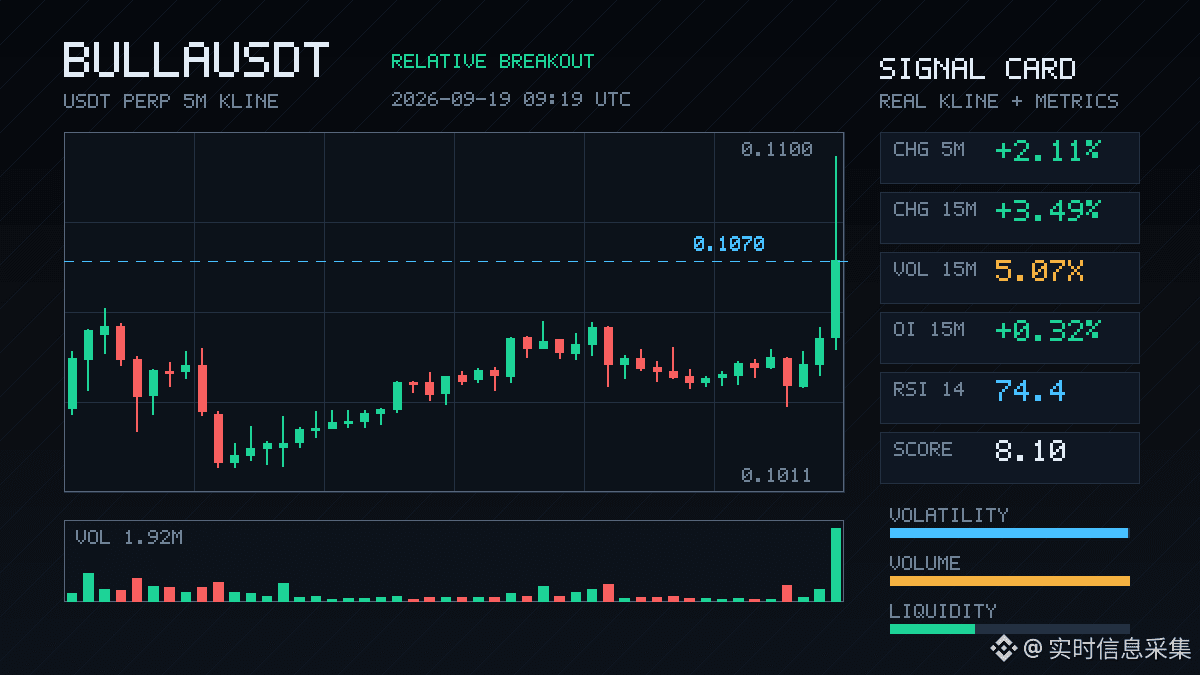
$BULLA This 15-minute move is pretty interesting.
The volume directly hit 5x, the buy/sell ratio is 2.37, and the aggressive execution gap is down 40.7%—plainly put, someone is actively pushing price higher. The price just broke above the upper band of the last ~20 5m candles; the Z value is 3.95—this isn’t just small action.
More importantly, the OI: the 15m contract +0.32%, with notional change of 428K; the 1h timeframe also added 354K. Price is rising and OI is rising with it—this isn’t shorts covering. It’s new leveraged longs entering. OI’s abnormal percentile is 98%, ranked #4 in the whole pool, and notional change is #21.
In the last 24h, the total trading volume is only 11.28M, so the pool isn’t that deep. With volume like this, pushing it up is easy, and dumping it is also quick.
For now, just watch—see whether this 15m candle can hold its ground.
$BULLA This 15-minute move is pretty interesting.
The volume directly hit 5x, the buy/sell ratio is 2.37, and the aggressive execution gap is down 40.7%—plainly put, someone is actively pushing price higher. The price just broke above the upper band of the last ~20 5m candles; the Z value is 3.95—this isn’t just small action.
More importantly, the OI: the 15m contract +0.32%, with notional change of 428K; the 1h timeframe also added 354K. Price is rising and OI is rising with it—this isn’t shorts covering. It’s new leveraged longs entering. OI’s abnormal percentile is 98%, ranked #4 in the whole pool, and notional change is #21.
In the last 24h, the total trading volume is only 11.28M, so the pool isn’t that deep. With volume like this, pushing it up is easy, and dumping it is also quick.
For now, just watch—see whether this 15m candle can hold its ground.
The volume directly hit 5x, the buy/sell ratio is 2.37, and the aggressive execution gap is down 40.7%—plainly put, someone is actively pushing price higher. The price just broke above the upper band of the last ~20 5m candles; the Z value is 3.95—this isn’t just small action.
More importantly, the OI: the 15m contract +0.32%, with notional change of 428K; the 1h timeframe also added 354K. Price is rising and OI is rising with it—this isn’t shorts covering. It’s new leveraged longs entering. OI’s abnormal percentile is 98%, ranked #4 in the whole pool, and notional change is #21.
In the last 24h, the total trading volume is only 11.28M, so the pool isn’t that deep. With volume like this, pushing it up is easy, and dumping it is also quick.
For now, just watch—see whether this 15m candle can hold its ground.
26
·
--
$WLD 15m Just after it was smashed out a bearish 1.07% candle, volume was 1.46x, with a Z-score of 2.02. The close broke below the lower edge of the recent 20-plus 5m K bars. Selling pressure dominated: passive/active difference was -18.7%, and the buy-sell ratio was 0.69. The longs are clearly being pressed down at this level.
Even more interesting is OI: 15m -0.19%, 1h -0.04%, with notional changes of -989K and -1.10M respectively. Price fell while OI dropped—this is a typical deleveraging, stop-loss triggering, or position reduction. It’s not new shorts rushing in to dump; it’s the longs themselves pulling back. The anomaly percentile is 87.1%, anomaly #21 for the whole pool, and notional-change rank #12. Depth confirmation shows it has broken below the lower edge of the recent range.
24h turnover is 300M, so the pool isn’t shallow. Under this kind of structure, I’m not in a hurry to guess the bottom. First, I’ll see whether the long side has fully liquidated after their stop-losses.
$WLD 15m Just after it was smashed out a bearish 1.07% candle, volume was 1.46x, with a Z-score of 2.02. The close broke below the lower edge of the recent 20-plus 5m K bars. Selling pressure dominated: passive/active difference was -18.7%, and the buy-sell ratio was 0.69. The longs are clearly being pressed down at this level.
Even more interesting is OI: 15m -0.19%, 1h -0.04%, with notional changes of -989K and -1.10M respectively. Price fell while OI dropped—this is a typical deleveraging, stop-loss triggering, or position reduction. It’s not new shorts rushing in to dump; it’s the longs themselves pulling back. The anomaly percentile is 87.1%, anomaly #21 for the whole pool, and notional-change rank #12. Depth confirmation shows it has broken below the lower edge of the recent range.
24h turnover is 300M, so the pool isn’t shallow. Under this kind of structure, I’m not in a hurry to guess the bottom. First, I’ll see whether the long side has fully liquidated after their stop-losses.
Even more interesting is OI: 15m -0.19%, 1h -0.04%, with notional changes of -989K and -1.10M respectively. Price fell while OI dropped—this is a typical deleveraging, stop-loss triggering, or position reduction. It’s not new shorts rushing in to dump; it’s the longs themselves pulling back. The anomaly percentile is 87.1%, anomaly #21 for the whole pool, and notional-change rank #12. Depth confirmation shows it has broken below the lower edge of the recent range.
24h turnover is 300M, so the pool isn’t shallow. Under this kind of structure, I’m not in a hurry to guess the bottom. First, I’ll see whether the long side has fully liquidated after their stop-losses.
21
·
--
** NEAR rockets 15.3% to .08 – is this the new alt‑season spark?Uniswap (UNIUSDT) is trending right now!
Rank: #21
** NEAR just **blasted 15.3%** to **.082** in the last 24h, outpacing everything while and sit flat. 🚀 Uni follows, **up 13.3%** at **.653** and DOT is **+5.0%** at **.082**. I think this surge signals fresh risk‑on sentiment in Layer‑1s and DeFi‑centric tokens. If the volume keeps humming (NEAR 21M, UNI 17M), we could
#bitcoin #ethereum #crypto
** NEAR rockets 15.3% to .08 – is this the new alt‑season spark?
Uniswap (UNIUSDT) is trending right now!
Rank: #21
** NEAR just **blasted 15.3%** to **.082** in the last 24h, outpacing everything while and sit flat. 🚀 Uni follows, **up 13.3%** at **.653** and DOT is **+5.0%** at **.082**. I think this surge signals fresh risk‑on sentiment in Layer‑1s and DeFi‑centric tokens. If the volume keeps humming (NEAR 21M, UNI 17M), we could
#bitcoin #ethereum #crypto
Rank: #21
** NEAR just **blasted 15.3%** to **.082** in the last 24h, outpacing everything while and sit flat. 🚀 Uni follows, **up 13.3%** at **.653** and DOT is **+5.0%** at **.082**. I think this surge signals fresh risk‑on sentiment in Layer‑1s and DeFi‑centric tokens. If the volume keeps humming (NEAR 21M, UNI 17M), we could
#bitcoin #ethereum #crypto
66

·
--
🦞 RITIAN paper signal #21 · BTC/USDT
📊 Direction: BUY (trend following · long breakout)
💰 Entry price: $80,841.60
🛑 Stop loss: $80,281.82 (1.0×ATR)
🎯 Take profit 1: $81,681.27 (RR 1.5)
🎯 Take profit 2: $82,241.05 (RR 2.5)
📦 Position: 0.3573 BTC (risk $200)
🔬 Technicals:
• 1H MACD histogram +344.62 (prior value +301.97) momentum acceleration
• 4H MACD histogram +435.38 (prior value +237.01) 4-hour level golden cross confirmation
• Price breaks above all moving averages: MA7>MA25>MA99
• 4H recovers MA99 78,106 — bullish structure intact
• Volume ratio 1.76 — breakout on increased volume, high capital recognition
• Funding rate 6.68% APR, long/short ratio 1.03 — balanced, not crowded
⚠️ Risk warning:
• RSI6 1H 91.4 / 4H 92.7 — extremely overbought on both timeframes
• High pullback risk; keep stop loss tight at 1.0×ATR
• Suggest taking partial profits at TP1 to reduce position risk
🔒 PAPER mode · RITIAN_LIVE=0 · Paper trading does not involve real funds
digest: 21a513ab
$BTC #信号 #Blue Gum vs Letting Go Bird
🦞 RITIAN paper signal #21 · BTC/USDT
📊 Direction: BUY (trend following · long breakout)
💰 Entry price: $80,841.60
🛑 Stop loss: $80,281.82 (1.0×ATR)
🎯 Take profit 1: $81,681.27 (RR 1.5)
🎯 Take profit 2: $82,241.05 (RR 2.5)
📦 Position: 0.3573 BTC (risk $200)
🔬 Technicals:
• 1H MACD histogram +344.62 (prior value +301.97) momentum acceleration
• 4H MACD histogram +435.38 (prior value +237.01) 4-hour level golden cross confirmation
• Price breaks above all moving averages: MA7>MA25>MA99
• 4H recovers MA99 78,106 — bullish structure intact
• Volume ratio 1.76 — breakout on increased volume, high capital recognition
• Funding rate 6.68% APR, long/short ratio 1.03 — balanced, not crowded
⚠️ Risk warning:
• RSI6 1H 91.4 / 4H 92.7 — extremely overbought on both timeframes
• High pullback risk; keep stop loss tight at 1.0×ATR
• Suggest taking partial profits at TP1 to reduce position risk
🔒 PAPER mode · RITIAN_LIVE=0 · Paper trading does not involve real funds
digest: 21a513ab
$BTC #信号 #Blue Gum vs Letting Go Bird
📊 Direction: BUY (trend following · long breakout)
💰 Entry price: $80,841.60
🛑 Stop loss: $80,281.82 (1.0×ATR)
🎯 Take profit 1: $81,681.27 (RR 1.5)
🎯 Take profit 2: $82,241.05 (RR 2.5)
📦 Position: 0.3573 BTC (risk $200)
🔬 Technicals:
• 1H MACD histogram +344.62 (prior value +301.97) momentum acceleration
• 4H MACD histogram +435.38 (prior value +237.01) 4-hour level golden cross confirmation
• Price breaks above all moving averages: MA7>MA25>MA99
• 4H recovers MA99 78,106 — bullish structure intact
• Volume ratio 1.76 — breakout on increased volume, high capital recognition
• Funding rate 6.68% APR, long/short ratio 1.03 — balanced, not crowded
⚠️ Risk warning:
• RSI6 1H 91.4 / 4H 92.7 — extremely overbought on both timeframes
• High pullback risk; keep stop loss tight at 1.0×ATR
• Suggest taking partial profits at TP1 to reduce position risk
🔒 PAPER mode · RITIAN_LIVE=0 · Paper trading does not involve real funds
digest: 21a513ab
$BTC #信号 #Blue Gum vs Letting Go Bird
180
·
--
$DOGE This move is kind of interesting.
On the 15m chart it jumped 1.2%, and the volume went straight up to 3.71x. The Z value is 3.06—this isn’t some fake action with dead, sluggish ripples. Price broke above the upper band of nearly 20 consecutive 5m candles. The buy/sell ratio is 1.29, with active buy orders leaning toward 12.8%. Depth confirmation is solid enough.
But what really made me look twice is the OI: 15m -0.42%, 1h -0.89%. Price is rising while positions are shrinking. This isn’t new longs piling in—it’s shorts being squeezed out, or old positions being covered. The OI abnormal percentile is 96%. Across the whole pool, abnormal #21 and nominal change #10. Multiple consecutive cycles are continuing, and the funding rate is still in a high percentile recently.
To translate it plainly: the leveraged side is already a bit squeezed; the fuel is short covering stop-loss orders, not incremental new capital.
This kind of upside structure usually comes fast and decisive, but it’s also fragile. Once the short covering pushes are done, if there’s no new wave of longs to take over, the price will quickly lose momentum. 24h turnover is 443M—depth looks fine—but you have to keep a close eye on the direction.
DOGE never lacks for drama—what it lacks is follow-through. First, let’s see whether it can hold the breakout level. If it can’t, then it’ll be another pulse driven by buy-back/covering.
$DOGE This move is kind of interesting.
On the 15m chart it jumped 1.2%, and the volume went straight up to 3.71x. The Z value is 3.06—this isn’t some fake action with dead, sluggish ripples. Price broke above the upper band of nearly 20 consecutive 5m candles. The buy/sell ratio is 1.29, with active buy orders leaning toward 12.8%. Depth confirmation is solid enough.
But what really made me look twice is the OI: 15m -0.42%, 1h -0.89%. Price is rising while positions are shrinking. This isn’t new longs piling in—it’s shorts being squeezed out, or old positions being covered. The OI abnormal percentile is 96%. Across the whole pool, abnormal #21 and nominal change #10. Multiple consecutive cycles are continuing, and the funding rate is still in a high percentile recently.
To translate it plainly: the leveraged side is already a bit squeezed; the fuel is short covering stop-loss orders, not incremental new capital.
This kind of upside structure usually comes fast and decisive, but it’s also fragile. Once the short covering pushes are done, if there’s no new wave of longs to take over, the price will quickly lose momentum. 24h turnover is 443M—depth looks fine—but you have to keep a close eye on the direction.
DOGE never lacks for drama—what it lacks is follow-through. First, let’s see whether it can hold the breakout level. If it can’t, then it’ll be another pulse driven by buy-back/covering.
On the 15m chart it jumped 1.2%, and the volume went straight up to 3.71x. The Z value is 3.06—this isn’t some fake action with dead, sluggish ripples. Price broke above the upper band of nearly 20 consecutive 5m candles. The buy/sell ratio is 1.29, with active buy orders leaning toward 12.8%. Depth confirmation is solid enough.
But what really made me look twice is the OI: 15m -0.42%, 1h -0.89%. Price is rising while positions are shrinking. This isn’t new longs piling in—it’s shorts being squeezed out, or old positions being covered. The OI abnormal percentile is 96%. Across the whole pool, abnormal #21 and nominal change #10. Multiple consecutive cycles are continuing, and the funding rate is still in a high percentile recently.
To translate it plainly: the leveraged side is already a bit squeezed; the fuel is short covering stop-loss orders, not incremental new capital.
This kind of upside structure usually comes fast and decisive, but it’s also fragile. Once the short covering pushes are done, if there’s no new wave of longs to take over, the price will quickly lose momentum. 24h turnover is 443M—depth looks fine—but you have to keep a close eye on the direction.
DOGE never lacks for drama—what it lacks is follow-through. First, let’s see whether it can hold the breakout level. If it can’t, then it’ll be another pulse driven by buy-back/covering.
178
·
--
“UNI Rally of %26.5%: Why This Storm Could Get Even Worse?”Uniswap (UNIUSDT) is trending right now!
Rank: #21
The most striking number I saw today on Binance Square: UNIUSDT saw a **%26.5%** increase and climbed to **.66**, shaking the market with a trading volume of **217 M$**. It looks like a “pump,” but I interpret this rise as a **signal of a breakout from a bottom**. At the same time, **NEARUSDT** is up **%25.26%** and entered the **.595** level, coming in right behind with a trading volume of **350 M$**. These two “altcoins” aren’t just a “buzz”—they show that a **Layer‑2 and DeFi** infrastructure is coming back to life. **Data Analysis** - UNI’s **.814** price increase over the past 24 hours, reaching **.660** when the previous close was **.846**, gives a signal of **high liquidity** within volatility. - NEAR jumped from **.870** to **.595** on an increase of **/bin/sh.725**; while the price range is squeezed between **.804 – .615**, it still carries **25%** momentum. - DOT, meanwhile, has a more modest **%9.73** rise and sits at **.139**, but trading volume is **17.3 M* and token changes of 1.7 M**, indicating renewed interest in the Polkadot ecosystem. **Learning Corner** – “DCA vs. Ape‑In” In moves like these quick spikes, **DCA (Dollar Cost Averaging)** is generally a less risky strategy. However, for traders like me who “ape‑in,” it makes sense to set **stop‑loss** levels against the risk of a short‑term “pump‑and‑dump” at **.30** (UNI) and **.45** (NEAR). Since volatility is high, adjusting re‑entry points at mild pullbacks like **.20** and **.30** is a smart move. **Alph
“UNI Rally of %26.5%: Why This Storm Could Get Even Worse?”
Uniswap (UNIUSDT) is trending right now!
Rank: #21
The most striking number I saw today on Binance Square: UNIUSDT saw a **%26.5%** increase and climbed to **.66**, shaking the market with a trading volume of **217 M$**. It looks like a “pump,” but I interpret this rise as a **signal of a breakout from a bottom**. At the same time, **NEARUSDT** is up **%25.26%** and entered the **.595** level, coming in right behind with a trading volume of **350 M$**. These two “altcoins” aren’t just a “buzz”—they show that a **Layer‑2 and DeFi** infrastructure is coming back to life. **Data Analysis** - UNI’s **.814** price increase over the past 24 hours, reaching **.660** when the previous close was **.846**, gives a signal of **high liquidity** within volatility. - NEAR jumped from **.870** to **.595** on an increase of **/bin/sh.725**; while the price range is squeezed between **.804 – .615**, it still carries **25%** momentum. - DOT, meanwhile, has a more modest **%9.73** rise and sits at **.139**, but trading volume is **17.3 M* and token changes of 1.7 M**, indicating renewed interest in the Polkadot ecosystem. **Learning Corner** – “DCA vs. Ape‑In” In moves like these quick spikes, **DCA (Dollar Cost Averaging)** is generally a less risky strategy. However, for traders like me who “ape‑in,” it makes sense to set **stop‑loss** levels against the risk of a short‑term “pump‑and‑dump” at **.30** (UNI) and **.45** (NEAR). Since volatility is high, adjusting re‑entry points at mild pullbacks like **.20** and **.30** is a smart move. **Alph
Rank: #21
The most striking number I saw today on Binance Square: UNIUSDT saw a **%26.5%** increase and climbed to **.66**, shaking the market with a trading volume of **217 M$**. It looks like a “pump,” but I interpret this rise as a **signal of a breakout from a bottom**. At the same time, **NEARUSDT** is up **%25.26%** and entered the **.595** level, coming in right behind with a trading volume of **350 M$**. These two “altcoins” aren’t just a “buzz”—they show that a **Layer‑2 and DeFi** infrastructure is coming back to life. **Data Analysis** - UNI’s **.814** price increase over the past 24 hours, reaching **.660** when the previous close was **.846**, gives a signal of **high liquidity** within volatility. - NEAR jumped from **.870** to **.595** on an increase of **/bin/sh.725**; while the price range is squeezed between **.804 – .615**, it still carries **25%** momentum. - DOT, meanwhile, has a more modest **%9.73** rise and sits at **.139**, but trading volume is **17.3 M* and token changes of 1.7 M**, indicating renewed interest in the Polkadot ecosystem. **Learning Corner** – “DCA vs. Ape‑In” In moves like these quick spikes, **DCA (Dollar Cost Averaging)** is generally a less risky strategy. However, for traders like me who “ape‑in,” it makes sense to set **stop‑loss** levels against the risk of a short‑term “pump‑and‑dump” at **.30** (UNI) and **.45** (NEAR). Since volatility is high, adjusting re‑entry points at mild pullbacks like **.20** and **.30** is a smart move. **Alph
62
·
--
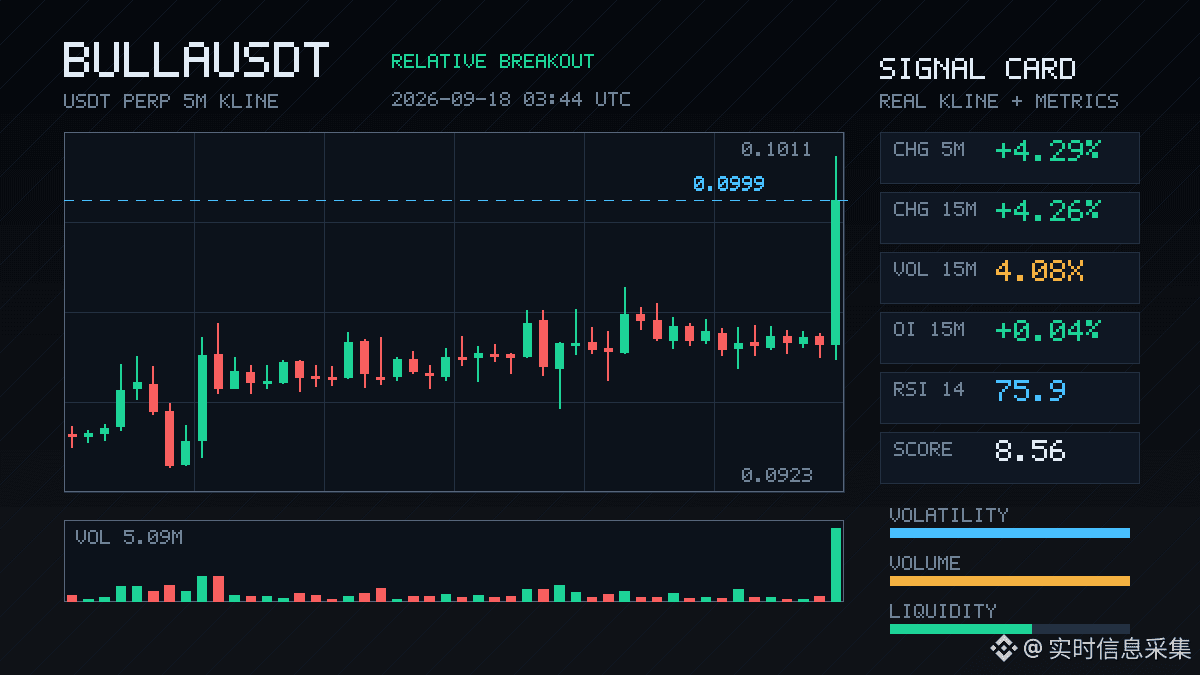
$BULLA This wave is kind of interesting.
In 15m, it directly jumped up 4.26%. The volume hit more than 4x the average, and the K-line closed outside the upper edge of the most recent ~20 5m-bar range. The aggressive buy side made up the gap by 24.8%, and the buy/sell ratio was 1.66—not a fake breakout propped up by resting orders. This is real demand sweeping.
OI is also rising in sync: 1h +0.06%. The nominal longs increased by 428k U, with an abnormal percentile of 80.4%. Price is up and so is open interest—an unmistakable leveraged long entry structure. Not the kind of “fake” where shorts are just getting squeezed.
In 24h, turnover is over 59 million. Liquidity/depth currently looks fine. In the whole pool, the nominal change ranks at #21, and the heat is still climbing.
What I care about most is that it moved at 11:44. Liquidity during the Asian midday session is usually mediocre. Pulling it up at this time either means it had been building for a long time—or someone didn’t want to wait.
Next, see whether it can hold above the upper edge of the range. If it can’t, then it’s just a single wick/pin.
$BULLA This wave is kind of interesting.
In 15m, it directly jumped up 4.26%. The volume hit more than 4x the average, and the K-line closed outside the upper edge of the most recent ~20 5m-bar range. The aggressive buy side made up the gap by 24.8%, and the buy/sell ratio was 1.66—not a fake breakout propped up by resting orders. This is real demand sweeping.
OI is also rising in sync: 1h +0.06%. The nominal longs increased by 428k U, with an abnormal percentile of 80.4%. Price is up and so is open interest—an unmistakable leveraged long entry structure. Not the kind of “fake” where shorts are just getting squeezed.
In 24h, turnover is over 59 million. Liquidity/depth currently looks fine. In the whole pool, the nominal change ranks at #21, and the heat is still climbing.
What I care about most is that it moved at 11:44. Liquidity during the Asian midday session is usually mediocre. Pulling it up at this time either means it had been building for a long time—or someone didn’t want to wait.
Next, see whether it can hold above the upper edge of the range. If it can’t, then it’s just a single wick/pin.
In 15m, it directly jumped up 4.26%. The volume hit more than 4x the average, and the K-line closed outside the upper edge of the most recent ~20 5m-bar range. The aggressive buy side made up the gap by 24.8%, and the buy/sell ratio was 1.66—not a fake breakout propped up by resting orders. This is real demand sweeping.
OI is also rising in sync: 1h +0.06%. The nominal longs increased by 428k U, with an abnormal percentile of 80.4%. Price is up and so is open interest—an unmistakable leveraged long entry structure. Not the kind of “fake” where shorts are just getting squeezed.
In 24h, turnover is over 59 million. Liquidity/depth currently looks fine. In the whole pool, the nominal change ranks at #21, and the heat is still climbing.
What I care about most is that it moved at 11:44. Liquidity during the Asian midday session is usually mediocre. Pulling it up at this time either means it had been building for a long time—or someone didn’t want to wait.
Next, see whether it can hold above the upper edge of the range. If it can’t, then it’s just a single wick/pin.
4
·
--
ZEC this drop isn't that severe—15m is only -0.90%. But the OI falling is pretty striking: 1h contracts are -0.38%, and the notional directly lost 21.79M USDT. The overall notional change for the whole pool ranks #3.
Aggressive trade underperformance is -22.5%, the buy/sell ratio is 0.63, and a 5m liquidation proxy of 251K is concentrated on the sell side. It doesn't look like a panic dump—more like the longs withdrew themselves first.
The funding rate is still in the higher percentile recently, while the price is clinging to the lower edge of the range. This combination usually means leveraged longs are slowly pulling back. Not a collapse—deleveraging.
OI abnormal percentile is 81.7%, with the whole pool at #21. At this point it’s either going to keep grinding or wait for a directional breakout. Chasing shorts now has mediocre cost-effectiveness—wait until the long’s positioning gets washed a bit.
ZEC this drop isn't that severe—15m is only -0.90%. But the OI falling is pretty striking: 1h contracts are -0.38%, and the notional directly lost 21.79M USDT. The overall notional change for the whole pool ranks #3.
Aggressive trade underperformance is -22.5%, the buy/sell ratio is 0.63, and a 5m liquidation proxy of 251K is concentrated on the sell side. It doesn't look like a panic dump—more like the longs withdrew themselves first.
The funding rate is still in the higher percentile recently, while the price is clinging to the lower edge of the range. This combination usually means leveraged longs are slowly pulling back. Not a collapse—deleveraging.
OI abnormal percentile is 81.7%, with the whole pool at #21. At this point it’s either going to keep grinding or wait for a directional breakout. Chasing shorts now has mediocre cost-effectiveness—wait until the long’s positioning gets washed a bit.
Aggressive trade underperformance is -22.5%, the buy/sell ratio is 0.63, and a 5m liquidation proxy of 251K is concentrated on the sell side. It doesn't look like a panic dump—more like the longs withdrew themselves first.
The funding rate is still in the higher percentile recently, while the price is clinging to the lower edge of the range. This combination usually means leveraged longs are slowly pulling back. Not a collapse—deleveraging.
OI abnormal percentile is 81.7%, with the whole pool at #21. At this point it’s either going to keep grinding or wait for a directional breakout. Chasing shorts now has mediocre cost-effectiveness—wait until the long’s positioning gets washed a bit.
1
160
·
--
$GRIFFAIN Early this morning, there was a bit of action—over the last 15m, it surged 1.7%. The volume shot straight up to 4.2× the normal level. The buy/sell ratio is 4.22, and the difference in aggressive trades is -61.7%—an overwhelmingly one-sided bid.
The key isn’t how much it pumped, but that the OI is rising along with it. 15m: +0.35%, 1h: +0.2%. The nominal increment isn’t large (85K / 66K), but the abnormal percentile is 90.3%. The entire pool ranks #21. This kind of deep confirmation is more worth watching in the structure where new leveraged longs are entering.
The closing price has already broken above the upper edge of the last ~20 5m range candles. In the past 24h, the turnover is 9.79M, with the pool showing an unusually high level. The 3:30 a.m. setup—either someone knew something in advance, or it’s a single wick to lure traders before the move. Look closely and act only after you’ve got clarity.
$GRIFFAIN Early this morning, there was a bit of action—over the last 15m, it surged 1.7%. The volume shot straight up to 4.2× the normal level. The buy/sell ratio is 4.22, and the difference in aggressive trades is -61.7%—an overwhelmingly one-sided bid.
The key isn’t how much it pumped, but that the OI is rising along with it. 15m: +0.35%, 1h: +0.2%. The nominal increment isn’t large (85K / 66K), but the abnormal percentile is 90.3%. The entire pool ranks #21. This kind of deep confirmation is more worth watching in the structure where new leveraged longs are entering.
The closing price has already broken above the upper edge of the last ~20 5m range candles. In the past 24h, the turnover is 9.79M, with the pool showing an unusually high level. The 3:30 a.m. setup—either someone knew something in advance, or it’s a single wick to lure traders before the move. Look closely and act only after you’ve got clarity.
The key isn’t how much it pumped, but that the OI is rising along with it. 15m: +0.35%, 1h: +0.2%. The nominal increment isn’t large (85K / 66K), but the abnormal percentile is 90.3%. The entire pool ranks #21. This kind of deep confirmation is more worth watching in the structure where new leveraged longs are entering.
The closing price has already broken above the upper edge of the last ~20 5m range candles. In the past 24h, the turnover is 9.79M, with the pool showing an unusually high level. The 3:30 a.m. setup—either someone knew something in advance, or it’s a single wick to lure traders before the move. Look closely and act only after you’ve got clarity.
1
Log in to explore more content
Join global crypto users on Binance Square
⚡️ Get latest and useful information about crypto.
💬 Trusted by the world’s largest crypto exchange.
👍 Discover real insights from verified creators.
Email / Phone number
Trending Topics
1
#AIStocksWhatNext
1.1M views
7,221 Discussing
2
#SpotBitcoinETFsInflow$2.31BInFourDays
10 views
3 Discussing
3
#BitcoinRejectedAt$87,300Twice
0 views
0 Discussing
4
#BCHJumps28%OnCMEFuturesListing
31,946 views
762 Discussing
5
#WallStreetEarningsRevisionsTurnBearish
22,955 views
559 Discussing
6
#DollarIndexReclaims101
19,157 views
491 Discussing
7
#21SharesLaunchesEuropesFirstZcashETP
61,242 views
1,255 Discussing
8
#CardanoJoinsX402PaymentStandard
37,448 views
888 Discussing
9
#BitcoinTops$87KAtEightMonthHigh
15,371 views
136 Discussing
10
#ZECBreaksAbove$1600AtRecordHigh
10,934 views
112 Discussing