
#15
15
38,314 views
411 Discussing
Hot
Latest

·
--
Cryptocurrency mining company American Bitcoin Corp (known on the Nasdaq exchange under the ticker ABTC) officially announced the execution of a reverse stock split (Reverse Stock Split) at a ratio of 1 for 15. Share reduction: This split will reduce the company’s issued shares from approximately 1.09 billion shares to about 73 million shares (specifically, a 93.3% reduction). This means the consolidation of shares: every 15 old shares that an investor holds in their portfolio will be automatically consolidated into one corresponding share, and the stock will immediately increase by #15 x to offset the decline. This will take effect officially after the stock market closes on July 2, and trading in the shares will begin on July 6, 2026.
Cryptocurrency mining company American Bitcoin Corp (known on the Nasdaq exchange under the ticker ABTC) officially announced the execution of a reverse stock split (Reverse Stock Split) at a ratio of 1 for 15. Share reduction: This split will reduce the company’s issued shares from approximately 1.09 billion shares to about 73 million shares (specifically, a 93.3% reduction). This means the consolidation of shares: every 15 old shares that an investor holds in their portfolio will be automatically consolidated into one corresponding share, and the stock will immediately increase by #15 x to offset the decline. This will take effect officially after the stock market closes on July 2, and trading in the shares will begin on July 6, 2026.

ABTCUS+2.45%
129

·
--
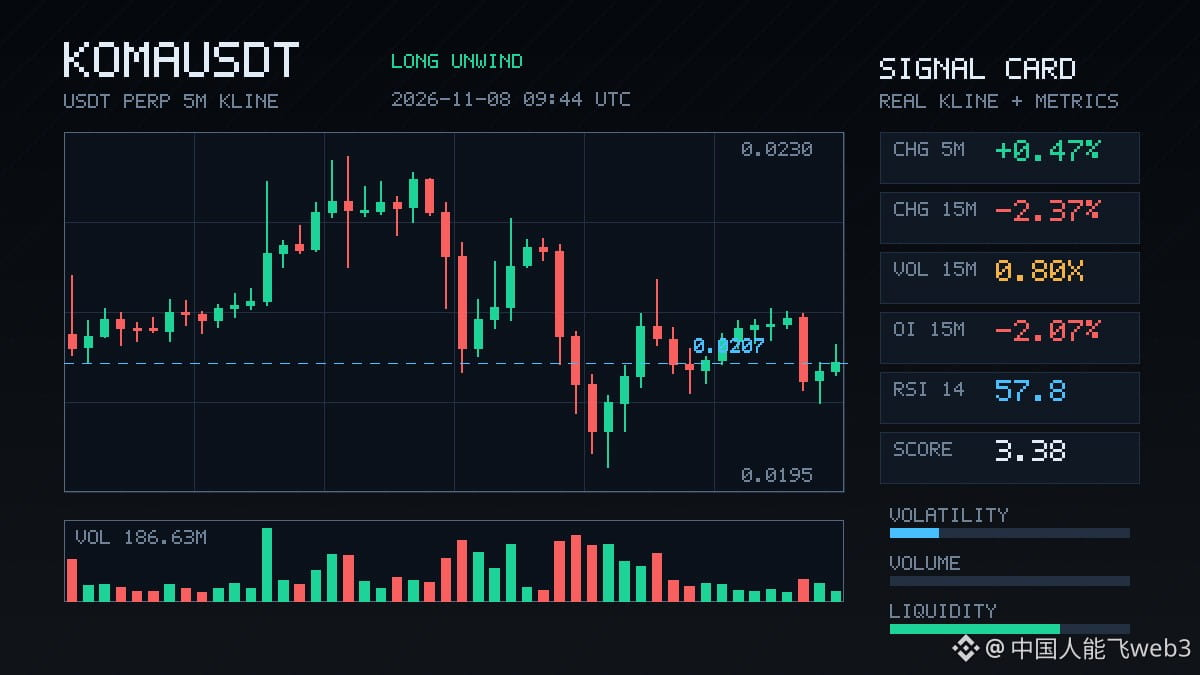
This decline at $KOMA is a little different from previous ones. The price fell 2.37%, but OI declined on both the 15m and 1h timeframes, by 2.07% and 1.31%, respectively. The combined notional change represents a decrease of more than 1 million USDT. This looks more like longs actively deleveraging and exiting via stop-losses, rather than new shorts entering and driving the price down. The aggressive trade delta is -8.2%, and the buy/sell ratio is 0.85, so selling pressure is definitely present. But volume is only 0.80x, suggesting there hasn't been a major wave of panic selling. The OI anomaly percentile has reached 94.2%, ranking #15 across the entire pool, and has remained in the extreme zone for several consecutive timeframes. This kind of contraction in positions often means sentiment is being flushed out. 24h trading volume is still 132M, so liquidity isn't bad. Let's see when this round of deleveraging stabilizes.
This decline at $KOMA is a little different from previous ones. The price fell 2.37%, but OI declined on both the 15m and 1h timeframes, by 2.07% and 1.31%, respectively. The combined notional change represents a decrease of more than 1 million USDT. This looks more like longs actively deleveraging and exiting via stop-losses, rather than new shorts entering and driving the price down. The aggressive trade delta is -8.2%, and the buy/sell ratio is 0.85, so selling pressure is definitely present. But volume is only 0.80x, suggesting there hasn't been a major wave of panic selling. The OI anomaly percentile has reached 94.2%, ranking #15 across the entire pool, and has remained in the extreme zone for several consecutive timeframes. This kind of contraction in positions often means sentiment is being flushed out. 24h trading volume is still 132M, so liquidity isn't bad. Let's see when this round of deleveraging stabilizes.
1

·
--
$XPL ’s drop is pretty interesting—the price is falling while OI is rising, strongly suggesting new leveraged shorts are entering. 15m volume surged to 3.89x, taker volume delta was -34.9%, and the buy/sell ratio was 0.48, clearly pointing to selling pressure. The close also broke below the lows of the last 20 or so 5m candles, so structurally, it has broken out of the recent range. The OI anomaly percentile is 88.1%, ranking #15 across the entire pool, and it has persisted for several consecutive periods rather than being a fleeting blip. 24h trading volume is only a little over 13M, so liquidity is thin. This volume spike is worth watching to see whether it triggers any knock-on effects.
$XPL ’s drop is pretty interesting—the price is falling while OI is rising, strongly suggesting new leveraged shorts are entering. 15m volume surged to 3.89x, taker volume delta was -34.9%, and the buy/sell ratio was 0.48, clearly pointing to selling pressure. The close also broke below the lows of the last 20 or so 5m candles, so structurally, it has broken out of the recent range. The OI anomaly percentile is 88.1%, ranking #15 across the entire pool, and it has persisted for several consecutive periods rather than being a fleeting blip. 24h trading volume is only a little over 13M, so liquidity is thin. This volume spike is worth watching to see whether it triggers any knock-on effects.
7
·
--
$JCT This move: the 15m price broke below the lower edge of the past 20 5m ranges, volume rose to 1.9x, and the buy/sell ratio was 0.59—aggressive selling pressure is very real.
But look at OI: -0.07% over 15m, -0.26% over 1h, with notional shrinking by just over $370K. Price fell and open interest declined, so this isn't new shorts entering to drive the sell-off. It looks more like longs couldn't hold on and are deleveraging, with stop-losses being swept.
It ranked #38 for anomalies across the entire pool and #15 for notional change, which shows the move wasn't small. But structurally, this is position reduction rather than shorts adding to their positions. Sometimes this kind of drop actually clears things out—after shaking out weak hands, let's see whether price can stabilize near the lower edge of the range.
$JCT This move: the 15m price broke below the lower edge of the past 20 5m ranges, volume rose to 1.9x, and the buy/sell ratio was 0.59—aggressive selling pressure is very real.
But look at OI: -0.07% over 15m, -0.26% over 1h, with notional shrinking by just over $370K. Price fell and open interest declined, so this isn't new shorts entering to drive the sell-off. It looks more like longs couldn't hold on and are deleveraging, with stop-losses being swept.
It ranked #38 for anomalies across the entire pool and #15 for notional change, which shows the move wasn't small. But structurally, this is position reduction rather than shorts adding to their positions. Sometimes this kind of drop actually clears things out—after shaking out weak hands, let's see whether price can stabilize near the lower edge of the range.
But look at OI: -0.07% over 15m, -0.26% over 1h, with notional shrinking by just over $370K. Price fell and open interest declined, so this isn't new shorts entering to drive the sell-off. It looks more like longs couldn't hold on and are deleveraging, with stop-losses being swept.
It ranked #38 for anomalies across the entire pool and #15 for notional change, which shows the move wasn't small. But structurally, this is position reduction rather than shorts adding to their positions. Sometimes this kind of drop actually clears things out—after shaking out weak hands, let's see whether price can stabilize near the lower edge of the range.
1

·
--
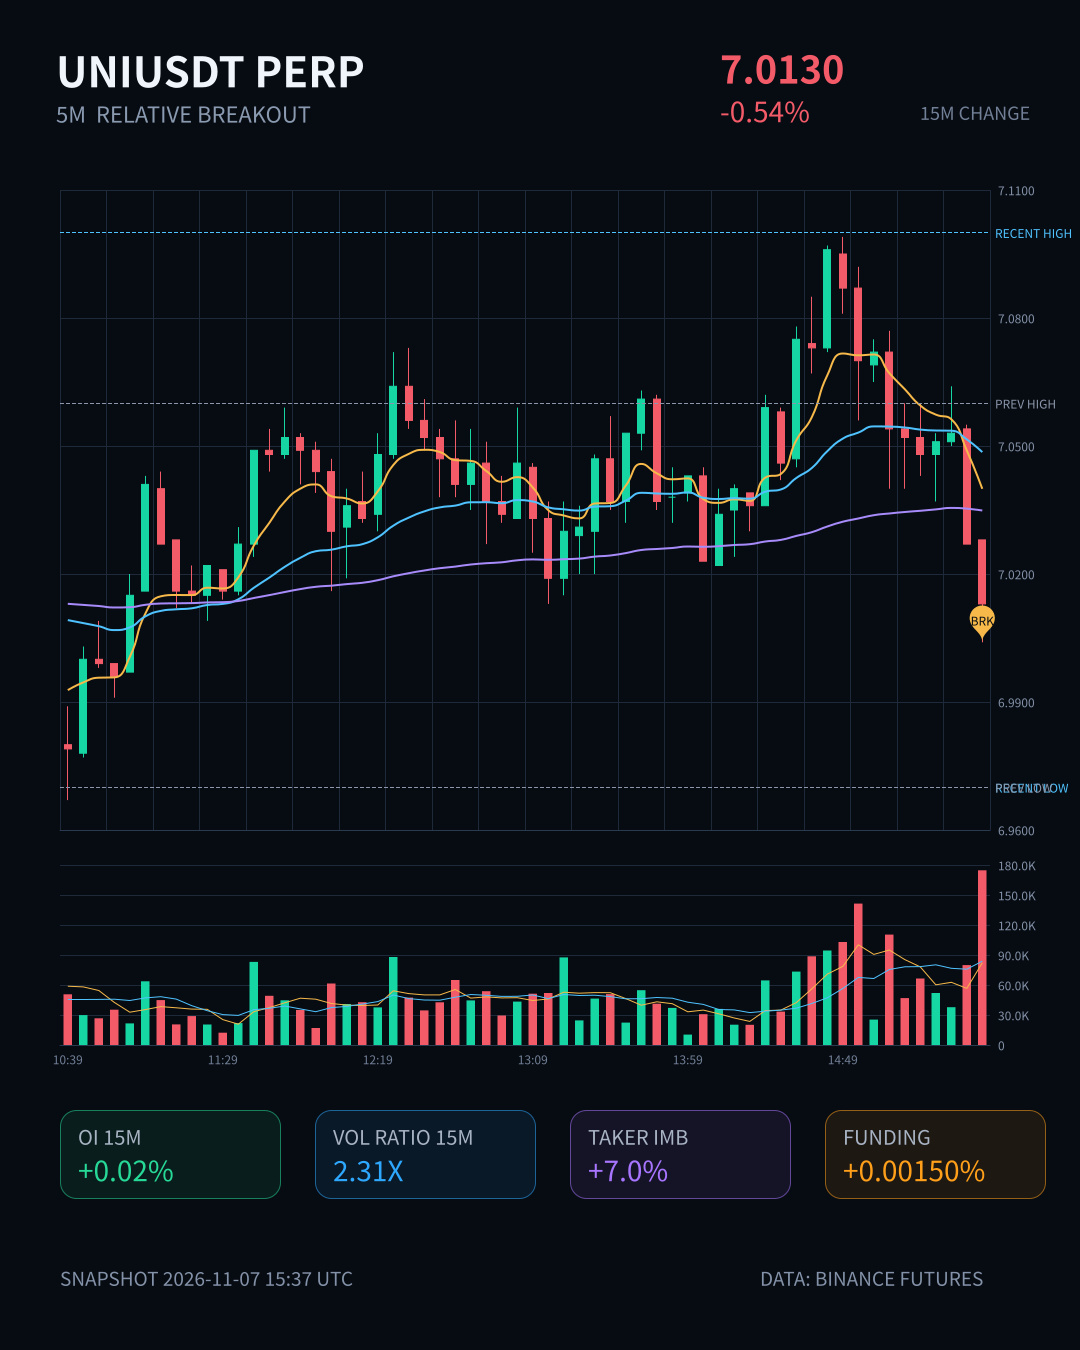
$UNI This 15m move is pretty interesting—the price is down just 0.54%, which doesn’t look like much, but volume jumped straight to 2.31x, and the close also fell below the lower bound of the last nearly 20 5m candles’ range.
OI hasn’t shrunk noticeably. Combined with the price decline, this looks more like new shorts entering with leverage than longs collectively throwing in the towel. The anomaly percentile is 81%; it ranks #15 across the whole pool and #6 for notional change, so liquidity is definitely clustering around this level.
The aggressive trade imbalance is 7%, and the buy/sell ratio is 1.15, so bulls haven’t completely given up either. The key is whether price can reclaim the range low after breaking below it. With $105M in daily trading volume behind it, any decisive move won’t be subtle.
For now, keep an eye on the lower bound of this 5m range.
$UNI This 15m move is pretty interesting—the price is down just 0.54%, which doesn’t look like much, but volume jumped straight to 2.31x, and the close also fell below the lower bound of the last nearly 20 5m candles’ range.
OI hasn’t shrunk noticeably. Combined with the price decline, this looks more like new shorts entering with leverage than longs collectively throwing in the towel. The anomaly percentile is 81%; it ranks #15 across the whole pool and #6 for notional change, so liquidity is definitely clustering around this level.
The aggressive trade imbalance is 7%, and the buy/sell ratio is 1.15, so bulls haven’t completely given up either. The key is whether price can reclaim the range low after breaking below it. With $105M in daily trading volume behind it, any decisive move won’t be subtle.
For now, keep an eye on the lower bound of this 5m range.
OI hasn’t shrunk noticeably. Combined with the price decline, this looks more like new shorts entering with leverage than longs collectively throwing in the towel. The anomaly percentile is 81%; it ranks #15 across the whole pool and #6 for notional change, so liquidity is definitely clustering around this level.
The aggressive trade imbalance is 7%, and the buy/sell ratio is 1.15, so bulls haven’t completely given up either. The key is whether price can reclaim the range low after breaking below it. With $105M in daily trading volume behind it, any decisive move won’t be subtle.
For now, keep an eye on the lower bound of this 5m range.
50

·
--
The Japanese, U.S., Indian, and Australian “Malabar” exercise—submariners better be on their toes!
Word is that Japan, the U.S., India, and Australia are holding a major “Malabar” exercise in Yokosuka, Kanagawa. With anti-submarine warfare and surface-ship operations underway, submariners had better watch out—this is no joke! #MalabarJointExercise#15
The Japanese, U.S., Indian, and Australian “Malabar” exercise—submariners better be on their toes!
Word is that Japan, the U.S., India, and Australia are holding a major “Malabar” exercise in Yokosuka, Kanagawa. With anti-submarine warfare and surface-ship operations underway, submariners had better watch out—this is no joke! #MalabarJointExercise#15
Word is that Japan, the U.S., India, and Australia are holding a major “Malabar” exercise in Yokosuka, Kanagawa. With anti-submarine warfare and surface-ship operations underway, submariners had better watch out—this is no joke! #MalabarJointExercise#15
77

·
--
The Japan-U.S.-India-Australia “Malabar” exercise—submariners, you’d better be nervous!
I hear Japan, the U.S., India, and Australia held a major “Malabar” exercise in Yokosuka, Kanagawa, involving anti-submarine and anti-surface warfare. Submariners, you’d better watch out—this is no joke! #MalabarJointExercise#15
The Japan-U.S.-India-Australia “Malabar” exercise—submariners, you’d better be nervous!
I hear Japan, the U.S., India, and Australia held a major “Malabar” exercise in Yokosuka, Kanagawa, involving anti-submarine and anti-surface warfare. Submariners, you’d better watch out—this is no joke! #MalabarJointExercise#15
I hear Japan, the U.S., India, and Australia held a major “Malabar” exercise in Yokosuka, Kanagawa, involving anti-submarine and anti-surface warfare. Submariners, you’d better watch out—this is no joke! #MalabarJointExercise#15
77

Article
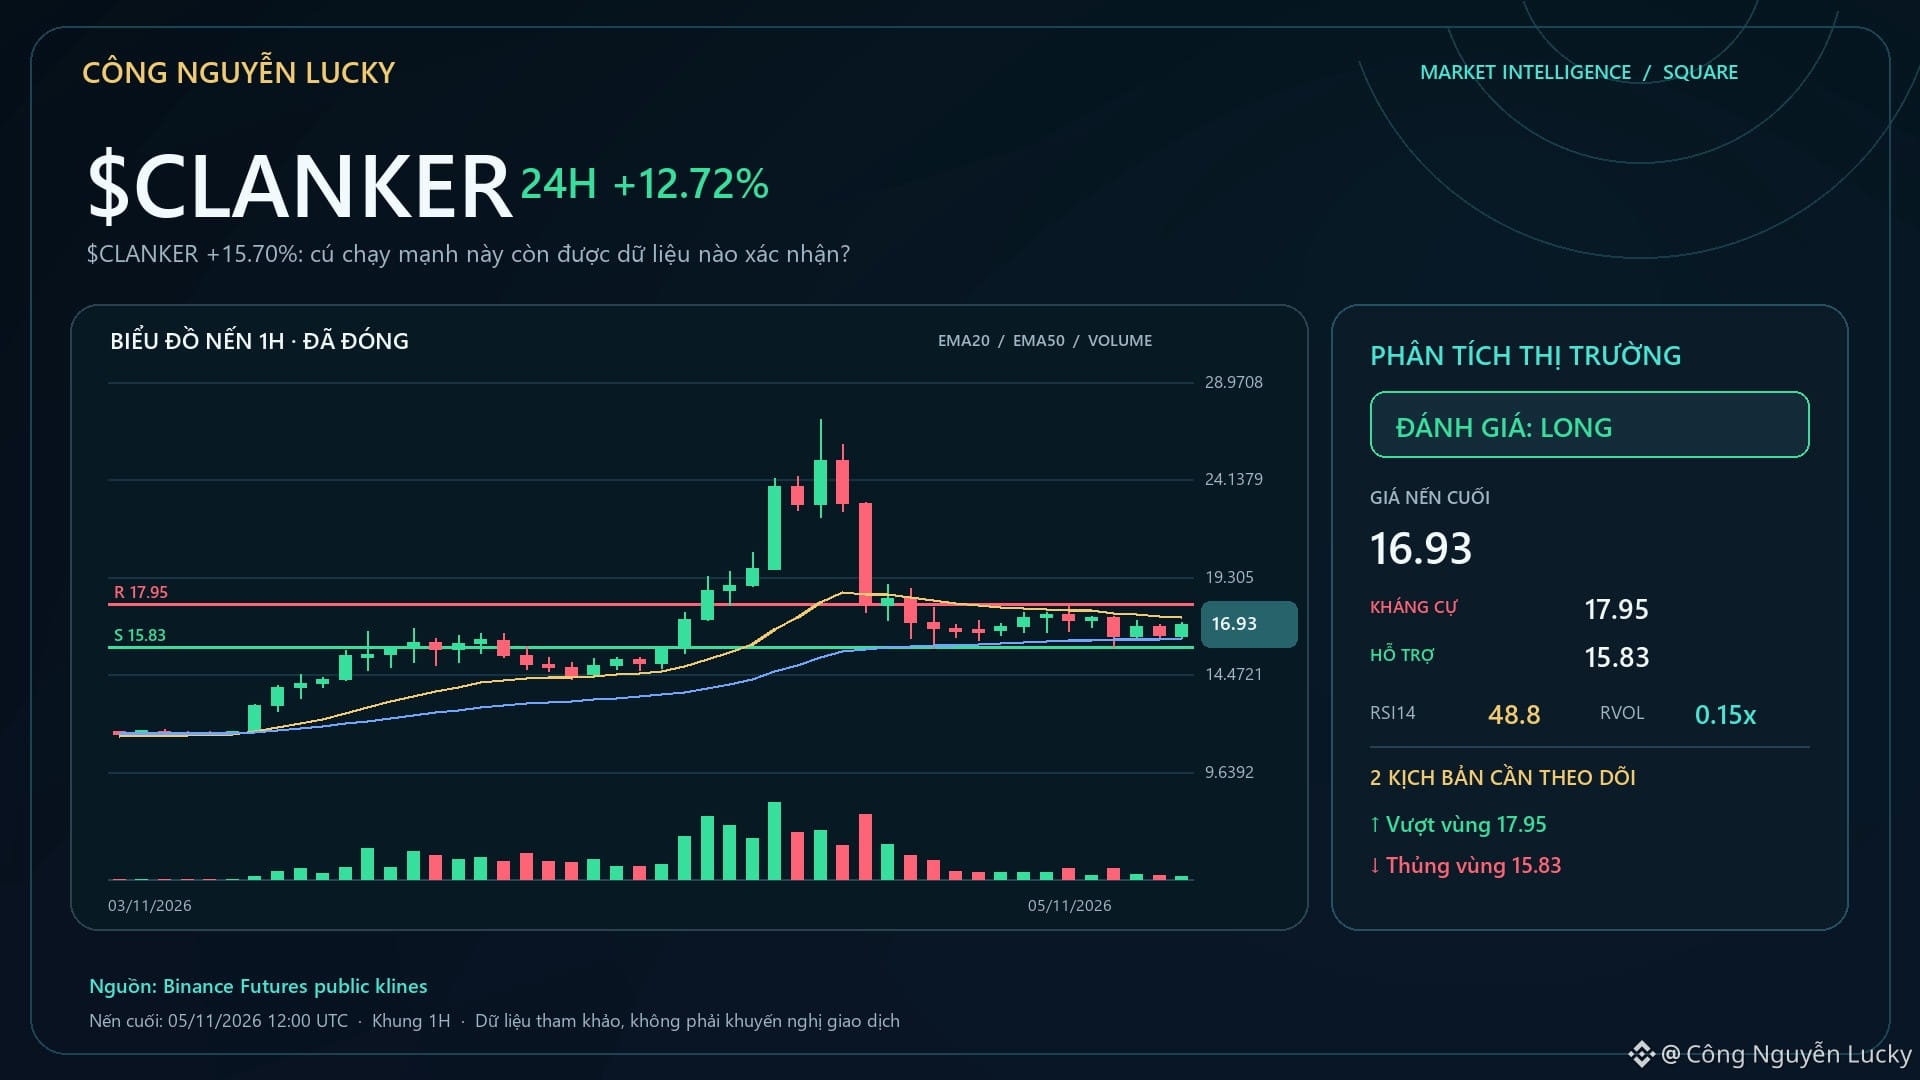
$CLANKER +15.70%: What else confirms this strong run?🔥 $CLANKER is up +15.70% — but the percentage change alone isn't enough to call this a good setup. 1️⃣ +15.70% — 24h change.
2️⃣ 431.9M USDT — 24h quote volume.
3️⃣ 20/100 — position within the daily range. A high number doesn't automatically make it a setup. What to confirm next:
• Breaking above 27.1 with expanding volume would make the continuation scenario more credible.
• Failing to hold the highs and falling back below the 21.02 midpoint would make the cooling-off scenario more evident. 🧭 Current bias: **LONG · STRONG · 87/100**.
$CLANKER +15.70%: What else confirms this strong run?
🔥 $CLANKER is up +15.70% — but the percentage change alone isn't enough to call this a good setup. 1️⃣ +15.70% — 24h change.
2️⃣ 431.9M USDT — 24h quote volume.
3️⃣ 20/100 — position within the daily range. A high number doesn't automatically make it a setup. What to confirm next:
• Breaking above 27.1 with expanding volume would make the continuation scenario more credible.
• Failing to hold the highs and falling back below the 21.02 midpoint would make the cooling-off scenario more evident. 🧭 Current bias: **LONG · STRONG · 87/100**.
2️⃣ 431.9M USDT — 24h quote volume.
3️⃣ 20/100 — position within the daily range. A high number doesn't automatically make it a setup. What to confirm next:
• Breaking above 27.1 with expanding volume would make the continuation scenario more credible.
• Failing to hold the highs and falling back below the 21.02 midpoint would make the cooling-off scenario more evident. 🧭 Current bias: **LONG · STRONG · 87/100**.
282
Article
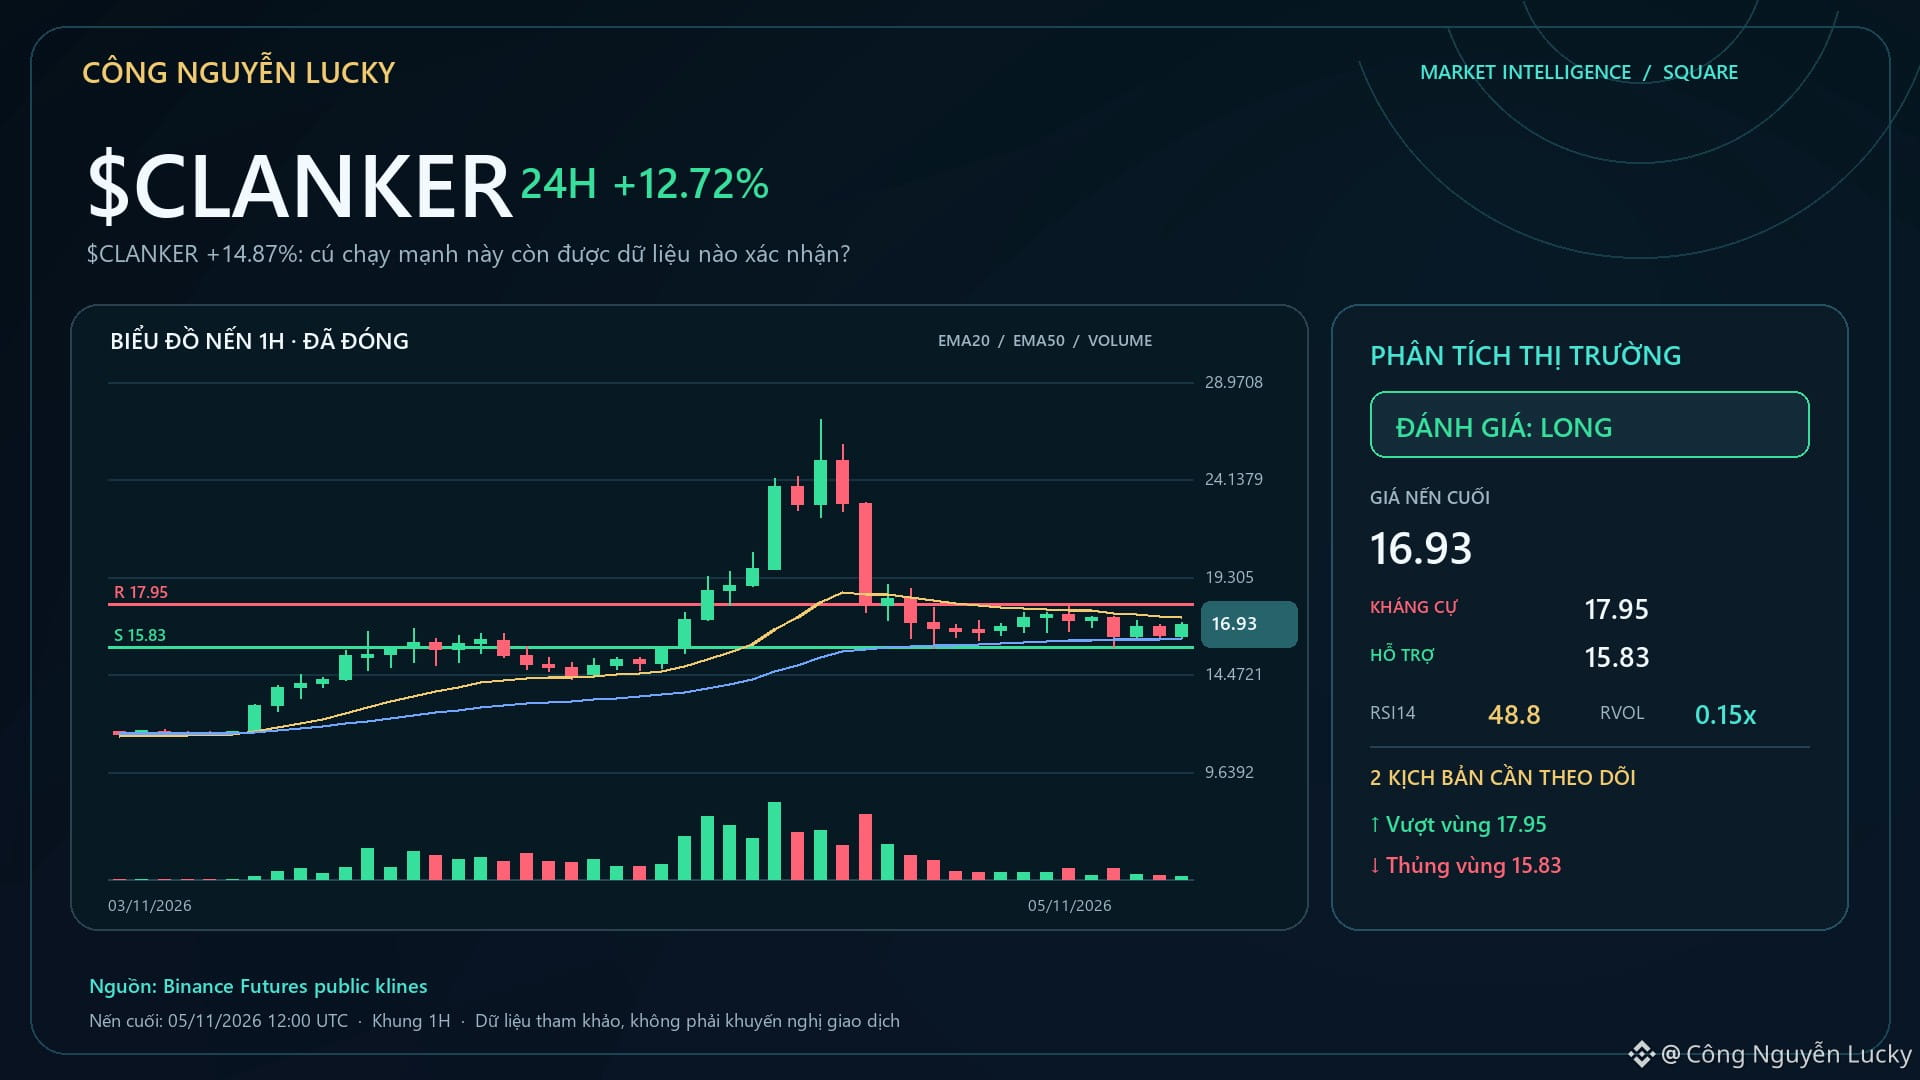
$CLANKER +14.87%: What data confirms this strong rally?🔎 $CLANKER: here’s a brief market note, keeping only verifiable facts. • 17.15 · 24h +14.87% · volume ~432.3M USDT · 4,007,749 trades. Condition for raising conviction: A break above 27.1 with expanding volume would make the continuation scenario more credible.
What would make me reconsider: Failing to hold the highs and falling back below the midpoint of 20.935 would make the cooling-off scenario more likely. 🧭 Current outlook: **LONG · STRONG · 87/100**.
$CLANKER +14.87%: What data confirms this strong rally?
🔎 $CLANKER : here’s a brief market note, keeping only verifiable facts. • 17.15 · 24h +14.87% · volume ~432.3M USDT · 4,007,749 trades. Condition for raising conviction: A break above 27.1 with expanding volume would make the continuation scenario more credible.
What would make me reconsider: Failing to hold the highs and falling back below the midpoint of 20.935 would make the cooling-off scenario more likely. 🧭 Current outlook: **LONG · STRONG · 87/100**.
What would make me reconsider: Failing to hold the highs and falling back below the midpoint of 20.935 would make the cooling-off scenario more likely. 🧭 Current outlook: **LONG · STRONG · 87/100**.
276

·
--
$ZRO This drop is interesting: the price fell 1.13%, but OI also declined, with a notional change of -510K. This looks more like longs actively deleveraging and exiting via stop-losses than a major wave of shorts entering to drive the price down.
The 15m taker flow imbalance is -14.4%, the buy/sell ratio is 0.75, and the close fell below the lower bound of the recent 20-candle 5m range, so the short-term structure is weak. However, the OI anomaly percentile is still at 90.1%, ranking #15 across the entire pool, and has remained elevated over several consecutive periods. This suggests leveraged positions have not yet been fully flushed out, and the funding rate is also still in a high percentile relative to recent levels.
24h trading volume is 67M, and market depth is not bad. But with this combination of falling prices and declining OI, be careful about chasing shorts in case of a rebound after long deleveraging runs its course. Wait for the OI anomaly percentile to fall and the taker flow imbalance to narrow before considering a direction. There is no need to rush in now.
$ZRO This drop is interesting: the price fell 1.13%, but OI also declined, with a notional change of -510K. This looks more like longs actively deleveraging and exiting via stop-losses than a major wave of shorts entering to drive the price down.
The 15m taker flow imbalance is -14.4%, the buy/sell ratio is 0.75, and the close fell below the lower bound of the recent 20-candle 5m range, so the short-term structure is weak. However, the OI anomaly percentile is still at 90.1%, ranking #15 across the entire pool, and has remained elevated over several consecutive periods. This suggests leveraged positions have not yet been fully flushed out, and the funding rate is also still in a high percentile relative to recent levels.
24h trading volume is 67M, and market depth is not bad. But with this combination of falling prices and declining OI, be careful about chasing shorts in case of a rebound after long deleveraging runs its course. Wait for the OI anomaly percentile to fall and the taker flow imbalance to narrow before considering a direction. There is no need to rush in now.
The 15m taker flow imbalance is -14.4%, the buy/sell ratio is 0.75, and the close fell below the lower bound of the recent 20-candle 5m range, so the short-term structure is weak. However, the OI anomaly percentile is still at 90.1%, ranking #15 across the entire pool, and has remained elevated over several consecutive periods. This suggests leveraged positions have not yet been fully flushed out, and the funding rate is also still in a high percentile relative to recent levels.
24h trading volume is 67M, and market depth is not bad. But with this combination of falling prices and declining OI, be careful about chasing shorts in case of a rebound after long deleveraging runs its course. Wait for the OI anomaly percentile to fall and the taker flow imbalance to narrow before considering a direction. There is no need to rush in now.
6
·
--
$EVAA has something going on. It’s up 3.81% in 15m, with volume hitting 3× normal levels and an aggressive buy/sell ratio of 1.48. It also closed above the highs of the last 20 or so 5m candles. The key point is that OI rose along with it—up 0.44% over 1h—so this wasn’t driven by spot buying alone; it looks more like new leveraged longs entering. It ranks #10 for anomalies across the entire pool and #15 for notional change, and depth confirms the move—it’s not just a quick fake-out. 24h trading volume of 79M also means it’s not a tiny pool. Let’s see if it can hold above the top of this range: if it can’t, it was just a wick; if it does, there may be another leg up.
$EVAA has something going on. It’s up 3.81% in 15m, with volume hitting 3× normal levels and an aggressive buy/sell ratio of 1.48. It also closed above the highs of the last 20 or so 5m candles. The key point is that OI rose along with it—up 0.44% over 1h—so this wasn’t driven by spot buying alone; it looks more like new leveraged longs entering. It ranks #10 for anomalies across the entire pool and #15 for notional change, and depth confirms the move—it’s not just a quick fake-out. 24h trading volume of 79M also means it’s not a tiny pool. Let’s see if it can hold above the top of this range: if it can’t, it was just a wick; if it does, there may be another leg up.
37
·
--
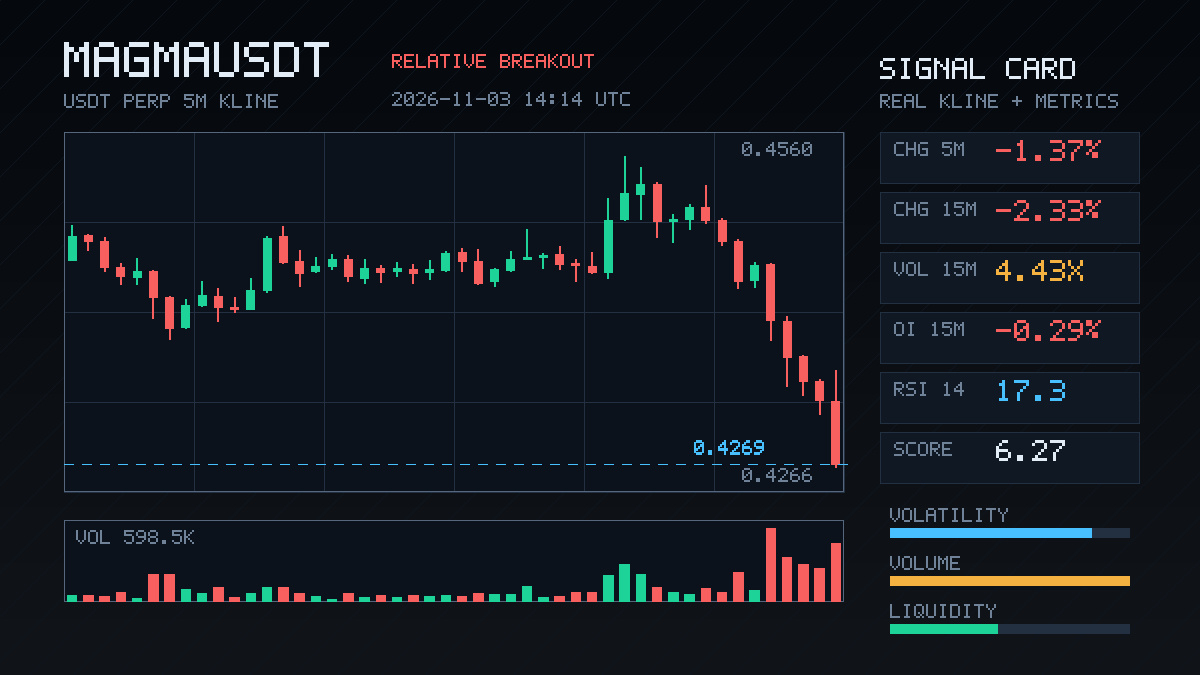
$MAGMA This drop is kind of interesting. It plunged 2.33% in 15m, with volume reaching 4.43x, and the close broke below the low of nearly 20 5m candles—but look at OI: it fell just 0.29% in 15m and only 0.87% in 1h, with notional exposure down by just over 500,000 U.
Price down + OI down typically means no new shorts are opening; instead, longs are deleveraging, getting stopped out, and shrinking their positions. The taker volume imbalance is only 0.7%, and the buy/sell ratio is 1.01, so selling pressure isn't actually that intense.
The OI anomaly percentile is 94.6%, ranking #15 across the entire pool, and the trend has persisted across multiple consecutive periods. In an extreme zone like this, a leveraged position flush is often cleaner than a straightforward sell-off. First, let's see if the market can stabilize once this wave of stop-losses is cleared.
$MAGMA This drop is kind of interesting. It plunged 2.33% in 15m, with volume reaching 4.43x, and the close broke below the low of nearly 20 5m candles—but look at OI: it fell just 0.29% in 15m and only 0.87% in 1h, with notional exposure down by just over 500,000 U.
Price down + OI down typically means no new shorts are opening; instead, longs are deleveraging, getting stopped out, and shrinking their positions. The taker volume imbalance is only 0.7%, and the buy/sell ratio is 1.01, so selling pressure isn't actually that intense.
The OI anomaly percentile is 94.6%, ranking #15 across the entire pool, and the trend has persisted across multiple consecutive periods. In an extreme zone like this, a leveraged position flush is often cleaner than a straightforward sell-off. First, let's see if the market can stabilize once this wave of stop-losses is cleared.
Price down + OI down typically means no new shorts are opening; instead, longs are deleveraging, getting stopped out, and shrinking their positions. The taker volume imbalance is only 0.7%, and the buy/sell ratio is 1.01, so selling pressure isn't actually that intense.
The OI anomaly percentile is 94.6%, ranking #15 across the entire pool, and the trend has persisted across multiple consecutive periods. In an extreme zone like this, a leveraged position flush is often cleaner than a straightforward sell-off. First, let's see if the market can stabilize once this wave of stop-losses is cleared.

·
--
$GTC This kind of movement doesn't look much like retail traders dumping. It fell 1.67% in 15m, while volume surged to more than 4 times normal. OI rose nearly 3% in an hour, and leveraged shorts kept piling in as the price moved down. Aggressive trade delta was -9.5%, and the buy/sell ratio was 0.83—selling pressure is real. The OI anomaly percentile is 92.7%, ranking #15 across the entire pool, and it has persisted for several consecutive periods. This kind of setup means either someone positioned early or shorts are chasing the move. Either way, the order book isn't quiet. 24h trading volume is only 13M, and market depth isn't very thick. A nominal OI change of just over 200K was enough to push it to this percentile, so both a short squeeze and an accelerated drop could be just around the corner. Keep watching for now.
$GTC This kind of movement doesn't look much like retail traders dumping. It fell 1.67% in 15m, while volume surged to more than 4 times normal. OI rose nearly 3% in an hour, and leveraged shorts kept piling in as the price moved down. Aggressive trade delta was -9.5%, and the buy/sell ratio was 0.83—selling pressure is real. The OI anomaly percentile is 92.7%, ranking #15 across the entire pool, and it has persisted for several consecutive periods. This kind of setup means either someone positioned early or shorts are chasing the move. Either way, the order book isn't quiet. 24h trading volume is only 13M, and market depth isn't very thick. A nominal OI change of just over 200K was enough to push it to this percentile, so both a short squeeze and an accelerated drop could be just around the corner. Keep watching for now.
3
·
--
This 15m move in $USELESS is looking interesting: the price only rose 0.85%, but volume jumped to 2.24x. The buy/sell ratio is 1.62, and the net taker volume is 23.7%, suggesting real capital is pushing the price higher. OI is up slightly on both the 15m and 1h timeframes, with nominal changes of 80K and 84K respectively. Both gains are just over 0.8%, which doesn’t look like a purely spot-driven move; it seems more like new leveraged longs are entering to test the waters. The close was above the upper bound of the recent 20-candle 5m range. It also ranked in the 83.3rd percentile for anomalies across the full pool, at #15, and passed the depth confirmation. 24h trading volume is just over 13M, so this isn’t a particularly large asset. If momentum traders pile in, this kind of setup can accelerate quickly—but it can also pull back just as fast. Keep an eye on whether it can hold above the range high.
This 15m move in $USELESS is looking interesting: the price only rose 0.85%, but volume jumped to 2.24x. The buy/sell ratio is 1.62, and the net taker volume is 23.7%, suggesting real capital is pushing the price higher. OI is up slightly on both the 15m and 1h timeframes, with nominal changes of 80K and 84K respectively. Both gains are just over 0.8%, which doesn’t look like a purely spot-driven move; it seems more like new leveraged longs are entering to test the waters. The close was above the upper bound of the recent 20-candle 5m range. It also ranked in the 83.3rd percentile for anomalies across the full pool, at #15, and passed the depth confirmation. 24h trading volume is just over 13M, so this isn’t a particularly large asset. If momentum traders pile in, this kind of setup can accelerate quickly—but it can also pull back just as fast. Keep an eye on whether it can hold above the range high.
2
·
--
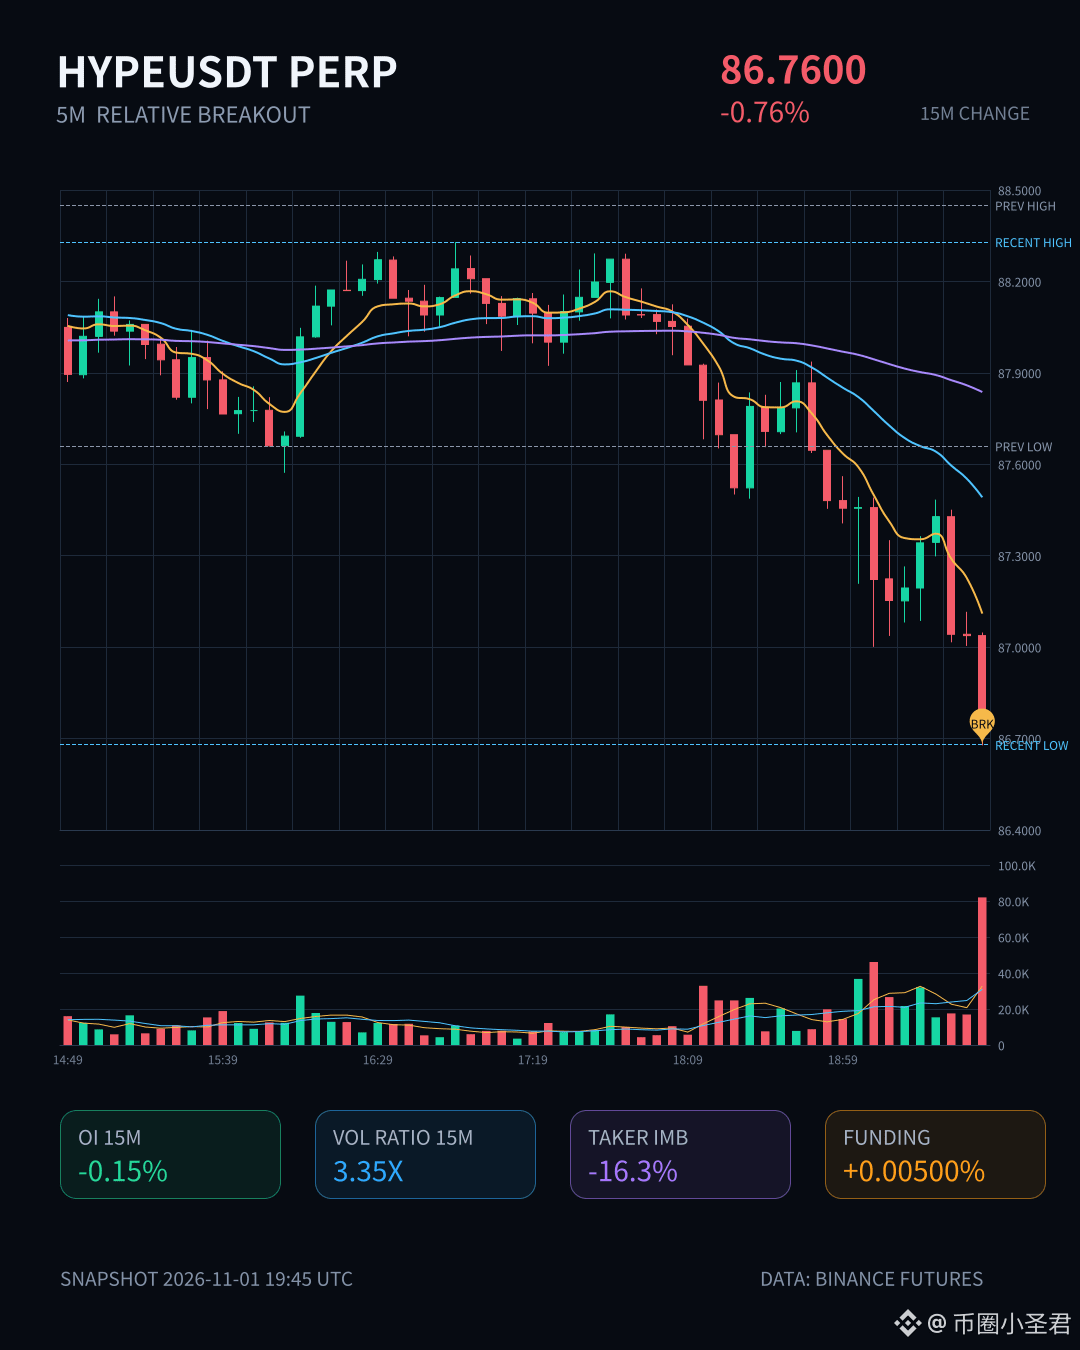
$HYPE This early-morning move has something to it.
On the 15m chart, price broke straight below the bottom of the range from nearly 20 recent 5m candles. Volume surged to 3.35x normal, taker buy/sell delta was -16.3%, and the buy/sell ratio was 0.72. Sellers are genuinely dumping—not just using sell orders to scare people.
But the interesting part is OI: down 0.15% on the 15m and 0.03% on the 1h, with notional changes of several million U downward. Price down + OI down is a classic long deleveraging pattern, driven by stop-losses and passive position reductions—not new shorts entering the market.
The anomaly percentile is 84.1%, ranking #15 across the entire pool; notional change ranks #2, and the funding rate is still in a high percentile relative to recent levels. This pattern has persisted across multiple consecutive intervals, so I’d avoid catching the falling knife for now and wait until leverage has been flushed out and OI stabilizes before reassessing.
$HYPE This early-morning move has something to it.
On the 15m chart, price broke straight below the bottom of the range from nearly 20 recent 5m candles. Volume surged to 3.35x normal, taker buy/sell delta was -16.3%, and the buy/sell ratio was 0.72. Sellers are genuinely dumping—not just using sell orders to scare people.
But the interesting part is OI: down 0.15% on the 15m and 0.03% on the 1h, with notional changes of several million U downward. Price down + OI down is a classic long deleveraging pattern, driven by stop-losses and passive position reductions—not new shorts entering the market.
The anomaly percentile is 84.1%, ranking #15 across the entire pool; notional change ranks #2, and the funding rate is still in a high percentile relative to recent levels. This pattern has persisted across multiple consecutive intervals, so I’d avoid catching the falling knife for now and wait until leverage has been flushed out and OI stabilizes before reassessing.
On the 15m chart, price broke straight below the bottom of the range from nearly 20 recent 5m candles. Volume surged to 3.35x normal, taker buy/sell delta was -16.3%, and the buy/sell ratio was 0.72. Sellers are genuinely dumping—not just using sell orders to scare people.
But the interesting part is OI: down 0.15% on the 15m and 0.03% on the 1h, with notional changes of several million U downward. Price down + OI down is a classic long deleveraging pattern, driven by stop-losses and passive position reductions—not new shorts entering the market.
The anomaly percentile is 84.1%, ranking #15 across the entire pool; notional change ranks #2, and the funding rate is still in a high percentile relative to recent levels. This pattern has persisted across multiple consecutive intervals, so I’d avoid catching the falling knife for now and wait until leverage has been flushed out and OI stabilizes before reassessing.
1

·
--
$1M to deploy today. Two doors. ENTRY 37.
Both doors resolved on the same hour — 19:00 UTC. One broke INTO open air. The other broke DOWN through its floor.
DOOR 1 — $LINK $11.70. Last night's extension-verdict post ended at the 18:00 UTC close: $11.769, the first closed hour above the $11.749 door since the Oct 29 flush. Then 19:00 UTC did the next thing the saga's own levels named: closed $11.912 ABOVE $11.896 on $1.96M. Open-air extension: fired. Five straight closes since above the $11.749 door. Rank #15, $8.97B mcap, 7d +1.2%. No fresh timed headline — tape, not news.
DOOR 2 — $LSK $0.25. Yesterday the chain's-last-day leg lost the $0.2967 line on two closes, and $0.2660 — the sell-bar low — was named as the next floor. 19:00 UTC took it out: $0.2784 → low $0.2391 → close $0.2434 on $2.19M — LSK's heaviest hourly bar of the day. Four straight closes since under $0.2660. The Lisk chain shuts down TODAY: official FAQ says withdraw by Oct 31, 100M LSK burn, pivot to stablecoin finance. Rank #413, $55M mcap, -99.3% off the $34.92 ATH.
My pick: Door 1. A door breaking into open air on real hourly volume beats a leg washing through its floor on the chain's last day.
Honest other side: LINK's forming hour sits at $11.695 — BELOW the $11.749 door, unclosed. The 05:30 IST close has to hold it, or the extension fails on its first test. And LSK's September proved shutdown books can squeeze from nowhere — $0.10 to $2.37 once, same chain.
Not a call, either way.
Which prints first at 05:30 IST — LINK's $11.749 door holding, or LSK's $0.2660 staying broken?
$1M to deploy today. Two doors. ENTRY 37.
Both doors resolved on the same hour — 19:00 UTC. One broke INTO open air. The other broke DOWN through its floor.
DOOR 1 — $LINK $11.70. Last night's extension-verdict post ended at the 18:00 UTC close: $11.769, the first closed hour above the $11.749 door since the Oct 29 flush. Then 19:00 UTC did the next thing the saga's own levels named: closed $11.912 ABOVE $11.896 on $1.96M. Open-air extension: fired. Five straight closes since above the $11.749 door. Rank #15, $8.97B mcap, 7d +1.2%. No fresh timed headline — tape, not news.
DOOR 2 — $LSK $0.25. Yesterday the chain's-last-day leg lost the $0.2967 line on two closes, and $0.2660 — the sell-bar low — was named as the next floor. 19:00 UTC took it out: $0.2784 → low $0.2391 → close $0.2434 on $2.19M — LSK's heaviest hourly bar of the day. Four straight closes since under $0.2660. The Lisk chain shuts down TODAY: official FAQ says withdraw by Oct 31, 100M LSK burn, pivot to stablecoin finance. Rank #413, $55M mcap, -99.3% off the $34.92 ATH.
My pick: Door 1. A door breaking into open air on real hourly volume beats a leg washing through its floor on the chain's last day.
Honest other side: LINK's forming hour sits at $11.695 — BELOW the $11.749 door, unclosed. The 05:30 IST close has to hold it, or the extension fails on its first test. And LSK's September proved shutdown books can squeeze from nowhere — $0.10 to $2.37 once, same chain.
Not a call, either way.
Which prints first at 05:30 IST — LINK's $11.749 door holding, or LSK's $0.2660 staying broken?
Both doors resolved on the same hour — 19:00 UTC. One broke INTO open air. The other broke DOWN through its floor.
DOOR 1 — $LINK $11.70. Last night's extension-verdict post ended at the 18:00 UTC close: $11.769, the first closed hour above the $11.749 door since the Oct 29 flush. Then 19:00 UTC did the next thing the saga's own levels named: closed $11.912 ABOVE $11.896 on $1.96M. Open-air extension: fired. Five straight closes since above the $11.749 door. Rank #15, $8.97B mcap, 7d +1.2%. No fresh timed headline — tape, not news.
DOOR 2 — $LSK $0.25. Yesterday the chain's-last-day leg lost the $0.2967 line on two closes, and $0.2660 — the sell-bar low — was named as the next floor. 19:00 UTC took it out: $0.2784 → low $0.2391 → close $0.2434 on $2.19M — LSK's heaviest hourly bar of the day. Four straight closes since under $0.2660. The Lisk chain shuts down TODAY: official FAQ says withdraw by Oct 31, 100M LSK burn, pivot to stablecoin finance. Rank #413, $55M mcap, -99.3% off the $34.92 ATH.
My pick: Door 1. A door breaking into open air on real hourly volume beats a leg washing through its floor on the chain's last day.
Honest other side: LINK's forming hour sits at $11.695 — BELOW the $11.749 door, unclosed. The 05:30 IST close has to hold it, or the extension fails on its first test. And LSK's September proved shutdown books can squeeze from nowhere — $0.10 to $2.37 once, same chain.
Not a call, either way.
Which prints first at 05:30 IST — LINK's $11.749 door holding, or LSK's $0.2660 staying broken?
7
·
--
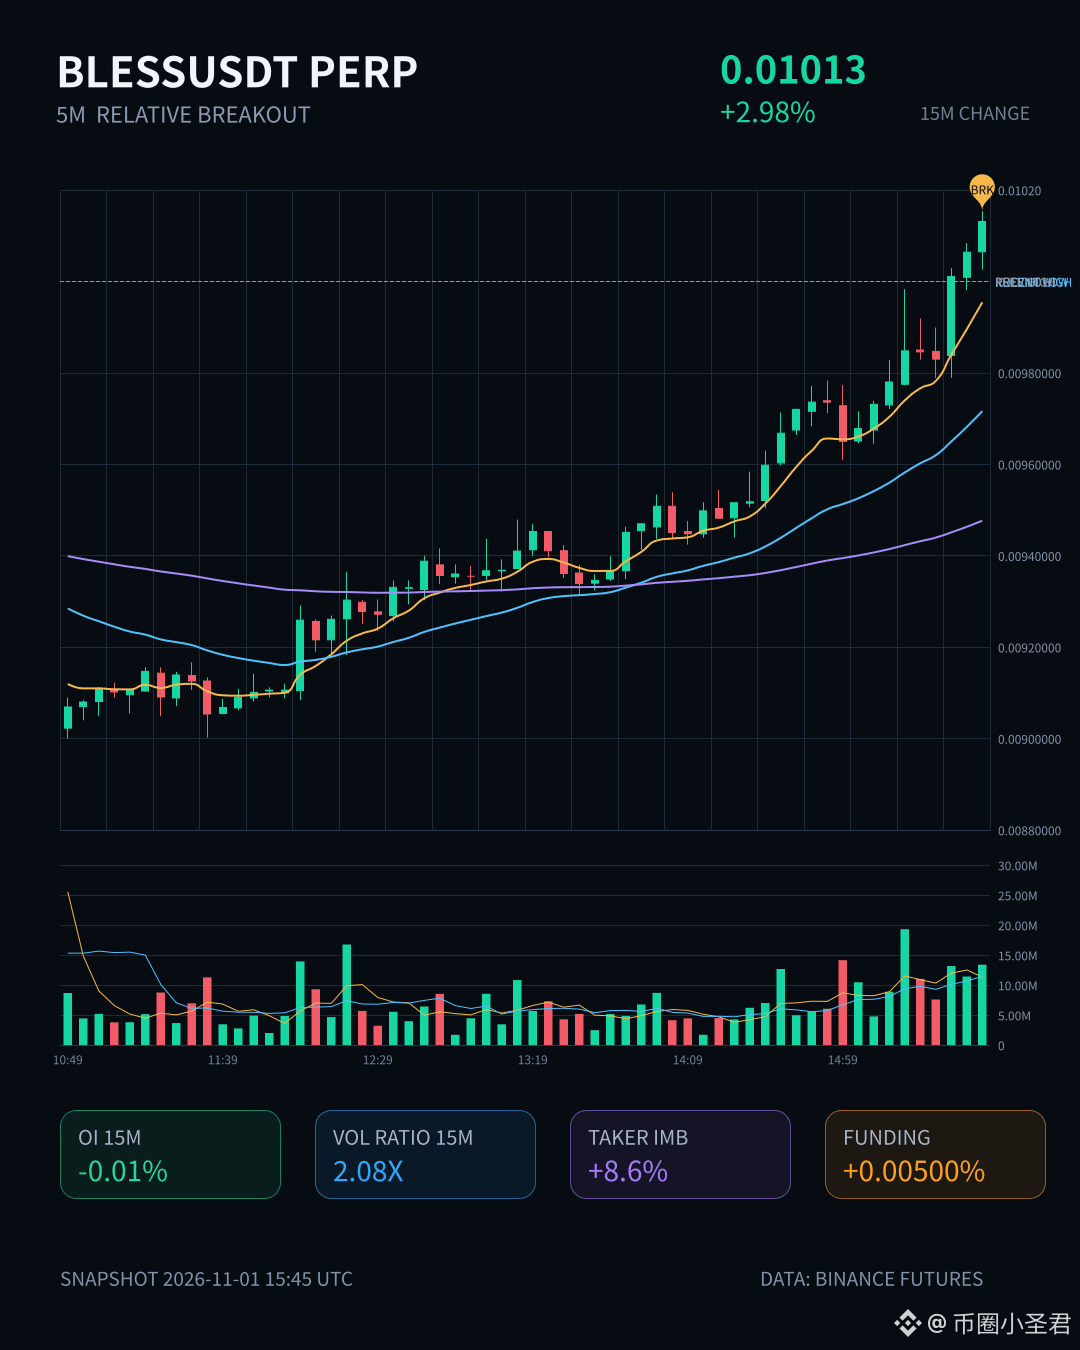
$BLESS This 15m move is up 2.98%, with volume exploding to 2.08x. Price broke above the high of the past 20 5m ranges, and the 1.19 taker buy/sell ratio suggests buyers are pushing.
But the interesting part is OI—both 15m and 1h OI are down slightly, while notional change is rising. Price up + open interest down: that’s basically the profile of short covering, not new longs entering. The anomaly percentile is 86.5%, ranking #15 across the entire pool, so this isn’t just a BLESS-specific event.
24h trading volume is only 24M—thin. With depth like this, a squeeze on shorts can easily drive a move like this. If you’re chasing the rally, think carefully.
$BLESS This 15m move is up 2.98%, with volume exploding to 2.08x. Price broke above the high of the past 20 5m ranges, and the 1.19 taker buy/sell ratio suggests buyers are pushing.
But the interesting part is OI—both 15m and 1h OI are down slightly, while notional change is rising. Price up + open interest down: that’s basically the profile of short covering, not new longs entering. The anomaly percentile is 86.5%, ranking #15 across the entire pool, so this isn’t just a BLESS-specific event.
24h trading volume is only 24M—thin. With depth like this, a squeeze on shorts can easily drive a move like this. If you’re chasing the rally, think carefully.
But the interesting part is OI—both 15m and 1h OI are down slightly, while notional change is rising. Price up + open interest down: that’s basically the profile of short covering, not new longs entering. The anomaly percentile is 86.5%, ranking #15 across the entire pool, so this isn’t just a BLESS-specific event.
24h trading volume is only 24M—thin. With depth like this, a squeeze on shorts can easily drive a move like this. If you’re chasing the rally, think carefully.
3
·
--
$SOPH This move has been a bit too sharp—up 7 points in 15m, with volume expanding to 12 times its previous level. Looks like someone was in a hurry.
But looking closer, OI actually fell 0.07% over 15m, and was also negative over 1h at −0.56%. Price up, open interest down—this pattern is all too familiar: short covering, not fresh money coming in to build long positions. That 119K in notional change looks more like margin top-ups or position closures than a signal of aggressive buying.
The closing price broke above the upper end of the range from the last 20 5m candles. The taker buy-sell difference was 7.2%, so buyers have the upper hand for now, and the funding rate is also in the upper range of its recent levels. The problem is that this kind of setup usually doesn’t last. If OI doesn’t recover, the price will just move sideways after the rally, and anyone chasing the top could get stuck.
Ranked #15 for abnormal activity across the pool and #31 for notional change—not a top-tier event. But 24h trading volume is only 25.63M, liquidity is average, and slippage is something to watch out for.
I’ll keep an eye on it for now and wait for OI to turn positive. You can take a bite out of this short-squeeze bounce, but don’t treat it as a trend.
$SOPH This move has been a bit too sharp—up 7 points in 15m, with volume expanding to 12 times its previous level. Looks like someone was in a hurry.
But looking closer, OI actually fell 0.07% over 15m, and was also negative over 1h at −0.56%. Price up, open interest down—this pattern is all too familiar: short covering, not fresh money coming in to build long positions. That 119K in notional change looks more like margin top-ups or position closures than a signal of aggressive buying.
The closing price broke above the upper end of the range from the last 20 5m candles. The taker buy-sell difference was 7.2%, so buyers have the upper hand for now, and the funding rate is also in the upper range of its recent levels. The problem is that this kind of setup usually doesn’t last. If OI doesn’t recover, the price will just move sideways after the rally, and anyone chasing the top could get stuck.
Ranked #15 for abnormal activity across the pool and #31 for notional change—not a top-tier event. But 24h trading volume is only 25.63M, liquidity is average, and slippage is something to watch out for.
I’ll keep an eye on it for now and wait for OI to turn positive. You can take a bite out of this short-squeeze bounce, but don’t treat it as a trend.
But looking closer, OI actually fell 0.07% over 15m, and was also negative over 1h at −0.56%. Price up, open interest down—this pattern is all too familiar: short covering, not fresh money coming in to build long positions. That 119K in notional change looks more like margin top-ups or position closures than a signal of aggressive buying.
The closing price broke above the upper end of the range from the last 20 5m candles. The taker buy-sell difference was 7.2%, so buyers have the upper hand for now, and the funding rate is also in the upper range of its recent levels. The problem is that this kind of setup usually doesn’t last. If OI doesn’t recover, the price will just move sideways after the rally, and anyone chasing the top could get stuck.
Ranked #15 for abnormal activity across the pool and #31 for notional change—not a top-tier event. But 24h trading volume is only 25.63M, liquidity is average, and slippage is something to watch out for.
I’ll keep an eye on it for now and wait for OI to turn positive. You can take a bite out of this short-squeeze bounce, but don’t treat it as a trend.
7
·
--
The verdict is in: $LINK closed $11.769 — above the $11.749 extension line.
Post 441 gave the 18:00 UTC hour one job: close above $11.749 and the rally walks in. It did. O $11.694 → H $11.816 → C $11.769 — the first closed hour above the line in the whole saga.
Both sides, as always:
The door opened, but nobody kicked it down. $1.2M printed on the verdict bar — ordinary volume, no blast. The 19:00 hour is still forming (live $11.876, tagged $11.896, unclosed) — its 20:00 UTC close is the next verdict, not this one. One close is an answer, not a march: 1h RSI 66 warming, not screaming.
And yet: $10.42 → $11.876 in a day and a half. The Oct 29 flush that snapped the $11.53 floor is fully unwound — that broken floor is support again, price holding above the 1h EMA20 ($11.52) and EMA50 ($11.42). Below: the $11.30 dead-cat shelf, then air under $10.914.
Fresh numbers: $11.876, +6.4% 24h, H $11.896 / L $11.091, $25M Binance volume. Rank #15, $9.09B mcap, 766.8M of 1B out (no unlock overhang), still -77% off the $52.70 ATH. No verified catalyst in the last half hour — prediction spam and old October pieces. Tape, not news.
Not a call, either way. A close back under $11.749 fails the extension on its first test — does the door hold?
The verdict is in: $LINK closed $11.769 — above the $11.749 extension line.
Post 441 gave the 18:00 UTC hour one job: close above $11.749 and the rally walks in. It did. O $11.694 → H $11.816 → C $11.769 — the first closed hour above the line in the whole saga.
Both sides, as always:
The door opened, but nobody kicked it down. $1.2M printed on the verdict bar — ordinary volume, no blast. The 19:00 hour is still forming (live $11.876, tagged $11.896, unclosed) — its 20:00 UTC close is the next verdict, not this one. One close is an answer, not a march: 1h RSI 66 warming, not screaming.
And yet: $10.42 → $11.876 in a day and a half. The Oct 29 flush that snapped the $11.53 floor is fully unwound — that broken floor is support again, price holding above the 1h EMA20 ($11.52) and EMA50 ($11.42). Below: the $11.30 dead-cat shelf, then air under $10.914.
Fresh numbers: $11.876, +6.4% 24h, H $11.896 / L $11.091, $25M Binance volume. Rank #15, $9.09B mcap, 766.8M of 1B out (no unlock overhang), still -77% off the $52.70 ATH. No verified catalyst in the last half hour — prediction spam and old October pieces. Tape, not news.
Not a call, either way. A close back under $11.749 fails the extension on its first test — does the door hold?
Post 441 gave the 18:00 UTC hour one job: close above $11.749 and the rally walks in. It did. O $11.694 → H $11.816 → C $11.769 — the first closed hour above the line in the whole saga.
Both sides, as always:
The door opened, but nobody kicked it down. $1.2M printed on the verdict bar — ordinary volume, no blast. The 19:00 hour is still forming (live $11.876, tagged $11.896, unclosed) — its 20:00 UTC close is the next verdict, not this one. One close is an answer, not a march: 1h RSI 66 warming, not screaming.
And yet: $10.42 → $11.876 in a day and a half. The Oct 29 flush that snapped the $11.53 floor is fully unwound — that broken floor is support again, price holding above the 1h EMA20 ($11.52) and EMA50 ($11.42). Below: the $11.30 dead-cat shelf, then air under $10.914.
Fresh numbers: $11.876, +6.4% 24h, H $11.896 / L $11.091, $25M Binance volume. Rank #15, $9.09B mcap, 766.8M of 1B out (no unlock overhang), still -77% off the $52.70 ATH. No verified catalyst in the last half hour — prediction spam and old October pieces. Tape, not news.
Not a call, either way. A close back under $11.749 fails the extension on its first test — does the door hold?
18
·
--
$1M to deploy today. Two doors. ENTRY 35.
Door 1: $ADA $0.1938 — the sleeper that broke. Our watchlist has carried ADA since Oct 21: trigger was a daily close above $0.234, invalidation a daily close below $0.2111. The invalidation fired: Oct 29's daily closed $0.1904 on $39.7M — the biggest ADA bar of the month — and Oct 30 confirmed at $0.1952. Since then it's parked $0.192-$0.196, hourly volume dying ($147-$411k), rank #18, $7.28B. The card is shown: $0.2111 is now the ceiling.
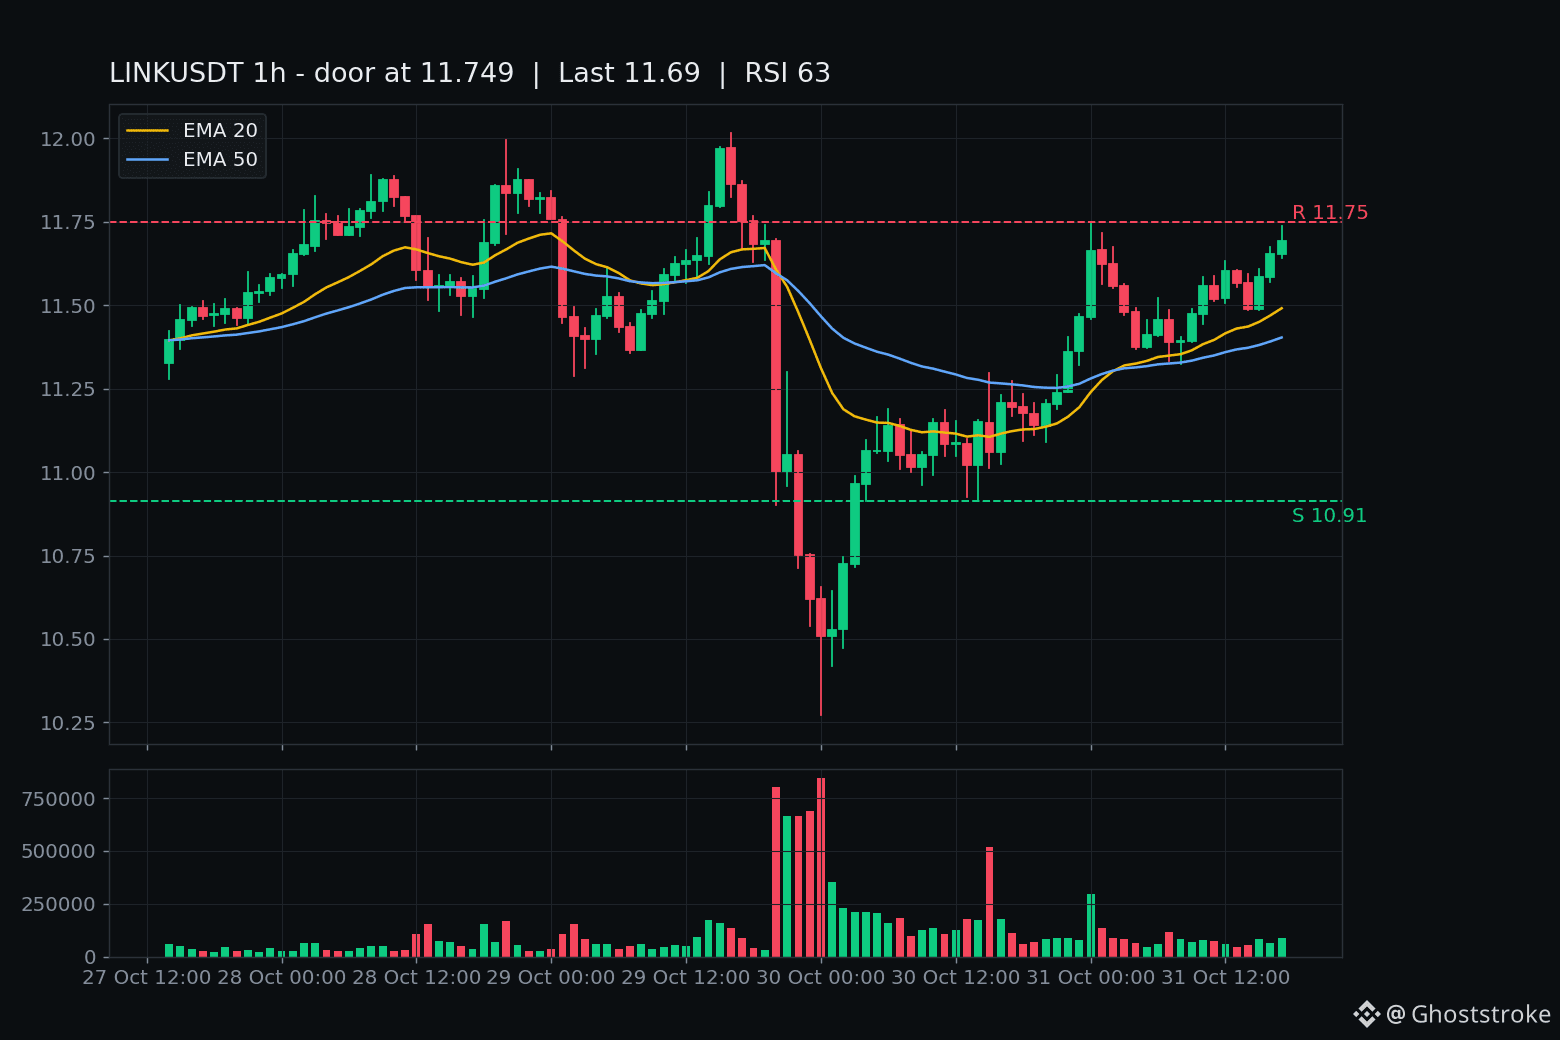
Door 2: $LINK $11.777 +5.9% — the door being knocked. The flush-failing verdict (first closed hour above $11.53) is extending: twelve closed hours grinding $11.457 up to $11.694, pressing the $11.749 extension line. The forming hour tagged $11.816 — unclosed. The 19:00 UTC close (00:30 IST) decides. RSI 63, over EMA20 $11.49 and EMA50 $11.40, $24.2M / 246.8k trades, rank #15, $9.03B. No verified timed headline — this is tape, not news.
My pick: Door 2. A door being knocked with a verdict you can watch resolve in the next hour beats a sleeper whose breakdown already printed — and every hour parked under $0.2111 writes it deeper.
The other side, honestly: LINK is up 5.9% INTO the line and the extension trigger still hasn't closed above $11.749 — one hourly close back below $11.53 is rejection resuming. And ADA breakdowns fail too: a daily close back above $0.2111 kills the bear thesis and shorts bleed.
Not a call, either way.
Which line prints first — the $11.749 close, or the $0.2111 reclaim?
$1M to deploy today. Two doors. ENTRY 35.
Door 1: $ADA $0.1938 — the sleeper that broke. Our watchlist has carried ADA since Oct 21: trigger was a daily close above $0.234, invalidation a daily close below $0.2111. The invalidation fired: Oct 29's daily closed $0.1904 on $39.7M — the biggest ADA bar of the month — and Oct 30 confirmed at $0.1952. Since then it's parked $0.192-$0.196, hourly volume dying ($147-$411k), rank #18, $7.28B. The card is shown: $0.2111 is now the ceiling.
Door 2: $LINK $11.777 +5.9% — the door being knocked. The flush-failing verdict (first closed hour above $11.53) is extending: twelve closed hours grinding $11.457 up to $11.694, pressing the $11.749 extension line. The forming hour tagged $11.816 — unclosed. The 19:00 UTC close (00:30 IST) decides. RSI 63, over EMA20 $11.49 and EMA50 $11.40, $24.2M / 246.8k trades, rank #15, $9.03B. No verified timed headline — this is tape, not news.
My pick: Door 2. A door being knocked with a verdict you can watch resolve in the next hour beats a sleeper whose breakdown already printed — and every hour parked under $0.2111 writes it deeper.
The other side, honestly: LINK is up 5.9% INTO the line and the extension trigger still hasn't closed above $11.749 — one hourly close back below $11.53 is rejection resuming. And ADA breakdowns fail too: a daily close back above $0.2111 kills the bear thesis and shorts bleed.
Not a call, either way.
Which line prints first — the $11.749 close, or the $0.2111 reclaim?
Door 1: $ADA $0.1938 — the sleeper that broke. Our watchlist has carried ADA since Oct 21: trigger was a daily close above $0.234, invalidation a daily close below $0.2111. The invalidation fired: Oct 29's daily closed $0.1904 on $39.7M — the biggest ADA bar of the month — and Oct 30 confirmed at $0.1952. Since then it's parked $0.192-$0.196, hourly volume dying ($147-$411k), rank #18, $7.28B. The card is shown: $0.2111 is now the ceiling.
Door 2: $LINK $11.777 +5.9% — the door being knocked. The flush-failing verdict (first closed hour above $11.53) is extending: twelve closed hours grinding $11.457 up to $11.694, pressing the $11.749 extension line. The forming hour tagged $11.816 — unclosed. The 19:00 UTC close (00:30 IST) decides. RSI 63, over EMA20 $11.49 and EMA50 $11.40, $24.2M / 246.8k trades, rank #15, $9.03B. No verified timed headline — this is tape, not news.
My pick: Door 2. A door being knocked with a verdict you can watch resolve in the next hour beats a sleeper whose breakdown already printed — and every hour parked under $0.2111 writes it deeper.
The other side, honestly: LINK is up 5.9% INTO the line and the extension trigger still hasn't closed above $11.749 — one hourly close back below $11.53 is rejection resuming. And ADA breakdowns fail too: a daily close back above $0.2111 kills the bear thesis and shorts bleed.
Not a call, either way.
Which line prints first — the $11.749 close, or the $0.2111 reclaim?
24
Log in to explore more content
Join global crypto users on Binance Square
⚡️ Get latest and useful information about crypto.
💬 Trusted by the world’s largest crypto exchange.
👍 Discover real insights from verified creators.
Email / Phone number
Trending Topics
1
#BinanceReopensWithdrawalsForHYPE&APT
60,335 views
816 Discussing
2
#SouthKoreaDraftLawTargets15To20%ShareholderCap
63,437 views
537 Discussing
3
#TradFiForBeginners
166,132 views
1,729 Discussing
4
#KeplrAdvisesSocialLoginUsersToTransferAssets
37,337 views
446 Discussing
5
#TetherPlans€28.8MForJuventusCapitalIncrease
22,793 views
349 Discussing
6
#JobsReportRaisesHikeOdds
816,658 views
4,364 Discussing
7
#CPITestsDecemberRateOutlook
323,350 views
1,840 Discussing
8
#US Data Center Rules May Constrain AI Expansion
121,718 views
258 Discussing
9
#ARKPlans14ThematicETFsCoveringAIAndTokenizedMarkets
8,527 views
88 Discussing
10
#WillAnthropicListOnTime
259,270 views
1,858 Discussing